Embed Size (px)
Citation preview
The international competitiveness of the UK cereals sector
David Thelwell1 and Christopher Ritson
2
1Project Management Services, Prospect House, Copt Hewick, Ripon, North
Yorkshire, HG4 5DB, England, [email protected] of Newcastle, Centre for Rural Economy, School of Agriculture, Food
and Rural Development, Newcastle upon Tyne, NE1 7RU, England, [email protected]
Paper prepared for presentation at the 98th EAAE Seminar ‘Marketing Dynamics within the Global Trading System: New Perspectives’, Chania, Crete,
Greece as in: 29 June – 2 July, 2006 Copyright 2006 by [David Thelwell and Christopher Ritson]. All rights reserved. Readers may make verbatim copies of this document for non-commercial purposes by any means, provided that this copyright notice appears on all such copies.
1
The International Competitiveness of the UK Cereals Sector
David Thelwell1 and Christopher Ritson2
1 Project Management Services, Prospect House, Copt Hewick, Ripon, North Yorkshire, HG4 5DB, England (Tel: +44 1765 602514, Fax: +44 1765 603581) [email protected] 2 University of Newcastle, Centre for Rural Economy, School of Agriculture, Food and Rural Development, Newcastle upon Tyne, NE1 7RU, England (Tel: +44 191 2226909; Fax: +44 191 2225411) [email protected] ABSTRACT The decoupling of support for crops under the reform of the CAP has led to concern within the UK as to whether its cereal sector can remain competitive when exposed to unprotected international commodity prices. This paper reports on a Global Benchmarking and Competitive Analysis of the UK Cereals Sector. The UK cereals sector was broken down into: Animal Feed Manufacture; Malting, Brewing and Distilling; Flour Milling and Baking; Industrial Applications – Starch, Bio-Fuels, Pharmaceutical. Four panels of UK experts were assembled. Each panel identified six main competitor countries to the UK for each supply chain and compiled a list of key factors affecting competitiveness. A total of 1500 questionnaires were distributed. Assurance, traceability, enforcement of regulation, and quality control procedures are regarded as strong in the UK. Supply chains have a good size structure providing a stable supply of raw material, well-located for usage outlets. However there appears to be a lack of co-operation, integration and trust within the supply chains. Specific training and education is required and there is a problem of recruiting and retaining skilled staff. There is a lack of benchmarking and sharing of good practice. There is concern that productivity improvement is threatened by the erosion of the UK research base. Overall a lack of confidence in the future of the sector is impeding entrepreneurship and innovative strategic investment. Key words: UK Cereals Sector, International Competitiveness
2
The International Competitiveness of the UK Cereals Industry David Thelwell and Christopher Ritson
1. Background In 2001 the British agricultural industry, together with the rural economy of the country, was confronted by a major crisis. On February 19th a Veterinary Inspector noticed symptoms of Foot and Mouth Disease in Pigs at an abattoir in Essex. The next day this was confirmed. By the end of the epidemic in September, more than 2000 premises had been infected, and about 6.5 million animals slaughtered from more than 10,000 farms. The crisis is estimated to have cost £8,000 million (Donaldson et al 2006). Perhaps even more significant than the impact on farming was the Government’s decision in effect “to close the countryside”, with its economic impact on rural businesses which contribute substantially more than farming to the rural economy. All this was against a background of the BSE crises, involving substantial slaughter of cattle, beef export ban, and a collapse in consumer confidence in the safety of the UK food supply together with mistrust over Government communication relation to food risks. (Frewer et al 2002). One response of the UK Government to these events was to establish a Commission of Enquiry into the “Future of Food and Farming” in the UK. The report of this Enquiry, (Defra 2002a) now usually referred to as the “Curry Report”, after the Chairman of the Commission, Sir Donald Curry, made a number of wide-ranging recommendations aimed at sustaining the future of the British agricultural industry. These recommendations were subsequently consolidated into a Ministry Strategy document (Defra 2002b) Underlying the Curry recommendations was what is probably the main theme of the Report, the need to improve efficiency and communication throughout the food chain. This in turn can be seen to have two components. The first can be summarised as the need to “reconnect” the farming with the consumer – the belief that agricultural production had become detached from changing patterns of consumer food requirements and that there was a need for an improvement in the flow of information between primary production and the final consumer through the food chain. Second, was the underlying process of CAP reform and the realisation that the various sectors of the UK food chain were likely to be thrown open to the impact of international competition and that improved efficiency in food production, processing and distribution was necessary if the country’s agro-food sector was to be able to compete in the new Global Economy. One of the main recommendations of the Curry Commission was for the establishment of a Food Chain Centre to pursue these objectives, and this was acted upon in 2002 by the Ministry with responsibility for agriculture, Defra, in collaboration with the Institute of Grocery Distribution. The activities of the Food Chain Centre are summarised by Defra (2002b) as to: • Map and measure the chain, searching for inefficiencies: • Recommend ways to reduce cost and waste; • Test and promote techniques to improve the chain; • Publicise best practice; and • Encourage teamwork among all members of the chain.
3
The British Trade and Industry Ministry had developed a programme of support for efficiency improving “adaptation schemes” which required sector participation by the establishment of an “Industry Forum” to initiate and manage the process of change, and one such forum, the Red Meat Industry Forum, had already been established within the UK Agro-Food Sector. Defra and the Food Chain Centre now invited the cereals sector to form a similar forum. This was facilitated by the sector levy body, the Home Grown Cereals Authority (HGCA) and the Cereals Industry Forum was established in 2003. Its members are representatives of all the major sector trade associations (listed in Table 1) under the Chairmanship of the HGCA Deputy Chairman, Christopher Ritson, one of the Authors of this paper. “The aim of the Cereals Industry Forum is to improve the efficiency and performance of the cereal chain in a way consistent with a sustainable, internationally competitive UK cereal industry” (Cereals Industry Forum, 2005).
Table 1 Members of the Cereals Industry Forum
Agricultural Industries Confederation
British Beer and Pub Association
British Society for Plant Breeders
Department for Environment Food and Rural Affairs
The Federation of Bakers
Food Chain Centre
Maltsters Association of Great Britain
National Association of British and Irish Millers
National Farmers Union
National Farmers Union of Scotland
Scottish Executive
Scottish Whisky Association
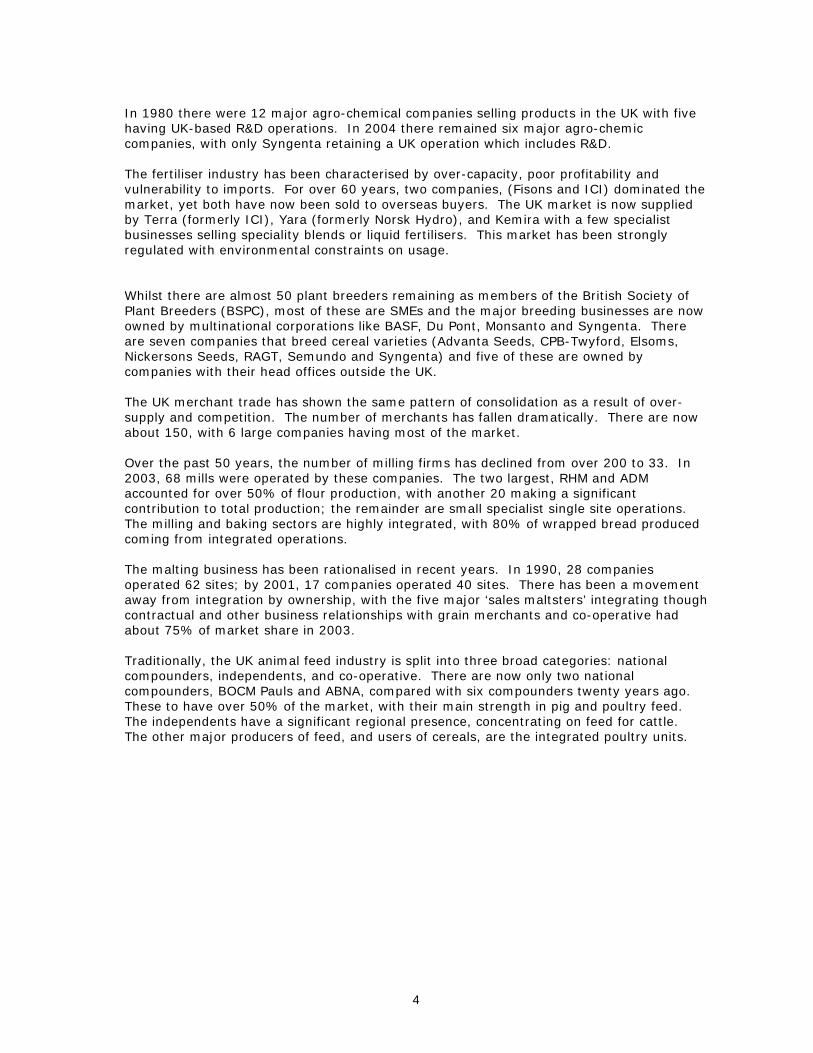
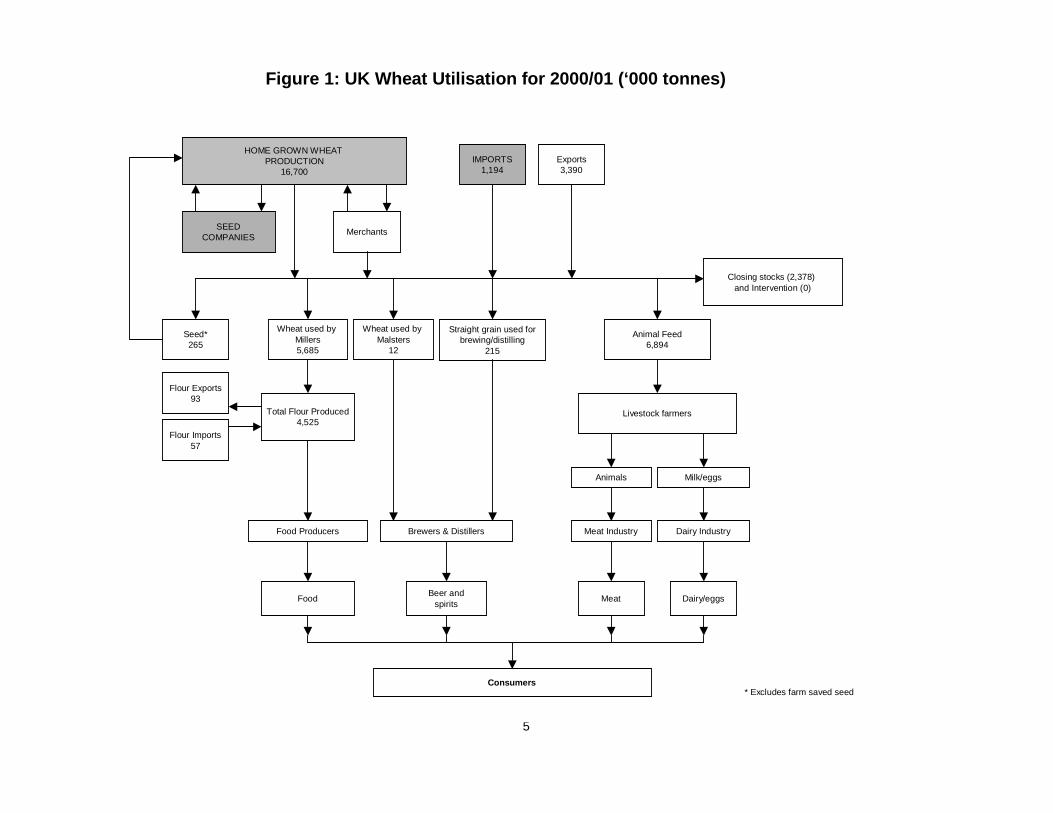
The first action of the Cereals Industry Forum in 2003 was to commission Prospect Management Services (PMS) to undertake a Global Benchmarking and Competitive Analysis of the UK Cereals Sector. The Director of PMS, David Thelwall, is the other author of this paper. 2. The Changing Structure of the UK Cereals Sector Figure 1 summarises the UK Cereal Supply Chain In 1970 there were around 172,000 holdings in the UK with a cereal enterprise. By 2000 the figure was about 65,000. At the same time the average size of enterprise has doubled. Cereal production has become increasingly concentrated in parts of the UK. Ownership and farming arrangements have become more complex and today 10-15,000 growers, about a third of those 30 years ago, are perhaps responsible for over 80% of production.
4
In 1980 there were 12 major agro-chemical companies selling products in the UK with five having UK-based R&D operations. In 2004 there remained six major agro-chemic companies, with only Syngenta retaining a UK operation which includes R&D. The fertiliser industry has been characterised by over-capacity, poor profitability and vulnerability to imports. For over 60 years, two companies, (Fisons and ICI) dominated the market, yet both have now been sold to overseas buyers. The UK market is now supplied by Terra (formerly ICI), Yara (formerly Norsk Hydro), and Kemira with a few specialist businesses selling speciality blends or liquid fertilisers. This market has been strongly regulated with environmental constraints on usage. Whilst there are almost 50 plant breeders remaining as members of the British Society of Plant Breeders (BSPC), most of these are SMEs and the major breeding businesses are now owned by multinational corporations like BASF, Du Pont, Monsanto and Syngenta. There are seven companies that breed cereal varieties (Advanta Seeds, CPB-Twyford, Elsoms, Nickersons Seeds, RAGT, Semundo and Syngenta) and five of these are owned by companies with their head offices outside the UK. The UK merchant trade has shown the same pattern of consolidation as a result of over-supply and competition. The number of merchants has fallen dramatically. There are now about 150, with 6 large companies having most of the market. Over the past 50 years, the number of milling firms has declined from over 200 to 33. In 2003, 68 mills were operated by these companies. The two largest, RHM and ADM accounted for over 50% of flour production, with another 20 making a significant contribution to total production; the remainder are small specialist single site operations. The milling and baking sectors are highly integrated, with 80% of wrapped bread produced coming from integrated operations. The malting business has been rationalised in recent years. In 1990, 28 companies operated 62 sites; by 2001, 17 companies operated 40 sites. There has been a movement away from integration by ownership, with the five major ‘sales maltsters’ integrating though contractual and other business relationships with grain merchants and co-operative had about 75% of market share in 2003. Traditionally, the UK animal feed industry is split into three broad categories: national compounders, independents, and co-operative. There are now only two national compounders, BOCM Pauls and ABNA, compared with six compounders twenty years ago. These to have over 50% of the market, with their main strength in pig and poultry feed. The independents have a significant regional presence, concentrating on feed for cattle. The other major producers of feed, and users of cereals, are the integrated poultry units.
5
Figure 1: UK Wheat Utilisation for 2000/01 (‘000 tonnes)
HOME GROWN WHEAT PRODUCTION
16,700IMPORTS
1,194Exports3,390
SEEDCOMPANIES Merchants
Closing stocks (2,378) and Intervention (0)
Wheat used by Millers5,685
Total Flour Produced4,525
Animal Feed6,894
Livestock farmers
Animals Milk/eggs
Meat Industry Dairy Industry
Meat Dairy/eggsBeer andspirits
Consumers
Seed*265
* Excludes farm saved seed
Flour Exports93
Brewers & Distillers
Food
Straight grain used for brewing/distilling
215
Flour Imports57
Wheat used by Malsters
12
Food Producers
6
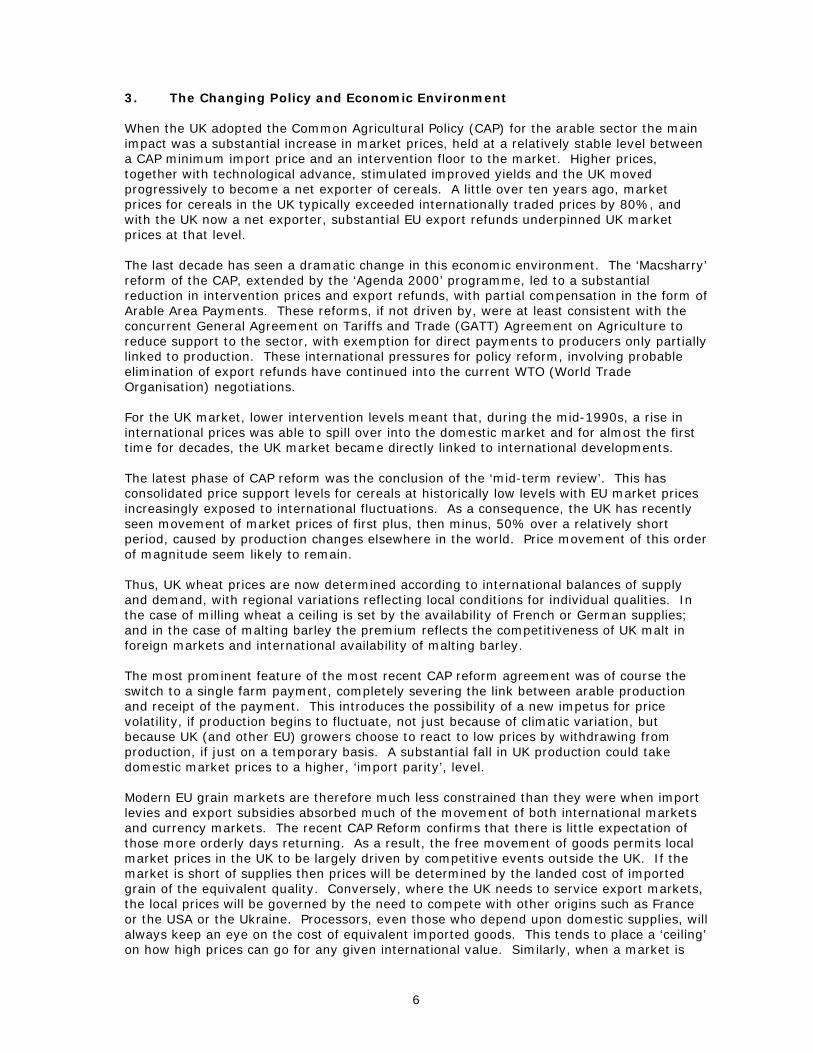
3. The Changing Policy and Economic Environment When the UK adopted the Common Agricultural Policy (CAP) for the arable sector the main impact was a substantial increase in market prices, held at a relatively stable level between a CAP minimum import price and an intervention floor to the market. Higher prices, together with technological advance, stimulated improved yields and the UK moved progressively to become a net exporter of cereals. A little over ten years ago, market prices for cereals in the UK typically exceeded internationally traded prices by 80%, and with the UK now a net exporter, substantial EU export refunds underpinned UK market prices at that level. The last decade has seen a dramatic change in this economic environment. The ‘Macsharry’ reform of the CAP, extended by the ‘Agenda 2000’ programme, led to a substantial reduction in intervention prices and export refunds, with partial compensation in the form of Arable Area Payments. These reforms, if not driven by, were at least consistent with the concurrent General Agreement on Tariffs and Trade (GATT) Agreement on Agriculture to reduce support to the sector, with exemption for direct payments to producers only partially linked to production. These international pressures for policy reform, involving probable elimination of export refunds have continued into the current WTO (World Trade Organisation) negotiations. For the UK market, lower intervention levels meant that, during the mid-1990s, a rise in international prices was able to spill over into the domestic market and for almost the first time for decades, the UK market became directly linked to international developments. The latest phase of CAP reform was the conclusion of the ‘mid-term review’. This has consolidated price support levels for cereals at historically low levels with EU market prices increasingly exposed to international fluctuations. As a consequence, the UK has recently seen movement of market prices of first plus, then minus, 50% over a relatively short period, caused by production changes elsewhere in the world. Price movement of this order of magnitude seem likely to remain. Thus, UK wheat prices are now determined according to international balances of supply and demand, with regional variations reflecting local conditions for individual qualities. In the case of milling wheat a ceiling is set by the availability of French or German supplies; and in the case of malting barley the premium reflects the competitiveness of UK malt in foreign markets and international availability of malting barley. The most prominent feature of the most recent CAP reform agreement was of course the switch to a single farm payment, completely severing the link between arable production and receipt of the payment. This introduces the possibility of a new impetus for price volatility, if production begins to fluctuate, not just because of climatic variation, but because UK (and other EU) growers choose to react to low prices by withdrawing from production, if just on a temporary basis. A substantial fall in UK production could take domestic market prices to a higher, ‘import parity’, level. Modern EU grain markets are therefore much less constrained than they were when import levies and export subsidies absorbed much of the movement of both international markets and currency markets. The recent CAP Reform confirms that there is little expectation of those more orderly days returning. As a result, the free movement of goods permits local market prices in the UK to be largely driven by competitive events outside the UK. If the market is short of supplies then prices will be determined by the landed cost of imported grain of the equivalent quality. Conversely, where the UK needs to service export markets, the local prices will be governed by the need to compete with other origins such as France or the USA or the Ukraine. Processors, even those who depend upon domestic supplies, will always keep an eye on the cost of equivalent imported goods. This tends to place a ‘ceiling’ on how high prices can go for any given international value. Similarly, when a market is
7
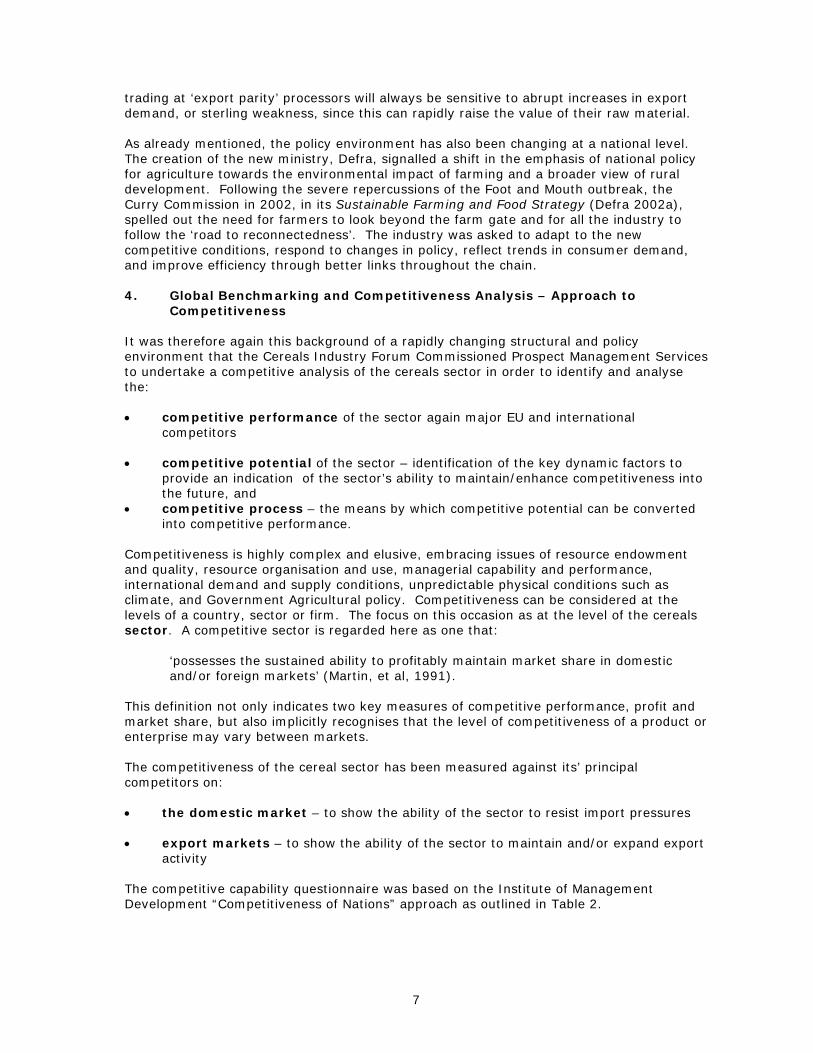
trading at ‘export parity’ processors will always be sensitive to abrupt increases in export demand, or sterling weakness, since this can rapidly raise the value of their raw material. As already mentioned, the policy environment has also been changing at a national level. The creation of the new ministry, Defra, signalled a shift in the emphasis of national policy for agriculture towards the environmental impact of farming and a broader view of rural development. Following the severe repercussions of the Foot and Mouth outbreak, the Curry Commission in 2002, in its Sustainable Farming and Food Strategy (Defra 2002a), spelled out the need for farmers to look beyond the farm gate and for all the industry to follow the ‘road to reconnectedness’. The industry was asked to adapt to the new competitive conditions, respond to changes in policy, reflect trends in consumer demand, and improve efficiency through better links throughout the chain. 4. Global Benchmarking and Competitiveness Analysis – Approach to
Competitiveness It was therefore again this background of a rapidly changing structural and policy environment that the Cereals Industry Forum Commissioned Prospect Management Services to undertake a competitive analysis of the cereals sector in order to identify and analyse the: • competitive performance of the sector again major EU and international
competitors • competitive potential of the sector – identification of the key dynamic factors to
provide an indication of the sector’s ability to maintain/enhance competitiveness into the future, and
• competitive process – the means by which competitive potential can be converted into competitive performance.
Competitiveness is highly complex and elusive, embracing issues of resource endowment and quality, resource organisation and use, managerial capability and performance, international demand and supply conditions, unpredictable physical conditions such as climate, and Government Agricultural policy. Competitiveness can be considered at the levels of a country, sector or firm. The focus on this occasion as at the level of the cereals sector. A competitive sector is regarded here as one that: ‘possesses the sustained ability to profitably maintain market share in domestic
and/or foreign markets’ (Martin, et al, 1991). This definition not only indicates two key measures of competitive performance, profit and market share, but also implicitly recognises that the level of competitiveness of a product or enterprise may vary between markets. The competitiveness of the cereal sector has been measured against its’ principal competitors on: • the domestic market – to show the ability of the sector to resist import pressures • export markets – to show the ability of the sector to maintain and/or expand export
activity The competitive capability questionnaire was based on the Institute of Management Development “Competitiveness of Nations” approach as outlined in Table 2.
8
Table 2 Competitiveness Breakdown
Economic Performance
Government Efficiency
Business Efficiency
Infrastructure
Domestic Economy
International Trade
International Investment
Employment
Prices
Public Finance
Fiscal Policy
Institutional Framework
Business
Legislation
Societal Framework
Productivity
Labour Market
Finance
Management Practices
Attitudes & Values
Basic
Technological
Scientific
Health & Environment
Education
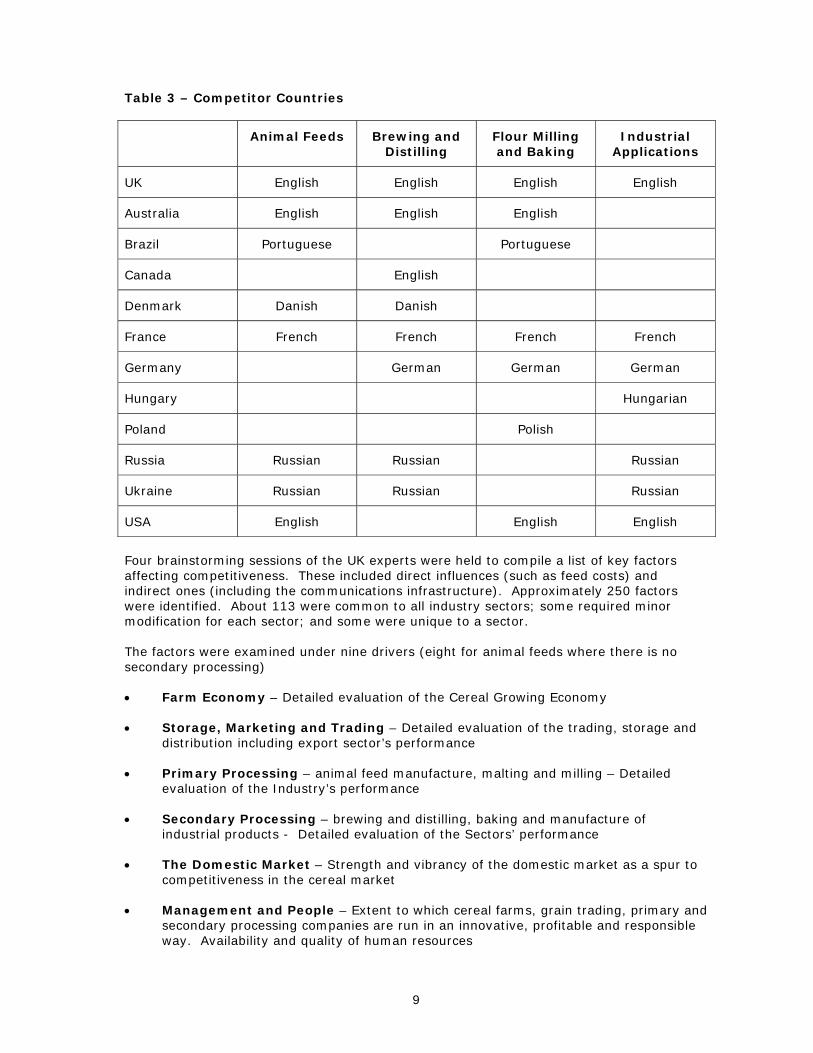
The purpose of such an analysis is to identify within each country: • Strengths and Weaknesses • Areas of Competitive Potential • Disadvantages • Parameters which can be changed • Parameters outside the control of the industry • Parameter which could be affected by Government action 5. Methodology With the cereals sector, sub sectors were identified from Figure 1 in the form of 4 supply streams: • Animal Feed Manufacture • Malting, Brewing and Distilling • Flour Milling and Baking • Industrial Applications – Starch, Bio-Fuels, Pharmaceuticals Four panels of UK experts were assembled after consultation with CIF and HGCA from commercial companies, trade organisations, technical experts for each industry sector – Animal Feeds, Brewing and Distilling, flour Milling and Baking, and Industrial Applications. These panels included people with awareness of the complete supply chain. Each panel identified six main competitors to the UK for each supply chain. These included local competitors in Europe, acknowledged world leaders and developing nations with high potential for future competitiveness. Table 3 lists the selected competitor countries together with language of questionnaire administration.
9
Table 3 – Competitor Countries
Animal Feeds Brewing and Distilling
Flour Milling and Baking
Industrial Applications
UK English English English English
Australia English English English
Brazil Portuguese Portuguese
Canada English
Denmark Danish Danish
France French French French French
Germany German German German
Hungary Hungarian
Poland Polish
Russia Russian Russian Russian
Ukraine Russian Russian Russian
USA English English English
Four brainstorming sessions of the UK experts were held to compile a list of key factors affecting competitiveness. These included direct influences (such as feed costs) and indirect ones (including the communications infrastructure). Approximately 250 factors were identified. About 113 were common to all industry sectors; some required minor modification for each sector; and some were unique to a sector. The factors were examined under nine drivers (eight for animal feeds where there is no secondary processing) • Farm Economy – Detailed evaluation of the Cereal Growing Economy • Storage, Marketing and Trading – Detailed evaluation of the trading, storage and
distribution including export sector’s performance • Primary Processing – animal feed manufacture, malting and milling – Detailed
evaluation of the Industry’s performance • Secondary Processing – brewing and distilling, baking and manufacture of
industrial products - Detailed evaluation of the Sectors’ performance • The Domestic Market – Strength and vibrancy of the domestic market as a spur to
competitiveness in the cereal market • Management and People – Extent to which cereal farms, grain trading, primary and
secondary processing companies are run in an innovative, profitable and responsible way. Availability and quality of human resources
10
• Infrastructure – Degree to which natural, technical and communication resources positively influence Competitiveness
• Government – How far government policy, practice and legislation assists
competitiveness • Science and Technology – The scientific and technological capability and capacity. Each factor was converted into a positive statement, for which a high level of agreement indicates competitiveness. The list of factors was converted into a spreadsheet-based questionnaire for which participants were invited to score their own country on a range from 1 (completely disagree) to 10 (completely agree). The questionnaires were professionally translated and the translation was then checked by native speaking industry specialists. Consultants or academics with an in depth knowledge of the industry sectors were recruited in Australia, Brazil, Denmark, France, Germany, Hungary, Poland, Russia and Ukraine to recruit approximately 30 specialists for each industry sector who were then contacted by email and asked to complete the appropriate questionnaires. These experts included personnel from: • Commercial companies • Extension advisers • Trade organisations • Consultants • Government • Major producers • Trade press and commentators • University and College Lecturers and Researchers A total of over 1500 questionnaires were distributed and 409 were returned. The individual questionnaire results were aggregated to calculate an average score (from 1 to 10) for each country by:- • Individual Question • Driver • Industry Sector The scores were then sorted and selected in a variety of different ways to produce the report submitted to the CIF in July 2004. 6. Summary of Survey Results A comprehensive summary of the result of the survey will be found in the Appendix. For each of the four sector streams (animal feed, milling and baking, brewing and distilling, industrial uses) the average score for all countries are first ranked according to the nine competitiveness “drivers”. The competing countries are then ranked for each driver 7. UK Cereals Sector Strengths and Weaknesses Relative to Competitive Countries The strengths and weakness of each of the four cereal supply chains can be examined by identifying factors on which the UK scored either significantly higher (strengths) or
11
significantly lower (weaknesses) than the average for the identified competitor countries. Using this approach, the main strengths of the UK are as follows:
1. Brewing and Distilling
• Strong whisky and other grain based spirit brands with good export trade links;
• Strong and enforced legislation; • Modern quality assurance schemes applied throughout the sector, including
HACCP, farm assurance and traceability.
2. Animal Feeds
• Strong quality assurance and traceability; • Income growth and food retailers driving demand for quality value added
meat products; • Concentrated structure of animal feed companies.
3. Milling and Baking
• Modern quality schemes applied throughout the sector including farm assurance, traceability and HACCP;
• Strong and enforced legislation/regulation; • Domestic demand driven by retailers and promotion by brand owners; • Good large scale structure of milling and manufacturing; • Ability to maintain separate supply chains (eg GM free).
4. Industrial Uses
• Well developed, concentrated and integrated starch industry supported by strong domestic demand;
• Strong industry support for the development of a UK bio-ethanol industry with management available to guide its development;
• Well established supply of wheat as raw material; • Capital available if appropriate incentives in place; • EU directive in place requiring member states to introduce mechanisms for
replacement of mineral oils. In contrast, sector weaknesses are identified as follows:
1. Brewing and Distilling
• Lack of investment in modern technology; • High land and labour costs; • Lack of farmer confidence in market for malting barley; • Poor research base; • Inadequate specialist education and training; • Difficulty of attracting and retaining quality management and scientific
people; • Stagnant domestic demand; • Lack of culture for sharing best practice; • Lack of strategic alliances/integration in chain.
2. Animal Feeds
• High land and labour costs; • Inadequate specialist education and training;
12
• Lack of culture for sharing best practice; • Impact of environmental, planning and fiscal legislation; • Lack of confidence in cereal farming impeding investment; • Lack of modern management structure; • High haulage costs; • Poor international reputation for UK meat; • Lack of varieties bred specifically for animal feed; • Concentrated buying power of supermarkets • GM variety restrictions
3. Milling and Baking
• High land and labour costs; • Inadequate specialist education and training; • Lack of confidence impeding long term investment; • Lack of benchmarking • High haulage costs; • Impact of climate on drying costs; • Sector not seen as attractive career opportunity; • Cereal farmers dependent on subsidies; • GM variety restrictions; • Negative impact of food allergy perception.
4. Industrial Uses
• Starch industry limited by capacity and less exploitation of economies of scale than continental competitors;
• Use of imported maize in starch production; • Insufficient Government support in duty relief for bio-ethanol; • Underdeveloped, relatively high cost UK bio fuel industry; • Undeveloped domestic bio-fuel market.
8. Conclusion One thing that stands out is how assurance, traceability, enforcement of regulation, and quality control procedures are regarded as strong in the UK relative to competitor countries. Second there is a view that the supply chains in the UK generally have a good size structure providing opportunities for economies. The UK farm sector is seen as providing a stable supply of raw material well located for usage outlets. The strong role of support organisations is also referred to. The list of weaknesses is typically rather longer. High land and labour costs and the impact of climate on crop quality are seen as competitive weaknesses. There appears to be a lack of cooperation, integration and trust within the supply chains. Specific training and education is required and there is a problem of recruiting and retaining skilled staff. There is a lack of benchmarking and sharing of good practice. There is concern that productivity improvement is threatened by the erosion of the UK research base. Overall a lack of confidence in the future of the sector is impeding entrepreneurship and innovative strategic investment. In order to attempt to correct the weaknesses, the Cereals Industry Forum has instigated a series of 5 business improvement initiatives, covering Value Chain Analysis; Industrial Sector Company Diagnostic Benchmarking; Customised Masterclasses; Farm Benchmarking Clubs and Risk Management Training.
13
References Defra (2002a) “The Future of Food and Farming in the UK”: Report of Commission of Enquiries Defra (2002b) “The Strategy for Sustainable Farming and Food – Facing the Future” Donaldson, A, Lee, R, Ward, N and Wilkinson, K (2006) “Foot and Mouth – Five Years On: The Legacy of the 2001 Foot and Mouth Disease Crisis for Farming and the British Countryside” Cereals Industry Forum (2005) Cereals Industry Forum Strategy, HGCA Frewer, L, Miles, S, Brennan, M, Kuznesof, S, Ness, M and Ritson, C (2002) “Public preferences for informed choice under conditions of risk uncertainty”, Public Understanding of Science, Vol 11 No 4 Martin, L., Westgnen, R. and Van Durren, E. (1991) “Agribusiness Competitiveness across National Boundaries”, American Journal of Agricultural Economics, December.
EAAE Seminar Results Appendix
17/06/2006 1
Animal Feed Stream
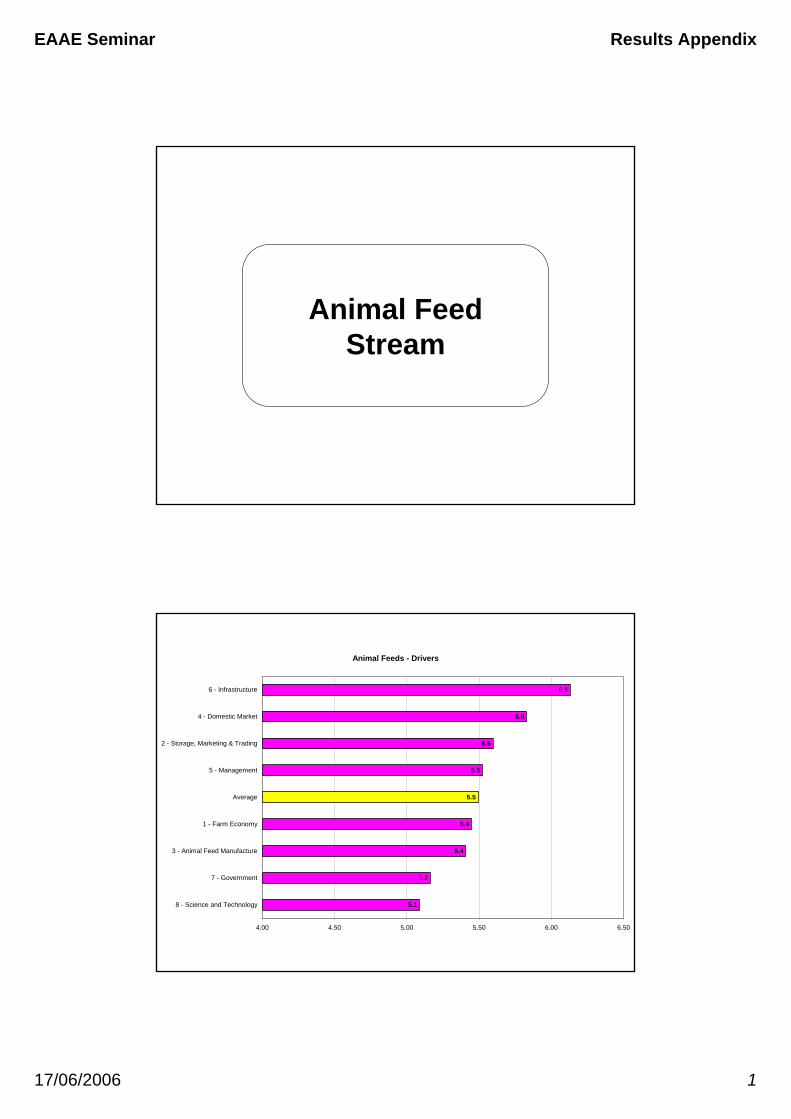
Animal Feeds - Drivers
5.1
5.2
5.4
5.4
5.5
5.5
5.6
5.8
6.1
4.00 4.50 5.00 5.50 6.00 6.50
8 - Science and Technology
7 - Government
3 - Animal Feed Manufacture
1 - Farm Economy
Average
5 - Management
2 - Storage, Marketing & Trading
4 - Domestic Market
6 - Infrastructure
EAAE Seminar Results Appendix
17/06/2006 2
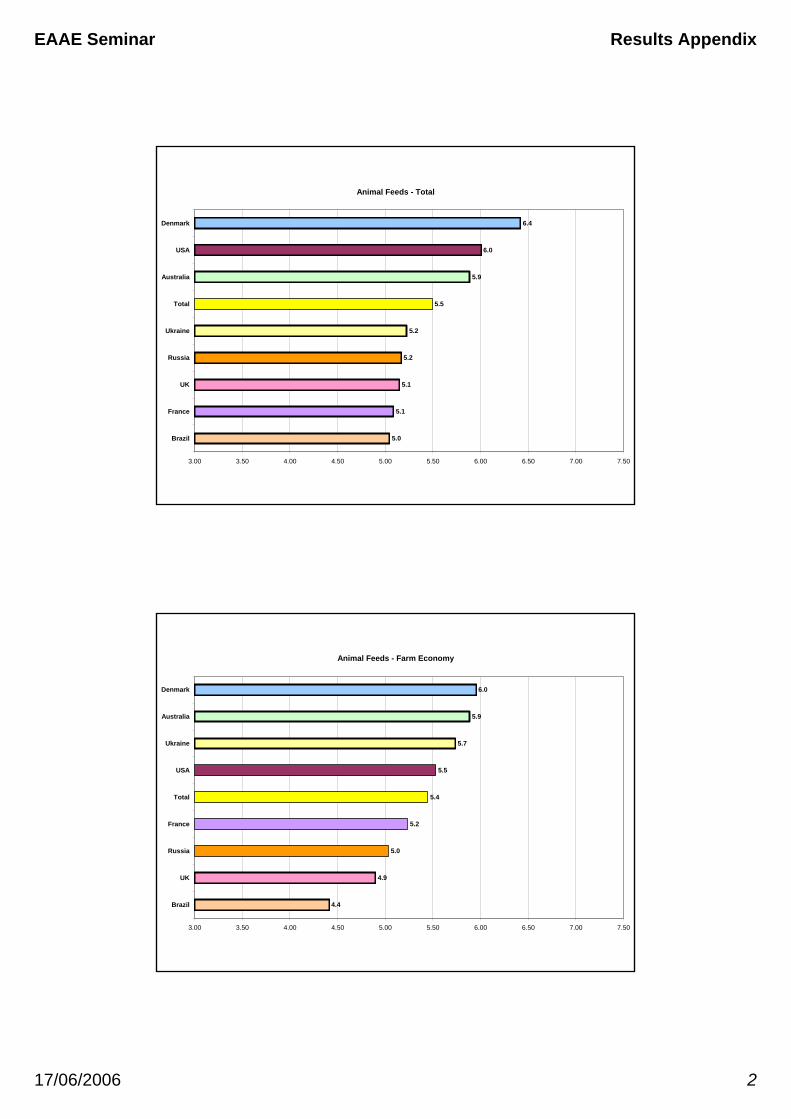
Animal Feeds - Total
5.0
5.1
5.1
5.2
5.2
5.5
5.9
6.0
6.4
3.00 3.50 4.00 4.50 5.00 5.50 6.00 6.50 7.00 7.50
Brazil
France
UK
Russia
Ukraine
Total
Australia
USA
Denmark
Animal Feeds - Farm Economy
4.4
4.9
5.0
5.2
5.4
5.5
5.7
5.9
6.0
3.00 3.50 4.00 4.50 5.00 5.50 6.00 6.50 7.00 7.50
Brazil
UK
Russia
France
Total
USA
Ukraine
Australia
Denmark
EAAE Seminar Results Appendix
17/06/2006 3
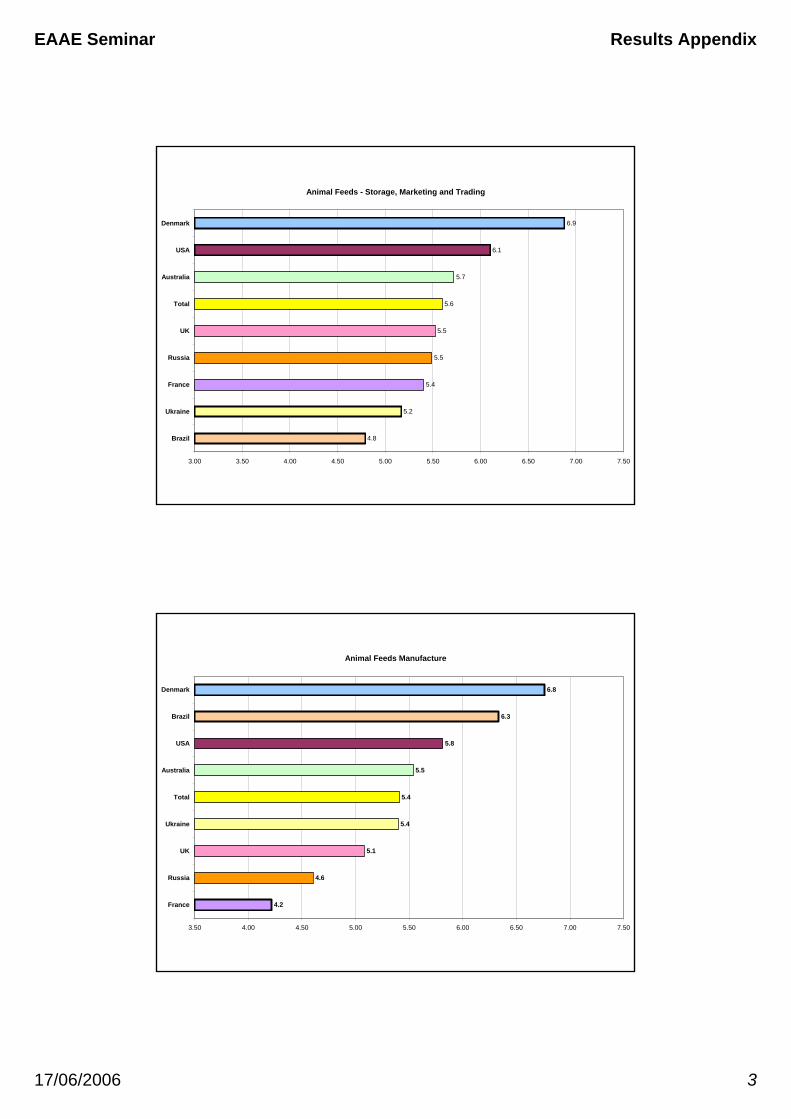
Animal Feeds - Storage, Marketing and Trading
4.8
5.2
5.4
5.5
5.5
5.6
5.7
6.1
6.9
3.00 3.50 4.00 4.50 5.00 5.50 6.00 6.50 7.00 7.50
Brazil
Ukraine
France
Russia
UK
Total
Australia
USA
Denmark
Animal Feeds Manufacture
4.2
4.6
5.1
5.4
5.4
5.5
5.8
6.3
6.8
3.50 4.00 4.50 5.00 5.50 6.00 6.50 7.00 7.50
France
Russia
UK
Ukraine
Total
Australia
USA
Brazil
Denmark
EAAE Seminar Results Appendix
17/06/2006 4
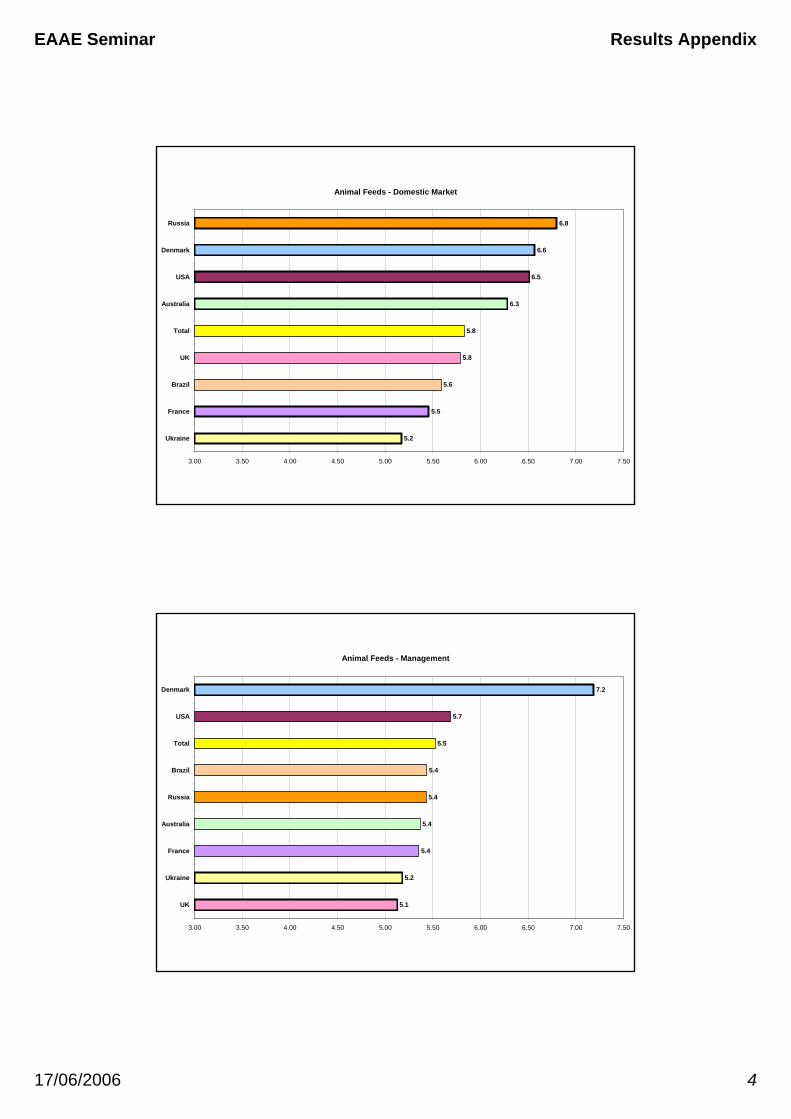
Animal Feeds - Domestic Market
5.2
5.5
5.6
5.8
5.8
6.3
6.5
6.6
6.8
3.00 3.50 4.00 4.50 5.00 5.50 6.00 6.50 7.00 7.50
Ukraine
France
Brazil
UK
Total
Australia
USA
Denmark
Russia
Animal Feeds - Management
5.1
5.2
5.4
5.4
5.4
5.4
5.5
5.7
7.2
3.00 3.50 4.00 4.50 5.00 5.50 6.00 6.50 7.00 7.50
UK
Ukraine
France
Australia
Russia
Brazil
Total
USA
Denmark
EAAE Seminar Results Appendix
17/06/2006 5
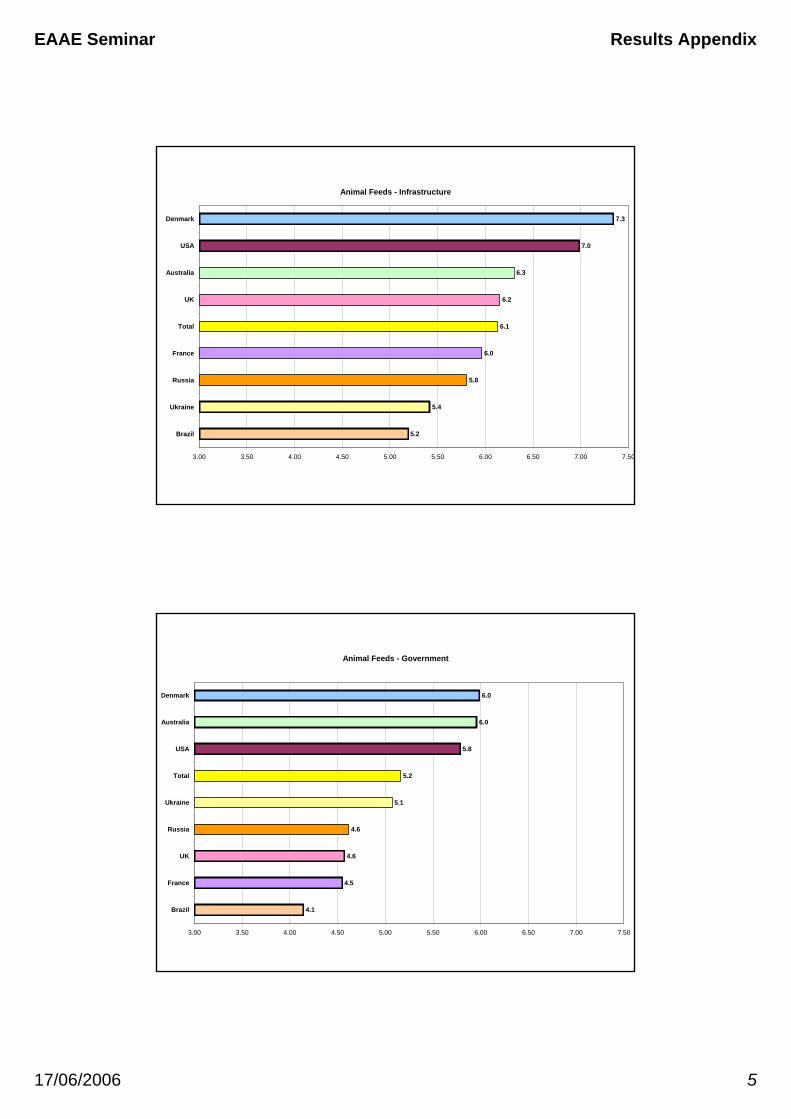
Animal Feeds - Infrastructure
5.2
5.4
5.8
6.0
6.1
6.2
6.3
7.0
7.3
3.00 3.50 4.00 4.50 5.00 5.50 6.00 6.50 7.00 7.50
Brazil
Ukraine
Russia
France
Total
UK
Australia
USA
Denmark
Animal Feeds - Government
4.1
4.5
4.6
4.6
5.1
5.2
5.8
6.0
6.0
3.00 3.50 4.00 4.50 5.00 5.50 6.00 6.50 7.00 7.50
Brazil
France
UK
Russia
Ukraine
Total
USA
Australia
Denmark
EAAE Seminar Results Appendix
17/06/2006 6
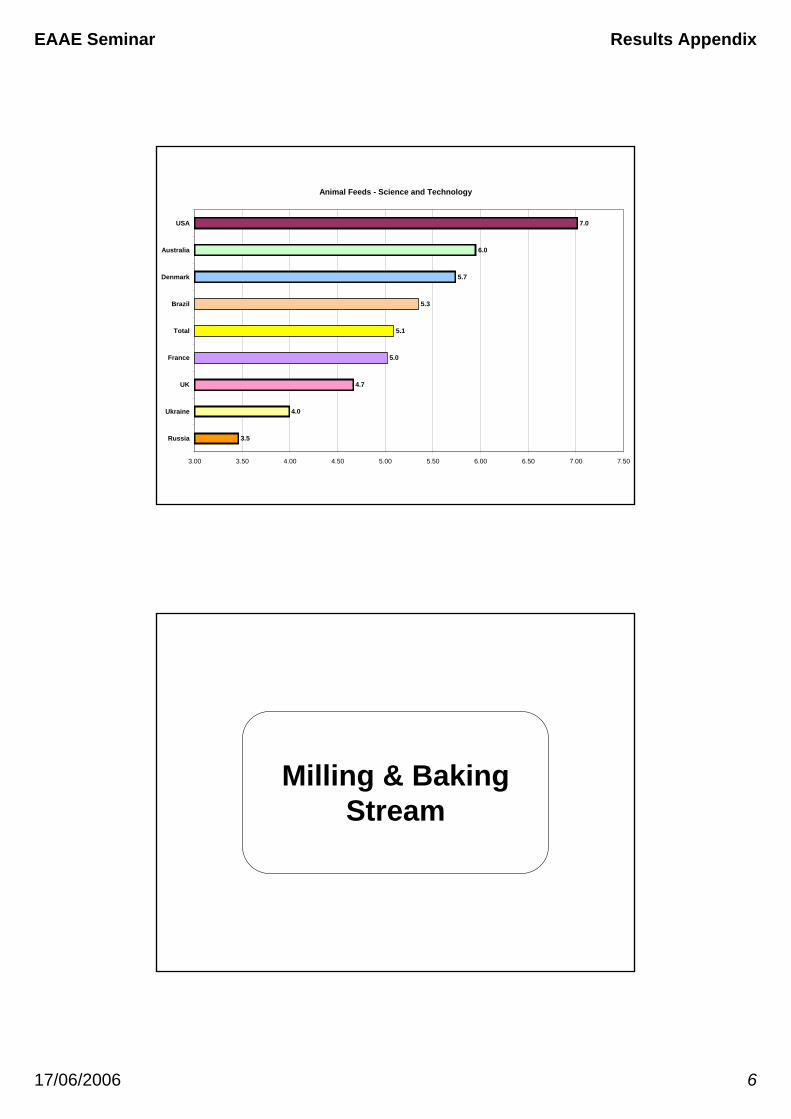
Animal Feeds - Science and Technology
3.5
4.0
4.7
5.0
5.1
5.3
5.7
6.0
7.0
3.00 3.50 4.00 4.50 5.00 5.50 6.00 6.50 7.00 7.50
Russia
Ukraine
UK
France
Total
Brazil
Denmark
Australia
USA
Milling & Baking Stream
EAAE Seminar Results Appendix
17/06/2006 7
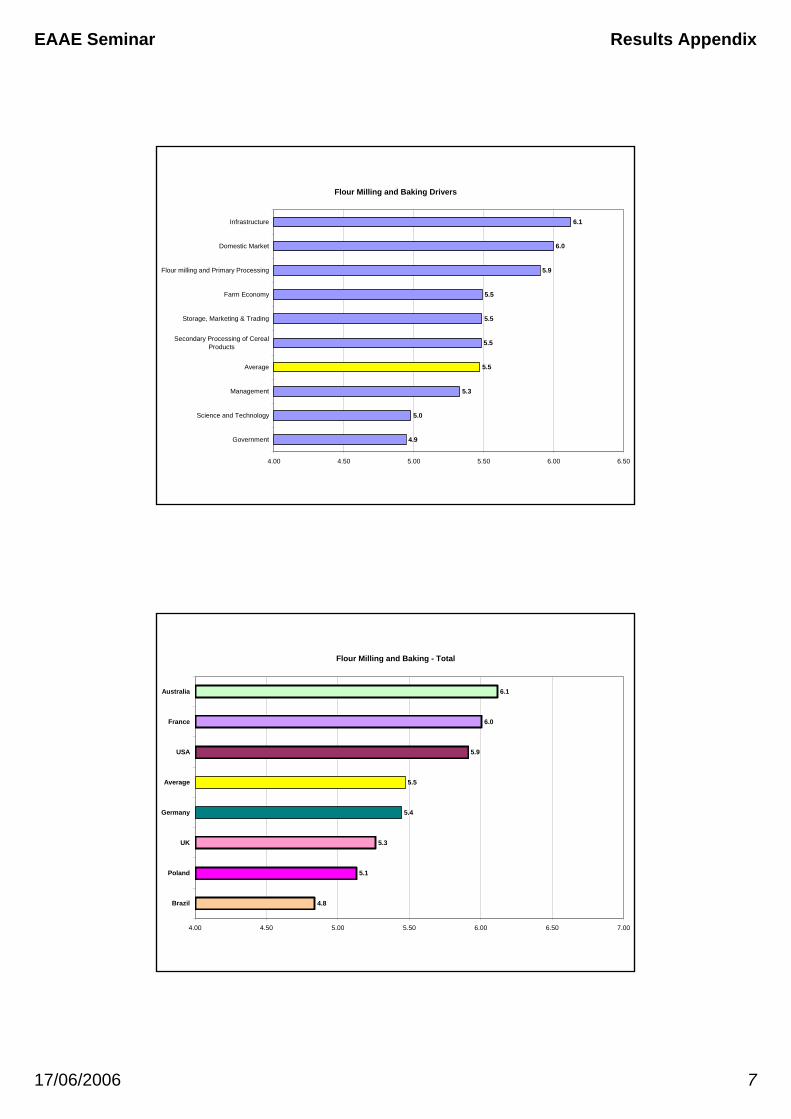
Flour Milling and Baking Drivers
4.9
5.0
5.3
5.5
5.5
5.5
5.5
5.9
6.0
6.1
4.00 4.50 5.00 5.50 6.00 6.50
Government
Science and Technology
Management
Average
Secondary Processing of CerealProducts
Storage, Marketing & Trading
Farm Economy
Flour milling and Primary Processing
Domestic Market
Infrastructure
Flour Milling and Baking - Total
4.8
5.1
5.3
5.4
5.5
5.9
6.0
6.1
4.00 4.50 5.00 5.50 6.00 6.50 7.00
Brazil
Poland
UK
Germany
Average
USA
France
Australia
EAAE Seminar Results Appendix
17/06/2006 8
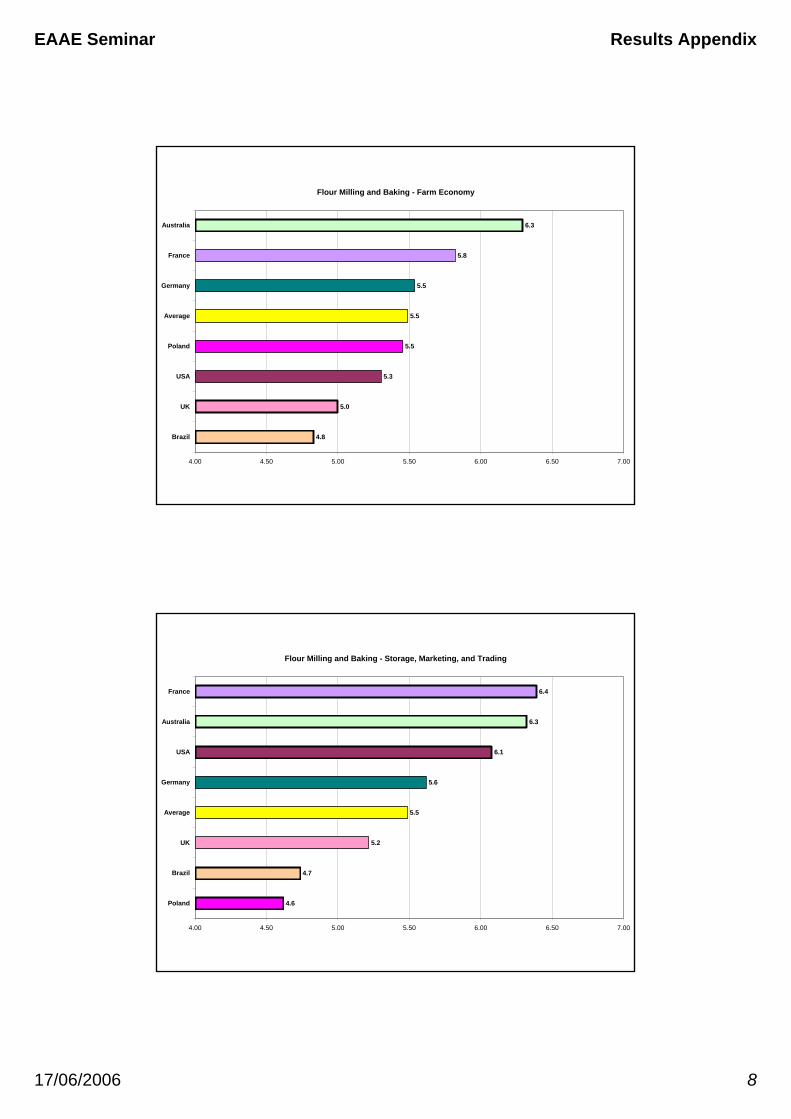
Flour Milling and Baking - Farm Economy
4.8
5.0
5.3
5.5
5.5
5.5
5.8
6.3
4.00 4.50 5.00 5.50 6.00 6.50 7.00
Brazil
UK
USA
Poland
Average
Germany
France
Australia
Flour Milling and Baking - Storage, Marketing, and Trading
4.6
4.7
5.2
5.5
5.6
6.1
6.3
6.4
4.00 4.50 5.00 5.50 6.00 6.50 7.00
Poland
Brazil
UK
Average
Germany
USA
Australia
France
EAAE Seminar Results Appendix
17/06/2006 9
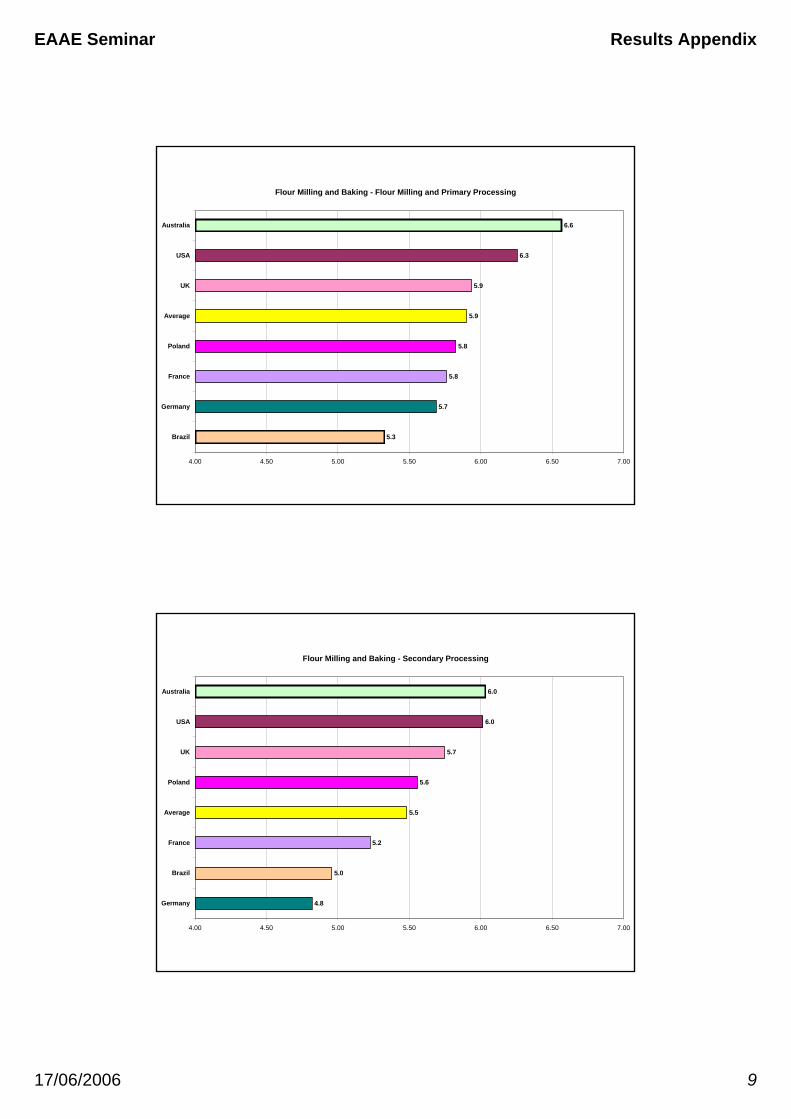
Flour Milling and Baking - Flour Milling and Primary Processing
5.3
5.7
5.8
5.8
5.9
5.9
6.3
6.6
4.00 4.50 5.00 5.50 6.00 6.50 7.00
Brazil
Germany
France
Poland
Average
UK
USA
Australia
Flour Milling and Baking - Secondary Processing
4.8
5.0
5.2
5.5
5.6
5.7
6.0
6.0
4.00 4.50 5.00 5.50 6.00 6.50 7.00
Germany
Brazil
France
Average
Poland
UK
USA
Australia
EAAE Seminar Results Appendix
17/06/2006 10
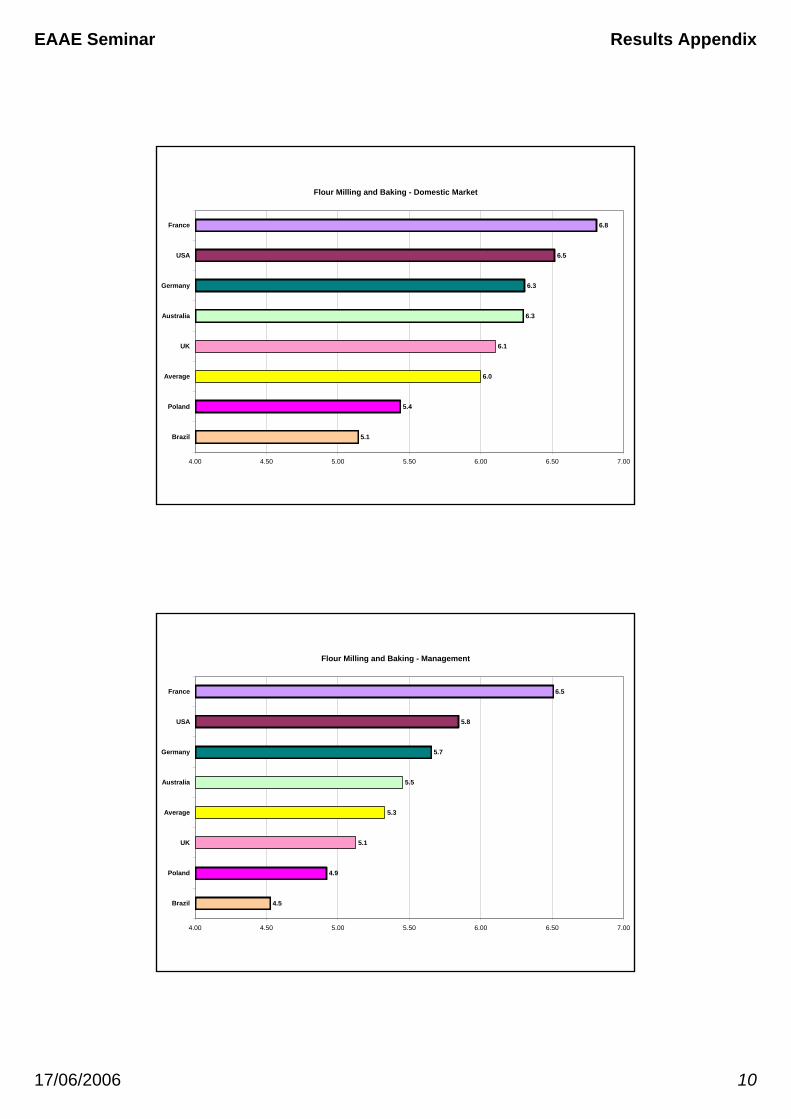
Flour Milling and Baking - Domestic Market
5.1
5.4
6.0
6.1
6.3
6.3
6.5
6.8
4.00 4.50 5.00 5.50 6.00 6.50 7.00
Brazil
Poland
Average
UK
Australia
Germany
USA
France
Flour Milling and Baking - Management
4.5
4.9
5.1
5.3
5.5
5.7
5.8
6.5
4.00 4.50 5.00 5.50 6.00 6.50 7.00
Brazil
Poland
UK
Average
Australia
Germany
USA
France
EAAE Seminar Results Appendix
17/06/2006 11
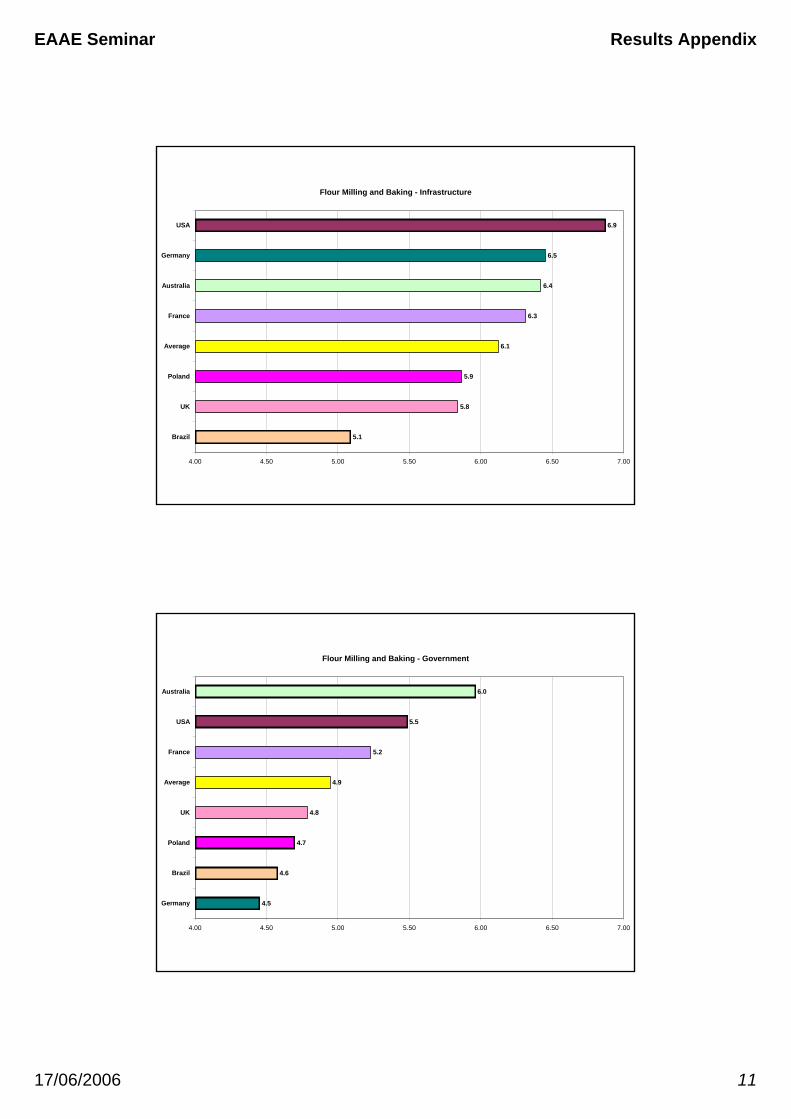
Flour Milling and Baking - Infrastructure
5.1
5.8
5.9
6.1
6.3
6.4
6.5
6.9
4.00 4.50 5.00 5.50 6.00 6.50 7.00
Brazil
UK
Poland
Average
France
Australia
Germany
USA
Flour Milling and Baking - Government
4.5
4.6
4.7
4.8
4.9
5.2
5.5
6.0
4.00 4.50 5.00 5.50 6.00 6.50 7.00
Germany
Brazil
Poland
UK
Average
France
USA
Australia
EAAE Seminar Results Appendix
17/06/2006 12
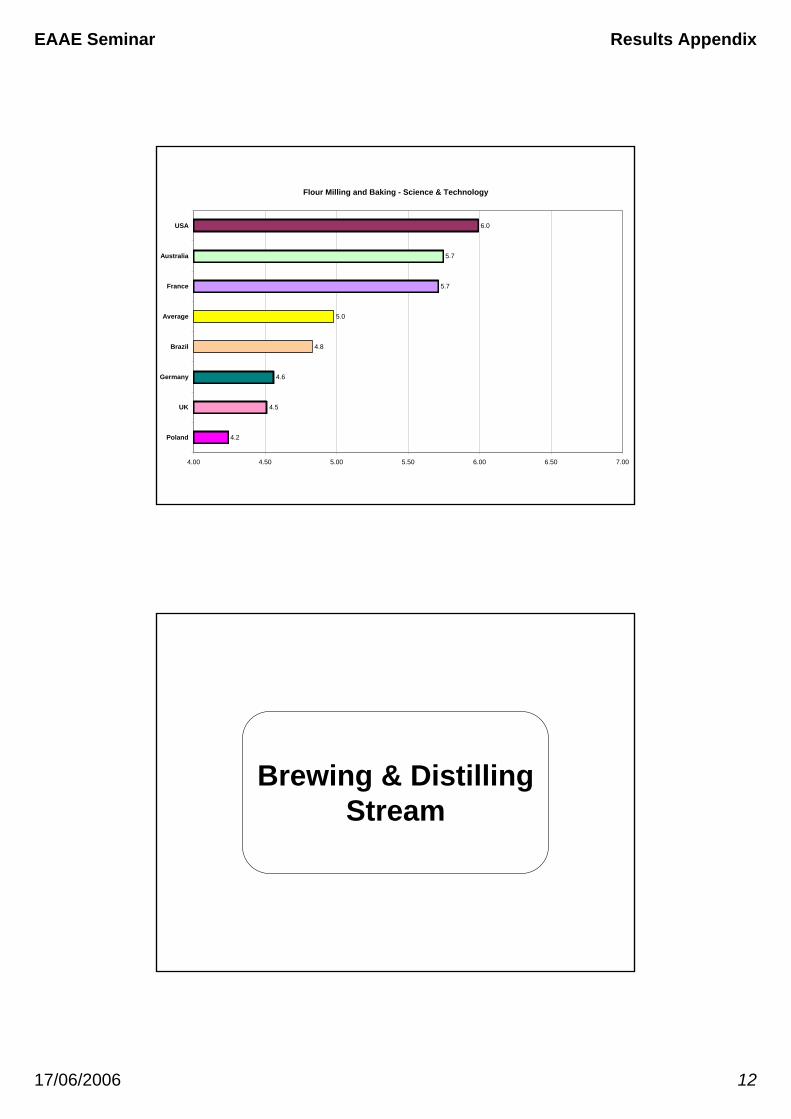
Flour Milling and Baking - Science & Technology
4.2
4.5
4.6
4.8
5.0
5.7
5.7
6.0
4.00 4.50 5.00 5.50 6.00 6.50 7.00
Poland
UK
Germany
Brazil
Average
France
Australia
USA
Brewing & Distilling Stream
EAAE Seminar Results Appendix
17/06/2006 13
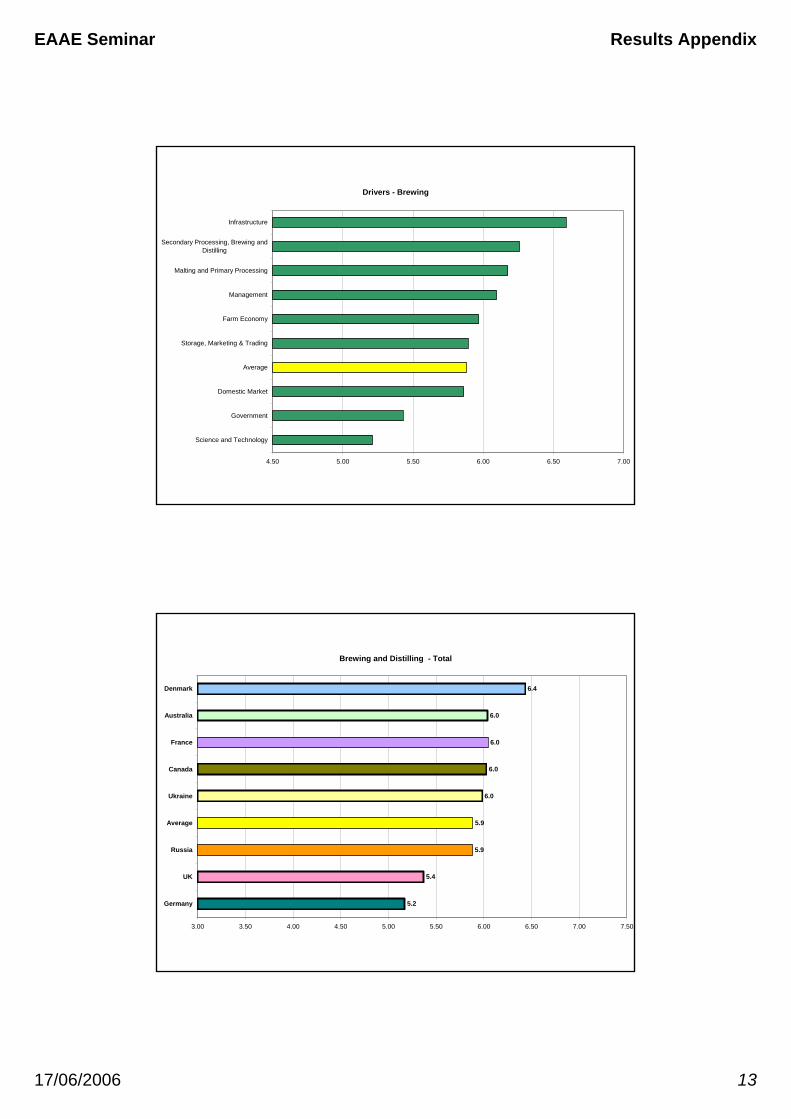
Drivers - Brewing
4.50 5.00 5.50 6.00 6.50 7.00
Science and Technology
Government
Domestic Market
Average
Storage, Marketing & Trading
Farm Economy
Management
Malting and Primary Processing
Secondary Processing, Brewing andDistilling
Infrastructure
Brewing and Distilling - Total
5.2
5.4
5.9
5.9
6.0
6.0
6.0
6.0
6.4
3.00 3.50 4.00 4.50 5.00 5.50 6.00 6.50 7.00 7.50
Germany
UK
Russia
Average
Ukraine
Canada
France
Australia
Denmark
EAAE Seminar Results Appendix
17/06/2006 14
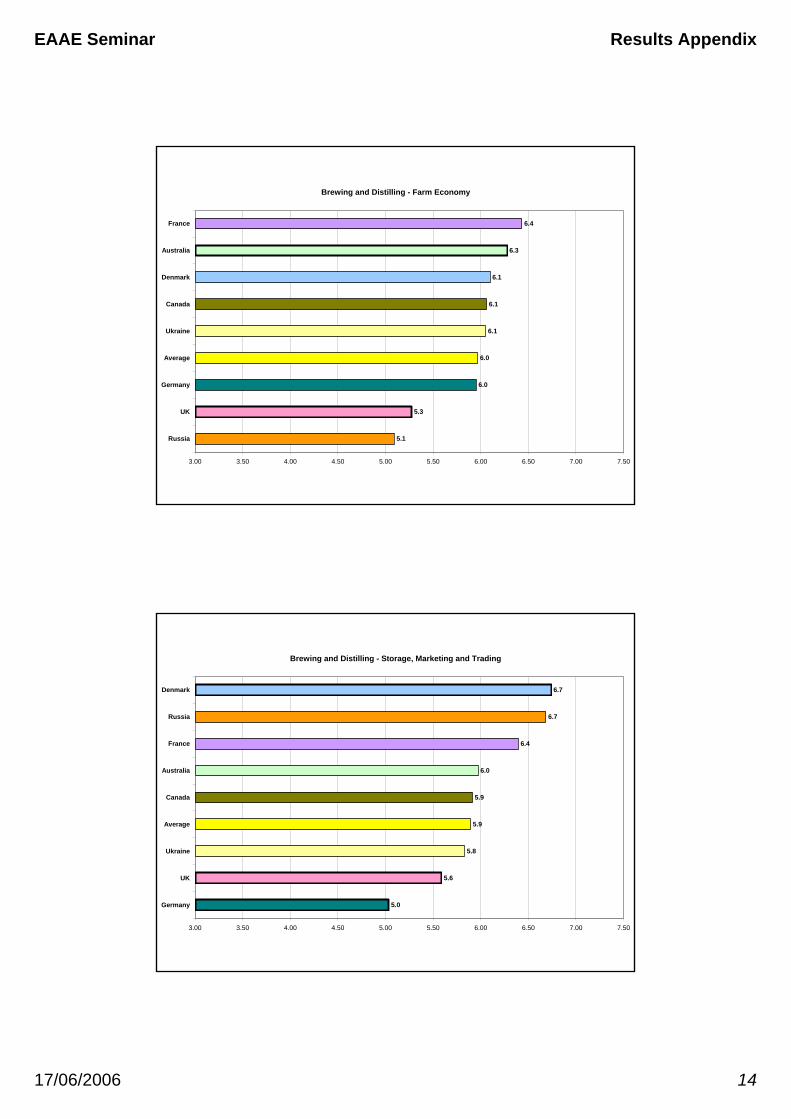
Brewing and Distilling - Farm Economy
5.1
5.3
6.0
6.0
6.1
6.1
6.1
6.3
6.4
3.00 3.50 4.00 4.50 5.00 5.50 6.00 6.50 7.00 7.50
Russia
UK
Germany
Average
Ukraine
Canada
Denmark
Australia
France
Brewing and Distilling - Storage, Marketing and Trading
5.0
5.6
5.8
5.9
5.9
6.0
6.4
6.7
6.7
3.00 3.50 4.00 4.50 5.00 5.50 6.00 6.50 7.00 7.50
Germany
UK
Ukraine
Average
Canada
Australia
France
Russia
Denmark
EAAE Seminar Results Appendix
17/06/2006 15
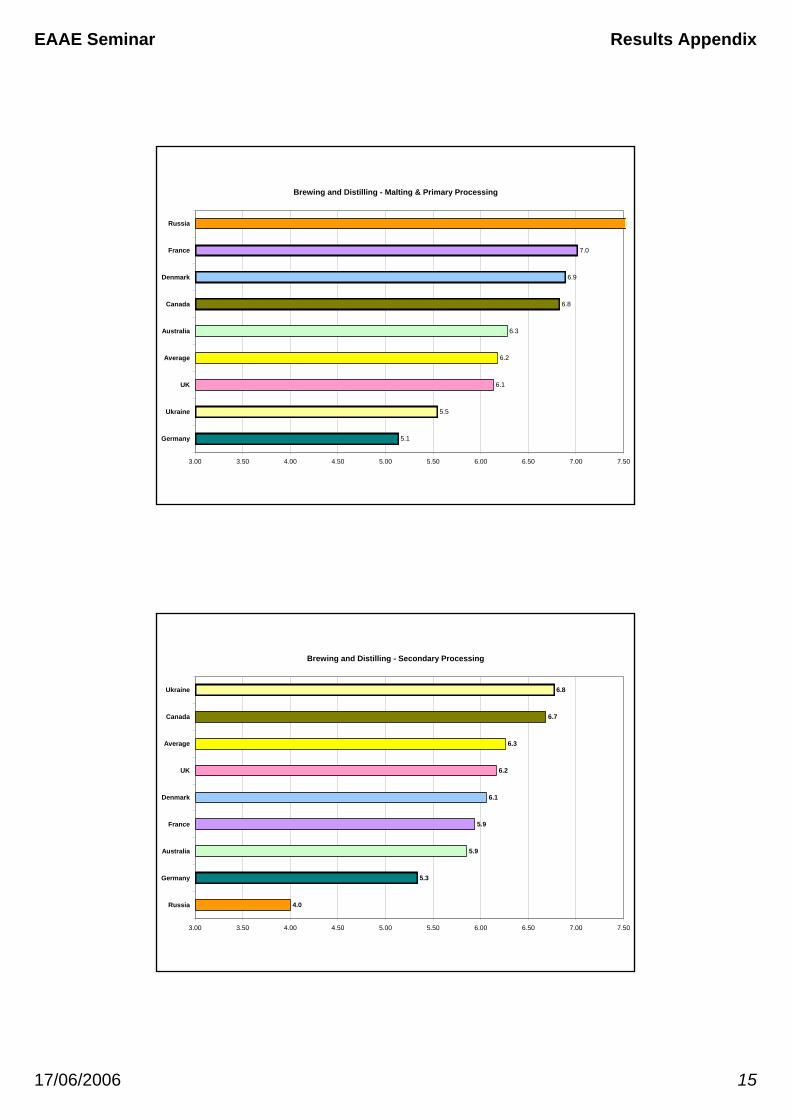
Brewing and Distilling - Malting & Primary Processing
5.1
5.5
6.1
6.2
6.3
6.8
6.9
7.0
3.00 3.50 4.00 4.50 5.00 5.50 6.00 6.50 7.00 7.50
Germany
Ukraine
UK
Average
Australia
Canada
Denmark
France
Russia
Brewing and Distilling - Secondary Processing
4.0
5.3
5.9
5.9
6.1
6.2
6.3
6.7
6.8
3.00 3.50 4.00 4.50 5.00 5.50 6.00 6.50 7.00 7.50
Russia
Germany
Australia
France
Denmark
UK
Average
Canada
Ukraine
EAAE Seminar Results Appendix
17/06/2006 16
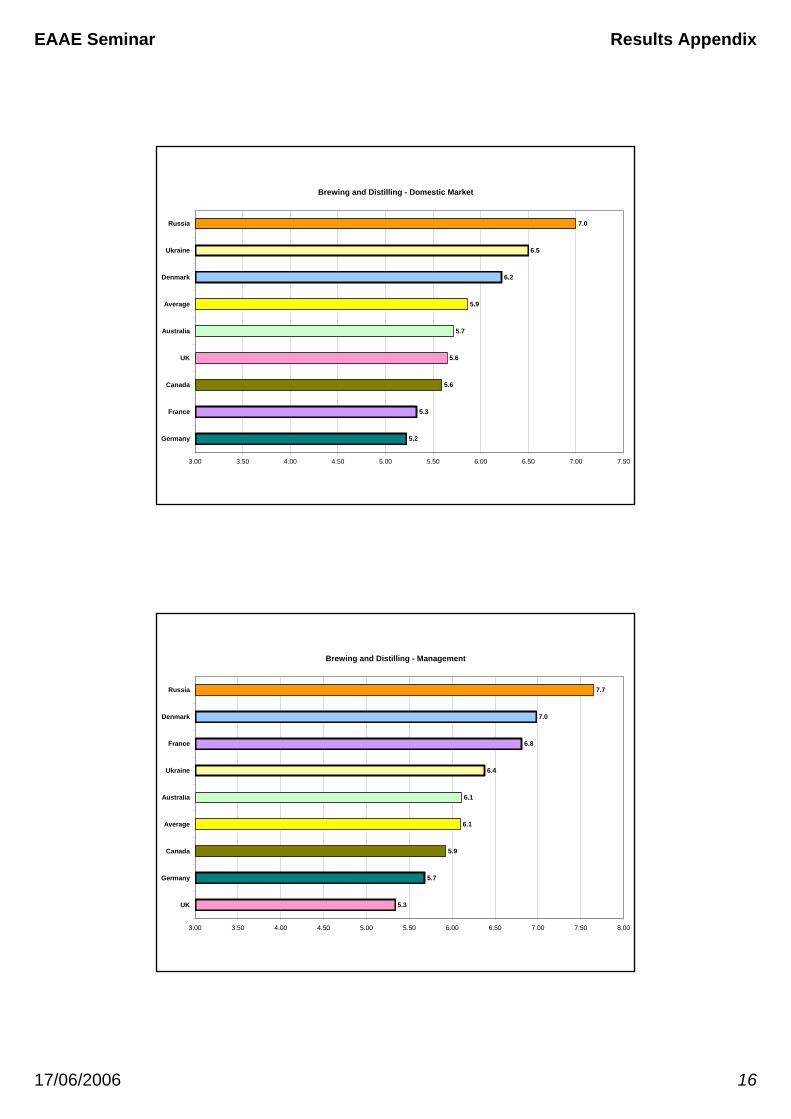
Brewing and Distilling - Domestic Market
5.2
5.3
5.6
5.6
5.7
5.9
6.2
6.5
7.0
3.00 3.50 4.00 4.50 5.00 5.50 6.00 6.50 7.00 7.50
Germany
France
Canada
UK
Australia
Average
Denmark
Ukraine
Russia
Brewing and Distilling - Management
5.3
5.7
5.9
6.1
6.1
6.4
6.8
7.0
7.7
3.00 3.50 4.00 4.50 5.00 5.50 6.00 6.50 7.00 7.50 8.00
UK
Germany
Canada
Average
Australia
Ukraine
France
Denmark
Russia
EAAE Seminar Results Appendix
17/06/2006 17
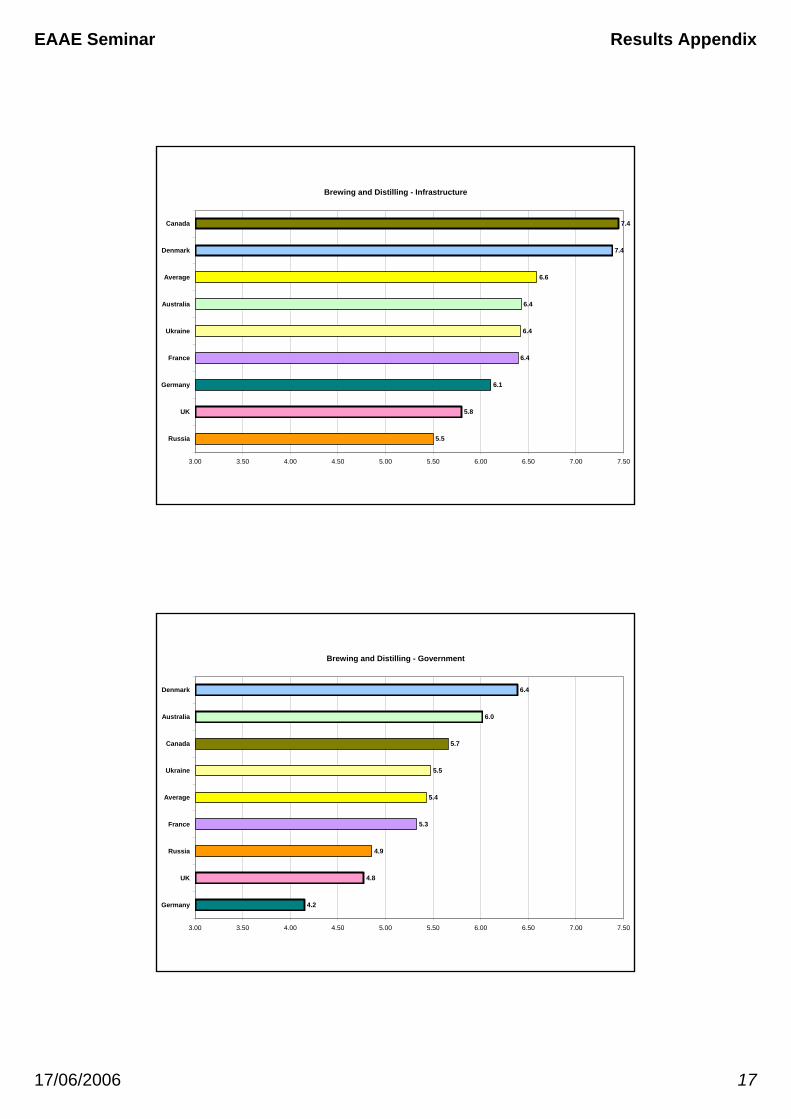
Brewing and Distilling - Infrastructure
5.5
5.8
6.1
6.4
6.4
6.4
6.6
7.4
7.4
3.00 3.50 4.00 4.50 5.00 5.50 6.00 6.50 7.00 7.50
Russia
UK
Germany
France
Ukraine
Australia
Average
Denmark
Canada
Brewing and Distilling - Government
4.2
4.8
4.9
5.3
5.4
5.5
5.7
6.0
6.4
3.00 3.50 4.00 4.50 5.00 5.50 6.00 6.50 7.00 7.50
Germany
UK
Russia
France
Average
Ukraine
Canada
Australia
Denmark
EAAE Seminar Results Appendix
17/06/2006 18
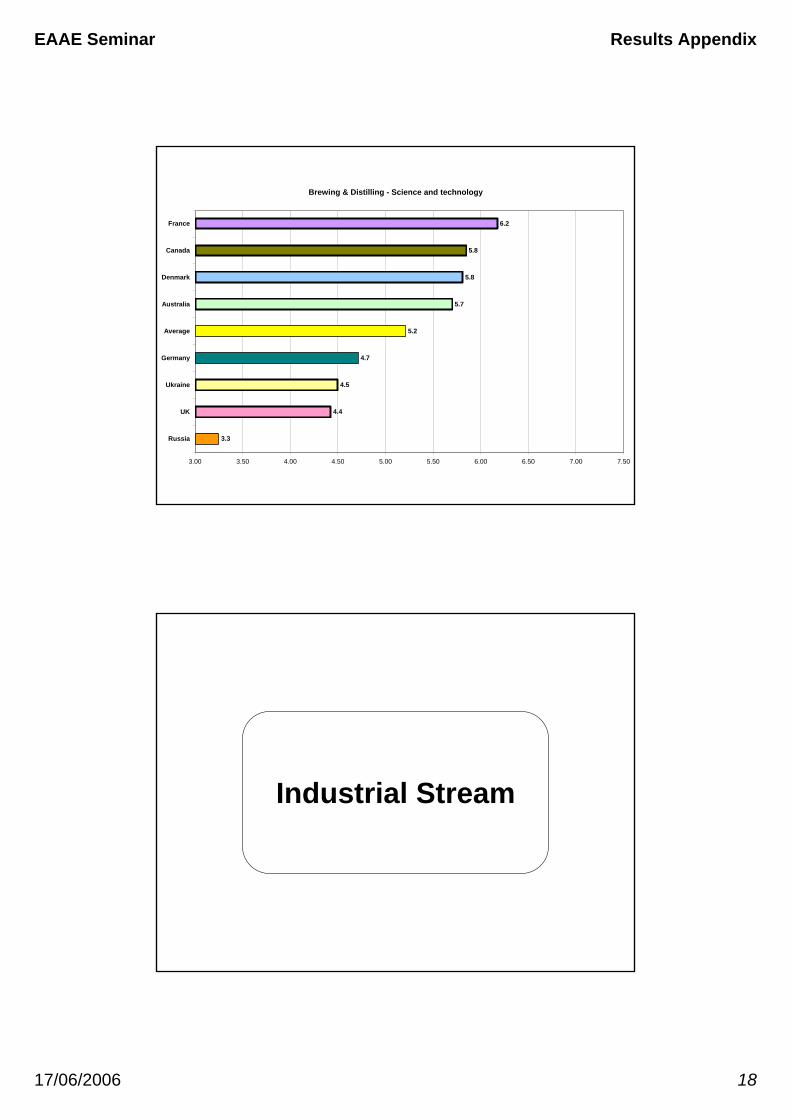
Brewing & Distilling - Science and technology
3.3
4.4
4.5
4.7
5.2
5.7
5.8
5.8
6.2
3.00 3.50 4.00 4.50 5.00 5.50 6.00 6.50 7.00 7.50
Russia
UK
Ukraine
Germany
Average
Australia
Denmark
Canada
France
Industrial Stream
EAAE Seminar Results Appendix
17/06/2006 19
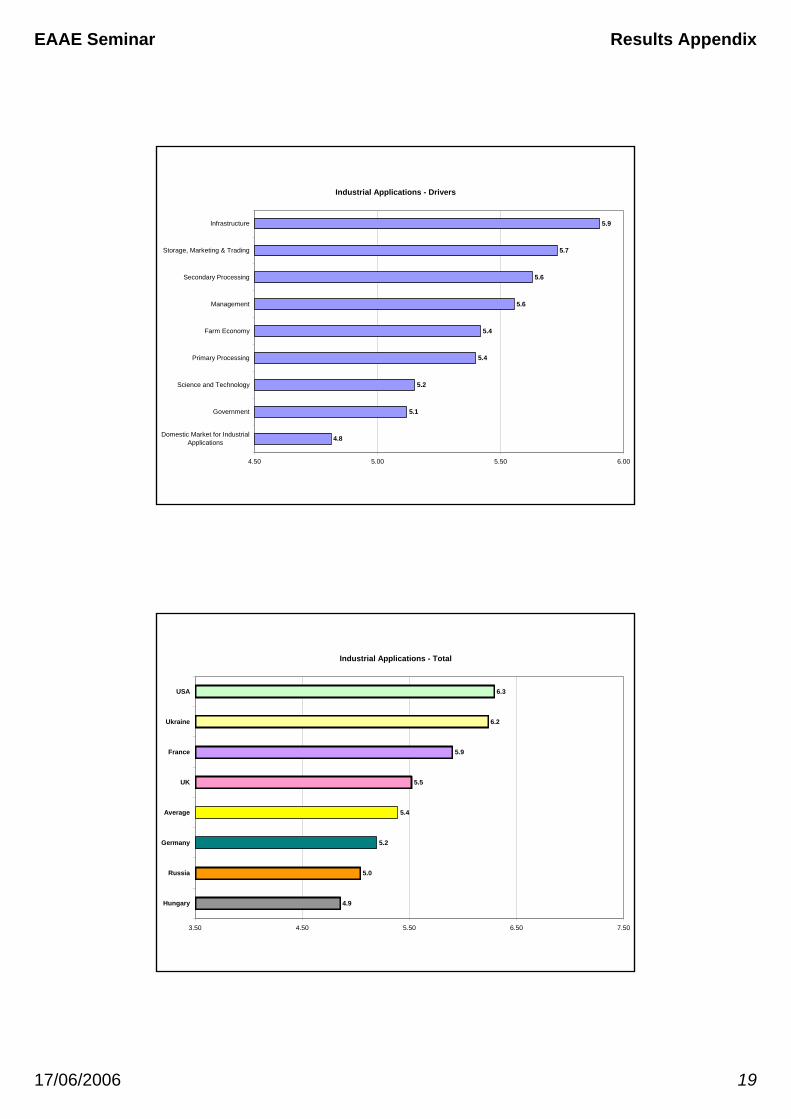
Industrial Applications - Drivers
4.8
5.1
5.2
5.4
5.4
5.6
5.6
5.7
5.9
4.50 5.00 5.50 6.00
Domestic Market for IndustrialApplications
Government
Science and Technology
Primary Processing
Farm Economy
Management
Secondary Processing
Storage, Marketing & Trading
Infrastructure
Industrial Applications - Total
4.9
5.0
5.2
5.4
5.5
5.9
6.2
6.3
3.50 4.50 5.50 6.50 7.50
Hungary
Russia
Germany
Average
UK
France
Ukraine
USA
EAAE Seminar Results Appendix
17/06/2006 20
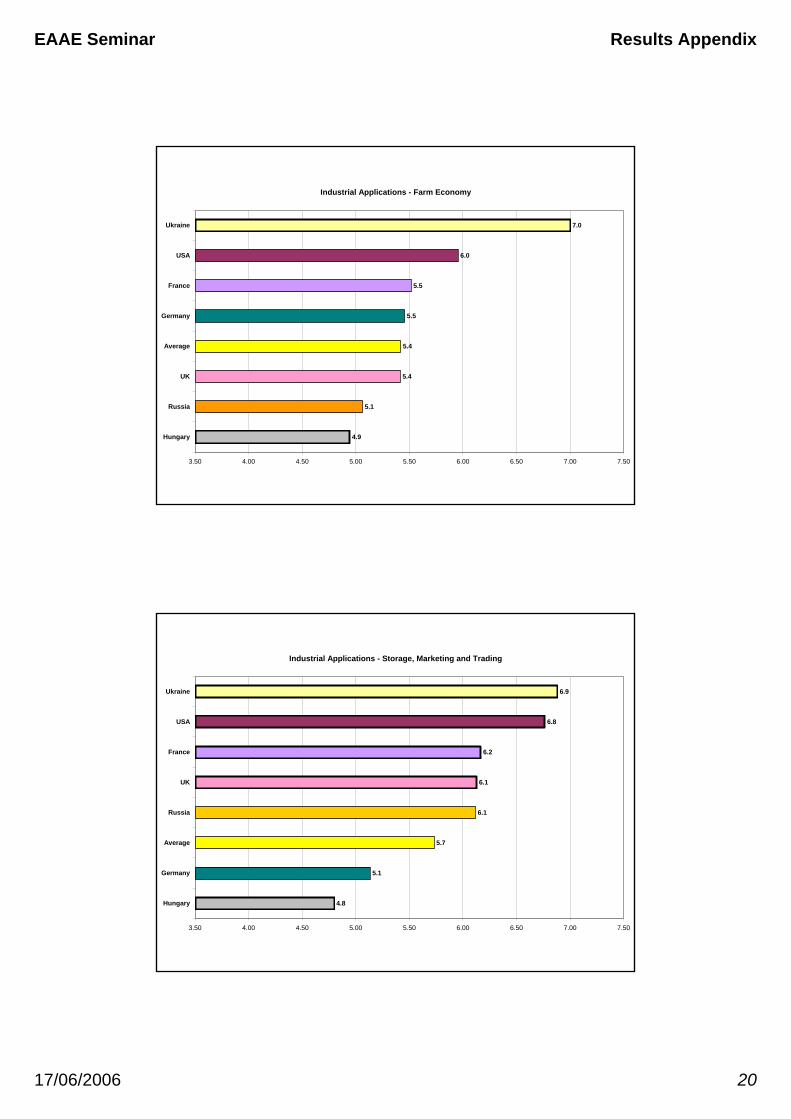
Industrial Applications - Farm Economy
4.9
5.1
5.4
5.4
5.5
5.5
6.0
7.0
3.50 4.00 4.50 5.00 5.50 6.00 6.50 7.00 7.50
Hungary
Russia
UK
Average
Germany
France
USA
Ukraine
Industrial Applications - Storage, Marketing and Trading
4.8
5.1
5.7
6.1
6.1
6.2
6.8
6.9
3.50 4.00 4.50 5.00 5.50 6.00 6.50 7.00 7.50
Hungary
Germany
Average
Russia
UK
France
USA
Ukraine
EAAE Seminar Results Appendix
17/06/2006 21
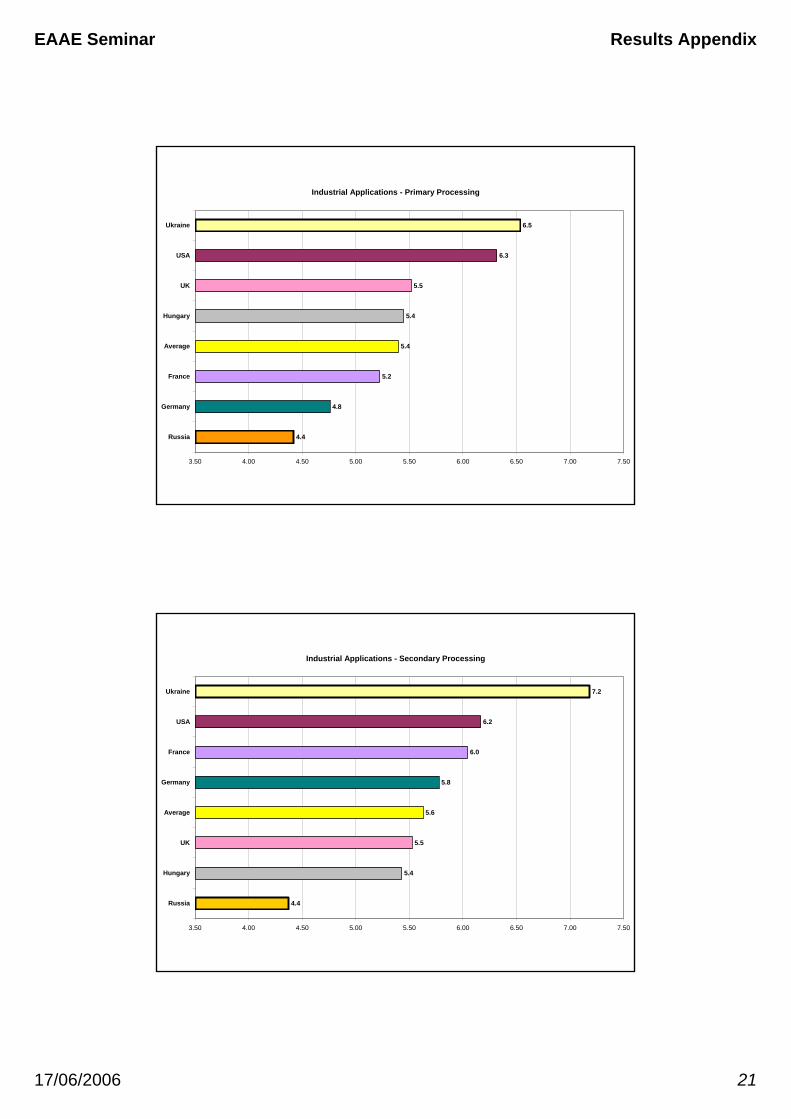
Industrial Applications - Primary Processing
4.4
4.8
5.2
5.4
5.4
5.5
6.3
6.5
3.50 4.00 4.50 5.00 5.50 6.00 6.50 7.00 7.50
Russia
Germany
France
Average
Hungary
UK
USA
Ukraine
Industrial Applications - Secondary Processing
4.4
5.4
5.5
5.6
5.8
6.0
6.2
7.2
3.50 4.00 4.50 5.00 5.50 6.00 6.50 7.00 7.50
Russia
Hungary
UK
Average
Germany
France
USA
Ukraine
EAAE Seminar Results Appendix
17/06/2006 22
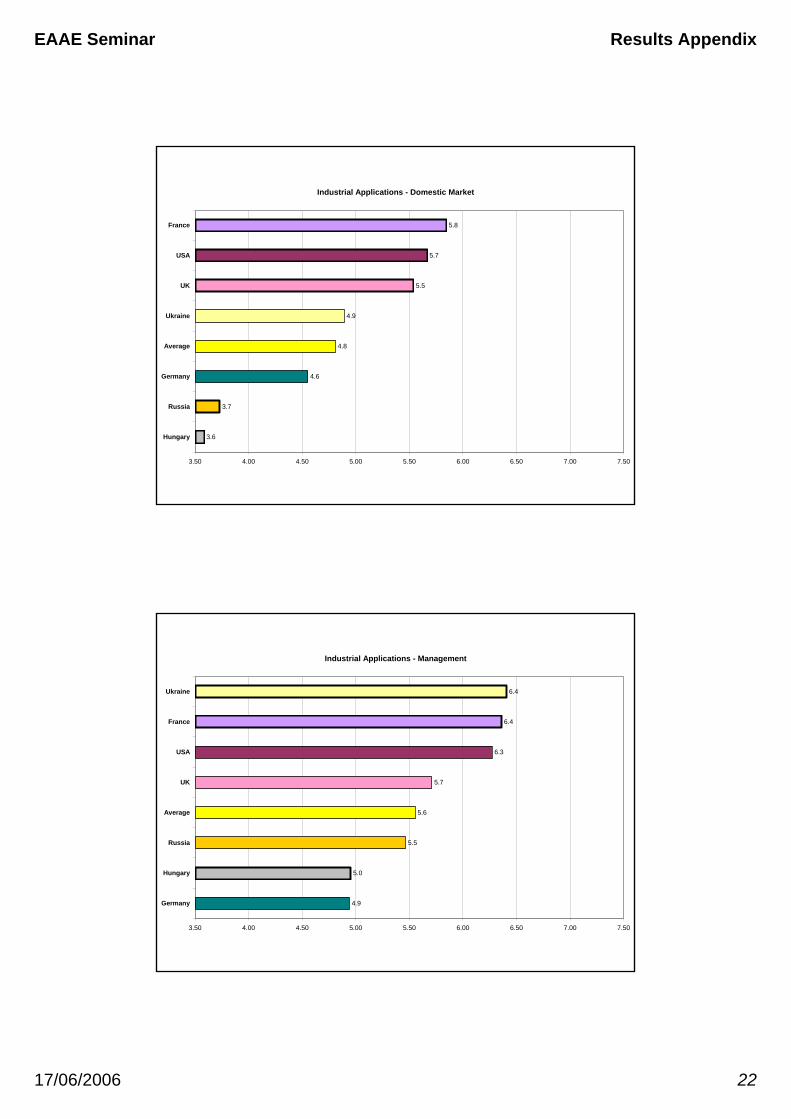
Industrial Applications - Domestic Market
3.6
3.7
4.6
4.8
4.9
5.5
5.7
5.8
3.50 4.00 4.50 5.00 5.50 6.00 6.50 7.00 7.50
Hungary
Russia
Germany
Average
Ukraine
UK
USA
France
Industrial Applications - Management
4.9
5.0
5.5
5.6
5.7
6.3
6.4
6.4
3.50 4.00 4.50 5.00 5.50 6.00 6.50 7.00 7.50
Germany
Hungary
Russia
Average
UK
USA
France
Ukraine
EAAE Seminar Results Appendix
17/06/2006 23
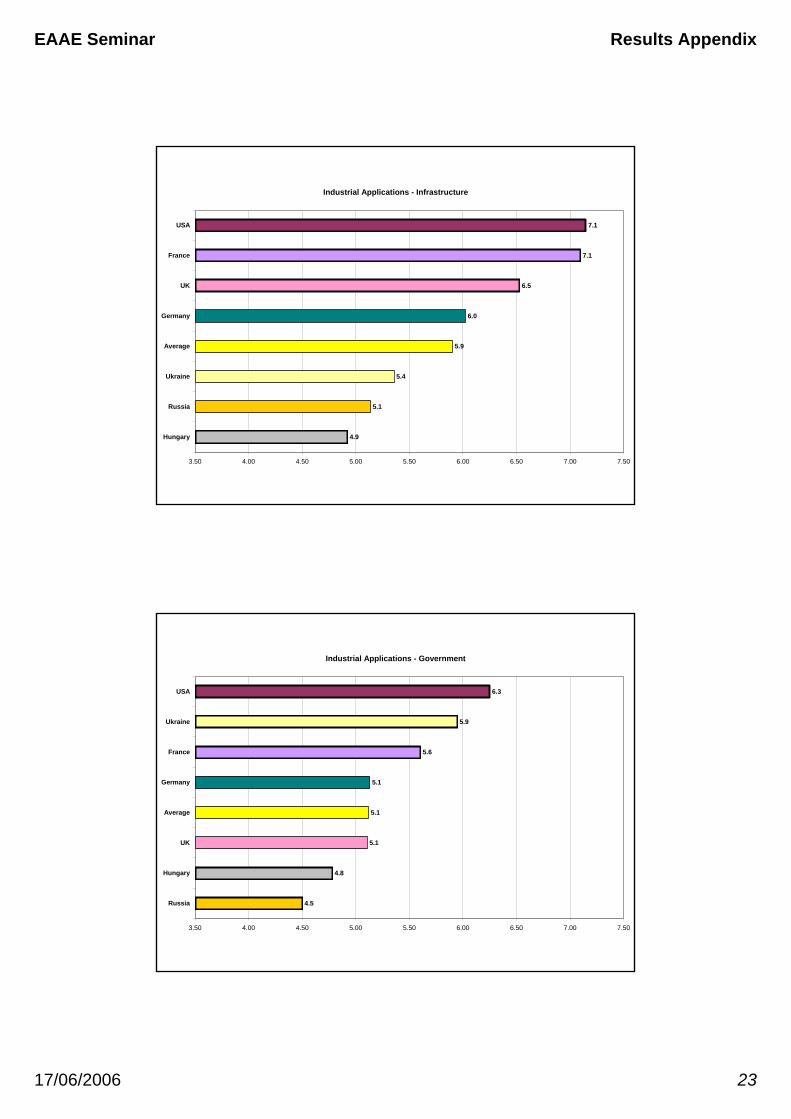
Industrial Applications - Infrastructure
4.9
5.1
5.4
5.9
6.0
6.5
7.1
7.1
3.50 4.00 4.50 5.00 5.50 6.00 6.50 7.00 7.50
Hungary
Russia
Ukraine
Average
Germany
UK
France
USA
Industrial Applications - Government
4.5
4.8
5.1
5.1
5.1
5.6
5.9
6.3
3.50 4.00 4.50 5.00 5.50 6.00 6.50 7.00 7.50
Russia
Hungary
UK
Average
Germany
France
Ukraine
USA
EAAE Seminar Results Appendix
17/06/2006 24
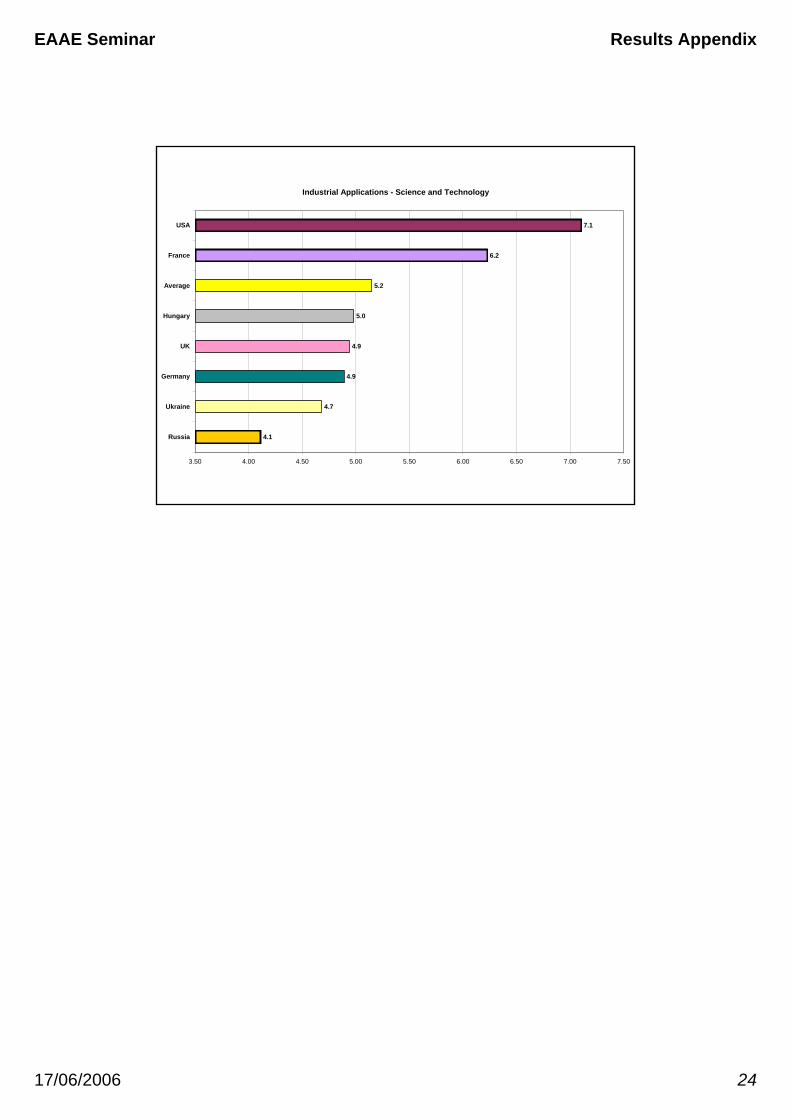
Industrial Applications - Science and Technology
4.1
4.7
4.9
4.9
5.0
5.2
6.2
7.1
3.50 4.00 4.50 5.00 5.50 6.00 6.50 7.00 7.50
Russia
Ukraine
Germany
UK
Hungary
Average
France
USA