Embed Size (px)
Citation preview
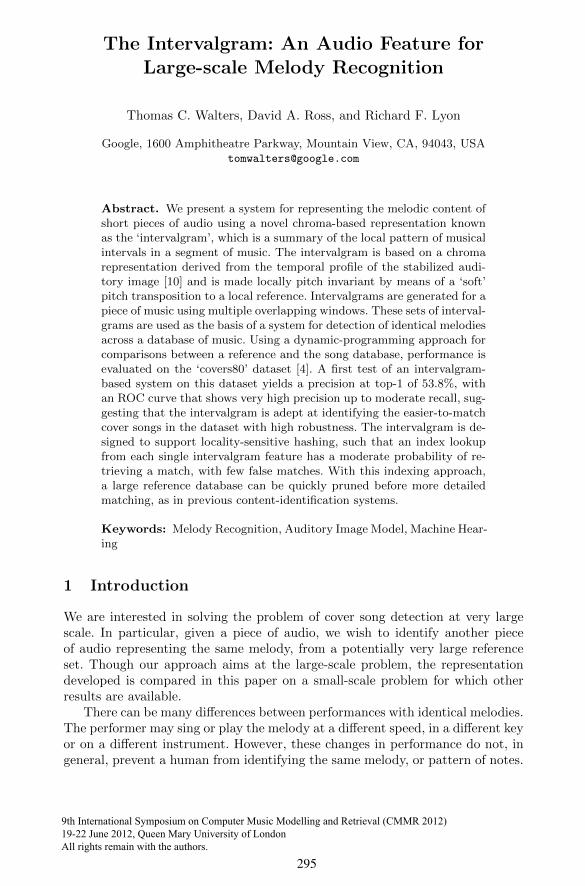
The Intervalgram: An Audio Feature forLarge-scale Melody Recognition
Thomas C. Walters, David A. Ross, and Richard F. Lyon
Google, 1600 Amphitheatre Parkway, Mountain View, CA, 94043, [email protected]
Abstract. We present a system for representing the melodic content ofshort pieces of audio using a novel chroma-based representation knownas the ‘intervalgram’, which is a summary of the local pattern of musicalintervals in a segment of music. The intervalgram is based on a chromarepresentation derived from the temporal profile of the stabilized audi-tory image [10] and is made locally pitch invariant by means of a ‘soft’pitch transposition to a local reference. Intervalgrams are generated for apiece of music using multiple overlapping windows. These sets of interval-grams are used as the basis of a system for detection of identical melodiesacross a database of music. Using a dynamic-programming approach forcomparisons between a reference and the song database, performance isevaluated on the ‘covers80’ dataset [4]. A first test of an intervalgram-based system on this dataset yields a precision at top-1 of 53.8%, withan ROC curve that shows very high precision up to moderate recall, sug-gesting that the intervalgram is adept at identifying the easier-to-matchcover songs in the dataset with high robustness. The intervalgram is de-signed to support locality-sensitive hashing, such that an index lookupfrom each single intervalgram feature has a moderate probability of re-trieving a match, with few false matches. With this indexing approach,a large reference database can be quickly pruned before more detailedmatching, as in previous content-identification systems.
Keywords: Melody Recognition, Auditory Image Model, Machine Hear-ing
1 Introduction
We are interested in solving the problem of cover song detection at very largescale. In particular, given a piece of audio, we wish to identify another pieceof audio representing the same melody, from a potentially very large referenceset. Though our approach aims at the large-scale problem, the representationdeveloped is compared in this paper on a small-scale problem for which otherresults are available.
There can be many differences between performances with identical melodies.The performer may sing or play the melody at a different speed, in a different keyor on a different instrument. However, these changes in performance do not, ingeneral, prevent a human from identifying the same melody, or pattern of notes.
9th International Symposium on Computer Music Modelling and Retrieval (CMMR 2012) 19-22 June 2012, Queen Mary University of London All rights remain with the authors.
295
2 Thomas C. Walters, David A. Ross and Richard F. Lyon
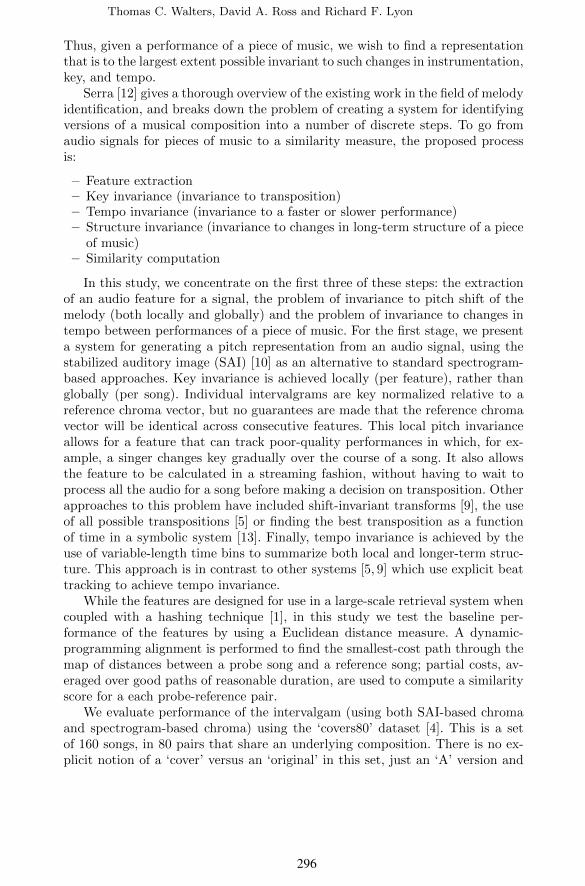
Thus, given a performance of a piece of music, we wish to find a representationthat is to the largest extent possible invariant to such changes in instrumentation,key, and tempo.
Serra [12] gives a thorough overview of the existing work in the field of melodyidentification, and breaks down the problem of creating a system for identifyingversions of a musical composition into a number of discrete steps. To go fromaudio signals for pieces of music to a similarity measure, the proposed processis:
– Feature extraction– Key invariance (invariance to transposition)– Tempo invariance (invariance to a faster or slower performance)– Structure invariance (invariance to changes in long-term structure of a piece
of music)– Similarity computation
In this study, we concentrate on the first three of these steps: the extractionof an audio feature for a signal, the problem of invariance to pitch shift of themelody (both locally and globally) and the problem of invariance to changes intempo between performances of a piece of music. For the first stage, we presenta system for generating a pitch representation from an audio signal, using thestabilized auditory image (SAI) [10] as an alternative to standard spectrogram-based approaches. Key invariance is achieved locally (per feature), rather thanglobally (per song). Individual intervalgrams are key normalized relative to areference chroma vector, but no guarantees are made that the reference chromavector will be identical across consecutive features. This local pitch invarianceallows for a feature that can track poor-quality performances in which, for ex-ample, a singer changes key gradually over the course of a song. It also allowsthe feature to be calculated in a streaming fashion, without having to wait toprocess all the audio for a song before making a decision on transposition. Otherapproaches to this problem have included shift-invariant transforms [9], the useof all possible transpositions [5] or finding the best transposition as a functionof time in a symbolic system [13]. Finally, tempo invariance is achieved by theuse of variable-length time bins to summarize both local and longer-term struc-ture. This approach is in contrast to other systems [5, 9] which use explicit beattracking to achieve tempo invariance.
While the features are designed for use in a large-scale retrieval system whencoupled with a hashing technique [1], in this study we test the baseline per-formance of the features by using a Euclidean distance measure. A dynamic-programming alignment is performed to find the smallest-cost path through themap of distances between a probe song and a reference song; partial costs, av-eraged over good paths of reasonable duration, are used to compute a similarityscore for a each probe-reference pair.
We evaluate performance of the intervalgam (using both SAI-based chromaand spectrogram-based chroma) using the ‘covers80’ dataset [4]. This is a setof 160 songs, in 80 pairs that share an underlying composition. There is no ex-plicit notion of a ‘cover’ versus an ‘original’ in this set, just an ‘A’ version and
296
The Intervalgram: An Audio Feature for Large-scale Melody Recognition 3
a ‘B’ version of a given composition, randomly selected. While it is a small cor-pus, several researchers have made use of this dataset for development of audiofeatures, and report results on it. Ellis [5] reports performance in terms of ab-solute classification accuracy for the LabRosa 2006 and 2007 music informationretrieval evaluation exchange (MIREX) competition, and these results are ex-tended by, amongst others, Ravuri and Ellis [11], who present detection errortradeoff curves for a number of systems.
Since we are ultimately interested in the use of the intervalgram in a large-scale system, it is worth briefly considering the requirements of such a system.In order to perform completely automated detection of cover songs from a largereference collection, it is necessary to tune a system to have extremely low falsehit rate on each reference. For such a system, we are interested less in high abso-lute recall and more in finding the best possible recall given a very low thresholdfor false positives. Such systems have previously been reported for nearly-exact-match content identification [1]. The intervalgram has been developed for andtested with a similar large-scale back end based on indexing, but there is no largeaccessible data set on which performance can be reported. It is hard to estimaterecall on such undocumented data sets, but the system identifies a large numberof covers even when tuned for less than 1% false matches.
2 Algorithm
2.1 The Stabilized Auditory Image
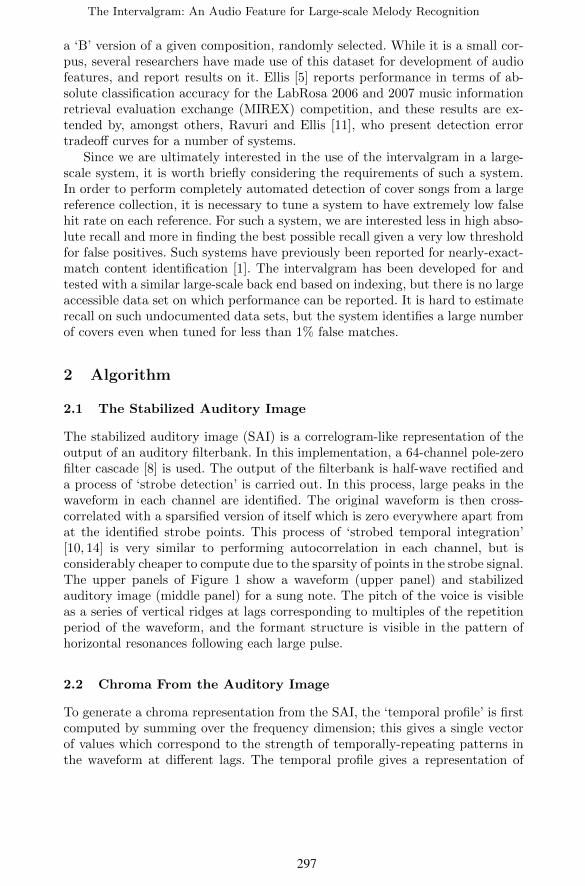
The stabilized auditory image (SAI) is a correlogram-like representation of theoutput of an auditory filterbank. In this implementation, a 64-channel pole-zerofilter cascade [8] is used. The output of the filterbank is half-wave rectified anda process of ‘strobe detection’ is carried out. In this process, large peaks in thewaveform in each channel are identified. The original waveform is then cross-correlated with a sparsified version of itself which is zero everywhere apart fromat the identified strobe points. This process of ‘strobed temporal integration’[10, 14] is very similar to performing autocorrelation in each channel, but isconsiderably cheaper to compute due to the sparsity of points in the strobe signal.The upper panels of Figure 1 show a waveform (upper panel) and stabilizedauditory image (middle panel) for a sung note. The pitch of the voice is visibleas a series of vertical ridges at lags corresponding to multiples of the repetitionperiod of the waveform, and the formant structure is visible in the pattern ofhorizontal resonances following each large pulse.
2.2 Chroma From the Auditory Image
To generate a chroma representation from the SAI, the ‘temporal profile’ is firstcomputed by summing over the frequency dimension; this gives a single vectorof values which correspond to the strength of temporally-repeating patterns inthe waveform at different lags. The temporal profile gives a representation of
297
4 Thomas C. Walters, David A. Ross and Richard F. Lyon
0 5 10
Time (ms)F
ilte
r ce
nte
r fr
eq
ue
ncy (
Hz) 9400
40
0 5 10
Lag (ms)
Fig. 1. Waveform (top panel), stabilized auditory image(SAI) (middle panel) and SAItemporal profile (bottom panel) for a human voice singing a note.
the time intervals associated with strong temporal repetition rates, or possiblepitches, in the incoming waveform. This SAI temporal profile closely modelshuman pitch perception [6]; for example, in the case of stimuli with a missingfundamental, there may be no energy in the spectrogram at the frequency of thepitch perceived by a human, but the temporal profile will show a peak at thetime interval associated with the missing fundamental.
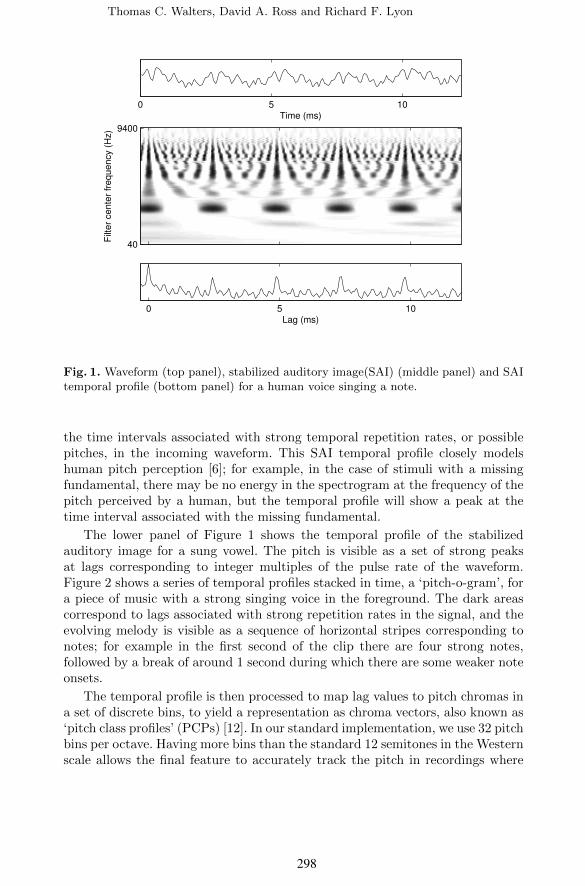
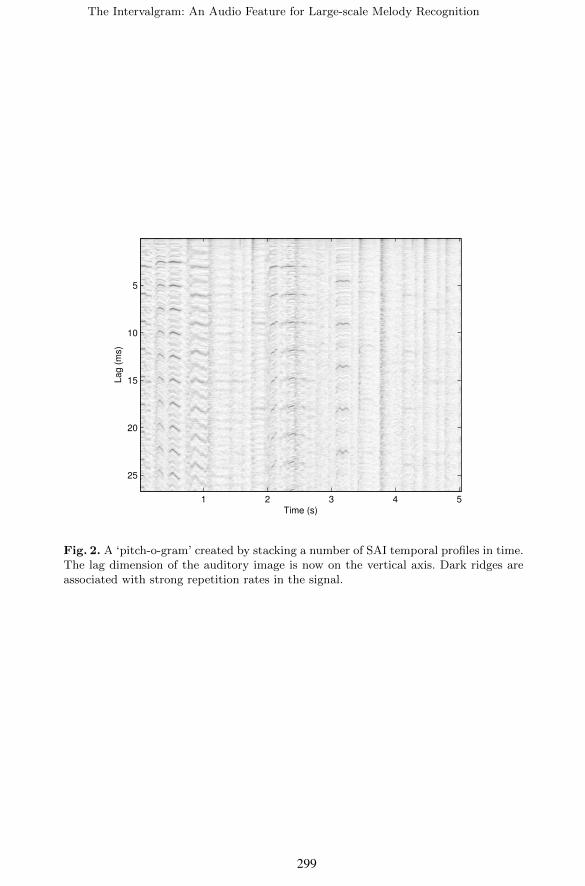
The lower panel of Figure 1 shows the temporal profile of the stabilizedauditory image for a sung vowel. The pitch is visible as a set of strong peaksat lags corresponding to integer multiples of the pulse rate of the waveform.Figure 2 shows a series of temporal profiles stacked in time, a ‘pitch-o-gram’, fora piece of music with a strong singing voice in the foreground. The dark areascorrespond to lags associated with strong repetition rates in the signal, and theevolving melody is visible as a sequence of horizontal stripes corresponding tonotes; for example in the first second of the clip there are four strong notes,followed by a break of around 1 second during which there are some weaker noteonsets.
The temporal profile is then processed to map lag values to pitch chromas ina set of discrete bins, to yield a representation as chroma vectors, also known as‘pitch class profiles’ (PCPs) [12]. In our standard implementation, we use 32 pitchbins per octave. Having more bins than the standard 12 semitones in the Westernscale allows the final feature to accurately track the pitch in recordings where
298
The Intervalgram: An Audio Feature for Large-scale Melody Recognition 5
La
g (
ms)
Time (s)
1 2 3 4 5
5
10
15
20
25
Fig. 2. A ‘pitch-o-gram’ created by stacking a number of SAI temporal profiles in time.The lag dimension of the auditory image is now on the vertical axis. Dark ridges areassociated with strong repetition rates in the signal.
299
6 Thomas C. Walters, David A. Ross and Richard F. Lyon
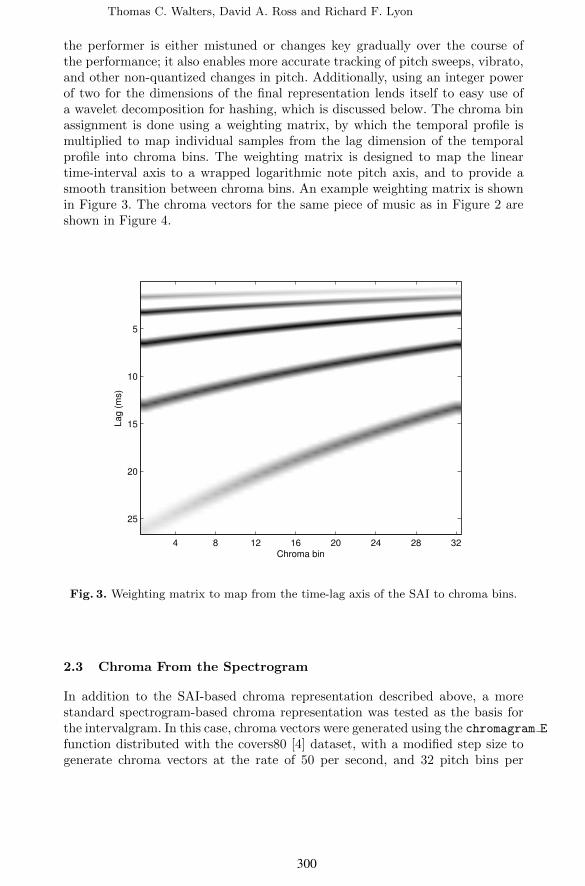
the performer is either mistuned or changes key gradually over the course ofthe performance; it also enables more accurate tracking of pitch sweeps, vibrato,and other non-quantized changes in pitch. Additionally, using an integer powerof two for the dimensions of the final representation lends itself to easy use ofa wavelet decomposition for hashing, which is discussed below. The chroma binassignment is done using a weighting matrix, by which the temporal profile ismultiplied to map individual samples from the lag dimension of the temporalprofile into chroma bins. The weighting matrix is designed to map the lineartime-interval axis to a wrapped logarithmic note pitch axis, and to provide asmooth transition between chroma bins. An example weighting matrix is shownin Figure 3. The chroma vectors for the same piece of music as in Figure 2 areshown in Figure 4.
La
g (
ms)
Chroma bin
4 8 12 16 20 24 28 32
5
10
15
20
25
Fig. 3. Weighting matrix to map from the time-lag axis of the SAI to chroma bins.
2.3 Chroma From the Spectrogram
In addition to the SAI-based chroma representation described above, a morestandard spectrogram-based chroma representation was tested as the basis forthe intervalgram. In this case, chroma vectors were generated using the chromagram E
function distributed with the covers80 [4] dataset, with a modified step size togenerate chroma vectors at the rate of 50 per second, and 32 pitch bins per
300

The Intervalgram: An Audio Feature for Large-scale Melody Recognition 7
Time (s)
Ch
rom
a b
in
1 2 3 4 5
4
8
12
16
20
24
28
32
Fig. 4. Chroma vectors generated from the pitch-o-gram vectors shown in Figure 2.
octave for compatibility with the SAI-based features above. This function usesa Gaussian weighting function to map FFT bins to chroma, and weights theentire spectrum with a Gaussian weighting function to emphasize octaves in themiddle of the range of musical pitches.
2.4 Intervalgram Generation
A stream of chroma vectors is generated at a rate of 50 per second. From thischromagram, a stream of ‘intervalgrams’ is constructed at the rate of around4 per second. The intervalgram is a matrix with dimensions of chroma andtime offset; however, depending on the exact design the time-offset axis may benonlinear.
For each time-offset bin in the intervalgram, a sequence of individual chromavectors are averaged together to summarize the chroma in some time window,before or after a central reference time. It takes several contiguous notes to ef-fectively discern the structure of a melody, and for any given melody the streamof notes may be played a range of speeds. In order to take into account bothshort- and longer-term structure in the melody, a variable-length time-averagingprocess is used to provide a fine-grained view of the local melody structure, andsimultaneously give a coarser view of longer timescales, to accommodate a mod-erate amount of tempo variation; that is, small absolute time offsets use narrowtime bin widths, while larger absolute offsets use larger bin widths. Figure 5shows how chroma vectors are averaged together to make the intervalgram. Inthe examples below, the widths of the bins increase from the center of the inter-valgram, and are proportional to the sum of a forward and reverse exponential
wb = f(wp
f + w−pf
), where p is an integer between 0 and 15 (for the positive
bins) and between 0 and -15 (for the negative bins), f is the central bin width,and wf is the width factor which determines the speed with which the bin widthincreases as a function of distance from the center of the intervalgram.
In the best-performing implementation, the temporal axis of the intervalgramis 32 bins wide and spans a total time window of around 30 seconds. The central
301
8 Thomas C. Walters, David A. Ross and Richard F. Lyon
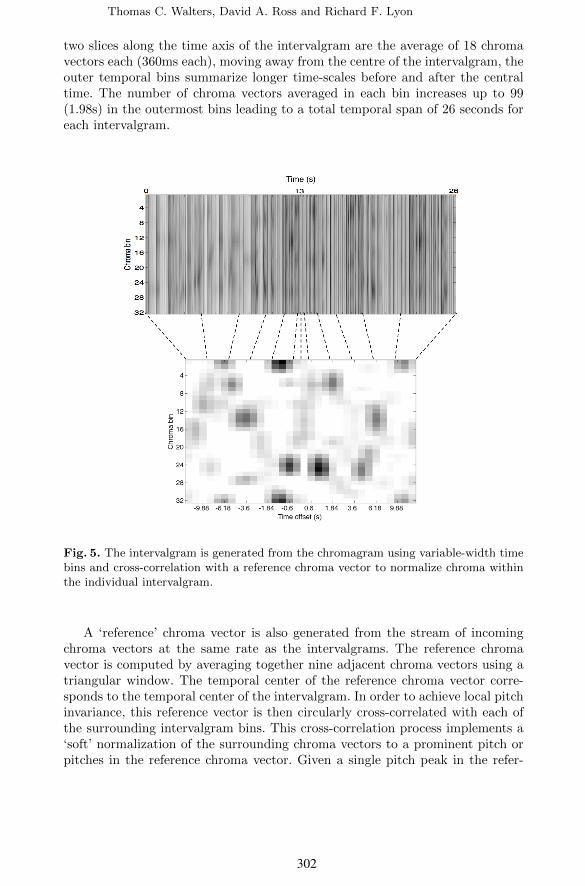
two slices along the time axis of the intervalgram are the average of 18 chromavectors each (360ms each), moving away from the centre of the intervalgram, theouter temporal bins summarize longer time-scales before and after the centraltime. The number of chroma vectors averaged in each bin increases up to 99(1.98s) in the outermost bins leading to a total temporal span of 26 seconds foreach intervalgram.
Fig. 5. The intervalgram is generated from the chromagram using variable-width timebins and cross-correlation with a reference chroma vector to normalize chroma withinthe individual intervalgram.
A ‘reference’ chroma vector is also generated from the stream of incomingchroma vectors at the same rate as the intervalgrams. The reference chromavector is computed by averaging together nine adjacent chroma vectors using atriangular window. The temporal center of the reference chroma vector corre-sponds to the temporal center of the intervalgram. In order to achieve local pitchinvariance, this reference vector is then circularly cross-correlated with each ofthe surrounding intervalgram bins. This cross-correlation process implements a‘soft’ normalization of the surrounding chroma vectors to a prominent pitch orpitches in the reference chroma vector. Given a single pitch peak in the refer-
302
The Intervalgram: An Audio Feature for Large-scale Melody Recognition 9
ence chroma vector, the process corresponds exactly to a simple transpositionof all chroma vectors to be relative to the single pitch peak. In the case wherethere are multiple strong peaks in the reference chroma vector, the process cor-responds to a simultaneous shifting to multiple reference pitches, followed by aweighted average based on the individual pitch strengths. This process leads toa blurry and more ambiguous interval representation but, crucially, never leadsto a hard decision being made about the ‘correct’ pitch of the melody at anypoint. Making only ‘soft’ decisions at each stage means that there is less needfor either heuristics or tuning of parameters in building the system. With stan-dard parameters the intervalgram is a 32 by 32 pixel feature vector generatedat the rate of one every 240ms and spanning a 26 second window. Since thereare many overlapping intervalgrams generated, there are many different pitchreference slices used, some making crisp intervalgrams, and some making fuzzyintervalgrams.
2.5 Similarity Scoring
Dynamic programming is a standard approach for aligning two audio representa-tions, and has been used for version identification by many authors (for example[16]; Serra [12] provides a representative list of example implementations). Tocompare sets of features from two recordings, each feature vector from the proberecording is compared to each feature vector from the reference recording, usingsome distance measure, for example Euclidean distance, correlation, or Hammingdistance over a locality-sensitive hash of the feature. This comparison yields adistance matrix with samples from the probe on one axis and samples from thereference on the other. We then find a minimum-cost path through this matrixusing a dynamic programming algorithm that is configured to allow jumpingover poorly-matching pairs. Starting at the corner corresponding to the begin-ning of the two recordings the path can continue by jumping forward a certainnumber of pixels in both the horizontal and vertical dimensions. The total costfor any particular jump is a function of the similarity of the two samples to bejumped to, the cost of the jump direction and the cost of the jump distance. Iftwo versions are exactly time-aligned, we would expect that the minimum-costpath through the distance matrix would be a straight line along the leading di-agonal. Since we expect the probe and reference to be roughly aligned, the costof a diagonal jump is set to be smaller than the cost of an off-diagonal jump.
The minimum and maximum allowed jump lengths in samples can be selectedto allow the algorithm to find similar intervalgrams that are more sparsely dis-tributed, interleaved with poorly matching ones, and to constrain the maximumand minimum deviation from the leading diagonal. Values that work well are aminimum jump of 3 and maximum of 4, with a cost factor equal to the longerof the jump dimensions (so a move of 3 steps in the reference and 4 in the probecosts as much as 4,4 even though it uses up less reference time, while jumps of3,3 and 4,4 along the diagonal can be freely intermixed without affecting thescore as long as enough good matching pairs are found to jump between). Theselengths, along with the cost penalty for an off-diagonal jump and the difference
303
10 Thomas C. Walters, David A. Ross and Richard F. Lyon
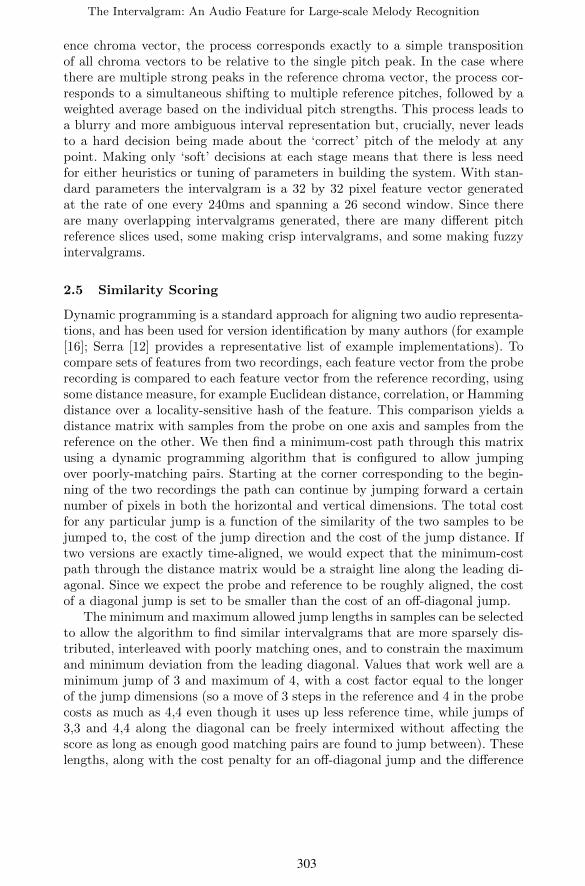
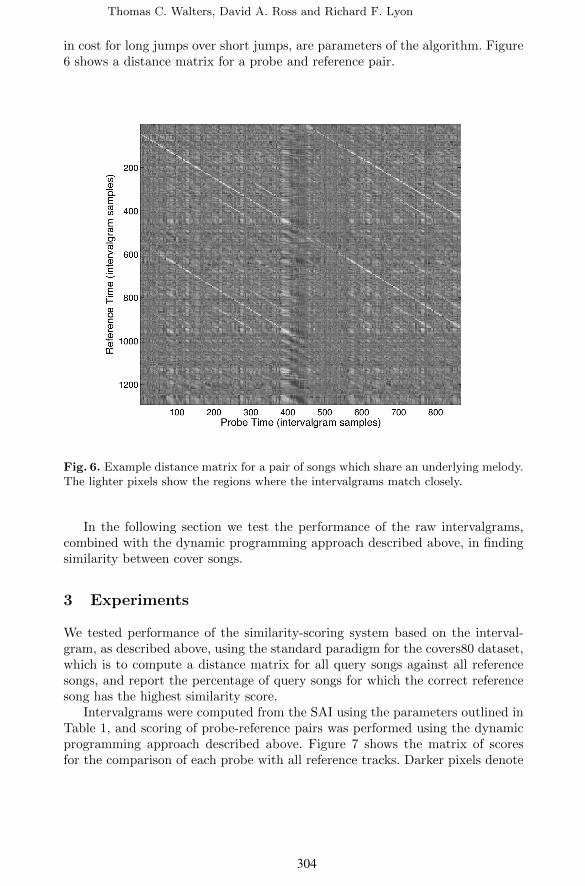
in cost for long jumps over short jumps, are parameters of the algorithm. Figure6 shows a distance matrix for a probe and reference pair.
Fig. 6. Example distance matrix for a pair of songs which share an underlying melody.The lighter pixels show the regions where the intervalgrams match closely.
In the following section we test the performance of the raw intervalgrams,combined with the dynamic programming approach described above, in findingsimilarity between cover songs.
3 Experiments
We tested performance of the similarity-scoring system based on the interval-gram, as described above, using the standard paradigm for the covers80 dataset,which is to compute a distance matrix for all query songs against all referencesongs, and report the percentage of query songs for which the correct referencesong has the highest similarity score.
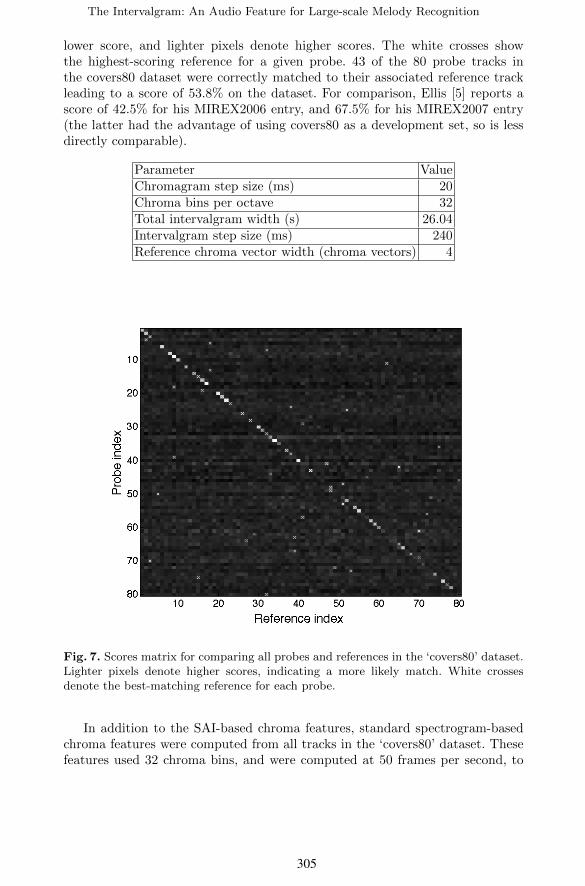
Intervalgrams were computed from the SAI using the parameters outlined inTable 1, and scoring of probe-reference pairs was performed using the dynamicprogramming approach described above. Figure 7 shows the matrix of scoresfor the comparison of each probe with all reference tracks. Darker pixels denote
304
The Intervalgram: An Audio Feature for Large-scale Melody Recognition 11
lower score, and lighter pixels denote higher scores. The white crosses showthe highest-scoring reference for a given probe. 43 of the 80 probe tracks inthe covers80 dataset were correctly matched to their associated reference trackleading to a score of 53.8% on the dataset. For comparison, Ellis [5] reports ascore of 42.5% for his MIREX2006 entry, and 67.5% for his MIREX2007 entry(the latter had the advantage of using covers80 as a development set, so is lessdirectly comparable).
Parameter ValueChromagram step size (ms) 20Chroma bins per octave 32Total intervalgram width (s) 26.04Intervalgram step size (ms) 240Reference chroma vector width (chroma vectors) 4
Fig. 7. Scores matrix for comparing all probes and references in the ‘covers80’ dataset.Lighter pixels denote higher scores, indicating a more likely match. White crossesdenote the best-matching reference for each probe.
In addition to the SAI-based chroma features, standard spectrogram-basedchroma features were computed from all tracks in the ‘covers80’ dataset. Thesefeatures used 32 chroma bins, and were computed at 50 frames per second, to
305
12 Thomas C. Walters, David A. Ross and Richard F. Lyon
provide a drop-in replacement for the SAI-based features. Intervalgrams werecomputed from these features using the parameters in Table 1.
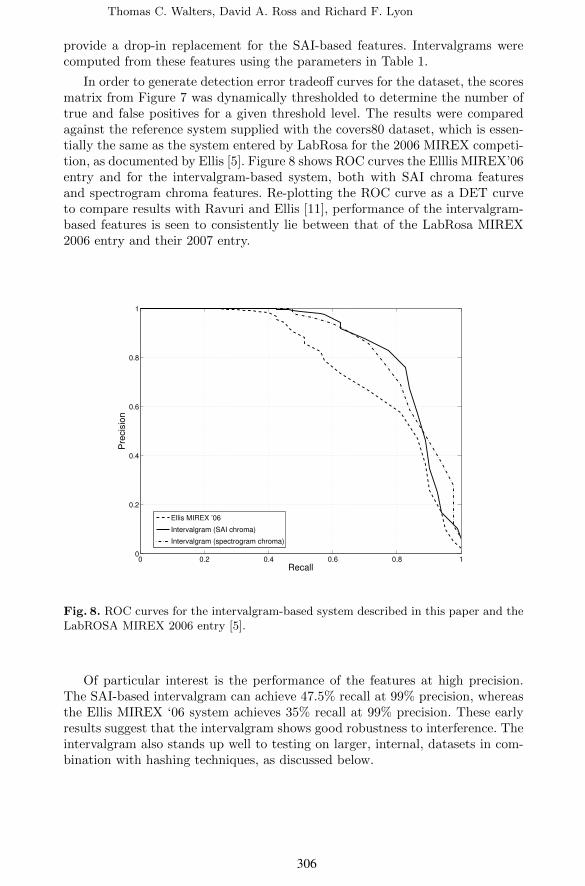
In order to generate detection error tradeoff curves for the dataset, the scoresmatrix from Figure 7 was dynamically thresholded to determine the number oftrue and false positives for a given threshold level. The results were comparedagainst the reference system supplied with the covers80 dataset, which is essen-tially the same as the system entered by LabRosa for the 2006 MIREX competi-tion, as documented by Ellis [5]. Figure 8 shows ROC curves the Elllis MIREX’06entry and for the intervalgram-based system, both with SAI chroma featuresand spectrogram chroma features. Re-plotting the ROC curve as a DET curveto compare results with Ravuri and Ellis [11], performance of the intervalgram-based features is seen to consistently lie between that of the LabRosa MIREX2006 entry and their 2007 entry.
0 0.2 0.4 0.6 0.8 10
0.2
0.4
0.6
0.8
1
Recall
Pre
cis
ion
Ellis MIREX ’06
Intervalgram (SAI chroma)
Intervalgram (spectrogram chroma)
Fig. 8. ROC curves for the intervalgram-based system described in this paper and theLabROSA MIREX 2006 entry [5].
Of particular interest is the performance of the features at high precision.The SAI-based intervalgram can achieve 47.5% recall at 99% precision, whereasthe Ellis MIREX ‘06 system achieves 35% recall at 99% precision. These earlyresults suggest that the intervalgram shows good robustness to interference. Theintervalgram also stands up well to testing on larger, internal, datasets in com-bination with hashing techniques, as discussed below.
306
The Intervalgram: An Audio Feature for Large-scale Melody Recognition 13
4 Discussion
We have introduced a new chroma-based feature for summarizing musical melodies,which does not require either beat tracking or exhaustive search for transpositioninvariance, and have demonstrated a good baseline performance on a standarddataset. However, we developed the intervalgram representation to be a suitablecandidate for large-scale, highly robust cover-song detection. In the followingsections we discuss some approaches to the application of the intervalgram insuch a system.
4.1 SAI and Spectrogram-based Chroma
There was no great difference in performance between intervalgrams gener-ated using the temporal profile of the SAI and intervalgrams generated usinga spectrogram-based chroma feature. However, there are some small differencesin different regions of the ROC curve. Recall at high precision is very similarfor both forms of chroma features; as precision is allowed to fall, the SAI-basedfeatures lead to slightly higher recall for a given precision, but the trend is re-versed in the lower-precision end of the curve. This may suggest that there wouldbe a benefit in combining both SAI-based and spectrogram-based chroma into afeature which makes use of both. There is some evidence to suggest that the tem-poral profile of the SAI may be robust to stimuli in which the pitch is ambiguous[6], but this result may be less relevant in the context of music.
4.2 Scaling Up
In order to perform melody recognition on a large database of content, it isnecessary to find a cheaper and more efficient way of matching a probe songagainst many references. The brute-force approach of computing a full distancemap for the probe against every possible reference scales as the product of thenumber of probes and the number of references; thus a system which makesit cheap to find a set of matching segments in all references for a given probewould be of great value. Bertin-Mahieux and Ellis [2] presented a system us-ing hashed chroma landmarks as keys for a linear-time database lookup. Theirsystem showed promise, and demonstrated a possible approach to large-scalecover-song detection but the reported performance numbers would not makefor a practically-viable system. While landmark or ‘interest point’ detection hasbeen extremely successful in the context of exact audio matching in noise [15]its effectiveness in such applications is largely due to the absolute invariance inthe location of strong peaks in the spectrogram. For cover version identificationthe variability in performances, both in timing and in pitch, means that de-scriptors summarizing small constellations of interest points will necessarily beless discriminative than descriptors summarizing more complete features over along time span. With this in mind, we now explore some options for generatingcompact hashes of full intervalgrams for indexing and retrieval purposes.
307
14 Thomas C. Walters, David A. Ross and Richard F. Lyon
Hashing of the Intervalgram Using the process outlined above, 32×32 pixelintervalgrams are generated from a signal at the rate of one per 240ms. Toeffectively find alternative performances of a melody in a large-scale database, itmust be possible to do efficient lookup to find sequences of potentially potentialmatching intervalgrams. The use of locality-sensitive-hashing (LSH) techniquesover long-timescale features for music information retrieval has previously beeninvestigated and found to be useul for large datasets [3]. Various techniquesbased on locality-sensitive hashing (LSH) may be employed to generate a set ofcompact hashes which summarize the intervalgram, and which can be used askeys to look up likely matches in a key-value lookup system.
An effective technique for summarizing small images with a combination ofwavelet analysis and Min-Hash was presented by Baluja and Covell [1] in thecontext of hashing spectrograms for exact audio matching. A similar system ofwavelet decomposition was previously applied to image analysis [7]. The systemdescribed in [1] has been adapted to produce a compact locality-sensitive hashof the intervalgram. The 32×32 intervalgram is decomposed into a set of waveletcoefficients using a Haar kernel, and the top t wavelet coefficients with the highestmagnitude values retained. If the value t is chosen to be much smaller thanthe total number of pixels in the image, the most prominent structure of theintervalgram will be maintained, with a loss of some detail.
Compared to exact-match audio identification, this system is much morechallenging, since the individual hash codes are noisier and less discriminative.The indexing stage necessarily has many false hits when it is tuned to get anyreasonable recall, so there are still many (at least thousands out of a referenceset of millions) of potential matches to score in detail before deciding whetherthere is a match.
5 Conclusions
The intervalgram is a pitch-shift-independent feature for melody-recognitiontasks. Like other features for melody recognition, it is based on chroma fea-tures, but in our work the chroma representation is derived from the temporalprofile of a stabilized auditory image, rather than from a spectrogram. To achievepitch-shift invariance, individual intervalgrams are shifted relative to a referencechroma vector, but no global shift invariance is used. Finally, to achieve somedegree of tempo-invariance, variable-width time-offset bins are used to captureboth local and longer-term features.
In this study, the performance of the intervalgram was tested by using dynamic-programming techniques to find the cheapest path through similarity matricescomparing a cover song to all references in the ‘covers80’ dataset. Intervalgrams,followed by dynamic-programming alignment and scoring, gave a precision attop-1 of 53.8%. This performance value, and the associated ROC curve, lies be-tween the performance of the Ellis 2006 and Ellis 2007 MIREX entries (the latterof which was developed using the covers80 dataset).
308
The Intervalgram: An Audio Feature for Large-scale Melody Recognition 15
The intervalgram has shown itself to be a promising feature for melody recog-nition. It has good performance characteristics for high-precision matching witha low false-positive rate. Furthermore the algorithm is fairly simple and fully‘feed-forward’, with no need for beat tracking or computation of global statistics.This means that it can be run in a streaming fashion, requiring only bufferingof enough data to produce the first intervalgram before a stream of interval-grams can be generated. This feature could make it suitable for applications likequery-by-example in which absolute latency is an important factor.
We believe that the intervalgram representation would also lend itself well tolarge scale application when coupled with locality-sensitive hashing techniquessuch as wavelet-decomposition followed by minhash. The high precision wouldallow for querying of a large database with a low false-positive rate, and indeedpreliminary experiments show some promise in this area. We look forward totuning the performance of the intervalgram representation on larger researchdatasets.
References
1. S. Baluja and M. Covell. Waveprint: Efficient wavelet-based audio fingerprinting.Pattern recognition, 41(11):3467–3480, 2008.
2. T. Bertin-Mahieux and D. Ellis. Large-scale cover song recognition using hashedchroma landmarks. In Proceedings of the International Symposium on Music In-formation Retrieval (ISMIR), 2011.
3. M. Casey, C. Rhodes, and M. Slaney. Analysis of minimum distances in high-dimensional musical spaces. IEEE Transactions on Audio, Speech, and LanguageProcessing, 16(5):1015–1028, 2008.
4. D. Ellis, The ‘covers80’ cover song data set.http://labrosa.ee.columbia.edu/projects/coversongs/covers80/.
5. D. Ellis and C. Cotton. The 2007 LabROSA cover song detection system. MIREX2007 Audio Cover Song Evaluation system description, 2007.
6. D. Ives and R. Patterson. Pitch strength decreases as f0 and harmonic resolutionincrease in complex tones composed exclusively of high harmonics. The Journal ofthe Acoustical Society of America, 123:2670, 2008.
7. C. Jacobs, A. Finkelstein, and D. Salesin. Fast multiresolution image querying. InProceedings of the 22nd annual conference on Computer graphics and interactivetechniques, pages 277–286. ACM, 1995.
8. R. Lyon. Cascades of two-pole-two-zero asymmetric resonators are good modelsof peripheral auditory function. Journal of the Acoustical Society of America,130(6):3893, 2011.
9. M. Marolt. A mid-level representation for melody-based retrieval in audio collec-tions. Multimedia, IEEE Transactions on, 10(8):1617–1625, 2008.
10. R. Patterson, K. Robinson, J. Holdsworth, D. McKeown, C. Zhang, and M. Aller-hand. Complex sounds and auditory images. In Auditory physiology and percep-tion, Proceedings of the 9th International Symposium on Hearing, pages 429–446.Pergamon, 1992.
11. S. Ravuri and D. Ellis. Cover song detection: from high scores to general classifi-cation. In Acoustics Speech and Signal Processing (ICASSP), 2010 IEEE Interna-tional Conference on, pages 65–68. IEEE, 2010.
309
16 Thomas C. Walters, David A. Ross and Richard F. Lyon
12. J. Serra Julia. Identification of versions of the same musical composition by pro-cessing audio descriptions. PhD thesis, Universitat Pompeu Fabra, 2011.
13. W. Tsai, H. Yu, and H. Wang. Using the similarity of main melodies to identifycover versions of popular songs for music document retrieval. Journal of Informa-tion Science and Engineering, 24(6):1669–1687, 2008.
14. T. Walters. Auditory-based processing of communication sounds. PhD thesis, Uni-versity of Cambridge, 2011.
15. A. Wang. An industrial strength audio search algorithm. In Proceedings of the In-ternational Symposium on Music Information Retrieval (ISMIR), volume 2, 2003.
16. C. Yang. Music database retrieval based on spectral similarity. In Proceedings ofthe International Symposium on Music Information Retrieval (ISMIR), 2001.
310