Embed Size (px)
Citation preview

Open Econ Rev (2008) 19:183–201DOI 10.1007/s11079-007-9024-x
RESEARCH ARTICLE
The Lack of International Consumption Risk Sharing:Can Inflation Differentials and Trading Costs HelpExplain the Puzzle?
Mathias Hoffmann
Published online: 18 May 2007© Springer Science + Business Media, LLC 2007
Abstract The bulk of evidence on the lack of international risk sharing is basedon regressions of idiosyncratic consumption growth on idiosyncratic outputgrowth. This paper argues that the results from such regressions obtained frominternational data are, however, not directly comparable to those based on re-gional data: the standard practice of running such regressions on internationaldata fails to account for persistent international differentials in consumerprices, whereas—implicitly—most of the literature based on regional datahas accounted for these differences. When risk sharing regressions are setup in conceptually the same way in international and regional data sets, theestimated coefficients are also very similar. To explore this result further, weadapt the variance decomposition of Asdrubali et al. (Q J Econ 111:1081–1110,1996) to allow for deviations from purchasing power parity across countries.While quantity (income and credit) flows are the dominant channel of risksharing among regions, relative consumption and output price (internal termsof trade) fluctuations account for the bulk of the deviation from the completemarkets outcome in international data. To the extent that persistent differ-ences in consumer prices are an indication of goods market segmentation, ourfindings provide empirical evidence for the proposition by Obstfeld and Rogoff(NBER Macroeconomics Annual 2000, 2000) that segmented international
This paper is part of the project B6: The International Allocation of Risk in the framework ofSFB 475 funded by the Deutsche Forschungsgemeinschaft. The UK Economic and SocialResearch Council funded early stages of the research that led to this paper under its‘Evolving Macroeconomy’ scheme (grant no. L138251037).
M. Hoffmann (B)University of Zurich, IEW, Zürichbergstrasse 14, CH-8032 Zurich, Switzerlande-mail: [email protected]: www.iew.uzh.ch/itf
M. HoffmannCESifo, Poschingerstr. 5, 81679 Munich, Germany

184 M. Hoffmann
goods markets rather than asset market incompleteness may account for the(apparent) lack of risk sharing between countries.
Keywords International consumption risk sharing · Capital flows ·Trading cost · New open economy macroeconomics · Home bias
JEL Classification F21 · F32 · F36 · E21
1 Introduction
Risk sharing between regions and nations has been the focus of much empiricalresearch over the last decade.1 The main conclusion that emerges from thisliterature is that regions within a country share a lot more consumption riskthan do countries.
Most of the evidence on international and interregional risk sharing is basedon panel regressions of real idiosyncratic consumption growth on other idio-syncratic variables, mostly national or regional output. The motivation behindsuch risk sharing regressions is that in a world with complete capital markets,countries and regions will insure completely against any idiosyncratic risk.If furthermore, trade in goods markets is frictionless so that prices equalizeacross countries and regions, then, ex post , there should not be any correlationbetween a country’s or region’s relative output and consumption. The size ofthe regression coefficient of idiosyncratic consumption on idiosyncratic outputcan therefore be interpreted as a measure of the deviation from the completemarkets outcome.
This paper argues that the results obtained from such regressions in inter-national data are not generally comparable to those based on regional data.The reason for this is that for most countries consumer price indexes arenot available at the regional level. Therefore, in regional data, the commonlyapplied procedure is to transform nominal into real quantities by deflating withthe country-wide CPI. This practice preserves fluctuations in the relative valueof consumption across regions. In this paper, we advocate this practice alsofor international data sets. Earlier studies that have examined risk sharing ininternational data have typically deflated the data with national (i.e. country-specific) CPIs. In this way, only fluctuations in the relative quantities but notin the relative value of consumption are preserved.
What may at first sight appear as a measurement issue is, in fact, animportant conceptual difference: in addition to quantity (i.e.: capital incomeand credit) flows, fluctuations in relative consumer prices may constitute aseparate channel of risk sharing. I add such a price channel to the popularvariance decomposition by Asdrubali et al. (1996). Whereas earlier versions
1Some prominent papers are Asdrubali et al. (1996), Sørensen and Yosha (1998), Hess and Shin(1998), Crucini (1999) and Mélitz and Zumer (1999).

The lack of international consumption risk sharing 185
of this decomposition2 have focused on the relative importance of capitalincome and credit flows for risk sharing, the version suggested here alsoallows to gauge the contribution of price fluctuations. In the framework of thisdecomposition, it is straightforward to give economic meaning to the differentpractices of deflating regional and international data: the procedure commonlyused on international data simply eliminates fluctuations in relative purchasingpower and therefore does not pick up their contribution to risk sharing. Sincefluctuations in relative prices are particularly important at the internationallevel where goods markets are relatively segmented, one may expect thatthe omission of this channel may have a particularly pronounced effect onestimates of risk sharing obtained from international data sets.
We find this conjecture confirmed in our empirical investigation, for whichwe use data from the Penn World tables for 22 industrialized countries from1973–2000. Our results show that once the price channel is accounted for ina comparable way, the coefficients estimated from risk sharing regressions aresimilar in regional and international data sets. Hence, conceptual differences inthe preparation of the data used in estimation seem to explain why most studiesfind very little risk sharing in international data and a lot in regional data.
Does this finding suggest that there is no lack of international risk sharing?To explore the anatomy of this result further, we compare our internationalresults to evidence obtained from regional data sets from Australia, Canada,Germany and Italy—countries for which consumer price data can be obtainedat a regional level. We find that regions within countries achieve most of theirrisk sharing through quantity (income and credit flows), very much as theearlier literature has documented. Also, quantity flows between countries aresmall, again in line with virtually all of the extant literature. In this sense thereis a clear lack of international consumption risk sharing. The reason why westill find a small coefficient when our version of the risk sharing regressionis performed on international data, is that international inflation differentialscovary strongly with the relative value of a country’s output. This channel, onthe other hand, is virtually absent in regional data, presumably because thecross-regional dispersion of consumer prices is low.
We interpret the degree of international variation in consumer price infla-tion as an indication of goods market segmentation or, loosely speaking, oftrading costs. This allows us to read the lack of international quantity—i.e.income and credit—flows in the light of a recent literature that emphasizesthe role of goods market segmentation in rationalizing some of the majoranomalies in international finance. In particular Obstfeld and Rogoff (2000)have argued that relatively small trading costs in goods markets can lead tohuge equity portfolio home biases and may therefore also explain the apparentlack of capital flows between countries. In the Obstfeld–Rogoff model thisoccurs even though financial markets are complete. While our results do notimply that either regional or international financial markets are complete, they
2See e.g. Becker and Hoffmann (2006), who examine the contribution of capital income and creditflows to risk sharing at different horizons.
186 M. Hoffmann
provide further empirical support for the view that goods market frictionsrather than financial market frictions can explain the lack of risk sharing at thecountry relative to the regional level: As emphasized by Obstfeld and Rogoff(2000), optimal risk sharing under goods market segmentation implies that inresponse to idiosyncratic output shocks, consumption growth is equated acrosscountries only to the extent that consumption price levels are equated. Ceterisparibus, larger international price dispersion means that smaller income andcredit flows are required to implement an allocation in which risk is sharedoptimally.3 The comparison between our results obtained from internationaldata on the one hand and regional data on the other suggest that largervariation in relative prices—as measured by international or interregional in-flation differentials—does indeed go in hand with smaller cross-border incomeand credit flows. Lane and Milesi-Ferretti (2004) emphasize that countries’international asset portfolio weights are highly correlated with their tradeweights. The results here may help explain this finding: if international tradeeliminates country-specific variation in consumer prices, then larger capitalflows may be required to share risk optimally.
Starting with Backus and Smith (1993), a number of studies have empha-sized that optimal risk sharing implies a high inverse relation between realexchange rates and relative consumption if purchasing power parity is violated.The tenor of these studies is that the link between real exchange rates andconsumption growth is tenuous at best. It would therefore seem surprising thatour approach reveals such an important role for relative prices in internationalrisk sharing. However, our results are perfectly in line with the observation thatreal exchange rates and relative consumption are weakly correlated and indeedwe corroborate this finding in our data set. As we argue, correlations betweenconsumption and real exchange rates may be low for a variety of reasons thatcould be unrelated to market incompleteness.4
This is why in this paper we prefer to build on the literature on risk sharingregressions in the spirit of Cochrane (1991), Mace (1991), Townsend (1994),Asdrubali et al. (1996), Crucini (1999) and others. Rather than to examinecorrelations between real exchange rates and consumption, we argue, that asomewhat more robust, reading of the conditions for optimal risk sharing isthat the relative value of marginal utility should not be systematically relatedto a country’s idiosyncratic risk.
The remainder of this paper is structured as follows: in Section 2 we takestock of the current practice of formulating risk sharing regressions in regionaland international data. We then propose how to adapt the international risk
3We have nothing to say about welfare implications. Clearly, it will be welfare enhancing if thereare no transport costs and if prices equalize, even though this may entail more flows of capital (andultimately shipment of goods). Our interest here is in the optimality (or otherwise) of risk sharinggiven the structure of goods markets, not in assessing the welfare implications of the respectivestructure.4Indeed, we find that the correlation between consumption and real exchange rates (i.e. inflationdifferentials) is very low even in regional data, even though there is wide agreement in theliterature that there is quite a lot of risk sharing at the regional level.

The lack of international consumption risk sharing 187
sharing regression so that it can be compared to the findings from regional dataand we highlight the role of international price dynamics for this adaptation.In Section 3, we modify the variance decomposition of Asdrubali et al. (1996)to take account of both a price channel and a quantity channel of internationalrisk sharing. In Section 4, we present our data set along with our empiricalresults. Section 5 discusses and concludes.
2 Risk sharing regressions
The focus of this paper is on panel regressions of the form
� log
[Ck
t
C∗t
]= βu� log
[Yk
t
Y∗t
]+ εk
t (1)
where C and Y are measures of real per capita consumption and output,respectively, k is the country or region index and the asterisk denotes thepopulation-weighted rest of the world or country average.
Regressions such as Eq. 1 were first suggested by Mace (1991) and Cochrane(1991) as tests of financial market completeness: in complete financial markets,idiosyncratic consumption growth should be independent of idiosyncraticrisk and therefore, in particular of idiosyncratic fluctuations in a country’sor region’s output. While this intuition is exactly true only under specialassumptions (such as power utility and additive separability in consumptionand leisure), it has proven sufficiently powerful to spark a large and influentialliterature that has generated important insights into the structure of inter-national and interregional risk sharing. In particular, Asdrubali et al. (1996),Sørensen and Yosha (1998) and others have argued very convincingly that thecoefficient βu—typically between zero and one in the data—is a measure ofthe deviation from the complete markets outcome; it indicates how much of
the idiosyncratic risk represented by fluctuations in � log[
Ykt
Y∗t
]is not shared
but spills over into fluctuations in relative consumption.In international data, estimates of βu are generally much higher than in
regional data. This stylized fact documents a lack of international risk sharing.The fact that βu is significantly bigger than zero and often close to unityamounts to a restatement of the famous international consumption correlationpuzzle first identified by Backus et al. (1992). But the correlation-basedformulation of the puzzle also encounters the so-called quantity anomaly:international consumption correlations are lower than the correlations inthe underlying risks, i.e. in output growth rates. This would suggest thatcountries actually use financial markets to de-stabilize consumption, a veryimplausible proposition. Even under complete markets, countries or regionsmay experience idiosyncratic demand or preference shocks (see e.g. Stockmanand Tesar 1995) and consumption is often measured with error. In thesecases, consumption growth may be imperfectly correlated across regions butin complete markets it should still be uncorrelated with idiosyncratic country

188 M. Hoffmann
risk characteristics, notably relative output. Presumably for these reasons,regressions such as Eq. 1 provide a standard metric of risk sharing used inmany empirical studies.
2.1 Common vs. country-specific consumption deflators
As I am going to argue in this sub-section, the coefficients obtained fromstudies based on international data are not generally directly comparableto those based on regional data because the real consumption and outputmeasures C and Y used in both types of studies are conceptually different.
For most countries, notably the U.S., for which we have the most evidencein relation to interregional risk sharing, consumer prices are not available atthe regional (say, federal state) level. For this reason, most researchers use thecountry-wide CPI to deflate both GDP and consumption.5 Hence, the regionalconsumption and output measures are
Ckt = Ck
t CPIkt /CPI∗
t and Ykt = Pk
t Ykt /CPI∗
t
where Ckt is the actual quantity of consumption in region k, CPI denotes the
consumer price index and Pk is the regional output deflator.The risk sharing regression is formulated in terms of relative growth rates,
so that with C∗t = C∗
t and Y∗t = P∗
t Y∗t /CPI∗
t the risk sharing regression (1)effectively becomes
� log
[CPIk
t Ckt
CPI∗t C∗
t
]= βreg
u � log
[Pk
t Ykt
P∗t Y∗
t
]+ ε
regkt (2)
Hence, in regional data, the risk sharing regression effectively amounts torunning regressions of region-specific nominal consumption growth on therelative nominal growth rates of output.
Conversely, most studies based on international data deflate both consump-tion and output with the country-specific CPI, so that Ck
t = Ckt and Yk
t =Pk
t Ykt /CPIk
t so that the regression run on international data is
� log
[Ck
t
C∗t
]= β int
u � log
[Pk
t Ykt /CPIk
t
P∗t Y∗
t /CPI∗t
]+ εint
kt (3)
Clearly, these are not the same regressions. I wish to explore to whatextent the difference in the setup of these regressions affects the comparisonbetween international and regional measures of risk sharing. Using data froma number of countries for which regional CPIs are available, I therefore runthe international regression (3) on regional data. Conversely, I will run theregional regression (2) on an international data set.
This exercise is interesting, because the difference between the two regres-sions is conceptually important: βreg tells us how the value of consumption
5E.g. Asdrubali et al. (1996), Sørensen and Yosha (1998), Crucini (1999) and Mélitz and Zumer(1999), Becker and Hoffmann (2006). And presumably, this list is far from complete.

The lack of international consumption risk sharing 189
growth relative to the rest of the country reacts to shocks in the value ofregional output. β int
u tells us how relative consumption quantities react toshocks in the quantity of consumption a country can buy for its output.6 Thedifference between β int and β
regu must tell us something about the role of
interregional and international price dispersion for risk sharing.As I will show, running the international regression on regional data does
not make much of a difference for our estimate of βu: in regional data,fluctuations in relative consumer prices are relatively small so that the re-gression outcome is not strongly affected. There is, however, a huge cross-sectional dispersion in consumer price inflation across countries. I interpretthis dispersion as an indication of goods market segmentation or, looselyspeaking, of trading costs. And, as I will show, fluctuations in relative consumerprices correlate negatively with relative national output quantities. Therefore,if regression (2) is run on international data, I find a coefficient that is almost aslow as if it is run on regional data. To the extent that international dispersionin inflation rates has something to say about the integration of goods marketsthis suggests that trading costs may help explain why so little risk sharing isgenerally found in international data.
In adapting Eq. 2 to international data, we face the problem of also makingnational output measures comparable across countries. In regional data, acommon set of sectoral price indexes is used to construct the regional outputdeflator Pk. For example, this is the procedure followed by the U.S. Bureauof Economic Analysis.7 Hence, the price used to value e.g. oil production isthe same across all U.S. states. Since oil accounts for a much larger shareof output in some U.S. states, such as e.g. Alaska and Texas, fluctuationsin the price of oil will still lead to idiosyncratic fluctuations in the value ofthese states’ outputs. Therefore, fluctuations in Pk/P∗ by construction cannotreflect deviations from the law of one price but only differences in the sectoralcomposition of output.
In adapting the regional risk sharing regression to international data, wetherefore use a common set of international prices to compare the value ofoutput across countries. At the international level, such a set of prices forthe components of GDP is implicit in the data compiled in the Penn WorldTables (PWT). The scope of the PWT is exactly to facilitate such internationalcomparisons of national account data like the one we are conducting here. Tothis end, the PWT uses a common set of dollar prices to value the componentsof a country’s output basket. This approach is akin to the construction of GDPprice indexes at the state level. Hence, the risk sharing regression we estimatein international data has the form
� log
[CPIk
t
CPI∗t
]+ � log
[Ck
t
C∗t
]= βu
[� log
[P$
P∗$
]+ � log
[Yk
t
Y∗t
]]+ εkt (4)
6The term Pkt /CPIk
t , the internal terms of trade, gives the value of a country’s output in terms ofits consumption bundle.7See their windows help file at http://www.bea.gov/bea/regional/gsp/OnlineHelp.chm

190 M. Hoffmann
where P$/P∗$ denotes the (relative) price level of GDP, in international (i.e.
PPP) prices. We note again that even though home and foreign GDP areevaluated with the same set of prices, the aggregate GDP price levels do nothave to equalize since domestic and rest-of-the-world GDP will generally becomposed of very different outputs. It is therefore straightforward to interpretP$/P∗
$ as a (PPP adjusted) measure of the terms of trade.We note here that all of the above specifications abstract from the role of
nominal exchange rate fluctuations. The main reason to do so is that all of theregression-based literature on international risk sharing has conditioned onfixed nominal exchange rates. Since our aim here is to understand the anatomyof the results that earlier studies have obtained from regional and internationaldata, it is natural that we keep with the approach chosen in these studies.8
Furthermore, it is well known that exchange rates appear largely disconnectedfrom any plausible macroeconomic fundamentals and this disconnect is alsolikely to blur the consumption-real exchange rate relation highlighted byBackus and Smith (1993). Therefore, to explore the role of nominal exchangerates in risk sharing, one may need a complete model of currency pricingwhich is clearly beyond the scope of this paper. Finally, nominal exchangerate movements can only matter in international data. So in comparing resultsfrom risk sharing regressions in regional and international data, we feel it isinstructive to start by abstracting from nominal exchange rate risk.
Before moving on to the next section, we introduce some notational simpli-fication: all risk sharing regressions are formulated in idiosyncratic terms, i.e.in relation to a ’rest of the world’ aggregate. This just reflects the fact that onlyidiosyncratic risk can be insured. We will therefore abbreviate the logarithmof relative levels with the lower case letter, so that y = log Yk
Y∗ , c = log Ck
C∗ . Itwill also prove convenient to abbreviate with gdp the logarithm of the relativevalue of output, i.e. gdp = log P$Yk
P∗$Y∗ .
3 Prices vs. quantities: channels of risk sharing
In a sequence of seminal papers, Asdrubali et al. (1996)9 and Sørensenand Yosha (1998) also suggested a variance decomposition of relative GDPgrowth that allows to examine, to which extent capital income and credit flowscontribute to consumption risk sharing. They find that at an international level,capital income flows virtually do not contribute at all to consumption insurancewhereas borrowing and lending ex-post smooths about one quarter of thevariability induced by idiosyncratic output growth. Their setup does, however,
8In virtually all studies, the nominal exchange rate is kept fixed by transferring quantities in a baseyear into a common currency denomination using base year nominal exchange rates. Clearly, sinceall regressions are in first differences, the choice of this exchange rate is of no practical relevance.9For convenience, we will often refer to this paper as ‘ASY.’

The lack of international consumption risk sharing 191
not explicitly consider relative price adjustment as a mechanism of risk sharing.We now propose a version of the ASY-decomposition that allows to examineto what extent relative consumer price variability affects international risksharing.
To this end, we write
P$Y = YINC
× INCC
× P$
CPI× CPI × C
where the new symbol INC denotes national income and will usually bemeasured by GNP. We take logarithms and apply the variance operator onboth sides. Using the notational convention introduced at the end of the lastsection, we can write
var(�gdp) = cov(�y − �inc, �gdp)
+ cov(�inc − �c, �gdp)
+ cov(�p$ − �cpi, �gdp)
+ cov(�cpi + �c, �gdp)
Dividing through by var(�gdp) we get
1 = βinc + βcons + βprice + βu
where
βinc = cov(�y − �inc, �gdp)
var(�gdp)
βcons = cov(�inc − �c, �gdp)
var(�gdp)
βprice = cov(�p$ − �cpi, �gdp)
var(�gdp)
βu = cov(�cpi + �c, �gdp)
var(�gdp)
Since the wedge between output and income reflects cross-border flowsof (capital or dividend) income, βinc measures risk sharing through cap-ital (i.e. equity) markets. In the same mould, βc measures consumptionsmoothing through saving or dissaving in credit markets whereas βu reflectsthe unsmoothed component of risk. The interpretation of the coefficientsβinc, βcons and also βu is therefore quite analogus to that suggested by

192 M. Hoffmann
ASY (1996) in their version of the variance decomposition of output.10 Werefer to the sum of βinc and βcons as the quantity channel since it measures howquantity flows in the form of credit or income streams help stabilize relativeconsumption. We abbreviate the contribution of the quantity channel withβq = cov(�y − �c, �gdp)/var(�gdp).
The new channel we introduce is the price channel and its contribution isgiven by βprice. This coefficient measures to what extent international goodsmarket segmentation and hence the possibility of consumer prices to differacross regions can make quantity flows unnecessary for the optimal allocationof risk. The main mechanism we mean to capture with βprice is prominentlyhighlighted by Obstfeld and Rogoff (2000): if consumer prices fall in responseto a positive output shock, consumers will take advantage of low prices toincrease their consumption. This will induce a negative comovement between(relative) consumption and (relative) output. The quantity-based risk sharingregression will register this comovement as a failure of financial markets toprovide consumption insurance, even though it may just reflect an optimalresponse to idiosyncratic price fluctuations.
4 Empirical implementation
4.1 Results from international data
The source of our international data are the Penn World Tables of which weuse release 6.1. (PWT 6.1.). Besides data from national accounts, the PWT alsocontain a set of deflators that have been constructed using a set of commoninternational prices. This allows us to obtain an internationally comparablemeasure of the value of a country’s output, i.e. gdp = p$ + y.
The PWT expresses all data in per capita terms. We generate the Rest-of-the-world (RoW) aggregate as the population-weighted mean. We constructmeasures of world-wide (RoW) GDP components using population weightedaverages, where the population data is also from the PWT. Our analysis coversa panel of 22 industrialized countries over the period 1973–2000. Virtually allof the countries in the panel are OECD members and we sometimes refer tothem under this label. Specifically, the countries in our cross-section are:
1. Canada, 2. the United States, 3. Japan, 4. Austria, 5. Belgium,6. Denmark, 7. Finland, 8. France, 9. Germany (West), 10. Greece,11. Ireland, 12. Italy, 13. Luxemburg, 14. Netherlands, 15. Norway,16. Portugal, 17. Spain, 18. Sweden, 19. Switzerland, 20. United Kingdom,21. Australia, 22. New Zealand.
10We note, however, that they are not analytically the same: in ASY and Sørensen and Yosha(1998), the variable with respect to which income and consumption are smoothed is � log Y, in oursetup it is � log
[P$Y
]. We empirically explore the importance of this difference in Section 4.4.

The lack of international consumption risk sharing 193
Table 1 Price adjusted and quantity based risk sharing regressions
Price adjusted Quantity based
Coefficient estimate 0.20 (2.48) 0.68 (8.37)
The price adjusted regression is �cpi + �c = βu �gdp + u the quantity-based regression is�c = βu�y + v. Panel OLS estimates with country and time-specific fixed effects. Robust t−statistics based on Newey and West (1987) in parentheses
We start our empirical analysis by estimating our adapted version of theregional risk sharing regression (4) on international data. We then comparethe outcomes to that obtained from the standard international risk sharingregression (3).11 We take account of country specific fixed effects by removingthe mean from each country-time series. By expressing all variables in growthrates relative to the rest of the world, we also account for time-specific fixedeffects. We then estimate the risk sharing regressions by means of panel OLS.Throughout the paper, we report heteroskedasticity consistent standard errorsbased on Newey and West (1987).
In Table 1, the price-adjusted version of the risk sharing regression revealsa lot more risk sharing than the purely quantity based specification: thecoefficient on the price adjusted equation is 0.20, whereas the coefficient ofquantity-based regression is 0.68. The latter is completely in line with whatis typically found in risk sharing regressions based on international data andsuggests that only about a quarter to a third of all idiosyncratic country risk issmoothed or insured (e.g. Sørensen and Yosha 1998; Crucini 1999).
The price-adjusted risk sharing regression, on the other hand, reveals thattaking account of differences in consumer prices and correcting for differentprice levels of GDP matters substantially for the amount of risk that is foundto be shared. Our estimate of 0.20 is rather in the order of magnitude of thecoefficient estimated from risk sharing regressions based on US state-level data(Asdrubali et al. 1996; Crucini 1999; Mélitz and Zumer 1999).
In the following subsections we first attempt to identify what the channelsof risk sharing are in the price adjusted setup and what the sources ofthis dramatic drop in the international risk sharing coefficient are. We thencompare these findings to an implementation of the international, quantity-based regression (3) on regional data.
4.2 Prices vs. quantities?
Through which channels is the allocation of risk achieved once we take accountof both relative price fluctuations and quantity flows? The variant of the ASY
11We will also refer to this regression as the quantity-based regression since it does not takeaccount of relative consumer price variability. Furthermore, since for most countries the nationalGDP price deflator is highly correlated with CPI, regression (3) also the regressor reflects whatare virtually pure quantities.

194 M. Hoffmann
Table 2 Channels of risk sharing
Channel Coefficient estimate
Price adjusted Quantity based
Quantity βinc 0.05 (1.52) 0.04 (1.19)βcons 0.27 (4.73) 0.29 (3.94)
Price βprice 0.48 (7.89) –
The price adjusted regressions are regressions of �y − �inc (βinc),�inc − �c (βcons) and�p$ − �cpi (βprice)on �gdp. The quantity adjusted regressions are the same variables (except�p$ − �cpi)regressed on �y. On estimation details see Table 1
decomposition that we suggested in the previous section can shed light onthis issue. In Table 2 we report the estimates of the β-coefficients. Half ofall idiosyncratic risk is buffered by relative movements in the terms of tradeand real exchange rates, our point estimate of βprice is 0.48. The two quantity-flow channels taken together account for only 30%. This suggests that relativedynamics in the internal terms of trade can account for most of the allocationof idiosyncratic risk, much more than do international capital flows.
For comparison, we also estimate a purely quantity-based decompositionof relative GDP growth, i.e. a version of the risk sharing regression where�y − �inc and �inc − �c are regressed on �y instead of �gdp. This is theregressions that is typically run on international data, when the data aredeflated with the country-specific CPI. The second column of Table 2 reportsthe outcome of this exercise. Even though the regressor is quite different inthe price-adjusted regressions, the point estimates for the βs associated withincome and consumption smoothing respectively, are very similar in both theprice adjusted and the pure quantity-based decompositions.
Hence, accounting for deviations from PPP and for terms of trade fluctua-tions does not alter our conclusions as to what extent international quantityflows contribute to international risk sharing. But it does provide a way tounderstand why international risk sharing generally appears so low: consumerand output prices covary systematically with idiosyncratic risk in OECDcountries. This effect goes a long way towards explaining why most studieswould find more risk sharing in regional than in international data.
4.3 International vs. regional evidence from risk sharing regressions
We now study the relative importance of price and quantity dynamics forrisk sharing by looking at regional data from a small group of countries, forwhich both real and nominal consumption and GDP data are available at theregional level. The countries and the sample of years for which we have dataare: Australia (1990–2002), Canada (1980–2000), Italy (1960–96) and Germany(1996–2002). We provide details on the regional data in the Appendix.
Only for Canada and Germany we have income measures at the regionallevel. Since the scope of our analysis is not to assess the relative importance

The lack of international consumption risk sharing 195
Table 3 Relative role of price and quantity channels in regional data
Country Quantity flows Price Unsmoothed
βq βprice βu
Australia 0.43 (4.93) 0.50 (5.34) 0.70 (0.78)Canada 0.64 (5.80) 0.16 (2.02) 0.18 (2.93)Germany 0.58 (6.14) 0.01 (0.19) 0.42 (3.55)Italy 0.77 (16.83) 0.07 (3.67) 0.11 (4.86)
See Table 1
of the two quantity channels we just identify the sum of βinc + βc = βq byregressing �y − �c on �gdp. Table 3 provides the estimates of βq and βprice
as well as of the unsmoothed part, βu, for the four countries.In as far as the size of the unsmoothed component βu is concerned, our
estimates provide a wholesale confirmation of those obtained by ASY andothers for U.S. data: roundabout three quarters of all idiosyncratic risk isshared among the regions of a country. While small relative to the standardinternational quantity regression, the non-insured component is generallysignificant.
As becomes apparent, the price channel contributes a lot less to risk sharingthan it does in international data. This may not appear too surprising sincepersistent difference in particular in consumer price inflation are a featurerather of international than of regional data. But it is noteworthy that the priceeffect, though small, is significant in all countries except Germany.12
These results confirm our previous conjecture: controlling for relative priceeffects in international data reveals a much smaller deviation from the com-plete markets outcome than is commonly found using what we call a quantitybased regression. Eventually, the allocation of risk is comparably efficient tothat in regional data. What is different are the channels of risk sharing at theregional and the international levels.
Our interpretation of these findings is that goods markets are more inte-grated among the regions of a country than among countries and thereforeconsumer price differentials are small. Equating the value of marginal utilitiesacross regions therefore virtually amounts to equating real marginal utilitieswhich in turn requires big quantity flows. On the other hand, optimal risksharing contracts between countries will take account of the fact that goodsmarkets are very segmented internationally. Lane and Milesi-Ferretti (2004)provide evidence that countries that trade a lot with each other also have
12For Australia, the data reveal relative roles of quantity and price channels that are comparableto what we have obtained from international data. While this is an interesting result, we note twothings: first, our sample for Australia is rather short. Second, to obtain measure of the regionalGDP deflator, we had to use an experimental volume chain index for real state-level GDP. TheAustralian Bureau of Statistics issues a note of caution regarding the use of this series. We wouldtherefore not overemphasize this particular result.

196 M. Hoffmann
larger cross-holdings of financial assets. One reason for this may be thattrade eliminates price differentials and therefore, consumption insurance canultimately only be achieved through a diversified portfolio of financial assets.13
Interestingly, some authors have also documented a quantity anomaly—a high comovement between relative consumption and output—in regionaldata. Hess and Shin (1998) find that regressions for US state-level incomeand consumption yield coefficients near unity, not unlike the quantity-basedrisk sharing regressions obtained from international data. Del Negro (2002)confirms the results obtained by Hess and Shin and claims that the highlevels of risk sharing identified by Asdrubali et al. (1996) can be explainedby measurement error in the ASY data set.
Again, it seems that the principal difference between those studies thatfind a quantity anomaly and those that find high levels of risk sharing inregional data lies in the way they deflate the data. Asdrubali et al. (1996) andCrucini (1999) deflate gross state product (the state level equivalent of GDP)with the consumption price index whereas Hess and Shin deflate GSP withthe respective state GSP-deflator. Sørensen and Yosha (2007) argue that theright way to deflate quantities in risk sharing regressions is with the CPI: theendowment risk of an economy is the value of its GDP in terms of the country’sconsumption basket. This implies that nominal output should be deflated withthe CPI. The present paper has extended this logic in two important respects:first, we have argued that the data should be deflated with the area-wide(’common’) CPI so that fluctuations in relative consumption price levels arepreserved. Secondly, in international data it may also be important to useinternational prices to price output. We turn to a further discussion of thissecond point in the next subsection.
4.4 The role of international prices
In order to adapt the regional risk sharing regression, we have used a commonset of international GDP deflators. The primary reason for doing so wasthat this is also the practice how GDP is valued in regional data. There isalso a theoretical justification for following this approach: the maintained
13To the extent that trade eventually eliminates price differentials, we should expect the role of theprice channel in international data to decline in the long-run, quite in line with a growing literaturethat suggests that purchasing power parity may ultimately hold. Following Becker and Hoffmann(2006), I therefore examined the role of relative price variability at long horizons by performing thevariance decomposition suggested above in the levels of the variables instead of first differences.As discussed in this earlier paper, this regression constitutes a long-run panel relation in thesense of Phillips and Moon (1999). Hence, even though the individual time series may be non-stationary and may not necessarily be integrated, there is no risk of spurious regression. Theresults of this exercise provide strong support for the interpretation above: in the long-run relativeprice fluctuations play a much smaller role for risk sharing. In international data, I now estimateβprice = 0.05. Though still significant, (t-statistics: 2.37) this is much smaller than the correspondingβprice estimated from first differences in Table 2. Conversely, quantity flows keep up quite well inthe levels specification and the ex ante channel even gains in importance. (βinc = 0.10 (tstat = 2.54)and βcons = 0.23 (tstat = 4.59)). I thank an anonymous referee for suggesting this exercise.

The lack of international consumption risk sharing 197
Table 4 Role of international GDP price deflators
Channel Coefficient estimate
Quantity βinc 0.04 (1.20)βcons 0.29 (3.94)
Price βprice 0.32 (4.20)
Regressions of �y − �inc (βinc), �inc − �c (βcons) and −�cpi (βprice)on �y . On estimationdetails see Table 1
hypothesis in all of the risk sharing literature running regressions such as Eq. 1is that international flows can, in principle, generate an allocation in whichconsumption can be made completely independent of output. This implies thatoutput is perfectly tradeable. But in making this assumption, we should alsoimpose a common set of prices to value this output rather than national GDPprice deflators. On the other hand, consumption in country k has to take placein country k, so that the price level that is relevant for consumers in country kis not an international price but a local currency-price.14
One issue that may arise in this context is that the PWT’s set of internationalGDP prices could be subject to measurement error, plausibly on a largerscale than are regional output price levels. This could lead to attenuationbias since relative growth in the value of GDP is the regressor in all ourregressions. Secondly, it may be interesting to explore to what extent the choiceof GDP deflator contributes to the price channel: is it relative consumer pricevariability or are our findings induced by fluctuations in �p$?
We address these issues jointly by running all regressions of the extendedASY decomposition above with real rather than nominal relative GDP growthas regressor, i.e. we take out any effect that derives from valuing output atinternational prices by using �y instead of �gdp = �p$ + �y.15 Comparingthe results, given in Table 4, to the price adjusted regressions in Table 2 showsthat this has virtually no effect on the coefficients of the quantity channels,a strong indication that measurement error cannot be a problem since itshould lead to attenuation bias in both the regressions for the quantity andthe price channels. The coefficient on the price channel decreases somewhat.The obvious interpretation is that in the price regression in Table 2, theterm cov(�p$ − �cpi, �p$) is positive; fluctuations in �cpi not only shieldconsumption from fluctuations in output quantities but also from ups anddowns in the international terms of trade, �p$. This again suggests that ourresults reported above are largely driven by international variation in inflationdifferentials and only to a very limited extent by the choice of output pricedeflator.
14At a theoretical level, our approach could be justified by a model in which output consists ofintermediate inputs that are highly tradeable internationally. These outputs can then either betraded or be transformed into an imperfectly tradeable consumption good.15I thank George von Fuerstenberg for suggesting this course of analysis.
198 M. Hoffmann
4.5 The relation between real exchange rates and consumption
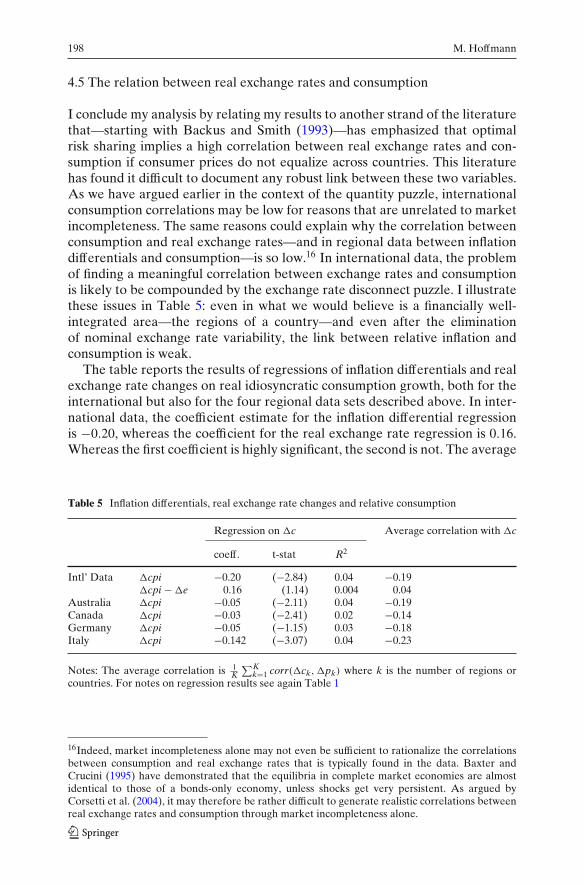
I conclude my analysis by relating my results to another strand of the literaturethat—starting with Backus and Smith (1993)—has emphasized that optimalrisk sharing implies a high correlation between real exchange rates and con-sumption if consumer prices do not equalize across countries. This literaturehas found it difficult to document any robust link between these two variables.As we have argued earlier in the context of the quantity puzzle, internationalconsumption correlations may be low for reasons that are unrelated to marketincompleteness. The same reasons could explain why the correlation betweenconsumption and real exchange rates—and in regional data between inflationdifferentials and consumption—is so low.16 In international data, the problemof finding a meaningful correlation between exchange rates and consumptionis likely to be compounded by the exchange rate disconnect puzzle. I illustratethese issues in Table 5: even in what we would believe is a financially well-integrated area—the regions of a country—and even after the eliminationof nominal exchange rate variability, the link between relative inflation andconsumption is weak.
The table reports the results of regressions of inflation differentials and realexchange rate changes on real idiosyncratic consumption growth, both for theinternational but also for the four regional data sets described above. In inter-national data, the coefficient estimate for the inflation differential regressionis −0.20, whereas the coefficient for the real exchange rate regression is 0.16.Whereas the first coefficient is highly significant, the second is not. The average
Table 5 Inflation differentials, real exchange rate changes and relative consumption
Regression on �c Average correlation with �c
coeff. t-stat R2
Intl’ Data �cpi −0.20 (−2.84) 0.04 −0.19�cpi − �e 0.16 (1.14) 0.004 0.04
Australia �cpi −0.05 (−2.11) 0.04 −0.19Canada �cpi −0.03 (−2.41) 0.02 −0.14Germany �cpi −0.05 (−1.15) 0.03 −0.18Italy �cpi −0.142 (−3.07) 0.04 −0.23
Notes: The average correlation is 1K
∑Kk=1 corr(�ck,�pk) where k is the number of regions or
countries. For notes on regression results see again Table 1
16Indeed, market incompleteness alone may not even be sufficient to rationalize the correlationsbetween consumption and real exchange rates that is typically found in the data. Baxter andCrucini (1995) have demonstrated that the equilibria in complete market economies are almostidentical to those of a bonds-only economy, unless shocks get very persistent. As argued byCorsetti et al. (2004), it may therefore be rather difficult to generate realistic correlations betweenreal exchange rates and consumption through market incompleteness alone.

The lack of international consumption risk sharing 199
(across countries) correlation of relative consumption growth and inflationdifferentials is −0.19, the average correlation between real exchange ratesand consumption virtually zero. Regressing inflation differentials on relativeconsumption growth in regional data, we obtain on average coefficients thatare even lower (in absolute value) than in international data. The averagecorrelation ranges from −0.14 to -0.23. The R2 statistics are low in allregressions.
Hence, there is virtually no relation between real exchange rates andconsumption at the international level, quite in keeping with results in Backusand Smith (1993) and elsewhere. But the results from regional data show thateven the elimination of nominal exchange rate variability in financially wellintegrated areas does not help to establish a particularly pronounced linkbetween the two variables. In fact, once we abstract from nominal exchangerate variability in international data, the link between inflation differentialsand consumption is no stronger in regional than in international data. Thesefindings seem to suggest that the Backus–Smith condition gives us an importanttheoretical puzzle to solve, but it also seems to teach us that the consumption-real exchange rate correlation may have relatively little to say about the extentof risk sharing.
5 Discussion and conclusion
A lot more risk is shared among the regions within a country than among coun-tries. This is the evidence from a well-established literature that has looked atrisk sharing regressions, i.e. regressions of idiosyncratic consumption growthon idiosyncratic output growth. This paper has argued that the way in whichthe data have been deflated in risk sharing regressions when applied to inter-national data is conceptually different from the way in which regional data aredeflated in such cases: whereas international data are deflated with country-specific CPIs, regional data have mostly been deflated with the country-wide(i.e. a common) CPI. The latter approach leaves relative price movementsintact, whereas the former eliminates them. But relative price movements areimportant from a risk sharing perspective and they may be particularly sobetween countries, where consumer price movements are known to be muchmore idiosyncratic than among the relatively well-integrated regions within acountry.
Our results suggest that accounting for this price channel can indeed explainwhy there is an apparent lack of risk sharing between countries. It seemsthat consumption allocations observed between countries are not as far awayfrom an optimal allocation (of risk) as is often thought. Movements in therelative price levels of consumption and output account for a lot of thedeparture from the full risk sharing allocation at the international level. Still,our results corroborate the findings by Sørensen and Yosha (1998), Crucini(1999), Becker and Hoffmann (2006) and others that quantity (income andcredit) flows between countries are small relative to quantity flows betweenregions. Certainly, in this respect there is a lack of international risk sharing.

200 M. Hoffmann
But our interpretation of these findings is that goods markets—rather thanfinancial markets—are a lot more segmented between countries than betweenregions. The more segmented goods markets are , the higher the dispersionof prices across regions or countries will generally be. And the more theprice of consumption can differ across countries, the less quantity flowsare needed to optimally share risk: if it is costly to ship goods, then otherthings equal, optimal financial contracts will minimize the shipment of capital(and therefore ultimately: goods) between countries. If prices do not equalizebetween countries or regions, then consumption should be relatively high whenprices are relatively low.
These findings are consistent with a recent strand of the theoretical lit-erature that emphasizes that frictions in international goods markets maybe the main ‘culprits’ behind the major quantity anomalies in internationalmacroeconomics (see notably Obstfeld and Rogoff (2000)). They can alsohelp understand the empirical regularity—recently highlighted by Lane andMilesi-Ferretti (2004)—that countries’ international asset portfolio weights arehighly correlated with their trade weights: among countries that have highlyintegrated goods markets and therefore quite similar consumption prices,capital income and credit flows will be needed to achieve an efficient allocationof consumption risk. Therefore, one may expect these countries to have moresubstantial cross-holdings of financial assets than pairs of countries for whichrelative price dynamics plays an important role in allocating idiosyncratic risk.
Acknowledgements I would like to thank Mike Artis, George von Fuerstenberg, and an anony-mous referee as well as seminar participants at the ESRC programme conference ‘Understandingthe Evolving Macroeconomy’ at University College, Oxford, at the Deutsche Bundesbank and atthe University of St. Andrews.
Appendix
Regional data sources
Australia: All data are from the Australian Bureau of Statistics and areavailable at the state level. The CPI data are the CPIs of the respective eightcapital cities. Consumption and output are obtained from the breakdown ofstate level GDP by expenditure and are mid-year estimates (June), rangingfrom 1990–2002. Income is real gross state domestic income, 1992–2002.
Canada: The data are from Statistics Canada. The data series are personalincome, retail sales, population, GDP and CPI by province and range from1981–2002.
Germany: All data are from the Statistisches Bundesamt, at the federal statelevel for all 16 federal states. The data range is 1990–2002.

The lack of international consumption risk sharing 201
Italy: We used the REGIO-IT data set from the Centro di Ricerche Eco-nomiche Nord Sud (CRENoS) at University of Cagliari. The data range from1960–1996.
References
Asdrubali P, Sørensen PE, Yosha O (1996) Channels of interstate risk sharing: United States1963–90. Q J Econ 111:1081–1110
Backus D, Kehoe P, Kydland F (1992) International real business cycles. J Polit Econ 100(4):745–775
Backus D, Smith G (1993) Consumption and real exchange rates in dynamic exchange economieswith nontraded goods. J Int Econ 35:297–316
Baxter M, Crucini MJ (1995) Business cycles and the asset structure of foreign trade. Int Econ Rev36(4):821–853
Becker SO, Hoffmann M (2006) Intra- and international risk sharing in the short run and the longrun. Eur Econ Rev 50(3):777–806
Cochrane JH (1991) A simple test of consumption insurance. J Polit Econ 99(5):957–976Cole J, Obstfeld M (1991) Commodity trade and international risk sharing: how much do financial
markets matter? J Monet Econ 28:3–24Corsetti G, Dedola L (2002) The macroeconomics of international price discrimination. ECB
Working Paper No. 176Corsetti G, Dedola L, Leduc S (2004) International risk-sharing and the transmission of produc-
tivity shocks. ECB Working Paper No. 308Crucini M (1999) On international and national dimensions of risk sharing. The Review of Eco-
nomics and Statistics, Febuary 1999, 81(1):73–84Del Negro M (2002) Asymmetric shocks among U.S. states. J Int Econ 56:273-297Engel C (1999) Accounting for U.S. real exchange rate changes. J Polit Econ 107:507–38Hess GD, Shin K (1998) Intranational business cycles in the United States. J Int Econ 44:289–313Kraay A, Ventura J (2002) Trade integration and risk sharing. Eur Econ Rev 46(6)Lane PD, Milesi-Ferretti GM (2004) International investment patterns. Mimeo, Trinity College
Dublin and International Monetary FundMace B (1991) Full insurance in the presence of aggregate uncertainty. J Polit Econ 99(5):928–956Mélitz J, Zumer F (1999) Smoothing of regional shocks within countries and lessons for EMU.
Carnegie-Rochester Conference series on Public Policy 51:149–188Newey W, West KD (1987) A simple, positive definite, heteroskedasticity and autocorrelation
consistent covariance matrix. Econometrica 55(3):703–708Obstfeld M, Rogoff K (2000) The six major puzzles in international macroeconomics: is there a
common cause? In: Bernanke K, Rogoff BS (eds) NBER Macroeconomics Annual 2000. MIT,Cambridge, MA
Phillips PCB, Moon HR (1999) Linear regression limit theory for nonstationary panel data.Econometrica 67(5):1057–1111
Rogoff KR (1996) The purchasing power parity puzzle. J Econ Lit 34:647–66Sørensen BE, Yosha O (1998) International risk sharing and European monetary unification. J Int
Econ 45:211–38Sørensen BE, Yosha O (2007) Producer prices versus consumer prices in the measurement of risk
sharing. Appl Econ Q 53(1):1–17Stockman AC, Tesar L (1995) Tastes and technology in a two-country model of the business cycle:
explaining international comovements. Am Econ Rev 85(1):168–185 (Mar)Townsend RM (1994) Risk and insurance in Village India. Econometrica 62:539–591


![[ĐT3] 2010 Monetary Policy, Inflation Expectations and The Price Puzzle (SVARs)](https://img.pdfslide.net/doc/110x75/577d1d551a28ab4e1e8c0f27/dt3-2010-monetary-policy-inflation-expectations-and-the-price-puzzle-svars.jpg)


