Embed Size (px)
Citation preview
Developed by The Economist Intelligence Unit
Published by Pearson
2014 REPORTEDUCATION AND SkILLS FOR LIFE
The Learning Curve 2014
Overview ForewordBy John Fallon, Chief executive of Pearson 01IntroductionBy Sir Michael Barber, Chief education advisor of Pearson 02Preface An explanation of the research context, objectives and its contributing experts
03Executive summary A summary of the report’s findings and its conclusions 04
Research and analysis Introduction: skills matter What better skills mean for economic performance 06New insights into effective skills education: harnessing all stakeholders The benefit of engaging all of society in education
08
Using and maintaining skills The promises and challenges of lifelong learning 11Lessons for developing countriesInternational experience and relevance to local conditions 15Conclusion Improvement is possible 18
Appendix 1 Global Index of Cognitive Skills and Educational Attainment – overall results 20
Appendix 2 Index methodology 22
01Pearson
ForewordTo solve a problem, you need to understand why it exists in the first place. An obvious notion, but one that cannot always be taken for granted.
Two years ago, Pearson asked The Economist Intelligence Unit to help gather, organise and interpret data about 50 of the world’s education systems. Our goal was to make a contribution to the global debate on learning outcomes, and help to open up what happens inside the ‘black box’ of education. What resulted is The Learning Curve – the only open living resource, where 2,500 data points on educational, economic and social indicators from the widest array of international educational indicators exist in one place.
The lessons were of course far from comprehensive – and since 2012, we’ve seen much important debate around the reliability and limitations of education rankings. But controversial or not, as this report shows, these education rankings have shone a light on education, helping engage all of society, which has produced better educational outcomes.
One of the most pervasive and endemic problems in education in just about every country is the lack of attention paid to skills provision.
Even in the richest countries, fewer than half of school students are career or college ready, with the result that higher education institutions and employers often find themselves re-skilling school leavers before they embark on the next phase of their lives.
In the world’s emerging economies, the demand for high quality technical education is just as pressing – as the BRICS and other developing nations strive to design and build their national infrastructures and create rewarding skilled jobs, current education systems often prove inadequate. Just as importantly, in an era where a ‘job for life’ is ancient history, older workers want and need continuous development too.
Yet the prize if we improve skills globally is huge. As this report points out, half of the economic growth in developed nations in the past ten years can be attributed to better skills.
For all these reasons, this year’s Learning Curve has taken skills for life as its theme, hoping to synthesise some emerging lessons with an agenda for change. It is, again, small data – a contribution to the global discussion on learning, not the whole answer. But – as educational debates shift from a focus on inputs to learning outcomes, we hope what we have discovered will drive others to take up the baton and do more work in this field.
We will continue to revise and update The Learning Curve as new international data comes to light – and at the same time we will continue to make it a living, open resource for all of our partners and anyone who wishes to draw on it for their own work.
The problems and challenges in education often seem intractable when faced by a single school, institution, or even a single government. But – with clarity of mission, and the right information about how great learning outcomes are achieved in other contexts, those problems can begin to seem a little more surmountable.
John Fallon Chief executive of Pearson
02 The Learning Curve 2014
Every education minister I meet is interested to know what he or she can learn from other countries and what needs to be done to improve performance. Of course, there are risks involved – neither PISA nor any of the recognised rankings measure everything that matters – but overall this is an important and positive development. Governments all around the world are under pressure to deliver improved learning outcomes because they are increasingly important ingredients of success. As a result, education ministers are on the search for evidence of what works more than they ever were before.
The Learning Curve is a contribution to the growing evidence base. By combining a number of different international rankings – including PISA and TIMSS as well as measures of adult skills – it provides the equivalent of a poll of polls. Furthermore, in a single database, it combines education input data with data on learning outcomes and data on social outcomes, such as employment and crime. All this data is openly available to researchers and others who want to make their own connections.
The second edition of The Learning Curve has been updated to include data, such as the recent PISA published in December 2013, that wasn’t available when the first edition was published in 2012.
As with any other approach to ranking it is not perfect. Some of the data has limitations and all of it needs to be approached with caution and judgement. The evidence can inform decision-making but it does not tell you what to do.
Even so, some conclusions from The Learning Curve can clearly be reached. One is the continuing rise of a number of Pacific Asian countries, such as Singapore and Hong kong, which combine effective education systems with a culture that prizes effort above inherited ‘smartness’. Another is the significant challenge of improving skills and knowledge in adulthood, for people
Introductionwho were let down by their school system. This is one focus of The Learning Curve report and will become increasingly important to countries around the world.
These and other lessons need to be debated and understood country by country so that each can learn, in a sophisticated way, how to do better. Even the highest-performing countries in The Learning Curve rankings are far from providing education that would ensure every single student is prepared for informed citizenship and 21st century employability.
That is why alongside The Learning Curve Index and report, Pearson is publishing a series of papers by the world’s leading education thinkers on how to improve teaching, learning and the performance of education systems. For example, A Rich Seam, by Michael Fullan and Maria Langworthy, published in January 2014, examines how pedagogy needs to change to unlock the motivation of both students and teachers and exploit the potential of modern technology.
Pearson itself is committed to efficacy – demonstrating the impact on learning outcomes of all its products and services – to ensure it too contributes to the improved performance of education systems that is required for the 21st century.
This updated version of The Learning Curve makes a further contribution to the knowledge base on which education leaders are drawing. It also makes possible extensive further research for those who want to extend their knowledge base.
The rankings and report are interesting and provoke debate but it is the ever-deeper knowledge base that will change the world.
Sir Michael Barber Chief education advisor of Pearson
03Pearson
This report, published by Pearson and written by The Economist Intelligence Unit, is part of a wide-ranging programme of quantitative and qualitative analysis, entitled The Learning Curve. It seeks to distil some of the major lessons on the links between education and skill development, retention and use.
Underlying this report are the findings from the analysis of a large body of internationally comparable education data – The Learning Curve Data Bank (LCDB). First compiled in 2012, the LCDB has been updated in early 2014 to include, among other indicators, the latest test results from:
› the Progress in International Reading Literacy Study (PIRLS)
› the Trends in International Mathematics and Science Study (TIMSS)
› the Programme for International Student Assessment (PISA)
› the initial output from the Programme for the International Assessment of Adult Competencies (PIAAC), which looks at cognitive skill levels across the population.
The Economist Intelligence Unit has also updated the associated Global Index of Cognitive Skills and Educational Attainment, which compares the education outputs of countries. Both the LCDB and the Index are accessible online. For more information on the data we have used, please refer to the methodology note on page 23.
The report also draws on extensive desk research, as well as in-depth interviews conducted with seven experts in education. The research was conducted entirely by The Economist Intelligence Unit, and the views expressed in the report do not necessarily reflect those of Pearson. The report was written by Dr Paul kielstra and edited by Sara Mosavi of The Economist Intelligence Unit.
Sincere thanks go to the following interviewees for sharing their insights on this topic:
Professor Maria Helena Guimarães de Castro Executive director, SEADE, São Paulo, Brazil
Eric Hanushek Paul and Jean Hanna Senior fellow, Stanford University
Professor Elizabeth Henning Director, Centre for Education Practice Research, University of Johannesburg
Dr Randall S Jones Head of the Japan/South korea Desk, OECD
Professor kjell Rubenson Department of Educational Studies, The University of British Columbia
Andreas Schleicher Deputy director for education, OECD
Jagmohan Singh Raju Director-general, National Literacy Mission Authority
Preface
04 The Learning Curve 2014
Executive summary
The value which education can provide through the inculcation of skills is enormous. Looking at economic outcomes alone, the OECD estimates that half of the economic growth in developed countries in the last decade came from better skills. How best to give those abilities to students is therefore a matter of great importance.This report considers what new lessons we have learned about how to inculcate skills in students; it examines how to maintain or expand skill levels among adults and explores the relevance of developed-world answers to these questions for emerging markets.
The main findings are as follows:
East Asian nations continue to outperform others, while Scandinavia shows mixed results
In the latest edition of the Global Index of Cognitive Skills and Educational Attainment, South korea tops the rankings, followed by Japan (2nd), Singapore (3rd) and Hong kong (4th). The success of these countries highlights the importance of having clear goalposts for the educational system and a strong culture of accountability among all stakeholders.
Scandinavian countries, strong performers in international education rankings since the 1990s, display mixed results. Finland, the 2012 Index leader, has fallen to 5th place, due to its performance in the 2012 PISA tests. Sweden has also declined (from 21st to 24th), fuelling the debate over the country’s free schools policy.
Denmark and Norway, however, have made gains (rising to 11th and 21st position, respectively).
Other notable improvers this year include Israel (up 12 places to 17th), which achieved major gains in PISA maths and science scores, Russia (up seven places to 13th) and Poland (up four places to 10th).
PISA results show the value of engaging all of society in education
Many of the messages about educational success from this year’s PISA reinforce those from earlier years. A wider range of survey questions accompanying the test, however, point to the importance of widespread engagement with the education system. Schools in which principals work with teachers on school management, and thus can function autonomously, tend to produce better results; parental expectations have a measurable impact on student motivation; and student interest has an effect on outcomes in a variety of ways. Effective education requires a broad range of actors, which points to the benefit of having a broadly supportive culture.
05Pearson
Better adult retention of skills depends on how often, and the environment within which, they are used
All adults lose skills over time, but better skill retention depends on the environment in which they are used. The OECD’s PIAAC study found that from around 25 years of age, skill levels tend to decline, even when accounting for the quality of initial education. Skills need to be used in order to be maintained; greater levels of personal or workplace reading and mathematical activity lead to a slower decline in skill scores over time. An adult learning infrastructure, possibly outside the formal education system, is likely to facilitate this.
Lifelong learning helps slow age-related skill decline mainly for those who are highly skilled already
It is difficult to determine the impact of adult education and training on individuals because those who engage in it are almost always already highly educated and skilled. Teaching adults, therefore, does very little to make up for a poor school system; a strong foundation
is important not just for inculcating skills in the first place, but also for maintaining them. Moreover, those with high skills continue to maintain them for a reason; adult education needs to find ways to convince low-skilled individuals of its value.
Before focusing on 21st century skills, developing countries must teach basic skills more effectively
Many, but not all, of the lessons of PISA and PIAAC for developed countries are useful for developing ones. The unique needs of developing countries can differ widely from those in the OECD. As a result, nations such as Brazil and South Africa may be able to derive useful insights about investing in teachers and the status of the teaching profession, as well as the importance of accountability. But the 21st century skills debate will have less resonance in systems that often have difficulty teaching more basic skills successfully.
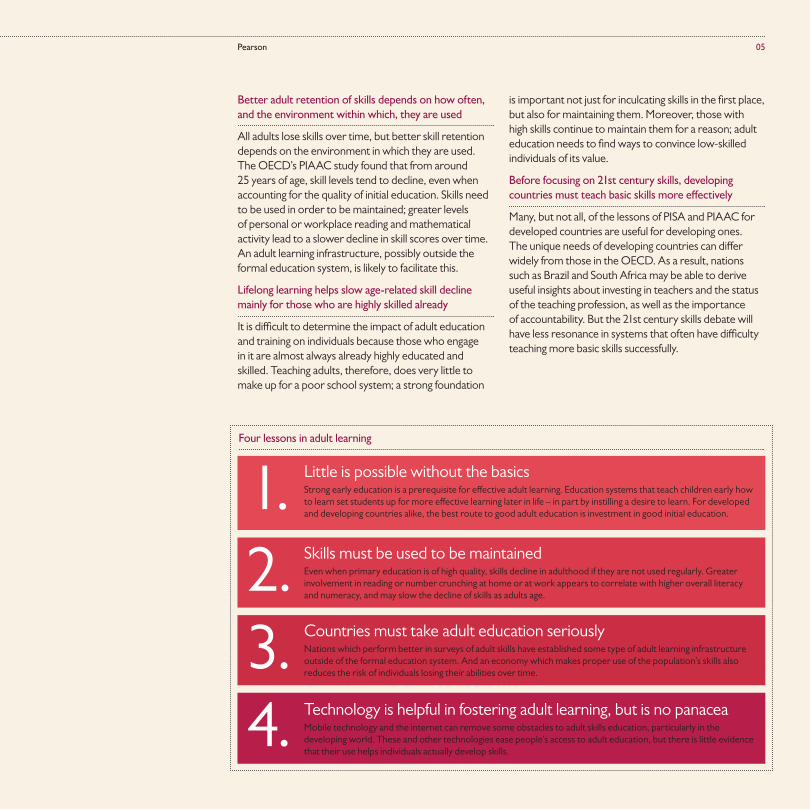
Four lessons in adult learning
Little is possible without the basics Strong early education is a prerequisite for effective adult learning. Education systems that teach children early how to learn set students up for more effective learning later in life – in part by instilling a desire to learn. For developed and developing countries alike, the best route to good adult education is investment in good initial education.
1.Skills must be used to be maintained Even when primary education is of high quality, skills decline in adulthood if they are not used regularly. Greater involvement in reading or number crunching at home or at work appears to correlate with higher overall literacy and numeracy, and may slow the decline of skills as adults age.
2.Countries must take adult education seriously Nations which perform better in surveys of adult skills have established some type of adult learning infrastructure outside of the formal education system. And an economy which makes proper use of the population’s skills also reduces the risk of individuals losing their abilities over time.
3.Technology is helpful in fostering adult learning, but is no panacea Mobile technology and the internet can remove some obstacles to adult skills education, particularly in the developing world. These and other technologies ease people’s access to adult education, but there is little evidence that their use helps individuals actually develop skills.
4.
06 The Learning Curve 2014
That education correlates with economic growth is one of the few conclusions with strong empirical backing that can be drawn from education studies.1 The average time spent in school by a country’s students and the labour productivity of its workers have been statistically linked for the last two decades, which is as far back as our database goes.Since the 1970s economists have posited that obtaining an educational qualification sends a signal to employers of existing positive attributes – such as native intelligence or a good work ethic – which may be entirely divorced from the qualification’s course content. A 2010 New Zealand government study found that higher literacy brought only limited benefits in its national labour market without an accompanying formal qualification.2
A substantial amount of research, however, points in a more predictable direction. Success in having students learn basic cognitive skills affects labour markets and aids economic growth substantially. The OECD estimates that, over the last decade, better skills have driven half of economic growth in the industrialised world.3
A 2010 analysis found that such skills – as measured by national average scores in the OECD’s Programme for International Student Assessment (PISA) tests – correlate with GDP. Moreover, it found that once skill levels are factored in, the total number of years of schooling a student receives becomes irrelevant.4 A 2013 study of immigrants to Canada found that as new arrivals built careers in their adopted country, those who came from places which inculcated skills better – measured by international test scores – saw higher average economic benefits per year of education than those educated in less effective national systems.5
Inculcating a broad range of skills in children is therefore crucial for national economic development. Thinking on which skills are important, however, is starting to evolve, as are ideas about how best to teach them.
Introduction: skills matter
1 The Learning Curve 2012: Lessons in country performance in education, The Economist Intelligence Unit, 2012 online: http://thelearningcurve.pearson.com/the-report-2012
2 Labour market outcomes of skills and qualifications, New Zealand Government Tertiary Education Occasional Paper 2010/05.
3 OECD’s Education at a Glance, 2012.
4 Eric Hanushek and Ludger Woessmann, ‘Education and Economic Growth’, in Dominic J. Brewer and Patrick J. McEwan, eds., Economics of Education, Amsterdam: Elsevier, 2010.
5 Qing Li and Arthur Sweetman, ‘The Quality of Immigrant Source Country Educational Outcomes: Do they Matter in the Receiving Country?’, Centre for Research and Analysis of Migration, University College London, Discussion Paper 1332, 2013.
07Pearson
21st century skills: beyond the Three Rs
In recent years it has become increasingly clear that basic reading, writing and arithmetic, while essential, are not necessarily enough. The importance of non-cognitive skills – usually defined as abilities important for social interaction – is also pronounced. A British study found that teacher-assessed levels of social adjustment at the age of 11 correlated just as strongly as a child’s cognitive abilities at that age with an individual’s likelihood of employment at 42, and had about one-third of the impact on adult pay.6 Such social understanding is also integral to a new range of abilities which educationalists have identified as ‘21st century skills’, including communication, working in teams and problem-solving.7
As Andreas Schleicher, OECD Deputy director for education, puts it: “The world economy no longer pays for what people know but for what they can do with what they know.” So far, however, understanding how best to teach these skills has suffered from even poorer data than those available for traditional ones, or even from a lack of outcomes definitions. The OECD’s Programme for International Student Assessment (PISA) is seeking to fill the void. In April 2014 it released the results from a problem-solving section included for the first time in the 2012 test, and in 2015 it aims to test collaborative working.
The task of assessing these skills is unlikely to be straightforward, nor are the results predictable. Data from the Programme for the International Assessment of Adult Competencies (PIAAC) on problem-solving skills in a technology-rich environment found that the economic return from having these abilities is lower than from having advanced literacy
or numeracy, especially in terms of higher individual wages. Eric Hanushek, the Paul and Jean Hanna senior fellow at Stanford University, notes that more detailed study is needed: “We know that in the highest-technology parts of society – which use skills the most – problem-solving is important, but we don’t know how to measure it very precisely or necessarily how to develop [these skills] per se.”
The answer to these questions will be relevant for a debate with the potential to reshape education in the near future. Despite the success of Asian education in inculcating numeracy and literacy, systems in that region are frequently criticised for relying on rote education: one study found that for each of their twice-a-semester exams, South korean students have to memorise between 60 to 100 pages of facts in order to do well.8 This type of teaching is presumed to impede creativity and the ability of students to address unexpected problems, either alone or in groups. The average test scores for problem-solving in 2014 and for collaborative working in 2015 might lend credence to these concerns or allay them, in which case other countries may need to revisit how they promote creativity.
Nor is any system currently likely to have the optimal approach for education. Just as new technology is requiring students to acquire a broader range of skills, it is opening up the potential for revolutionary new teaching techniques. This could even lead to new models of networking between and among students and teachers, allowing more individualised learning goals and pathways.9
6 Pedro Carneiro et al., ‘Which Skills Matter?’, Centre for the Economics of Education, London School of Economics, Discussion Paper 59, 2006.
7 Giorgio Brunello and Martin Schlotter, ‘Non Cognitive Skills and Personality Traits: Labour Market Relevance and their Development in Education & Training Systems,’ Forschungsinstitut zur Zukunft der Arbeit, Discussion Paper 5743, 2011.
8 Randall S Jones, ‘Education Reform in South korea’, OECD Economics Department Working Paper No 1067, 2013.
9 For a discussion, see Michael Fullan and Maria Langworthy, A Rich Seam: How New Pedagogies Find Deep Learning, January 2014.
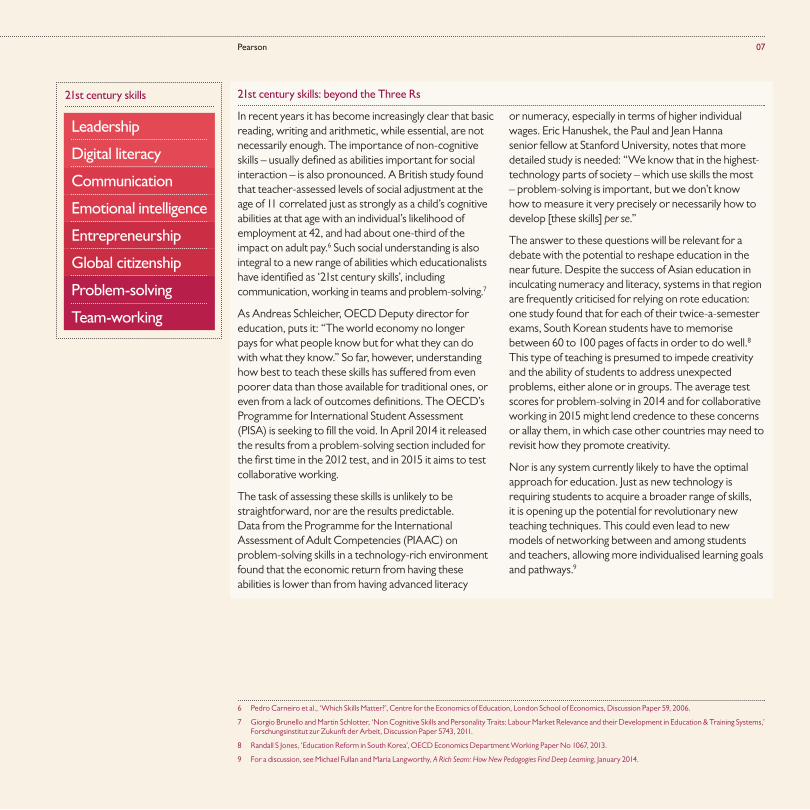
21st century skills
Leadership
Digital literacy
Communication
Emotional intelligence
Entrepreneurship
Global citizenship
Problem-solving
Team-working
08 The Learning Curve 2014
While far from perfect, our understanding of the attributes of school systems which are successful at inculcating skills has grown in the last decade. The Learning Curve 2012 report discusses a number of these at length, including the importance of attracting good teachers and giving them the social status of professionals; clear goals and expectations within the education system accompanied by accountability for schools and teachers; and autonomy for education professionals in reaching those goals.
Since that report, however, the major international testing programmes – PIRLS, TIMSS and PISA – have released new results which in turn have had an impact on our Global Index of Cognitive Skills and Educational Attainment. In producing the rankings, the Index compares 39 countries and one region (Hong kong) on two categories of education outputs: cognitive skills (PIRLS, TIMSS and PISA) and educational outcomes (graduation rates and literacy). What does all this new data say about what works in education?
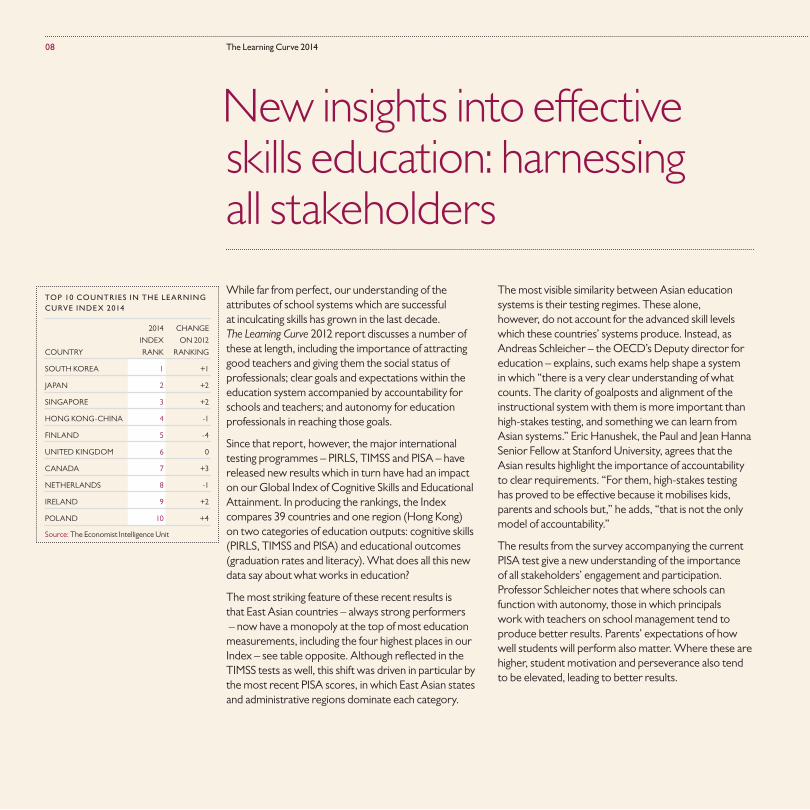
The most striking feature of these recent results is that East Asian countries – always strong performers – now have a monopoly at the top of most education measurements, including the four highest places in our Index – see table opposite. Although reflected in the TIMSS tests as well, this shift was driven in particular by the most recent PISA scores, in which East Asian states and administrative regions dominate each category.
The most visible similarity between Asian education systems is their testing regimes. These alone, however, do not account for the advanced skill levels which these countries’ systems produce. Instead, as Andreas Schleicher – the OECD’s Deputy director for education – explains, such exams help shape a system in which “there is a very clear understanding of what counts. The clarity of goalposts and alignment of the instructional system with them is more important than high-stakes testing, and something we can learn from Asian systems.” Eric Hanushek, the Paul and Jean Hanna Senior Fellow at Stanford University, agrees that the Asian results highlight the importance of accountability to clear requirements. “For them, high-stakes testing has proved to be effective because it mobilises kids, parents and schools but,” he adds, “that is not the only model of accountability.”
The results from the survey accompanying the current PISA test give a new understanding of the importance of all stakeholders’ engagement and participation. Professor Schleicher notes that where schools can function with autonomy, those in which principals work with teachers on school management tend to produce better results. Parents’ expectations of how well students will perform also matter. Where these are higher, student motivation and perseverance also tend to be elevated, leading to better results.
New insights into effective skills education: harnessing all stakeholders
TOP 10 COUNTRIES IN THE LEARNING CURVE INDEX 2014
COUNTRY
2014
INDEx
RANk
CHANGE
ON 2012
RANkING
SOUTH kOREA 1 +1
JAPAN 2 +2
SINGAPORE 3 +2
HONG kONG-CHINA 4 -1
FINLAND 5 -4
UNITED kINGDOM 6 0
CANADA 7 +3
NETHERLANDS 8 -1
IRELAND 9 +2
POLAND 10 +4
Source: The Economist Intelligence Unit
09Pearson
Finally, the data show in a number of ways that student engagement is vital to success: truancy and lateness correlate with poorer skill levels; openness to solving problems – including enjoying the task – leads to higher math scores. Professor Schleicher notes that “in the highest-performing nations, students see themselves as the ones who own their learning.”
The new data, then, suggest that systems which successfully inculcate basic skills such as literacy and numeracy rely not just on effective and autonomous professionals following clear goals. They need students engaged in the process and supportive families expecting results – in other words, a whole community with a culture conducive to education.
The Global Index of Cognitive Skills and Educational Attainment 2014
Changes in this year’s Index are driven to a great extent by newly published test results for PISA, PIRLS and TIMSS. A country’s movement in the rankings is driven both by its improved or worsened performance in these tests and by the performance of its peers. In the cases where a country’s raw scores have dropped, but the average score has fallen too, that country’s ranking might have improved just by virtue of performing above average. Below are some of the highlights from this year’s Index (the complete results can be found in Appendix I).
East Asian countries are prominent in the top tier: South korea takes first position, dislodging Finland, which falls by four places in this year’s Index to fifth. Japan, Singapore and Hong kong come second, third and fourth in that order. These countries’ performance is characterised by a strong community culture dedicated to education, where each stakeholder is accountable for a number of objectives.
It is a mixed performance for Scandinavian countries, which have tended to be the stars of the educational arena. Finland’s loss of its pole position to South korea is due largely to its subpar performance in the most recent PISA tests. Sweden’s test performance also declined, leading to a fall of three places to 24th position and prompting criticism of the country’s free schools policy.
Denmark, although improved on the 2012 Index results, falls just short of the top ten, ranking 11th. Norway sees the greatest improvement – a rise of five places – but still only ranks 21st.
Developing countries populate the lower half of the Index, with Indonesia again ranking last of the 40 nations covered, preceded by Mexico (39th) and Brazil (38th). Questions must follow about the ability of these countries’ education systems to support sustained high rates of economic growth over the long term.
There are nonetheless some noteworthy improvers among emerging countries. Russia, for example, has climbed seven places to put it in proximity of the top ten (at 13th), while Poland (up four places to 10th) manages to penetrate this select group. Among developed countries, Israel’s rise of 12 places to 17th position is one of the most notable improvements. Israel registered major gains in the PISA maths and sciences scores, which bodes well for the future of the country’s thriving technology sector.
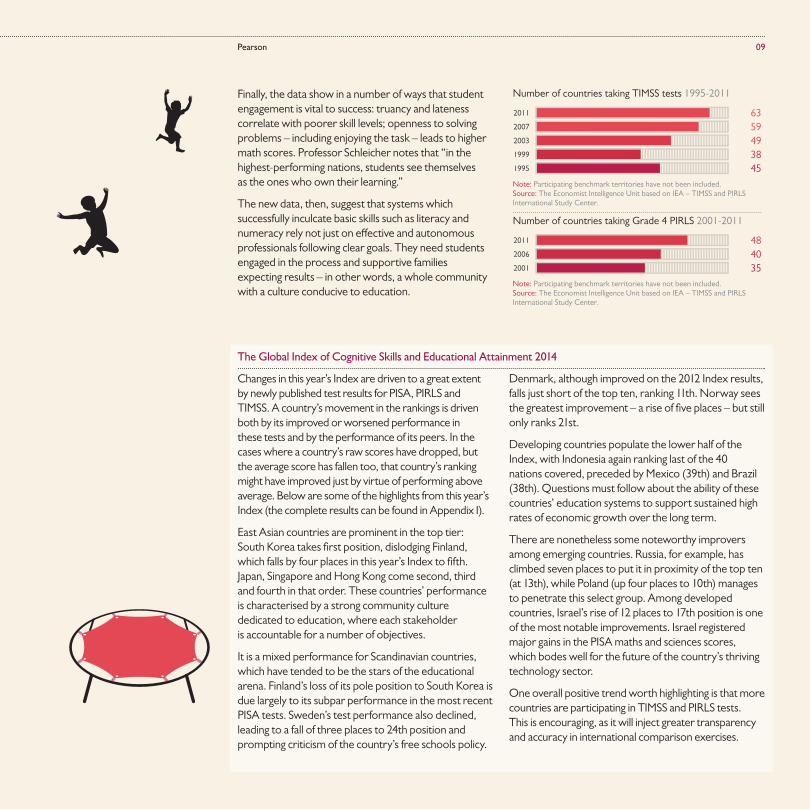
One overall positive trend worth highlighting is that more countries are participating in TIMSS and PIRLS tests. This is encouraging, as it will inject greater transparency and accuracy in international comparison exercises.
63594938
Number of countries taking TIMSS tests 1995-2011
2011
2007
2003
1999
1995 45Note: Participating benchmark territories have not been included.Source: The Economist Intelligence Unit based on IEA – TIMSS and PIRLS International Study Center.
484035
Number of countries taking Grade 4 PIRLS 2001-2011
2011
2006
2001
Note: Participating benchmark territories have not been included.Source: The Economist Intelligence Unit based on IEA – TIMSS and PIRLS International Study Center.

10 The Learning Curve 2014
11Pearson
The economic value of skills for societies comes largely from their use in the workforce during adulthood. The monetary impact of abilities initially received in education at first seems to grow as people leave school further behind: an analysis of PIAAC data found that the economic return to skills is greater for middle-aged individuals than for those just entering work.10
The effect of school, however, actually wears off over the years, as suggested by the PIAAC data. First, after accounting for differences in educational quality over time, the data indicate that skill levels decline with age. Second, differences in educational attainment correlate with skill differences less strongly among older than among younger people, indicating a diminishing effect for the former. Therefore, when considering skills across the adult population, at least as important as how well formal education inculcates them in students is how well they are maintained or, where needed, expanded in later years.
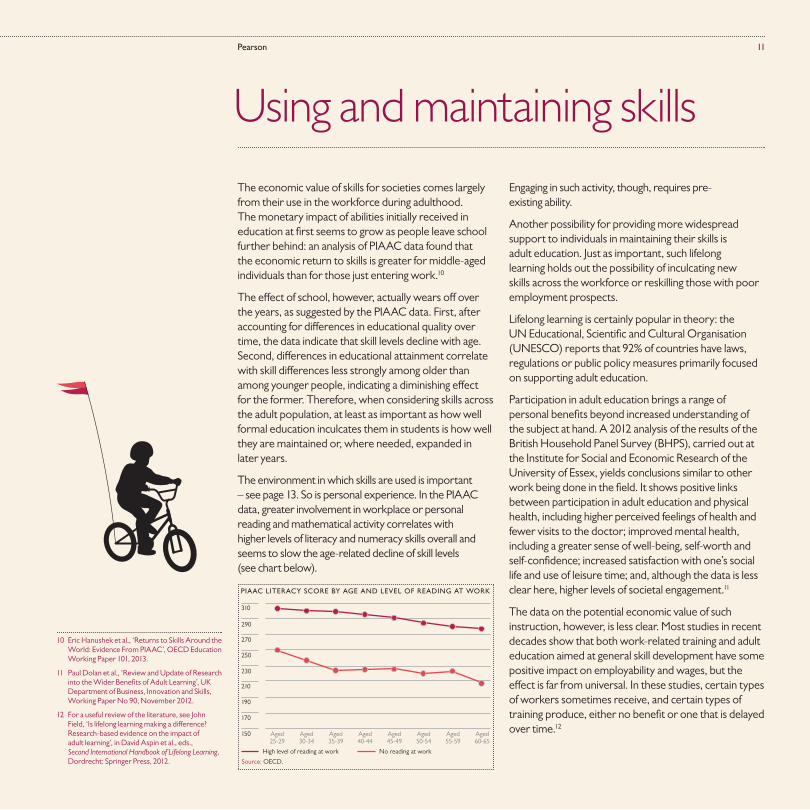
The environment in which skills are used is important – see page 13. So is personal experience. In the PIAAC data, greater involvement in workplace or personal reading and mathematical activity correlates with higher levels of literacy and numeracy skills overall and seems to slow the age-related decline of skill levels (see chart below).
Engaging in such activity, though, requires pre-existing ability.
Another possibility for providing more widespread support to individuals in maintaining their skills is adult education. Just as important, such lifelong learning holds out the possibility of inculcating new skills across the workforce or reskilling those with poor employment prospects.
Lifelong learning is certainly popular in theory: the UN Educational, Scientific and Cultural Organisation (UNESCO) reports that 92% of countries have laws, regulations or public policy measures primarily focused on supporting adult education.
Participation in adult education brings a range of personal benefits beyond increased understanding of the subject at hand. A 2012 analysis of the results of the British Household Panel Survey (BHPS), carried out at the Institute for Social and Economic Research of the University of Essex, yields conclusions similar to other work being done in the field. It shows positive links between participation in adult education and physical health, including higher perceived feelings of health and fewer visits to the doctor; improved mental health, including a greater sense of well-being, self-worth and self-confidence; increased satisfaction with one’s social life and use of leisure time; and, although the data is less clear here, higher levels of societal engagement.11
The data on the potential economic value of such instruction, however, is less clear. Most studies in recent decades show that both work-related training and adult education aimed at general skill development have some positive impact on employability and wages, but the effect is far from universal. In these studies, certain types of workers sometimes receive, and certain types of training produce, either no benefit or one that is delayed over time.12
Using and maintaining skills
10 Eric Hanushek et al., ‘Returns to Skills Around the World: Evidence From PIAAC’, OECD Education Working Paper 101, 2013.
11 Paul Dolan et al., ‘Review and Update of Research into the Wider Benefits of Adult Learning’, Uk Department of Business, Innovation and Skills, Working Paper No 90, November 2012.
12 For a useful review of the literature, see John Field, ‘Is lifelong learning making a difference? Research-based evidence on the impact of adult learning’, in David Aspin et al., eds., Second International Handbook of Lifelong Learning, Dordrecht: Springer Press, 2012.
310
290
230
250
270
210
190
Aged25-29
Aged30-34
Aged35-39
Aged40-44
Aged45-49
Aged50-54
Aged55-59
Aged60-65
170
150
PIAAC LITERACY SCORE BY AGE AND LEVEL OF READING AT WORK
High level of reading at work
Source: OECD.
No reading at work
12 The Learning Curve 2014
Doubts over the economic benefits aside, the main challenge for proponents of lifelong learning is that people most likely to engage in adult education are those who already have higher education levels. This can lead to such high correlation between those with formal and adult education that it is difficult mathematically to tease out any effect of the latter. As Professor Schleicher explains: “Our hopes that lifelong learning would make up for initial differences have not been borne out. If you [compare PIAAC with] PISA results, you can put countries more or less on a straight line. Lifelong learning seems to reinforce initial skill differences.”
Adult education is not, then, a palliative for an underperforming education system. According to Professor Hanushek: “The more skills you have early in life, the more you build on those, and commensurately the more you have later in life. Countries with strong schooling programmes set their citizens up for developing over time” by teaching them how to learn. Education systems “need to invest in strong foundations,” adds Professor Schleicher. This suggests that many countries are seeing simultaneous virtuous circles of improvement for those who were successful at education in the first place, and vicious circles of accelerated skill diminution over time for those who were not. Finding ways to engage the latter is therefore important to raise the overall skill levels in the population.
For kjell Rubenson, professor of education at the University of British Columbia, the solution starts with taking adult education seriously. He notes that Canadian education authorities tend to focus on formal education, but that the adult infrastructure is weak. In contrast, “one explanation why countries like Sweden, Denmark and Norway are doing relatively better in PIAAC is that they have a system where they use and maintain their skills.” The strength of Sweden’s adult education system goes a long way back: dissatisfied with state-run schools, the country’s working class and unions set up their own adult schools nearly a century ago. “If you go into small Swedish cities, the adult study associations are as common as bank offices,” says Professor Rubenson. Similarly, Nordic funding of adult education is also more predictable.
Just as important, he believes, Nordic systems are stronger because they go beyond job training to encompass general education and skills. This leads to broader societal support for funding. The approach also has direct relevance to efforts to inculcate 21st century skills. “If you work in a study circle [in Scandinavia], you have to organise, discuss and share. In that way, you develop a certain skill set,” says Professor Rubenson. He adds that this generalist approach helps promote a wider cultural acceptance of the value of adult education for everyone, which explains why over half of adults take courses in these countries. That said, the potential of reaching the low-skilled with adult education is not limited to well-off countries.
One question is whether technology, which is becoming increasingly entrenched in the modern learning environment, can be used to encourage low-skilled adults to pursue further education. In the last couple of years many of the world’s top universities have launched massive open online courses (MOOCs), broadening access to high-quality educational resources. But a recent study by the University of Pennsylvania found that 83% of its MOOC participants already had a post-secondary degree – far higher than international averages. Broadening access through technology, then, appears to be not enough. A culture of learning and understanding the value of bettering oneself needs to be fostered at an earlier stage in life before new technologies can start to have a real impact on lifelong learning.
Whatever the best approach, finding ways to square the circle and broaden the appeal of adult education “is no longer a luxury,” according to Professor Schleicher. “It is almost an imperative that people upgrade skills, but it is not working where the foundations are missing. You need both. You need an incentive system that encourages people to invest in skills [throughout their lives].”
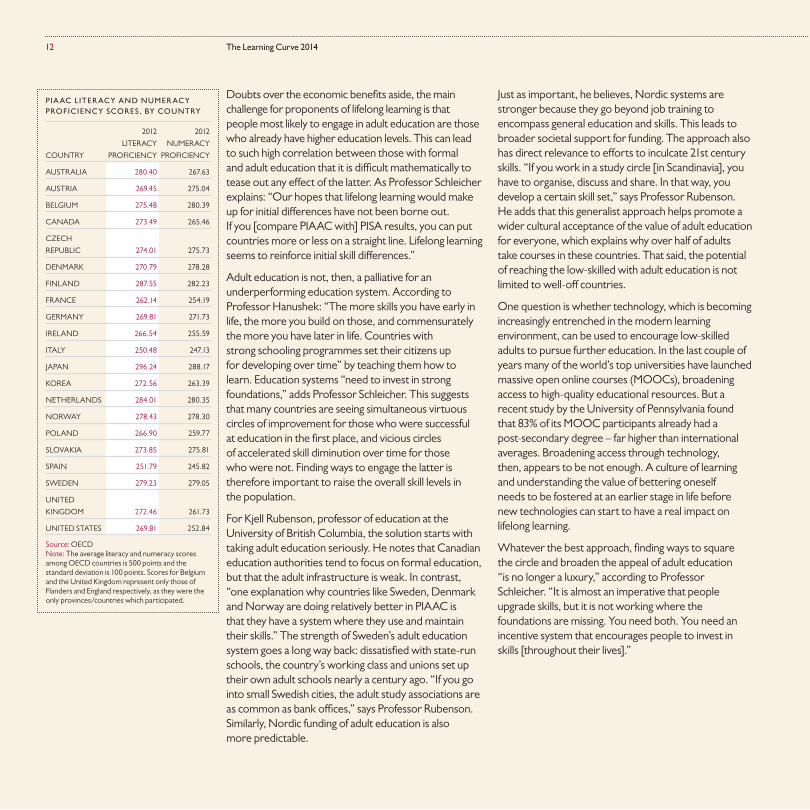
PIAAC LITERACy AND NUMERACy PROFICIENCy SCORES , By COUNTRy
COUNTRY
2012
LITERACY
PROFICIENCY
2012
NUMERACY
PROFICIENCY
AUSTRALIA 280.40 267.63
AUSTRIA 269.45 275.04
BELGIUM 275.48 280.39
CANADA 273.49 265.46
CZECH
REPUBLIC
274.01
275.73
DENMARk 270.79 278.28
FINLAND 287.55 282.23
FRANCE 262.14 254.19
GERMANY 269.81 271.73
IRELAND 266.54 255.59
ITALY 250.48 247.13
JAPAN 296.24 288.17
kOREA 272.56 263.39
NETHERLANDS 284.01 280.35
NORWAY 278.43 278.30
POLAND 266.90 259.77
SLOVAkIA 273.85 275.81
SPAIN 251.79 245.82
SWEDEN 279.23 279.05
UNITED
kINGDOM
272.46
261.73
UNITED STATES 269.81 252.84
Source: OECD Note: The average literacy and numeracy scores among OECD countries is 500 points and the standard deviation is 100 points. Scores for Belgium and the United kingdom represent only those of Flanders and England respectively, as they were the only provinces/countries which participated.
13Pearson
The value and retention of skills: a complex interplay between knowledge and environment
The environment in which skills are used is central to the value that can be derived from them. An analysis of PIAAC data measured the percentage increase in income per one standard deviation worth of improvement in numeracy scores. Individuals everywhere saw some benefit from better ability with numbers, but those in countries with a higher share of workers in the private sector, less restrictive employment laws and lower union density saw measurably higher returns, presumably because conditions let them use their greater abilities in more productive ways, or at least command better rewards for them. In the United States the improvement in wages was over twice that for some Scandinavian countries.
Eric Hanushek, who helped to write that study, believes that creating optimal conditions for skill utilisation will be as important a part of the education debate in future as skill inculcation and maintenance. “The US has done well overall not because our students have been highly skilled but because the economic system best rewards and makes use of those skills. Having people go into jobs that depress individual differences holds down the utilisation of skills. Other countries are starting to realise that.”
South korea has for a number of years been among the top PISA performers, but its PIAAC results were at or below average for the skills measured. Part of the reason is that universal secondary education became a reality there only in the 1990s: the figures show a rapid drop in abilities between those cohorts where education was common and those where it was less so.
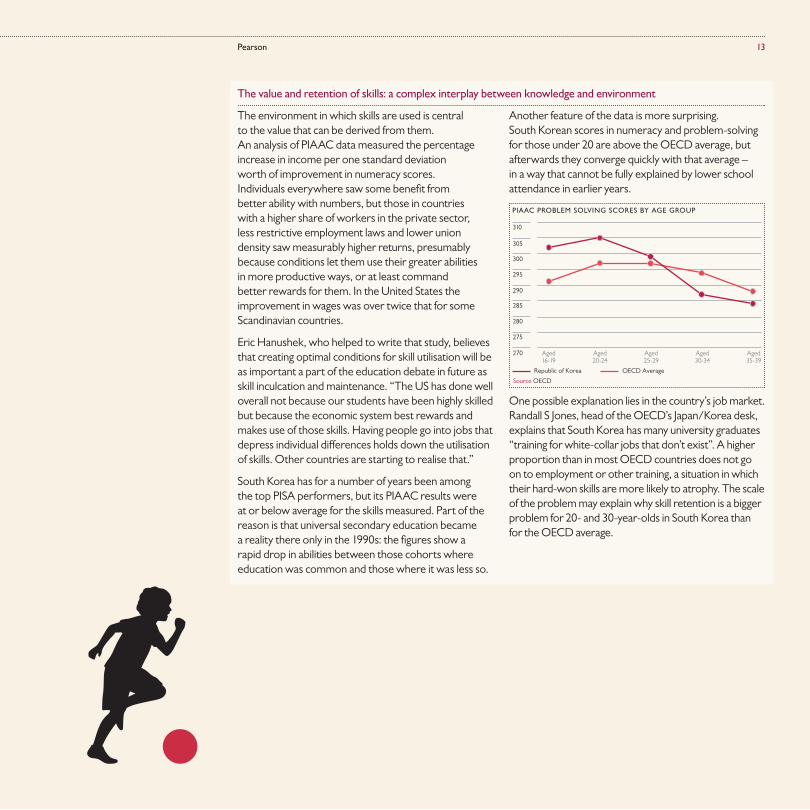
Another feature of the data is more surprising. South korean scores in numeracy and problem-solving for those under 20 are above the OECD average, but afterwards they converge quickly with that average – in a way that cannot be fully explained by lower school attendance in earlier years.
310
305
290
295
300
285
280
Aged16-19
Aged20-24
Aged25-29
Aged30-34
Aged35-39
275
270
PIAAC PROBLEM SOLVING SCORES BY AGE GROUP
Republic of Korea OECD Average
Source OECD
One possible explanation lies in the country’s job market. Randall S Jones, head of the OECD’s Japan/korea desk, explains that South korea has many university graduates “training for white-collar jobs that don’t exist”. A higher proportion than in most OECD countries does not go on to employment or other training, a situation in which their hard-won skills are more likely to atrophy. The scale of the problem may explain why skill retention is a bigger problem for 20- and 30-year-olds in South korea than for the OECD average.

14 The Learning Curve 2014
15Pearson
For developing countries, the most pertinent message from recent testing and earlier research is to focus on the needs which they know they have, in particular creating an effective teaching cadre and giving it the autonomy to do the job, and finding new ways to engage in mass adult education where appropriate.
Our Index and PISA cover a number of large developing countries – such as Brazil, Indonesia and Russia – but what works for education systems in the OECD’s core states will not necessarily have the same effects in those with lower incomes. Indeed, a report from the consulting firm Mckinsey points out that the best way for resources to be applied in pursuit of an improved educational system depends greatly on the current condition of that system.13 Although international data and insight provide valuable inspiration, “we have to adapt the experience of other countries to our needs,” says Maria Helena Guimarães de Castro, executive director of SEADE, São Paulo’s statistical agency, and previously Brazil’s deputy minister of education.
For Elizabeth Henning, director of the Centre for Education Practice Research at the University of Johannesburg, tests such as PISA and TIMSS are a waste of money for South Africa because they only reveal what every grade school teacher already knows. (She also acknowledges, however, that her views are not mainstream in this regard.) Still, Professor Henning adds, there is great value in testing as long as it is relevant to local conditions.
She and her colleagues are working with German experts to develop competence tests to better understand the needs of individual students and to improve teaching practice in South Africa. Her attitude towards testing is echoed by Jagmohan Singh Raju, director-general of India’s National Literacy Mission Authority and leader of the government’s adult education efforts, when referring to the relevance of efforts such as PIAAC: “In different countries, the competences to be tested will be uneven. Even the benchmarking will be. That it should be a scientific way of assessing things, however, is well accepted.”
With the caveat that conditions in no two systems will be completely alike, some of the needs which national experts identify in developing countries run parallel with the growing international consensus about which elements are important for a successful education system. In Brazil, for example, Professor de Castro stresses the need to focus on teachers. She cites reports indicating that the country requires 30% more of them in basic subjects such as maths and science, and that those who are available are overworked and often undertrained. “We don’t have teachers because the career is not attractive. This is a problem that will not be resolved unless the government and policymakers decide to change.” Similarly, in South Africa, Professor Henning speaks of the pressing need to invest in teachers, especially at the elementary level. At the same time she notes that efforts made by the government, modelled on those of Finland, to improve the cultural status of teachers are encouraging more bright young people – who earlier might have gone elsewhere – to enter the profession.
Lessons for developing countries
13 How the world’s most improved school systems keep getting better Mckinsey, 2010.
16 The Learning Curve 2014
Autonomy is also a highly relevant issue for both countries. Professor Henning notes that South Africa’s national curriculum, while excellent on paper, has negative effects. It is so extensive and tightly controlled that “teachers need to follow it like a form of ventriloquist’s dummy, and they lose most of the kids along the way.” On the other hand, the bright spots tend to be at the provincial or even district level. These successes are “about individuals, leadership and management,” she adds. Similarly, Professor de Castro notes that Brazil’s federal system provides the room for interesting initiatives at the municipal and state level that point to ways in which the country’s education system can improve.
As for adult education, the PIAAC findings may have even less resonance – in part because they are available only for a limited number of developed economies. Professor de Castro believes that, given the outcomes data for Brazilian students, adult skill levels are likely to be low by international standards – so low, in fact, that she suspects politicians will be too embarrassed for Brazil to participate in the programme.
Mobile technology can help overcome some obstacles to adult learning in the developing world. In Bangladesh, for example, the BBC is working with the ‘English in Action’ initiative to improve the language skills of over 25 million people by 2017. Launched in 2009, BBC Janala takes advantage of the prolific use of functional mobile phones in the country to deliver English audio lessons and short messaging service (SMS) quizzes. Other programmes currently operate on a smaller scale. UNESCO has set up the Mobile-Based Post Literacy Programme, which aims to help rural women aged between 15 and 25 retain the literacy skills they picked up while in formal schooling. Women taking part receive text messages in Urdu to which they are expected to reply, and they are also given monthly tests to track progress. As of January 2013 the programme had made 1,500 women literate.
In its working paper series on mobile learning, UNESCO makes clear that the full potential of using mobile technologies in education is yet to be realised. At the same time, however, others doubt the merits of mobile learning. A study conducted in Niger found that adult students taught using mobile phones were more likely to retain their newly acquired skills.14 In contrast, a study using evidence from across Asia found that while mobile technology helped to improve access to education, especially for women and rural inhabitants, proof of mobile phones promoting new learning was less convincing.15
How to create a successful adult education system in the developing world is not immediately obvious. Professor Schleicher notes that in emerging markets “the bulk of the skills base problem may be in the labour force, but everything suggests that you need to get initial education fixed first or you have a leaking pot that is very hard to fix.” The need for skill inculcation among adults is all the more urgent, then. As India’s literacy efforts show, skill inculcation among adults is possible on a large scale if done in a credible manner that helps to motivate learners – see case study opposite. In such circumstances, it may become an important part of improving skills in developing countries. The shape adult education takes, however, like teaching at all other levels, needs to be appropriate to local conditions.
14 Jenny C. Aker, Christopher ksoll and Travis J. Lybbert, ‘ABC, 123: Can you text me now? The impact of a mobile phone literacy program on educational outcomes’, University of Oxford Working Paper, 2010.
15 John-Harmen Valk, Ahmed Rashid and Laurent Elder, ‘Using mobile phones to improve educational outcomes: an analysis of evidence from Asia’, International Review of Research in Open and Distance Learning.
17Pearson
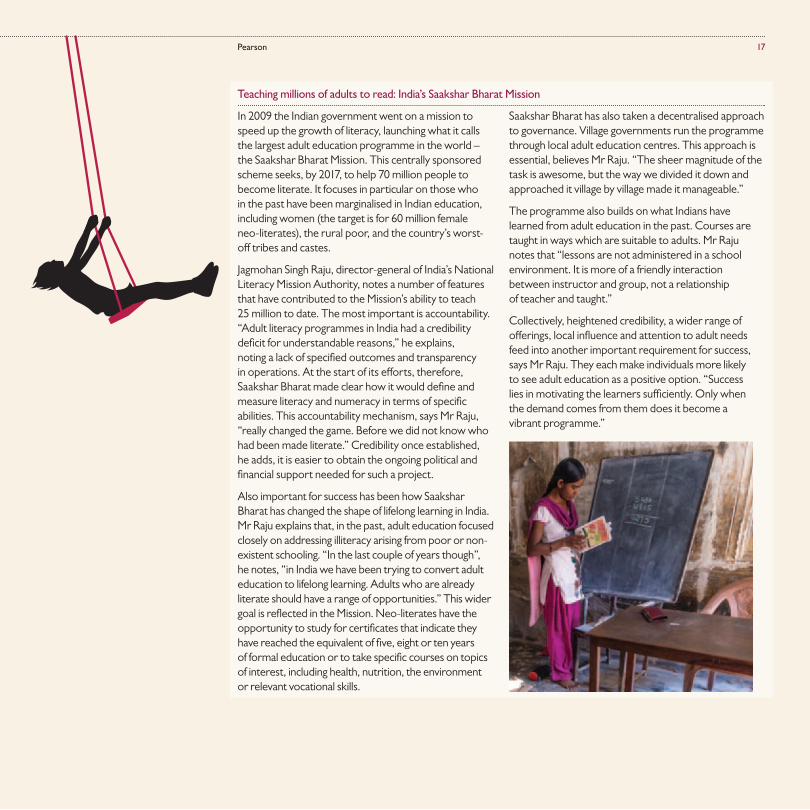
Teaching millions of adults to read: India’s Saakshar Bharat Mission
In 2009 the Indian government went on a mission to speed up the growth of literacy, launching what it calls the largest adult education programme in the world – the Saakshar Bharat Mission. This centrally sponsored scheme seeks, by 2017, to help 70 million people to become literate. It focuses in particular on those who in the past have been marginalised in Indian education, including women (the target is for 60 million female neo-literates), the rural poor, and the country’s worst-off tribes and castes.
Jagmohan Singh Raju, director-general of India’s National Literacy Mission Authority, notes a number of features that have contributed to the Mission’s ability to teach 25 million to date. The most important is accountability. “Adult literacy programmes in India had a credibility deficit for understandable reasons,” he explains, noting a lack of specified outcomes and transparency in operations. At the start of its efforts, therefore, Saakshar Bharat made clear how it would define and measure literacy and numeracy in terms of specific abilities. This accountability mechanism, says Mr Raju, “really changed the game. Before we did not know who had been made literate.” Credibility once established, he adds, it is easier to obtain the ongoing political and financial support needed for such a project.
Also important for success has been how Saakshar Bharat has changed the shape of lifelong learning in India. Mr Raju explains that, in the past, adult education focused closely on addressing illiteracy arising from poor or non-existent schooling. “In the last couple of years though”, he notes, “in India we have been trying to convert adult education to lifelong learning. Adults who are already literate should have a range of opportunities.” This wider goal is reflected in the Mission. Neo-literates have the opportunity to study for certificates that indicate they have reached the equivalent of five, eight or ten years of formal education or to take specific courses on topics of interest, including health, nutrition, the environment or relevant vocational skills.
Saakshar Bharat has also taken a decentralised approach to governance. Village governments run the programme through local adult education centres. This approach is essential, believes Mr Raju. “The sheer magnitude of the task is awesome, but the way we divided it down and approached it village by village made it manageable.”
The programme also builds on what Indians have learned from adult education in the past. Courses are taught in ways which are suitable to adults. Mr Raju notes that “lessons are not administered in a school environment. It is more of a friendly interaction between instructor and group, not a relationship of teacher and taught.”
Collectively, heightened credibility, a wider range of offerings, local influence and attention to adult needs feed into another important requirement for success, says Mr Raju. They each make individuals more likely to see adult education as a positive option. “Success lies in motivating the learners sufficiently. Only when the demand comes from them does it become a vibrant programme.”
18 The Learning Curve 2014
Our understanding of how education systems – including lifelong learning – can help inculcate and maintain skills has recently become a little clearer: › To existing knowledge about the importance of teachers, accountability and autonomy has been added evidence of the increasing appreciation of the importance of student and parent engagement in academic performance.
› Age-induced declines in the skills inculcated by school systems are a fact of life. Adult education and training as currently structured, however, are not showing the ability to contain or reverse them. On the other hand, ongoing interest in further training among those with high skill levels suggests that they see value in such activity. Finding ways to harness it for those with fewer skills could yield great benefit.
› Conditions matter greatly. Some of the education reform agendas from developed countries will be pertinent, as they seek to improve their education systems, but they are likely to need to focus on the basics first.
Improvement is not only possible – countries as diverse as Germany, Mexico and Tunisia are achieving it. More generally, of the 65 countries which have participated in PISA, 45 had better average scores in at least one subject in 2012 than in earlier tests. “The extraordinarily important message,” says Professor Hanushek, “is that countries can improve. Although none of this is easy, the data show that some have gotten better over time.”
Conclusion

19Pearson
20 The Learning Curve 2014
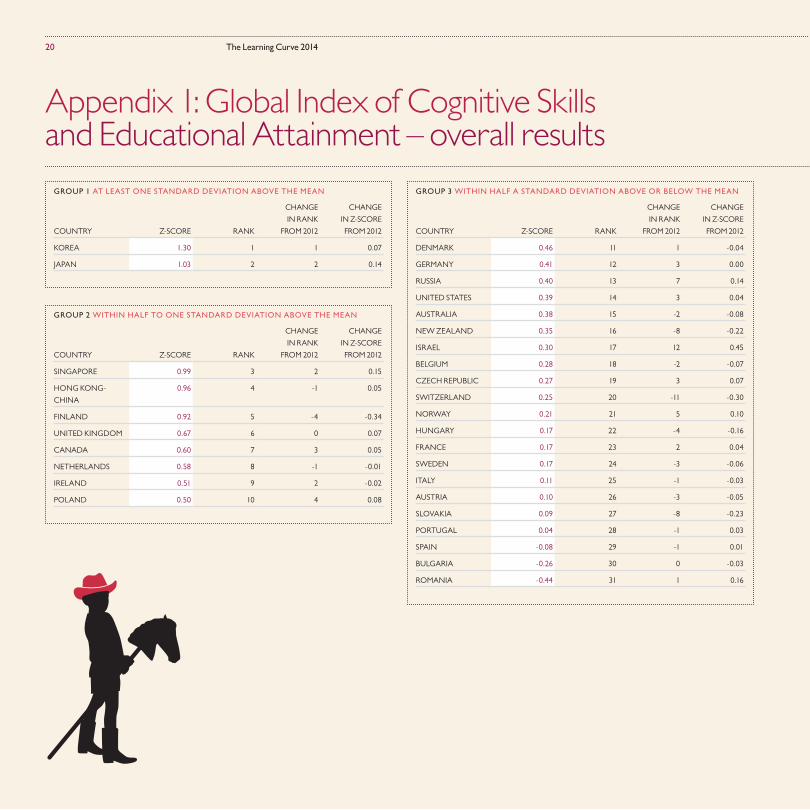
Appendix 1: Global Index of Cognitive Skills and Educational Attainment – overall results
GROUP 1 AT LEAST ONE STANDARD DEVIATION ABOVE THE MEAN
COUNTRY Z-SCORE RANk
CHANGE
IN RANk
FROM 2012
CHANGE
IN Z-SCORE
FROM 2012
kOREA 1.30 1 1 0.07
JAPAN 1.03 2 2 0.14
GROUP 2 WITHIN HALF TO ONE STANDARD DEVIATION ABOVE THE MEAN
COUNTRY Z-SCORE RANk
CHANGE
IN RANk
FROM 2012
CHANGE
IN Z-SCORE
FROM 2012
SINGAPORE 0.99 3 2 0.15
HONG kONG-
CHINA
0.96 4 -1 0.05
FINLAND 0.92 5 -4 -0.34
UNITED kINGDOM 0.67 6 0 0.07
CANADA 0.60 7 3 0.05
NETHERLANDS 0.58 8 -1 -0.01
IRELAND 0.51 9 2 -0.02
POLAND 0.50 10 4 0.08
GROUP 3 WITHIN HALF A STANDARD DEVIATION ABOVE OR BELOW THE MEAN
COUNTRY Z-SCORE RANk
CHANGE
IN RANk
FROM 2012
CHANGE
IN Z-SCORE
FROM 2012
DENMARk 0.46 11 1 -0.04
GERMANY 0.41 12 3 0.00
RUSSIA 0.40 13 7 0.14
UNITED STATES 0.39 14 3 0.04
AUSTRALIA 0.38 15 -2 -0.08
NEW ZEALAND 0.35 16 -8 -0.22
ISRAEL 0.30 17 12 0.45
BELGIUM 0.28 18 -2 -0.07
CZECH REPUBLIC 0.27 19 3 0.07
SWITZERLAND 0.25 20 -11 -0.30
NORWAY 0.21 21 5 0.10
HUNGARY 0.17 22 -4 -0.16
FRANCE 0.17 23 2 0.04
SWEDEN 0.17 24 -3 -0.06
ITALY 0.11 25 -1 -0.03
AUSTRIA 0.10 26 -3 -0.05
SLOVAkIA 0.09 27 -8 -0.23
PORTUGAL 0.04 28 -1 0.03
SPAIN -0.08 29 -1 0.01
BULGARIA -0.26 30 0 -0.03
ROMANIA -0.44 31 1 0.16
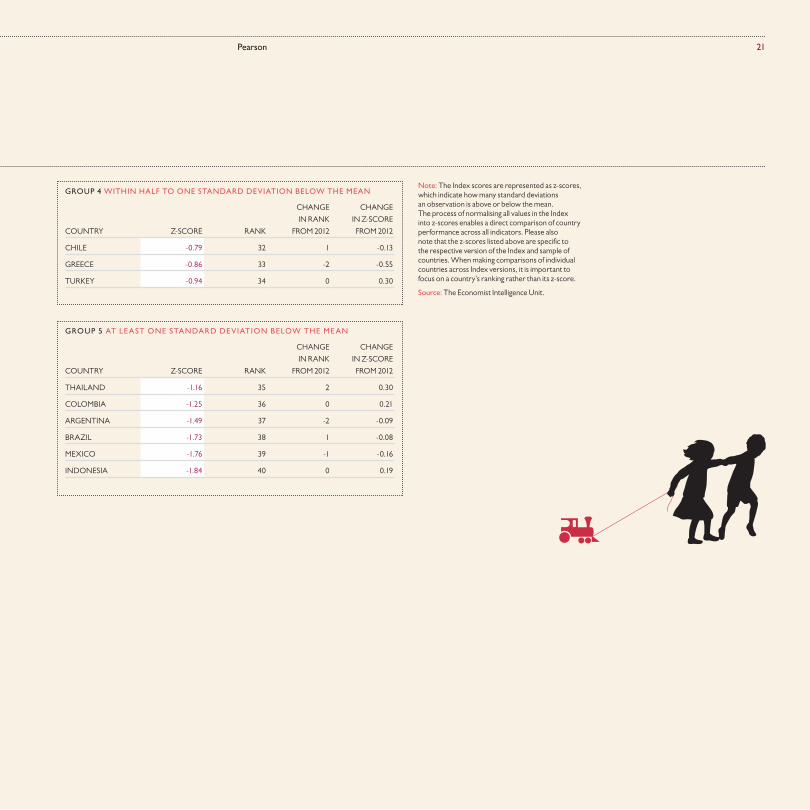
21Pearson
GROUP 4 WITHIN HALF TO ONE STANDARD DEVIATION BELOW THE MEAN
COUNTRY Z-SCORE RANk
CHANGE
IN RANk
FROM 2012
CHANGE
IN Z-SCORE
FROM 2012
CHILE -0.79 32 1 -0.13
GREECE -0.86 33 -2 -0.55
TURkEY -0.94 34 0 0.30
GROUP 5 AT LEAST ONE STANDARD DEVIATION BELOW THE MEAN
COUNTRY Z-SCORE RANk
CHANGE
IN RANk
FROM 2012
CHANGE
IN Z-SCORE
FROM 2012
THAILAND -1.16 35 2 0.30
COLOMBIA -1.25 36 0 0.21
ARGENTINA -1.49 37 -2 -0.09
BRAZIL -1.73 38 1 -0.08
MExICO -1.76 39 -1 -0.16
INDONESIA -1.84 40 0 0.19
Note: The Index scores are represented as z-scores, which indicate how many standard deviations an observation is above or below the mean. The process of normalising all values in the Index into z-scores enables a direct comparison of country performance across all indicators. Please also note that the z-scores listed above are specific to the respective version of the Index and sample of countries. When making comparisons of individual countries across Index versions, it is important to focus on a country’s ranking rather than its z-score.
Source: The Economist Intelligence Unit.
22 The Learning Curve 2014
23Pearson
As part of The Learning Curve programme, launched in 2012, a substantial quantitative exercise was undertaken to analyse nations’ educational systems’ performance in a global context. Two main objectives were set: to collate and compare international data on national school systems’ outputs in a comprehensive and accessible way, and for the results to help set the editorial agenda for The Learning Curve programme.
The EIU was aided by an Advisory Panel of education experts from around the world. The Panel was consulted on the aims, approach, methodology and outputs of The Learning Curve’s quantitative component. Feedback from the Panel was fed into the research in order to ensure the highest level of quality.
The Global Index of Cognitive Skills and Educational Attainment compares the performance of 39 countries and one region (Hong kong is used as a proxy for China due to the lack of test results at a national level) on two categories of education, cognitive skills and educational attainment. The Index provides a snapshot of the relative performance of countries based on their education outputs.
The Index was first published in November 2012, and updated with the latest data in January 2014. The 2014 Index follows the same methodology as the original Index. No countries have been added or removed; the indicators, weightings and sources remain the same.
Country and indicator selection
For data availability purposes, country selection to the original 2012 Index was based on whether a country was a ‘comprehensive-data’ country within the The Learning Curve Data Bank (please see the Appendix of The 2012 Learning Curve report for more information on this quantitative aspect of the project). Guided by the Advisory Panel, the EIU’s goal in selecting indicators for the Index was to establish criteria by which to measure countries’ output performance in education. Initial questions included: What level of cognitive skills are national education systems equipping students with and how are students performing on internationally comparable tests at different ages? What are levels of reading, maths and science in these countries? How successful are national education systems at attaining a high level of literacy in the population? How successful are national education systems at educating students to secondary and tertiary degree level?
Based on this set of questions, the EIU chose objective quantitative indicators, grouping them into two groups: cognitive skills and educational attainment. For cognitive skills, the Index uses the latest reading, maths and science scores from PISA (Grade 8 level), TIMSS (Grade 4 and 8) and PIRLS (Grade 4). For educational attainment, the Index uses the latest literacy rate and graduation rates at the upper secondary and tertiary level. Data for some countries was more recent than others; when the latest available data point was five years older than the latest, the EIU chose not to include it, although this was very rarely found to be an issue.
The EIU made estimations when no internationally comparable data was available. For example, a number of countries’ Grade 8 TIMSS Science scores were estimated by regression with PISA Science scores, when the regression was found to be statistically significant. In addition, when OECD data was not available for graduation rates, national ministry or statistics bureau data were sanity-checked and then used if deemed internationally comparable.
Calculating scores and weightings
In order to make indicators directly comparable across all countries in the Index, all values were normalised into z-scores. This process enables the comparison and aggregation of different data sets (on different scales), and also the scoring of countries on the basis of their comparative performance. A z-score indicates how many standard deviations an observation is above or below the mean. To compute the z-score, the EIU first calculated each indicator’s mean and standard deviation using the data for the countries in the Index, and then the distance of the observation from the mean in terms of standard deviations.
The overall Index score is the weighted sum of the underlying two category scores. Likewise, the category scores are the weighted sum of the underlying indicator scores. As recommended by the Advisory Panel, the default weight for the Index is two-thirds to cognitive skills and one-third to educational attainment. Within the cognitive skills category, the Grade 8 tests’ score accounts for 60% while the Grade 4 tests’ score accounts for 40% (Reading, Maths and Science all account for equal weights). Within the educational attainment category, the literacy rate and graduation rates account for equal weights.
Appendix 2: Index methodology
24 The Learning Curve 2014
Areas for caution
Because indexes aggregate different data sets on different scales from different sources, building them invariably requires making a number of subjective decisions. This index is no different. Each ‘area for caution’ is described below.
Z-scores for PISA, TIMSS and PIRLS
It is important to note that, strictly speaking, the z-scores for PISA, TIMSS and PIRLS are not directly comparable. The methodology applied both by the OECD and the International Association for the Evaluation of Educational Achievement (IEA) to calculate the performance of the participating countries consists of comparing the performance of the participating countries to the respective mean performance (the countries’ ‘raw’ test scores before normalisation are not published; just their scores in comparison to the other participants). Thus, which countries participate in each test and how well they perform in comparison to the other participants has a direct impact on the resulting final scores. Given that the sample of countries that take the PISA, TIMSS and PIRLS tests are not exactly the same, there are limitations to the comparability of their scores.
The EIU has chosen not to change these scores to account for this lack of direct comparability; however, it did consider other options along the way. The main alternative suggestion from the Advisory Panel was to use a pivot country in order to transform the z-scores of other countries in comparison to that pivot country’s z-score. Although this method is used in some studies, after substantial consideration, the EIU decided not to employ this method for the purpose of an index. The resulting z-scores after transformation depend heavily on the
choice of pivot country; choosing one country as a pivot over another affects countries’ z-scores quite substantially. The EIU did not feel it was in a position to make such a choice. Despite these limitations to test scores’ direct comparability, the EIU believes that the applied methodology is the least invasive and most appropriate to aggregate these scores.
Graduation rate data
Some members of the Advisory Panel questioned the use of graduation rates in the Index in that it is not clear whether they add value as a comparative indicator of education performance. Unlike test results and literacy rates, standards to gaining an upper secondary and tertiary degree do differ across countries. Notwithstanding, the EIU believes that graduation rates do add value in evaluating a national educational system’s performance, as there is common acceptance that national education systems should aim for their citizens to gain educational qualifications, especially at the secondary level. Including graduation rate data in the Index therefore awards countries that have put this aim into practice, albeit at varying levels of quality.
Because of the variation in how countries measure graduation rates, the EIU followed the Panel’s suggestion in using OECD graduation rate data, which uses one main definition. When OECD data was not available, national ministry or statistics bureau data was sanity-checked and then used if deemed comparable. In some cases, no data on graduation rates was available. In this case, the EIU awarded the country the mean score for this indicator. One disadvantage of giving a country the mean score is that if in reality it performs worse than the average in this indicator, the Index boosts
its score, and vice versa. Finally, the EIU took the most recent data available. Because graduation rates are based on the pattern of graduation existing at the time, they are sensitive to changes in the educational system, such as the addition of new programmes or a change in programme duration. As an extreme example, Portugal’s upper secondary graduation rate increased from a range between 50% and 65% in the early 2000s to 2008, to 104% in 2010 and 89% in 2011, as a result of the government’s “New Opportunities” programme, launched to provide a second chance for those individuals who left school early without a secondary diploma. In order to treat countries consistently, the Index takes the most recent figure. Although this inflates Portugal’s score on this indicator, this inflation should eventually fall out of the Index as the figure gets updated each year. Given the limitations of graduation rate data, the EIU followed the Panel’s suggestion of giving a smaller weighting (one-third) to educational attainment.
It is also important to note that for the tertiary graduation rate, this is limited to tertiary-type A programmes. Tertiary-type B programmes are not included. This methodology was chosen largely because not all countries collect data and organise their education systems along the lines of A and B. As per the OECD, tertiary-type A programmes are largely theory-based and are designed to provide qualifications for entry into advanced research programmes and professions with high requirements in knowledge and skills. These programmes are typically delivered by universities, and their duration ranges from three to five years, or more at times. Tertiary-type B programmes are classified at the same academic level as those of type A, but are often shorter in duration
(usually two to three years). They are generally not intended to lead to further university-level degrees, but rather to lead directly to the labour market.
Although excluding tertiary-type B programmes makes for a more relevant comparison amongst countries, it also slightly disadvantages a number of countries that have particularly high type B graduation rates (as these rates are not included). These countries are Chile, Ireland, Japan and New Zealand. Nonetheless, this exclusion has quite a limited impact on these countries’ ranking in the Index.
Other indicators
The EIU had wanted to include other education performance indicators in the Index, such as how well national education systems prepare students for the labour market and the performance of vocational studies. However, data availability was and remains a limiting factor. The EIU found that sufficient data was not available that isolates educational attainment within labour market outcomes; and internationally comparable data on vocational studies covering all countries in the Index was not readily available either.
Released by the OECD in 2013, the Survey of Adult Skills as part of the Programme for the International Assessment of Adult Competencies (PIAAC) measures the literacy and numeracy proficiency of 16-65 year-olds at a national level. This indicator was considered for inclusion to the Index, but was ultimately not included: for one, the study does not cover 16 of the 40 countries currently in the Index, and secondly, a viable method for estimating the missing 16 countries’ scores could not be found. Any future version of the Index will again consider incorporating this survey as well as others.
Pearson
Pearson is the world’s leading learning company, with 40,000 employees in more than 80 countries working to help people of all ages to make measurable progress in their lives through learning.
We provide learning materials, technologies, assessments and services to teachers and students in order to help people everywhere aim higher and fulfil their true potential. We put the learner at the centre of everything we do.
www.pearson.com
The Economist Intelligence Unit wrote all sections of this report with the exception of the Foreword.
The Economist Intelligence Unit (EIU) is the world’s leading resource for economic and business research, forecasting and analysis. It provides accurate and impartial intelligence for companies, government agencies, financial institutions and academic organisations around the globe, inspiring business leaders to act with confidence since 1946. EIU products include its flagship Country Reports service, providing political and economic analysis for 195 countries, and a portfolio of subscription-based data and forecasting services. The company also undertakes bespoke research and analysis projects on individual markets and business sectors. More information is available at www.eiu.com or follow us on www.twitter.com/theeiu
Disclosure: The Economist Intelligence Unit is part of The Economist Group. Pearson owns a 50% stake in The Economist Group.
Learn more, explore the data and join the discussion at The Learning Curve website…
thelearningcurve.pearson.com
› Full report online and in PDF
› The Learning Curve Data Bank
› Case studies
› Country profiles
› Video interviews
› Data visualisations

Pearson 80 Strand London WC2R 0RL T +44 (0)20 7010 2000
Design and Production: Radley Yeldar (London) ry.com Print: Pureprint Group
This report has been printed on Edixion Challenger Offset which is FSC® certified and made from 100% Elemental Chlorine Free (ECF) pulp. The mill and the printer are both certified to ISO 14001 environmental management system and registered to EMAS the eco management Audit Scheme. The report was printed using vegetable based inks by a CarbonNeutral® printer.
Learn more at thelearningcurve.pearson.com