Embed Size (px)
Citation preview
[CONTRIBUTION FROM THE WM. H. CHANDLER CHEMISTRY LABORATORY, LEHIQH UNIVERSITY]
THE MILLS-NIXON EFFECT AND BOND MULTIPLICITY VIA ULTRAVIOLET SPECTRA1
R. H. HORNING AND E. D. AMSTUTZ
Received April 11, 1066
It is a well established fact that the characteristics of most aromatic bonds vary from those of the normal benzene bond. Naphthalene has received consider- able attention and the behavior of this system is now understood as being due to a greater electronic charge density about the alpha carbon atom with respect to the beta atom (1) and to a greater mobile bond order of the 1-2 bond (2). Mills and Nixon (3) postulated a similar sort of phenomenon for the indan sys- tem and described the molecule as favoring the Kekul6 isomer in which the bi- nuclear bond is single. The work of numerous investigators seeking to learn both the direction and extent of the bond fixation has already been reviewed (4, 5). It may be said, however that interpretation of empirical information has led to widely varying concepts as to the importance of the Mills-Nixon effect. Berthier and Pullman (5) have submitted a theory, based on detailed molecular orbital calculations, which seems to account for the greatest number of facts and which indicates the Mills-Nixon effect to be quite subtle, and not generally sus- ceptible to physical measurement. Chemical reactivity, on the other hand, may not be reliably translated into relative bond orders even though it does provide an insight into the relative charge densities about the carbon atoms,
It has been suggested (6a) that an examination of the spectra of 3,4- and 4,5- trimethylenepyridazine would reveal the extent of bond fixation in indan. In order to provide the necessary comparison for such an examination it becomes mandatory to examine also the spectra of 3,4- and 4,5-dimethylpyridazine and of 3,4- and 4,5-tetramethylenepyridazine.
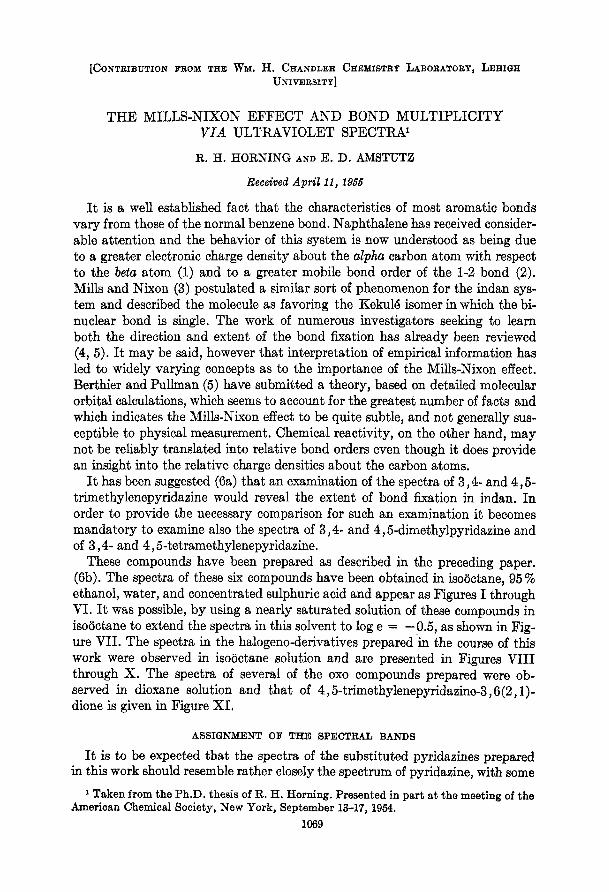
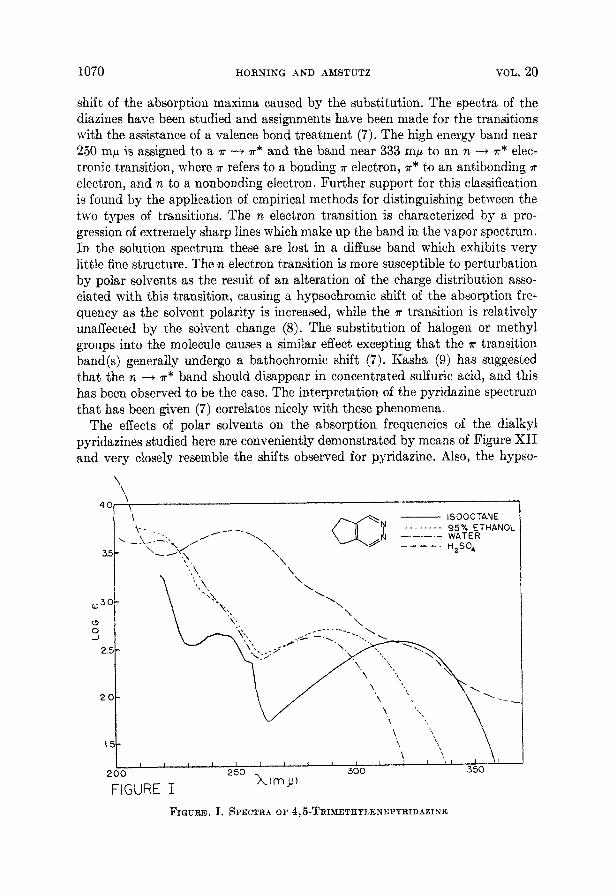
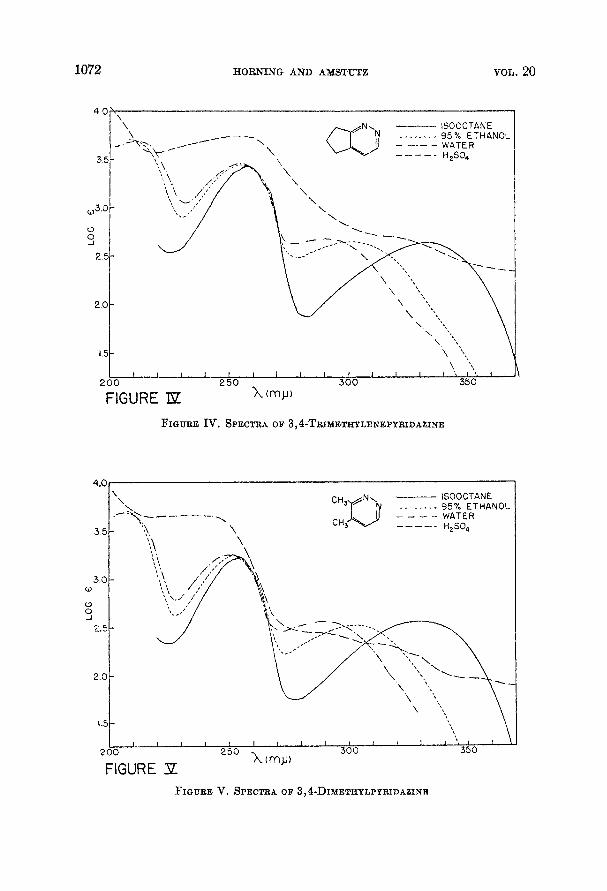
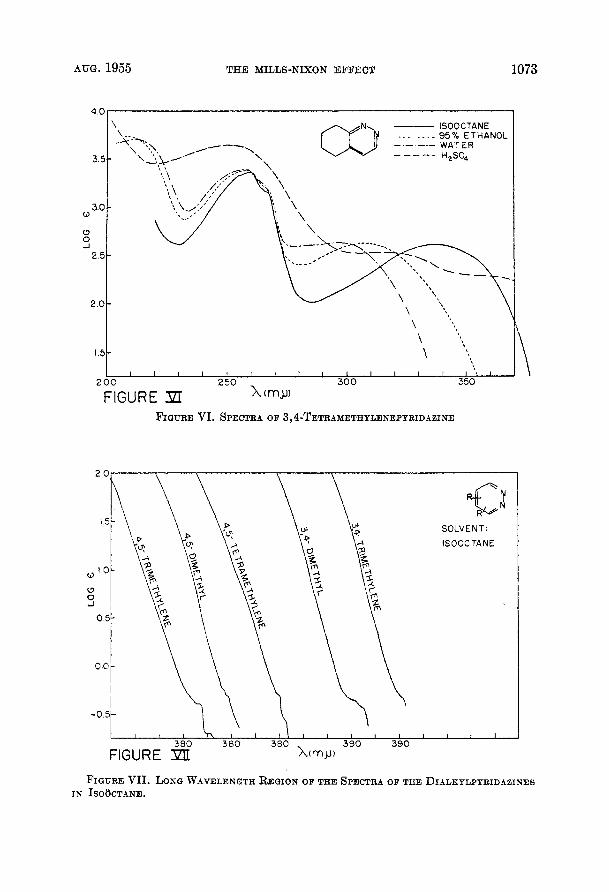
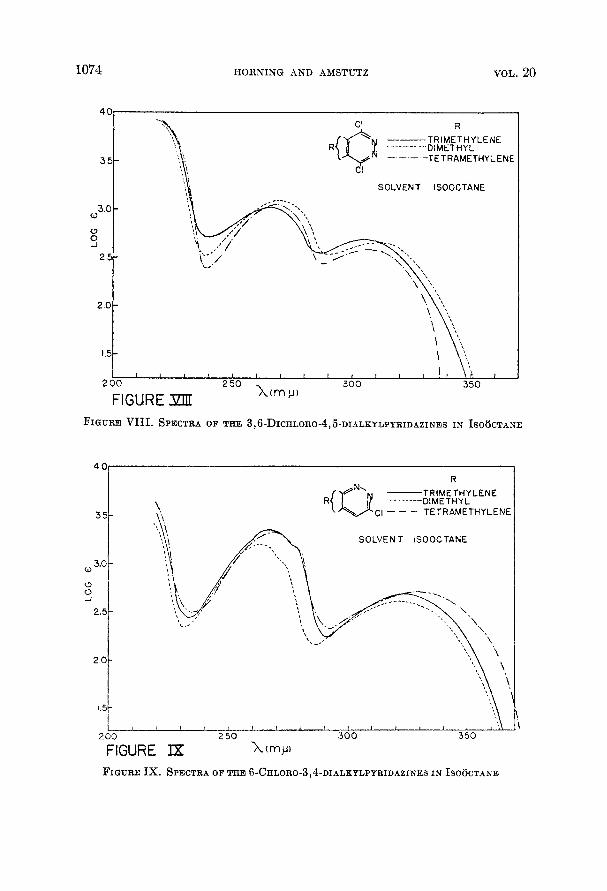
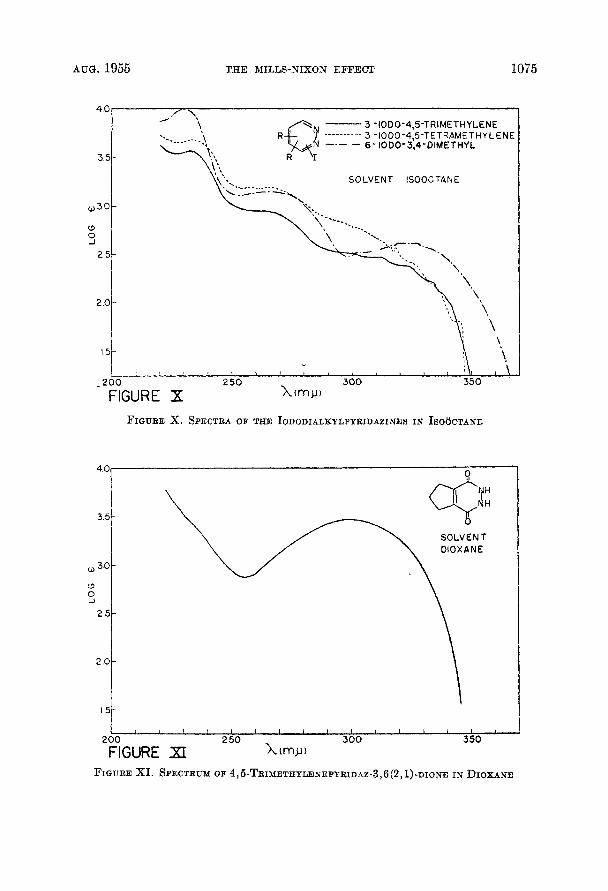
These compounds have been prepared as described in the preceding paper. (6b). The spectra of these six compounds have been obtained in isooctane, 95 % ethanol, water, and concentrated sulphuric acid and appear as Figures I through VI. It was possible, by using a nearly saturated solution of these compounds in isooctane to extend the spectra in this solvent to log e = -0.5, as shown in Fig- ure VII. The spectra in the halogeno-derivatives prepared in the course of this work were observed in isooctane solution and are presented in Figures VI11 through X. The spectra of several of the oxo compounds prepared were ob- served in dioxane solution and that of 4,5-trimethylenepyridazine-3,6(2,1)- dione is given in Figure XI.
ASSIGNMENT OF THE SPECTRAL BANDS
It is to be expected that the spectra of the substituted pyridazines prepared in this work should resemble rather closely the spectrum of pyridazine, with some
1 Taken from the Ph.D. thesis of R. H. Homing. Presented in part at the meeting of the American Chemical Bociety, New York, September 13-17, 1954.
1069
VOL. 20 1070 HORNING -4ND AMSTUTZ
shift of the absorption maxima caused by the substitution. The spectra of the diazines have been studied and assignments have been made for the transitions with the assistance of a valence bond treatment (7). The high energy band near 250 mp is assigned to a a -+ a* and the band near 333 mp to an n 4 a* elec- tronic transition, where a refers to a bonding a electron, a* to an antibonding 7r electron, and n to a nonbonding electron. Further support for this classification is found by the application of empirical methods for distinguishing between the two types of transitions. The n electron transition is characterized by a pro- gression of extremely sharp lines which make up the band in the vapor spectrum. In the solution spectrum these are lost in a diffuse band which exhibits very little fine structure. The n electron transition is more susceptible t o perturbation by polar solvents as the result of an alteration of the charge distribution asso- ciated with this transition, causing a hypsochromic shift of the absorption fre- quency as the solvent polarity is increased, while the a transition is relatively unaffected by the solvent change (8). The substitution of halogen or methyl groups into the molecule causes a similar effect excepting that the a transition band(s) generally undergo a bathochromic shift (7). Kasha (9) has suggested that the n 4 7" band should disappear in concentrated sulfuric acid, and this has been observed to be the case. The interpretation of the pyridazine spectrum that has been given (7) correlates nicely with these phenomena.
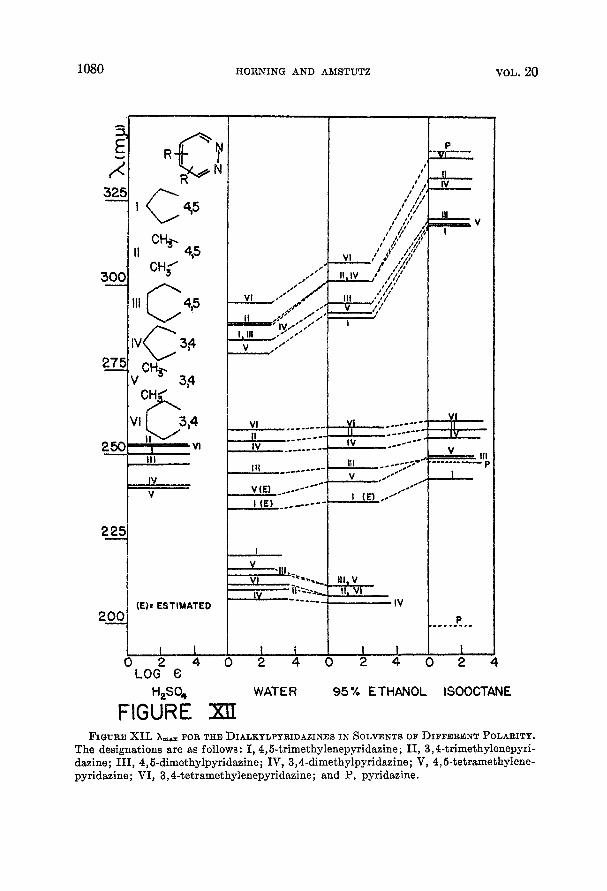
The effects of polar solvents on the absorption frequencies of the dialkyl pyridazines studied here are conveniently demonstrated by means of Figure XI1 and very closely resemble the shifts observed for pyridaaine. Also, the hypso-
\ '\
4 0 , \ IS 00 C TAN E
15 \ \
I 1 I I I I t I I I 1 ) 1 % " ' 2 50 300 3 50 X(rn9) 200
FIGURE I FIGURE. I. SPECTRA OF 4,5-TRIMETHYLENEPYRIDAZINE

BUG. 1955 THE MILLS-NIXON EFFECT 1071
ISOOCTANE
WATER - - - 95% ETHANOL -.A< Y,\,
\ ' , \ /--'
L' ' \ $ \ \
*\/ \ 3.5- / \, \
*(, '. \ ', \~ \
,30-
W 0 J
2.5-
2.0 -
1.5-
2 0 0 250 300 350
FIGURE II FIQURE 11. SPECTRA OF 4,5-DIMETHYLPYRIDAZINB
FIGURE 111. SPECTRA OF 4,5-TETRAMETHYLENEPYRIDAZINE
1072 HORNING AND AMSTUTZ VOL. 20
3.5-
,3.0
0
9 2.5-
2.0
1.5
9 5 % ETHANOL \
O'\\
-
-
- \ '<\\
\. 'l$ I I I I I I I I I I 1 I l t , l . l
200 2 50 300 350
FIQURE Iv, SPECTRA OF 3,4-TRIMETHYLENEPYRIDAZINE
..- \
- - .___-- 95% ETHANOL
0
(3
3
2.0 -
1.5-
2 0 0 2 5 0 3 0 0 350 X (my) FIGURE P
FIGURE v. SPECTRA OF 3,4-DIMETHYLPYRIDAZrNB
\
AUG. 1955 THE MILLS-NIXON EFFECT 1073
SOLVENT : IC 0 0 C TAN E
FIGURE VII. LONG WAVELENGTH REGION OF THE SPECTRA OF THE DIALKYLPYRIDAZINEB IN ISO~CTANE.
1074 HORNING AND AMSTUTZ VOL. 20
TRIMETHYLENE
-TET RAMETHY LENE CI
SOLVENT ISOOCTANE
2 00 2 5 0 3 0 0 350 X(rnp) FIGURE XIU FIGURE V I I I . SPECTRA OF THE 3,6-DICHLORO-4,6-DIALKYLPYRIDAZINES IN ISO6CTANE
40 R
TRIMETHYLENE
CI - - - TETRAMETHYLENE 35-
SOLVENT ISOOCTANE
3.0- 0
0 0 -I
2.5-
2 0-
1.5-
I J 1 1 1 1 1 1 1 I t 1 1 1 ) ' I
2 00 2 5 0 300 350 FIGURE IX X ( m y
FIGURE Ix. SPECTRA OF THE 6-CHLORO-3,4-DIALEYLPYRIDAZINES I N ISO6CTANE
AUG. 1955 THE MILLS-NIXON EFFECT 1075
40, / \
3 -IODO-4,5-TRIMETHYLENE
35-
SOLVENT ISOOCTANE
w 3 0 -
(3 0 -I
2 5 -
2 0-
I5-
-200 250 300 350 FIGURE X X(rn9)
FIGURE X. SPECTRA OF TEE IODODIALKYLPYRIDAEINES IN ISO~CTANE
FIGURE XI. SPECTRUM OF 4,6-TRIMETHYLENEPYRIDAZ-3,6(2,1)-DIONE I N DIOXANE

1076 HORNINC AND AMSTUTZ VOL. 20
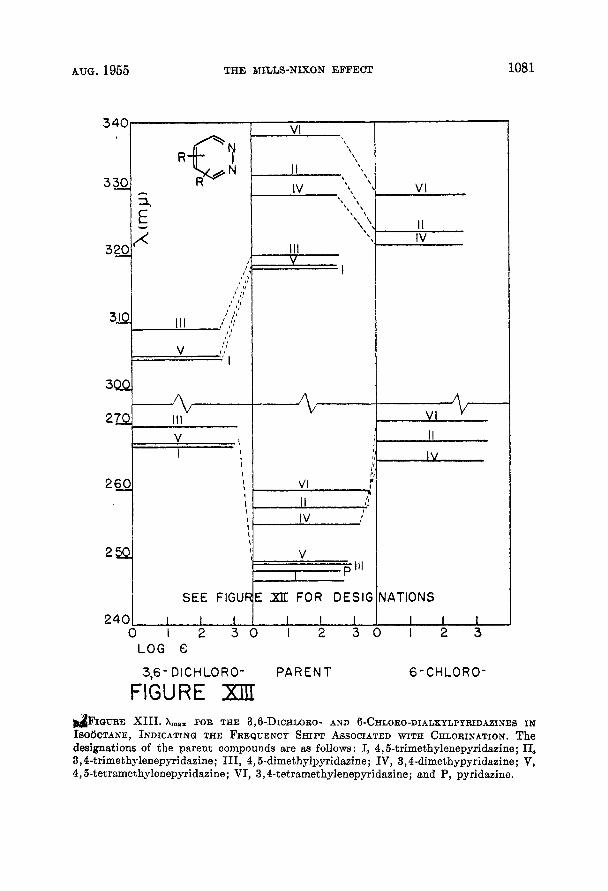
chromic shift of the long wavelength band with respect to the corresponding band in pyridazine illustrates the expected effect of alkyl substitution of the two types of transitions. The corresponding frequency shifts of the chloro- and dichloro-dialkylpyridazines are diagrammed in Figure XIII. The spectra of the dialkylpyridazines in concentrated sulfuric acid that are presented here are somewhat unusual in that the long wavelength band continues on into the visible region of the spectrum rather than decreasing rather sharply in absorbance. Further, while the solutions examined apparently obey Beer’s Law the solutions in concentrated sulfuric acid seem to be exceptions, a t least insofar as the region above ca. 260 mp is concerned. This is based on the observation that on increas- ing the concentration of 4,5-dimethylpyridazine in concentrated sulfuric acid one hundred fold the log of the molar extinction coefficient decreased from about 2.0 to about 0.7 at 304 mp. No reason has been ascertained for this behavior although it does seem unlikely that it is due to the solvation effects that some- times cause deviations from Beer’s Law. Nevertheless, the absorbance of the sulfuric acid solutions in the region of 325 mp is somewhat less than it is in the other solvents.
The spectra of the dialkylpyridazines in nearly saturated isooctane solution show, in the region of 385 mp, a shoulder on the side of the singlet-singlet n --+ n* band. Dr. R. C. Hirt (10) has suggested that these shoulders might possibly be a singlet-triplet n + n* transition for they have about the anticipated frequency and absorbance. It is also possible, however, that they are due to impurities present in the samples used or to instrumental errors, since the absorbance a t this frequency was quite low (ca. 0.005). This assignment accordingly, must be a very uncertain one.
APPLICATION OF THE SPECTRA TO THE MILLS-NIXON PROBLEM
Examination of the spectra of benzalaziiie and 1,4-diphenylbutadiene has revealed the fact that the former has an absorption maximum a t shorter wave- length than the latter ( l l ) , suggesting that the azo linkage possesses a high potential energy (12) or that the tendency of the nitrogen atoms to acquire negative charges effectively shortens the length of the conjugated system (13). Lewis and Calvin (11) attribute this to a “strain” in the azo link of excited species of the azine. Thus, in the fully resonating azo-azine system the greater contribution would be expected to come from the form possessing the azine link. This is borne out by the fact that the Oth order (un-normalized) wave functions for pyridazine, as-triazine, and oic-tetrazine have been found to be \k = $A + 1.39+B, 9 = +A + 1.47I)B and 9 = + 1.721)~ respectively, the more stable structures being in the first two cases the ones with no azo links and in the last case the one with but a single azo link (14). The introduction of another bond- localizing influence into the system of pyridazine would alter the relative con- tributions of the Kekul8 isomers. In this manner it has been shown (sa) that the ground state of cinnoline should be above that of phthalazine because the greater bond order of the 1-2 bond in naphthalene favors the azo link in cinnoline and the azine link in phthalazine. This variation in the ground state energy
AUG. 1955 THE MILLS-NIXON EFFECT 1077
should be evidenced by differences in the near ultraviolet spectra. The impor- tance of polarized or charge separated structures increases in the first excited states, Cinnoline, with a longer polarized system that phthalazine, should undergo the transition to the first excited state with the absorption of less energy than is required for the similar transition of phthalazine. This difference in polarizability should be evidenced in a shift of the ultraviolet absorption max- ima of cinnoline to longer wavelengths with respect to the spectrum of phthala- zine. It has been found, in fact, that cinnoline does absorb a t longer wavelengths than does phthalazine.
In order to interpret the spectra that have been presented here in terms of bond order differences in indan, tetralin, and o-xylene it is first necessary to take into consideration those factors likely to affect the position of the absorption maxima. It is to be expected that hyperconjugation, induction, and strain may cause some variation in the polarizabilities. However, the bathochromic shifts of the maxima for the 3,4-dialkylpyridazines with respect to the 4,5-dialkylpyri- dazines should be the same for the series of six such compounds treated here, with one exception. If the contributions that the various substituents (ie., dimethyl, trimethylene, and tetramethylene) make to this bathochromic shift by means of hyperconjugation, induction, or strain are not the same, the relative shifts due to polarizability could not be the same. However, it is precisely the differences due to these factors that are of interest here; especially inasmuch as they would be expected to influence the preference for particular limiting polar- ized structures in the hydrocarbons. Accordingly, the assumption is made the polarizability differences among the three pairs of isomers should produce no difference in the bathochromic shift of the 3,4- with respect to the 4,5- isomer excepting insofar as these differences are caused by variations of strain, hyper- conjugation, and induction due to the aklyl groups of indan, tetralin, and o- xylene. The second factor exerting an influence on the ultraviolet spectra of the substituted pyridazines is the vicinal diaza system. The perturbations produced by the nitrogen atoms should be different for the isomeric pairs of the compounds studied. By the same reasoning utilized above for the polarizability differences, the variance of pairs of isomers should be constant. This justifies the assumption that the introduction of two nitrogen atoms into the ring systems does not prohibit the results from being extrapolated to the hydrocarbon systems. A third factor that would have the effect of altering the frequency of the absorption maxima is the transition probability of the fine structure components of the band. For this reason the assumption is made that differences in the frequency of the absorption maxima of the compounds studied are due to real energy differences and not to alterations in the transition probability of the fine structure compo- nents of the band. Some verification is given to this in that the spectral bands of the various compounds in isooctane do retain their symmetry. That is, there is no alteration of the geometric center of any band as compared to the cor- responding band for another compound. The fourth factor affecting the frequency of maximum absorption is the relative contributions to the ground states of the molecules by the azo and the azine system. The introductory discussion to this
1078 HORNING AND AMSTUTZ VOL. 20
section and the discussion of the spectra of cinnoline and phthalazine referred to above point out that a greater contribution to the ground state of the mole- cule by the azo relative to the azine system will cause absorption to occur at longer wavelengths.
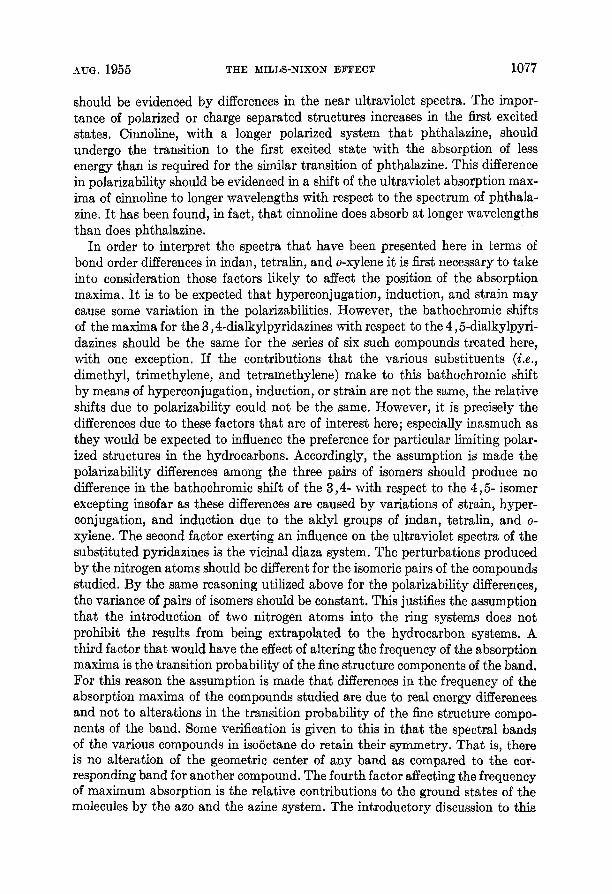
It is this fact which is responsible for the spectral differences noted herein and which makes possible an assignment of relative bond orders. The spectra observed in this work should then reveal any significant differences in the bond orders of the two adjacent bonds 1 and 2 (in I) for indan, tetralin, and o-xylene.
I
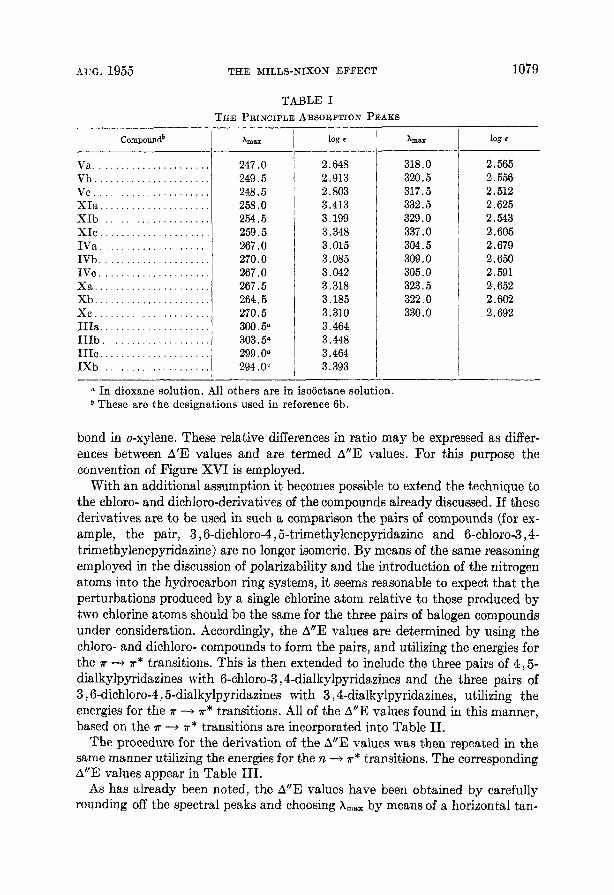
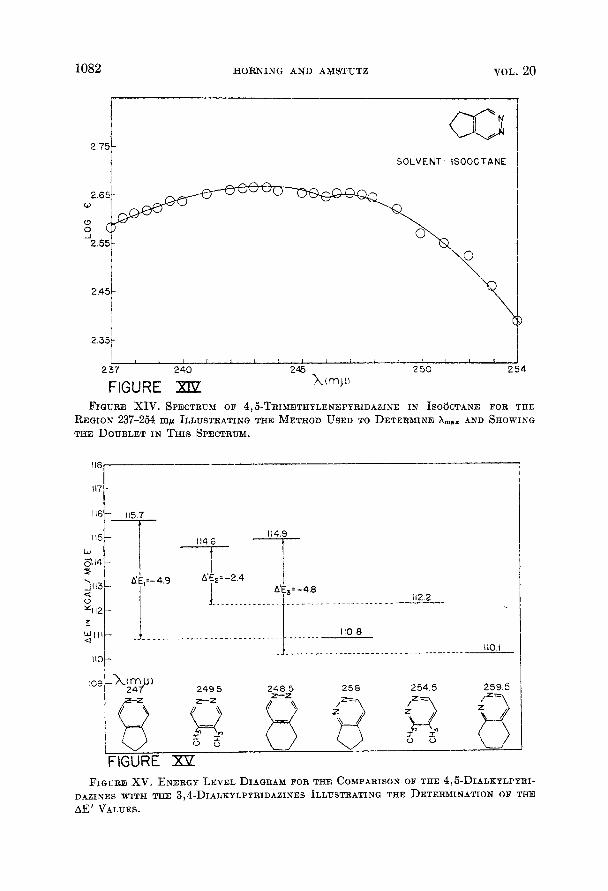
The wavelength maxima were determined by plotting the region of the peak on an expanded basis, as in Figure XIV, and then finding the horizontal tangent, The only case in which there was any difficulty experienced in choosing the peak was for the one a t about 245 mp for 4,5-trimethylenepyridazine. The less ener- getic band of the doublet was chosen as A,, because the proximity of a band be- low 220 mp disproportionately increases the absorbance of the more energetic band of the doublet (10). This, in turn, might be effective in causing the more energetic side of the doublet to have greater absorbance than the other side even though the transition is of lesser probability (7). Furthermore, if the separation between the shoulder on the low energy side of the T 3 T* band and the peak of this band is to be nearly constant for the dialkylpyridazines this same choice must be made. These facts indicate that it is reasonable to choose A,,, for this band a t 247 mp rather than a t 243 mk. The principal absorption peaks chosen by the method of tangents are listed in Table I.
The energy differences corresponding to A,,, for the P 4 P* transition then were set up on an energy level diagram as in Figure XV by converting the energy units to Kcal/mole. The differences in transition energy for pairs of iso- mers were then found as the differences in the energy levels for the isomeric pairs. These differences in transition energy are designated as A’ E values. Grant- ing the assumptions that have been outlined above it is seen that the A‘ E values for the isomeric pairs should all be the same if the relationship between the 1 and 2 bonds (from I) is the same for indan, tetralin, and o-xylene. Figure XV reveals that this is not the case, for A’E1 + A’Ez # A’Ea. Adhering to the con- ventions employed on the energy level diagram a lower A’E value corresponds to the fact that the 3,4-dialkyl isomer of the pair with the lower A’E value absorbs energy a t a relatively longer wavelength. This implies that the bond order ratio of the 2 bond to the 1 bond in the isoelectronic hydrocarbons is greater for the hydrocarbon of greater molecular weight. For example, A’Ei = -4.9 and A’Ez = -2.4. Since A’E1 is lower the implication is that the ratio of the 4-5 to the 5-6 bond in indan is greater than the ratio of the 3-4 to the 4-5
.4UG. 1955 THE MILLS-NIXON EFFECT 1079
TABLE I THE PRINCIPLE ABSORPTION PEAKS
Va . . . . . . . . . . . . . . . . . . . . . .
v c . . . . . . . . . . . . . . . . . . . . . . XIa . . . . . . . . . . . XIb . . . . . . . . . . . . . . . . . . . . . XIC . . . . . . . . . . IVa . . . . . . . . . . . . . . . . . . . . . IVb . . . . . . . . . . . . . . . . . . . . .
X a . . . . . . . . . . . . . . . . . . . . . .
. . . . . . . . . . . . . . . I I Ib . . . . . . . . . . . . . . . . . . . .
IXb . . . . . . . . . . . . . . . . . . . . .
247 .O 249.5 248.5 258.0 254.5 259.5 267.0 270.0 267.0 267.5 264.5 270.5 300.5“ 303. 55 299.0” 294.0“
106
2.648 2.913 2.803 3.413 3.199 3.348 3.015 3.085 3.042 3.318 3.185 3.310 3.464 3.448 3.464 3.393
Xmsx
318.0 320.5 317.5 332.5 329.0 337.0 304.5 309.0 305.0 323.5 322.0 330.0
log €
2.565 2.556 2.512 2.625 2.543 2.605 2.679 2.650 2.591 2.652 2.602 2.692
a In dioxane solution. All others are in isooctane solution. b These are the designations used in reference 6b.
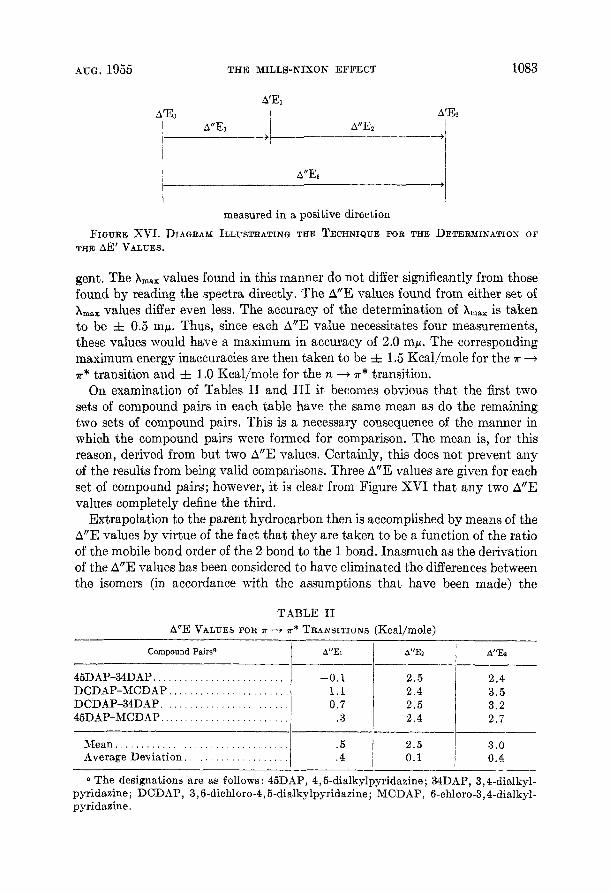
bond in o-xylene. These relative differences in ratio may be expressed as differ- ences between A’E values and are termed A”E values. For this purpose the convention of Figure XVI is employed.
With an additional assumption it becomes possible to extend the technique to the chloro- and dichloro-derivatives of the compounds already discussed. If these derivatives are to be used in such a comparison the pairs of compounds (for ex- ample, the pair, 3,6-dichloro-4 , 5-trimethylenepyridazine and 6-chloro-3 , 4- trimethylenepyridazine) are no longer isomeric. By means of the same reasoning employed in the discussion of polarizability and the introduction of the nitrogen atoms into the hydrocarbon ring systems, it seems reasonable to expect that the perturbations produced by a single chlorine atom relative to those produced by two chlorine atoms should be the same for the three pairs of halogen compounds under consideration. Accordingly, the A”E values are determined by using the chloro- and dichloro- compounds to form the pairs, and utilizing the energies for the ‘IT -+ ‘IT* transitions. This is then extended to include the three pairs of 4,s- dialkylpyridaxines with 6-chloro-3 , 4-dialkylpyridazines and the three pairs of 3,6-dichIoro-4,5-dialkylpyridaxines with 3,4-dialkylpyridazines, utilizing the energies for the ‘IT -+ ‘IT* transitions. All of the A”E values found in this manner, based on the T -+ ‘IT* transitions are incorporated into Table 11.
The procedure for the derivation of the A”E values was then repeated in the same manner utilizing the energies for the n -+ ‘IT* transitions. The corresponding A”E values appear in Table 111.
As has already been noted, the A”E values have been obtained by carefully rounding off the spectral peaks and choosing A,,, by means of a horizontal tan-
1080
4.5
(E): ESTIMATED
HORIVING AND AMSTUTZ
0 2 4 0 2 4 LOG €
I t
I
Ill, v 11. VI
IV
VOL. 20
I
H 2 W WATER 95 '1' ETHANOL ISOOCTANE
FIGURE x[I FIGURE XII. hm, FOR THE DIALKYLPYRIDAZINES I N SOLVENTS OF DIFFERENT POLARITY.
The designations are as follows: I, 4,5-trimethylenepyridaeine; 11, 3,4-trimethylenepyri- dazine; 111, 4,5-dimethylpyridazine; IV, 3,4-dimethylpyridazine; V, 4,5-tetramethylene- pyridazine; VI, 3,4-tetramethylenepyridazine; and P, pyridazine.
AUG. 1955 THE MILLS-NIXON EFFECT 108 1
2 3]---3-k4-
I I SEE FIGUqE XII: FOR DESIG
2401 1 1 I I I I I 0 I 2 3 0 I 2 3
L O G 6 3,6- DICHLORO- PARENT
FIGURE Xm
I I IV
_2r_ I I
JATIONS - 1 2 3
6- C H L O R O -
&IGURE X I I I . hmax FOR THE 3,B-DICHLORO- AND 6-CHLORO-DIALKYLPYRIDAZINES IN ISO~CTANE, INDICATINQ THE FREQUENCY SHIFT ASSOCIATED WITH CHLORINATION. The designations of the parent compounds are aa follows : I, 4,5-trimethylenepyridasine; 11, 3,4-trimethylenepyridaaine; 111, 4,5-dimethylpyridazine; IV, 3,4-dimethypyridazine; V, 4,5-tetramethylenepyridazine; VI, 3,4-tetramethylenepyridazine; snd P, pyridazine.
1082 HORNING AND AMSTUTZ VOL. 20
SOLVENT ISOOCTANE
2.351 3
I4
FIGURE XIV. SPECTRUM OF 4,5-TRIMETHYLENEPYRIDAZINE I N ISOGCTANE FOR THE
REGION 237-254 mp ILLUSTRATING THE METHOD U S E D TO DETERMINE &W,X AND SHOWING TEE DOUBLET IN THIS SPECTRUM.
FIGURE xv. ENERGY LEVEL DIAGRAM FOR THE COMPARISON OF THE 4,Fi-DIALKYLPYRI- DAZINES WITH THE 3,4-DIALHYLPYRIDAZINES ILLUSTRATING THE DETERMINATION OF THE AE' VALUES.
AUG. 1955 THE MILLS-NIXON EFFECT
A”E1 A”Ez -+ -4 A ” E ~
1083
Compound Pairs” I
. . . . . . . . . . . . . . . . . . . . . . . . . 45DAP-34DAP. DCDAP-MCDAP DCDAP-34DAP 45DAP-MCDAP
. . . . . . . . . . . . . . . . . . . . . . . . . . . . . . . . . . . . . . . . . . . . . . . . . . . . . . . . . . . . . . . . . . . . . . . . .
. . . . . . . . . . . . . . . . . . . . . . . . . . . . . . . . . Mean Average Deviation . . . . . . . . . . . . . . . . . . . . -
A”E1 A”EZ A“Ex
-0.1 2 . 5 2.4 1 . 1 2 . 4 3 .5 0.7 2 .5 3.2 .3 2.4 2.7
.5 2 . 5 3.0
. 4 0 .1 0 .4
gent. The A,,, values found in this manner do not differ significantly from those found by reading the spectra directly. The A”E values found from either set of A,,, values differ even less. The accuracy of the determination of A,,, is taken to be f 0.5 mp. Thus, since each A”E value necessitates four measurements, these values would have a maximum in accuracy of 2.0 mp. The corresponding maximum energy inaccuracies are then taken to be =t 1.5 Kcal/mole for the a --+
T* transition and f 1 .O Kcal/mole for the n -+ a* transition. On examination of Tables I1 and I11 it becomes obvious that the first two
sets of compound pairs in each table have the same mean as do the remaining two sets of compound pairs. This is a necessary consequence of the manner in which the compound pairs were formed for comparison. The mean is, for this reason, derived from but two A”E values. Certainly, this does not prevent any of the results from being valid comparisons. Three A”E values are given for each set of compound pairs; however, it is clear from Figure XVI that any two A”E values completely define the third.
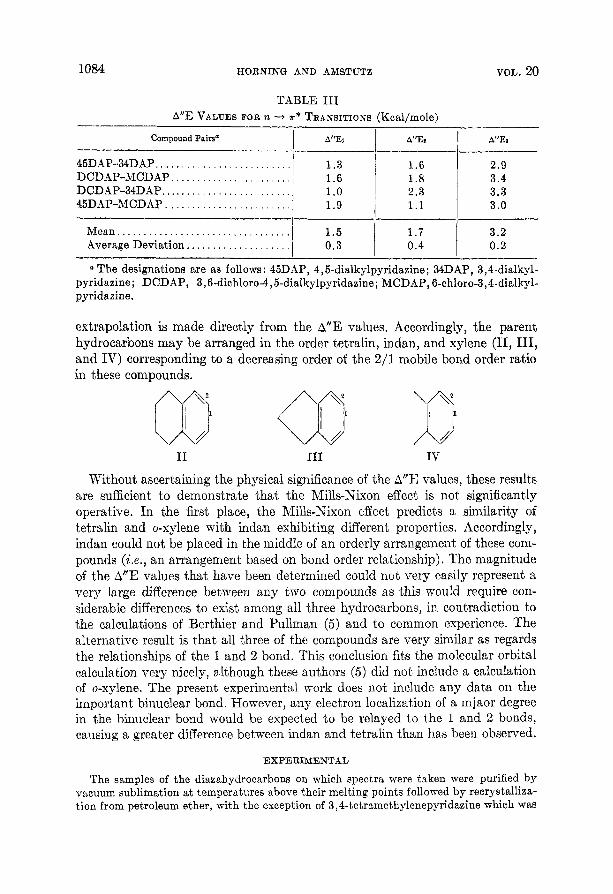
Extrapolation to the parent hydrocarbon then is accomplished by means of the A”E values by virtue of the fact that they are taken to be a function of the ratio of the mobile bond order of the 2 bond to the 1 bond. Inasmuch as the derivation of the A”E values has been considered to have eliminated the differences between the isomers (in accordance with the assumptions that have been made) the
TABLE I1 A”E VALUES FOR T - T* TRANSITIONS (Kcal/mole)
1084
Compound Pairsa
45DAP-34DAP. . . . . . . . . . . . . . . . . . . . . . . . . . DCDAP-MCDAP . . . . . . . . . . . . . . . . . . . . . . . DCDAP-34DAP 45DAP-MCD AP . . . . . . . . . . . . . . . . . . . . . . . .
Mean . . . . . . . . . . . . . . . . . . . . . . . . . . . . . . . . . Average Deviation. . . . . . . . . . . . . . . . . . . .
. . . . . . . . . . . . . . . . . . . . . . . . .
HORNING AND AMSTUTZ
A”Ei
1.3 1.6 1.0 1.9
1.5 0.3
VOL. 20
A‘% __
1.6 1.8 2.3 1.1
TABLE I11 A”E VALUES FOR n -+ R* TRAXSITIONS (Kcal/mole)
A’IEa
2.9 3.4 3.3 3.0
3.2 0.4 l.’ 0.2
The designations are as follows : 45DAP, 4,5-dialkylpyridazine; 34DAP, 3,4-dialkyl- pyridazine; DCDAP, 3,6-dichloro-4,5-dialkylpyridazine; MCDAP, 6-chlor0-3,4-dialkyl- pyridazine.
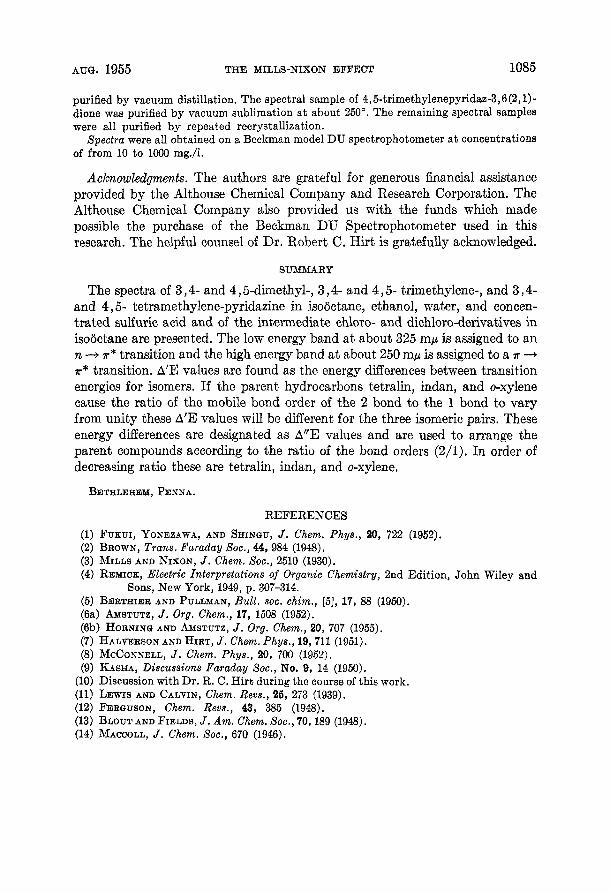
extrapolation is made directly from the A”E values. Accordingly, the parent hydrocarbons may be arranged in the order tetralin, indan, and xylene (11,111, and IV) corresponding to a decreasing order of the 2/1 mobile bond order ratio in these compounds.
I1 I11 I V
Without ascertaining the physical significance of the A”E values, these results are sufficient to demonstrate that the Mills-Nixon effect is not significantly operative. In the first place, the Mills-Nixon effect predicts a similarity of tetralin and o-xylene with indan exhibiting different properties. Accordingly, indan could not be placed in the middle of an orderly arrangement of these com- pounds (Le. , an arrangement based on bond order relationship). The magnitude of the A”E values that have been determined could not very easily represent a very large difference between any two compounds as this would require con- siderable differences to exist among all three hydrocarbons, in contradiction to the calculations of Berthier and Pullman ( 5 ) and to common experience. The alternative result is that all three of the compounds are very similar as regards the relationships of the 1 and 2 bond. This conclusion fits the molecular orbital calculation very nicely, although these authors ( 5 ) did not include a calculation of o-xylene. The present experimental work does not include any data on the important binuclear bond. However, any electron localization of a mjaor degree in the binuclear bond would be expected to be relayed to the 1 and 2 bonds, causing a greater difference between indan and tetralin than has been observed.
EXPERIMENTAL
The samples of the diazahydrocarbons on which spectra were taken were purified by vacuum sublimation at temperatures above their melting points followed by recrystalliza- tion from petroleum ether, with the exception of 3,4-tetramethylenepyridazine which was
AUB. 1955 THE MILLS-NIXON EFFECT 1085
purified by vacuum distillation. The spectral sample of 4,5-trimethylenepyridaz-3,6(2,1)- dione was purified by vacuum sublimation a t about 250”. The remaining spectral samples were all purified by repeated recrystallization.
Spectra were all obtained on a Beckman model DU spectrophotometer a t concentrations of from 10 to 1000 mg./l.
Acknowledgments. The authors are grateful for generous financial assistance provided by the Althouse Chemical Company and Research Corporation. The Althouse Chemical Company also provided us with the funds which made possible the purchase of the Beckman DU Spectrophotometer used in this research. The helpful counsel of Dr. Robert C. Hirt is gratefully acknowledged.
SUMMARY
The spectra of 3 , 4- and 4 , 5-dimethyl-, 3 , 4- and 4,5- trimethylene-, and 3,4- and 4 , 5- tetramethylene-pyridazine in isooctane, ethanol, water, and concen- trated sulfuric acid and of the intermediate chloro- and dichloro-derivatives in isooctane are presented. The low energy band a t about 325 mp is assigned to an n 3 T* transition and the high energy band a t about 250 mp is assigned to a ?r + ?r* transition. A’E values are found as the energy differences between transition energies for isomers. If the parent hydrocarbons tetralin, indan, and o-xylene cause the ratio of the mobile bond order of the 2 bond to the 1 bond to vary from unity these A’E values will be different for the three isomeric pairs, These energy differences are designated as A”E values and are used to arrange the parent compounds according to the ratio of the bond orders (2/1). In order of decreasing ratio these are tetralin, indan, and o-xylene.
BETHLEHEM, PENNA.
REFERENCES (1) FUEUI, YONEZAWA, AND SHINGU, J. Chem. Phys., 20, 722 (1952). (2) BROWN, Trans. Faraday Soc., 44,984 (1948). (3) MILLS AND NIXON, J. Chem. soc., 2510 (1930). (4) REMICK, Electric Interpretations of Organic Chemistry, 2nd Edition, John Wiley and
(5) BERTHIER AND PULLMAN, BUZZ. SOC. chim., [5], 17, 88 (1950). (6a) AYSTUTZ, J. Org. Chem., 17, 1508 (1952). (6b) HORNING AND AMSTUTZ, J. Org. Chem., 20, 707 (1955). (7) HALVERSON AND HIRT, J. Chem. Phys., 19,711 (1951). (8) MCCONNELL, J . Chem. Phys., 20, 700 (1952). (9) KASHA, Discussions Faraday Soc., No. 9, 14 (1950).
Sons, New York, 1949, p. 307-314.
(10) Discussion with Dr. R. C. Hirt during the course of this work. (11) LEWIS AND CALVIN, Chem. Revs., 26, 273 (1939). (12) FERGUSON, Chem. Revs., 43, 385 (1948). (13) BLOUT AND FIELDS, J. Am. Chem. Soc., 70,189 (1948). (14) MACCOLL, J . Chem. Soc., 670 (1946).