Embed Size (px)
Citation preview
Electron Commer ResDOI 10.1007/s10660-014-9138-3
The moderating role of income on consumers’preferences and usage for online and offline paymentmethods
Eric W. K. See-To · Savvas Papagiannidis ·J. Christopher Westland
© Springer Science+Business Media New York 2014
Abstract In this paper we examine consumer attitudes towards a payment method,which is a key factor affecting the probability of completing a transaction offline andonline. More specifically, we constructed a model that surveyed the offline and onlineusage of prepaid e-cash, debit cards, credit cards and cash. User perceptions of theattractiveness of e-cash and various traditional payment means were also empiricallyassessed. Consumer attitudes towards a payment technology were found to be influ-ential on users’ perceptions in both online and offline environments. User perceptionsof offline purchases with a payment technology had significant and positive effectson the corresponding online usage perceptions. The effects of our research model arecontingent on the income level of users. Our findings have significant implications,as they could help shed light on why consumers abandon their shopping carts and donot complete their transactions, which could potentially play a significant role whenit comes to designing applications targeting sspecific consumer segments.
Keywords Income · Payment methods · Payment preferences · Electronic cash
E. W. K. See-ToDepartment of Industrial & Systems Engineering,The Hong Kong Polytechnic University, Hung Hom, Kowloon, Hong Konge-mail: [email protected]
S. Papagiannidis (B)Newcastle University Business School, 5 Barrack Road, Newcastle upon Tyne NE1 4SE, UKe-mail: [email protected]; [email protected]
J. C. WestlandDepartment of Information and Decision Sciences, University of Illinois at Chicago,2400 University Hall, 601 South Morgan Street, MC 294, Chicago, IL 60607-7124, USAe-mail: [email protected]
123
E. W. K. See-To et al.
1 Introduction
The online consumer behaviour literature tends to study antecedents of the attitudetowards shopping over the Internet and factors affecting user behaviour when doingso. Our research objective is to contribute to this body of research by examining userpreferences for offline and online payment methods, which in turn might increase ordecrease the probability of completing a transaction online. We measure how specificcharacteristics of four payment methods (prepaid e-cash, debit cards, credit cards andcash) affect customer attitudes towards these payment methods and, more specifically,the payment range within which a customer is willing to complete transactions witheach one of them. We also examine how income might affect the payment range. Ourfindings aim to bridge the gap between consumer behaviour research, which doesnot put much emphasis on the payment method itself, finance and finance marketingliterature, which does the opposite by focusing much of the discussion on the paymentmethods and their properties, and finally computing science, which is solely concernedwith the technical aspects of the payment method, primarily security.
After the introduction, the paper continues with a review of the relevant onlineconsumer behaviour and shopping cart abandonment literature. We examine paymentpreferences in more detail, reviewing how the selection of the payment method couldaffect concerns about trust and payment convenience. We then present the theoreticalmodel before discussing our findings and their implications. The paper concludes byoffering suggestions for future research.
2 Literature review
2.1 Why do users abandon their shopping carts?
Over the past few years much effort has been put into researching online consumerbehaviour from many different angles. For example, studies on the determinants ofonline consumer behaviour can be separated into five major domain areas: individ-ual/consumer characteristics, environmental influences, product/service characteris-tics, medium characteristics, and online merchant and intermediary characteristics [5].Factors such as security and trust, time/place convenience, lower prices, ease of search-ing and comparing products, accessibility and usability all affect user attitudes andintention towards buying online. Chang et al (2005), summarising the findings of theeffects of antecedents of attitude toward online shopping, found that there was a sig-nificant positive impact in all the studies examined for overall trust, while a significantnegative impact was found for risk perception. In addition, the shopping experience(effort, compatibility, playfulness) had a significant positive impact. Not all shoppingintentions will translate into sales, though, with many transactions often stopping astep short, i.e. when the user abandons a populated shopping cart.
Studying shopping cart abandonment, i.e. consumers placing items in their onlineshopping cart without making a purchase during that online shopping session, Kukar-Kinney and Close [23] identified both cognitive and behavioural reasons that affectuser behaviour. More specifically, they found evidence that factors influencing online
123
Moderating role of income on consumers’ preferences
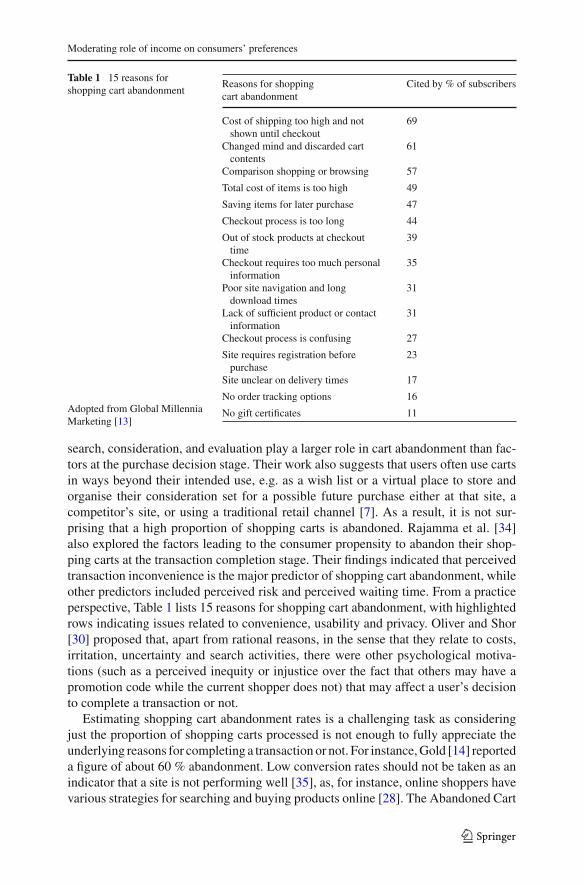
Table 1 15 reasons forshopping cart abandonment
Adopted from Global MillenniaMarketing [13]
Reasons for shoppingcart abandonment
Cited by % of subscribers
Cost of shipping too high and notshown until checkout
69
Changed mind and discarded cartcontents
61
Comparison shopping or browsing 57
Total cost of items is too high 49
Saving items for later purchase 47
Checkout process is too long 44
Out of stock products at checkouttime
39
Checkout requires too much personalinformation
35
Poor site navigation and longdownload times
31
Lack of sufficient product or contactinformation
31
Checkout process is confusing 27
Site requires registration beforepurchase
23
Site unclear on delivery times 17
No order tracking options 16
No gift certificates 11
search, consideration, and evaluation play a larger role in cart abandonment than fac-tors at the purchase decision stage. Their work also suggests that users often use cartsin ways beyond their intended use, e.g. as a wish list or a virtual place to store andorganise their consideration set for a possible future purchase either at that site, acompetitor’s site, or using a traditional retail channel [7]. As a result, it is not sur-prising that a high proportion of shopping carts is abandoned. Rajamma et al. [34]also explored the factors leading to the consumer propensity to abandon their shop-ping carts at the transaction completion stage. Their findings indicated that perceivedtransaction inconvenience is the major predictor of shopping cart abandonment, whileother predictors included perceived risk and perceived waiting time. From a practiceperspective, Table 1 lists 15 reasons for shopping cart abandonment, with highlightedrows indicating issues related to convenience, usability and privacy. Oliver and Shor[30] proposed that, apart from rational reasons, in the sense that they relate to costs,irritation, uncertainty and search activities, there were other psychological motiva-tions (such as a perceived inequity or injustice over the fact that others may have apromotion code while the current shopper does not) that may affect a user’s decisionto complete a transaction or not.
Estimating shopping cart abandonment rates is a challenging task as consideringjust the proportion of shopping carts processed is not enough to fully appreciate theunderlying reasons for completing a transaction or not. For instance, Gold [14] reporteda figure of about 60 % abandonment. Low conversion rates should not be taken as anindicator that a site is not performing well [35], as, for instance, online shoppers havevarious strategies for searching and buying products online [28]. The Abandoned Cart
123
E. W. K. See-To et al.
Syndrome (ACS) [10,29], as it is often called in the literature, can make a significantdifference to retailers. As far as the checkout stage is concerned, this mainly revolvesaround issues such as shipping, customer relations (e.g. account management) and ofcourse payment type, which can be the most mundane part of the online experience.For example, even for intangible products for which no physical delivery is needed,customers may have to enter their credit card details, including their full address, inorder to complete the payment, which raises trust and convenience issues. Conse-quently, understanding consumer preference for various payment methods is crucial,as their attributes could potentially play a catalytic role in completing transactionsfor purchasing products and services online. Early evidence suggests a fragmentedlandscape with users’ preferences being split among various payment modes such ascash on delivery, credit cards, cheques, cash cards among others [24]. Given the rapiddevelopment of electronic commerce and the ever increasing maturity of e-retails ande-consumers, this is an area that requires further investigation.
2.2 Payment method preferences
The literature examining customer payment preference, and more specifically, prefer-ences involving electronic transactions and cash (e-cash), revolves around the follow-ing axes: research that studies the topic on a market level (e.g. [39,40,45]), research thatexamines specific schemes [20,22,33,41,42], country cases and in particular in rela-tion to e-commerce applications [6,12,17,36,53,54] or the technology/methodologyitself (e.g. see [47–49]) and finally research that is interested in the user and the factorsthat affect decision making. Before discussing the last category in more detail, it isworth first defining electronic money (cash or currency), which encompasses storedvalue cards (that hold their value in a physical device), e-coins (prepaid electronictokens that represent fixed amounts of value) and online e-purses (essentially elec-tronic bank accounts) [36]. Shy and Torkka [40] define electronic cash as a means ofpayment with the following two characteristics: first, payments made with it at thepoint of sale are electronically settled and not manually performed and, second, theydo not involve significant bookkeeping or verification costs in any central registry.More specifically in relation to prepaid cards, Chakravorti and Lubasi [4] note thatthey allow purchasers to transfer funds that are accessed electronically when goodsand services are bought by recipients. They also allow recipients without relation-ships with financial institutions to make electronic payments and, finally, they enablepurchasers to restrict the types of merchants or the products that can be bought.
Foscht et al. [11], examining debit and credit card usage and satisfaction, concludedthat a person’s preference for a particular payment method is dependent on personalcharacteristics, with the payment method’s features and characteristics influencing itsdesirability and acceptance. They also reported that a person’s expectations had animpact on the attitude toward the payment method, with positive expectations, per-formance, and desires leading to customer satisfaction, which, in turn, led to a higherdegree of intent to use the payment method and a higher degree of intent to recommendthe payment method. Penz et al. [32] studied consumers’ acceptance of the electronicpurse, cash and established non-cash payment systems in Austria, by analysing social
123
Moderating role of income on consumers’ preferences
representations of payment facilities. Their findings suggest that the means of paymentare categorised in two dimensions: cash and non-cash, with the latter characterisedby high abstraction levels, and loss of subjective control over expenditures. Theyalso offered three reasons as to why, although people increasingly preferred non-cashpayment systems to cash, they remained reluctant to use the electronic purse, whichwas perceived as very dissimilar to other means of payments: (1) the electronic pursehad only limited applicability and thus failed to offer a USP, (2) people had onlyfragmentary knowledge about how and when to use the electronic purse and (3) theelectronic purse was considered to be a highly abstract means of payment, leading tolow subjective control and reduced transparency of transactions.
Although the case of one country may not be generalisable, their findings illustratesome key elements in the success of payment technology schemes. Van Hove [45],studying 16 European electronic purse schemes, concluded that a successful schemetends to be one that is active in a relatively small country, where debit cards are fairlypopular, but function in on-line mode, where all players quickly agreed upon a commonsolution so that there were no incompatibility problems. In addition, such schemeswere more likely to be successful if all major banks participated in the scheme andproved to be completely committed, and where the e-purse project received supportfrom players in at least one and possibly several of the following sectors: publictelephones, parking meters, vending machines, and public transport. On the otherhand, Westland [52], surveying merchant and customer preferences for cash, nearcash, and electronic cash (e-cash), reported a clear preference: ordering with cashand credit cards being preferred to e-cash, and e-cash being preferred to debit cardsand hybrids. He concluded that e-cash was unlikely to compete well against cash andcredit cards because of the switching costs, technology risk, and insufficient marketdifferentiation. His results suggest that there may not be a market niche for e-cash,but instead, successful products are likely to emerge in the form of vertical marketcash substitutes that meet specific objectives. Jonker [18], aiming to identify price andnon-price features of payment instruments that can be used to stimulate the use ofelectronic payment cards, reported that their attractiveness can be increased throughtechnological modifications that enhance their convenience, by increasing the numberof acceptance points and making it less expensive for consumers to pay with paymentcards could also increase the usage of payment cards.
As far as repeated micropayments are concerned, for which e-cash is often used(e.g. for public transport), the longitudinal effects should also be considered. Auhet al. [1] suggest that for a purchase to occur, the pleasure of consumption should beat least equal to or greater than the pain of payments aggregated across the useful lifeof a product. At the point of purchase, consumers should base their decisions on thenet present value of pleasure and pain. Still, they found that consumers are sensitiveto not only the total sum of their pleasure and pain, but also to their microstructures[1]. Finally, Hussein et al. [16], exploring the effect that credit card payment systemsmay have on e-business adoption, found evidence of users being reluctant to use acredit card as the main method of payment for online purchases, although this wasless emphatic if they owned at least one card. Instead, they preferred cash on delivery,which they perceived as a more convenient, familiar and therefore trusted method ofpayment.
123
E. W. K. See-To et al.
When it comes to demographics, Jonker [18] reported that income and educationallevels are also significant factors in the choice of payment methods as the higher aperson’s income and educational level, the more “modern” their payment behaviouris. In addition, keeping track of expenses may be more important for the lower incomecategories (net monthly household income belowe1800), which usually include peo-ple educated to lower and medium levels, while in contrast higher income categoriesmay prefer the ease of paying by debit card. Moreover, people with a low or mediumhousehold income have a 6–9 % lower probability of being a frequent credit cardpayer, compared to people with a high household income [18]. Demographics werefound to be of importance when it came to selecting the payment method in other stud-ies. For instance, Carow and Statena [3] analysed the consumer’s payment option touse debit, general purpose credit cards, gasoline credit cards, or cash, concluding thatconsumers are more likely to use cash when they have less education, lower incomes,are middle-aged, and own fewer credit cards, while on the hand debit and credit cardusers are younger, more educated, and hold more credit cards. Borzekowski et al. [2]also found that education was predictive of debit card use among checking accountholders, but, with the exception of lower card use for the lowest income category,income was not a strong predictor of debit card use.
3 Methodology
3.1 Research model
Payment preferences can vary significantly from case to case, with demographicsplaying an important role. To gain new insights into consumer preferences as regardspayment methods used, in this paper we focus on trust and convenience, in particularexamining how electronic payment methods can potentially affect online transactions.Previous research into the design of payment technologies demonstrated that peoplebring to bear very different kinds of reasons when making judgments about technolo-gies and that apart from trust and security, other kinds of issue, like ease of use andconvenience, or social ones, may be equally or even more important [21]. Such per-ceptions can make a significant difference in the choice of payment method used tocomplete a transaction. For instance on eBay if the uncertainties surrounding a productcan be reduced (e.g. whether the product is used or new, whether it is still under war-ranty, and the degree to which it is a “look and feel” product), the probability of usingcredit cards will increase, otherwise cash equivalents will be more likely to be adopted[55]. In the context of this study, trust includes constructs such as security and privacy,while convenience mostly refers to transacting convenience, which is of key impor-tance when it comes to micropayments for intangible digital products and services.We argue that a payment technology’s attributes have the potential to minimise pay-ment security concerns, while offering anonymity during the payment process, whichcould increase trust by minimising the perceived risk of loss of privacy. In such a case,customers would be more willing to make high-amount payments and hence the upperbound of the amount a customer is willing to pay to a seller using a specific paymentmethod could act as a proxy for measuring trust. It requires a higher level of trust for
123
Moderating role of income on consumers’ preferences
a consumer to be willing to use a payment method for a higher transaction amount.Transacting convenience, on the other hand, will not influence this upper bound deci-sion. However, one might be more willing to use a payment method for small andmicro payments if it is convenient enough, both in terms of the monetary transactioncosts involved and the effort put into completing the transaction itself. Even thoughprice alone does not necessarily reflect the consumer’s perceived value, it could beargued that the lower the product or service cost, the more convenience will matter, asotherwise the overall transaction cost will increase. A higher level of transacting con-venience will therefore encourage a consumer to pay smaller transaction values with apayment method—hence a smaller lower bound of payment range. Consequently, wecan use the lower bound of the amount a customer is willing to pay to a seller usinga specific payment method to act as a proxy for measuring transacting convenience.When it comes to electronic payment technology, there is typically a low transactioncost, since completing a transaction usually involves inserting a card or touching thecard to a reader. Not having to register or fill in lengthy payment forms can increaseusability and in turn convenience. Finally, as far as prices are concerned, we assume,as we are only looking at preferred payment methods for transacting, that there is anintention to buy, implicitly suggesting that the price is acceptable for the consumer.
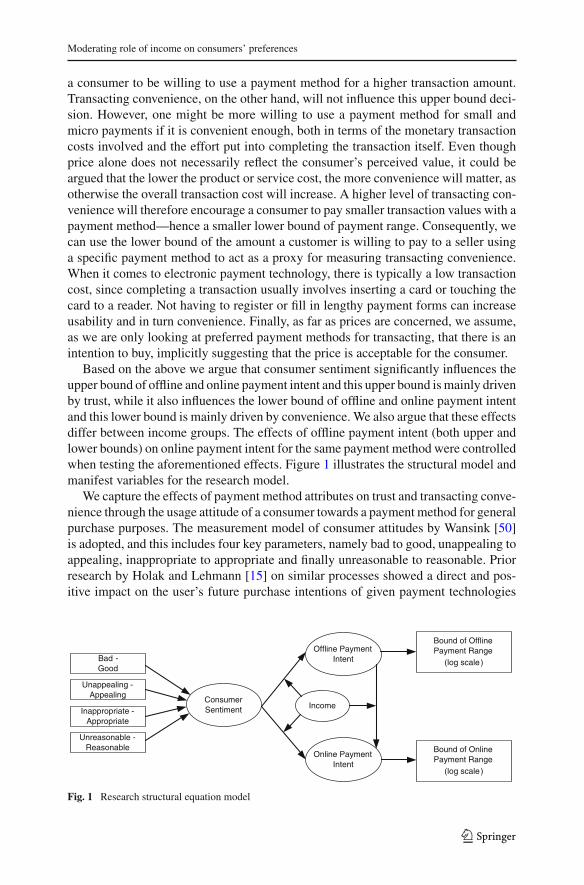
Based on the above we argue that consumer sentiment significantly influences theupper bound of offline and online payment intent and this upper bound is mainly drivenby trust, while it also influences the lower bound of offline and online payment intentand this lower bound is mainly driven by convenience. We also argue that these effectsdiffer between income groups. The effects of offline payment intent (both upper andlower bounds) on online payment intent for the same payment method were controlledwhen testing the aforementioned effects. Figure 1 illustrates the structural model andmanifest variables for the research model.
We capture the effects of payment method attributes on trust and transacting conve-nience through the usage attitude of a consumer towards a payment method for generalpurchase purposes. The measurement model of consumer attitudes by Wansink [50]is adopted, and this includes four key parameters, namely bad to good, unappealing toappealing, inappropriate to appropriate and finally unreasonable to reasonable. Priorresearch by Holak and Lehmann [15] on similar processes showed a direct and pos-itive impact on the user’s future purchase intentions of given payment technologies
Bad -Good
Unappealing -Appealing
Inappropriate -Appropriate
Unreasonable -Reasonable
Consumer Sentiment
Offline Payment Intent
Online Payment Intent
Bound of Offline Payment Range
(log scale)
Bound of Online Payment Range
(log scale)
Income
Fig. 1 Research structural equation model
123
E. W. K. See-To et al.
used in different contexts. In innovation diffusion research, perceived compatibility—which varies by payment context—was found to be influential on adoption decisions(1995). Rogers [37] argues that particular technology use needs to be consistent withconsumer values, socio-cultural beliefs and prior and present experiences. When anew and an existing application were closely linked to each other, prior experienceof the existing one would correlate strongly with the adoption of the new one [9,25].In various technology diffusion and adoption studies, prior experience was shown tobe influential (e.g. [8,19,43,44,46]). In the context of online purchases, it was alsovalid as shown by various studies (e.g. [26,27,31]). Hence, we expected the perceivedtrust and transacting convenience of a particular payment technology offline to havea positive impact on the corresponding online perceptions.
3.2 Data collection and sampling
An online survey was conducted in a metropolitan city, using 1-week’s records from thedatabase of a locally based contactless prepaid electronic payment technology. Whenundertaking the survey, the plan of the local electronic payment vendor was to build anonline version, which would work as follows. Firstly, a personal card reader would beprovided and attached to the consumer’s computer through a USB port. The consumerwould pay by putting the prepaid card into the personal reader, following exactly thesame procedure of using the card offline. The online merchant would then processthe information sent from the consumer’s side and complete the transactions just likethe physical one. An online video demonstrating the process was shown to surveyrespondents to help them understand this possibility and answer the related questions.
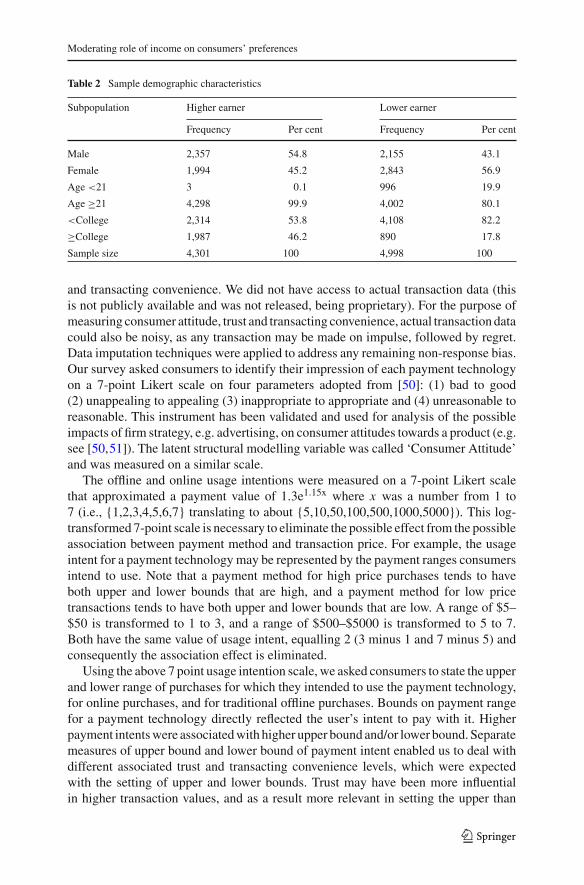
The research location has 100 % Internet penetration and 94 % computer literacyrate in the population. Prepaid card holders were invited to participate in the surveyby email. Respondents completed the survey by clicking on a direct link, embeddedin the e-mail, pointing to the web-based questionnaire. To encourage participation,and a completed and accurate response, monetary incentives were provided througha Chinese-style lottery called a “lucky draw”. The online survey lasted for 4 weeks.It attracted a total of 4,301 usable responses from higher earners (income ≥ 100 K inlocal currency), and 4,998 usable responses from lower earners (income ≤ 100 K).Demographic profiles for age, gender and income were used to compare the respon-dents with demographics of the research location. The demographic profiles were verysimilar, indicating good representativeness of the survey dataset. Table 2 below showsthe demographic profiles of the two subpopulations in terms of gender, education andincome levels. Gender distributions are very similar across the two subpopulations.Age and education levels are two other possible demographic factors for control. Thereare clear associations between income group, and age and education levels. The major-ity of higher earners were over 21, and had a college degree. This is probably to beexpected, as earning power is partly determined by age and education.
3.3 Measurements
All data represents intent to use. Data was collected specifically to investigate threesubjective and indirectly observable behavioural quantities—consumer attitude, trust
123
Moderating role of income on consumers’ preferences
Table 2 Sample demographic characteristics
Subpopulation Higher earner Lower earner
Frequency Per cent Frequency Per cent
Male 2,357 54.8 2,155 43.1
Female 1,994 45.2 2,843 56.9
Age <21 3 0.1 996 19.9
Age ≥21 4,298 99.9 4,002 80.1
<College 2,314 53.8 4,108 82.2
≥College 1,987 46.2 890 17.8
Sample size 4,301 100 4,998 100
and transacting convenience. We did not have access to actual transaction data (thisis not publicly available and was not released, being proprietary). For the purpose ofmeasuring consumer attitude, trust and transacting convenience, actual transaction datacould also be noisy, as any transaction may be made on impulse, followed by regret.Data imputation techniques were applied to address any remaining non-response bias.Our survey asked consumers to identify their impression of each payment technologyon a 7-point Likert scale on four parameters adopted from [50]: (1) bad to good(2) unappealing to appealing (3) inappropriate to appropriate and (4) unreasonable toreasonable. This instrument has been validated and used for analysis of the possibleimpacts of firm strategy, e.g. advertising, on consumer attitudes towards a product (e.g.see [50,51]). The latent structural modelling variable was called ‘Consumer Attitude’and was measured on a similar scale.
The offline and online usage intentions were measured on a 7-point Likert scalethat approximated a payment value of 1.3e1.15x where x was a number from 1 to7 (i.e., {1,2,3,4,5,6,7} translating to about {5,10,50,100,500,1000,5000}). This log-transformed 7-point scale is necessary to eliminate the possible effect from the possibleassociation between payment method and transaction price. For example, the usageintent for a payment technology may be represented by the payment ranges consumersintend to use. Note that a payment method for high price purchases tends to haveboth upper and lower bounds that are high, and a payment method for low pricetransactions tends to have both upper and lower bounds that are low. A range of $5–$50 is transformed to 1 to 3, and a range of $500–$5000 is transformed to 5 to 7.Both have the same value of usage intent, equalling 2 (3 minus 1 and 7 minus 5) andconsequently the association effect is eliminated.
Using the above 7 point usage intention scale, we asked consumers to state the upperand lower range of purchases for which they intended to use the payment technology,for online purchases, and for traditional offline purchases. Bounds on payment rangefor a payment technology directly reflected the user’s intent to pay with it. Higherpayment intents were associated with higher upper bound and/or lower bound. Separatemeasures of upper bound and lower bound of payment intent enabled us to deal withdifferent associated trust and transacting convenience levels, which were expectedwith the setting of upper and lower bounds. Trust may have been more influentialin higher transaction values, and as a result more relevant in setting the upper than
123
E. W. K. See-To et al.
the lower bound of the intended payment range. Transacting convenience may havebeen more influential in smaller transaction values, and consequently more relevantin setting the lower than the upper bound of the intended payment range. Harmon’sone-factor tests were run on the responses to check that there were no misconstructedor omitted factors which might undermine the causal relationships proposed in thestructural equation model. Cronbach’s alpha was computed for the latent construct toassess the reliability. The alpha coefficient was greater than 0.80, indicating a reliablemeasurement model for the latent construct.
4 Results and findings
4.1 Overall fit of the research model
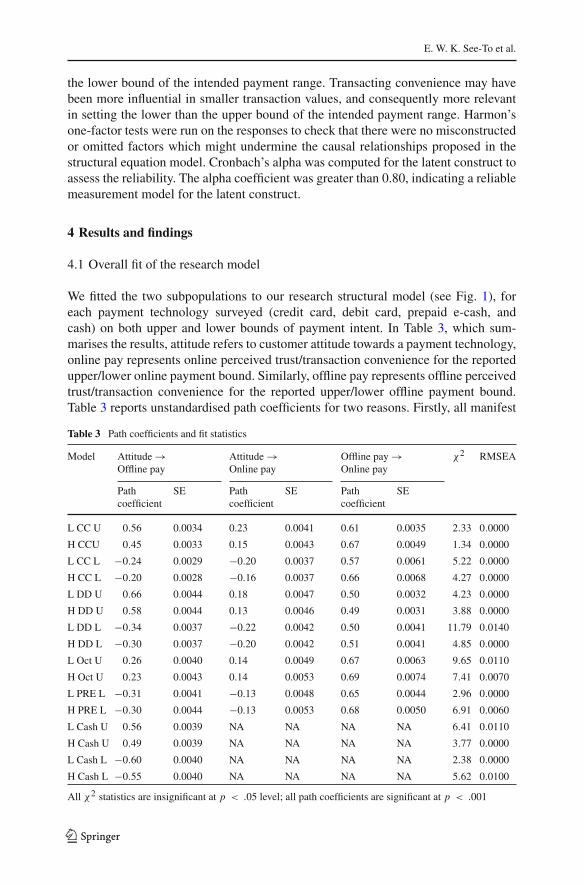
We fitted the two subpopulations to our research structural model (see Fig. 1), foreach payment technology surveyed (credit card, debit card, prepaid e-cash, andcash) on both upper and lower bounds of payment intent. In Table 3, which sum-marises the results, attitude refers to customer attitude towards a payment technology,online pay represents online perceived trust/transaction convenience for the reportedupper/lower online payment bound. Similarly, offline pay represents offline perceivedtrust/transaction convenience for the reported upper/lower offline payment bound.Table 3 reports unstandardised path coefficients for two reasons. Firstly, all manifest
Table 3 Path coefficients and fit statistics
Model Attitude →Offline pay
Attitude →Online pay
Offline pay →Online pay
χ2 RMSEA
Pathcoefficient
SE Pathcoefficient
SE Pathcoefficient
SE
L CC U 0.56 0.0034 0.23 0.0041 0.61 0.0035 2.33 0.0000
H CCU 0.45 0.0033 0.15 0.0043 0.67 0.0049 1.34 0.0000
L CC L −0.24 0.0029 −0.20 0.0037 0.57 0.0061 5.22 0.0000
H CC L −0.20 0.0028 −0.16 0.0037 0.66 0.0068 4.27 0.0000
L DD U 0.66 0.0044 0.18 0.0047 0.50 0.0032 4.23 0.0000
H DD U 0.58 0.0044 0.13 0.0046 0.49 0.0031 3.88 0.0000
L DD L −0.34 0.0037 −0.22 0.0042 0.50 0.0041 11.79 0.0140
H DD L −0.30 0.0037 −0.20 0.0042 0.51 0.0041 4.85 0.0000
L Oct U 0.26 0.0040 0.14 0.0049 0.67 0.0063 9.65 0.0110
H Oct U 0.23 0.0043 0.14 0.0053 0.69 0.0074 7.41 0.0070
L PRE L −0.31 0.0041 −0.13 0.0048 0.65 0.0044 2.96 0.0000
H PRE L −0.30 0.0044 −0.13 0.0053 0.68 0.0050 6.91 0.0060
L Cash U 0.56 0.0039 NA NA NA NA 6.41 0.0110
H Cash U 0.49 0.0039 NA NA NA NA 3.77 0.0000
L Cash L −0.60 0.0040 NA NA NA NA 2.38 0.0000
H Cash L −0.55 0.0040 NA NA NA NA 5.62 0.0100
All χ2 statistics are insignificant at p < .05 level; all path coefficients are significant at p < .001
123
Moderating role of income on consumers’ preferences
variables are measured on a 7-point scale. Consequently, all our latent constructs canbe safely assumed to have an implicit 7-point scale too. This makes standardisation ofestimates unnecessary for evaluation of the magnitudes of path coefficients. Secondly,the unstandardised path coefficients can readily be used to examine further the impactsof consumer attitude on payment intents through their average relationship.
The dataset fitted is large, and the χ2 statistic1 and Root Mean Square Error ofApproximation2 (RMSEA) were excellent for modelling fit-to-all subpopulations.The first column in Table 3 describes the model. The coding is read as follows:
• Left Column: Lower earner/Higher earner subpopulation• Middle Column: Credit Card/Debit Card/Prepaid e-cash/Cash usage• Right Column: Upper/Lower spending limit
For instance, “L CC U” is the upper limit of payment intent with a credit card among thelower earner subpopulation. Note that both the χ2 statistic and RMSEA are sensitiveto skewed data distribution and large sample size. As both our lower earner and higherearner samples were very large, the data distributions were skewed due to the natureof 7-point Likert measurements. Despite these limitations, excellent fits were foundacross all models. This is strong evidence supporting the influence of consumer attitudetowards a payment technology on users’ intent to use that payment technology for apurchase of a given magnitude.
4.2 Impact of income on preference
The effect of income constraint was reflected by differences in the path coefficients,which translated into a different influence of consumer attitude on usage intents. Ourfocus of analysis was on the path coefficients. The effects of income constraint weresignificant, as shown by a multi-group analysis with structural equation modelling.For each payment technology and upper or lower limit of payment intent, an H0 andan H1 model were constructed. Under H0, it was assumed that the income groupdifference (lower earner versus higher earner) had no effect on the estimates of theresearch structural model. That is, all path coefficients were equal across lower earnerand higher earner groups. Under H1, path coefficients were free to vary across incomesubpopulations. A χ2 statistic was obtained by subtracting the χ2 statistics of the H1model from the H0 model. If H0 was supported, the difference in χ2 obtained shouldbe insignificant, implying that the H1 model was no better than the H0 model. If the
1 The χ2 statistic is the traditional fit measure for evaluating the hypothesis H0 : � = �(θ) where � isthe population covariance structure and �(θ) is the covariance structure approximated by the model. Wewould like to accept this hypothesis, so small values of the χ2 statistic are preferred. One idiosyncrasy ofthis statistic is that it tends to be sensitive to, and to increase with, departures from multivariate normality(particularly excessive kurtosis). The fact that our data were ordinals from 1 to 7 implies a skewness whichwill tend to increase the value of this particular statistic, even with optimal fit.2 RMSEA provides an indication of the size of error of approximation of �, the population covariancestructure, by �(θ), that of the model, but per degree of freedom, thus taking model complexity into account.Ideally this would be zero, and larger values indicate an inappropriate model; values less than 0.05 reflecta good fit; between 0.05 and 0.08 a mediocre fit; and those above 0.08 reflect a poor fit. Again, skeweddistributions will tend to raise this value.
123
E. W. K. See-To et al.
Table 4 χ2 differences fortesting the effects of income Model χ2 DF p value
CC U (H0) 127.92 27
CC U (H1) 66.13 17
Differences 61.79 10 <.001
CC L (H0) 146.79 27
CC L (H1) 134.38 17
Differences 12.41 10 .2586
DD U (H0) 131.90 27
DD U (H1) 58.17 17
Differences 73.73 10 <.001
DD L (H0) 216.04 27
DD L (H1) 76.10 17
Differences 139.94 10 <.001
Oct U (H0) 119.49 27
Oct U (H1) 29.82 17
Differences 89.67 10 <.001
PRE L (H0) 234.51 27
PRE L (H1) 74.35 17
Differences 160.16 10 <.001
Cash U (H0) 213.10 19
Cash U (H1) 55.85 13
Differences 157.25 6 <.001
Cash L (H0) 148.76 19
Cash L (H1) 51.37 13
Differences 97.39 6 <.001
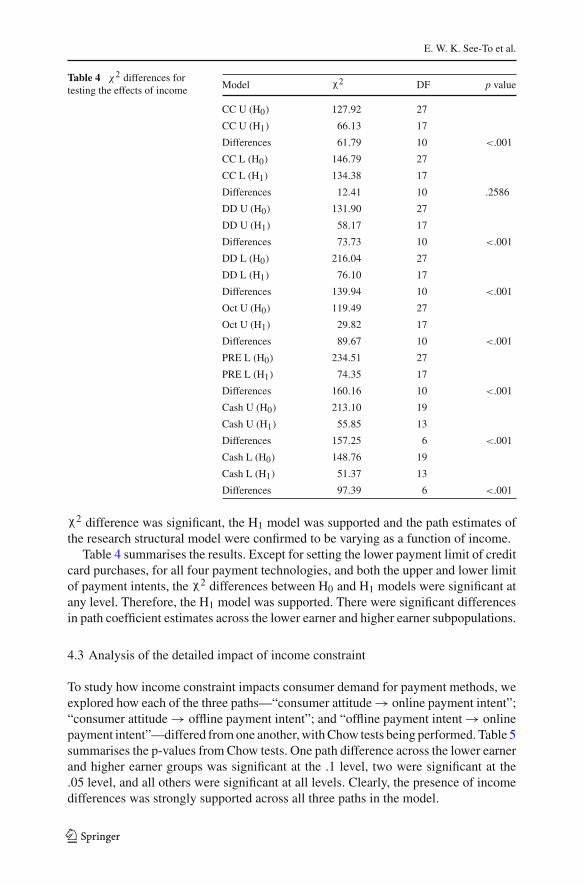
χ2 difference was significant, the H1 model was supported and the path estimates ofthe research structural model were confirmed to be varying as a function of income.
Table 4 summarises the results. Except for setting the lower payment limit of creditcard purchases, for all four payment technologies, and both the upper and lower limitof payment intents, the χ2 differences between H0 and H1 models were significant atany level. Therefore, the H1 model was supported. There were significant differencesin path coefficient estimates across the lower earner and higher earner subpopulations.
4.3 Analysis of the detailed impact of income constraint
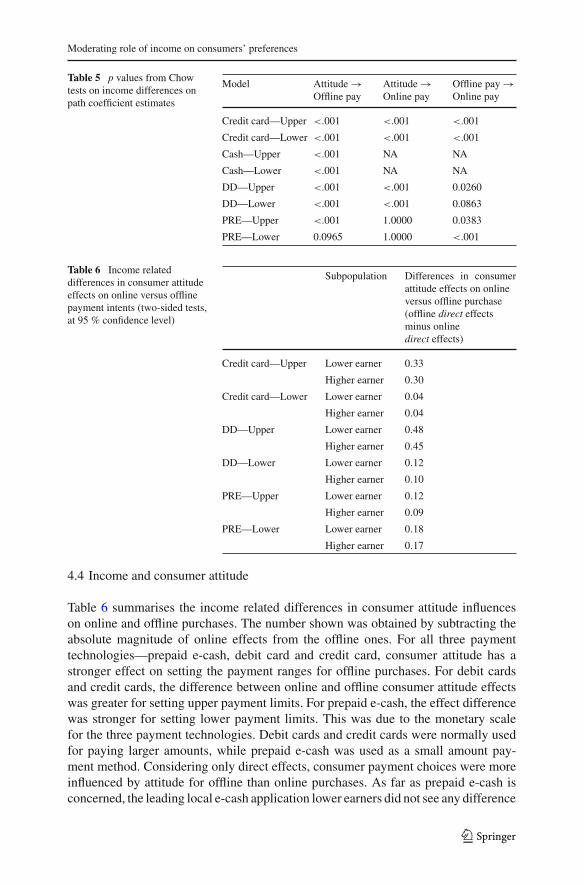
To study how income constraint impacts consumer demand for payment methods, weexplored how each of the three paths—“consumer attitude → online payment intent”;“consumer attitude → offline payment intent”; and “offline payment intent → onlinepayment intent”—differed from one another, with Chow tests being performed. Table 5summarises the p-values from Chow tests. One path difference across the lower earnerand higher earner groups was significant at the .1 level, two were significant at the.05 level, and all others were significant at all levels. Clearly, the presence of incomedifferences was strongly supported across all three paths in the model.
123
Moderating role of income on consumers’ preferences
Table 5 p values from Chowtests on income differences onpath coefficient estimates
Model Attitude →Offline pay
Attitude →Online pay
Offline pay →Online pay
Credit card—Upper <.001 <.001 <.001
Credit card—Lower <.001 <.001 <.001
Cash—Upper <.001 NA NA
Cash—Lower <.001 NA NA
DD—Upper <.001 <.001 0.0260
DD—Lower <.001 <.001 0.0863
PRE—Upper <.001 1.0000 0.0383
PRE—Lower 0.0965 1.0000 <.001
Table 6 Income relateddifferences in consumer attitudeeffects on online versus offlinepayment intents (two-sided tests,at 95 % confidence level)
Subpopulation Differences in consumerattitude effects on onlineversus offline purchase(offline direct effectsminus onlinedirect effects)
Credit card—Upper Lower earner 0.33
Higher earner 0.30
Credit card—Lower Lower earner 0.04
Higher earner 0.04
DD—Upper Lower earner 0.48
Higher earner 0.45
DD—Lower Lower earner 0.12
Higher earner 0.10
PRE—Upper Lower earner 0.12
Higher earner 0.09
PRE—Lower Lower earner 0.18
Higher earner 0.17
4.4 Income and consumer attitude
Table 6 summarises the income related differences in consumer attitude influenceson online and offline purchases. The number shown was obtained by subtracting theabsolute magnitude of online effects from the offline ones. For all three paymenttechnologies—prepaid e-cash, debit card and credit card, consumer attitude has astronger effect on setting the payment ranges for offline purchases. For debit cardsand credit cards, the difference between online and offline consumer attitude effectswas greater for setting upper payment limits. For prepaid e-cash, the effect differencewas stronger for setting lower payment limits. This was due to the monetary scalefor the three payment technologies. Debit cards and credit cards were normally usedfor paying larger amounts, while prepaid e-cash was used as a small amount pay-ment method. Considering only direct effects, consumer payment choices were moreinfluenced by attitude for offline than online purchases. As far as prepaid e-cash isconcerned, the leading local e-cash application lower earners did not see any difference
123
E. W. K. See-To et al.
Table 7 Differences in pathcoefficients (lower earner minushigher earner)
Technology—bound
Attitude →Offline pay
Attitude →Online pay
Offline pay →Online pay
Credit card—Upper 0.11 0.08 −0.06
Credit card—Lower 0.04 0.04 −0.09
Cash—Upper 0.07 NA NA
Cash—Lower 0.05 NA NA
DD—Upper 0.08 0.05 0.01
DD—Lower 0.04 0.02 −0.01
PRE—Upper 0.03 0.00 −0.02
PRE—Lower 0.01 0.00 −0.03
in using it for either online or offline spending. This highlights one possible advantageof e-cash for online usage, i.e. that consumers consider e-cash as a payment method inthe same way, whether online or offline. This is particularly important for online firms,for which lower earners (e.g. young users like students) who may not have access toa debit or credit card, could potentially be a lucrative market segment. For instance,users could use e-cash to buy mobile phone applications or virtual items for use inonline games.
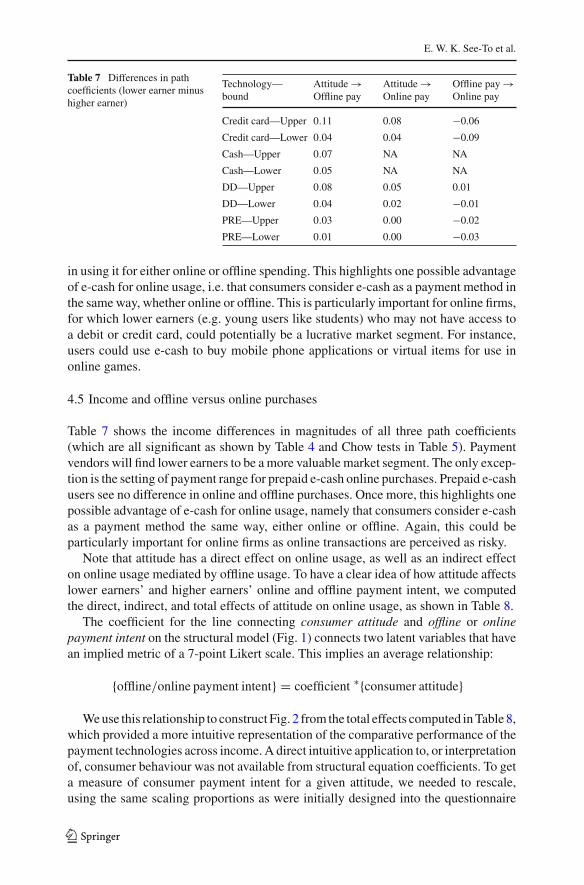
4.5 Income and offline versus online purchases
Table 7 shows the income differences in magnitudes of all three path coefficients(which are all significant as shown by Table 4 and Chow tests in Table 5). Paymentvendors will find lower earners to be a more valuable market segment. The only excep-tion is the setting of payment range for prepaid e-cash online purchases. Prepaid e-cashusers see no difference in online and offline purchases. Once more, this highlights onepossible advantage of e-cash for online usage, namely that consumers consider e-cashas a payment method the same way, either online or offline. Again, this could beparticularly important for online firms as online transactions are perceived as risky.
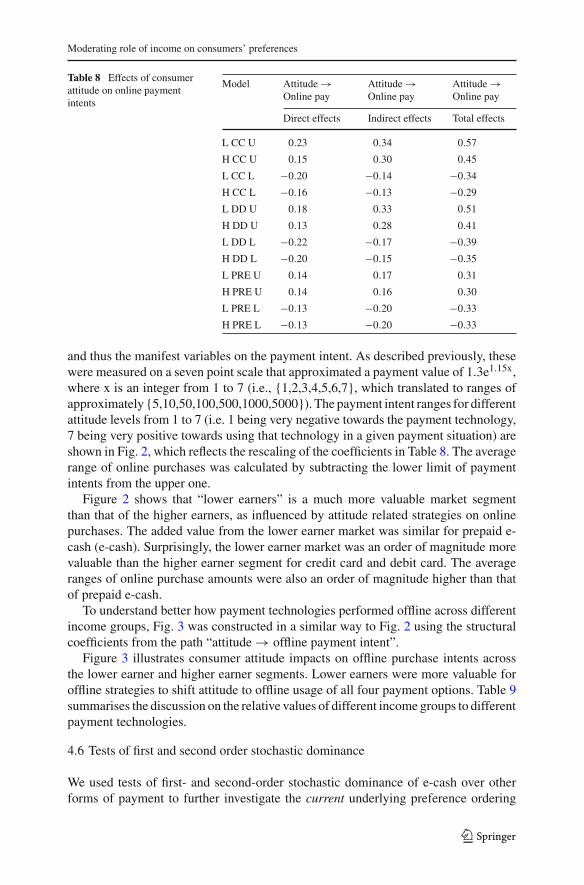
Note that attitude has a direct effect on online usage, as well as an indirect effecton online usage mediated by offline usage. To have a clear idea of how attitude affectslower earners’ and higher earners’ online and offline payment intent, we computedthe direct, indirect, and total effects of attitude on online usage, as shown in Table 8.
The coefficient for the line connecting consumer attitude and offline or onlinepayment intent on the structural model (Fig. 1) connects two latent variables that havean implied metric of a 7-point Likert scale. This implies an average relationship:
{offline/online payment intent} = coefficient ∗{consumer attitude}
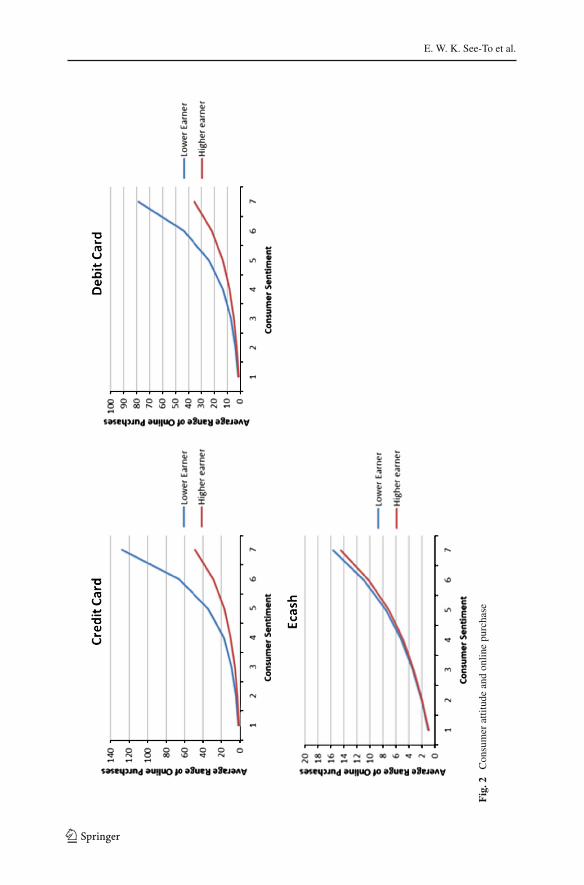
We use this relationship to construct Fig. 2 from the total effects computed in Table 8,which provided a more intuitive representation of the comparative performance of thepayment technologies across income. A direct intuitive application to, or interpretationof, consumer behaviour was not available from structural equation coefficients. To geta measure of consumer payment intent for a given attitude, we needed to rescale,using the same scaling proportions as were initially designed into the questionnaire
123
Moderating role of income on consumers’ preferences
Table 8 Effects of consumerattitude on online paymentintents
Model Attitude →Online pay
Attitude →Online pay
Attitude →Online pay
Direct effects Indirect effects Total effects
L CC U 0.23 0.34 0.57
H CC U 0.15 0.30 0.45
L CC L −0.20 −0.14 −0.34
H CC L −0.16 −0.13 −0.29
L DD U 0.18 0.33 0.51
H DD U 0.13 0.28 0.41
L DD L −0.22 −0.17 −0.39
H DD L −0.20 −0.15 −0.35
L PRE U 0.14 0.17 0.31
H PRE U 0.14 0.16 0.30
L PRE L −0.13 −0.20 −0.33
H PRE L −0.13 −0.20 −0.33
and thus the manifest variables on the payment intent. As described previously, thesewere measured on a seven point scale that approximated a payment value of 1.3e1.15x,where x is an integer from 1 to 7 (i.e., {1,2,3,4,5,6,7}, which translated to ranges ofapproximately {5,10,50,100,500,1000,5000}). The payment intent ranges for differentattitude levels from 1 to 7 (i.e. 1 being very negative towards the payment technology,7 being very positive towards using that technology in a given payment situation) areshown in Fig. 2, which reflects the rescaling of the coefficients in Table 8. The averagerange of online purchases was calculated by subtracting the lower limit of paymentintents from the upper one.
Figure 2 shows that “lower earners” is a much more valuable market segmentthan that of the higher earners, as influenced by attitude related strategies on onlinepurchases. The added value from the lower earner market was similar for prepaid e-cash (e-cash). Surprisingly, the lower earner market was an order of magnitude morevaluable than the higher earner segment for credit card and debit card. The averageranges of online purchase amounts were also an order of magnitude higher than thatof prepaid e-cash.
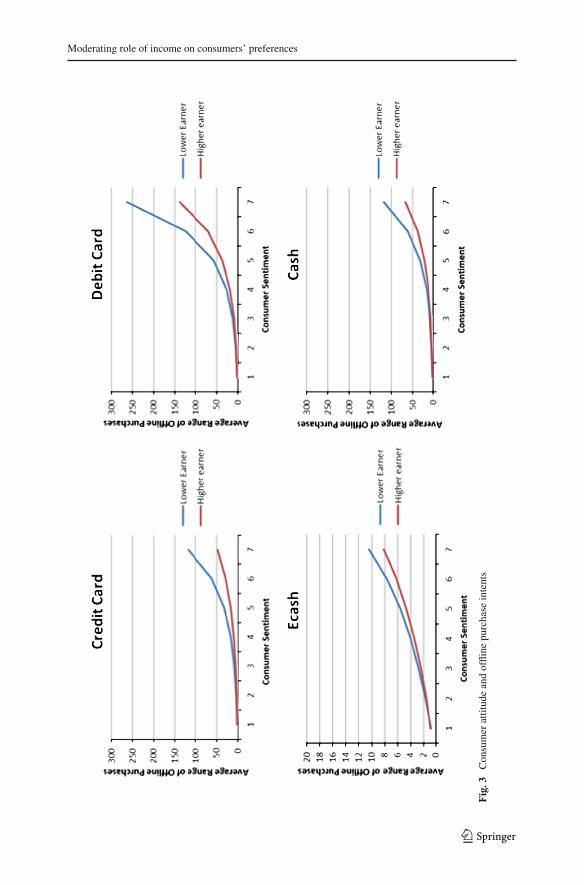
To understand better how payment technologies performed offline across differentincome groups, Fig. 3 was constructed in a similar way to Fig. 2 using the structuralcoefficients from the path “attitude → offline payment intent”.
Figure 3 illustrates consumer attitude impacts on offline purchase intents acrossthe lower earner and higher earner segments. Lower earners were more valuable foroffline strategies to shift attitude to offline usage of all four payment options. Table 9summarises the discussion on the relative values of different income groups to differentpayment technologies.
4.6 Tests of first and second order stochastic dominance
We used tests of first- and second-order stochastic dominance of e-cash over otherforms of payment to further investigate the current underlying preference ordering
123
E. W. K. See-To et al.
Fig
.2C
onsu
mer
attit
ude
and
onlin
epu
rcha
se
123
Moderating role of income on consumers’ preferences
Fig
.3C
onsu
mer
attit
ude
and
offli
nepu
rcha
sein
tent
s
123
E. W. K. See-To et al.
Table 9 More and less valuable income groups for shifting attitude
Offline use Online use
CC Cash PRE DD CC PRE DD
More valuable Lower Lower Lower Lower Lower Lower Lower
earner earner earner earner earner earner earner
Less valuable Higher Higher Higher Higher Higher Higher Higher
earner earner earner earner earner earner earner
of e-cash versus other payment technologies. If e-cash was already preferred by con-sumers, the use of attitudes to shift preferences would be less useful. It is also usefulin identifying areas for improvement and further investment of resources for e-cashvendors. To investigate stochastic dominance, we assumed that consumers exhibitedvon Neumann–Morgansten utilities, which in turn assumed continuity: i.e., if X ispreferred to Y and Y is preferred to Z, then some probability p exists such that p • Xis regarded as being of equal utility to (1 − p) • Z and to the certainty of Y. In thisresearch, we assumed that underlying the responses to the offline and online 7-pointpayment intent scale there was a continuous underlying attitude dimension and thateach response item was monotonically related to that continuum. Hence, the paymentrange intent used in Figs. 2 and 3 in its 7-point format would have the same prop-erty. The exact form could not necessarily be elicited in this study (the granularity ofmeasurement was set by the survey instrument), but a more favourable attitude couldcreate a larger payment intent range. Precedents and justifications have been presentedby Rossi et al. [38].
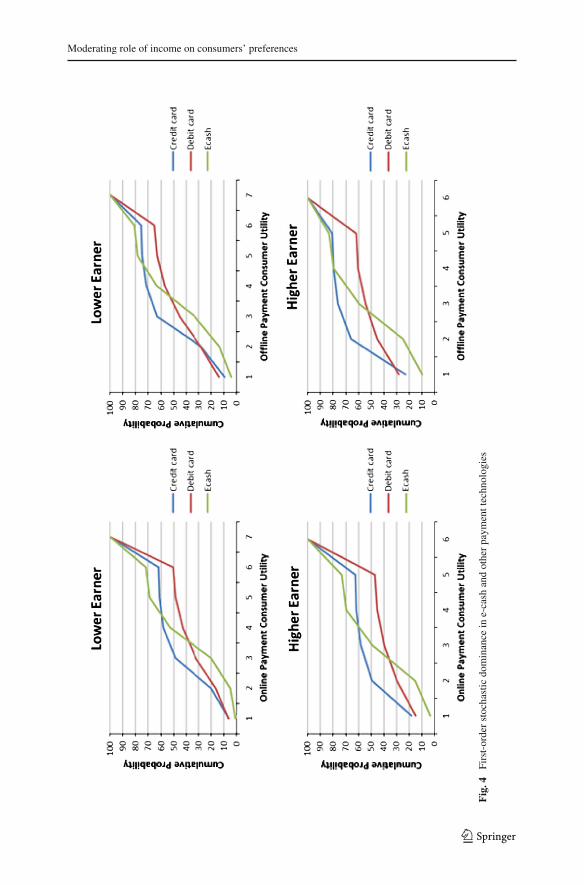
A payment method was stochastically dominant over another if an arbitrary cus-tomer received greater utility from it over all possible outcomes (in this case, the con-sumer payment range intent). First-order stochastic dominance applied to all increasingutility functions (presumably the consumers’ utility increased with an increase in thepayment range intent). A payment method that was preferred with cumulative proba-bility distribution G(U) over all utility levels U ∈ {Ui} would stochastically dominatea payment method that was preferred with cumulative probability distribution F(U)over all utility levels U ∈ {Ui} if G(U) ≤ F(U) for all U∈{Ui} and G(U) < F(U) forat least one U∈ {Ui}.
Figure 4 shows the first-order stochastic dominance curves for the three paymenttechnologies across lower earner and higher earner groups, for both online and offlinepurchases.
There was no clear first-order stochastic preference ordering. Equivocal preferenceorderings are often the result of the failure to incorporate risk aversion into the pref-erence model. Fortunately, it was possible to reassess the preference ordering underan assumption that customers were risk averse. An assumption of risk aversion isespecially appropriate when investigating new technologies such as e-cash. There arealso likely to be differences among income groups in the willingness to accept riskassociated with adopting any new technology. If we assume that consumers had anaversion to bearing technology risk, then second-order stochastic dominance could beused to assess the risk-adjusted preference for the new technology of e-cash. Second-
123
Moderating role of income on consumers’ preferences
Fig
.4Fi
rst-
orde
rst
ocha
stic
dom
inan
cein
e-ca
shan
dot
her
paym
entt
echn
olog
ies
123
E. W. K. See-To et al.
order stochastic dominance assumed upward sloping utility functions that increased ata decreasing rate (i.e., utility was non-decreasing and strictly concave, which impliedthat individuals were risk averse). E-cash with cumulative distribution function G(•)would second-order stochastically dominate payment technologies with F(•) for allrisk-averse consumers if
∫ Ui−∞[G(U ) − F(U )]dU ≤ 0 for all utility levels Ui∈{Ui},
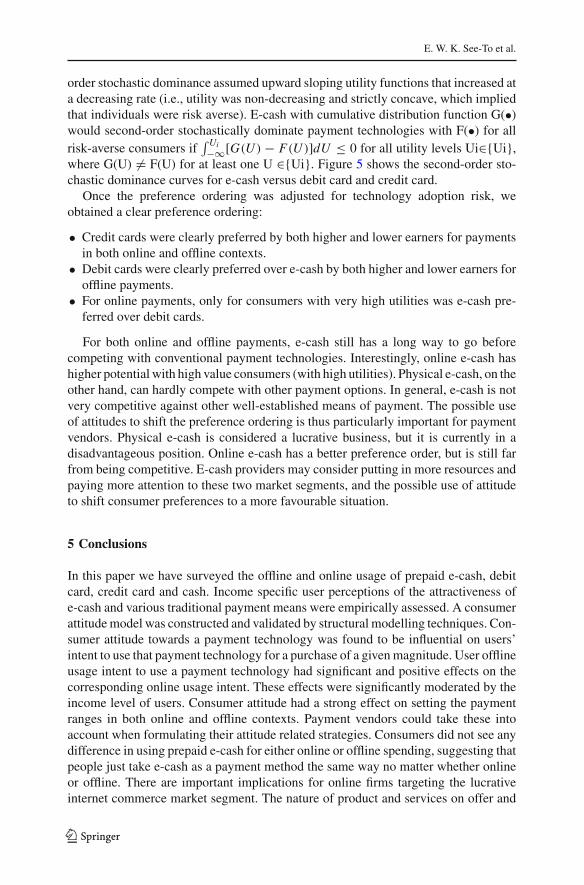
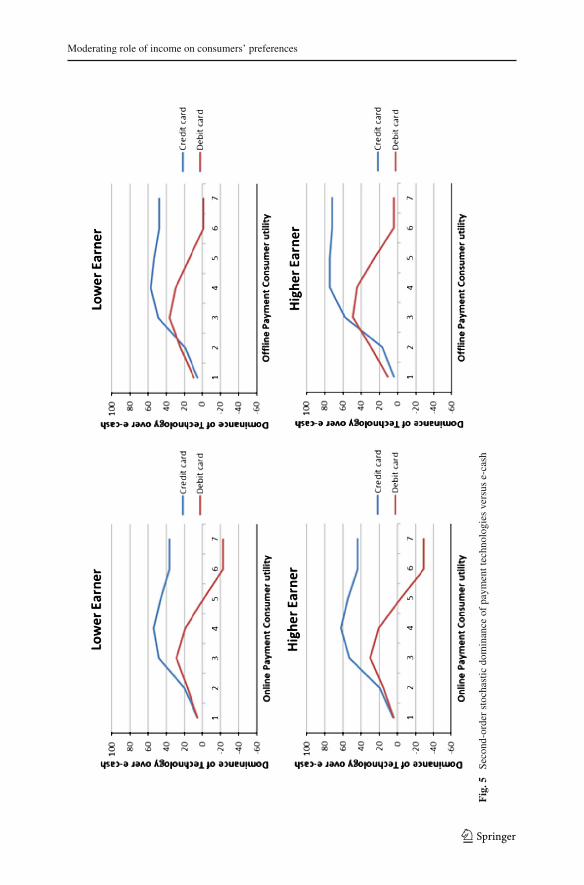
where G(U) �= F(U) for at least one U ∈{Ui}. Figure 5 shows the second-order sto-chastic dominance curves for e-cash versus debit card and credit card.
Once the preference ordering was adjusted for technology adoption risk, weobtained a clear preference ordering:
• Credit cards were clearly preferred by both higher and lower earners for paymentsin both online and offline contexts.
• Debit cards were clearly preferred over e-cash by both higher and lower earners foroffline payments.
• For online payments, only for consumers with very high utilities was e-cash pre-ferred over debit cards.
For both online and offline payments, e-cash still has a long way to go beforecompeting with conventional payment technologies. Interestingly, online e-cash hashigher potential with high value consumers (with high utilities). Physical e-cash, on theother hand, can hardly compete with other payment options. In general, e-cash is notvery competitive against other well-established means of payment. The possible useof attitudes to shift the preference ordering is thus particularly important for paymentvendors. Physical e-cash is considered a lucrative business, but it is currently in adisadvantageous position. Online e-cash has a better preference order, but is still farfrom being competitive. E-cash providers may consider putting in more resources andpaying more attention to these two market segments, and the possible use of attitudeto shift consumer preferences to a more favourable situation.
5 Conclusions
In this paper we have surveyed the offline and online usage of prepaid e-cash, debitcard, credit card and cash. Income specific user perceptions of the attractiveness ofe-cash and various traditional payment means were empirically assessed. A consumerattitude model was constructed and validated by structural modelling techniques. Con-sumer attitude towards a payment technology was found to be influential on users’intent to use that payment technology for a purchase of a given magnitude. User offlineusage intent to use a payment technology had significant and positive effects on thecorresponding online usage intent. These effects were significantly moderated by theincome level of users. Consumer attitude had a strong effect on setting the paymentranges in both online and offline contexts. Payment vendors could take these intoaccount when formulating their attitude related strategies. Consumers did not see anydifference in using prepaid e-cash for either online or offline spending, suggesting thatpeople just take e-cash as a payment method the same way no matter whether onlineor offline. There are important implications for online firms targeting the lucrativeinternet commerce market segment. The nature of product and services on offer and
123
Moderating role of income on consumers’ preferences
Fig
.5Se
cond
-ord
erst
ocha
stic
dom
inan
ceof
paym
entt
echn
olog
ies
vers
use-
cash
123
E. W. K. See-To et al.
the consumer segments targeted can encourage offering those payment methods thatconsumers are more likely to accept, which could in turn increase the probability ofcompleting the transaction and not abandoning the shopping cart. Online and offlinepurchases appeared to be equally different for higher earners and lower earners. Pay-ment vendors may use similar online and offline strategies. “Lower earners” is a morevaluable market segment for payment system vendors, as attitudes had a much strongerdirect effect on both the online and offline payment intents of lower earners.
6 Limitations and future research
Consumer attitude had an impact on behavioural intent that varied greatly acrossincome groups. Much of this variation can be speculated as arising from the perceptionsabout the ease of use and the utility of each particular payment technology. Oneway in which payment methods differ that is likely to influence consumer attitudeoccurs when the consumer actually incurs a wealth transfer—before (prepaid), during(direct payment) or after (deferred payment) the transaction. Cash is a direct paymenttechnology; credit cards are deferred payment methods, where interest accumulateson the balance; debit cards and stored value cards like prepaid e-cash (and e-cashtechnologies in general) are prepaid, because cash must be paid to place a balanceon the card, or into the associated bank account, before the card can be used for atransaction (although exactly how this should be perceived may be open to question).Consumers in this survey seemed not to have a clear understanding of payment timing.Part of the fault may lie with purveyors of prepaid card technologies, who downplaythe fact that they have to prepay.
It is also necessary to examine the generalisability of these findings to other tech-nologies and environments. Future research might examine the acceptance of paymenttechnologies like mobile payment systems (e.g. in the context of near field commu-nications) using a different theoretical perspective (e.g., critical mass) in order totriangulate findings and/or question assumptions. Although this study was conductedamong prepaid e-cash account holders, to further establish external validity, researchcould be conducted in an organisational context and also for systems designed for usein particular organisations. Another important issue for future research is the tempo-ral dynamics associated with the findings from this work. It is necessary for futureresearch to determine whether the favourable user reactions (enhanced levels of userperceptions and intentions) were only temporary or whether such reactions lasted forlong enough periods of time to indeed have an impact on acceptance, adoption andusage decisions.
References
1. Auh, S., Shih, E., & Yoon, Y. (2007). Aligning benefits with payments in a consumer financing context.A test of the pattern alignment hypothesis. SSRN eLibrary.
2. Borzekowski, R., Kiser, E., & Ahmed, S. (2008). Consumers’ use of debit cards: Patterns, preferences,and price response. Journal of Money, Credit and Banking, 40(1), 149–172.
3. Carow, K. A., & Staten, M. E. (1999). Debit, credit, or cash: Survey evidence on gasoline purchases.Journal of Economics and Business, 51(5), 409–421.
123
Moderating role of income on consumers’ preferences
4. Chakravorti, S., & Lubasi, V. (2006). Payment instrument choice: The case of prepaid cards. EconomicPerspectives, Federal Reserve Bank of Chicago, 2nd Quarter, 29–43.
5. Cheung, C. M. K., Chan, G. W. W., & Limayem, M. (2005). A critical review of online consumerbehavior: Empirical research. Journal of Electronic Commerce in Organizations, 3(4), 1–19.
6. Chong, S., Bagnall, J., & Smith, K. E. (2011). Australian consumer payment behaviour and preferences.JASSA, 2(4), 20–29.
7. Close, A. G., & Kukar-Kinney, M. (2010). Beyond buying: Motivations behind consumers’ onlineshopping cart use. Journal of Business Research, 63(9–10), 986–992.
8. Davis, F., Bagozzi, R., & Warshaw, P. (1989). User acceptance of computer technology: A comparisonof two theoretical models. Management Science, 35(8), 982–1003.
9. Eastin, M. (2002). Diffusion of e-commerce: An analysis of the adoption of four e-commerce activities.Telematics and Informatics, 19(3), 251–267.
10. Fenech, T. (2002). Antecedents to web cart abandonment. Paper presented at the Australian and NewZealand Marketing Academy (ANZMAC) Conference, Melbourne.
11. Foscht, T., Maloles, C. I., Swoboda, B., & Chia, S. (2010). Debit and credit card usage and satisfactionwho uses which and why—evidence from Austria. International Journal of Bank Marketing, 28(2),150–165.
12. Garcia-Murillo, M. (2004). Institutions and the adoption of electronic commerce in Mexico. ElectronicCommerce Research, 4, 201–219.
13. Global Millennia Marketing. (2002). Shopping Cart Abandonment. Retrieved May 3, 2010 from http://www.globalmillenniamarketing.com/press_release_mar_12_02.htm.
14. Gold, K. (2007). Tackling the Shopping Cart Abandonment Rate from http://www.searchmarketingstandard.com/tackling-the-shopping-cart-abandonment-rate.
15. Holak, S., & Lehmann, D. (1990). Purchase intentions and the dimensions of innovation: An exploratorymodel. Journal of Product Innovation Management, 7(1), 59–73.
16. Hussain, Z., Wallace, J., Tassabehji, R., & Khan, O. (2007). E-business in the developing world:An empirical study of payment methods and their implications. International Journal of ElectronicBusiness, 5(3), 315–335.
17. Isaac, J. T., Zeadally, S., & Cámara, J. S. (2012). A lightweight secure mobile payment protocol forvehicular ad-hoc networks (VANETs). Electronic Commerce Research, 12, 97–123.
18. Jonker, N. (2007). Payment instruments as perceived by consumers. Results from a household survey.De Economist, 155(3), 271–303.
19. Karahanna, E., Straub, D., & Chervany, N. (1999). Information technology adoption across time: Across-sectional comparison of pre-adoption and post-adoption beliefs. MIS Quarterly, 23(2), 183–213.
20. Kheng-Tan, W., & Tan, Y. (2009). From a retail-based e-micropayment program to a multi-purposeprogram: Which critical factors are needed for such a transformation? Paper presented at the IADISInternational Conference e-Commerce 2009. Portugal: Algarve.
21. Kindberg, T., Sellen, A., & Geelhoed, E. (2004). Security and trust in mobile interactions: A studyof users’ perceptions and reasoning. Paper presented at the Ubiquitous Computing: 6th InternationalConference, Nottingham, UK.
22. Knights, D., Noble, F., Vurdubakis, T., & Willmott, H. (2007). Electronic cash and the virtual market-place: Reflections on a revolution postponed. Organization, 14(6), 747–776.
23. Kukar-Kinney, M., & Close, A. (2010). The determinants of consumers’ online shopping cart aban-donment. Journal of the Academy of Marketing Science, 38(2), 240–250.
24. Lee, P.-M. (2002). Behavioral model of online purchasers in E-commerce environment. ElectronicCommerce Research, 2(1–2), 75–85.
25. Leung, L. (2001). College student motives for chatting on ICQ. New Media & Society, 3(4), 483–500.26. Liao, Z., & Cheung, M. (2001). Internet-based e-shopping and consumer attitudes: An empirical study.
Information & Management, 38(5), 299–306.27. Lohse, G., Bellman, S., & Johnson, E. (2000). Consumer buying behavior on the Internet: Findings
from panel data. Journal of Interactive Marketing, 14(1), 15–29.28. Moe, W. W., & Fader, P. S. (2001). Uncovering patterns in cybershopping. California Management
Review, 43(4), 106–117.29. Moore, S., & Mathews, S. (2008). An exploration of online shopping cart abandonment syndrome: A
matter of risk and reputation. Journal of Website Promotion, 2(1), 71–88.30. Oliver, R. L., & Shor, M. (2003). Digital redemption of coupons: Satisfying and dissatisfying effects
of promotion codes. Journal of Product & Brand Management, 12(2), 121–134.
123
E. W. K. See-To et al.
31. Park, C., & Jun, J. (2003). A cross-cultural comparison of internet buying behavior Effects of Inter-net usage, perceived risks, and innovativeness Cheol Park, Jong-Kun Jun the authors. InternationalMarketing Review, 20(5), 534–553.
32. Penz, E., Meier-Pesti, K., & Kirchler, E. (2004). It’s practical, but no more controllable: Social repre-sentations of the electronic purse in Austria. Journal of Economic Psychology, 25(6), 771–787.
33. Phillips, D. J. (1998). The social construction of a secure, anonymous electronic payment system:Frame alignment and mobilization around Ecash. Journal of Information Technology, 13(4), 273–284.
34. Rajamma, R. K., Paswan, A. K., & Hossain, M. M. (2009). Why do shoppers abandon shopping cart?Perceived waiting time, risk, and transaction inconvenience. Journal of Product & Brand Management,18(3), 188–197.
35. Renaud, K., Cockshott, T., & Hair, M. (2009). Everyone Abandons—Eventually: Understanding theOnline Shopping Experience. Paper presented at the Commerce and Enterprise Computing, 2009. CEC’09. IEEE Conference.
36. Roberts, H., & Gregor, S. (2005). Why Australian merchants aren’t adopting e-money. Journal ofResearch and Practice in Information Technology, 37(1), 11–25.
37. Rogers, E. (1995). Diffusion of innovations (4th ed.). New York: The Free Press.38. Rossi, P., Wright, J., & Anderson, A. (1983). Handbook of survey research. New York: Academic
Press.39. See-To, E. W. K., Jaisingh, J., & Tam, K. Y. (2007). Analysis of electronic micro-payment market.
Journal of Electronic Commerce Research, 8(1), 63–83.40. Shy, O., & Tarkka, J. (2002). The market for electronic cash cards. Journal of Money, Credit, and
Banking, 34(2), 299–314.41. Stalder, F. (2002). Failures and successes: Notes on the development of electronic cash. The Information
Society: An International Journal, 18(3), 209–219.42. Tan, W. K., & Tan, Y. J. (2012). Transformation of smart-card-based single-purpose e-micropayment
scheme to multi-purpose scheme: A case study. Expert Systems with Applications, 39(3), 2306–2313.43. Taylor, S., & Todd, P. (1995). Assessing IT usage: The role of prior experience. MIS Quarterly, 19(4),
561–570.44. Thompson, R., Higgins, C., & Howell, J. (1994). Influence of experience on personal computer uti-
lization: Testing a conceptual model. Journal of Management Information Systems, 11(1), 167–187.45. van Hove, L. (2004). Electronic purses in Euroland: Why do penetration and usage rates differ? Paper
presented at the The European Money and Finance Forum.46. Venkatesh, V., Morris, M., Hall, M., Davis, G., & Davis, F. (2003). User acceptance of information
technology: Towards a unified view. MIS Quarterly, 27(3), 425–478.47. Vincent, O. R., Folorunso, O., & Akinde, A. D. (2010). Improving e-payment security using elliptic
curve cryptosystem. Electronic Commerce Research, 10(1), 27–41.48. Wang, C.-T., Chang, C.-C., & Lin, C.-H. (2002). A new micro-payment system using general payword
chain. Electronic Commerce Research, 2(1–2), 159–168.49. Wang, H., Zhang, Y., & Cao, J. (2004). An electronic cash scheme and its management. Concurrent
Engineering, 12(3), 247–257.50. Wansink, B. (1994). Advertising’s impact on category substitution. Journal of Marketing Research,
31(4), 505–515.51. Wansink, B., & Ray, M. (1996). Advertising strategies to increase usage frequency. Journal of Mar-
keting Research, 60(1), 31–46.52. Westland, J. C. (2002). Preference ordering cash, near cash, and electronic cash. Journal of Organiza-
tional Computing and Electronic Commerce, 12(3), 223–242.53. Westland, J. C., Kwok, M., Shu, J., Kwok, T., & Ho, H. (1997). Electronic cash in Hong Kong.
Electronic Markets, 7(2), 3–6.54. Worthington, S., Stewart, D., & Lu, X. (2007). The adoption and usage of credit cards by urban-affluent
consumers in China. International Journal of Bank Marketing, 25(4), 238–252.55. Zhang, H., & Li, H. (2006). Factors affecting payment choices in online auctions: A study of eBay
traders. Decision Support Systems, 42(2), 1076–1088.
123
Moderating role of income on consumers’ preferences
Eric W. K. See-To is Assistant Professor at Department of Industrialand Systems Engineering, Hong Kong Polytechnic University. Eric’sresearch focuses on strategy and consumer behaviours in mobileand digital environments, and business intelligence and knowledgemining. He studies the role of information and digital interaction,empowered by technology, in formulating business model and mar-keting strategy, and the practical applications of business intelligenceand knowledge mining. Eric was previously a business theme mem-ber of the 12 million digital economy research hub at the Universityof Newcastle-upon-Tyne in the UK. His work has been published inJournal of Management Information Systems (JMIS), Research Pol-icy, Technological Forecasting and Social Change, Electronic Mar-kets, Information Systems Frontiers, and Journal of Electronic Com-merce Research. Eric received his PhD in Information Systems in2005 from Hong Kong University of Science and Technology.
Savvas Papagiannidis is the David Goldman Professor of Innova-tion and Enterprise in the Newcastle University Business School,UK and the Head of Marketing, Operations and Systems subjectgroup. His work has been published in several academic journals andpresented at international conferences. His research interests mainlyrevolve around electronic business and its various sub-domains. Morespecifically, his research aims to inform our understanding of howe-business technologies affect the social and business environment,organisational strategies and business models, and how these areimplemented in terms of functional innovations. His work puts strongemphasis on innovation, new value creation and exploitation of entre-preneurial opportunities, within the context of different industries.Savvas holds a PhD in Theoretical Physics (2003) and a Doctoratein Business Administration (2010) from Newcastle University.
J. Christopher Westland Currently Professor of Information &Decision Sciences at the University of Illinois in Chicago, Chrishave extensive professional experience in the US as a certified pub-lic accountant and as a risk, valuation and technology consultantin the US, Europe, Latin America and Asia. Chris is the authorof numerous academic papers and of six books: Financial Dynam-ics (Wiley 2003); Valuing Technology (Wiley 2002); Global Elec-tronic Commerce (MIT Press 2000); Global Innovation Management(Palgrave Macmillan 2008); Red Wired: China’s Internet Revolution(Cyan, 2009); and Structural Equation Models (CreateSpace, 2012).He received his PhD in Computers and Information Systems byUniversity of Michigan in 1987.
123