Embed Size (px)
Citation preview
November 4, 2013 1
The New York State Accountability Report 2011-12
Data in this report are those reported by districts in the Student Information Repository System as of August 24, 2012. On May 29, 2012, the United States Department of Education (USDE) approved New York's Elementary and Secondary Education Act (ESEA) waiver. This waiver provides New York with increased flexibility to help close the achievement gap and assist students in becoming college and career ready. New York’s waiver introduced a system of identifying districts and/or schools as Reward, Focus, or Priority, based on performance in English language arts (ELA), mathematics, and science at the elementary/middle level and in ELA, mathematics, and graduation rate at the secondary level. More information on the waiver is available at http://www.p12.nysed.gov/esea-waiver/. Data in The New York State Accountability Report are those used to determine Performance Indices (PIs) and make Adequate Yearly Progress (AYP) determinations which, in turn, are used to assist in identifying districts and schools as Reward, Focus, and Priority. Explanations of how the data are used to make the determinations are available at http://www.p12.nysed.gov/accountability/ESEAMaterials.html.
More Information: Office of Accountability New York State Education Department 55 Hanson Place Brooklyn, NY 11217 Email: [email protected]
November 4, 2013 2
Adequate Yearly Progress and Performance Indices Performance Indices (PIs) and Unweighted Combined PIs are used to determine if a district or school is Priority or Focus. Adequate Yearly Progress (AYP) for accountability groups (all students, racial/ethnic groups, students with disabilities, limited English proficient students, and economically disadvantaged students) and PIs for accountability groups and non-AYP groups (non-racial/ethnic groups, general-education students, English proficient students, not economically disadvantaged students, male and female students, and migrant and non-migrant students) are used to determine if a district or school is Reward or a school requires a Local Assistance Plan. For more information, see http://www.p12.nysed.gov/accountability/documents/NYSESEAFlexibilityWaiver_REVISED.pdf. Adequate Yearly Progress
In accordance with federal and State laws, the New York State Education Department must determine and report on the performance of students in the following areas:
1) Elementary/middle-level (grades 3–8) English Language Arts (ELA) 2) Elementary/middle-level (grades 3–8) Mathematics 3) Elementary/middle-level (grades 4 and 8) Science 4) Secondary-level (grades 9–12) ELA 5) Secondary-level (grades 9–12) Mathematics 6) Graduation Rate
This performance is determined by identifying whether or not a district or school made “Adequate Yearly Progress” (AYP). AYP indicates satisfactory progress by a district or a school toward the goal of proficiency for all students. In ELA, mathematics, and science, AYP is determined by comparing the percentage of students tested and the performance of tested students against defined standards. In graduation rate, AYP is determined by comparing the percentage of students graduating against defined standards. Standards for English Language Arts, Mathematics, and Science
Participation: In ELA and mathematics, 95% of students in each accountability group with 40 or more members must be tested to meet the participation criterion. In science, 80% must be tested.
Performance: In ELA and mathematics, a calculated measure of performance called the “Performance Index” (PI) for each accountability group with 30 or more members must equal or exceed a preset objective called an “Effective Annual Measurable Objective” (EAMO) or a safety net objective called a “Safe Harbor Target.” In science, the criterion for performance is the same but the safety net is referred to as a “Progress Target.”
Districts and schools must meet both the participation and performance criteria for all groups with sufficient numbers to make AYP. Standards for Graduation Rate
Districts and schools with secondary-level grades are also held to certain standards for the percentage of students who graduated. To make AYP in graduation rate, every accountability group with 30 or more members must make AYP. For a group to make AYP, the graduation rate of the 4-year graduation-rate total cohort or the 5-year graduation-rate total cohort must equal or exceed the Graduation-Rate Standard of 80% or the group’s Progress Target. A cohort is a group of students who entered grade 9 anywhere in a particular school year. Graduation rates for these cohorts are then determined 4 and 5 years after the students first enter grade 9.
For more information on how AYP and PIs are determined, see “Determining AYP in 2011-12” under Understanding Accountability in New York State at http://www.p12.nysed.gov/irs/accountability.
November 4, 2013 3
Elementary/Middle-Level ELA: AYP
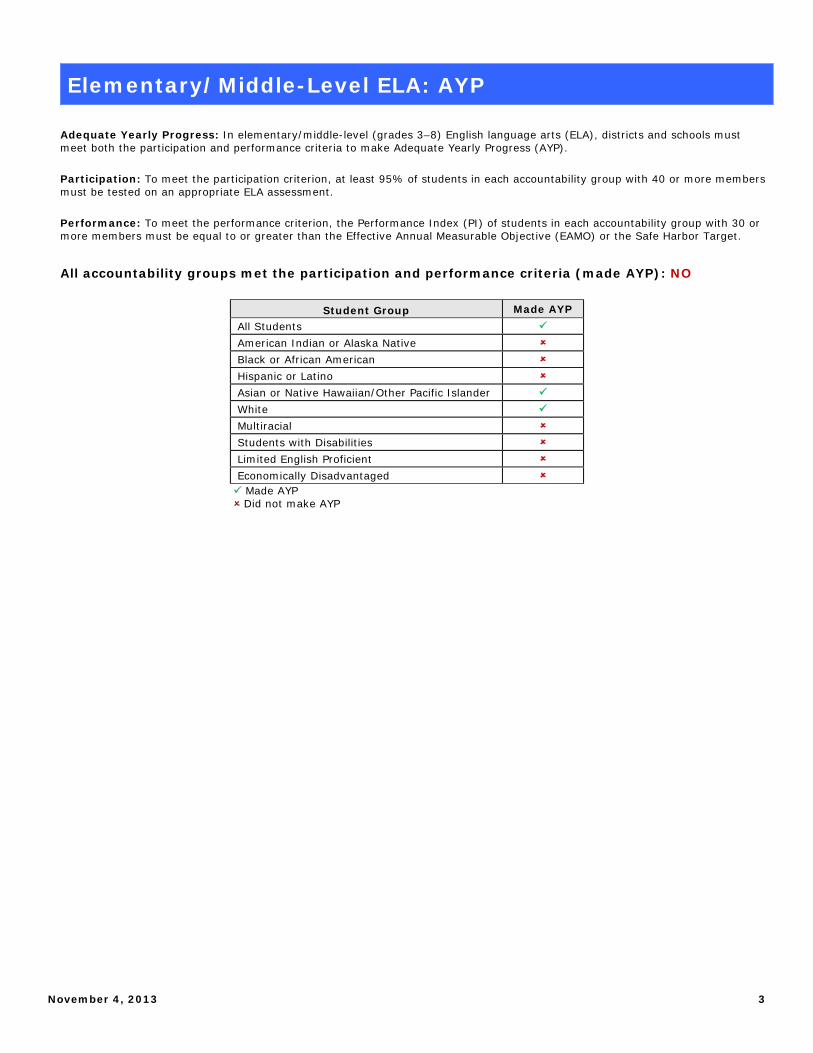
Adequate Yearly Progress: In elementary/middle-level (grades 3–8) English language arts (ELA), districts and schools must meet both the participation and performance criteria to make Adequate Yearly Progress (AYP). Participation: To meet the participation criterion, at least 95% of students in each accountability group with 40 or more members must be tested on an appropriate ELA assessment. Performance: To meet the performance criterion, the Performance Index (PI) of students in each accountability group with 30 or more members must be equal to or greater than the Effective Annual Measurable Objective (EAMO) or the Safe Harbor Target.
All accountability groups met the participation and performance criteria (made AYP): NO
Student Group Made AYP
All Students American Indian or Alaska Native Black or African American Hispanic or Latino Asian or Native Hawaiian/Other Pacific Islander White Multiracial Students with Disabilities Limited English Proficient Economically Disadvantaged Made AYP Did not make AYP
November 4, 2013 4
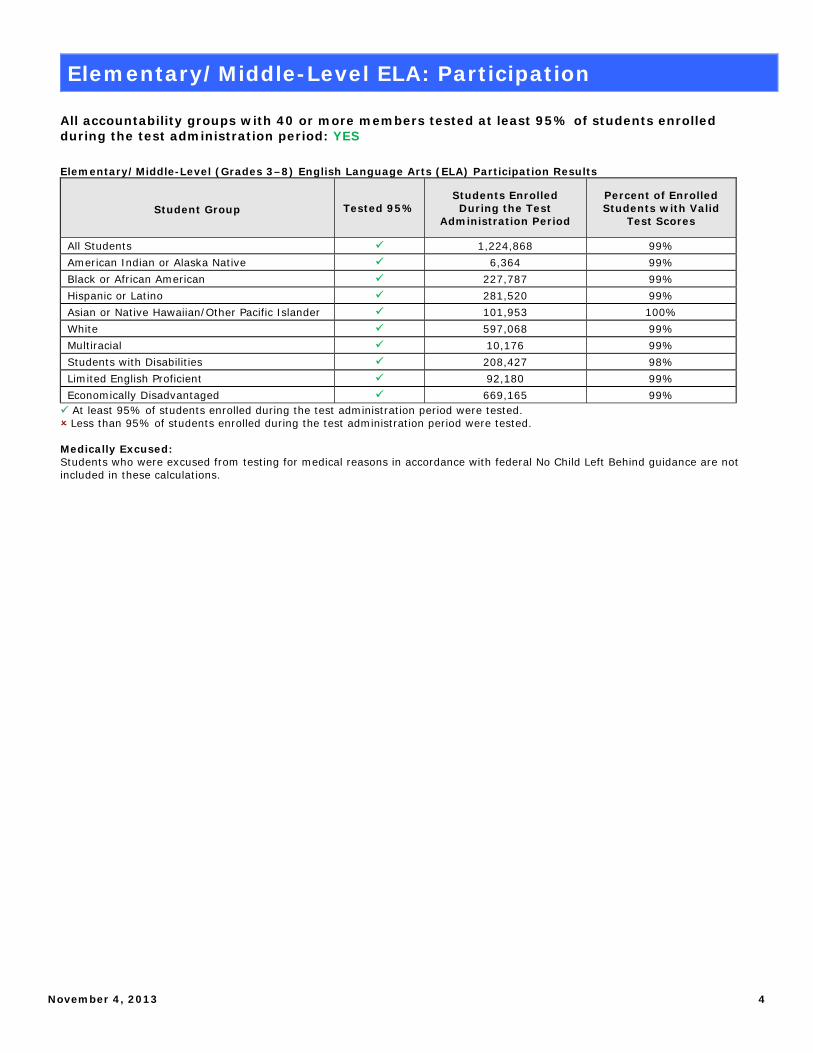
Elementary/Middle-Level ELA: Participation All accountability groups with 40 or more members tested at least 95% of students enrolled during the test administration period: YES Elementary/Middle-Level (Grades 3–8) English Language Arts (ELA) Participation Results
Student Group Tested 95% Students Enrolled During the Test
Administration Period
Percent of Enrolled Students with Valid
Test Scores
All Students 1,224,868 99% American Indian or Alaska Native 6,364 99% Black or African American 227,787 99% Hispanic or Latino 281,520 99% Asian or Native Hawaiian/Other Pacific Islander 101,953 100% White 597,068 99% Multiracial 10,176 99% Students with Disabilities 208,427 98% Limited English Proficient 92,180 99% Economically Disadvantaged 669,165 99% At least 95% of students enrolled during the test administration period were tested. Less than 95% of students enrolled during the test administration period were tested. Medically Excused: Students who were excused from testing for medical reasons in accordance with federal No Child Left Behind guidance are not included in these calculations.
November 4, 2013 5
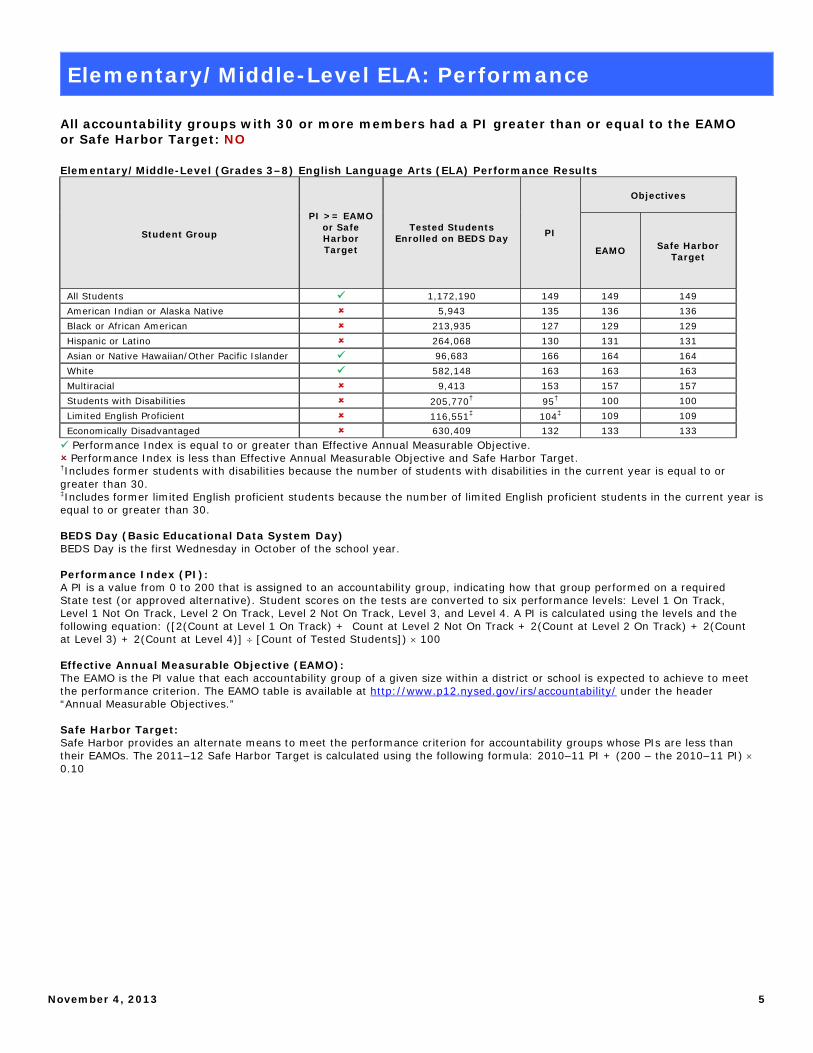
Elementary/Middle-Level ELA: Performance
All accountability groups with 30 or more members had a PI greater than or equal to the EAMO or Safe Harbor Target: NO Elementary/Middle-Level (Grades 3–8) English Language Arts (ELA) Performance Results
Student Group
PI >= EAMO or Safe Harbor Target
Tested Students Enrolled on BEDS Day PI
Objectives
EAMO Safe Harbor Target
All Students 1,172,190 149 149 149 American Indian or Alaska Native 5,943 135 136 136 Black or African American 213,935 127 129 129 Hispanic or Latino 264,068 130 131 131 Asian or Native Hawaiian/Other Pacific Islander 96,683 166 164 164 White 582,148 163 163 163 Multiracial 9,413 153 157 157 Students with Disabilities 205,770† 95† 100 100 Limited English Proficient 116,551‡ 104‡ 109 109 Economically Disadvantaged 630,409 132 133 133 Performance Index is equal to or greater than Effective Annual Measurable Objective. Performance Index is less than Effective Annual Measurable Objective and Safe Harbor Target. †Includes former students with disabilities because the number of students with disabilities in the current year is equal to or greater than 30. ‡Includes former limited English proficient students because the number of limited English proficient students in the current year is equal to or greater than 30. BEDS Day (Basic Educational Data System Day) BEDS Day is the first Wednesday in October of the school year. Performance Index (PI): A PI is a value from 0 to 200 that is assigned to an accountability group, indicating how that group performed on a required State test (or approved alternative). Student scores on the tests are converted to six performance levels: Level 1 On Track, Level 1 Not On Track, Level 2 On Track, Level 2 Not On Track, Level 3, and Level 4. A PI is calculated using the levels and the following equation: ([2(Count at Level 1 On Track) + Count at Level 2 Not On Track + 2(Count at Level 2 On Track) + 2(Count at Level 3) + 2(Count at Level 4)] [Count of Tested Students]) 100 Effective Annual Measurable Objective (EAMO): The EAMO is the PI value that each accountability group of a given size within a district or school is expected to achieve to meet the performance criterion. The EAMO table is available at http://www.p12.nysed.gov/irs/accountability/ under the header “Annual Measurable Objectives.” Safe Harbor Target: Safe Harbor provides an alternate means to meet the performance criterion for accountability groups whose PIs are less than their EAMOs. The 2011–12 Safe Harbor Target is calculated using the following formula: 2010–11 PI + (200 – the 2010–11 PI) 0.10
November 4, 2013 6
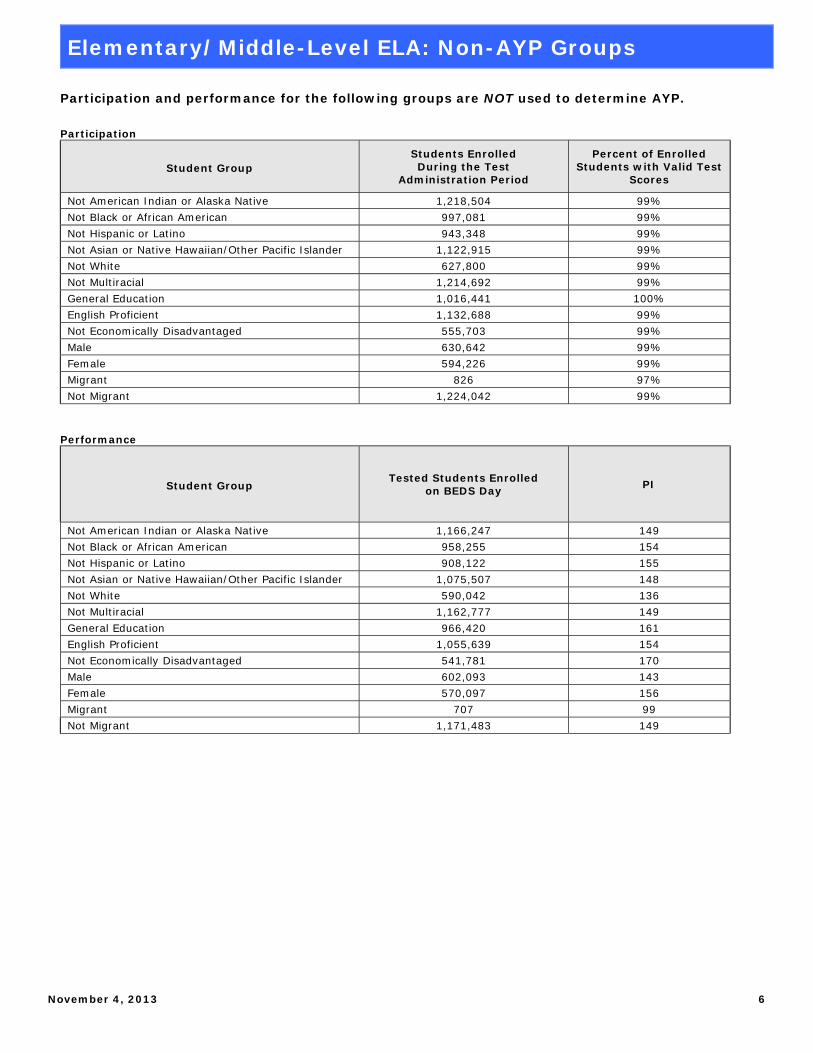
Elementary/Middle-Level ELA: Non-AYP Groups
Participation and performance for the following groups are NOT used to determine AYP. Participation
Student Group Students Enrolled During the Test
Administration Period
Percent of Enrolled Students with Valid Test
Scores
Not American Indian or Alaska Native 1,218,504 99% Not Black or African American 997,081 99% Not Hispanic or Latino 943,348 99% Not Asian or Native Hawaiian/Other Pacific Islander 1,122,915 99% Not White 627,800 99% Not Multiracial 1,214,692 99% General Education 1,016,441 100% English Proficient 1,132,688 99% Not Economically Disadvantaged 555,703 99% Male 630,642 99% Female 594,226 99% Migrant 826 97% Not Migrant 1,224,042 99%
Performance
Student Group Tested Students Enrolled
on BEDS Day PI
Not American Indian or Alaska Native 1,166,247 149 Not Black or African American 958,255 154 Not Hispanic or Latino 908,122 155 Not Asian or Native Hawaiian/Other Pacific Islander 1,075,507 148 Not White 590,042 136 Not Multiracial 1,162,777 149 General Education 966,420 161 English Proficient 1,055,639 154 Not Economically Disadvantaged 541,781 170 Male 602,093 143 Female 570,097 156 Migrant 707 99 Not Migrant 1,171,483 149
November 4, 2013 7
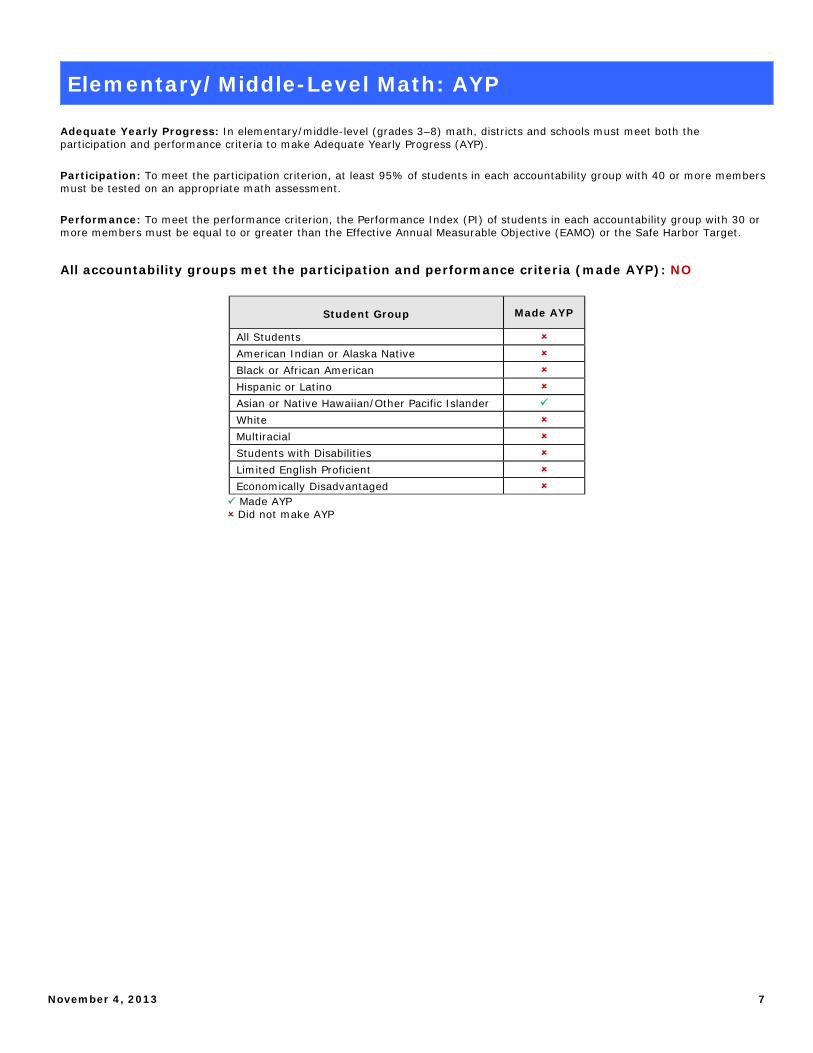
Elementary/Middle-Level Math: AYP
Adequate Yearly Progress: In elementary/middle-level (grades 3–8) math, districts and schools must meet both the participation and performance criteria to make Adequate Yearly Progress (AYP). Participation: To meet the participation criterion, at least 95% of students in each accountability group with 40 or more members must be tested on an appropriate math assessment. Performance: To meet the performance criterion, the Performance Index (PI) of students in each accountability group with 30 or more members must be equal to or greater than the Effective Annual Measurable Objective (EAMO) or the Safe Harbor Target.
All accountability groups met the participation and performance criteria (made AYP): NO
Student Group Made AYP
All Students American Indian or Alaska Native Black or African American Hispanic or Latino Asian or Native Hawaiian/Other Pacific Islander White Multiracial Students with Disabilities Limited English Proficient Economically Disadvantaged Made AYP Did not make AYP
November 4, 2013 8
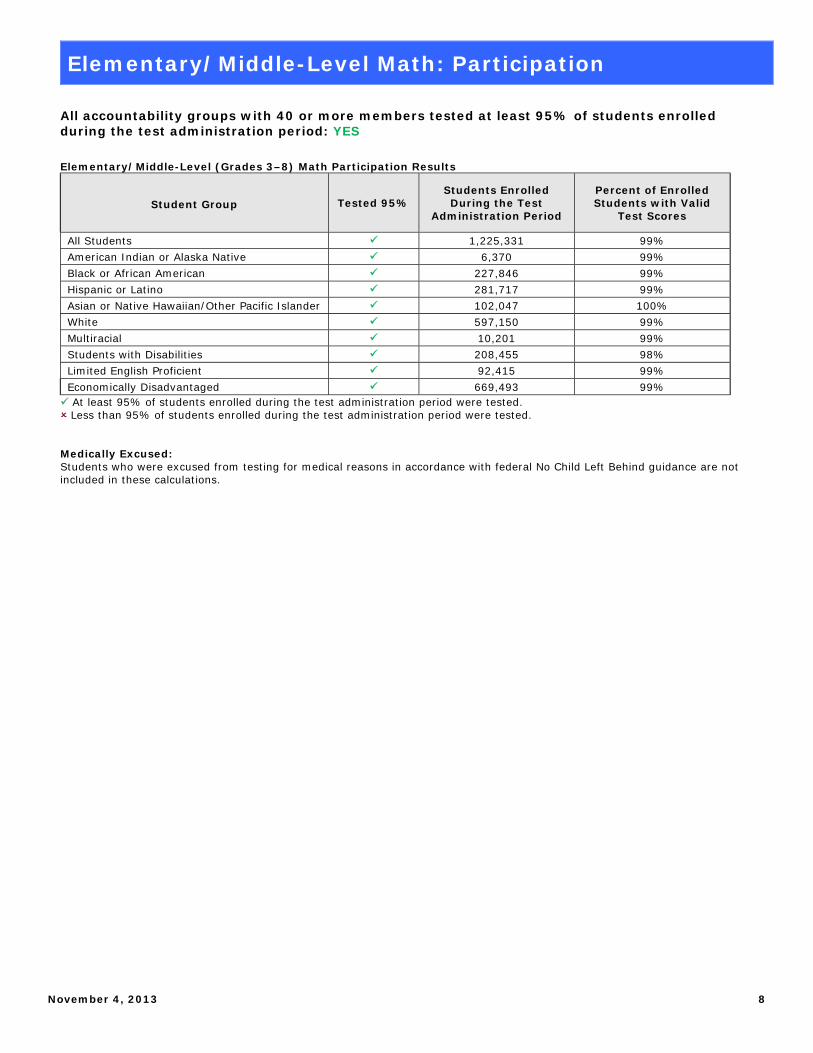
Elementary/Middle-Level Math: Participation
All accountability groups with 40 or more members tested at least 95% of students enrolled during the test administration period: YES Elementary/Middle-Level (Grades 3–8) Math Participation Results
Student Group Tested 95% Students Enrolled During the Test
Administration Period
Percent of Enrolled Students with Valid
Test Scores
All Students 1,225,331 99% American Indian or Alaska Native 6,370 99% Black or African American 227,846 99% Hispanic or Latino 281,717 99% Asian or Native Hawaiian/Other Pacific Islander 102,047 100% White 597,150 99% Multiracial 10,201 99% Students with Disabilities 208,455 98% Limited English Proficient 92,415 99% Economically Disadvantaged 669,493 99% At least 95% of students enrolled during the test administration period were tested. Less than 95% of students enrolled during the test administration period were tested. Medically Excused: Students who were excused from testing for medical reasons in accordance with federal No Child Left Behind guidance are not included in these calculations.
November 4, 2013 9
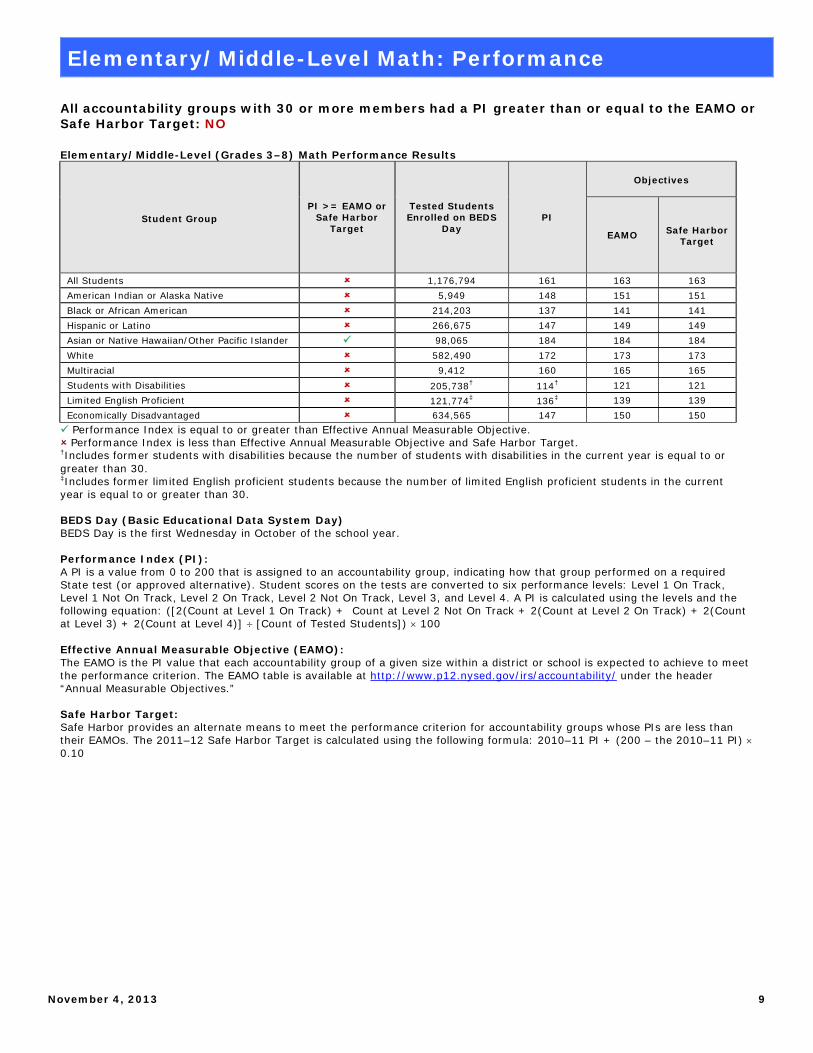
Elementary/Middle-Level Math: Performance
All accountability groups with 30 or more members had a PI greater than or equal to the EAMO or Safe Harbor Target: NO Elementary/Middle-Level (Grades 3–8) Math Performance Results
Student Group PI >= EAMO or
Safe Harbor Target
Tested Students Enrolled on BEDS
Day PI
Objectives
EAMO Safe Harbor Target
All Students 1,176,794 161 163 163 American Indian or Alaska Native 5,949 148 151 151 Black or African American 214,203 137 141 141 Hispanic or Latino 266,675 147 149 149 Asian or Native Hawaiian/Other Pacific Islander 98,065 184 184 184 White 582,490 172 173 173 Multiracial 9,412 160 165 165 Students with Disabilities 205,738† 114† 121 121 Limited English Proficient 121,774‡ 136‡ 139 139 Economically Disadvantaged 634,565 147 150 150 Performance Index is equal to or greater than Effective Annual Measurable Objective. Performance Index is less than Effective Annual Measurable Objective and Safe Harbor Target. †Includes former students with disabilities because the number of students with disabilities in the current year is equal to or greater than 30. ‡Includes former limited English proficient students because the number of limited English proficient students in the current year is equal to or greater than 30. BEDS Day (Basic Educational Data System Day) BEDS Day is the first Wednesday in October of the school year. Performance Index (PI): A PI is a value from 0 to 200 that is assigned to an accountability group, indicating how that group performed on a required State test (or approved alternative). Student scores on the tests are converted to six performance levels: Level 1 On Track, Level 1 Not On Track, Level 2 On Track, Level 2 Not On Track, Level 3, and Level 4. A PI is calculated using the levels and the following equation: ([2(Count at Level 1 On Track) + Count at Level 2 Not On Track + 2(Count at Level 2 On Track) + 2(Count at Level 3) + 2(Count at Level 4)] [Count of Tested Students]) 100 Effective Annual Measurable Objective (EAMO): The EAMO is the PI value that each accountability group of a given size within a district or school is expected to achieve to meet the performance criterion. The EAMO table is available at http://www.p12.nysed.gov/irs/accountability/ under the header “Annual Measurable Objectives.” Safe Harbor Target: Safe Harbor provides an alternate means to meet the performance criterion for accountability groups whose PIs are less than their EAMOs. The 2011–12 Safe Harbor Target is calculated using the following formula: 2010–11 PI + (200 – the 2010–11 PI) 0.10
November 4, 2013 10
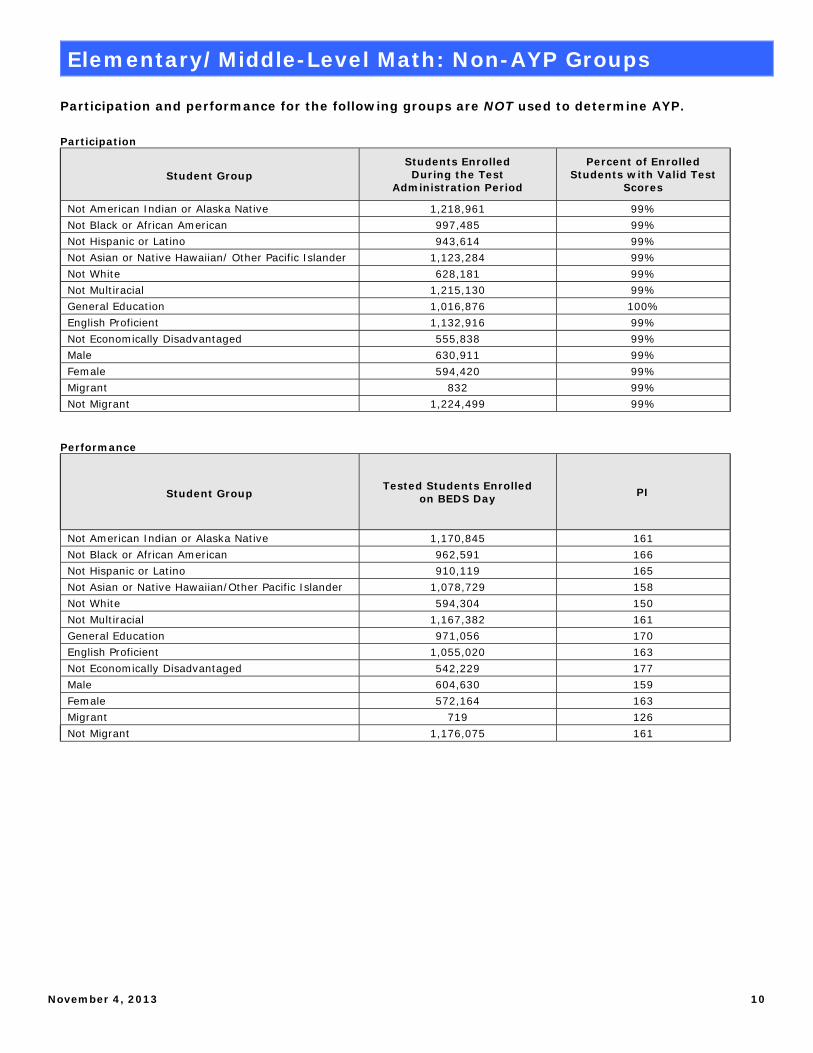
Elementary/Middle-Level Math: Non-AYP Groups
Participation and performance for the following groups are NOT used to determine AYP. Participation
Student Group Students Enrolled During the Test
Administration Period
Percent of Enrolled Students with Valid Test
Scores
Not American Indian or Alaska Native 1,218,961 99% Not Black or African American 997,485 99% Not Hispanic or Latino 943,614 99% Not Asian or Native Hawaiian/ Other Pacific Islander 1,123,284 99% Not White 628,181 99% Not Multiracial 1,215,130 99% General Education 1,016,876 100% English Proficient 1,132,916 99% Not Economically Disadvantaged 555,838 99% Male 630,911 99% Female 594,420 99% Migrant 832 99% Not Migrant 1,224,499 99%
Performance
Student Group Tested Students Enrolled
on BEDS Day PI
Not American Indian or Alaska Native 1,170,845 161 Not Black or African American 962,591 166 Not Hispanic or Latino 910,119 165 Not Asian or Native Hawaiian/Other Pacific Islander 1,078,729 158 Not White 594,304 150 Not Multiracial 1,167,382 161 General Education 971,056 170 English Proficient 1,055,020 163 Not Economically Disadvantaged 542,229 177 Male 604,630 159 Female 572,164 163 Migrant 719 126 Not Migrant 1,176,075 161
November 4, 2013 11
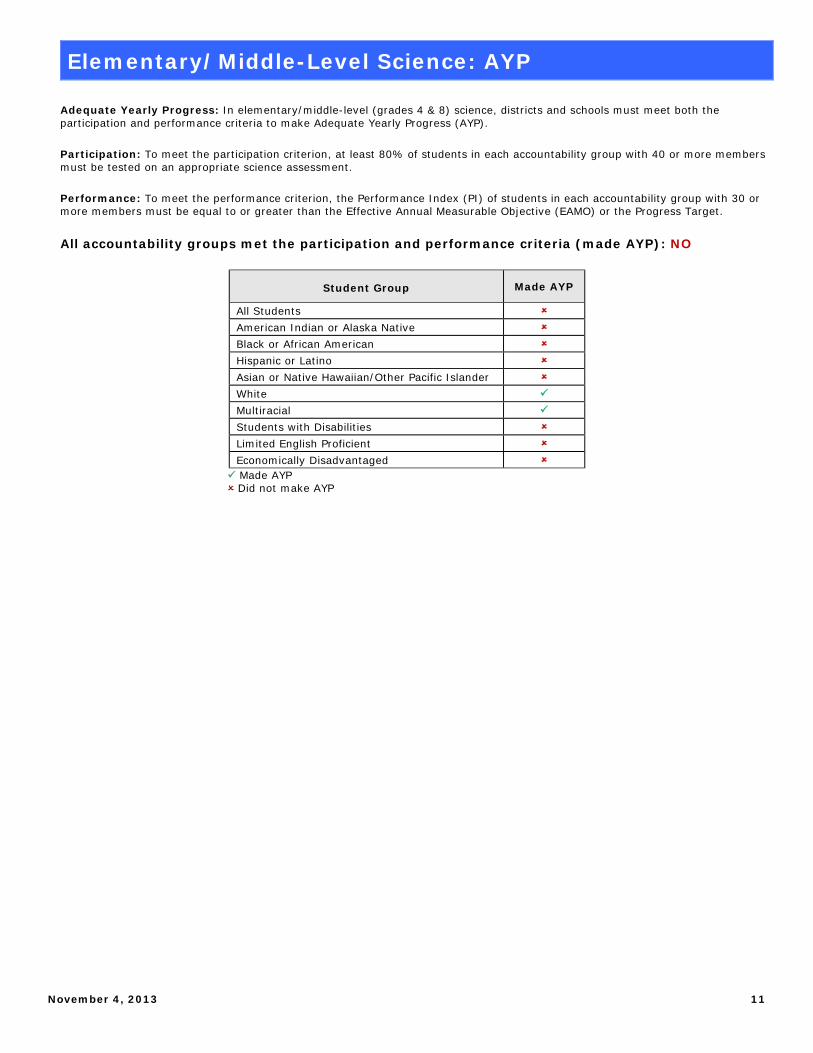
Elementary/Middle-Level Science: AYP
Adequate Yearly Progress: In elementary/middle-level (grades 4 & 8) science, districts and schools must meet both the participation and performance criteria to make Adequate Yearly Progress (AYP). Participation: To meet the participation criterion, at least 80% of students in each accountability group with 40 or more members must be tested on an appropriate science assessment. Performance: To meet the performance criterion, the Performance Index (PI) of students in each accountability group with 30 or more members must be equal to or greater than the Effective Annual Measurable Objective (EAMO) or the Progress Target. All accountability groups met the participation and performance criteria (made AYP): NO
Student Group Made AYP
All Students American Indian or Alaska Native Black or African American Hispanic or Latino Asian or Native Hawaiian/Other Pacific Islander White Multiracial Students with Disabilities Limited English Proficient Economically Disadvantaged Made AYP Did not make AYP
November 4, 2013 12
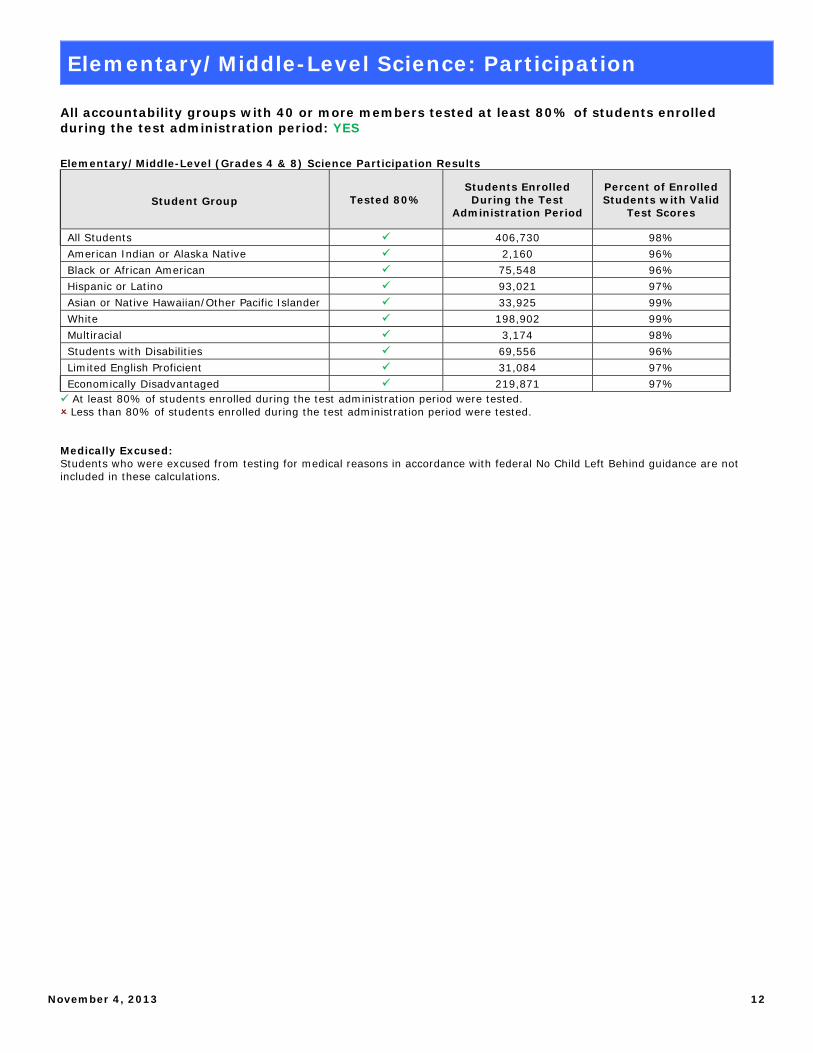
Elementary/Middle-Level Science: Participation
All accountability groups with 40 or more members tested at least 80% of students enrolled during the test administration period: YES Elementary/Middle-Level (Grades 4 & 8) Science Participation Results
Student Group Tested 80% Students Enrolled During the Test
Administration Period
Percent of Enrolled Students with Valid
Test Scores
All Students 406,730 98% American Indian or Alaska Native 2,160 96% Black or African American 75,548 96% Hispanic or Latino 93,021 97% Asian or Native Hawaiian/Other Pacific Islander 33,925 99% White 198,902 99% Multiracial 3,174 98% Students with Disabilities 69,556 96% Limited English Proficient 31,084 97% Economically Disadvantaged 219,871 97% At least 80% of students enrolled during the test administration period were tested. Less than 80% of students enrolled during the test administration period were tested. Medically Excused: Students who were excused from testing for medical reasons in accordance with federal No Child Left Behind guidance are not included in these calculations.
November 4, 2013 13
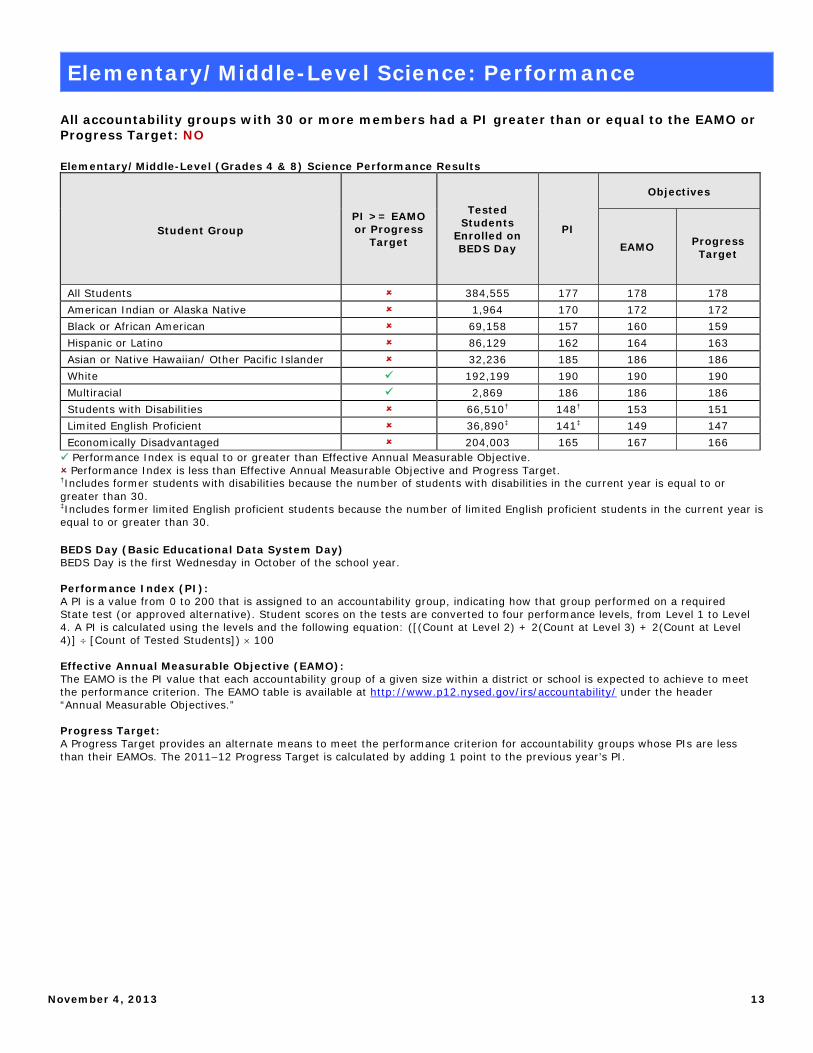
Elementary/Middle-Level Science: Performance
All accountability groups with 30 or more members had a PI greater than or equal to the EAMO or Progress Target: NO Elementary/Middle-Level (Grades 4 & 8) Science Performance Results
Student Group PI >= EAMO or Progress
Target
Tested Students
Enrolled on BEDS Day
PI
Objectives
EAMO Progress Target
All Students 384,555 177 178 178 American Indian or Alaska Native 1,964 170 172 172 Black or African American 69,158 157 160 159 Hispanic or Latino 86,129 162 164 163 Asian or Native Hawaiian/ Other Pacific Islander 32,236 185 186 186 White 192,199 190 190 190 Multiracial 2,869 186 186 186 Students with Disabilities 66,510† 148† 153 151 Limited English Proficient 36,890‡ 141‡ 149 147 Economically Disadvantaged 204,003 165 167 166 Performance Index is equal to or greater than Effective Annual Measurable Objective. Performance Index is less than Effective Annual Measurable Objective and Progress Target. †Includes former students with disabilities because the number of students with disabilities in the current year is equal to or greater than 30. ‡Includes former limited English proficient students because the number of limited English proficient students in the current year is equal to or greater than 30. BEDS Day (Basic Educational Data System Day) BEDS Day is the first Wednesday in October of the school year. Performance Index (PI): A PI is a value from 0 to 200 that is assigned to an accountability group, indicating how that group performed on a required State test (or approved alternative). Student scores on the tests are converted to four performance levels, from Level 1 to Level 4. A PI is calculated using the levels and the following equation: ([(Count at Level 2) + 2(Count at Level 3) + 2(Count at Level 4)] [Count of Tested Students]) 100 Effective Annual Measurable Objective (EAMO): The EAMO is the PI value that each accountability group of a given size within a district or school is expected to achieve to meet the performance criterion. The EAMO table is available at http://www.p12.nysed.gov/irs/accountability/ under the header “Annual Measurable Objectives.” Progress Target: A Progress Target provides an alternate means to meet the performance criterion for accountability groups whose PIs are less than their EAMOs. The 2011–12 Progress Target is calculated by adding 1 point to the previous year’s PI.
November 4, 2013 14
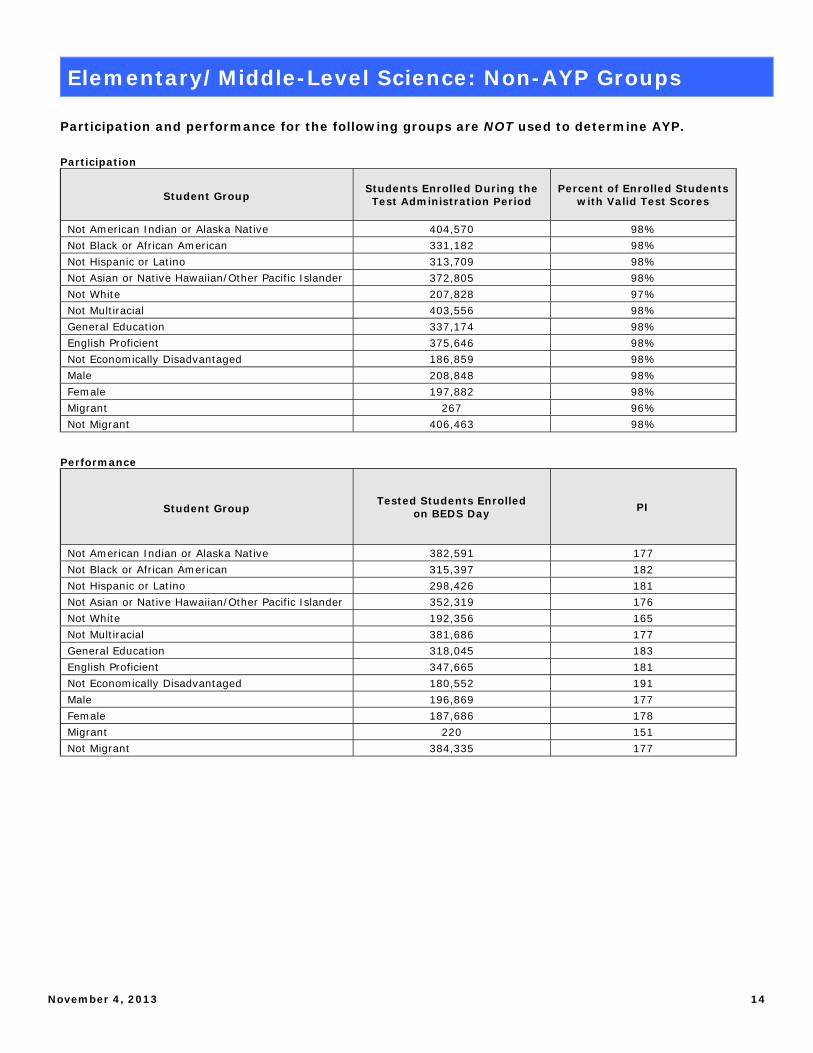
Elementary/Middle-Level Science: Non-AYP Groups
Participation and performance for the following groups are NOT used to determine AYP. Participation
Student Group Students Enrolled During the Test Administration Period
Percent of Enrolled Students with Valid Test Scores
Not American Indian or Alaska Native 404,570 98% Not Black or African American 331,182 98% Not Hispanic or Latino 313,709 98% Not Asian or Native Hawaiian/Other Pacific Islander 372,805 98% Not White 207,828 97% Not Multiracial 403,556 98% General Education 337,174 98% English Proficient 375,646 98% Not Economically Disadvantaged 186,859 98% Male 208,848 98% Female 197,882 98% Migrant 267 96% Not Migrant 406,463 98%
Performance
Student Group Tested Students Enrolled
on BEDS Day PI
Not American Indian or Alaska Native 382,591 177 Not Black or African American 315,397 182 Not Hispanic or Latino 298,426 181 Not Asian or Native Hawaiian/Other Pacific Islander 352,319 176 Not White 192,356 165 Not Multiracial 381,686 177 General Education 318,045 183 English Proficient 347,665 181 Not Economically Disadvantaged 180,552 191 Male 196,869 177 Female 187,686 178 Migrant 220 151 Not Migrant 384,335 177
November 4, 2013 15
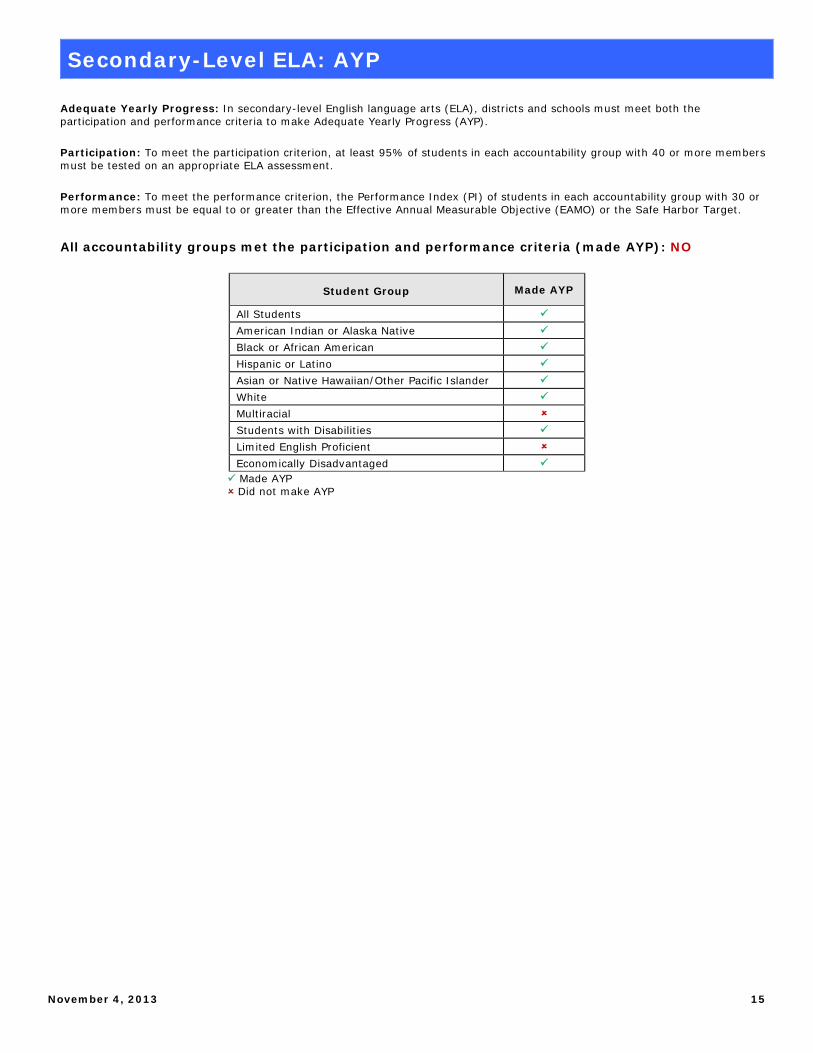
Secondary-Level ELA: AYP
Adequate Yearly Progress: In secondary-level English language arts (ELA), districts and schools must meet both the participation and performance criteria to make Adequate Yearly Progress (AYP). Participation: To meet the participation criterion, at least 95% of students in each accountability group with 40 or more members must be tested on an appropriate ELA assessment. Performance: To meet the performance criterion, the Performance Index (PI) of students in each accountability group with 30 or more members must be equal to or greater than the Effective Annual Measurable Objective (EAMO) or the Safe Harbor Target.
All accountability groups met the participation and performance criteria (made AYP): NO
Student Group Made AYP
All Students American Indian or Alaska Native Black or African American Hispanic or Latino Asian or Native Hawaiian/Other Pacific Islander White Multiracial Students with Disabilities Limited English Proficient Economically Disadvantaged Made AYP Did not make AYP
November 4, 2013 16
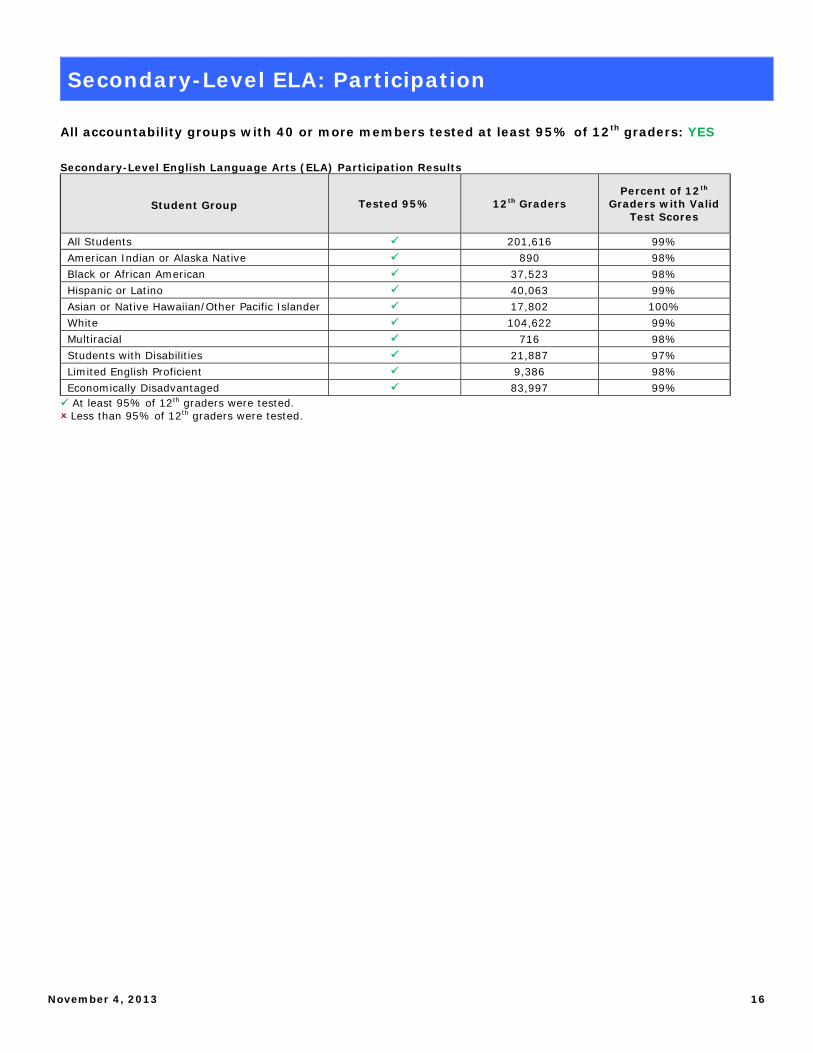
Secondary-Level ELA: Participation
All accountability groups with 40 or more members tested at least 95% of 12th graders: YES Secondary-Level English Language Arts (ELA) Participation Results
Student Group Tested 95% 12th Graders Percent of 12th
Graders with Valid Test Scores
All Students 201,616 99% American Indian or Alaska Native 890 98% Black or African American 37,523 98% Hispanic or Latino 40,063 99% Asian or Native Hawaiian/Other Pacific Islander 17,802 100% White 104,622 99% Multiracial 716 98% Students with Disabilities 21,887 97% Limited English Proficient 9,386 98% Economically Disadvantaged 83,997 99% At least 95% of 12th graders were tested. Less than 95% of 12th graders were tested.
November 4, 2013 17
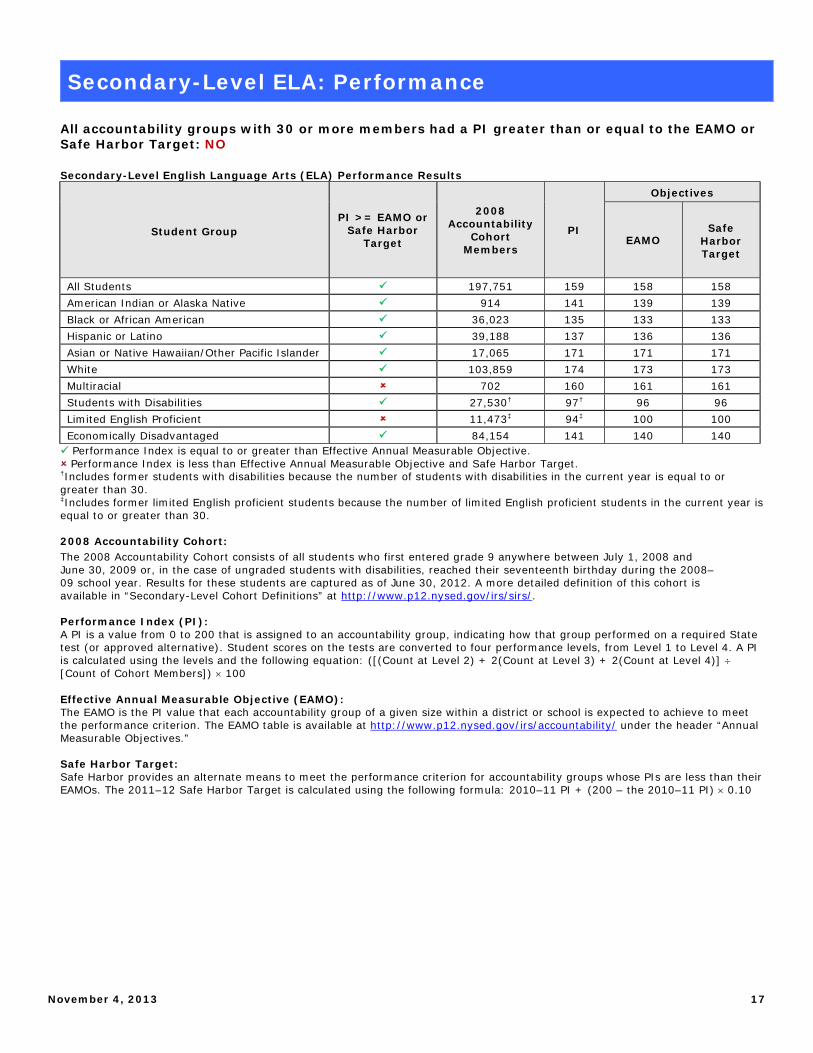
Secondary-Level ELA: Performance
All accountability groups with 30 or more members had a PI greater than or equal to the EAMO or Safe Harbor Target: NO Secondary-Level English Language Arts (ELA) Performance Results
Student Group PI >= EAMO or
Safe Harbor Target
2008 Accountability
Cohort Members
PI
Objectives
EAMO Safe
Harbor Target
All Students 197,751 159 158 158 American Indian or Alaska Native 914 141 139 139 Black or African American 36,023 135 133 133 Hispanic or Latino 39,188 137 136 136 Asian or Native Hawaiian/Other Pacific Islander 17,065 171 171 171 White 103,859 174 173 173 Multiracial 702 160 161 161 Students with Disabilities 27,530† 97† 96 96 Limited English Proficient 11,473‡ 94‡ 100 100 Economically Disadvantaged 84,154 141 140 140 Performance Index is equal to or greater than Effective Annual Measurable Objective. Performance Index is less than Effective Annual Measurable Objective and Safe Harbor Target. †Includes former students with disabilities because the number of students with disabilities in the current year is equal to or greater than 30. ‡Includes former limited English proficient students because the number of limited English proficient students in the current year is equal to or greater than 30. 2008 Accountability Cohort: The 2008 Accountability Cohort consists of all students who first entered grade 9 anywhere between July 1, 2008 and June 30, 2009 or, in the case of ungraded students with disabilities, reached their seventeenth birthday during the 2008–09 school year. Results for these students are captured as of June 30, 2012. A more detailed definition of this cohort is available in “Secondary-Level Cohort Definitions” at http://www.p12.nysed.gov/irs/sirs/. Performance Index (PI): A PI is a value from 0 to 200 that is assigned to an accountability group, indicating how that group performed on a required State test (or approved alternative). Student scores on the tests are converted to four performance levels, from Level 1 to Level 4. A PI is calculated using the levels and the following equation: ([(Count at Level 2) + 2(Count at Level 3) + 2(Count at Level 4)] [Count of Cohort Members]) 100 Effective Annual Measurable Objective (EAMO): The EAMO is the PI value that each accountability group of a given size within a district or school is expected to achieve to meet the performance criterion. The EAMO table is available at http://www.p12.nysed.gov/irs/accountability/ under the header “Annual Measurable Objectives.” Safe Harbor Target: Safe Harbor provides an alternate means to meet the performance criterion for accountability groups whose PIs are less than their EAMOs. The 2011–12 Safe Harbor Target is calculated using the following formula: 2010–11 PI + (200 – the 2010–11 PI) 0.10
November 4, 2013 18
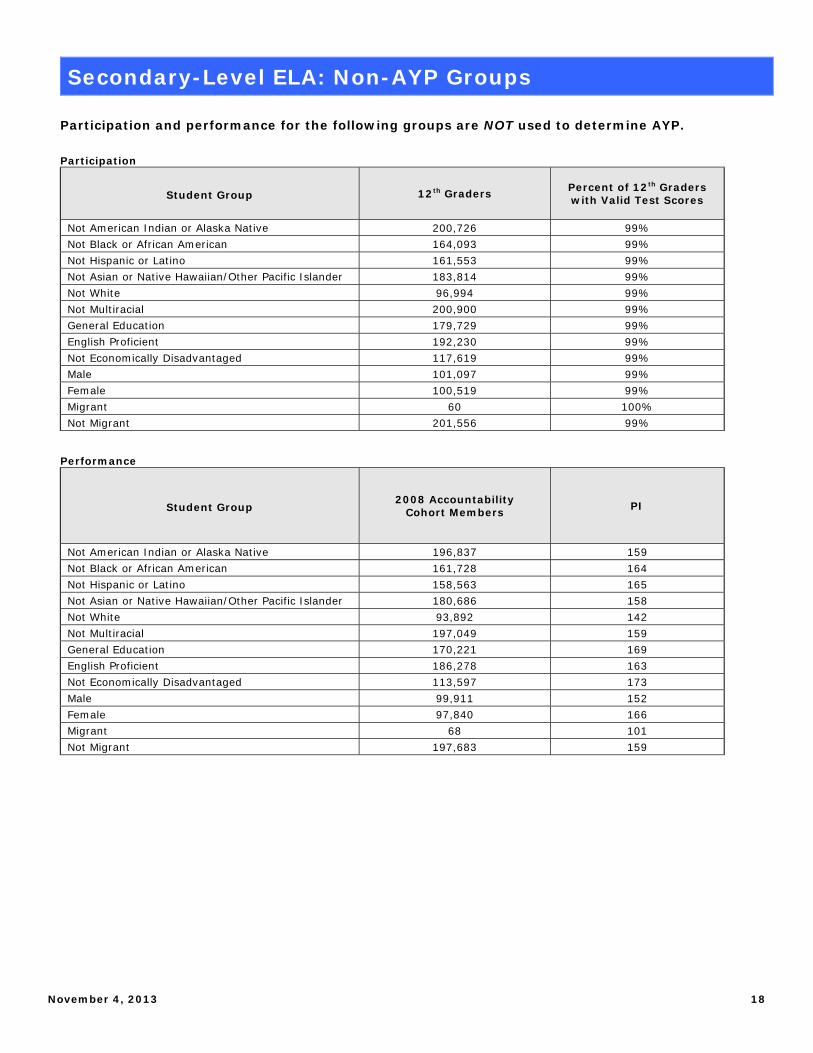
Secondary-Level ELA: Non-AYP Groups
Participation and performance for the following groups are NOT used to determine AYP. Participation
Student Group 12th Graders Percent of 12th Graders with Valid Test Scores
Not American Indian or Alaska Native 200,726 99% Not Black or African American 164,093 99% Not Hispanic or Latino 161,553 99% Not Asian or Native Hawaiian/Other Pacific Islander 183,814 99% Not White 96,994 99% Not Multiracial 200,900 99% General Education 179,729 99% English Proficient 192,230 99% Not Economically Disadvantaged 117,619 99% Male 101,097 99% Female 100,519 99% Migrant 60 100% Not Migrant 201,556 99%
Performance
Student Group 2008 Accountability
Cohort Members PI
Not American Indian or Alaska Native 196,837 159 Not Black or African American 161,728 164 Not Hispanic or Latino 158,563 165 Not Asian or Native Hawaiian/Other Pacific Islander 180,686 158 Not White 93,892 142 Not Multiracial 197,049 159 General Education 170,221 169 English Proficient 186,278 163 Not Economically Disadvantaged 113,597 173 Male 99,911 152 Female 97,840 166 Migrant 68 101 Not Migrant 197,683 159
November 4, 2013 19
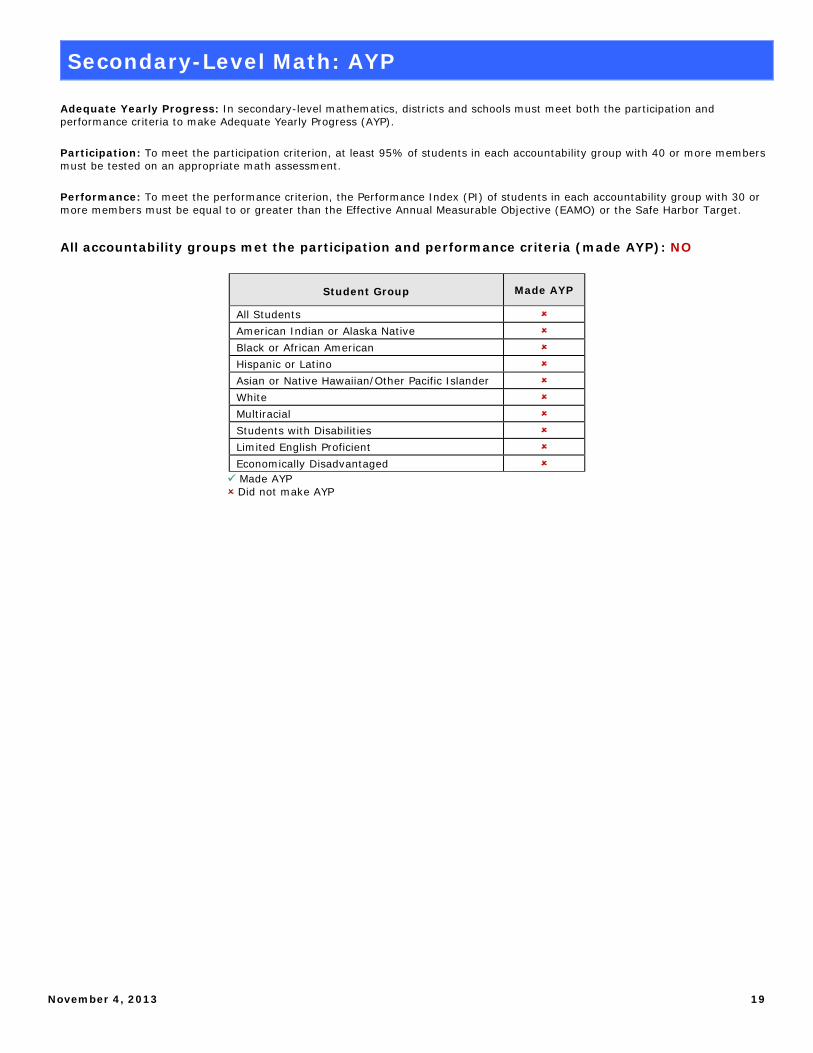
Secondary-Level Math: AYP
Adequate Yearly Progress: In secondary-level mathematics, districts and schools must meet both the participation and performance criteria to make Adequate Yearly Progress (AYP). Participation: To meet the participation criterion, at least 95% of students in each accountability group with 40 or more members must be tested on an appropriate math assessment. Performance: To meet the performance criterion, the Performance Index (PI) of students in each accountability group with 30 or more members must be equal to or greater than the Effective Annual Measurable Objective (EAMO) or the Safe Harbor Target.
All accountability groups met the participation and performance criteria (made AYP): NO
Student Group Made AYP
All Students American Indian or Alaska Native Black or African American Hispanic or Latino Asian or Native Hawaiian/Other Pacific Islander White Multiracial Students with Disabilities Limited English Proficient Economically Disadvantaged Made AYP Did not make AYP
November 4, 2013 20
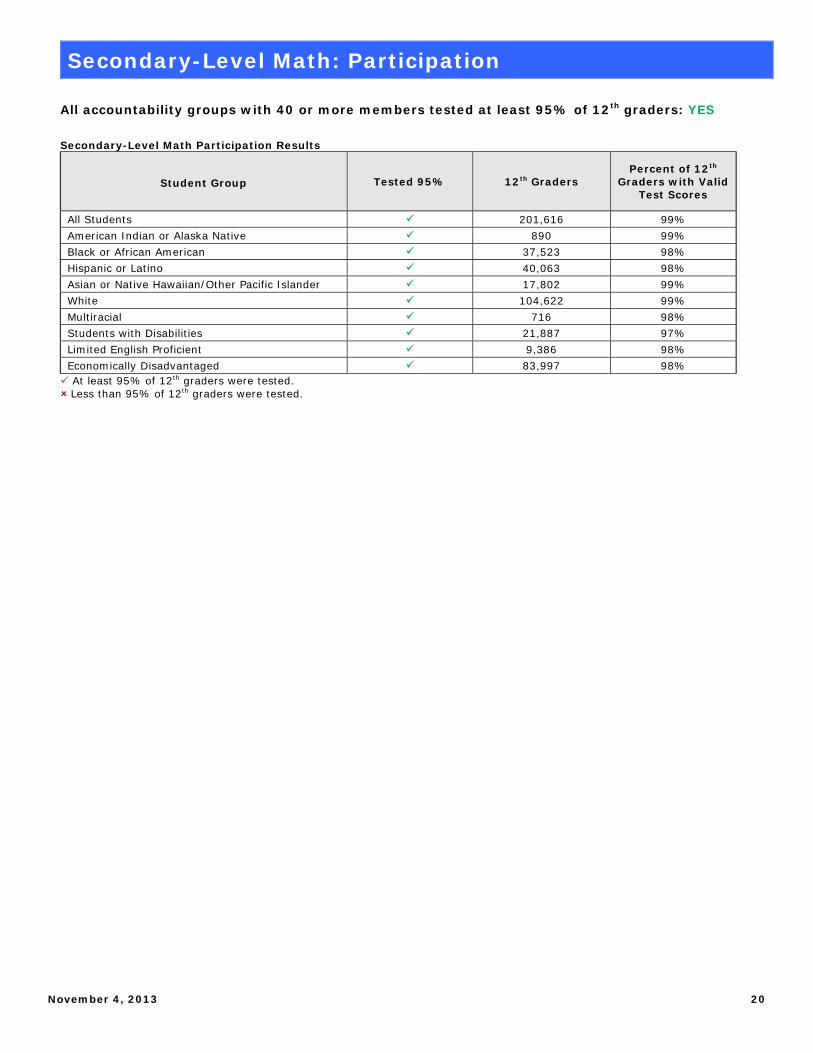
Secondary-Level Math: Participation
All accountability groups with 40 or more members tested at least 95% of 12th graders: YES Secondary-Level Math Participation Results
Student Group Tested 95% 12th Graders Percent of 12th
Graders with Valid Test Scores
All Students 201,616 99% American Indian or Alaska Native 890 99% Black or African American 37,523 98% Hispanic or Latino 40,063 98% Asian or Native Hawaiian/Other Pacific Islander 17,802 99% White 104,622 99% Multiracial 716 98% Students with Disabilities 21,887 97% Limited English Proficient 9,386 98% Economically Disadvantaged 83,997 98% At least 95% of 12th graders were tested. Less than 95% of 12th graders were tested.
November 4, 2013 21
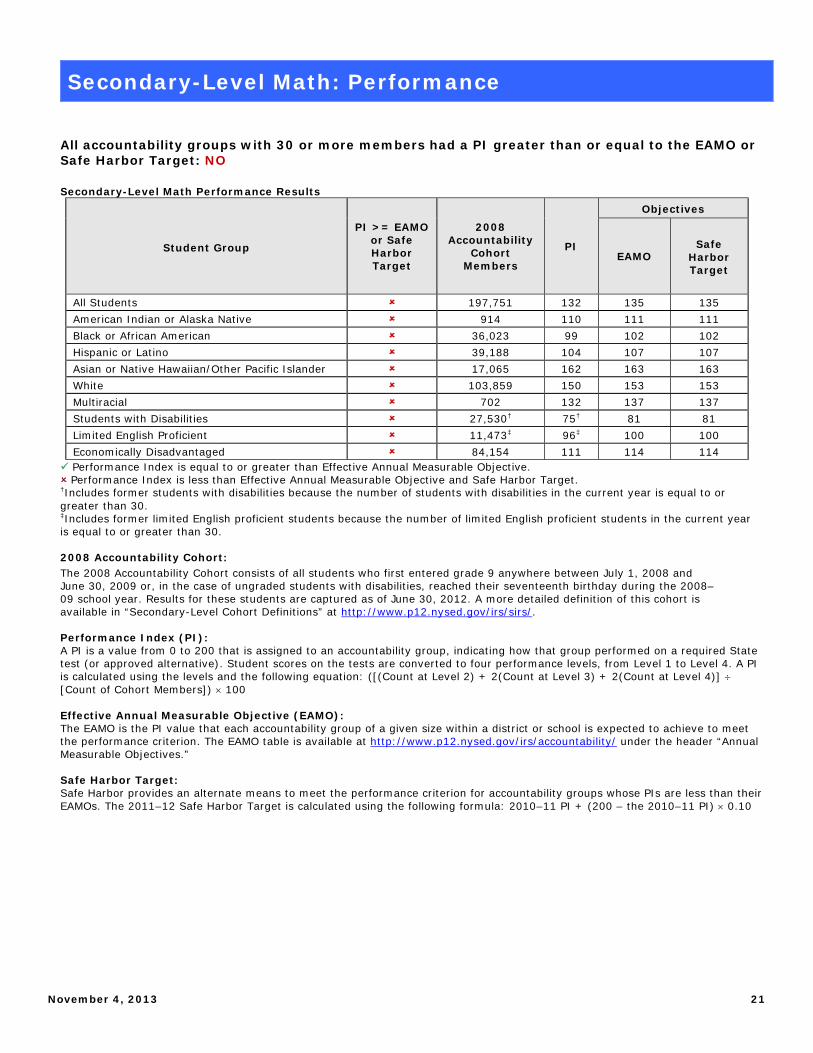
Secondary-Level Math: Performance
All accountability groups with 30 or more members had a PI greater than or equal to the EAMO or Safe Harbor Target: NO Secondary-Level Math Performance Results
Student Group
PI >= EAMO or Safe Harbor Target
2008 Accountability
Cohort Members
PI
Objectives
EAMO Safe
Harbor Target
All Students 197,751 132 135 135 American Indian or Alaska Native 914 110 111 111 Black or African American 36,023 99 102 102 Hispanic or Latino 39,188 104 107 107 Asian or Native Hawaiian/Other Pacific Islander 17,065 162 163 163 White 103,859 150 153 153 Multiracial 702 132 137 137 Students with Disabilities 27,530† 75† 81 81 Limited English Proficient 11,473‡ 96‡ 100 100 Economically Disadvantaged 84,154 111 114 114
Performance Index is equal to or greater than Effective Annual Measurable Objective. Performance Index is less than Effective Annual Measurable Objective and Safe Harbor Target. †Includes former students with disabilities because the number of students with disabilities in the current year is equal to or greater than 30. ‡Includes former limited English proficient students because the number of limited English proficient students in the current year is equal to or greater than 30. 2008 Accountability Cohort: The 2008 Accountability Cohort consists of all students who first entered grade 9 anywhere between July 1, 2008 and June 30, 2009 or, in the case of ungraded students with disabilities, reached their seventeenth birthday during the 2008–09 school year. Results for these students are captured as of June 30, 2012. A more detailed definition of this cohort is available in “Secondary-Level Cohort Definitions” at http://www.p12.nysed.gov/irs/sirs/. Performance Index (PI): A PI is a value from 0 to 200 that is assigned to an accountability group, indicating how that group performed on a required State test (or approved alternative). Student scores on the tests are converted to four performance levels, from Level 1 to Level 4. A PI is calculated using the levels and the following equation: ([(Count at Level 2) + 2(Count at Level 3) + 2(Count at Level 4)] [Count of Cohort Members]) 100 Effective Annual Measurable Objective (EAMO): The EAMO is the PI value that each accountability group of a given size within a district or school is expected to achieve to meet the performance criterion. The EAMO table is available at http://www.p12.nysed.gov/irs/accountability/ under the header “Annual Measurable Objectives.” Safe Harbor Target: Safe Harbor provides an alternate means to meet the performance criterion for accountability groups whose PIs are less than their EAMOs. The 2011–12 Safe Harbor Target is calculated using the following formula: 2010–11 PI + (200 – the 2010–11 PI) 0.10
November 4, 2013 22
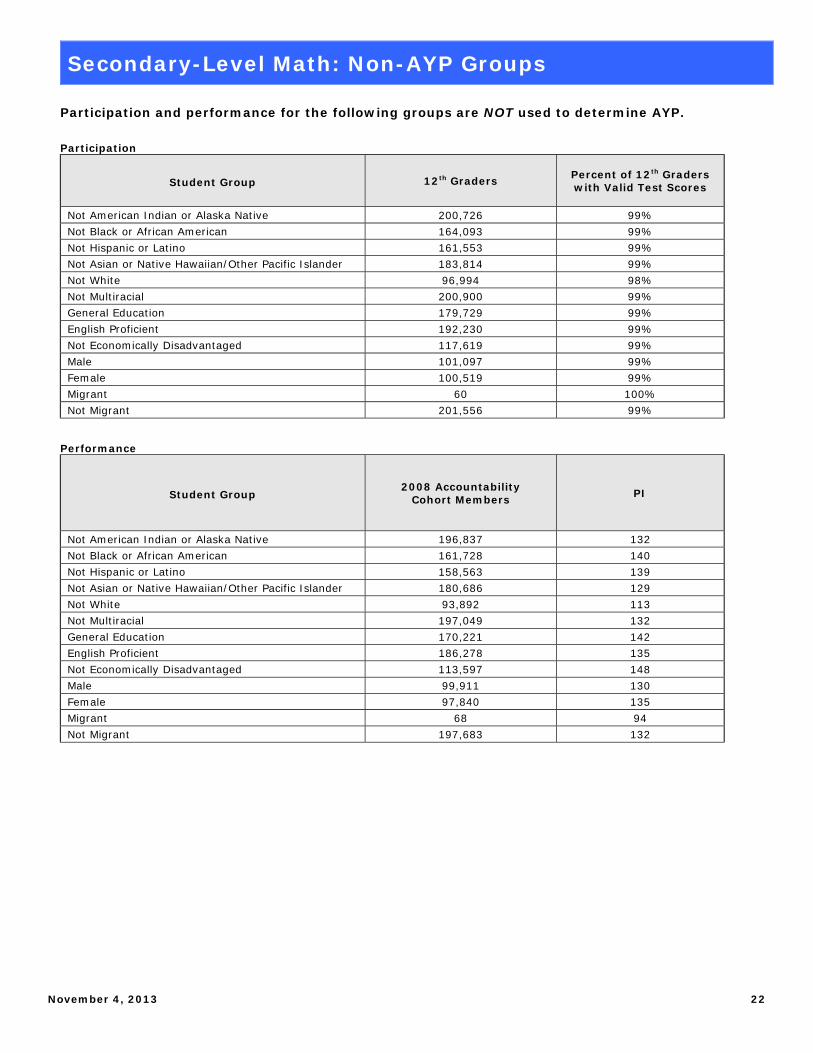
Secondary-Level Math: Non-AYP Groups
Participation and performance for the following groups are NOT used to determine AYP. Participation
Student Group 12th Graders Percent of 12th Graders with Valid Test Scores
Not American Indian or Alaska Native 200,726 99% Not Black or African American 164,093 99% Not Hispanic or Latino 161,553 99% Not Asian or Native Hawaiian/Other Pacific Islander 183,814 99% Not White 96,994 98% Not Multiracial 200,900 99% General Education 179,729 99% English Proficient 192,230 99% Not Economically Disadvantaged 117,619 99% Male 101,097 99% Female 100,519 99% Migrant 60 100% Not Migrant 201,556 99%
Performance
Student Group 2008 Accountability
Cohort Members PI
Not American Indian or Alaska Native 196,837 132 Not Black or African American 161,728 140 Not Hispanic or Latino 158,563 139 Not Asian or Native Hawaiian/Other Pacific Islander 180,686 129 Not White 93,892 113 Not Multiracial 197,049 132 General Education 170,221 142 English Proficient 186,278 135 Not Economically Disadvantaged 113,597 148 Male 99,911 130 Female 97,840 135 Migrant 68 94 Not Migrant 197,683 132
November 4, 2013 23
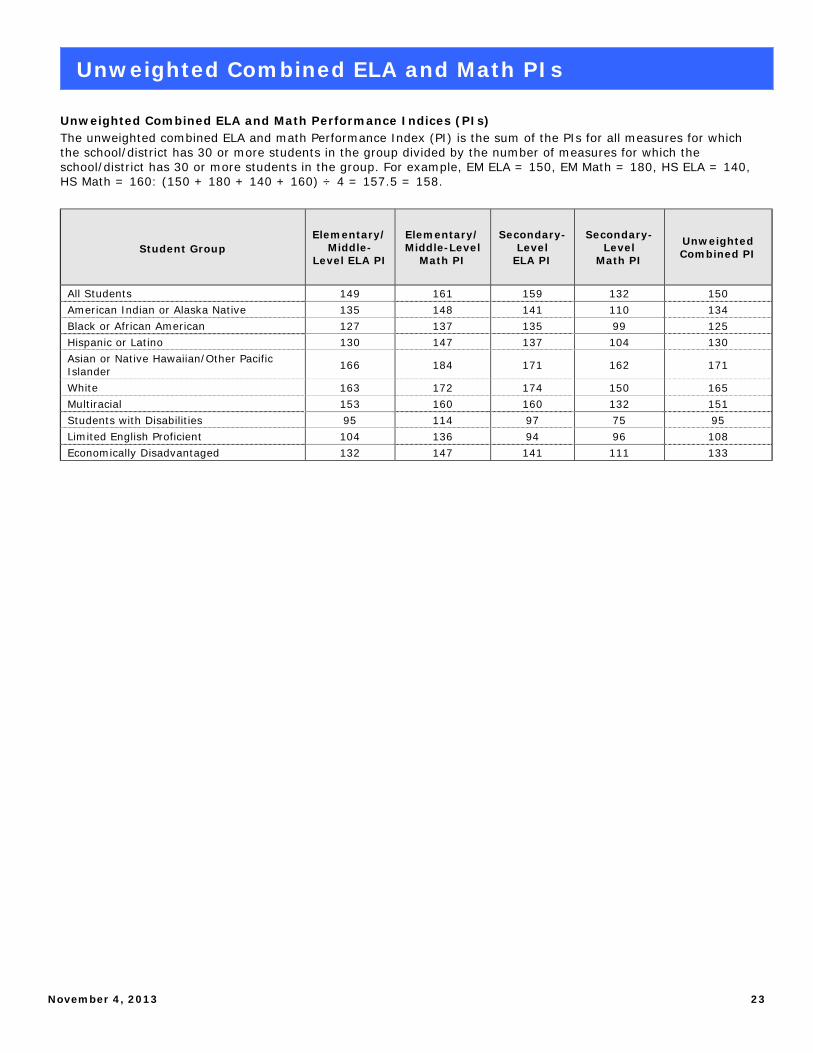
Unweighted Combined ELA and Math PIs
Unweighted Combined ELA and Math Performance Indices (PIs) The unweighted combined ELA and math Performance Index (PI) is the sum of the PIs for all measures for which the school/district has 30 or more students in the group divided by the number of measures for which the school/district has 30 or more students in the group. For example, EM ELA = 150, EM Math = 180, HS ELA = 140, HS Math = 160: (150 + 180 + 140 + 160) ÷ 4 = 157.5 = 158.
Student Group Elementary/
Middle-Level ELA PI
Elementary/ Middle-Level
Math PI
Secondary-Level
ELA PI
Secondary-Level
Math PI
Unweighted Combined PI
All Students 149 161 159 132 150 American Indian or Alaska Native 135 148 141 110 134 Black or African American 127 137 135 99 125 Hispanic or Latino 130 147 137 104 130 Asian or Native Hawaiian/Other Pacific Islander 166 184 171 162 171
White 163 172 174 150 165 Multiracial 153 160 160 132 151 Students with Disabilities 95 114 97 75 95 Limited English Proficient 104 136 94 96 108 Economically Disadvantaged 132 147 141 111 133
November 4, 2013 24
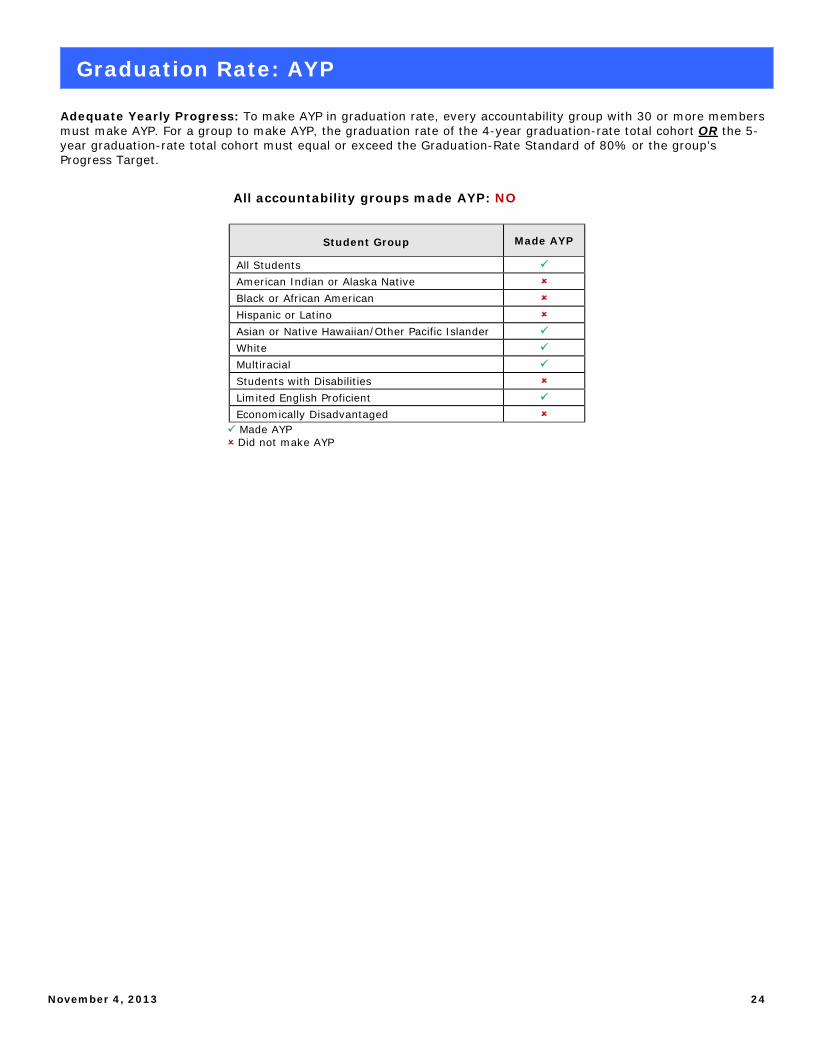
Graduation Rate: AYP
Adequate Yearly Progress: To make AYP in graduation rate, every accountability group with 30 or more members must make AYP. For a group to make AYP, the graduation rate of the 4-year graduation-rate total cohort OR the 5-year graduation-rate total cohort must equal or exceed the Graduation-Rate Standard of 80% or the group’s Progress Target.
All accountability groups made AYP: NO
Student Group Made AYP
All Students American Indian or Alaska Native Black or African American Hispanic or Latino Asian or Native Hawaiian/Other Pacific Islander White Multiracial Students with Disabilities Limited English Proficient Economically Disadvantaged Made AYP Did not make AYP
November 4, 2013 25
Graduation Rate: 4-Year Graduation-Rate Total Cohort
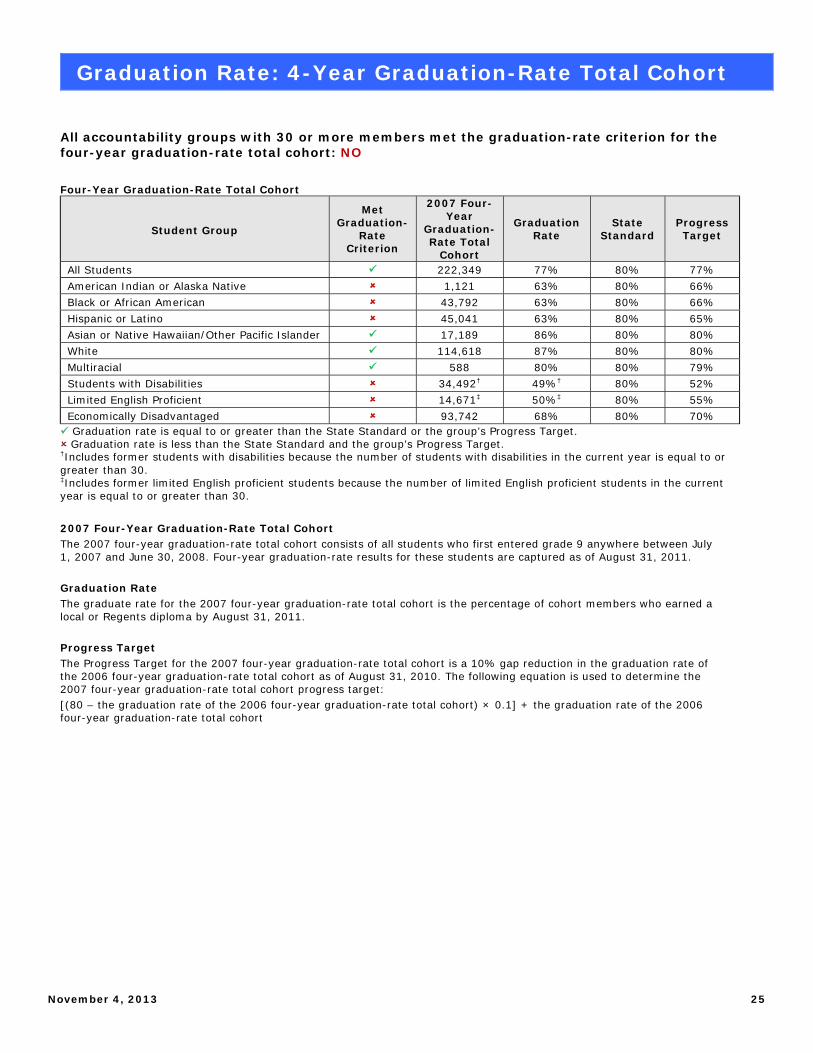
All accountability groups with 30 or more members met the graduation-rate criterion for the four-year graduation-rate total cohort: NO Four-Year Graduation-Rate Total Cohort
Student Group
Met Graduation-
Rate Criterion
2007 Four-Year
Graduation-Rate Total
Cohort
Graduation Rate
State Standard
Progress Target
All Students 222,349 77% 80% 77% American Indian or Alaska Native 1,121 63% 80% 66% Black or African American 43,792 63% 80% 66% Hispanic or Latino 45,041 63% 80% 65% Asian or Native Hawaiian/Other Pacific Islander 17,189 86% 80% 80% White 114,618 87% 80% 80% Multiracial 588 80% 80% 79% Students with Disabilities 34,492† 49%† 80% 52% Limited English Proficient 14,671‡ 50%‡ 80% 55% Economically Disadvantaged 93,742 68% 80% 70% Graduation rate is equal to or greater than the State Standard or the group’s Progress Target. Graduation rate is less than the State Standard and the group’s Progress Target. †Includes former students with disabilities because the number of students with disabilities in the current year is equal to or greater than 30. ‡Includes former limited English proficient students because the number of limited English proficient students in the current year is equal to or greater than 30.
2007 Four-Year Graduation-Rate Total Cohort The 2007 four-year graduation-rate total cohort consists of all students who first entered grade 9 anywhere between July 1, 2007 and June 30, 2008. Four-year graduation-rate results for these students are captured as of August 31, 2011. Graduation Rate The graduate rate for the 2007 four-year graduation-rate total cohort is the percentage of cohort members who earned a local or Regents diploma by August 31, 2011. Progress Target The Progress Target for the 2007 four-year graduation-rate total cohort is a 10% gap reduction in the graduation rate of the 2006 four-year graduation-rate total cohort as of August 31, 2010. The following equation is used to determine the 2007 four-year graduation-rate total cohort progress target: [(80 – the graduation rate of the 2006 four-year graduation-rate total cohort) × 0.1] + the graduation rate of the 2006 four-year graduation-rate total cohort
November 4, 2013 26
Graduation Rate: 5-Year Graduation-Rate Total Cohort
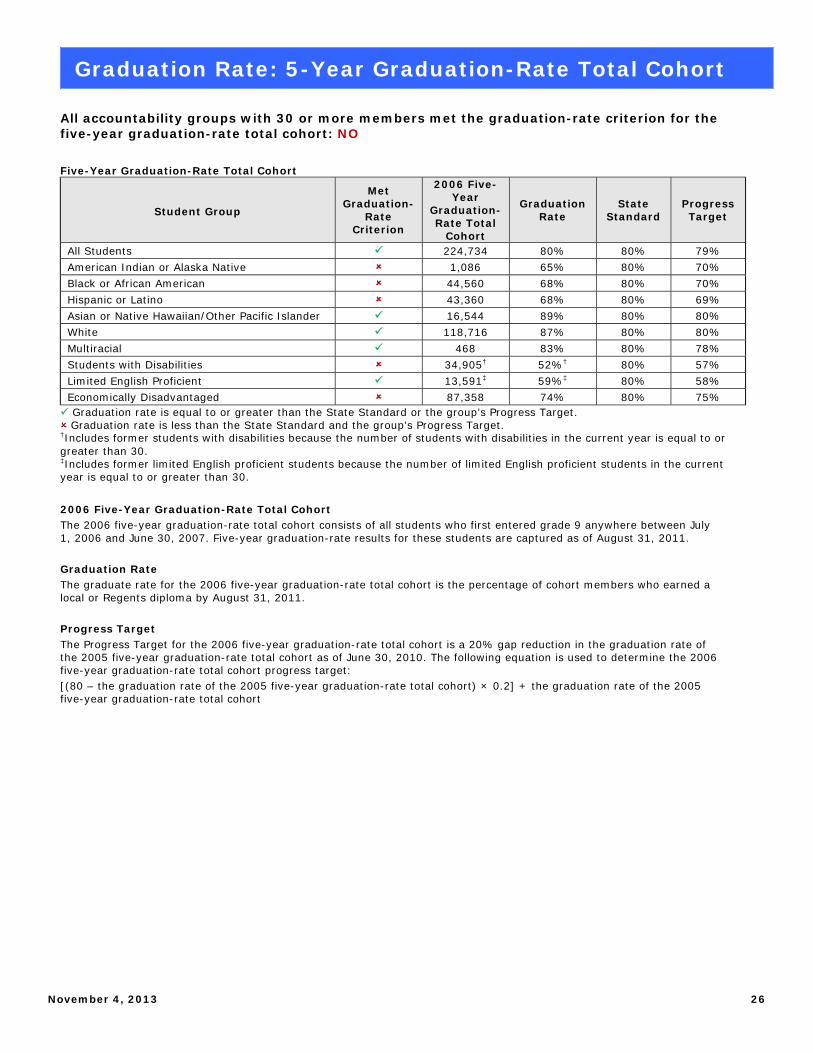
All accountability groups with 30 or more members met the graduation-rate criterion for the five-year graduation-rate total cohort: NO
Five-Year Graduation-Rate Total Cohort
Student Group
Met Graduation-
Rate Criterion
2006 Five-Year
Graduation-Rate Total
Cohort
Graduation Rate
State Standard
Progress Target
All Students 224,734 80% 80% 79% American Indian or Alaska Native 1,086 65% 80% 70% Black or African American 44,560 68% 80% 70% Hispanic or Latino 43,360 68% 80% 69% Asian or Native Hawaiian/Other Pacific Islander 16,544 89% 80% 80% White 118,716 87% 80% 80% Multiracial 468 83% 80% 78% Students with Disabilities 34,905† 52%† 80% 57% Limited English Proficient 13,591‡ 59%‡ 80% 58% Economically Disadvantaged 87,358 74% 80% 75% Graduation rate is equal to or greater than the State Standard or the group’s Progress Target. Graduation rate is less than the State Standard and the group’s Progress Target. †Includes former students with disabilities because the number of students with disabilities in the current year is equal to or greater than 30. ‡Includes former limited English proficient students because the number of limited English proficient students in the current year is equal to or greater than 30.
2006 Five-Year Graduation-Rate Total Cohort The 2006 five-year graduation-rate total cohort consists of all students who first entered grade 9 anywhere between July 1, 2006 and June 30, 2007. Five-year graduation-rate results for these students are captured as of August 31, 2011. Graduation Rate The graduate rate for the 2006 five-year graduation-rate total cohort is the percentage of cohort members who earned a local or Regents diploma by August 31, 2011. Progress Target The Progress Target for the 2006 five-year graduation-rate total cohort is a 20% gap reduction in the graduation rate of the 2005 five-year graduation-rate total cohort as of June 30, 2010. The following equation is used to determine the 2006 five-year graduation-rate total cohort progress target: [(80 – the graduation rate of the 2005 five-year graduation-rate total cohort) × 0.2] + the graduation rate of the 2005 five-year graduation-rate total cohort
November 4, 2013 27
Graduation Rate: Non-AYP
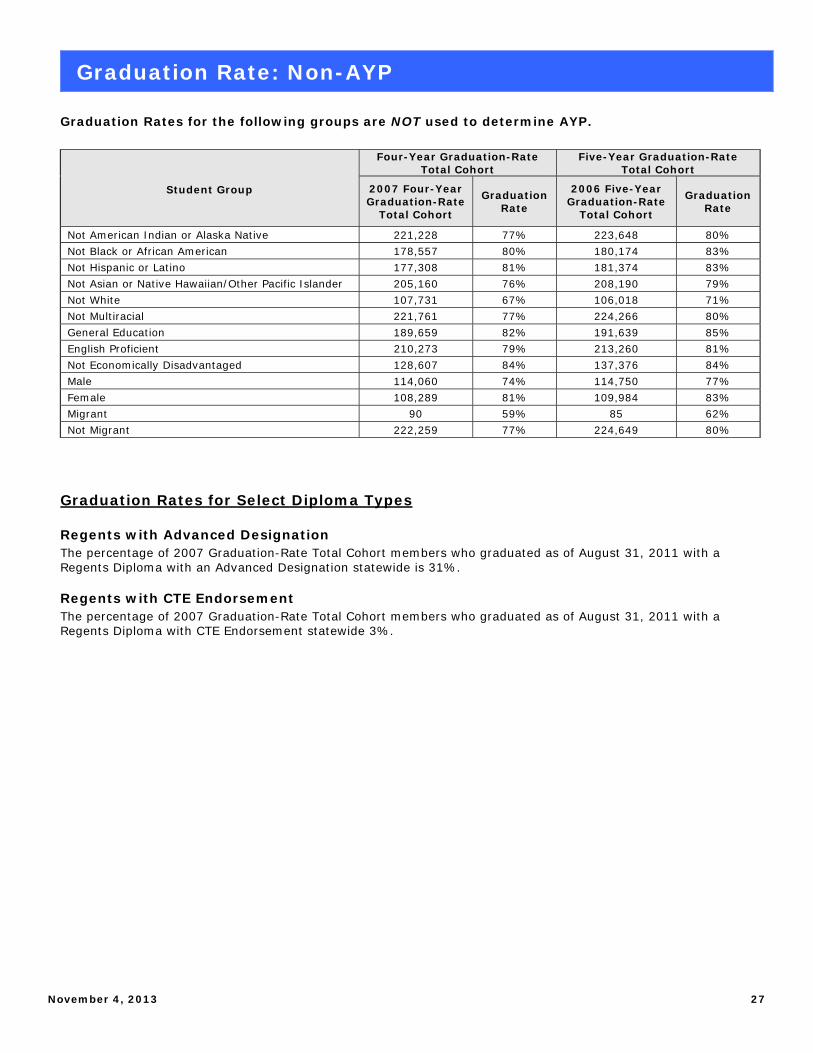
Graduation Rates for the following groups are NOT used to determine AYP.
Student Group
Four-Year Graduation-Rate Total Cohort
Five-Year Graduation-Rate Total Cohort
2007 Four-Year Graduation-Rate
Total Cohort
Graduation Rate
2006 Five-Year Graduation-Rate
Total Cohort
Graduation Rate
Not American Indian or Alaska Native 221,228 77% 223,648 80% Not Black or African American 178,557 80% 180,174 83% Not Hispanic or Latino 177,308 81% 181,374 83% Not Asian or Native Hawaiian/Other Pacific Islander 205,160 76% 208,190 79% Not White 107,731 67% 106,018 71% Not Multiracial 221,761 77% 224,266 80% General Education 189,659 82% 191,639 85% English Proficient 210,273 79% 213,260 81% Not Economically Disadvantaged 128,607 84% 137,376 84% Male 114,060 74% 114,750 77% Female 108,289 81% 109,984 83% Migrant 90 59% 85 62% Not Migrant 222,259 77% 224,649 80%
Graduation Rates for Select Diploma Types Regents with Advanced Designation The percentage of 2007 Graduation-Rate Total Cohort members who graduated as of August 31, 2011 with a Regents Diploma with an Advanced Designation statewide is 31%. Regents with CTE Endorsement The percentage of 2007 Graduation-Rate Total Cohort members who graduated as of August 31, 2011 with a Regents Diploma with CTE Endorsement statewide 3%.