Embed Size (px)
Citation preview
AFRICAN DEVELOPMENT BANK GROUP
THE ONE BANK RESULTS MEASUREMENT FRAMEWORK 2013-2016
December 2013
Quality Assurance & Results Department Results Division
i
NOTE ON THE PROCESS
This is the final draft of the Bank Group’s Results Measurement Framework (RMF). An earlier
version of the paper was discussed at CODE in September 2013 and endorsed for submission to
the Board of Directors for final approval. (A first draft was shared with Board members and ADF
Deputies in May 2013 ahead of the second ADF replenishment meeting in June). The final draft
has been revised in the light of comments received from CODE members and ADF Deputies.
This new RMF draws on extensive research. It not only builds on lessons learnt from experience
in implementing the previous RMF, but also benefits from consultations from other multilateral
development institutions: the World Bank, the Asian Development Bank, the Inter-American
Development Bank, the International Fund for Agricultural Development, and the European Bank
for Reconstruction and Development. The OECD has been another important source of
information on best practice in measuring inclusive growth, green growth and development in
fragile states.1
This paper should be read in tandem with the Glossary of Indicators, which provides details on the
rationale, definition, methodology and sources for each of the indicators suggested in this RMF.
1 The Bank benefitted from work done by the International Network on Conflict and Fragility, the Green
Growth Knowledge Platform, and the OECD Initiative on Inclusive Growth.
ii
C O N T E N T S
EXECUTIVE SUMMARY .............................................................................................. III
I. INTRODUCTION ............................................................................................................... 1
II. GUIDING PRINCIPLES AND AREAS OF SPECIAL ATTENTION .......................................................... 2 A. Aligning the RMF on the Bank’s Strategy (2013-2022) .................................................. 3 B. Better assessing the Bank’s impact on development .................................................... 4 C. Stronger focus on gender ............................................................................................... 5 D. Value for money ............................................................................................................. 5 E. Ambitious targets that stretch the Bank’s performance ............................................... 6 F. Harmonising indicators across MDBs ............................................................................. 6
III. THE NEW RESULTS MEASUREMENT FRAMEWORK .................................................................... 7 A. Level 1: What development progress is Africa making? ................................................ 7 B. Level 2: How well is AfDB contributing to development in Africa? ............................. 10 C. Level 3: Is AfDB managing its operations effectively? ................................................. 13 D. Level 4: Is AfDB managing itself efficiently? ................................................................ 16
IV. MANAGING FOR RESULTS .................................................................................................18 A. Improving corporate performance .............................................................................. 18 B. Increasing country-level focus on results ..................................................................... 18 C. Better managing project results ................................................................................... 19
V. CONCLUSION AND OUTLOOK .............................................................................................20
TABLES TABLE 1 — What development progress is Africa making (Level 1)? ............................................................... 9 TABLE 2 — How well is AfDB contributing to development in Africa (Level 2)? .............................................. 12 TABLE 3 — Is AfDB managing its operations effectively (Level 3)? ................................................................ 15 TABLE 4 — Is AfDB managing itself efficiently (Level 4)? .............................................................................. 17
FIGURES
FIGURE 1 — Milestones in implementing the results agenda ......................................................................... 1 FIGURE 2 — Aligning the RMF with the Strategy 2013-2022 .......................................................................... 3
BOXES
BOX 1 — Understanding development chains: Helping manufacturing to thrive in Ethiopia ............................. 4 BOX 2 — Three areas of special emphasis .................................................................................................. 11 BOX 3 — Mapping for results .................................................................................................................... 19
iii
E X E C U T I V E S U M M A R Y
Emerging challenges: Improving the quality of Africa’s growth
Africa, where around one-third of the countries are growing by more than 6% a year, is the world’s
fastest-growing continent. This new economic dynamism is more than just a resource boom; it is the
result of dramatic improvements in economic management. Today, one of Africa’s main development
challenges is sustaining the pace of growth over the long term so that its benefits are equitably shared.
To this end, the African Development Bank’s Strategy (2013-2022) is designed to support Africa’s
continued growth in ways that are inclusive and sustainable and that make the best use of Africa’s
natural resources.
As the Bank embarks on this strategy, it needs a corporate management tool that will help it meet its
development goals—a tool that brings together evidence of the Bank’s strengths and weaknesses so
that Management can chart a course of action that helps the Bank implement its strategy in the most
effective and efficient way possible.
The Bank’s new Results Measurement Framework (2013-2016) is intended to be such a tool.
Measuring the Bank’s performance in meeting its development goals is a complex undertaking. To do
this, the Results Measurement Framework (RMF) tracks around 100 performance indicators organised
into four interconnected levels:
Development progress in Africa (Level 1)
AfDB’s contribution to development in Africa (Level 2)
AfDB’s operational performance (Level 3)
AfDB’s organisational efficiency (Level 4)
The new Results Measurement Framework
This paper presents the Bank’s fifth RMF. Since 2003, when the Bank first introduced this corporate
management tool, the size of the Bank and the scale of its operations have expanded considerably. Ten
years ago, the Bank was a centralised organisation with offices in only eight countries, fewer than
1000 staff and an active portfolio of UA 8 billion. Today, the Bank is Africa’s premier development
institution with offices in 34 countries, more than 2000 staff and an ongoing portfolio worth UA 22
billion.
Helping the Bank successfully meet its new ambitions is one of the RMF’s main objectives. It does so
by increasing attention to five critical areas:
Strategic focus. The Bank’s long-term strategy has identified two overarching goals: inclusive
growth and the transition to green growth. At Level 1, a better set of indicators improves the
way we measure Africa’s progress towards achieving these two goals. And at Level 2, the
Bank’s contributions towards achieving them are captured across the five operational priorities
set out in the strategy: infrastructure development, regional integration, private sector
development, skills and technology, and governance and accountability.
Better assessing the Bank’s development impact. Assessing the Bank’s development impact is
not an easy task, because development is a complex business involving many different actors.
To address this challenge we are putting additional emphasis on intermediate outcomes rather
than outputs. We are also improving our understanding of development impact by articulating
the linkages between the Bank’s activities and their impact. In addition, we are increasing
demand for and use of evidence-based policies by strengthening national statistical capacity
and scaling up the African Community of Practice on managing for development results.
Stronger focus on gender. Without greater equality between women and men, it will be
difficult for Africa to sustain its growth and meet its development objectives. This is why the
new RMF has strengthened its focus on gender at all four levels: more gender-specific
indicators have been introduced, and as much as possible, indicators are disaggregated by sex.
iv
Delivering better value for money. Delivering better value for money is central to the Bank’s
development mandate. It means ensuring that every dollar we invest delivers the greatest value
for our clients. It also means that we keep our costs under constant scrutiny and make sure that
all our resources—human and financial—are used efficiently and economically to deliver
maximum development impact.
Ambitious targets that stretch the Bank’s performance. Our clients expect the Bank to be
Africa’s premier development institution. To help us meet these expectations, we have set
ourselves exacting standards of performance for the Bank’s operations (Level 3) and
organisational efficiency (Level 4). Annual targets will help measure progress and prompt
timely corrective action. To achieve these goals during the budget process the Bank has
aligned its corporate performance indicators with the RMF targets, which have been cascaded
throughout the Bank’s complexes so that they all contribute to a common set of objectives.
Managing for development results
The Results Measurement Framework is first and foremost a management tool designed to improve
the Bank’s development effectiveness. It does so by enhancing the planning cycle, systematically
tracking performance and fostering organisational learning. One important challenge will be to
leverage this tool to strengthen the Bank’s results-oriented management culture. With this objective in
mind, the Bank is reinforcing the tools, processes and systems that underpin the RMF and ensure that
results inform the Bank’s strategies, operations and staff incentives. We are taking actions at four
different levels:
Tracking results throughout the project life-cycle. To ensure that each operation delivers
development outcomes, the Bank is revamping the tools it uses to track results from project
inception to project completion (log-frames, supervision reports, project completion reports).
In addition, our Readiness Reviews scrutinise all our public sector operations to make sure
they are fit for purpose and designed to achieve their development outcomes. Independent
evaluations of our operations show that in 2012, 71% of our operations met or exceeded their
development objectives (Level 2).
Monitoring results in “real time.” So far, the Bank has been in a position only to monitor
results of completed operations. The Results Reporting System, which was piloted in 2013 and
will be rolled out in 2014, will provide Management with real-time information on the results
for ongoing operations. It will also track portfolio performance by sector, region and country,
providing Management with critical information to further improve portfolio performance
(Level 3).
Mapping the Bank’s portfolio of ongoing operations. Mapping the geographic location of the
Bank’s portfolio allows the Bank to improve the geographic allocations of its resources and to
provide stakeholders and citizens with a better understanding of the Bank’s activities and their
impact on local development. Our new geocoding tool—MapAfrica—has already mapped our
entire ongoing portfolio (732 operations), and a web-based interface will go live in 2014.
Assessing the Bank’s development effectiveness. Finally, to capture our contribution to
Africa’s development, we have launched a series of Development Effectiveness Reviews.
Each review focuses on the fundamental challenges of development on the African continent;
the first set focused on governance, regional integration and countries in situations of fragility,
and future editions will focus on other themes and groups of countries. These reviews provide
important opportunities to draw lessons on what has worked well and where the Bank can do
better.
A learning organisation
To achieve its development goals, the African Development Bank has to be a learning organisation
committed to improving its operations continuously, an organisation that draws lessons from past and
ongoing activities to inform its business decision-making. With the new RMF, and the management
information systems that underpin it, the Bank will be better equipped to improve the lives and
livelihoods of the people of Africa.
1
I. INTRODUCTION
1. In recent years, the African Development Bank (AfDB, or the Bank) has significantly
strengthened its focus on measuring development results. The Department for Quality Assurance
and Results (ORQR) was established in 2008 to support AfDB’s ambition to move from being a
volume- and target-driven organisation to becoming one that manages for results. ORQR supports
the Bank in improving our client countries’ development impact by ensuring consistency of
results measurement across operations, setting consistent standards for tracking results; and
ensuring that these results inform the Bank’s strategies, operations and incentives.
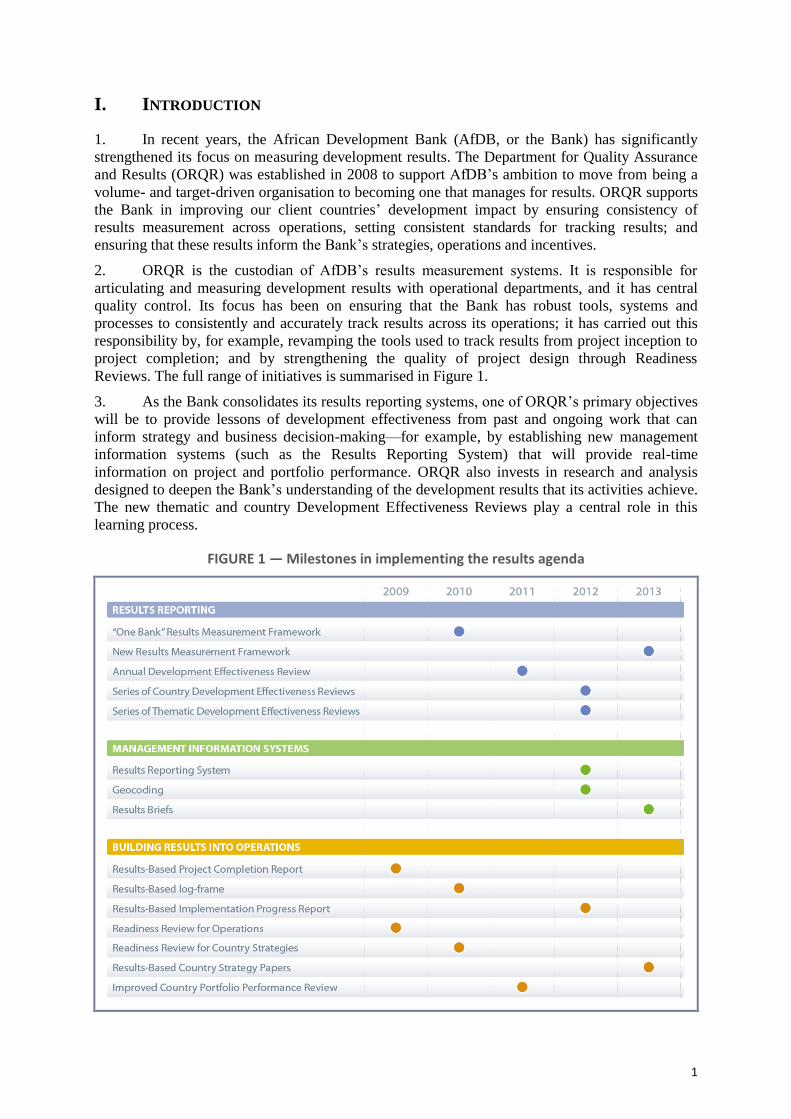
2. ORQR is the custodian of AfDB’s results measurement systems. It is responsible for
articulating and measuring development results with operational departments, and it has central
quality control. Its focus has been on ensuring that the Bank has robust tools, systems and
processes to consistently and accurately track results across its operations; it has carried out this
responsibility by, for example, revamping the tools used to track results from project inception to
project completion; and by strengthening the quality of project design through Readiness
Reviews. The full range of initiatives is summarised in Figure 1.
3. As the Bank consolidates its results reporting systems, one of ORQR’s primary objectives
will be to provide lessons of development effectiveness from past and ongoing work that can
inform strategy and business decision-making—for example, by establishing new management
information systems (such as the Results Reporting System) that will provide real-time
information on project and portfolio performance. ORQR also invests in research and analysis
designed to deepen the Bank’s understanding of the development results that its activities achieve.
The new thematic and country Development Effectiveness Reviews play a central role in this
learning process.
FIGURE 1 — Milestones in implementing the results agenda
2
4. Against this background, the purpose of this paper is to present the Bank’s organising
framework for measuring and managing for development results. Part II sets out the guiding
principles and areas of special attention, laying out the rationale for the changes made to the
Results Measurement Framework. Part III describes the structure and indicators proposed for each
of the four levels of the new Results Measurement Framework. Part IV discusses actions the Bank
is taking to strengthen a results-oriented management culture that shifts the Bank’s focus from
measuring results to managing for results.
5. A separate document, One Bank Results Measurement Framework (2013-2016) –
Glossary of Indicators, defines all indicators, providing a detailed rationale for the choice of the
indicators, an explanation of the methodology, and how each indicator is calculated.
II. GUIDING PRINCIPLES AND AREAS OF SPECIAL ATTENTION
6. Every organisation needs a yardstick by which to measure its performance. The African
Development Bank, like other multilateral development banks (MDBs), uses a set of performance
indicators to track progress against different aspects of its work; these indicators are set out in a
Results Measurement Framework (RMF).
7. This paper presents the Bank’s fifth RMF. Since 2003, when the Bank first introduced this
corporate management tool, the size of the Bank and the scale of its operations have expanded
considerably. Ten years ago, the Bank was a centralised organisation with offices in only eight
countries, fewer than 1000 staff and an active portfolio of UA 8 billion. Today, the Bank is
Africa’s premier development institution with offices in 34 countries, more than 2000 staff and an
ongoing portfolio worth UA 22 billion.
8. As the Bank begins implementing its new long-term strategy, it needs a corporate
management tool that will help it meet its development goals—a tool that brings together
evidence of the Bank’s strengths and weaknesses so that Management can chart a course of action
that helps the Bank implement its strategy as effectively and efficiently as possible.
9. The Bank’s new Results Measurement Framework (2013-2016) is intended to be such a
tool. Designing this tool is a complex undertaking—partly because the political, economic,
demographic and social dynamics of development are themselves complicated and intertwined,
and partly because organisations like the AfDB are complex institutions with many moving parts.
10. To address this inherent complexity and simplify the problem of measuring the Bank’s
contribution to development, the RMF starts from the assumption that to effectively contribute to
development, the Bank needs to meet conditions at four different levels:
Respond to Africa’s most pressing development needs and contribute to progress in key
development areas (Level 1).
Implement operations that contribute to Africa’s development (Level 2).
Manage the portfolio of operations effectively by ensuring, for example, that operations
are designed to achieve results and are smoothly implemented (Level 3).
Organise the Bank so that it is fit for purpose and makes best use of its human and
financial resources (Level 4).
11. The RMF tracks progress at all four of these levels. It uses a set of about 100 indicators
that provide a comprehensive and detailed picture of performance. These indicators allow us to
measure changes against our baselines and assess whether we are on track to meet our targets.
12. Since 2009, the RMF captures the aggregate contribution of the AfDB Group2 to
development, rather than just that of ADF resources. This is why it is now called the “One Bank”
RMF. It covers both public and private sector operations. In a similar vein, the RMF does not 2 The ADB Group includes AfDB, ADF, and the Nigeria Trust Fund.
3
report by department or product, but by Bankwide results and outcomes achieved. For example,
the results of private sector operations are presented as part of the Bank’s broader contributions to
energy, transport, or microfinance, and so on.
A. Aligning the RMF on the Bank’s Strategy (2013-2022)
13. Africa, where around one-third of the countries are growing by more than 6% each year, is
the world’s fastest-growing continent. This new economic dynamism is more than just a resource
boom; it is the result of dramatic improvements in economic management. Today, one of Africa’s
main development challenges is sustaining the pace of growth over the long term so that its
benefits are equitably shared. To this end, the Bank’s Strategy (2013-2022) is designed to support
Africa’s continued growth in ways that are socially inclusive and environmentally sustainable.
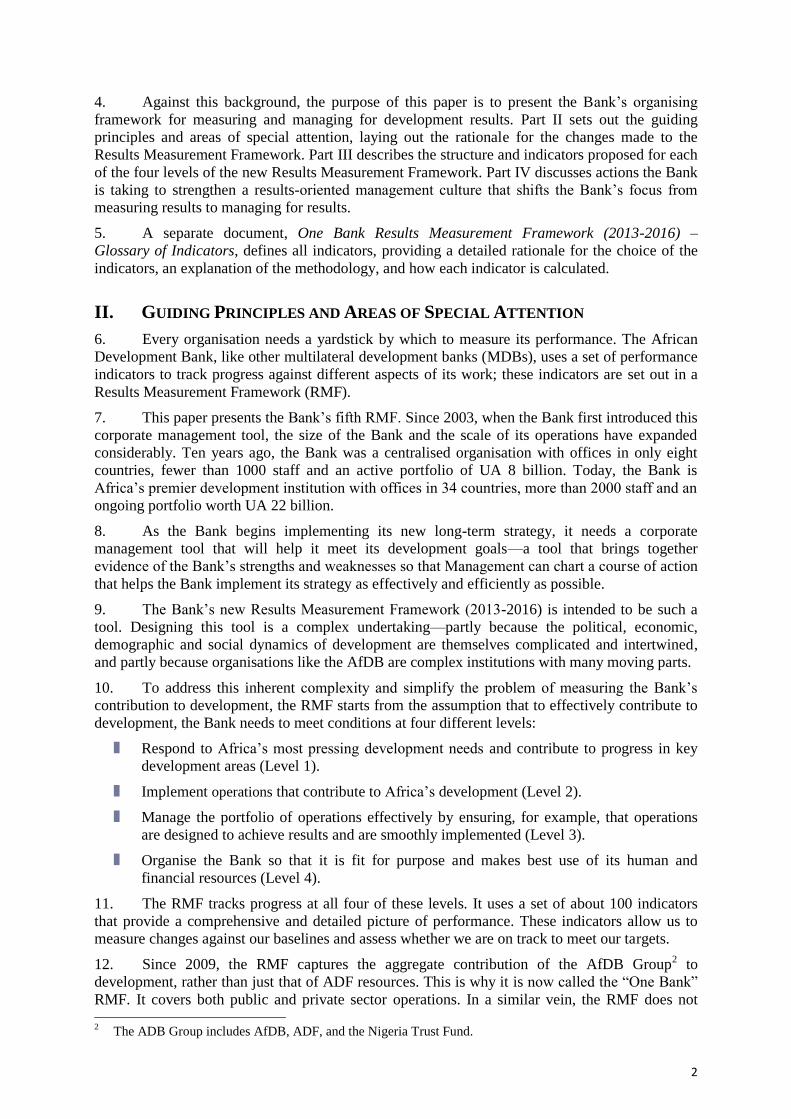
14. As the Bank embarks on this strategy, it needs to adjust the RMF to help it meet these new
development challenges. This is why the internal architecture of the RMF has been re-engineered
to match the priorities set out in Strategy 2013-2022 (Figure 2):
Level 1 monitors development progress against the two overarching goals: inclusive
growth and the transition towards green growth.
Level 2 captures the Bank’s five main channels to deliver its work and improve the quality
of growth in Africa: infrastructure development, regional integration, private sector
development, skills and technology, and governance and accountability.
Level 3 tracks the quality and effectiveness of the Bank’s operations.
Level 4 measures progress in important areas of internal reforms: decentralisation,
engaging and mobilising staff, and improving cost-efficiency.
15. The three areas of special emphasis—fragile states, agriculture and food security, and
gender—are mainstreamed across the RMF.
FIGURE 2 — Aligning the RMF with the Strategy 2013-2022
4
B. Better assessing the Bank’s impact on development
16. One of the most frequent critiques of results measurement frameworks is that they do not
do enough to assess the development impact of projects or programmes, and tend to focus too
much on project outputs— for example, the number of schools built by an education project—
which are easier to measure.
17. This is a problem that all development organisations struggle with, for a number of good
reasons. The first is conceptual: development outcomes (e.g., literacy rates) are the result of
multiple factors (economic, social, demographic) and multiple agents (state, private sector,
development agencies). So it is exceedingly difficult to assign an outcome to a single project,
programme, or set of activities. The second reason has to do with the timeline: development
activities typically take a number of years before they yield development outcomes. For instance,
an effective education programme might take two to three years after the project is completed
before it generates positive outcomes; as a result, these outcomes will not be captured in the
annual RMF. The third reason is paucity of data on outcomes. National or regional statistical
departments, on which projects rely for data on outcomes, often do not have relevant or timely
statistics.
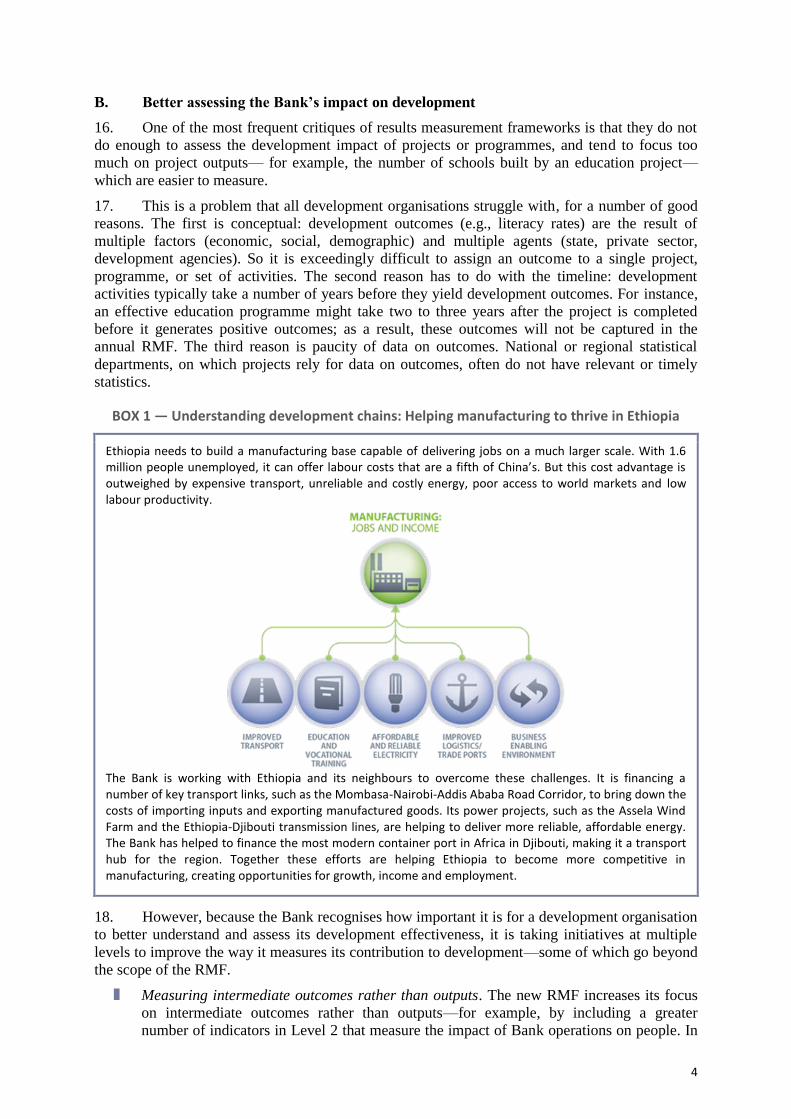
BOX 1 — Understanding development chains: Helping manufacturing to thrive in Ethiopia
Ethiopia needs to build a manufacturing base capable of delivering jobs on a much larger scale. With 1.6 million people unemployed, it can offer labour costs that are a fifth of China’s. But this cost advantage is outweighed by expensive transport, unreliable and costly energy, poor access to world markets and low labour productivity.
The Bank is working with Ethiopia and its neighbours to overcome these challenges. It is financing a number of key transport links, such as the Mombasa-Nairobi-Addis Ababa Road Corridor, to bring down the costs of importing inputs and exporting manufactured goods. Its power projects, such as the Assela Wind Farm and the Ethiopia-Djibouti transmission lines, are helping to deliver more reliable, affordable energy. The Bank has helped to finance the most modern container port in Africa in Djibouti, making it a transport hub for the region. Together these efforts are helping Ethiopia to become more competitive in manufacturing, creating opportunities for growth, income and employment.
18. However, because the Bank recognises how important it is for a development organisation
to better understand and assess its development effectiveness, it is taking initiatives at multiple
levels to improve the way it measures its contribution to development—some of which go beyond
the scope of the RMF.
Measuring intermediate outcomes rather than outputs. The new RMF increases its focus
on intermediate outcomes rather than outputs—for example, by including a greater
number of indicators in Level 2 that measure the impact of Bank operations on people. In
5
energy, for instance, the focus is less on the number of power stations constructed and
more on people benefitting from improved access to electricity. The beneficiaries are key,
and the output indicators provide some context for how the Bank’s work is improving
their lives and creating new economic opportunities
Improving the Bank’s understanding of development impact. A quantitative framework of
indicators can only go so far in articulating the linkages between the Bank’s activities and
their impact on a country’s development. Thus the Bank is increasingly investing in
qualitative analysis designed to deepen its understanding of the development results that
its activities are likely to achieve and help it design more effective programmes (see
Box 1). The new thematic and country Development Effectiveness Reviews (discussed in
Section IV) play a central role in this learning process.
Strengthening client capacities and demand for evidence-based policies. To overcome the
bottleneck of data availability, the Bank is investing in strengthening national statistical
capacity. It is also working through the African Community of Practice (AfCoP) to foster
demand for evidence-based policy-making (elaborated in Section IV).
C. Stronger focus on gender
19. Without achieving greater equality between women and men, Africa will not sustain its
growth and meet its development goals. While greater equality between men and women is a
development objective in its own right, it is also smart economics—investing in women and girls
boosts the pace of development progress and has a powerful impact on both women and men.
20. In recognition of the importance of gender as a driver of development progress, the new
RMF has strengthened its gender focus at all four levels:
Level 1: The RMF includes new, more robust gender indicators to track progress in areas
of special importance to the Bank’s strategic goal of inclusive growth—for example, the
RMF now includes an indicator that measures gender disparities in national labour
markets.
Level 2: To better measure the impact of Bank operations on women and girls, Level 2
indicators—especially those that track the number of beneficiaries of operations—are
disaggregated by sex, wherever possible.
Level 3: Better integrating gender dimensions into project design is fundamental to
ensuring that our operations do a better job at closing gender disparities. The RMF
systematically tracks progress in mainstreaming gender dimensions in public sector
operations and country strategy papers.
Level 4: The Bank recognises that it has a special responsibility to ensure gender equality
in its workforce. The new RMF has set ambitious targets for the share of women among
professional staff and management.
21. The Bank is also strengthening its management information systems so that they better
address the gender dimensions of Bank operations. In addition to the Readiness Reviews, the
Results Reporting System will also systematically prompt task managers to provide indicators that
are disaggregated by sex (see Section III).
D. Value for money
22. Delivering better value for money to the Bank’s stakeholders is central to the Bank’s
development mandate—it is in fact a principle that informs everything we do. It means that we
keep our costs under constant scrutiny and make sure that all our resources—human and
financial—are used efficiently and economically. In doing this, the Bank is guided by three
principles:
Effectiveness: successfully achieving the intended outcomes from an activity.
6
Efficiency: maximising output for a given input while ensuring the same standards of
quality.
Economy: reducing the cost of resources used for an activity while maintaining the same
standards of quality.
23. The RMF captures these three dimensions of value for money in different ways.
Effectiveness is measured by Level 2 performance indicators and summarised in the Bank’s
scorecard. The indicators assess the degree to which the Bank’s operations have achieved their
intended outcomes and outputs. In 2012, for example, 71% of the Bank’s operations met or
exceeded their operational targets.3 Efficiency and economy are measured by four indicators at
Level 4 of the RMF: (i) administrative costs per UA 1 million disbursed; (ii) cost of preparing a
lending project; (iii) annual cost of supporting project implementation; and (iv) work environment
cost per seat.4 Ambitious targets have been set for each of these indicators.
24. The Bank is committed to streamlining its operational, institutional and budgetary
processes, weighing time and resource costs against value-added. Better cost accounting will
strengthen the links between resources and results, as costs related to project design and
implementation are tracked to push for greater cost-efficiency in delivering outputs and outcomes.
To this end the Bank is developing a new Cost Accounting System to provide more accurate
information on the cost of delivering on the Bank’s commitments.
E. Ambitious targets that stretch the Bank’s performance
25. Our clients expect the Bank to be Africa’s premier development institution. To help us
meet these expectations, we have set ourselves exacting standards of performance. Our targets for
operational performance (Level 3) and organisational efficiency (Level 4) are ambitious and will
further stretch our performance.
26. From the previous RMF we have learnt to be diligent in our analysis of the data to ensure
that we set realistic targets. We have also learnt, when assessing baselines, to take into account
special contexts such as the financial crisis in 2010. The targets reflect what the Bank can
realistically achieve by 2016 through ambitious reforms to improve performance on all these
indicators.5 The RMF charts the way towards achieving the 2016 targets by setting annual targets
to closely monitor progress and prompt timely corrective action. To deliver on these targets, the
Bank is aligning its corporate performance indicators (KPIs) with the targets set in RMF.
27. Systematically tracking performance against these targets will help Management ensure
that the Bank keeps its institutional reforms on track. With the new monitoring tools and enhanced
operational systems, more detailed and timely data will be available to prompt corrective action
when and where needed.
F. Harmonising indicators across MDBs
28. In elaborating the new RMF, the Bank has examined the RMFs of all the major MDBs
with a view to harmonising performance indicators at all four levels. However, MDBs have
different mandates and corporate challenges, and there are limits to how much standardisation can
be achieved or is even desirable. The Bank often operates in very challenging environments: for
example, Africa has the largest share of fragile states, and most of its client countries are still
ADF-eligible. Thus even where similar indicators are used, they may not be comparable in all
institutions.
3 See Annual Development Effectiveness Review 2013, p. 41.
4 The RMF Glossary of Indicators provides a detailed definition of all these indicators.
5 See the ADF-13 Institutional Effectiveness and Efficiency paper for a more detailed account.
7
III. THE NEW RESULTS MEASUREMENT FRAMEWORK
29. This section describes the new RMF and explains for each of the four levels how the
innovations discussed in the previous section have been captured.
A. Level 1: What development progress is Africa making?
30. Level 1 tracks Africa’s overall development progress, using 32 performance indicators
that measure progress against the Bank’s two strategic goals: inclusive growth and the transition
towards green growth. Each indicator is assigned a “traffic light” score showing Africa’s progress
since 2005 relative to that of other developing regions.
A.1. Measuring inclusive growth
31. Inclusive growth not only fosters more opportunities for all but is also more effective at
reducing poverty and creating jobs. Work is under way to develop an index to measure progress
on inclusive growth in Africa.6 In the meantime, the RMF seeks to capture progress, directly or
indirectly, against the four dimensions of inclusive growth: economic inclusion, social inclusion,
spatial inclusion and political inclusion.
32. The main challenge in tracking inclusive growth is the availability of meaningful
indicators: robust metrics that have good geographic coverage and that are updated annually. To
overcome the data challenge, the RMF relies on a broad range of indicators, including proxy
indicators, organised in five categories.
Economic inclusion: Reducing poverty and income inequality. As African economies
grow, the benefits of this growth tend to accrue to a narrow section of the population.
Thus Africa has some of the highest rates of income inequality in the world.7 Reducing
poverty while securing a more even distribution of wealth is a way of both promoting
greater economic inclusion and sustaining the pace of growth. This dimension is measured
by four indicators that track growth, wealth (GDP per capita), poverty, and income
inequality (Gini coefficient).
Spatial inclusion: Expanding access to basic services. Spatial inclusion is about ensuring
that wherever communities are, they benefit from growth. One way of achieving this is by
making sure that everybody has access to some of the basic services that create economic
opportunities for all—access to roads, electricity, water and ICT.
Social inclusion: Ensuring equal opportunities for all. One of the objectives of social
inclusion is to ensure that everyone contributes to and benefits from growth. Africa’s
challenge is that whole swaths of the population are deprived of economic opportunities.
Outside agriculture, for example, only 8.5% of jobs are held by women; and youth
unemployment stands at 35%. These indicators capture inclusion in benefiting from
growth (education and health) and contributing to it in the labour market.
Political inclusion: Securing broad-based representation. Political inclusion requires
robust and accountable institutions that ensure democratic and broad-based representation
of citizens. It is measured through indicators that track governance (Mo Ibrahim Index),
the quality of institutions (CPIA indicator), and their ability to ensure broad-based
representation (taxation and inclusion of women).
Sustaining growth: Building competitive economies. Africa will need to sustain strong
6 AfDB Strategy (2013-2022), p. 11. This composite index aims at capturing the opportunities for
inclusiveness by emphasising the importance of productive employment, redistribution of resources to
engender equity, political inclusion, and economic empowerment through greater participation by women in
the labour market 7 Six of the ten most unequal countries in the world are in Africa, and there is not yet any evidence of progress
in reducing income inequality. See Annual Development Effectiveness Review 2013, p.13.
8
growth to lift more people out of poverty. Achieving this requires economies that are
competitive on a regional and global scale and that create opportunities for growth. These
qualities are measured through several proxies: intra-African trade, trading across borders,
global competitiveness, private sector environment (business start-up, access to credit),
and economic diversification.
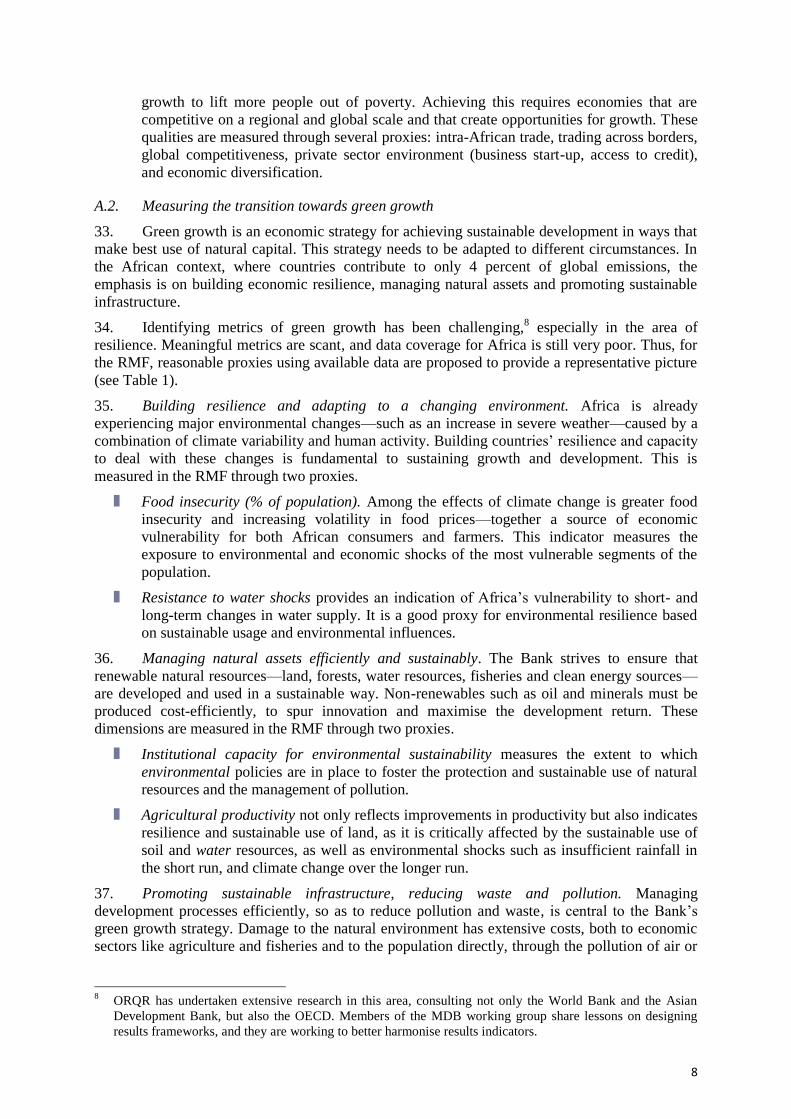
A.2. Measuring the transition towards green growth
33. Green growth is an economic strategy for achieving sustainable development in ways that
make best use of natural capital. This strategy needs to be adapted to different circumstances. In
the African context, where countries contribute to only 4 percent of global emissions, the
emphasis is on building economic resilience, managing natural assets and promoting sustainable
infrastructure.
34. Identifying metrics of green growth has been challenging,8 especially in the area of
resilience. Meaningful metrics are scant, and data coverage for Africa is still very poor. Thus, for
the RMF, reasonable proxies using available data are proposed to provide a representative picture
(see Table 1).
35. Building resilience and adapting to a changing environment. Africa is already
experiencing major environmental changes—such as an increase in severe weather—caused by a
combination of climate variability and human activity. Building countries’ resilience and capacity
to deal with these changes is fundamental to sustaining growth and development. This is
measured in the RMF through two proxies.
Food insecurity (% of population). Among the effects of climate change is greater food
insecurity and increasing volatility in food prices—together a source of economic
vulnerability for both African consumers and farmers. This indicator measures the
exposure to environmental and economic shocks of the most vulnerable segments of the
population.
Resistance to water shocks provides an indication of Africa’s vulnerability to short- and
long-term changes in water supply. It is a good proxy for environmental resilience based
on sustainable usage and environmental influences.
36. Managing natural assets efficiently and sustainably. The Bank strives to ensure that
renewable natural resources—land, forests, water resources, fisheries and clean energy sources—
are developed and used in a sustainable way. Non-renewables such as oil and minerals must be
produced cost-efficiently, to spur innovation and maximise the development return. These
dimensions are measured in the RMF through two proxies.
Institutional capacity for environmental sustainability measures the extent to which
environmental policies are in place to foster the protection and sustainable use of natural
resources and the management of pollution.
Agricultural productivity not only reflects improvements in productivity but also indicates
resilience and sustainable use of land, as it is critically affected by the sustainable use of
soil and water resources, as well as environmental shocks such as insufficient rainfall in
the short run, and climate change over the longer run.
37. Promoting sustainable infrastructure, reducing waste and pollution. Managing
development processes efficiently, so as to reduce pollution and waste, is central to the Bank’s
green growth strategy. Damage to the natural environment has extensive costs, both to economic
sectors like agriculture and fisheries and to the population directly, through the pollution of air or
8 ORQR has undertaken extensive research in this area, consulting not only the World Bank and the Asian
Development Bank, but also the OECD. Members of the MDB working group share lessons on designing
results frameworks, and they are working to better harmonise results indicators.
9
drinking water. Managing waste products well can help to sustain high growth rates and avoid
negative impacts on communities. The RMF measures these dimensions through two proxies.
Production efficiency (CO2 emissions as a share of GDP). This is not a measure of CO2
mitigation but rather a proxy of the economic efficiency of the production process. As
production processes become increasingly sophisticated, CO2 intensities per unit will
decline, indicating more efficient use of the resources along with reduced waste and
decreased pollution for the people of Africa.
Renewable energy (% total electricity produced) measures how well Africa is using its
vast hydro, geothermal, photovoltaic and wind energy to generate increased electricity
supply from renewable energy sources.
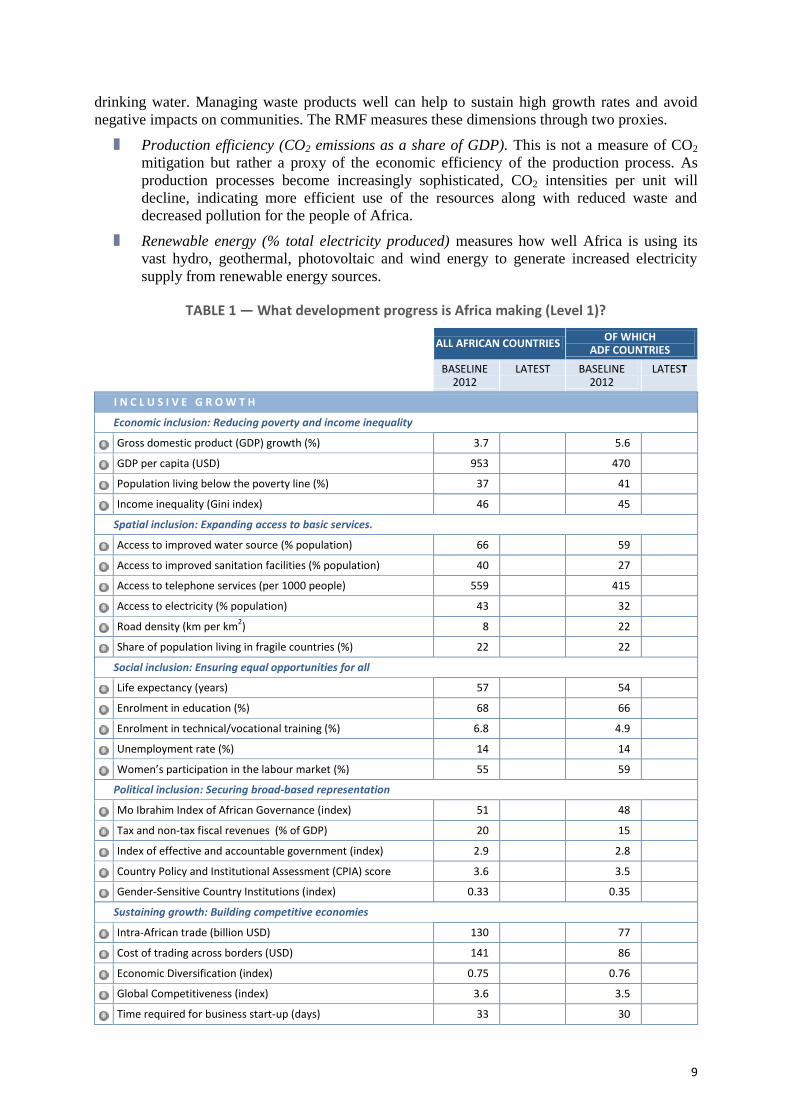
TABLE 1 — What development progress is Africa making (Level 1)?
ALL AFRICAN COUNTRIES
OF WHICH ADF COUNTRIES
BASELINE
2012 LATEST BASELINE
2012 LATEST
I N C L U S I V E G R O W T H
Economic inclusion: Reducing poverty and income inequality
Gross domestic product (GDP) growth (%) 3.7 5.6
GDP per capita (USD) 953 470
Population living below the poverty line (%) 37 41
Income inequality (Gini index) 46 45
Spatial inclusion: Expanding access to basic services.
Access to improved water source (% population) 66 59
Access to improved sanitation facilities (% population) 40 27
Access to telephone services (per 1000 people) 559 415
Access to electricity (% population) 43 32
Road density (km per km2) 8 22
Share of population living in fragile countries (%) 22 22
Social inclusion: Ensuring equal opportunities for all
Life expectancy (years) 57 54
Enrolment in education (%) 68 66
Enrolment in technical/vocational training (%) 6.8 4.9
Unemployment rate (%) 14 14
Women’s participation in the labour market (%) 55 59
Political inclusion: Securing broad-based representation
Mo Ibrahim Index of African Governance (index) 51 48
Tax and non-tax fiscal revenues (% of GDP) 20 15
Index of effective and accountable government (index) 2.9 2.8
Country Policy and Institutional Assessment (CPIA) score 3.6 3.5
Gender-Sensitive Country Institutions (index) 0.33 0.35
Sustaining growth: Building competitive economies
Intra-African trade (billion USD) 130 77
Cost of trading across borders (USD) 141 86
Economic Diversification (index) 0.75 0.76
Global Competitiveness (index) 3.6 3.5
Time required for business start-up (days) 33 30
10
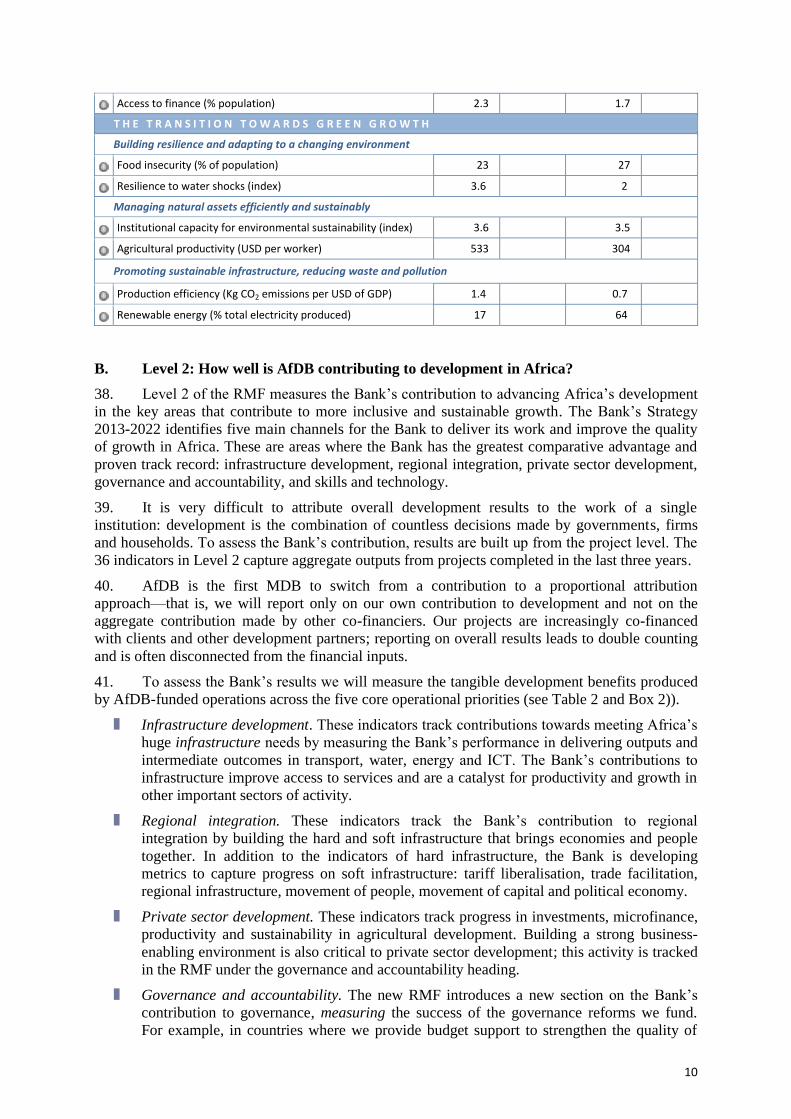
Access to finance (% population) 2.3 1.7
T H E T R A N S I T I O N T O W A R D S G R E E N G R O W T H
Building resilience and adapting to a changing environment
Food insecurity (% of population) 23 27
Resilience to water shocks (index) 3.6 2
Managing natural assets efficiently and sustainably
Institutional capacity for environmental sustainability (index) 3.6 3.5
Agricultural productivity (USD per worker) 533 304
Promoting sustainable infrastructure, reducing waste and pollution
Production efficiency (Kg CO2 emissions per USD of GDP) 1.4 0.7
Renewable energy (% total electricity produced) 17 64
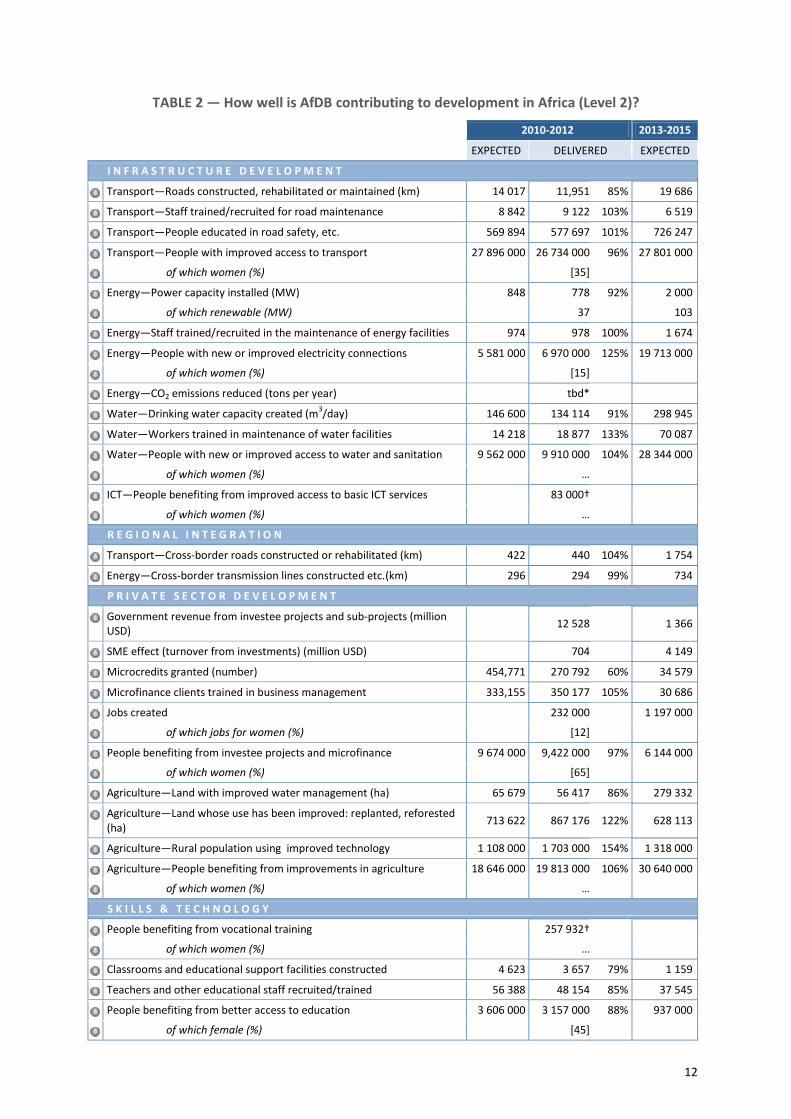
B. Level 2: How well is AfDB contributing to development in Africa?
38. Level 2 of the RMF measures the Bank’s contribution to advancing Africa’s development
in the key areas that contribute to more inclusive and sustainable growth. The Bank’s Strategy
2013-2022 identifies five main channels for the Bank to deliver its work and improve the quality
of growth in Africa. These are areas where the Bank has the greatest comparative advantage and
proven track record: infrastructure development, regional integration, private sector development,
governance and accountability, and skills and technology.
39. It is very difficult to attribute overall development results to the work of a single
institution: development is the combination of countless decisions made by governments, firms
and households. To assess the Bank’s contribution, results are built up from the project level. The
36 indicators in Level 2 capture aggregate outputs from projects completed in the last three years.
40. AfDB is the first MDB to switch from a contribution to a proportional attribution
approach—that is, we will report only on our own contribution to development and not on the
aggregate contribution made by other co-financiers. Our projects are increasingly co-financed
with clients and other development partners; reporting on overall results leads to double counting
and is often disconnected from the financial inputs.
41. To assess the Bank’s results we will measure the tangible development benefits produced
by AfDB-funded operations across the five core operational priorities (see Table 2 and Box 2)).
Infrastructure development. These indicators track contributions towards meeting Africa’s
huge infrastructure needs by measuring the Bank’s performance in delivering outputs and
intermediate outcomes in transport, water, energy and ICT. The Bank’s contributions to
infrastructure improve access to services and are a catalyst for productivity and growth in
other important sectors of activity.
Regional integration. These indicators track the Bank’s contribution to regional
integration by building the hard and soft infrastructure that brings economies and people
together. In addition to the indicators of hard infrastructure, the Bank is developing
metrics to capture progress on soft infrastructure: tariff liberalisation, trade facilitation,
regional infrastructure, movement of people, movement of capital and political economy.
Private sector development. These indicators track progress in investments, microfinance,
productivity and sustainability in agricultural development. Building a strong business-
enabling environment is also critical to private sector development; this activity is tracked
in the RMF under the governance and accountability heading.
Governance and accountability. The new RMF introduces a new section on the Bank’s
contribution to governance, measuring the success of the governance reforms we fund.
For example, in countries where we provide budget support to strengthen the quality of
11
public administration, we track improvements in the CPIA sub-score.
Skills and technology. To help African youth develop the skills they need to find jobs, the
Bank supports education and training. This contributes to establishing the foundations for
a productive workforce and creates opportunities for employment. Special attention is
given to vocational training to help bridge the gap between the skills the education system
produces and the ones the private sector wants.
42. The new RMF features fewer indicators in Level 2, with a reduced number of output
indicators and more focus on outcomes, especially those that measure how Bank interventions
have improved people’s lives. The choice of indicators has been guided by “mini-results-
chains”—a conceptual framework that connects activities, outputs and outcomes. For instance,
when we construct roads we also assess how these interventions have benefitted the population.
This ensures that we not only focus on delivering roads, but also put measures in place to keep
them well maintained, reduce future costs, and achieve the maximum benefits for the population.
BOX 2 — Three areas of special emphasis
In implementing the Strategy 2013-2022, in each of the five core operational priorities, the Bank will put emphasis on three areas of special attention: fragile states, agriculture and food security, and gender.
1. Fragile states. More than 200 million Africans live in countries affected by conflict and instability, and 80 percent of all the world’s fragile states are in Africa. State fragility is a major constraint on Africa’s development. The RMF covers fragile states by measuring the scope of fragility, drawing on a limited set of fragility specific indicators. Given the complex nature of situations of fragility and conflict, more in-depth analysis and monitoring are needed than the corporate RMF is able to provide. Dedicated publications, such as the recently published Development Effectiveness Review on Fragile States, will address the issue more systematically and in greater depth.
2. Agriculture and food security. Agriculture, which supports the livelihoods of and provides employment for over 70% of Africans, is a proven driver of inclusive growth and poverty reduction. As the Bank adopts a value chain approach and invests in rural infrastructure and a robust agro-industry regime, agriculture will become a platform to create jobs, ensure food security, increase incomes, diversify the product consumption base, engender import substitution for imported products and facilitate regional trade. To promote broad-based economic growth and development, the Bank will help countries embrace agribusiness for increased productivity and competitiveness. In the RMF, agriculture and food security continue to be captured in Level 1 and Level 2.
9
3. Gender. Greater equality between men and women is a development objective in its own right. Investing in women and girls is also smart economics. Increasing the capabilities and opportunities of women and girls can boost the productivity and participation of half the African population. Gender aspects are strengthened throughout the four levels of the RMF by introducing gender-specific indicators and sex-disaggregating all beneficiaries of Bank operations (see section II.C).
43. Reporting on results is by definition a backward-looking exercise: we report only on
operations that have been completed. As the Bank embarks on its Strategy 2013-2022, we need to
make sure we capture the commitments the Bank has made under its previous strategies, including
in such important areas as health and primary and secondary education. Thus Level 2 continues to
have some indicators in these areas.
9
A full list of indicators for Agriculture and food security is included in Glossary of indicators.
12
TABLE 2 — How well is AfDB contributing to development in Africa (Level 2)?
2010-2012 2013-2015
EXPECTED DELIVERED EXPECTED
I N F R A S T R U C T U R E D E V E L O P M E N T
Transport—Roads constructed, rehabilitated or maintained (km) 14 017 11,951 85% 19 686
Transport—Staff trained/recruited for road maintenance 8 842 9 122 103% 6 519
Transport—People educated in road safety, etc. 569 894 577 697 101% 726 247
Transport—People with improved access to transport 27 896 000 26 734 000 96% 27 801 000
of which women (%) [35]
Energy—Power capacity installed (MW) 848 778 92% 2 000
of which renewable (MW) 37 103
Energy—Staff trained/recruited in the maintenance of energy facilities 974 978 100% 1 674
Energy—People with new or improved electricity connections 5 581 000 6 970 000 125% 19 713 000
of which women (%) [15]
Energy—CO2 emissions reduced (tons per year) tbd*
Water—Drinking water capacity created (m3/day) 146 600 134 114 91% 298 945
Water—Workers trained in maintenance of water facilities 14 218 18 877 133% 70 087
Water—People with new or improved access to water and sanitation 9 562 000 9 910 000 104% 28 344 000
of which women (%) …
ICT—People benefiting from improved access to basic ICT services 83 000†
of which women (%) …
R E G I O N A L I N T E G R A T I O N
Transport—Cross-border roads constructed or rehabilitated (km) 422 440 104% 1 754
Energy—Cross-border transmission lines constructed etc.(km) 296 294 99% 734
P R I V A T E S E C T O R D E V E L O P M E N T
Government revenue from investee projects and sub-projects (million USD)
12 528 1 366
SME effect (turnover from investments) (million USD) 704 4 149
Microcredits granted (number) 454,771 270 792 60% 34 579
Microfinance clients trained in business management 333,155 350 177 105% 30 686
Jobs created 232 000 1 197 000
of which jobs for women (%) [12]
People benefiting from investee projects and microfinance 9 674 000 9,422 000 97% 6 144 000
of which women (%) [65]
Agriculture—Land with improved water management (ha) 65 679 56 417 86% 279 332
Agriculture—Land whose use has been improved: replanted, reforested (ha)
713 622 867 176 122% 628 113
Agriculture—Rural population using improved technology 1 108 000 1 703 000 154% 1 318 000
Agriculture—People benefiting from improvements in agriculture 18 646 000 19 813 000 106% 30 640 000
of which women (%) …
S K I L L S & T E C H N O L O G Y
People benefiting from vocational training 257 932†
of which women (%) …
Classrooms and educational support facilities constructed 4 623 3 657 79% 1 159
Teachers and other educational staff recruited/trained 56 388 48 154 85% 37 545
People benefiting from better access to education 3 606 000 3 157 000 88% 937 000
of which female (%) [45]
13
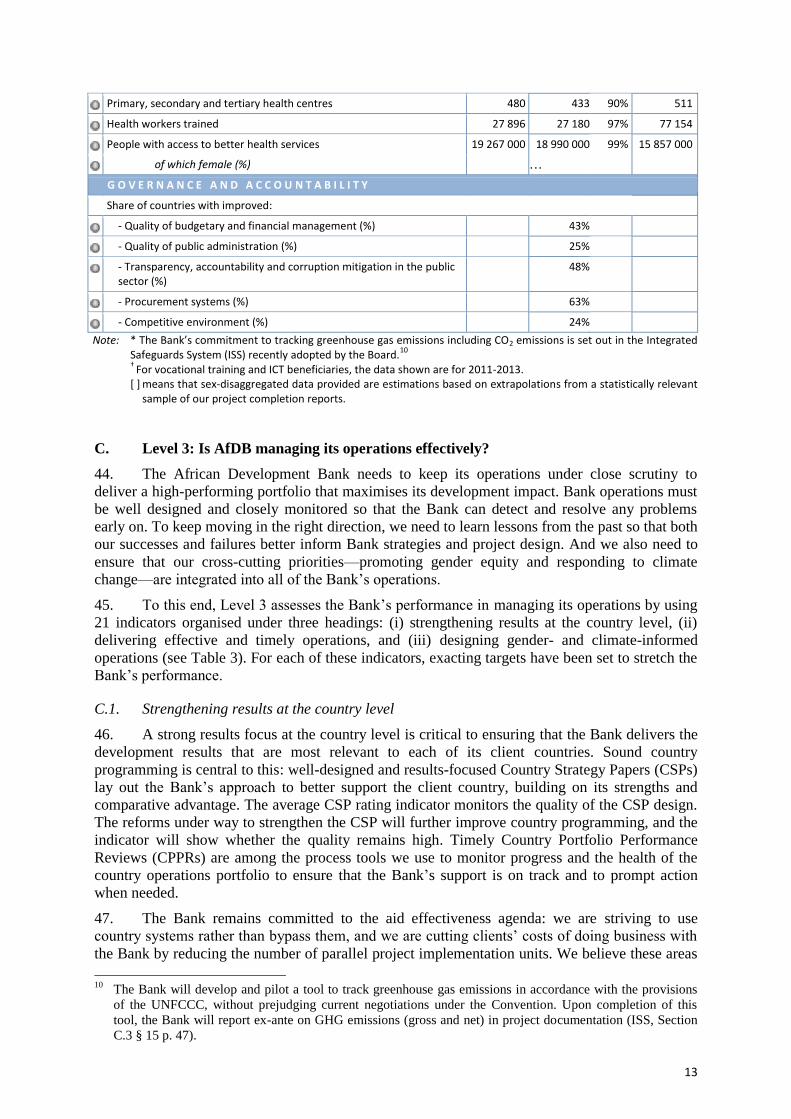
Primary, secondary and tertiary health centres 480 433 90% 511
Health workers trained 27 896 27 180 97% 77 154
People with access to better health services 19 267 000 18 990 000 99% 15 857 000
of which female (%) …
G O V E R N A N C E A N D A C C O U N T A B I L I T Y
Share of countries with improved:
- Quality of budgetary and financial management (%) 43%
- Quality of public administration (%) 25%
- Transparency, accountability and corruption mitigation in the public sector (%)
48%
- Procurement systems (%) 63%
- Competitive environment (%) 24%
Note: * The Bank’s commitment to tracking greenhouse gas emissions including CO2 emissions is set out in the Integrated Safeguards System (ISS) recently adopted by the Board.
10
† For vocational training and ICT beneficiaries, the data shown are for 2011-2013.
[ ] means that sex-disaggregated data provided are estimations based on extrapolations from a statistically relevant sample of our project completion reports.
C. Level 3: Is AfDB managing its operations effectively?
44. The African Development Bank needs to keep its operations under close scrutiny to
deliver a high-performing portfolio that maximises its development impact. Bank operations must
be well designed and closely monitored so that the Bank can detect and resolve any problems
early on. To keep moving in the right direction, we need to learn lessons from the past so that both
our successes and failures better inform Bank strategies and project design. And we also need to
ensure that our cross-cutting priorities—promoting gender equity and responding to climate
change—are integrated into all of the Bank’s operations.
45. To this end, Level 3 assesses the Bank’s performance in managing its operations by using
21 indicators organised under three headings: (i) strengthening results at the country level, (ii)
delivering effective and timely operations, and (iii) designing gender- and climate-informed
operations (see Table 3). For each of these indicators, exacting targets have been set to stretch the
Bank’s performance.
C.1. Strengthening results at the country level
46. A strong results focus at the country level is critical to ensuring that the Bank delivers the
development results that are most relevant to each of its client countries. Sound country
programming is central to this: well-designed and results-focused Country Strategy Papers (CSPs)
lay out the Bank’s approach to better support the client country, building on its strengths and
comparative advantage. The average CSP rating indicator monitors the quality of the CSP design.
The reforms under way to strengthen the CSP will further improve country programming, and the
indicator will show whether the quality remains high. Timely Country Portfolio Performance
Reviews (CPPRs) are among the process tools we use to monitor progress and the health of the
country operations portfolio to ensure that the Bank’s support is on track and to prompt action
when needed.
47. The Bank remains committed to the aid effectiveness agenda: we are striving to use
country systems rather than bypass them, and we are cutting clients’ costs of doing business with
the Bank by reducing the number of parallel project implementation units. We believe these areas
10
The Bank will develop and pilot a tool to track greenhouse gas emissions in accordance with the provisions
of the UNFCCC, without prejudging current negotiations under the Convention. Upon completion of this
tool, the Bank will report ex-ante on GHG emissions (gross and net) in project documentation (ISS, Section
C.3 § 15 p. 47).
14
remain critical; therefore, consistent with the post-Busan agenda, indicators on alignment on
budget, predictability, and use of country systems remain an integral part of the RMF.
C.2. Delivering effective and timely operations
48. As part of improving our portfolio performance, the Bank has launched a range of reforms
to ensure that all operations are well designed and regularly supervised. The indicators included
under this heading help us track our performance in implementing these reforms. They focus on
key aspects such as the quality of project design and quality at entry. Project quality at entry is
extremely important to our overall effectiveness, as errors in project design are generally difficult
to correct once implementation has begun. Another area of focus is quality of supervision. In
recent years, the quality of project supervision has improved, allowing problems to be identified
early and corrected. Results and lessons learnt are captured and made available to inform future
programming. Operations should also be timely; therefore, the RMF tracks delays in design,
disbursement, or procurement to enable the Bank to deliver more timely operations. For more in-
depth analysis and internal reporting purposes, the data are disaggregated by funding window and
type of operation.
49. The choice of indicators also reflects heightened ambitions. We are no longer measuring
areas where we are doing consistently well but focusing on areas where we need to do better. For
example, the Bank has successfully reduced the share of problem projects in its portfolio from
14% in 2006 to only 2% in 2012. So rather than tracking problem projects, we are tracking a more
ambitious indicator: projects at risk. This category includes not only problem projects but also
projects that are at risk of not meeting their objectives a range of reasons including problems
related to project implementation, slow disbursements, and so on.
C.3. Designing gender- and climate-informed operations
50. To ensure that the Bank’s cross-cutting priorities—promoting gender equity and
responding to climate change—are integrated into all our activities, at project design we assess all
our operations on both the gender and climate dimensions. The RMF gives special emphasis to the
Bank’s progress in building both aspects into the design of operations.
51. We will continue to use our climate-proofing methodology,11 which is working well.
Projects that started between 2007 and 2009 have all been retrospectively screened and adapted as
necessary, while newly designed projects should now have climate resilience built into their
design to protect the development initiatives from the negative impacts of climate change, climate
variability and extreme weather events, or to delay or reduce the harm caused by climate change.
52. For increased effectiveness in mainstreaming gender into our operations, the Bank has
drawn on international best practice to develop new standards. All our projects are assessed at the
design stage according to five criteria that measure how effectively gender mainstreaming has
been built into the project: sector-specific gender analysis; a gender-equality-related outcomes
statement; a gender-equality-related baseline; specific activities to address gender gaps; and
adequate budgets and human resources to implement the activities. This assessment better informs
the project design, and is also used to better monitor gender mainstreaming in Bank operations.
11
During the design of a project the Bank conducts a Readiness Review, which reviews, among other things,
how well climate resilience is built into the project design. This may include ensuring sufficient drainage
systems to increase road longevity (as in the Nigerian Ndali-Nikki Chicandou road), or offsetting CO2
emissions from increased traffic by planting trees and restoring vegetation cover, to create carbon sinks.
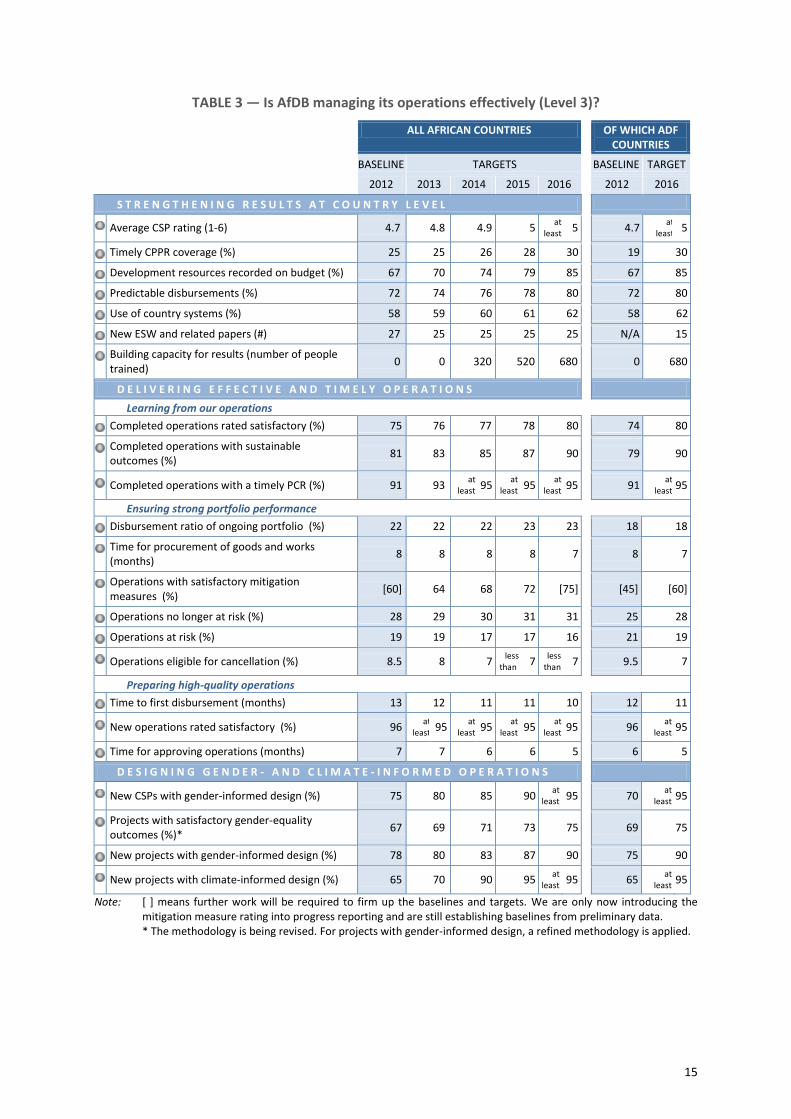
15
TABLE 3 — Is AfDB managing its operations effectively (Level 3)?
ALL AFRICAN COUNTRIES OF WHICH ADF
COUNTRIES
BASELINE TARGETS BASELINE TARGET
2012 2013 2014 2015 2016 2012 2016
S T R E N G T H E N I N G R E S U L T S A T C O U N T R Y L E V E L
Average CSP rating (1-6) 4.7 4.8 4.9 5 at
least 5 4.7 at
least 5
Timely CPPR coverage (%) 25 25 26 28 30 19 30
Development resources recorded on budget (%) 67 70 74 79 85 67 85
Predictable disbursements (%) 72 74 76 78 80 72 80
Use of country systems (%) 58 59 60 61 62 58 62
New ESW and related papers (#) 27 25 25 25 25 N/A 15
Building capacity for results (number of people trained)
0 0 320 520 680 0 680
D E L I V E R I N G E F F E C T I V E A N D T I M E L Y O P E R A T I O N S
Learning from our operations
Completed operations rated satisfactory (%) 75 76 77 78 80 74 80
Completed operations with sustainable outcomes (%)
81 83 85 87 90 79 90
Completed operations with a timely PCR (%) 91 93 at
least 95 at
least 95 at
least 95 91 at
least 95
Ensuring strong portfolio performance
Disbursement ratio of ongoing portfolio (%) 22 22 22 23 23 18 18
Time for procurement of goods and works (months)
8 8 8 8 7 8 7
Operations with satisfactory mitigation measures (%)
[60] 64 68 72 [75] [45] [60]
Operations no longer at risk (%) 28 29 30 31 31 25 28
Operations at risk (%) 19 19 17 17 16 21 19
Operations eligible for cancellation (%) 8.5 8 7 less
than 7 less
than 7 9.5 7
Preparing high-quality operations
Time to first disbursement (months) 13 12 11 11 10 12 11
New operations rated satisfactory (%) 96 at
least 95
at least 95
at least 95
at least 95 96
at least 95
Time for approving operations (months) 7 7 6 6 5 6 5
D E S I G N I N G G E N D E R - A N D C L I M A T E - I N F O R M E D O P E R A T I O N S
New CSPs with gender-informed design (%) 75 80 85 90 at
least 95 70 at
least 95
Projects with satisfactory gender-equality outcomes (%)*
67 69 71 73 75 69 75
New projects with gender-informed design (%) 78 80 83 87 90 75 90
New projects with climate-informed design (%) 65 70 90 95 at
least 95 65 at
least 95
Note: [ ] means further work will be required to firm up the baselines and targets. We are only now introducing the mitigation measure rating into progress reporting and are still establishing baselines from preliminary data. * The methodology is being revised. For projects with gender-informed design, a refined methodology is applied.
16
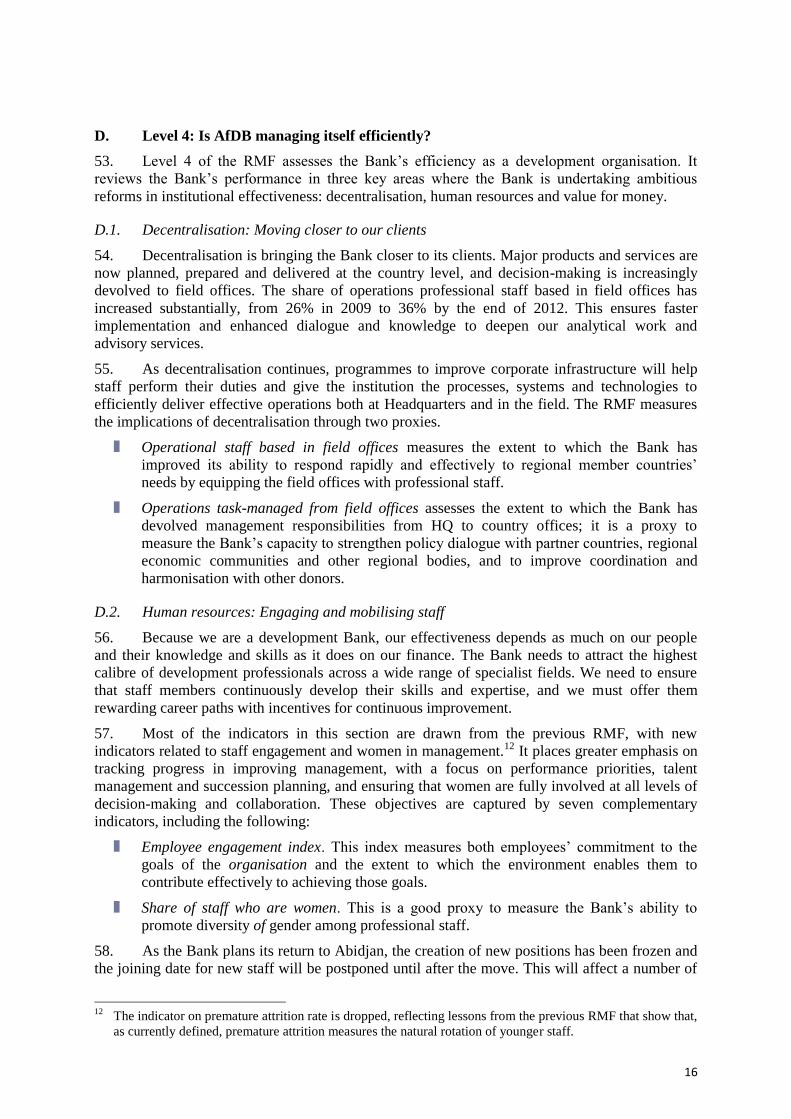
D. Level 4: Is AfDB managing itself efficiently?
53. Level 4 of the RMF assesses the Bank’s efficiency as a development organisation. It
reviews the Bank’s performance in three key areas where the Bank is undertaking ambitious
reforms in institutional effectiveness: decentralisation, human resources and value for money.
D.1. Decentralisation: Moving closer to our clients
54. Decentralisation is bringing the Bank closer to its clients. Major products and services are
now planned, prepared and delivered at the country level, and decision-making is increasingly
devolved to field offices. The share of operations professional staff based in field offices has
increased substantially, from 26% in 2009 to 36% by the end of 2012. This ensures faster
implementation and enhanced dialogue and knowledge to deepen our analytical work and
advisory services.
55. As decentralisation continues, programmes to improve corporate infrastructure will help
staff perform their duties and give the institution the processes, systems and technologies to
efficiently deliver effective operations both at Headquarters and in the field. The RMF measures
the implications of decentralisation through two proxies.
Operational staff based in field offices measures the extent to which the Bank has
improved its ability to respond rapidly and effectively to regional member countries’
needs by equipping the field offices with professional staff.
Operations task-managed from field offices assesses the extent to which the Bank has
devolved management responsibilities from HQ to country offices; it is a proxy to
measure the Bank’s capacity to strengthen policy dialogue with partner countries, regional
economic communities and other regional bodies, and to improve coordination and
harmonisation with other donors.
D.2. Human resources: Engaging and mobilising staff
56. Because we are a development Bank, our effectiveness depends as much on our people
and their knowledge and skills as it does on our finance. The Bank needs to attract the highest
calibre of development professionals across a wide range of specialist fields. We need to ensure
that staff members continuously develop their skills and expertise, and we must offer them
rewarding career paths with incentives for continuous improvement.
57. Most of the indicators in this section are drawn from the previous RMF, with new
indicators related to staff engagement and women in management.12 It places greater emphasis on
tracking progress in improving management, with a focus on performance priorities, talent
management and succession planning, and ensuring that women are fully involved at all levels of
decision-making and collaboration. These objectives are captured by seven complementary
indicators, including the following:
Employee engagement index. This index measures both employees’ commitment to the
goals of the organisation and the extent to which the environment enables them to
contribute effectively to achieving those goals.
Share of staff who are women. This is a good proxy to measure the Bank’s ability to
promote diversity of gender among professional staff.
58. As the Bank plans its return to Abidjan, the creation of new positions has been frozen and
the joining date for new staff will be postponed until after the move. This will affect a number of
12
The indicator on premature attrition rate is dropped, reflecting lessons from the previous RMF that show that,
as currently defined, premature attrition measures the natural rotation of younger staff.
17
indicators—for example, the vacancy rate is projected to increase temporarily, and the time to
recruit will be affected. Despite these temporary constraints, the Bank aims to achieve significant
progress overall by 2016.
59. Targets for the share of women in professional staff are also being affected. Given the
hiring freeze and moderate staff turnover, even with ongoing efforts to bring the share of women
to 50% of new hires, the Bank will only be able to increase the number of professional women to
33%. To reach this goal, the Bank is strengthening the organisation’s capacity to attract and retain
qualified women through gender-supportive policies in such areas as recruitment and selection,
gender-sensitive career development, and flexible and family-friendly working arrangements. In
addition, to increase the number of women in management, the Bank will need to promote the
career prospects of women staff and provide training and mentoring to expand the pool of women
who are qualified for promotion.
D.3. Value for money: Improving cost-efficiency
60. AfDB is committed to delivering its services cost-efficiently, and to that end it is
implementing a number of reforms to its business processes and practices. Better cost accounting
will strengthen the links between resources and results, as costs related to project design and
implementation are tracked to push for economy and greater cost-efficiency for delivering outputs
and outcomes.
Cost of preparing a lending project measures the expenditures associated with project
identification, preparation, appraisal, and launching.
Cost of supporting project implementation measures the expenditures associated with the
support of project implementation, such as cost of supervision and midterm review.
TABLE 4 — Is AfDB managing itself efficiently (Level 4)?
BASELINE TARGETS
2012 2013 2014 2015 2016
D E C E N T R A L I S A T I O N : M O V I N G C L O S E R T O O U R C L I E N T S
Operational staff based in field offices (%) 36 38 40 45 50
Projects managed from field offices (%) 42 45 50 53 55
Connecting to Field Offices (% successful videoconferences) 90 95 at least 95 at least 95 at least 95
H U M A N R E S O U R C E S : E N G A G I N G A N D M O B I L I S I N G S T A F F
Employee engagement index (%) [59] 62 64 67 [70]
Managerial effectiveness index (%) [70] 72 75 77 [80]
Operations professional staff (%) 67 69 70 70 70
Share of women in professional staff (%) 27 28 28 30 33
Share of management staff who are women (%) 24 26 28 30 32
Net vacancy rate—professional staff (%) 9.4 9 15 13 9
Time to recruit new staff (days) 176 160 N/A 150 100
V A L U E F O R M O N E Y : I M P R O V I N G C O S T E F F I C I E N C Y
Administrative costs per UA 1 million disbursed (UA ‘000) 86 89 87 85 80
Cost of preparing a lending project (UA ‘000) [74] 73 72 71 [70]
Cost of supporting project implementation (UA ‘000) [21] 20.5 20 19.5 [19]
Work environment cost per seat (UA) 3 500 3 450 3 400 3 350 3 300
Share of users satisfied with IT service delivery (%) 96 97 at least 97 at least 97 at least 97
Note: [ ] means further work will be required to firm up the baselines and targets. For example, we are only now introducing the employee engagement index, and are generating additional data to establish a solid baseline.
18
IV. MANAGING FOR RESULTS
61. Moving forward, one important challenge will be to strengthen the Bank’s results-oriented
management culture. For this purpose, the Bank is reinforcing the management information
systems that underpin the RMF to ensure that results inform the Bank’s strategies, operations and
staff incentives. This paper describes the tools, processes and systems being established to this
end at three different levels: corporate level, country level and project level.
A. Improving corporate performance
62. Results reporting has so far been an annual exercise. In the Annual Development
Effectiveness Review, the Bank reports against the RMF and uses additional analysis to provide
context for these data. Poorly performing indicators are raised to Management’s attention and
analysed in depth to identify challenges and possible implications for other reforms. Building on
the newly developed Results Reporting System and the Bank’s budget and performance systems,
the Bank is developing a senior management dashboard that will regularly provide Management
with more up-to-date data for monitoring progress and making strategic management decisions.
B. Increasing country-level focus on results
63. Key to delivering effective operations is deepening the focus on results in country
programming, working with clients to focus on critical bottlenecks, and coordinating with
partners. This means strengthening country dialogue, building country capacity, and firming up
results-based country strategies.
64. The Bank is working to strengthen country programming by revising its Results-based
CSPs, which define the Bank’s intervention strategy and programme, aligning them with the
country’s development vision and strategies. Results-based CSPs provide the logic of the Bank’s
interventions, emphasising the results to be achieved and providing a monitoring framework for
measuring those results. The quality standards underlying the Readiness Review process for
Results-based CSPs will also be refined and strengthened, incorporating lessons from experience
as well as new guidance.
65. With a solid results reporting system in place that can consistently capture operational
data, it will be possible to build systematic country portfolio monitoring tools that will help staff
monitor progress, better manage for results at the country level, and implement country strategies
more effectively. Such tools will provide more comprehensive and timely data that task managers,
portfolio managers and Management can use to take corrective action, if needed, to achieve better
results.
66. The Bank is committed to transparency and accountability. It is geographically mapping
its operations (see Box 3), and in July 2013 it launched its first publication of International Aid
Transparency Initiative (IATI) data. IATI includes a geocoding standard that will allow the Bank
and other institutions to feed into member country data platforms. This will help countries and the
Bank make more informed decisions on geographic complementarities, focusing operations where
they can achieve the biggest impact. AfDB is the first MDB to provide private sector and precise
geocoding data through IATI.
67. To manage for results at the country level, good data are needed. The Bank’s statistics
department, ESTA, is providing financial and technical support to all 54 regional member
countries and to the regional economic communities to strengthen their capacity to provide better
statistics. The Bank and the United Nations Economic Commission for Africa have been assigned
the lead to coordinate statistical activities in Africa with partners, working under the umbrella
framework for statistical development in Africa. Partners include the International Monetary
Fund, World Bank, UN Agencies, and Paris21.
19
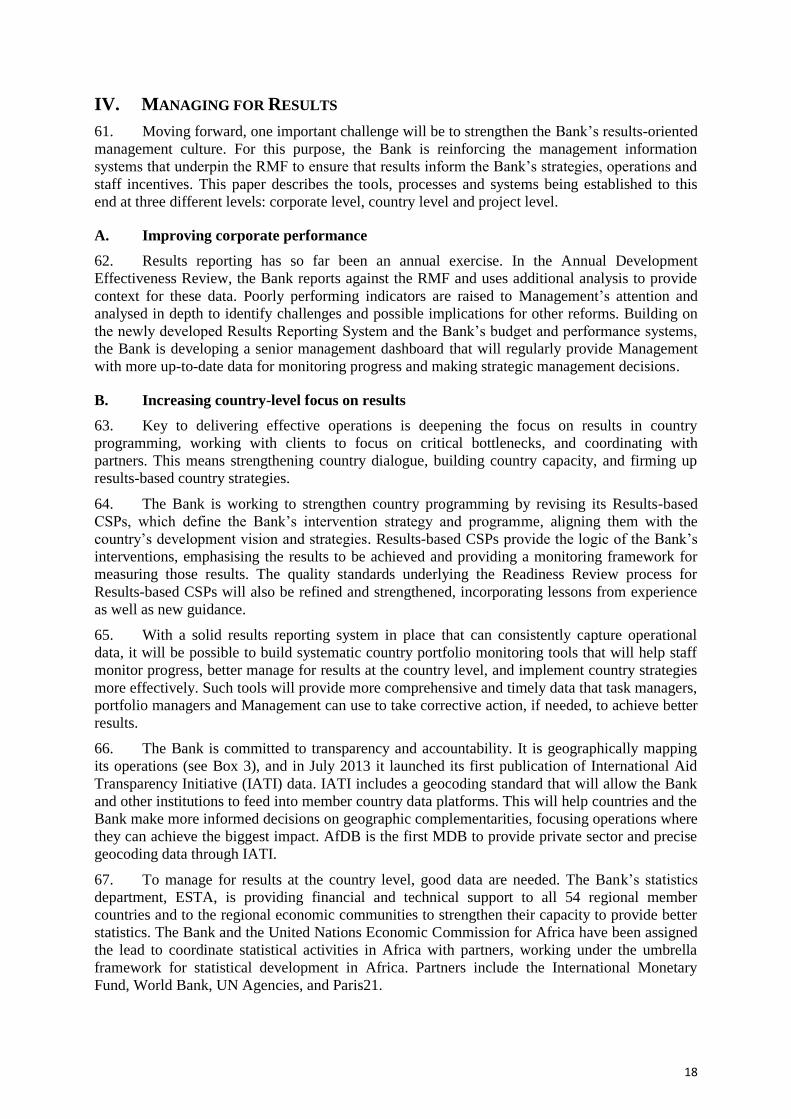
BOX 3 — Mapping for results
The African Development Bank approved around $21.3 billion in loans and grants between 2010 and 2012 ($61 billion since 2002). To increase the transparency of its operations and better allocate its resources across the continent, the Bank is geocoding its entire portfolio.
This map plots the geographic location of the 219 Bank operations that were approved between 2010 and 2012 (514 since 2002). The shades of green represent the density of rural poor. Projects that can be pinned to a geographic location are signalled by a blue dot. The map shows that a high proportion of the Bank’s activities are targeted in areas that most need the Bank’s support.
68. The Bank is also stepping up its support to strengthen capacity and demand for evidence-
based policy-making. At a 2012 conference in Tunis, “Putting Results First in Africa,” a joint
initiative with the Africa Capacity Building Foundation was launched to link results-based
networks with capacity-building centres under a new framework called Africa Knowledge for
Results. Under this framework, results-based management approaches will be applied to the
regional integration agenda. The Bank supports this work with a $13 million grant.
C. Better managing project results
69. The Bank is working in many areas to strengthen the project cycle so that it can better
manage for and measure results in its operations. We are consolidating these efforts to create an
integrated approach to monitoring and managing our pipeline and portfolio operations.
70. The Bank’s Independent Evaluation Department (OPEV) has set up a database of projects
completed since 2000, with project completion reports, independent review notes, and project
performance evaluation reports, as well as lessons learnt from project design and implementation
and development outcomes. This database will soon be accessible throughout the Bank. To help
achieve greater development outcomes, Bank staff can draw from this database to locate good
20
practices to inform the design of new projects, learn from past mistakes and find solutions to
challenges that may occur during implementation.
71. The Bank is using the improved IT platform to build better tools with which task
managers and portfolio managers can process and monitor operations. An electronic supervision
processing tool can help provide more systematic monitoring, not only to track progress in
operations, but also to provide timely identification of projects at risk and identify more systemic
issues that need to be addressed. This will strengthen the project results orientation and help focus
attention and resources to better support delivery of effective operations. Internal results
monitoring systems will also be able to drill down further by sector, country, financing source,
and instrument, down to the individual results of each operation.
72. Impact evaluation is a critical learning tool that can offer a much richer and more accurate
way of tracking the results achieved through Bank operations, with stronger results chains and
attribution of results; but it is costly. The Bank is using impact evaluation selectively where the
most valuable insights can be gained. A limited number of impact evaluations will be
incorporated into the design of projects to establish sound baselines. The Bank will conduct
additional impact evaluations to contribute to learning in areas where knowledge can help support
operations planning. The Bank is also working to establish in its research department a technical
work team on impact evaluation and a reference group to pilot and provide guidance on impact
evaluation in the Bank. As a knowledge broker, the Bank will further engage in international
partnerships and share findings from research as is most relevant to the Bank’s priorities and
challenges.
V. CONCLUSION AND OUTLOOK
73. The Bank is becoming more effective in producing results and is increasingly open and
transparent in sharing those results, introducing new ways of engaging with stakeholders on the
continent. The Bank has come a long way in implementing the results agenda. It is now working
to further improve the way it measures results and to use results data to inform Management and
deliver results at the corporate, country and project levels.
74. The new RMF reflects the transition from the Medium-Term Strategy to our new Strategy
2013-2022. It is both backward-looking, in that it measures results the Bank is achieving through
interventions initiated in the past, and forward-looking, to enhance the quality of design and
implementation of our new operations. We are already preparing to build this framework into our
operations, and will start tracking a broader set of indicators to enrich the RMF for the coming
period.
75. The main focus will be on deepening our results culture by weaving results even more
strongly into our processes, systems, and decision-making. We are finalising the tools that will
help us achieve this. It will require continued Management attention, but we are confident we are
on the right track to move the results agenda forward and manage the institution for more and
better results.
Recommendation:
76. The Boards of Directors are requested to consider and approve the new One Bank Results
Measurement Framework 2013-2016, proposed in this paper.
AFRICAN DEVELOPMENT BANK GROUP
THE ONE BANK RESULTS MEASUREMENT FRAMEWORK 2013-2016
Glossary of Indicators
December 2013
Quality Assurance & Results Department Results Division
RMF 2013-2016 – Definitions of Indicators
i
C O N T E N T S
I. INTRODUCTION................................................................................................................................... 1 A. Structure of the RMF .................................................................................................................. 1 B. Selection criteria for indicators .................................................................................................. 1 C. Mainstreaming Bank priorities ................................................................................................... 2
C.1. Inclusive growth ............................................................................................................................ 2 C.2. Transition towards green growth ................................................................................................. 3 C.3. Gender .......................................................................................................................................... 4 C.4. Value for money ........................................................................................................................... 5 C.5. Fragile states ................................................................................................................................. 6 C.6. Agriculture and Food Security ...................................................................................................... 7
II. DEFINITIONS OF INDICATORS ....................................................................................................8 A. Level 1: What development progress is Africa making? ............................................................ 8 B. Level 2: How well is AfDB contributing to development in Africa? ......................................... 12 C. Level 3: Is AfDB managing its operations effectively? ............................................................. 17 D. Level 4: Is AfDB managing itself efficiently?............................................................................. 20
BOXES AND FIGURE
BOX 1 Structure of the RMF indicators 1 BOX 2 Transitioning towards green growth in Africa 4 FIGURE 1 A conceptual model for delivering better value for money 6
RMF 2013-2016 – Definitions of Indicators
1
I. INTRODUCTION
1. This glossary accompanies the Results Measurement Framework (2013-2016), providing
additional background by laying out the rationale for and definitions of the proposed indicators. A
first draft was shared with the ADF deputies in August and a second version with CODE in
September for comments. This third version takes into account the changes to the RMF and the
comments received
2. This glossary for the Results Measurement Framework (RMF)1 explains the structure of
the RMF and discusses the guiding principles for the selection of indicators. Part II lists all
indicators in the order they appear in the RMF, with its four levels and thematic clusters; for each
one it provides a rationale for choosing the indicator and explains how it is calculated. Terms are
defined as necessary.
A. Structure of the RMF
3. The structure of the RMF reflects the strategic direction set out in the Bank’s Strategy
2013-2022, and therefore the selection of indicators is based on the areas of strategic focus (see
Box 1).
BOX 1 — Structure of the RMF indicators
LEVEL 1 WHAT DEVELOPMENT PROGRESS IS AFRICA MAKING? 1.1 Inclusive growth 1.2 Transitioning to green growth
LEVEL 2 HOW WELL IS AFDB CONTRIBUTING TO DEVELOPMENT IN AFRICA? 2.1 Infrastructure development 2.2 Regional integration 2.3 Private sector development 2.4 Skills and technology 2.5 Governance and accountability
LEVEL 3 IS AFDB MANAGING ITS OPERATIONS EFFECTIVELY? 3.1 Strengthening results at country level 3.2 Delivering effective and timely operations 3.3 Designing gender- and climate-informed operations
LEVEL 4 IS AfDB MANAGING ITSELF EFFICIENTLY? 4.1 Decentralisation: Moving closer to our clients 4.2 Human resources: Engaging and mobilising staff 4.3 Value for money: Improving cost-efficiency
B. Selection criteria for indicators
4. Preparation of the new RMF involved extensive work to identify practical and telling
indicators. The starting point was the lessons learnt in implementing the previous RMF. In
addition, the results frameworks of other multilateral development banks were consulted to draw
on international good practice and harmonise indicators where relevant.2
5. An extensive set of possible indicators was pared down by applying the principles of
selectivity and availability.
Selectivity—choosing the most telling indicators. To keep the RMF focussed on the most
relevant aspects of the Bank’s work, only the most telling indicators were chosen—those
that reflect the Bank’s strategic priorities, offer additional value in looking at development
priorities from various dimensions, and provide a good picture of the Bank’s reform
ambitions and its ability to deliver value for money. Given the broad range of topics and
1 Managing for Development Results: The One-Bank Results Measurement Framework (2013-2016).
2 The Bank benefitted from work done by the International Network on Conflict and Fragility, the Green
Growth Knowledge Platform, and the OECD Initiative on Inclusive Growth.
RMF 2013-2016 – Definitions of Indicators
2
in some cases available data sets, only the most significant are selected. When several
indicators are available, the RMF draws on the most robust and, if possible original data
source.
Availability—relying on timely and robust data. The selection of indicators—especially
those in Level 1—is noticeably constrained by the limited availability of data on Africa.
Indicators should be available annually, or at least every other year, and cover at least
80% of African countries. Household-survey-based indicators, in particular, are not
regularly available and are available for only a limited set of countries at a time. This
makes continuous reporting impossible. Where no alternatives exist—for example, for
income inequality—we use statistical methods to construct meaningful indicators to
compensate for gaps in data. In other cases—such as indicators on economic resilience—
we seek close proxies or alternative indicators; for example, we use density of the road
network rather than access to roads.
6. International organisations, development practitioners and academic researchers are
working to develop new indicators, but in the meantime, the RMF uses what is readily available.
For Level 2 the indicators are confined to those measured in the logical frameworks of the Bank
operations. Until the Bank switches to live reporting, changing indicators will only be effective
with a time-lag, as new indicators will need to be grandfathered in. For a limited number of
indicators, results can be retrofitted. The new set of core and frequently used indicators will
facilitate this process.
7. Applying these principles ensures that the RMF stays manageable, with about 100
indicators altogether, and is able to provide regular updates on emerging developments to the
Bank itself and to stakeholders (the RMF paper discusses the use of the RMF as a management
tool).
C. Mainstreaming Bank priorities
8. The RMF reflects the Bank’s strategic approach, measuring key operational and reform
areas. The new RMF reflects the priorities set out in the Bank’s Strategy 2013-2022. Cross-
cutting priorities such as gender, value for money and fragile states have been strengthened in the
new RMF throughout the four levels.
C.1. Inclusive growth
9. Despite strong economic growth in Africa, not all segments of the population are sharing
equally in the continent’s rising prosperity. Growth has often been narrowly concentrated in a few
sectors and has not achieved deep reductions in poverty and inequality. The RMF considers this
qualitative aspect of growth by including indicators to reflect various dimensions of inclusion—
economic, spatial, social and political.
Economic inclusion: Reducing poverty and income inequality. This dimension is
measured by four indicators that track growth, wealth (GDP per capita), poverty, and
income inequality (Gini coefficient). They capture complementary dimensions of poverty
and income distribution, indicating vulnerability and assessing how well the broad
population share in Africa’s growth.
Spatial inclusion: Expanding access to basic services. Spatial inclusion is about ensuring
that communities, wherever they are, can benefit from growth. One way of achieving this
is by making sure that everybody has access to some of the basic services that create
economic opportunities for all—roads, electricity, water and ICT. The indicators focus on
providing such access, mostly in rural areas, but increasingly also in urban centres, where
connectivity is still lagging. They show how many people have access to services and thus
to markets and economic and social opportunities.
Social inclusion: Ensuring equal opportunities for all. Social inclusion is about ensuring
that everyone can contribute to and benefit from growth. The indicators capture inclusion

RMF 2013-2016 – Definitions of Indicators
3
in benefiting from growth (education and health) and contributing to it in the labour
market. They focus on social groups such as children, the unemployed (often youth) and
women.
Political inclusion: Securing broad-based representation. Political inclusion requires
robust and accountable institutions that ensure the democratic and broad-based
representation of citizens. It is measured through indicators that track governance (Mo
Ibrahim Index), the quality of institutions (CPIA indicator), and their ability to ensure
broad-based representation (especially inclusion of women).
Sustaining growth: Building competitive economies. Africa will need to sustain strong
growth to lift more people out of poverty. Achieving this requires economies that are
competitive on a regional and global scale and that create opportunities for growth. These
qualities are measured through several proxies: global competitiveness, private sector
environment (business start-up, access to credit), and economic diversification.
10. Many more aspects of inclusion, especially geographical and social ones, are captured in
the sector aggregates. For analytical purposes, the Bank’s Development Effectiveness Reviews
take into account disaggregated data—urban/rural, men/women, youth, and so on—wherever such
data are available, to provide a richer picture of inclusion. To avoid a proliferation of indicators,
the RMF does not list and report against these sector indicators separately.
11. The Bank’s contribution to inclusion is difficult to disentangle; therefore, proxies are
selected on the basis of the beneficiaries the Bank reaches through its interventions. “Access”
indicators provide good proxies, as new and improved connections are typically geared towards
the poorest people. Sex disaggregation provides an additional dimension of inclusion.
12. All of the Bank’s operations take aspects of inclusion into account. Indicators are being
developed and integrated into country strategies to help ensure increased focus on inclusion in the
portfolio. Special emphasis is also placed on inclusion in project design: projects are reviewed to
ensure that they include an adequate stakeholder consultation process, a vulnerability assessment,
and provisions for maintaining affected people’s social conditions and livelihoods. These aspects
are part of the indicators CSPs rated satisfactory and new operations rated satisfactory and are to
some extent captured under operations with satisfactory mitigation measures. More explicit focus
is placed on gender by ensuring that new country strategies and projects are based on a solid
gender-informed design.
C.2. Transition towards green growth
13. As the Strategy 2013-2022 outlines, the Bank’s objective is to promote and maximise
opportunities from economic growth by building resilience; managing natural assets efficiently
and sustainably, including enhancing agriculture productivity; and promoting sustainable
infrastructure (see Box 2).
14. The RMF includes a range of indicators to cover the various dimensions of this transition
towards green development. The biggest challenge is to find adequate data and indicators to
monitor resilience. As discussions with the OECD working group on green growth indicators
confirm, the data situation is challenging, especially for Africa.3 Thus, for the RMF, reasonable
proxies using available data are proposed to provide an indicative picture.
Building resilience and adapting to a changing environment. While African countries
usually have not been the major drivers of global environmental change, African
livelihoods and economic sectors are considered among the most vulnerable to the impacts
of these changes, and the ecological footprint of African countries is increasing. These
dimensions are measured trough two proxies: food insecurity, which measures the
exposure to environmental and economic shocks of the most vulnerable, both consumers
3 The Bank participates in the Green Growth Knowledge Platform, a global network of researchers and
development experts that identifies and addresses major knowledge gaps in green growth theory and practice.
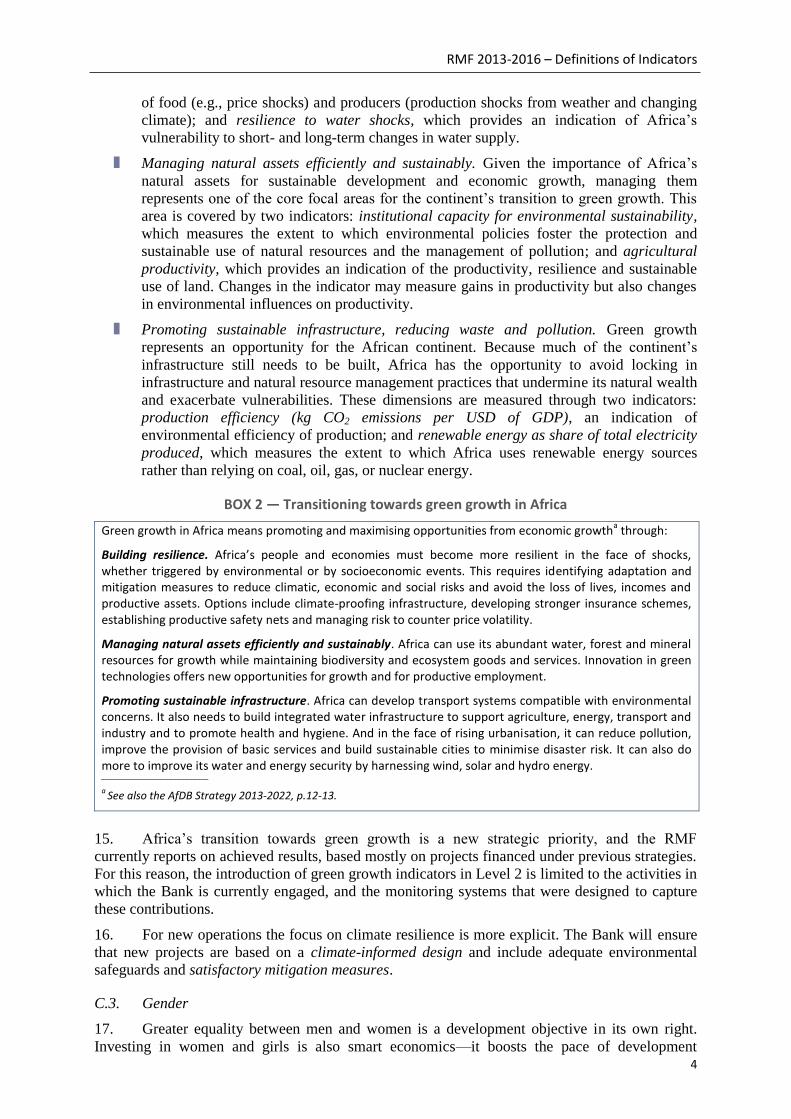
RMF 2013-2016 – Definitions of Indicators
4
of food (e.g., price shocks) and producers (production shocks from weather and changing
climate); and resilience to water shocks, which provides an indication of Africa’s
vulnerability to short- and long-term changes in water supply.
Managing natural assets efficiently and sustainably. Given the importance of Africa’s
natural assets for sustainable development and economic growth, managing them
represents one of the core focal areas for the continent’s transition to green growth. This
area is covered by two indicators: institutional capacity for environmental sustainability,
which measures the extent to which environmental policies foster the protection and
sustainable use of natural resources and the management of pollution; and agricultural
productivity, which provides an indication of the productivity, resilience and sustainable
use of land. Changes in the indicator may measure gains in productivity but also changes
in environmental influences on productivity.
Promoting sustainable infrastructure, reducing waste and pollution. Green growth
represents an opportunity for the African continent. Because much of the continent’s
infrastructure still needs to be built, Africa has the opportunity to avoid locking in
infrastructure and natural resource management practices that undermine its natural wealth
and exacerbate vulnerabilities. These dimensions are measured through two indicators:
production efficiency (kg CO2 emissions per USD of GDP), an indication of
environmental efficiency of production; and renewable energy as share of total electricity
produced, which measures the extent to which Africa uses renewable energy sources
rather than relying on coal, oil, gas, or nuclear energy.
BOX 2 — Transitioning towards green growth in Africa
Green growth in Africa means promoting and maximising opportunities from economic growtha through:
Building resilience. Africa’s people and economies must become more resilient in the face of shocks, whether triggered by environmental or by socioeconomic events. This requires identifying adaptation and mitigation measures to reduce climatic, economic and social risks and avoid the loss of lives, incomes and productive assets. Options include climate-proofing infrastructure, developing stronger insurance schemes, establishing productive safety nets and managing risk to counter price volatility.
Managing natural assets efficiently and sustainably. Africa can use its abundant water, forest and mineral resources for growth while maintaining biodiversity and ecosystem goods and services. Innovation in green technologies offers new opportunities for growth and for productive employment.
Promoting sustainable infrastructure. Africa can develop transport systems compatible with environmental concerns. It also needs to build integrated water infrastructure to support agriculture, energy, transport and industry and to promote health and hygiene. And in the face of rising urbanisation, it can reduce pollution, improve the provision of basic services and build sustainable cities to minimise disaster risk. It can also do more to improve its water and energy security by harnessing wind, solar and hydro energy. ___________________________
a See also the AfDB Strategy 2013-2022, p.12-13.
15. Africa’s transition towards green growth is a new strategic priority, and the RMF
currently reports on achieved results, based mostly on projects financed under previous strategies.
For this reason, the introduction of green growth indicators in Level 2 is limited to the activities in
which the Bank is currently engaged, and the monitoring systems that were designed to capture
these contributions.
16. For new operations the focus on climate resilience is more explicit. The Bank will ensure
that new projects are based on a climate-informed design and include adequate environmental
safeguards and satisfactory mitigation measures.
C.3. Gender
17. Greater equality between men and women is a development objective in its own right.
Investing in women and girls is also smart economics—it boosts the pace of development
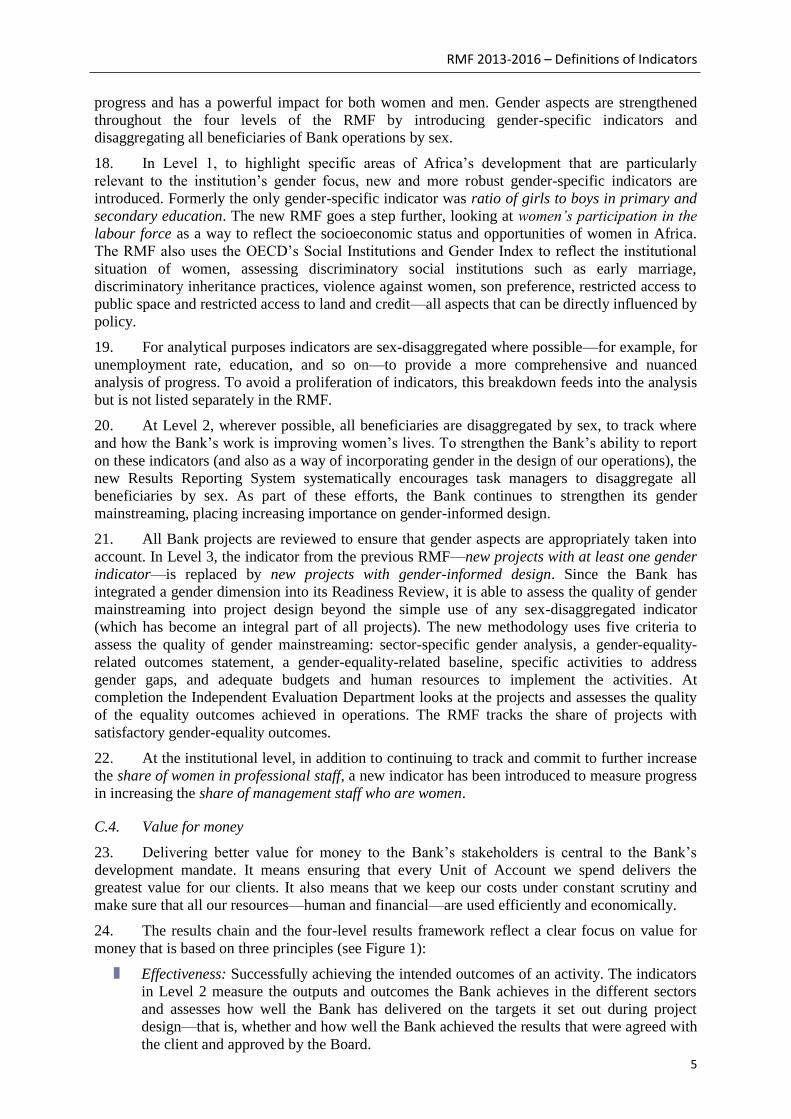
RMF 2013-2016 – Definitions of Indicators
5
progress and has a powerful impact for both women and men. Gender aspects are strengthened
throughout the four levels of the RMF by introducing gender-specific indicators and
disaggregating all beneficiaries of Bank operations by sex.
18. In Level 1, to highlight specific areas of Africa’s development that are particularly
relevant to the institution’s gender focus, new and more robust gender-specific indicators are
introduced. Formerly the only gender-specific indicator was ratio of girls to boys in primary and
secondary education. The new RMF goes a step further, looking at women’s participation in the
labour force as a way to reflect the socioeconomic status and opportunities of women in Africa.
The RMF also uses the OECD’s Social Institutions and Gender Index to reflect the institutional
situation of women, assessing discriminatory social institutions such as early marriage,
discriminatory inheritance practices, violence against women, son preference, restricted access to
public space and restricted access to land and credit—all aspects that can be directly influenced by
policy.
19. For analytical purposes indicators are sex-disaggregated where possible—for example, for
unemployment rate, education, and so on—to provide a more comprehensive and nuanced
analysis of progress. To avoid a proliferation of indicators, this breakdown feeds into the analysis
but is not listed separately in the RMF.
20. At Level 2, wherever possible, all beneficiaries are disaggregated by sex, to track where
and how the Bank’s work is improving women’s lives. To strengthen the Bank’s ability to report
on these indicators (and also as a way of incorporating gender in the design of our operations), the
new Results Reporting System systematically encourages task managers to disaggregate all
beneficiaries by sex. As part of these efforts, the Bank continues to strengthen its gender
mainstreaming, placing increasing importance on gender-informed design.
21. All Bank projects are reviewed to ensure that gender aspects are appropriately taken into
account. In Level 3, the indicator from the previous RMF—new projects with at least one gender
indicator—is replaced by new projects with gender-informed design. Since the Bank has
integrated a gender dimension into its Readiness Review, it is able to assess the quality of gender
mainstreaming into project design beyond the simple use of any sex-disaggregated indicator
(which has become an integral part of all projects). The new methodology uses five criteria to
assess the quality of gender mainstreaming: sector-specific gender analysis, a gender-equality-
related outcomes statement, a gender-equality-related baseline, specific activities to address
gender gaps, and adequate budgets and human resources to implement the activities. At
completion the Independent Evaluation Department looks at the projects and assesses the quality
of the equality outcomes achieved in operations. The RMF tracks the share of projects with
satisfactory gender-equality outcomes.
22. At the institutional level, in addition to continuing to track and commit to further increase
the share of women in professional staff, a new indicator has been introduced to measure progress
in increasing the share of management staff who are women.
C.4. Value for money
23. Delivering better value for money to the Bank’s stakeholders is central to the Bank’s
development mandate. It means ensuring that every Unit of Account we spend delivers the
greatest value for our clients. It also means that we keep our costs under constant scrutiny and
make sure that all our resources—human and financial—are used efficiently and economically.
24. The results chain and the four-level results framework reflect a clear focus on value for
money that is based on three principles (see Figure 1):
Effectiveness: Successfully achieving the intended outcomes of an activity. The indicators
in Level 2 measure the outputs and outcomes the Bank achieves in the different sectors
and assesses how well the Bank has delivered on the targets it set out during project
design—that is, whether and how well the Bank achieved the results that were agreed with
the client and approved by the Board.
RMF 2013-2016 – Definitions of Indicators
6
Efficiency: Maximising output for a given input while ensuring the same standards of
quality. The indicators, especially those in Level 3, reflect this mix of quality and timely
delivery—for example, the time it takes to prepare a project, but also the quality of the
design of the project—to ensure swift and high-quality delivery of operations.
Economy: Reducing the cost of resources used for an activity while maintaining the same
standards of quality. The RMF tracks costs directly by looking at cost of preparing a
lending project, annual cost of supporting project implementation, and work environment
cost per seat. It also examines how the Bank’s structure is helping it better engage with
clients and deliver high-quality and cost-effective operations—for example, through share
of operations professional staff based in field offices and share of operations task-
managed from field offices.
FIGURE 1 — A conceptual model for delivering better value for money
To contribute to Africa’s development (Level 1), the Bank needs to achieve effective outcomes in its operations (Level 2). How it achieves these outcomes is critical: its portfolio needs to be well designed, well performing, and efficient (Level 3). Efficient and effective operations are achieved through organisational structures (Level 4) that are lean and client-oriented, and that allow the Bank to work at its best.
25. The Bank will continue to streamline its operational, institutional and budgetary
processes, weighing time and resource costs against value-added and necessary safeguards. Better
cost accounting will strengthen the links between resources and results, and costs related to
project design and implementation will be tracked to push for economies and greater cost-
efficiency for delivering outputs and outcomes.
C.5. Fragile states
26. More than 200 million Africans live in countries affected by conflict and instability, and
80 percent of all the world’s fragile states are in Africa. These countries lag behind on almost all
development indicators—for example, compared with other low-income countries, their rates of
malnutrition are 50 percent higher, child mortality rates 20 percent higher, and primary school
completion rates 18 percent lower. State fragility is a major constraint on Africa’s development.
Therefore, the RMF gives special attention to this subset of countries. The challenge is to
integrate fragility-specific indicators—which cover only a subset of Africa’s development and
RMF 2013-2016 – Definitions of Indicators
7
Bank activities—into the “One Bank RMF,” which aims to reflect the overall situation of the
continent and the performance of the whole Bank.
27. The previous RMF used number of fragile countries. To provide an even better sense of
the scope of the issue, in the new RMF this indicator has been replaced with share of population
living in fragile countries. As part of the New Deal’s Peacebuilding and Statebuilding Goals,
additional specialised indicators on fragile states are being discussed; this discussion will inform
the refinement of the results framework and help to improve the design and alignment of Bank
Group assistance. As new indicators become available they may be used in the RMF to provide a
richer analysis on fragile states.
28. Even now, however, it is important to note that other indicators cover fragile states
implicitly. For example, while the CPIA and governance scores are directly influenced by fragile
states, other indicators—especially those focussing on the poorest people, such as access to
electricity—are often driven by achievements in fragile states. Furthermore, for analytical
purposes and to assess achievements, most of the RMF indicators can easily be disaggregated to
reflect the group of fragile states (as is currently done for ADF countries).
29. Given the complex nature of situations of fragility and conflict, more in-depth analysis
and monitoring are needed than the corporate RMF is able to provide. Dedicated publications,
such as the recently published Development Effectiveness Review on Fragile States, will address
the issue more systematically and in greater depth.
C.6. Agriculture and food security
30. Agriculture is the foundation of Africa’s economy, employing 60 percent of the
population and contributing 30 percent of GDP. Some 16 percent of Africa’s land is arable—the
highest proportion of any continent—and agricultural labour is plentiful. With 79 percent of the
arable land still uncultivated, there is enormous potential for growth; and if this land were put to
work effectively, it could provide food security for the continent and improve living standards for
the rural population. Ninety percent of production is at subsistence level, and 80 percent of
smallholders have less than two hectares of land. And with population growth outstripping
agriculture production, food prices have been rising rapidly, with profound economic, social and
political implications. The demand for food staples will grow dramatically in this decade; it is
expected to double by 2020.
31. For Africa’s potential to be developed there is a need for major investment in productivity
and infrastructure. Strengthening agriculture and food security through an integrated value chain
approach can improve the livelihoods of Africans who live in rural areas. By continuing to invest
in rural infrastructure (such as rural roads, irrigation, electricity, storage facilities, access to
markets, conservation systems and supply networks), the Bank will help countries increase their
agricultural productivity and competitiveness. By investing in regional infrastructure and
engaging in policy dialogue to remove trade barriers to importing food and inputs such as
fertilisers, it will help restrict food price volatility and reduce food insecurity.
32. Agriculture and food security are reflected throughout the RMF, often cutting across the
five core operational priorities. In level 1 the RMF looks explicitly at food insecurity and
agricultural productivity. Other indicators look at complementary aspects of rural development
and agribusiness, such as access to finance or to infrastructure such as electricity and roads. In
Level 2 four indicators measure the Bank’s results in agriculture (land with improved water
management, land whose use has been improved, rural population using improved technology,
and people benefiting from improvements in agriculture). Here also, a number of achievements
are cross-sector and are captured in related indicators such as feeder roads or cross-border roads
constructed, which helps raise farmgate prices by offering more reliable and affordable access to
markets for produce and inputs. Similarly, microfinance is often a powerful approach to support
rural development, private sector investment can include agribusiness investments, and so on.
Together these indicators capture key aspects of the Bank’s contributions to Africa’s agricultural
development and food security.
RMF 2013-2016 – Definitions of Indicators
8
II. DEFINITIONS OF INDICATORS
33. This section lists all indicators according to the structure of the RMF, from Level 1 to
Level 4. Each indicator has a short description of what it entails and how it is calculated, together
with the source and the unit.
A. Level 1: What development progress is Africa making?
34. Following the Bank’s Strategy 2013-2022, the structure of Level 1 reflects the two
strategic objectives of inclusive growth and gradual transition towards green growth. The
indicators look at the various dimensions of growth. The biggest challenge is data availability.
Data for Africa are particularly limited in the area of green growth.
1 WHAT DEVELOPMENT PROGRESS IS AFRICA MAKING?
1.1 INCLUSIVE GROWTH
ECONOMIC INCLUSION: REDUCING POVERTY & INCOME INEQUALITY
1.1.1 Gross domestic product growth—The increase in overall income in a country. GDP is the sum of gross value added by all resident producers in the economy plus any product taxes and minus any subsidies not included in the value of the products. It is calculated without making deductions for depreciation of fabricated assets or for depletion and degradation of natural resources. Source: AfDB / IMF | Unit: percentage
1.1.2 GDP per capita—The average income per person, calculated as GDP divided by midyear population. It offers an indication of disposable income. In combination with additional indicators, it offers a more comprehensive picture of the economic situation in Africa than GDP alone. Source: AfDB | Unit: USD
1.1.3 Population living below the poverty line—Share of people that are considered poor, when poverty is defined as living below the national poverty line. It offers an indication of what share of the population is most vulnerable. In combination with income inequality and GDP, it indicates the level of inclusion. Source: AfDB / World Bank | Unit: percentage
1.1.4 Income inequality (Gini index)—The extent to which people share in a country’s prosperity. The indicator measures the extent to which the distribution of income or consumption expenditure among individuals or households within an economy deviates from a perfectly equal distribution. Source: AfDB / World Bank | Unit: rating from 0 (low inequality) to 100 (high inequality)
SPATIAL INCLUSION: EXPANDING ACCESS TO BASIC SERVICES
1.1.5 Access to improved water source—Percentage of the population with reasonable access to an adequate amount of water from an improved source, such as a household connection, public standpipe, borehole, protected well or spring, or rainwater collection. Unimproved sources include vendors, tanker trucks, and unprotected wells and springs. Reasonable access is defined as the availability of at least 20 litres a person a day from a source within one kilometre of the dwelling. Source: WHO / UNICEF Joint Monitoring Programme for Water Supply and Sanitation | Unit: percentage
1.1.6 Access to improved sanitation facilities—Share of population with at least adequate access to excreta disposal facilities that can effectively prevent human, animal, and insect contact with excreta. Improved facilities range from simple but protected pit latrines to flush toilets with a sewerage connection. To be effective, facilities must be correctly constructed and properly maintained.
RMF 2013-2016 – Definitions of Indicators
9
Source: WHO / UNICEF Joint Monitoring Programme for Water Supply and Sanitation | Unit: percentage
1.1.7 Access to telephone services—Africans’ access to mobile information and communication systems. Mobile cellular telephone subscriptions are subscriptions to a public mobile telephone service using cellular technology, which provide access to the public switched telephone network. Postpaid and prepaid subscriptions are included. Because mobile technology is the dominant form of access, this indicator does not take fixed-line connections into account. Source: ITU | Unit: : number of users
1.1.8 Access to electricity—Share of the African population with an electricity connection. Electricity is indispensable for certain basic activities (lighting, refrigeration, etc.) and cannot easily be replaced by other forms of energy. Given the high level of connectivity in North Africa (99%) and certain middle-income countries, the indicator is driven mainly by developing countries and rural areas with low levels of access. Source: IEA | Unit: percentage
1.1.9 Road density—To indicate the level of road infrastructure, the indicator measures the ratio of the length of the country's total road network to the country’s land area (km roads/km2 of land area). The road network includes all roads in the country: motorways, highways, main or national roads, secondary or regional roads, and other urban and rural roads. As most indicators on access to roads are based on infrequent household surveys, this indicator serves as a reasonable proxy for the availability of transport and thus access to services and markets in Africa. Source: AfDB | Unit: ratio from 0 (low) upwards
1.1.10 Share of population living in fragile countries—The share of African population living in a fragile or conflict-affected country a (identified by the MDBs’ Harmonised List of Fragile Situations). These are often the most vulnerable and disenfranchised people, with limited access to basic services or accountable and effective security and social protection. Source: AfDB / UN POPIN | Unit: percentage
SOCIAL INCLUSION: ENSURING EQUAL OPPORTUNITIES FOR ALL
1.1.11 Life expectancy—Life expectancy at birth indicates the number of years a newborn infant would live if prevailing patterns of mortality at the time of its birth were to stay the same throughout its life. Source: AfDB | Unit: years
1.1.12 Enrolment in education—Combined primary, secondary, and tertiary gross enrolment ratio—that is, the number of students enrolled in the primary, secondary and tertiary levels of education, regardless of age, as a percentage of the population of appropriate age for the three levels. It gives an indication of the level of education from nursery/kindergarten to post-graduate education. It is part of the UNDP Human Development Index. Source: UNDP | Unit: percentage
1.1.13 Enrolment in technical/vocational training—number of students enrolled in technical/vocational programmes at public and private upper secondary education institutions as a share of total students enrolled in secondary education. It is a proxy for how well young people are being equipped with job skills. Source: EDStat | Unit: percentage
1.1.14 Unemployment rate—Share of people who are unemployed, calculated as people of working age who (a) were without work during the reference period, (b) were available for work, and (c) were seeking work, as a percentage of the total labour force. It reflects an underutilisation of economic potential, and indicates missing economic opportunities. Source: AfDB / ILO | Unit: percentage
1.1.15 Women’s participation in the labour market—The level of women’s participation in the
RMF 2013-2016 – Definitions of Indicators
10
work force, calculated as the share of a country’s working-age women that engage actively in the labour market, either by working or by looking for work. It indicates the socioeconomic status and opportunities of women in Africa. Source: ILO | Unit: percentage
POLITICAL INCLUSION: SECURING BROAD-BASED REPRESENTATION
1.1.16 Mo Ibrahim Index of African Governance—A composite index that looks at various dimensions of governance (personal safety, rule of law, accountability and corruption, and national security) and combines them in a standardised way to provide a statistical measure of governance performance in African countries and to assess the effective delivery of public goods and services. Source: Mo Ibrahim Foundation | Unit: rating from 0 (low) to 100 (high)
1.1.17 Tax and non-tax fiscal revenues—Revenue from taxes and other transfers as percentage of GDP. Transfers means compulsory transfers to the central government for public purposes, excluding fines, penalties, and most social security contributions. Refunds and corrections of erroneously collected tax revenue are treated as negative revenue. Source: IMF/ World Bank | Unit: percentage
1.1.18 Index of Effective and Accountable Government—Indicator on the effective use of public resources, with scores that reflect the answers to four questions: (a) Are the executive, legislative, and judicial branches of government able to oversee one another’s actions and hold each other accountable for any excessive exercise of power? (b) Does the state system ensure that people’s political choices are free from domination by the specific interests of power groups (e.g., the military, foreign powers, totalitarian parties, regional hierarchies, and/or economic oligarchies)? (c) Is the civil service selected, promoted, and dismissed on the basis of open competition and by merit? (d) Is the state engaged in issues reflecting the interests of women, disabled people, and ethnic, religious, and other distinct groups? Source: Freedom House/World Bank | Unit: rating from 0 (low) to 7 (high)
1.1.19 Country Policy and Institutional Assessment (CPIA)—A rating of how conducive a country’s policy and institutional framework is to ensuring the efficient utilisation of scarce development resources in the pursuit of sustainable and poverty-reducing development. The overall rating reflects sub-ratings in four clusters: Economic Management, Structural Policies, Policies for Social Inclusion, and Public Sector Management and Institutions. Source: AfDB / World Bank | Unit: rating from 1 (low) to 6 (high)
1.1.20 Gender-Sensitive Country Institutions (Index)—Indicator on discriminatory social institutions such as early marriage, discriminatory inheritance practices, violence against women, son preference, restricted access to public space, and restricted access to land and credit. The index is made up of 14 unique variables, grouped into 5 sub-indices: Discriminatory Family Code, Restricted Physical Integrity, Son Bias, Restricted Resources, and Entitlements and Restricted Civil Liberties. Source: OECD | Unit: rating from 0 (low discrimination) to 1 (high discrimination)
SUSTAINING GROWTH: BUILDING COMPETITIVE ECONOMIES
1.1.21 Intra-African trade—Extent of African countries’ trade with each other, measured as the volume of exports and imports of goods and service. It reflects the state or regional integration of both soft and hard infrastructure that allows for trade across the continent. Source: UNCTAD | Unit: USD
1.1.22 Cost of trading across borders—Cost of export and import, measured as all the official costs associated with completing the procedures to export or import a 20-foot container
RMF 2013-2016 – Definitions of Indicators
11
by sea transport—costs for documents, administrative fees for customs clearance and inspections, customs broker fees, port-related charges and inland transport costs. It does not include customs tariffs and duties or the actual costs of sea transport. Source: World Bank/IFC | Unit: USD
1.1.23 Economic Diversification (index)—Indication of a country’s reliance on a small number of economic sectors. The index signals whether the structure of exports or imports differs from the structure of world products. A value closer to 1 indicates a bigger difference from the world average. Source: UNCTAD | Unit: rating from 0 (high) to 1 (low)
1.1.24 Global Competitiveness—This index measures an economy’s level of competitiveness—that is, the institutions, policies, and factors that set the present and medium-term levels of economic prosperity. It takes into account 12 pillars or drivers: institutions, infrastructure, macroeconomic environment, health and primary education, higher education and training, goods market efficiency, labour market efficiency, financial market development, technological readiness, market size, business sophistication, and innovation. Source: World Economic Forum | Unit: rating from 1 (low) to 7 (high)
1.1.25 Time required for business start-up—Number of calendar days needed to complete the procedures to legally operate a business. If a procedure can be speeded up at additional cost, the fastest procedure, independent of cost, is chosen. Source: World Bank /IFC | Unit: days, from 1 (low) upwards
1.1.26 Access to finance—Adults with an account at a financial institution. It is measured as the percentage of the population with an account (alone or with someone else) at a bank, credit union, other financial institution (e.g., cooperative, microfinance institution), or the post office (if applicable), including those with a debit card. Source: Global Financial Inclusion (Global Findex) Database | Unit: percentage
1.2 THE TRANSITION TOWARDS GREEN GROWTH
BUILDING RESILIENCE AND ADAPTING TO A CHANGING ENVIRONMENT
1.2.1 Food insecurity—Proportion of the population estimated to be at risk of caloric inadequacy. The indicator is a proxy for the exposure of the most vulnerable people to environmental and economic shocks. This indicator was adopted as the official Millenium Development Goal indicator for goal 1, target C. Source: FAO | Unit: percentage
1.2.2 Resilience to water shocks—Indication of Africa’s vulnerability to short- and long-term changes in water supply. The indicator assesses the pressure on renewable water sources by measuring the total freshwater withdrawn in a given year, expressed as a percentage of the actual total renewable water resources. Source: FAO AquaStat | Unit: percentage
MANAGING NATURAL ASSETS EFFICIENTLY AND SUSTAINABLY
1.2.3 Institutional capacity for environmental sustainability—Extent to which environmental policies foster the protection and sustainable use of natural resources and the management of pollution. The indicator is a sub-indicator of the CPIA. It covers both institutional context (access to information, public participation, quality and effectiveness of the environmental assessment system, cross-sectoral coordination, and accountability) and environmental themes (air pollution, water pollution, waste, freshwater resources, marine and coastal resources, ecosystem and biodiversity, commercial renewable resources, non-renewable resources, and climate change).
RMF 2013-2016 – Definitions of Indicators
12
Source: AfDB / World Bank | Unit: rating from 1 (low) to 6 (high)
1.2.4 Agricultural productivity—Average agricultural value-added per agricultural worker. Agriculture comprises value added from forestry, hunting, and fishing as well as cultivation of crops and livestock production, less the value of intermediate inputs. Changes in the indicator may measure gains in productivity but also changes in environmental influences on productivity. Source: FAO | Unit: constant 2000 USD
PROMOTING SUSTAINABLE INFRASTRUCTURE, REDUCING WASTE AND POLLUTION
1.2.5 Production efficiency—Indication of environmental efficiency of production, measured as the ratio of CO2 emissions per GDP (kg CO2 per USD of GDP). Emissions are those stemming from the burning of fossil fuels and the manufacture of cement. They include CO2 produced during the consumption of solid, liquid, and gas fuels and gas flaring. Source: Carbon Dioxide Information Analysis Center4
| Unit: ratio, from 0 (low) upwards
1.2.6 Renewable energy—Indication of Africa’s use of its renewable energy sources to produce electricity rather than relying on coal, oil, gas, or nuclear energy. Renewable energy sources from hydro, bioenergy, wind, geothermal, solar photovoltaic, concentrated solar power, and marine are included as a share of total electricity generated. Source: World Bank | Unit: percentage
B. Level 2: How well is AfDB contributing to development in Africa?
35. These indicators focus increasingly on outcomes—on how operations are improving
people’s lives—rather than physical outputs. The structure of sector clusters aims to show mini-
results-chains. The indicators provide some indication of the scope of physical outputs, such as
MW installed; then focus on an indication of the sustainability of outputs, such as staff
trained/recruited for road maintenance; and finally indicate how the Bank’s activities are
benefitting people on the ground. The new RMF includes results from previous strategic
objectives for which the results are only now materialising. This means the RMF has to be both
forward- and backward-looking. Therefore, Level 2 captures not only the results in the Bank’s
current priority areas, but also results achieved in areas such as health or education that are no
longer operational priorities in the Strategy 2013-2022. This also means that results from some
aspects of the new strategy, especially in the areas of renewable energy and sustainable
infrastructure, will materialise only in the coming years and will show only in future results
frameworks.
2 HOW WELL IS AFDB CONTRIBUTING TO DEVELOPMENT IN AFRICA?
2.1 INFRASTRUCTURE DEVELOPMENT
2.1.1 Transport—Roads roads constructed, rehabilitated or maintained—The indicator shows the Bank’s efforts to create the necessary infrastructure to unlock the development potential of African countries by measuring the total kilometres of roads and feeder roads constructed, rehabilitated or maintained as a result of the Bank’s intervention. Roads are typically non-rural roads connecting urban centres/towns/settlements of more than 5,000 inhabitants to each other or to higher classes of roads, market towns and
4 The Bank will develop and pilot a tool to track greenhouse gas emissions in accordance with the provisions
of the UNFCCC, without prejudging current negotiations under the Convention. Upon completion of this tool, the Bank will report ex-ante on GHG emissions (gross and net) in project documentation (ISS, Section C.3 § 15 p. 47).
RMF 2013-2016 – Definitions of Indicators
13
urban centres; and feeder roads are typically rural roads connecting small urban centres/towns/settlements of less than 2,000 to 5,000 inhabitants to each other or to higher classes of roads, market towns and urban centres. Source: PCRs | Unit: kilometres
2.1.2 Transport—Staff trained/recruited for road maintenance—This indicator counts the total number of people who have received specific training and/or been recruited to ensure the efficiency of the road network (paved and non-paved) as a result of the Bank’s intervention. It includes staff working for the public sector at the central and local levels. Source: PCRs | Unit: number
2.1.3 Transport—People educated in road safety and HIV transmission—To assess the Bank’s efficiency in promoting sustainable development in the transport sector, the indicator measures the total number of people who have received specific training on road security and/or on HIV prevention as a result of the Bank’s intervention. Source: PCRs | Unit: number
2.1.4 Transport—People with improved access to transport (% of which are women)—Better transport can boost economic activities and transform the lives of communities. The indicator measures the Bank’s efforts to promote access for isolated communities by providing all-weather roads. It is calculated as the total number of people benefiting from access to all-season public transportation—within 2 km of their homes—as a result of the Bank’s intervention. Source: PCRs | Unit: number (percent of which are women)
2.1.5 Energy—Power capacity installed (of which renewable)—The indicator measures the extent to which the Bank has responded effectively to the growing energy needs of African countries, measuring the total power capacity of power plants and combined heat and power plants installed as a result of the Bank’s intervention. The total capacity installed from renewable energy sources—hydro, bioenergy, wind, geothermal, solar photovoltaic, concentrated solar power, and marine—is singled out. Source: PCRs | Unit: megawatts
2.1.6 Energy—Staff trained/recruited in the maintenance of energy facilities—The indicator measures the total number of people who have received specific training and/or been recruited to maintain efficient energy facilities, including power plants, transmission lines, distribution substations and transformers, as a result of the Bank’s intervention. Source: PCRs | Unit: number
2.1.7 Energy—People benefiting from new or improved electricity connections (% of which are women)—The indicator assesses the Bank’s contribution to improving the life of African people by providing access to electricity, enabling better-quality services and contributing to reduced pollution from diesel generators and household burning of fossil fuels. It provides the total number of people enjoying new access to electricity or better electricity connections as a result of the Bank’s intervention. Source: PCRs | Unit: number (percent of which are women)
2.1.8 Energy—CO2 emissions reduced—The indicator measures one factor in the Bank’s work to support the sustainable and efficient use of Africa’s natural resources while helping client countries respond to the challenges of an increasingly variable climate. It is calculated as the reduction in the amount of emission of carbon dioxide equivalent per year in tons from consumption as a result of the Bank’s intervention. To track this indicator the Bank will develop and pilot a tool to track greenhouse gas emissions in accordance with the provisions of the UNFCCC, without prejudging current negotiations under the Convention. Upon completion of this tool, the Bank will report ex-ante on GHG emissions (gross and net) in project documentation (ISS, Section C.3 § 15 p. 47). Source: PCRs | Unit: tons per year
RMF 2013-2016 – Definitions of Indicators
14
2.1.9 Water—Drinking water capacity created (service reservoirs)—The indicator is calculated as the total production capacity of safe water available at a community water point, resulting from the Bank’s intervention. A community water point is a public outlet for the provision of water supply. Source: PCRs | Unit: m
3/day
2.1.10 Water—Workers trained in the maintenance of water facilities—The indicator, a measure of the Bank’s support of the sustainable management of water supply, is calculated as the total number of people who have received specific training and/or been recruited to maintain the water facilities. Source: PCRs | Unit: number
2.1.11 Water—People with new or improved access to water and sanitation (% of which are women)—The indicator captures the Bank’s overall contribution to African countries’ efforts to provide access to safe water—that is, piped household connections (house or yard connections), public standpipes, boreholes, protected dug wells, or protected spring and rainwater collection—and improved sanitation services. Given that many projects provide beneficiaries with improved access to both water and sanitation, for now this indicator is reported jointly; the Bank has started to track both separately for future reporting. It is calculated as the total number of people who have new or improved access to water and sanitation as a result of the Bank’s intervention. Source: PCRs | Unit: number (percent of which are women)
2.1.12 ICT—People benefiting from improved access to basic ICT services—The indicator measures the Bank’s overall contribution in enhancing competitiveness and reducing the digital divide between and within countries. It provides the total number of people served with access to mobile and/or wire-line telephone services and/or Internet-based services. Source: PCRs | Unit: number (per-cent of which are women)
2.2 REGIONAL INTEGRATION
2.2.1 Transport—Cross-border roads constructed or rehabilitated—The indicator measures the Bank’s effort to promote regional integration by linking centres of economic activity with ports and feeder roads and extending the benefits to surrounding areas. It is calculated as the total kilometres of roads and feeder roads constructed, rehabilitated or maintained as a result of the Bank’s multinational intervention. Source: multinational PCRs | Unit: kilometres
2.2.2 Energy—Cross-border transmission lines constructed or rehabilitated—The indicator assesses the Bank’s contribution to the development of regional power pools, through which neighbouring countries connect their power grids into a single transmission network. It is calculated as the total number of kilometres of cross-border transmission lines constructed, rehabilitated or maintained as a result of the Bank’s multinational intervention. Source: multinational PCRs | Unit: kilometres
2.3 PRIVATE SECTOR DEVELOPMENT
2.3.1 Government revenue from investee projects and subprojects—The indicator measures the effectiveness of the Bank’s non-sovereign lending activity, which is designed to catalyse commercial investment in infrastructure, industry and the financial sector. It provides the total amount of revenues—taxes, dividends, subsidies, grants, and any other payments—generated by the Bank’s investee projects and subprojects and collected by the government. Source: XSRs | Unit: million USD
2.3.2 SME effect (turnover from investments)—The indicator measures the extent of the Bank’s support of local small and medium-sized enterprises (SMEs) that generate new
RMF 2013-2016 – Definitions of Indicators
15
turnover. SMEs are defined as firms with 10-250 employees, with less than US$50 million in turnover. The indicator is calculated as the total amount of turnover generated by Bank investee projects and subprojects. Source: XSRs | Unit: million USD
2.3.3 Microcredits granted—The indicator measures the effectiveness of the Bank’s effort to provide SMEs with access to credit, enabling them to expand and take on more workers. It is calculated as the total number of microcredits ensured as a result of the Bank’s intervention. Source: XSRs | Unit: number
2.3.4 Microfinance clients trained in business management—The indicator assesses the Bank’s effort to create and promote a sound climate for business and investment, enabling Africa’s SMEs to grow and flourish. It is calculated as the total number of people who have received specific training in business-related activities as a result of the Bank’s intervention. Source: XSRs | Unit: number
2.3.5 Jobs created (% of which are for women)—The indicator measures the Bank’s success in creating permanent jobs in the private sector, particularly for women, by prioritising access to finance for enterprises and promoting public-private partnerships. It is calculated as the total number of jobs creates as a result of Bank’s intervention. Source: PCRs and XSRs | Unit: number (percent of which are for women)
2.3.6 People benefiting from investee projects and microfinance (% of which are women)—The indicator captures the overall contribution of the Bank’s private sector development projects, particularly in developing the SMEs that are key to generating employment. It is calculated as the total number of people benefiting from investee projects and microfinance as a result of the Bank’s intervention in the private sector. Source: PCRs and XSRs | Unit: number (percent of which are women)
2.3.7 Agriculture—Land with improved water management—The indicator assesses the Bank’s efficacy in boosting the agriculture sector and improving food security. It is calculated as the total number of hectares of land irrigated as a result of the Bank’s intervention. Source: PCRs | Unit: hectares
2.3.8 Agriculture—Land whose use has been improved: replanted, reforested—The indicator, a measure of the Bank’s work to increase natural disaster resilience, is calculated as the total number of hectares of land that have been replanted or reforested as a result of the Bank’s intervention. Source: PCRs | Unit: hectares
2.3.9 Agriculture—Rural population using improved technology—The indicator, a measure of the Bank’s work to promote rural development, is calculated as the total number of people who have received specific training on agriculture-related activities and/or technical assistance on using improved technology as a result of the Bank’s intervention. Source: PCRs | Unit: number
2.3.10 Agriculture—People benefiting from improvements in agriculture (% of which are women)—The indicator captures the Bank’s overall contribution in the agriculture sector—one of the most direct ways to promote inclusive growth. It is calculated as the total number of people benefiting from improved agricultural productivity as a result of the Bank’s intervention. Source: PCRs | Unit: number (percent of which are women)
2.4 SKILLS & TECHNOLOGY
2.4.1 People benefiting from vocational training (% of which are women)—The indicator, a
RMF 2013-2016 – Definitions of Indicators
16
measure of the Bank’s provision of specific vocational education services tailored to African countries’ needs, is calculated as the total number of people who have received specific vocational training as a result of the Bank’s intervention. Vocational training is defined as training that emphasises the skills and knowledge required for a particular job function or trade. Source: PCRs | Unit: number (percent of which are women)
2.4.2 Classrooms and educational support facilities constructed—The indicator, a measure of the Bank’s effort to improve access to education, is calculated as the total number of schools, classrooms, and other educational support facilities constructed or rehabilitated as a result of the Bank’s intervention. Source: PCRs | Unit: number
2.4.3 Teachers and other educational staff recruited/trained—The indicator, a measure of the Bank’s effort to improve the quality of education, is calculated as the total number of teachers and other educational staff recruited and/or trained as a result of the Bank’s intervention. Source: PCRs | Unit: number
2.4.4 People benefiting from better access to education (% of which female)—The indicator captures the Bank’s efficacy in improving the access to education in African countries. It is calculated as the total number of people who have better access to education as a result of the Bank’s intervention. Source: PCRs | Unit: number (percent of which are female)
2.4.5 Primary, secondary and tertiary health centres—The indicator, a measure of the Bank’s effort to support African countries in developing a solid public health sector, is calculated as the total number of facilities for providing primary, secondary, or tertiary health care that were constructed, renovated and/or equipped a result of the Bank’s intervention. Source: PCRs | Unit: number
2.4.6 Health workers trained—The total number of health personnel who have received training through Bank-financed projects. Health personnel includes all types of health workers (doctors, nurses, midwives, and laboratory staff) and health administrators/managers; and training means pre-service or in-service training of any duration, including workshops and knowledge sharing; most training provided through Bank funds is in-service training of short to medium duration (e.g., upgrading skills and refresher training). Source: PCRs | Unit: number
2.4.7 People with access to better health services (% of which are female)—The indicator captures the Bank’s efficacy in improving the quality and delivery of health services in African countries. It is calculated as the total number of people who have access to improved health care (primary, secondary and tertiary) as a result of the Bank’s intervention. Source: PCRs | Unit: number (percent of which are female)
2.5 GOVERNANCE AND ACCOUNTABILITY
2.5.1 Share of countries with improved quality of budgetary and financial management—The indicator assesses whether Bank interventions have helped countries link a comprehensive and credible budget to policy priorities, strengthen financial management systems, and improve the timeliness and accuracy of accounting, fiscal reporting, and auditing. The calculations are based on the CPIA scores from before and after a relevant Bank intervention in a country. The indicator is expressed as the percentage of countries where improvements are observed over all countries in which the Bank has supported relevant reforms. Source: OSGE, based on CPIA data | Unit: percentage
RMF 2013-2016 – Definitions of Indicators
17
2.5.2 Share of countries with improved quality of public administration—The indicator assesses whether Bank interventions have helped client countries enhance the design and implementation of government policy and improve service delivery. The calculations are based on the CPIA scores from before and after a relevant Bank intervention. The indicator is expressed as the percentage of countries where improvements are observed over all countries in which the Bank has supported relevant reforms. Source: OSGE, based on CPIA data | Unit: percentage
2.5.3 Transparency, accountability and corruption mitigation in the public sector—The indicator assesses whether Bank interventions have helped client countries improve transparency and accountability and mitigate corruption in the public sector. It assesses the extent to which the executive can be held accountable for its use of funds by the electorate and by the legislature and judiciary, and the extent to which public employees are required to account for administrative decisions and use of resources. The calculations are based on the CPIA scores from before and after a relevant Bank intervention. The indicator is expressed as the percentage of countries where improvements are observed over all countries in which the Bank has supported relevant reforms. Source: OSGE, based on CPIA data | Unit: percentage
2.5.4 Share of countries with improved procurement systems—The indicator assesses whether Bank interventions have helped client countries improve the effectiveness of their procurement processes. Progress is measured by improvement in the procurement dimension of the Actionable Governance indicators. The indicator is expressed as the percentage of countries where improvements are observed over all countries in which the Bank has supported relevant reforms. Source: OSGE, based on Actionable Governance indicators | Unit: percentage
2.5.5 Share of countries with improved competitive environment—The indicator assesses whether the Bank’s intervention has helped client countries improve the legal, regulatory, and policy environment to help private businesses invest, create jobs, and become more productive. The indicator is expressed as the percentage of countries where improvements are observed over all countries in which the Bank has supported relevant reforms. Source: OSGE, based on Mo Ibrahim Index | Unit: percentage
C. Level 3: Is AfDB managing its operations effectively?
36. It is not enough to achieve results; it also matters how they are achieved. By engaging in
effective dialogue with clients, focusing on key priorities, and delivering high-quality operations,
the Bank makes the best use of its resources. Effective management also means achieving results
that comply with our own social and environmental safeguards, and placing special emphasis on
gender and climate change considerations while designing and delivering operations. The
indicators at this level reflect all of this. The first set of indicators focuses on the quality of the
Bank’s engagement with client countries, including aid effectiveness. The second set of indicators
reflects both the speed and the quality of the Bank’s operations, looking at the various phases of
the project cycle, from inception to closing. Gender and climate change as areas of special
emphasis are reflected in the third cluster of indicators.
3 IS AFDB MANAGING ITS OPERATIONS EFFECTIVELY?
3.1 STRENGTHENING RESULTS AT COUNTRY LEVEL
3.1.1 Average CSPs rating—This indicator draws from the Bank’s Readiness Review mechanism to measure the quality of Country Strategy Papers (CSPs) taking into account
RMF 2013-2016 – Definitions of Indicators
18
four dimensions: contextual diagnostic and strategy design rationale, alignment and ownership, positioning and strategic selectivity of programme design and monitoring, and results and risk assessment. It measures the average rating of all CSPs produced in the past year. Source: AfDB’s Readiness Reviews | Unit: rating from 1 (low) to 6 (high)
3.1.2 Timely CPPR coverage—A regular and timely Country Portfolio Performance Review (CPPR) should be conducted to monitor the health of the country portfolio and alert the country and the Bank to any need to take corrective actions. The indicator captures the percentage of country programmes in which CPPRs were conducted in the past year. Source: AfDB operations system | Unit: percentage
3.1.3 Development resources recorded on budget (Global Partnership Monitoring Framework Indicator 6)—The indicator captures the percentage of funding scheduled for disbursement that is recorded in the annual budgets approved by the legislatures of client countries. Source: AfDB Aid Effectiveness Survey | Unit: percentage
3.1.4 Predictable disbursements (Global Partnership Monitoring Framework Indicator 5a)—The indicator captures the percentage of funding for the government sector that is disbursed in the year for which it was scheduled. Source: AfDB Aid Effectiveness Survey | Unit: percentage
3.1.5 Use of country systems (Global Partnership Monitoring Framework Indicator 9b)—The indicator measures the percentage of disbursements for the government sector that use the client country’s public financial management and procurement systems. This indicator combines Paris Declaration indicators 5a (use of country PFM systems) and 5b (use of country procurement systems) to offer a single composite indicator. Source: AfDB Aid Effectiveness Survey | Unit: percentage
3.1.6 New ESW and related papers—Reflecting the scope of the Bank’s knowledge activities, the indicator counts the number of economic and sector work (ESW) and related papers the Bank produces in a year. Source: ORVP/OIVP/OSVP/ECON/COBS | Unit: number
3.1.7 Building capacity for results—The Bank aims to promote political leadership for results through training and coaching of policymakers, The indicator is calculated as the number of policymakers who have received training or coaching on (i) improving effectiveness in implementing regional policies, or (ii) improving the results orientation of policies and programmes. Source: AfCoP | Unit: number
3.2 DELIVERING EFFECTIVE AND TIMELY OPERATIONS
LEARNING FROM OUR OPERATIONS
3.2.1 Completed operations rated satisfactory—The indicator measures the share of projects that are rated satisfactory or above at completion. It reflects how well projects performed across various dimensions: relevance of design and objective, effectiveness in terms of achieving their stated objective, efficiency in using resources to achieve their outcomes, and sustainability to reflect the extent to which risks were addressed during implementation. Source: Operations Evaluation Department | Unit: percentage
3.2.2 Completed operations with sustainable outcomes—The assessment of sustainability considers the extent to which the project has addressed risks during implementation and put in place mechanisms to ensure the continued flow of benefits after project completion. The indicator is calculated as the share of projects that have a sustainability rating of satisfactory or above.
RMF 2013-2016 – Definitions of Indicators
19
Source: AfDB operations system | Unit: percentage
3.2.3 Completed operations with a timely PCR—Timely PCRs help capture Bank results and lessons learned from closing operations to feed into the design of new operations. The indicator measures the share of PCRs that were submitted within 12 months after the project closing date. Source: AfDB operations system | Unit: percentage
ENSURING STRONG PORTFOLIO PERFORMANCE
3.2.4 Disbursement ratio of ongoing portfolio—By measuring the pace at which the Bank makes resources available to clients, this indicator shows the speed with which the Bank implements its portfolio. It captures the ratio of total Bank disbursement since the beginning of the year (excluding disbursements associated with operations signed in the year and policy-based operations) over the undisbursed Bank balance of projects at the beginning of the year. Source: AfDB operations system | Unit: percentage
3.2.5 Time for procurement of goods and works—The indicator measures the average time procurement takes from bid reception to contract signature. A diligent yet speedy process is critical to implement projects on time and contribute to a reasonable disbursement ratio. Source: AfDB procurement system | Unit: months
3.2.6 Operations with satisfactory mitigation measures—The indicator measures the share of operations for which adequate mitigation measures to address environmental or social safeguards have been built in and implemented. It is calculated as the number of operations reporting satisfactory safeguard measures over all operations classified in safeguards categories 1, 2, and FI. Source: AfDB operations system | Unit: percentage
3.2.7 Operations no longer at risk—The indicator reflects the Bank’s success in bringing problematic and potentially problematic projects back on track. The indicator is calculated as the projects no longer at risk as a percentage of the total number of projects at risk at the beginning of the year. Source: AfDB operations system | Unit: percentage
3.2.8 Operations at risk—The indicator measures the share of projects that are either problematic or potentially problematic and are raised to management attention for appropriate supervision and timely corrective measures. Source: AfDB operations system | Unit: percentage
3.2.9 Operations eligible for cancellation—The indicator notes inactive projects in the portfolio that need to be cancelled or restructured. It is calculated as the ratio of cancellable projects over all active projects. Source: AfDB operations system | Unit: percentage
PREPARING HIGH-QUALITY OPERATIONS
3.2.10 Time to first disbursement—The indicator measures the time that elapses from project approval to declaration of effectiveness for first disbursement—the time needed for government ratification, meeting loan conditions, and government procurement. It is often a critical aspect of delay in project implementation that affects the disbursement ratio. It may be an indication of the quality of project design and dialogue with the client, but it may also be due to external factors. Source: AfDB financial reporting system | Unit: months
3.2.11 New operations rated satisfactory—The indicator reflects the quality of project design, taking into account eight dimensions: alignment and strategic fit, lessons learned from
RMF 2013-2016 – Definitions of Indicators
20
prior operations, rationale and ownership, focus on results and risk assessment, implementation arrangements, financial management/procurement, environmental and social considerations, and gender. It is calculated as the share of all operations reviewed that are rated satisfactory or above in the Readiness Review process. Source: AfDB’s Readiness Reviews | Unit: percentage
3.2.12 Time for approving operations—The indicator—calculated as the lapse of time between the concept note and the Board approval date—shows how quickly new operations are designed and processed from inception to approval. Source: AfDB operations system/BPPS | Unit: months
3.3 DESIGNING GENDER- AND CLIMATE-INFORMED OPERATIONS
3.3.1 New CSPs with gender-informed design—To measure how well the Bank takes gender aspects into account in the design of new country strategies, the indicator measures the share of new CSPs in which gender aspects are reflected in the results framework. Source: AfDB’s Readiness Reviews | Unit: percentage
3.3.2 Projects with satisfactory gender equality outcomes—The indicator measures how well the Bank has achieved gender aspects during the implementation of the operation. The Operations Evaluation Department reviews the achievement of the operations evaluating gender outcomes achieved by the project. This methodology is currently being revised to introduce a more detailed assessment for those projects that already use the new gender-informed design methodology. The first such projects are starting to close, and the revised methodology will be grandfathered in. Source: Operations Evaluation Department | Unit: percentage
3.3.3 New projects with gender-informed design—The indicator measures how well the Bank takes gender aspects into account in the design of new operations. It builds on five dimensions: sector-specific gender analysis, a gender-equality-related outcomes statement, a gender-equality-related baseline, specific activities to address gender gaps, and adequate budgets and human resources to implement the activities. The indicator is measured as the share of all projects going through the Readiness Review that have a satisfactory rating on gender-informed design. Source: AfDB’s Readiness Reviews | Unit: percentage
3.3.4 New projects with climate-informed design—The indicator measures how well the Bank takes climate aspects into account in the design of new operations. Projects are classified into three categories: (1) very vulnerable—which requires a detailed evaluation of climate change risks and adaptation measures; (2) vulnerable—which require a review of climate change risks and adaptation measures; (3) not vulnerable—no further action is required. The indicator measures the share of projects that have included satisfactory actions to protect development initiatives from the negative impacts of climate change, climate variability, and extreme weather events. Source: AfDB’s Readiness Reviews | Unit: percentage
D. Level 4: Is AfDB managing itself efficiently?
37. Indicators continue to reflect the Bank’s priority reforms on decentralisation and
strengthening human resources. They also reflect the even stronger focus on cost-effectiveness,
for which new indicators have been introduced to track the costs of preparing and implementing
operations.
RMF 2013-2016 – Definitions of Indicators
21
4 IS AFDB MANAGING ITSELF EFFICIENTLY?
4.1 DECENTRALISATION: MOVING CLOSER TO OUR CLIENTS
4.1.1 Share of operations professional staff based in field offices—The indicator measures the extent to which the Bank has improved its ability to respond rapidly and effectively to regional member countries’ needs by equipping the field offices with professional staff. The indicator is calculated as the ratio of operational professional staff in field offices over all Bank operational professional staff at post. Source: CHRM | Unit: percentage
4.1.2 Share of operations task-managed from field offices—The indicator assesses the extent to which the Bank has devolved management responsibilities from HQ to country offices. It is calculated as the ratio of ongoing projects task-managed from field offices over all ongoing Bank projects. Source: CIMM | Unit: percentage
4.1.3 Connecting to field offices (% successful videoconferences)—The indicator measures the quality and availability of videoconferencing in the Bank to ensure that the country offices are well connected and virtual meetings can be conducted seamlessly. It is measured as the percentage of videoconferences that were held successfully. Source: CIMM | Unit: percentage
4.2 HUMAN RESOURCES: ENGAGING AND MOBILISING STAFF
4.2.1 Employee engagement index—The indicator measures both employees’ commitment to the goals of the organisation and the extent to which the environment enables them to contribute effectively to achieving those goals. The indicator is measured through annual staff surveys. Source: CHRM | Unit: index from 0 (low) to 100 (high)
4.2.2 Managerial effectiveness index—Employees’ perception of their managers’ effectiveness in enabling staff to meet set objectives and develop their careers. The indicator is measured through annual staff surveys. Source: CHRM | Unit: index from 0 (low) to 100 (high)
4.2.3 Operations professional staff—The indicator measures the balance of the Bank’s staffing between operations professional staff and professional staff. It is calculated as the ratio of all Bank operations professional staff at post over all Bank professional staff (EL, PL and LP) at post. Source: CHRM | Unit: percentage
4.2.4 Share of women in professional staff—The indicator, a measure of the Bank’s commitment to diversity of gender among staff, is calculated as the ratio of female professional staff over all Bank professional staff (EL, PL and LP) at post. Source: CHRM | Unit: percentage
4.2.5 Share of management staff who are women—The indicator, a measure of the Bank’s ability to promote diversity of gender at the senior management level, is calculated as the ratio of female professional staff in a managerial position (PL2 or above) over total Bank management. Source: CHRM | Unit: percentage
4.2.6 Professional staff vacancy rate (net)—The indicator measures the Bank’s efficiency in minimising the number of staff vacancies by effectively recruiting people. It is calculated as the ratio of vacant professional positions (El, PL and LP)—excluding those for which recruitment is ongoing, candidates have been interviewed and selected, and offers have been made and accepted and candidates are preparing to assume their duties—to all the budgeted professional positions (EL, PL and LP) at any moment. Source: CHRM | Unit: percentage
RMF 2013-2016 – Definitions of Indicators
22
4.2.7 Average time to recruit new staff—The indicator tracks the average time taken to fill a professional level (PL) vacancy from the point the vacancy arises through advertisement, offer, acceptance of position, and assumption of duty. This is a measure of the organisation's efficiency in filling employee vacancies, measured by the number of work days consumed by the whole process. Source: CHRM | Unit: days
4.3 VALUE FOR MONEY: IMPROVING COST EFFICIENCY
4.3.1 Administrative costs per UA 1 million disbursed—The indicator assesses the extent to which the Bank has increased efficiency by reducing the administrative costs associated with disbursements. The indicator is calculated as the total amount of administrative expenditures (i.e., costs of missions, consultants, office and other expenses, and operational support) associated with 1 million UA disbursed. Source: COBS/FFCO | Unit: UA
4.3.2 Cost of preparing a lending project—The indicator is calculated as the average amount of expenditures associated with project identification, preparation, appraisal, and launching. Source: COBS | Unit: UA
4.3.3 Cost of supporting project implementation—The indicator is calculated as the average amount of expenditures associated with the support of project implementation, such as cost of supervision and midterm review. Source: COBS | Unit: UA
4.3.4 Work environment cost per seat—This indicator, a measure of how well the Bank manages its facilities, is calculated as the total rental, maintenance, and utilities costs per seat. Source: CGSP | Unit: UA
4.3.5 Share of users satisfied with IT service delivery—The indicator, a measure of Bank staff satisfaction with the efficiency of IT service delivery, is calculated through network monitoring tools and compiled using statistics models. Source: CIMM | Unit: percentage