Embed Size (px)
Citation preview
THE ORGANIZATION OF FIRMS ACROSS COUNTRIES
June 2008
Nick Bloom (Stanford, NBER & CEP)Raffaella Sadun (LSE & CEP)John Van Reenen (LSE, NBER & CEP)
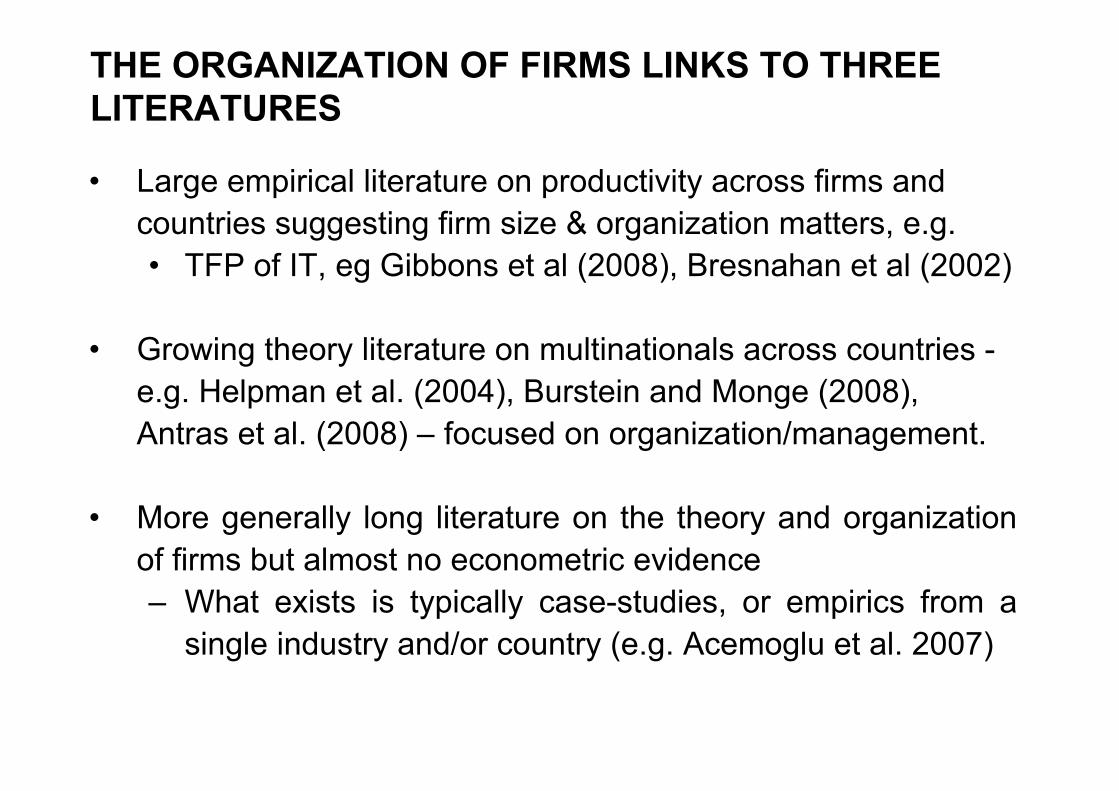
THE ORGANIZATION OF FIRMS LINKS TO THREELITERATURES
• Large empirical literature on productivity across firms andcountries suggesting firm size & organization matters, e.g.• TFP of IT, eg Gibbons et al (2008), Bresnahan et al (2002)
• Growing theory literature on multinationals across countries -e.g. Helpman et al. (2004), Burstein and Monge (2008),Antras et al. (2008) – focused on organization/management.
• More generally long literature on the theory and organizationof firms but almost no econometric evidence– What exists is typically case-studies, or empirics from a
single industry and/or country (e.g. Acemoglu et al. 2007)
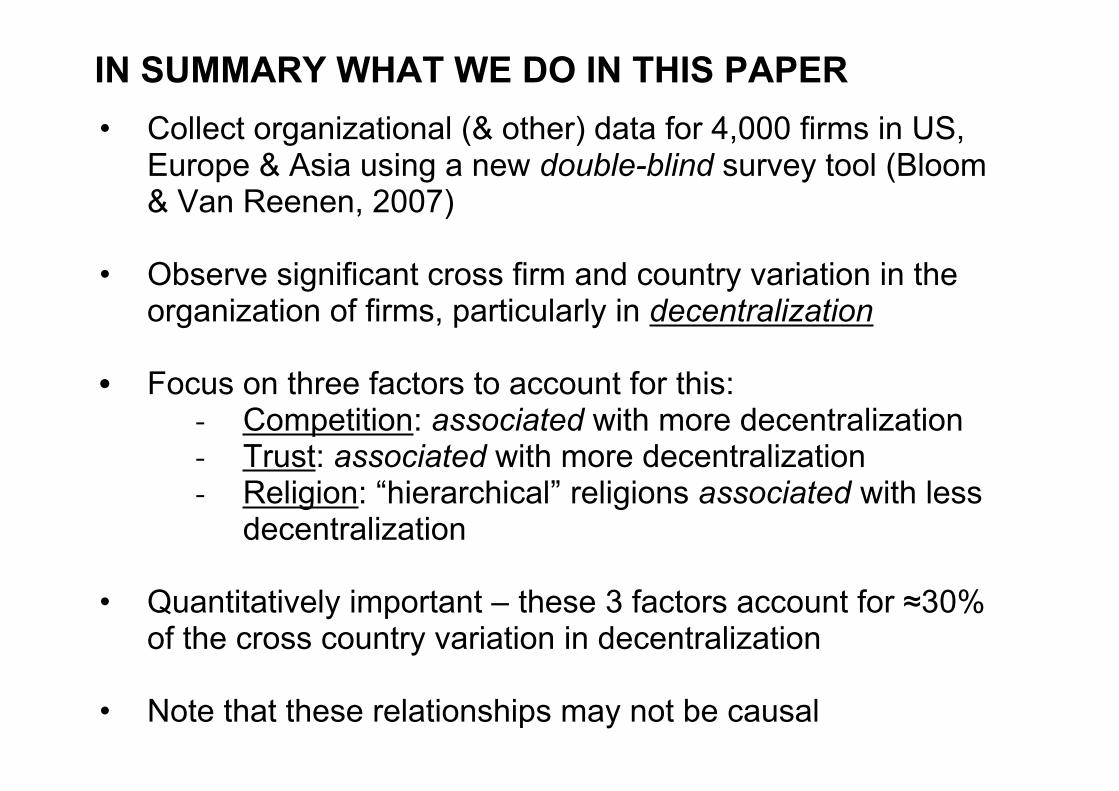
• Collect organizational (& other) data for 4,000 firms in US,Europe & Asia using a new double-blind survey tool (Bloom& Van Reenen, 2007)
• Observe significant cross firm and country variation in theorganization of firms, particularly in decentralization
• Focus on three factors to account for this:- Competition: associated with more decentralization- Trust: associated with more decentralization- Religion: “hierarchical” religions associated with less
decentralization
• Quantitatively important – these 3 factors account for ≈30%of the cross country variation in decentralization
• Note that these relationships may not be causal
IN SUMMARY WHAT WE DO IN THIS PAPER
• Data Collection Methodology
• Exploring the raw data
• Interpreting the data
• Quantification

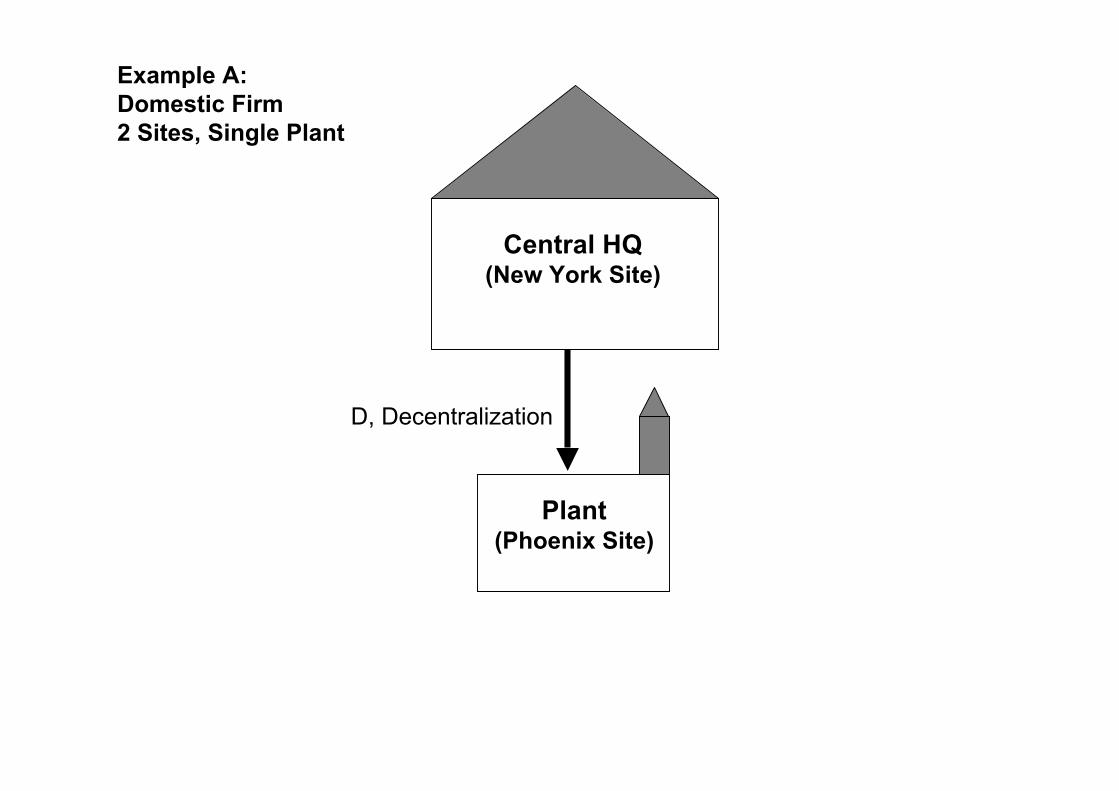
Central HQ(New York Site)
Example A: Domestic Firm2 Sites, Single Plant
Plant(Phoenix Site)
D, Decentralization
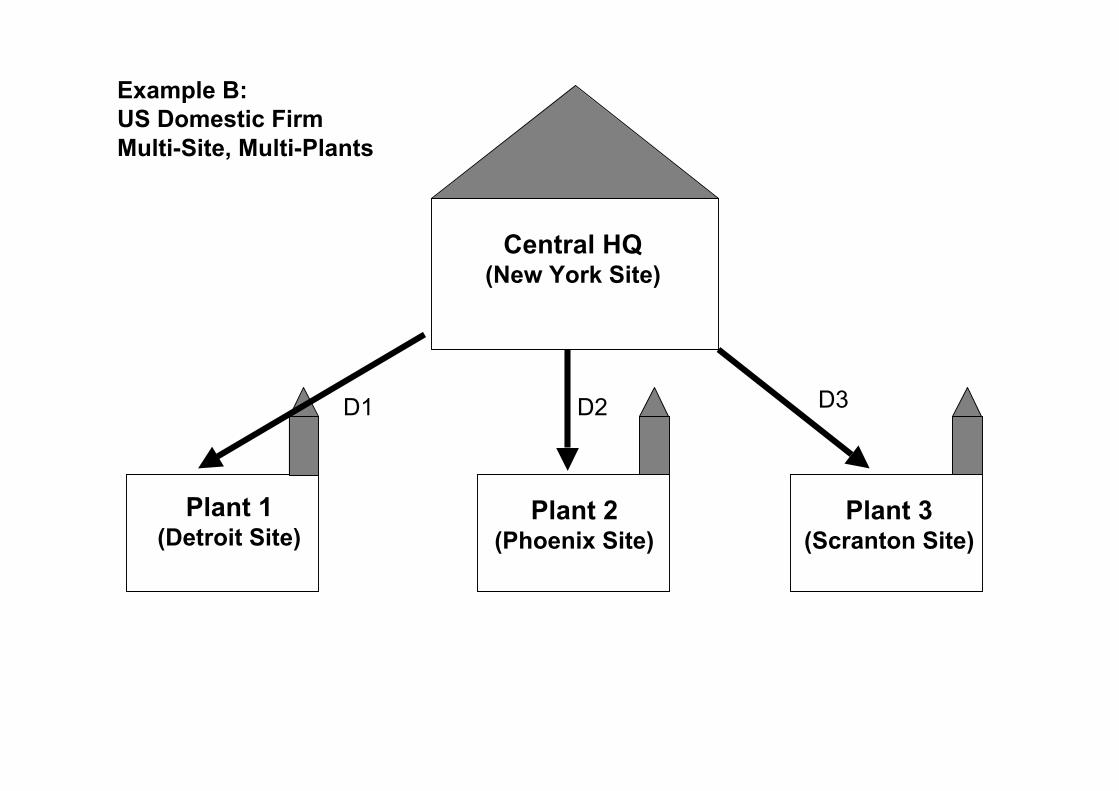
Central HQ(New York Site)
Example B: US Domestic FirmMulti-Site, Multi-Plants
Plant 1(Detroit Site)
Plant 3(Scranton Site)
Plant 2(Phoenix Site)
D1 D2 D3
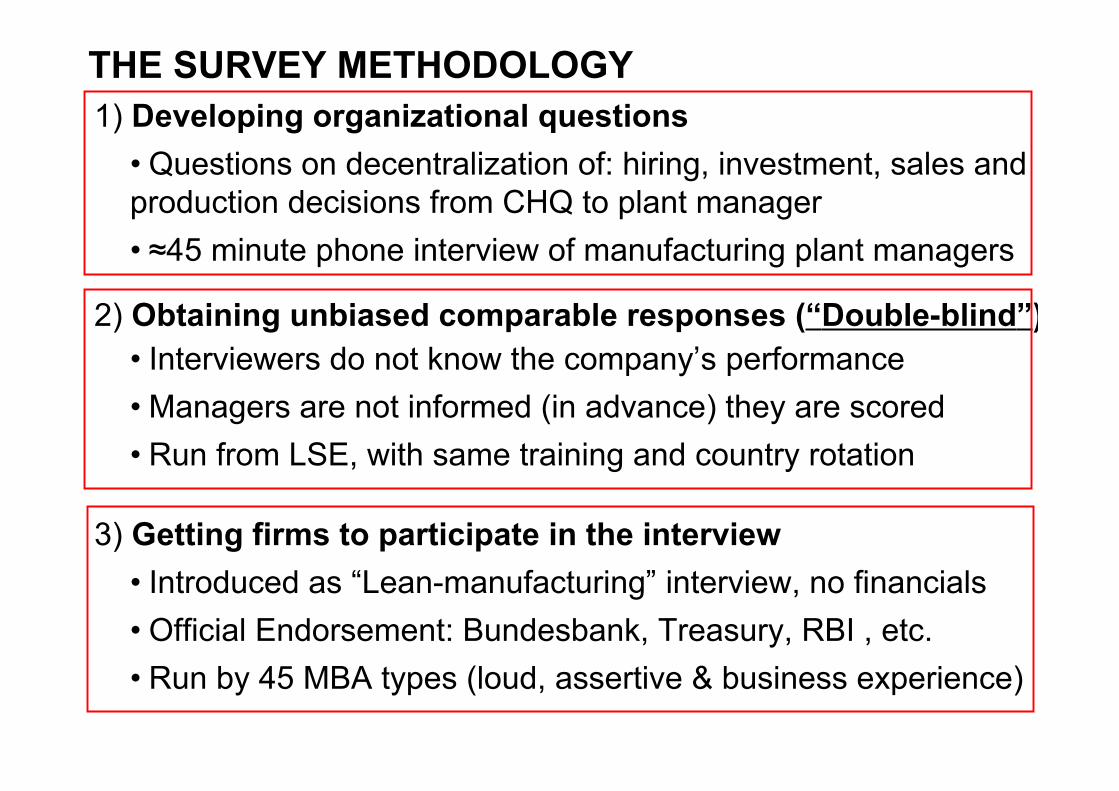
1) Developing organizational questions• Questions on decentralization of: hiring, investment, sales andproduction decisions from CHQ to plant manager• ≈45 minute phone interview of manufacturing plant managers
2) Obtaining unbiased comparable responses (“Double-blind”)• Interviewers do not know the company’s performance• Managers are not informed (in advance) they are scored• Run from LSE, with same training and country rotation
3) Getting firms to participate in the interview• Introduced as “Lean-manufacturing” interview, no financials• Official Endorsement: Bundesbank, Treasury, RBI , etc.• Run by 45 MBA types (loud, assertive & business experience)
THE SURVEY METHODOLOGY
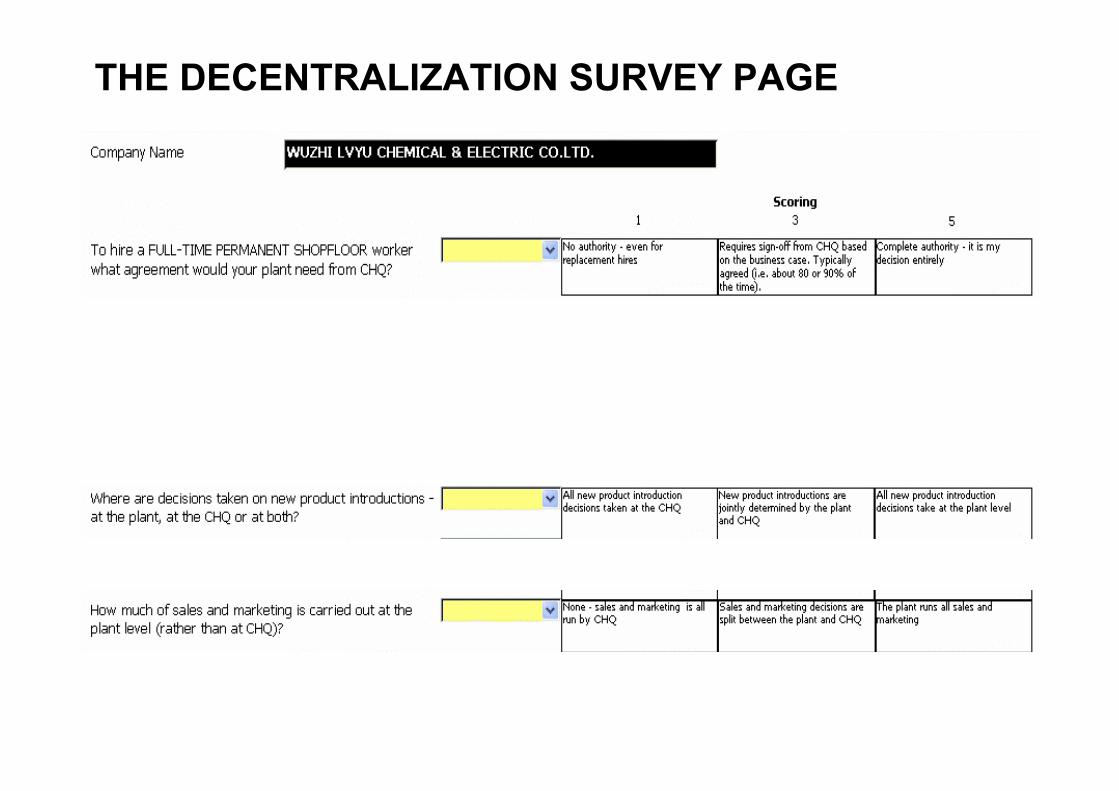
THE DECENTRALIZATION SURVEY PAGE
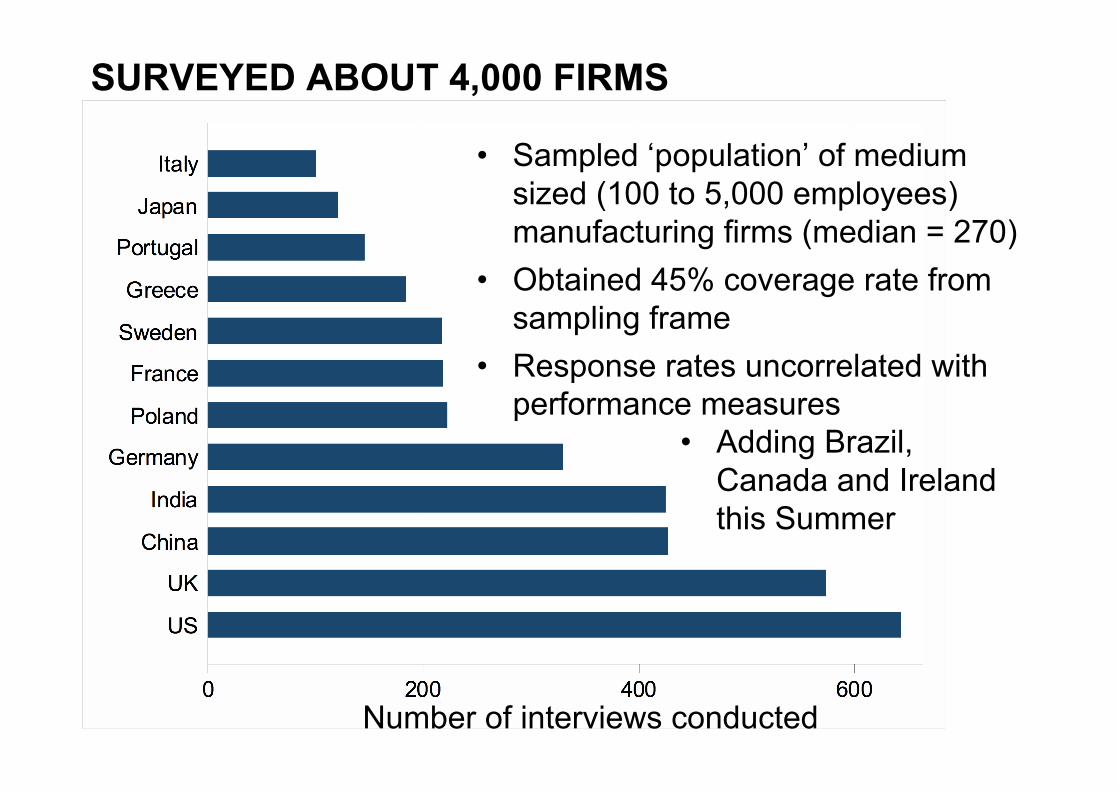
Number of interviews conducted
• Sampled ‘population’ of mediumsized (100 to 5,000 employees)manufacturing firms (median = 270)
• Obtained 45% coverage rate fromsampling frame
• Response rates uncorrelated withperformance measures
SURVEYED ABOUT 4,000 FIRMS
• Adding Brazil,Canada and Irelandthis Summer

MBA Call Centre Video
ALSO COLLECTED HR & “NOISE CONTROL” DATA
• Firm demographics, ownership, skills (% college) and otherbackground characteristics
• Recorded a series of “Noise controls” to reduce potentialsurvey bias:
– Interview: Duration, time of day and day of week– Interviewer: Full set of interviewer fixed effects– Interviewee: Gender, tenure in firm, tenure in post and
seniority
• Data Collection Methodology
• Exploring the raw data
• Interpreting the data
• Quantification
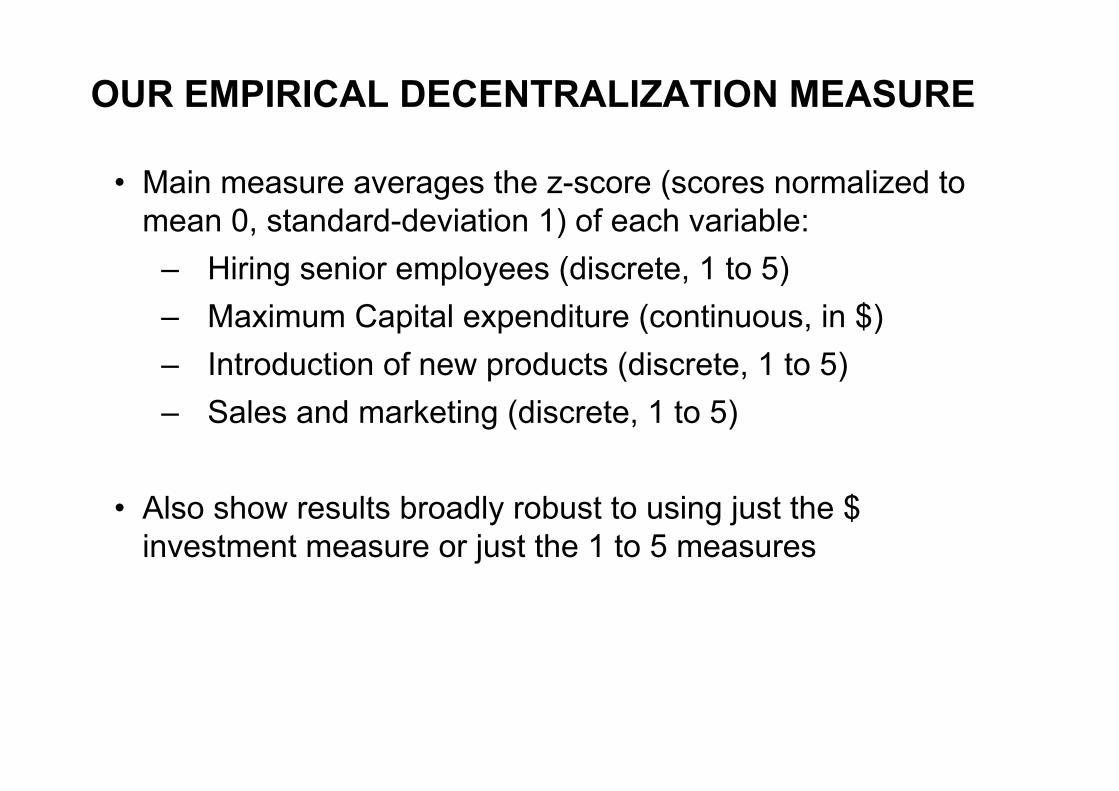
• Main measure averages the z-score (scores normalized tomean 0, standard-deviation 1) of each variable:
– Hiring senior employees (discrete, 1 to 5)– Maximum Capital expenditure (continuous, in $)– Introduction of new products (discrete, 1 to 5)– Sales and marketing (discrete, 1 to 5)
• Also show results broadly robust to using just the $investment measure or just the 1 to 5 measures
OUR EMPIRICAL DECENTRALIZATION MEASURE
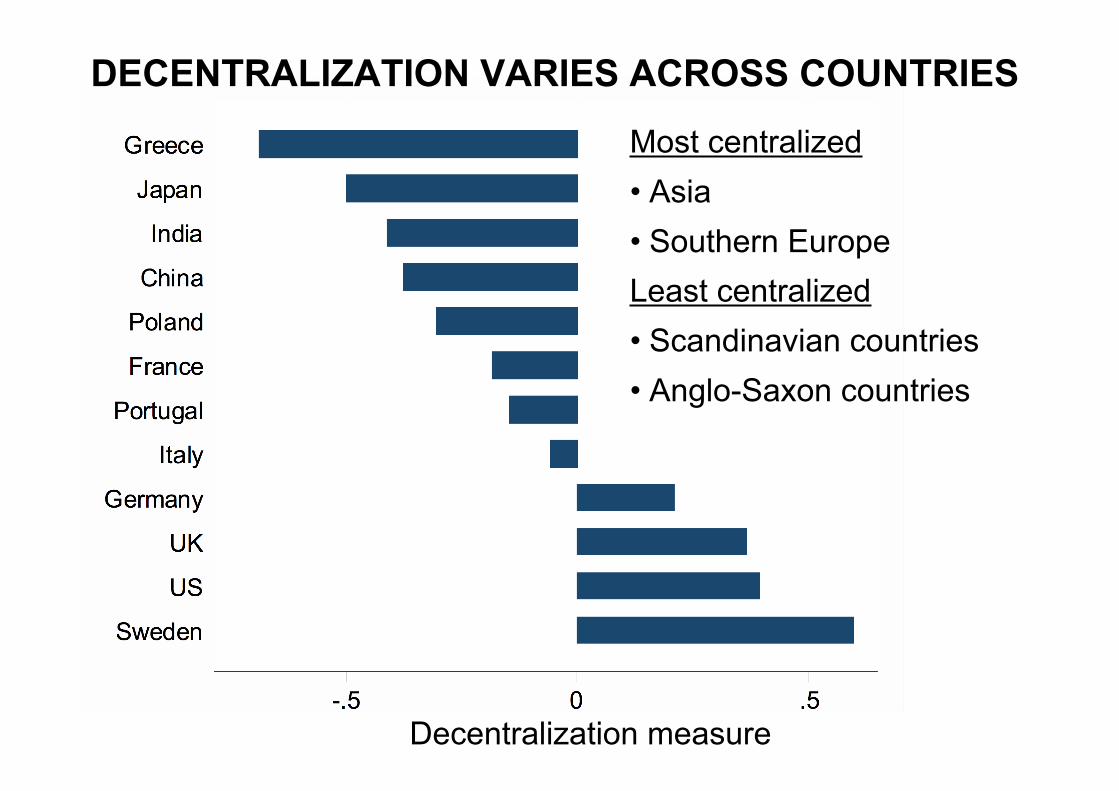
DECENTRALIZATION VARIES ACROSS COUNTRIES
Most centralized• Asia• Southern EuropeLeast centralized• Scandinavian countries• Anglo-Saxon countries
Decentralization measure
EXTERNAL VALIDATION (1)
• Do these cross-country values look sensible?
• Only prior firm decentralization measure to cross-check againstwe are aware of is from Hofstede (1980)
– Surveyed c.100,000 IBM employees across 50 countriesduring the 1970s & 1980s
– Questions on management style (autocractic/paternalisticor consultative) and preferences for delegation
– Combined into Power Distance index (1-100), low meanslimited (preference for) delegation
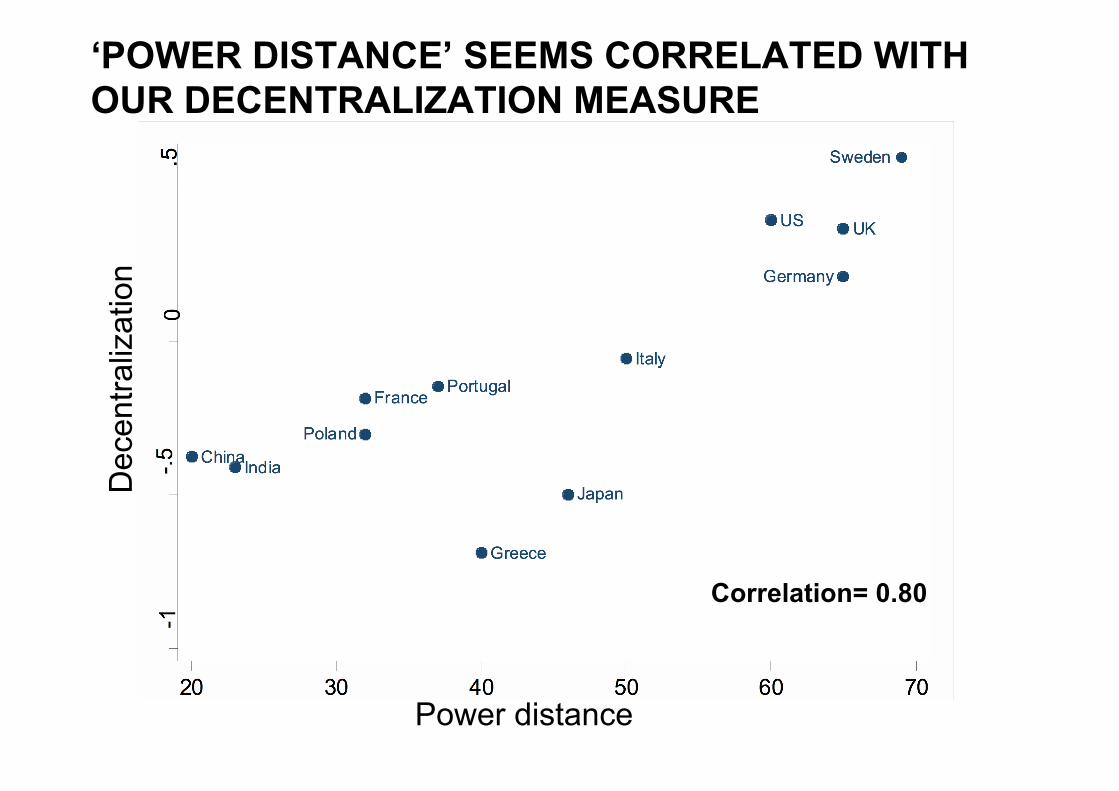
‘POWER DISTANCE’ SEEMS CORRELATED WITHOUR DECENTRALIZATION MEASURE
Dec
entra
lizat
ion
Power distance
Correlation= 0.80
EXTERNAL VALIDATION (2)
• There is also a cross-country index of Fiscal Decentralizationfrom Arzaghi and Henderson (2005, JPubE)
• Index of Fiscal Decentralization based on 9 factors including:• Government structure (e.g. unitary v federal)• Local (regional/municipal) democratization & autonomy• Local (regional/municipal) control over taxation and
spending (education, police, transport etc.)
• Surveyed every country with >10 million people (in 1995)
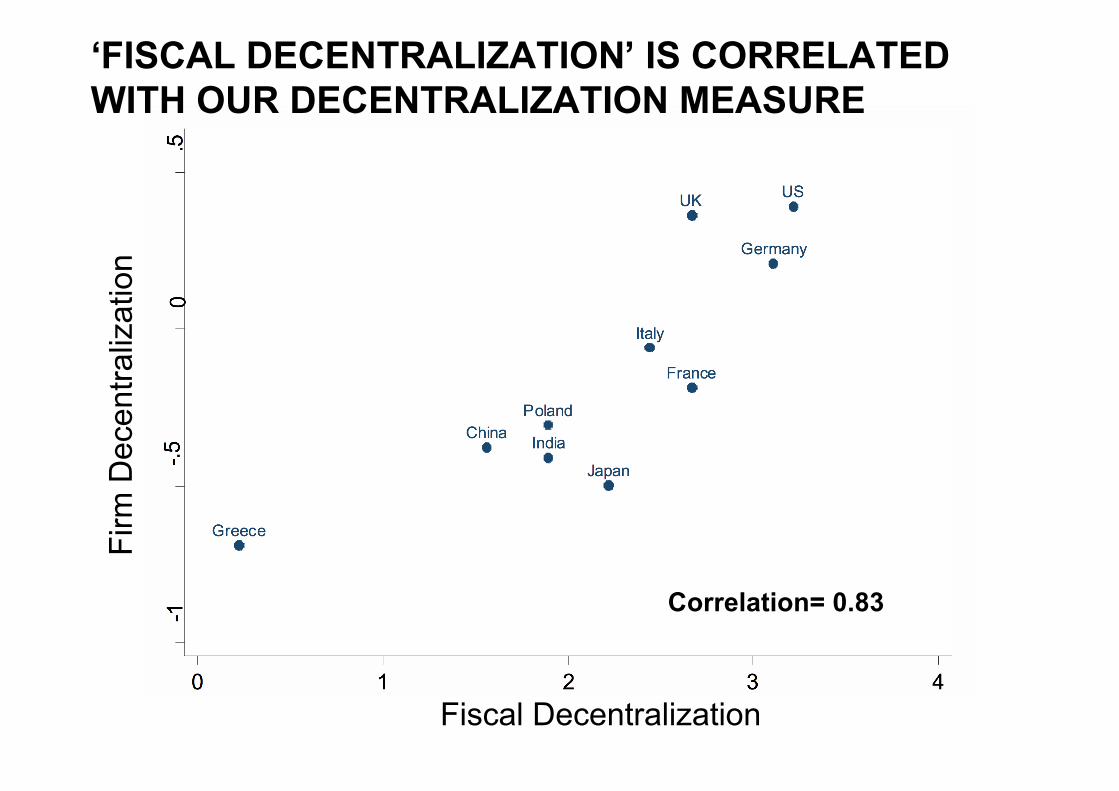
‘FISCAL DECENTRALIZATION’ IS CORRELATEDWITH OUR DECENTRALIZATION MEASURE
Firm
Dec
entra
lizat
ion
Fiscal Decentralization
Correlation= 0.83
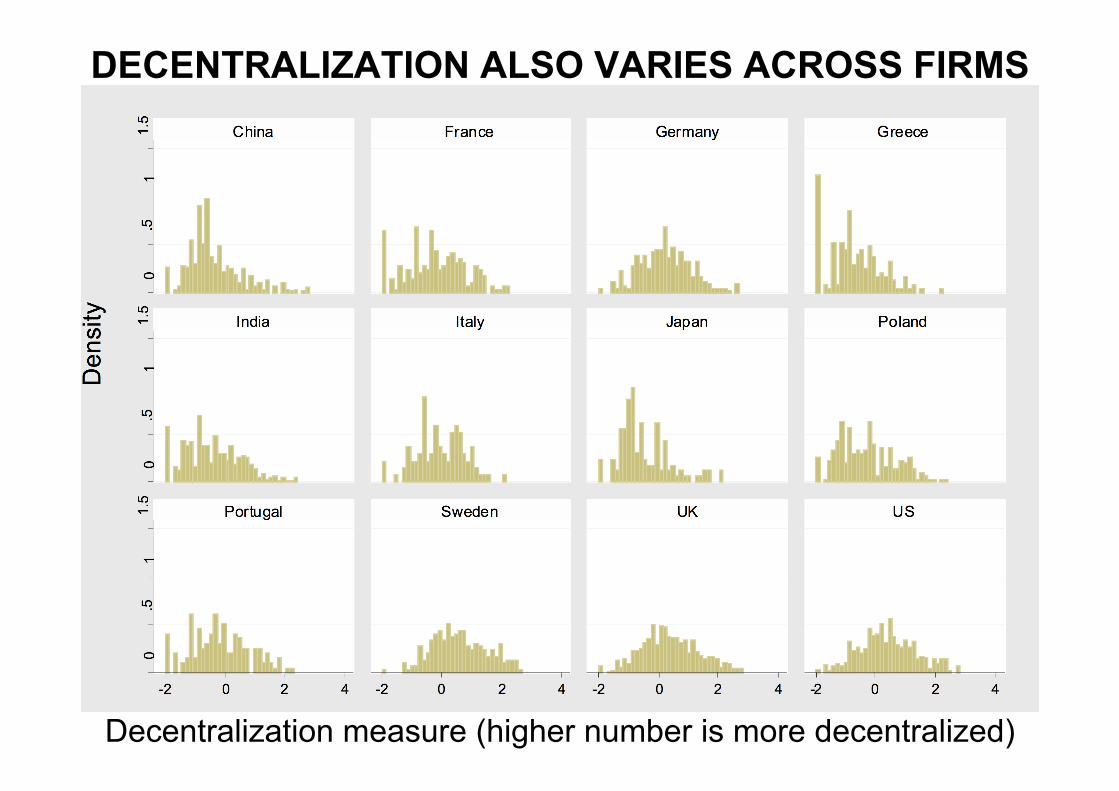
DECENTRALIZATION ALSO VARIES ACROSS FIRMS
Decentralization measure (higher number is more decentralized)
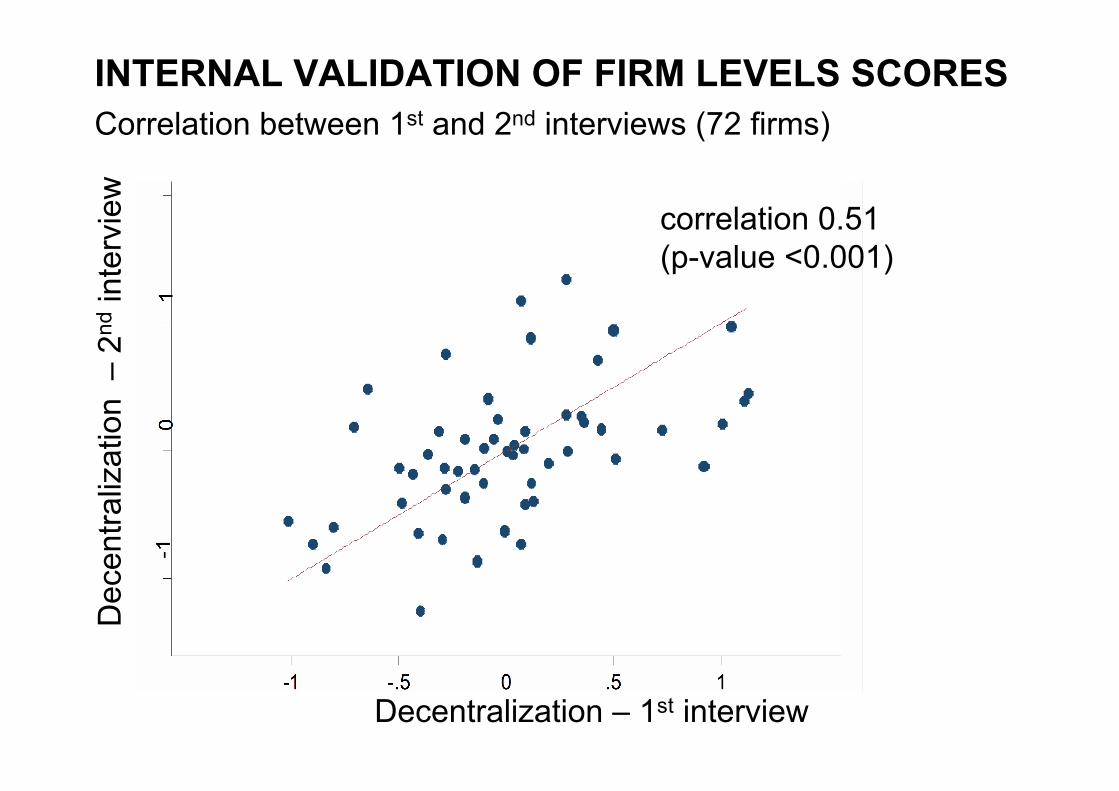
Correlation between 1st and 2nd interviews (72 firms)INTERNAL VALIDATION OF FIRM LEVELS SCORES
correlation 0.51(p-value <0.001)
Decentralization – 1st interview
Dec
entra
lizat
ion
– 2
nd in
terv
iew
• Data Collection Methodology
• Exploring the raw data
• Interpreting the data
• Quantification
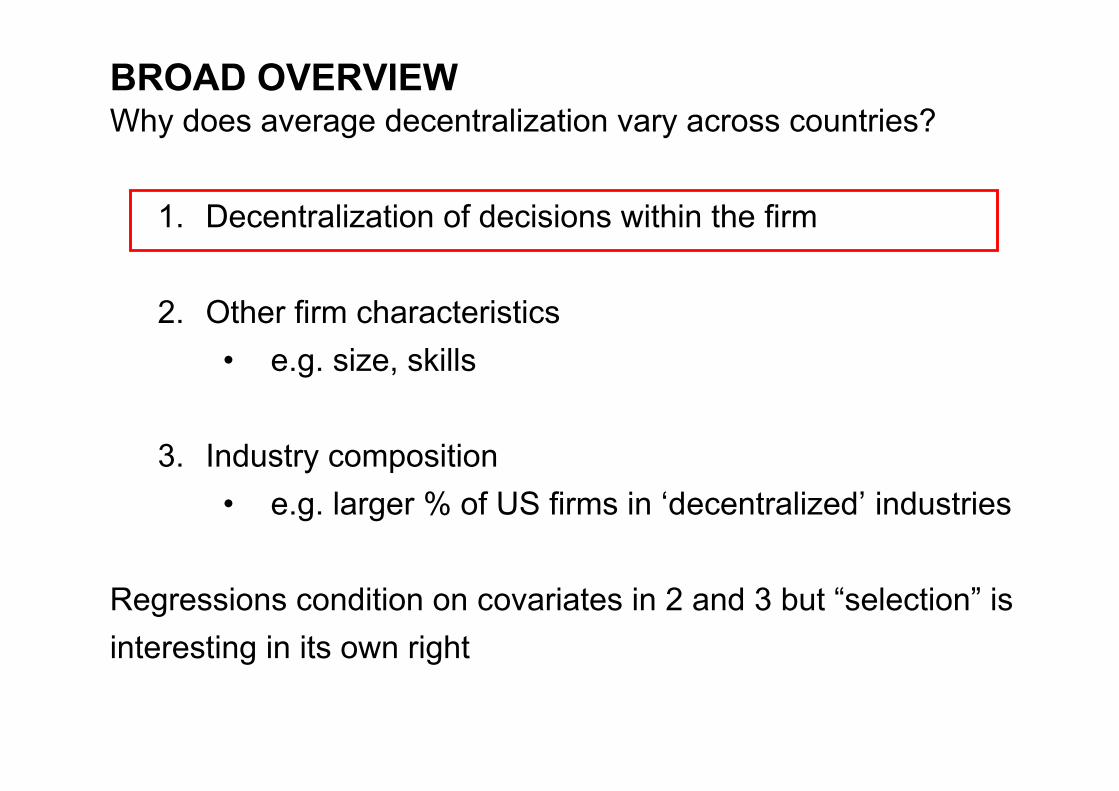
BROAD OVERVIEWWhy does average decentralization vary across countries?
1. Decentralization of decisions within the firm
2. Other firm characteristics• e.g. size, skills
3. Industry composition• e.g. larger % of US firms in ‘decentralized’ industries
Regressions condition on covariates in 2 and 3 but “selection” isinteresting in its own right
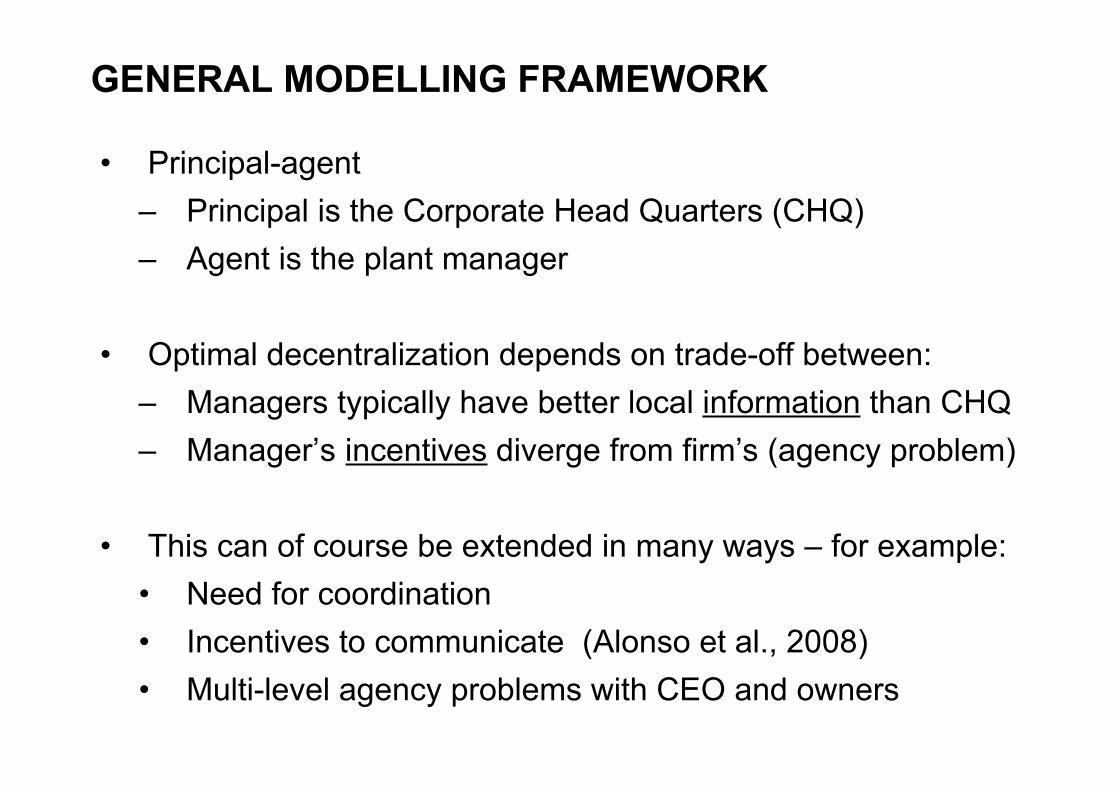
GENERAL MODELLING FRAMEWORK
• Principal-agent– Principal is the Corporate Head Quarters (CHQ)– Agent is the plant manager
• Optimal decentralization depends on trade-off between:– Managers typically have better local information than CHQ– Manager’s incentives diverge from firm’s (agency problem)
• This can of course be extended in many ways – for example:• Need for coordination• Incentives to communicate (Alonso et al., 2008)• Multi-level agency problems with CEO and owners
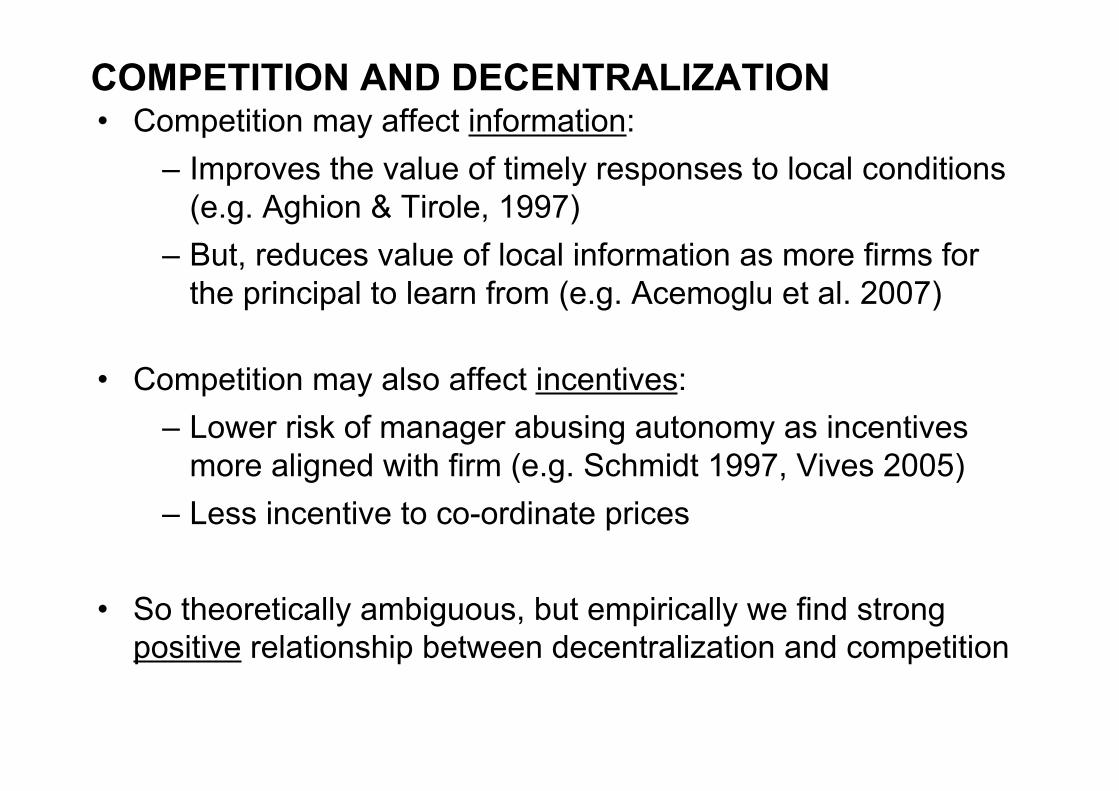
COMPETITION AND DECENTRALIZATION• Competition may affect information:
– Improves the value of timely responses to local conditions(e.g. Aghion & Tirole, 1997)
– But, reduces value of local information as more firms forthe principal to learn from (e.g. Acemoglu et al. 2007)
• Competition may also affect incentives:– Lower risk of manager abusing autonomy as incentives
more aligned with firm (e.g. Schmidt 1997, Vives 2005)– Less incentive to co-ordinate prices
• So theoretically ambiguous, but empirically we find strongpositive relationship between decentralization and competition
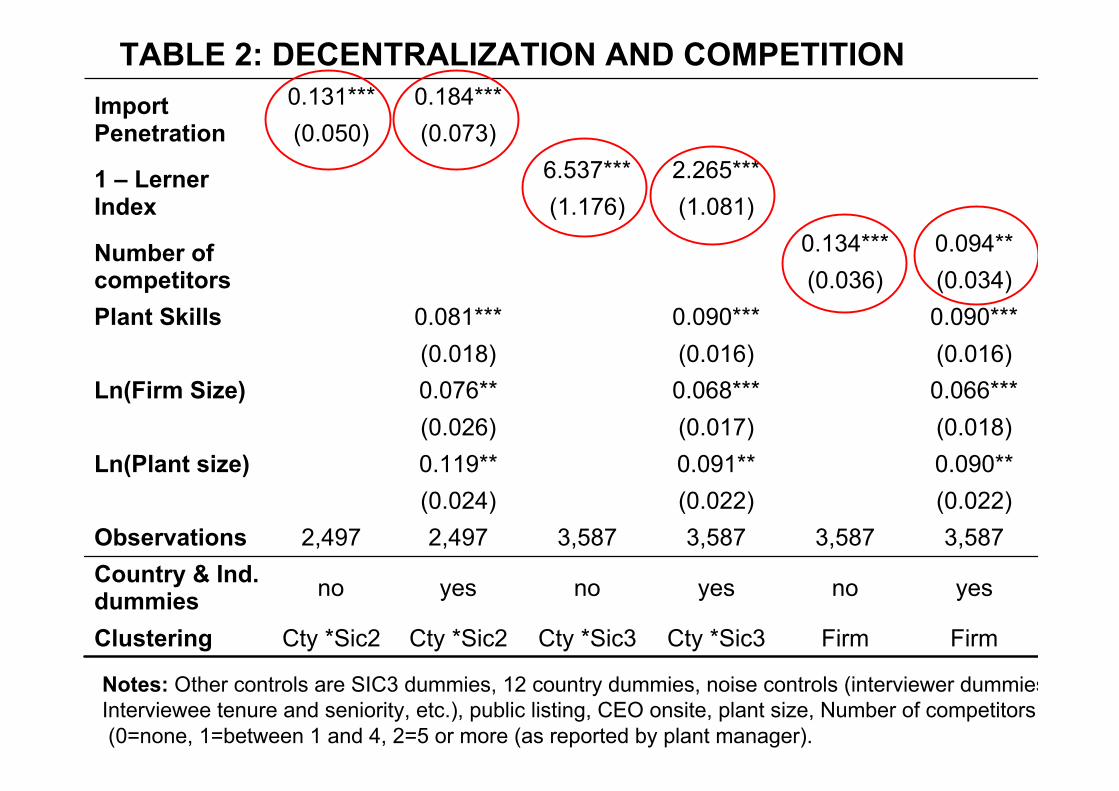
2.265***6.537***1 – LernerIndex (1.081)(1.176)
0.094**0.134***Number ofcompetitors (0.034)(0.036)
FirmFirmCty *Sic3Cty *Sic3Cty *Sic2Cty *Sic2Clustering
yesnoyesnoyesnoCountry & Ind.dummies
3,5873,5873,5873,5872,4972,497Observations(0.022)(0.022)(0.024)0.090**0.091**0.119**Ln(Plant size)(0.018)(0.017)(0.026)0.066***0.068***0.076**Ln(Firm Size)(0.016)(0.016)(0.018)0.090***0.090***0.081***Plant Skills
(0.073)(0.050)0.184***0.131***Import
Penetration
TABLE 2: DECENTRALIZATION AND COMPETITION
Notes: Other controls are SIC3 dummies, 12 country dummies, noise controls (interviewer dummiesInterviewee tenure and seniority, etc.), public listing, CEO onsite, plant size, Number of competitors (0=none, 1=between 1 and 4, 2=5 or more (as reported by plant manager).
TRUST AND DECENTRALIZATION
• Trust may also affect optimal decentralization– Facilitate cooperative solutions in repeated game
settings: e.g. Kreps et al. (1982) and Baker, Gibbons andMurphy (1999)
– Proxy the congruence of incentives: e.g. Aghion andTirole (1997)
• We find evidence of robust positive relationship between trustin region where plant is located and decentralization
• Measure trust using the World Value Survey, from the question: “Generally speaking, would you say that most people canbe trusted or that you can’t be too careful in dealing withpeople?”
Trust by region of the country defined as % of people answering “yes” to first part of the trust question
• Experimental studies show this question linked with trust/trustingbehavior (Glaeser et al, 2000, Sapienza et al, 2007)
• Used in prior social capital literature: e.g. Knack & Keefer(1997); Guiso, Sapienza, Zingales (2004);
MEASUREMENT AND IDENTIFICATION
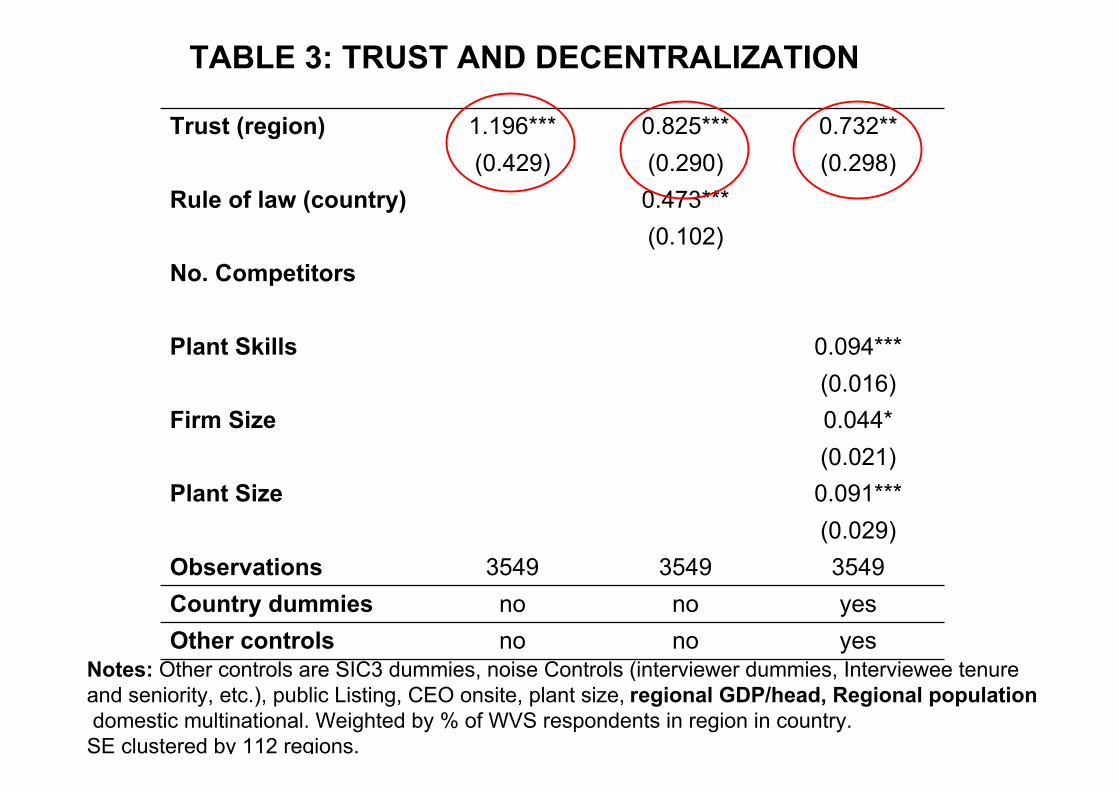
yesnonoCountry dummiesyesnonoOther controls
354935493549Observations(0.029)0.091***Plant Size(0.021)0.044*Firm Size(0.016)0.094***Plant Skills
No. Competitors(0.102)0.473***Rule of law (country)
(0.298)(0.290)(0.429)0.732**0.825***1.196***Trust (region)
TABLE 3: TRUST AND DECENTRALIZATION
Notes: Other controls are SIC3 dummies, noise Controls (interviewer dummies, Interviewee tenure and seniority, etc.), public Listing, CEO onsite, plant size, regional GDP/head, Regional population, domestic multinational. Weighted by % of WVS respondents in region in country.SE clustered by 112 regions.
USE MULTINATIONALS AS A SECOND TEST FORIMPORTANCE OF TRUST
• Could worry about bias due to trust proxying for othercountry/regional variables
• So look at affiliates of foreign multinationals and investigatewhether trust in their home country also matters
• Find that characteristics in both region of location andcountry of origin matter
• Parallels literature showing individuals behavior based onorigin and location: e.g. Ichino & Maggi (2000), Fernandez &Fogli (2007) and Fisman & Miguel (2008)
Central HQ(New York Site)
Example A: Domestic Firm2 Sites, Single Plant
Plant(Phoenix Site)
D, Decentralization
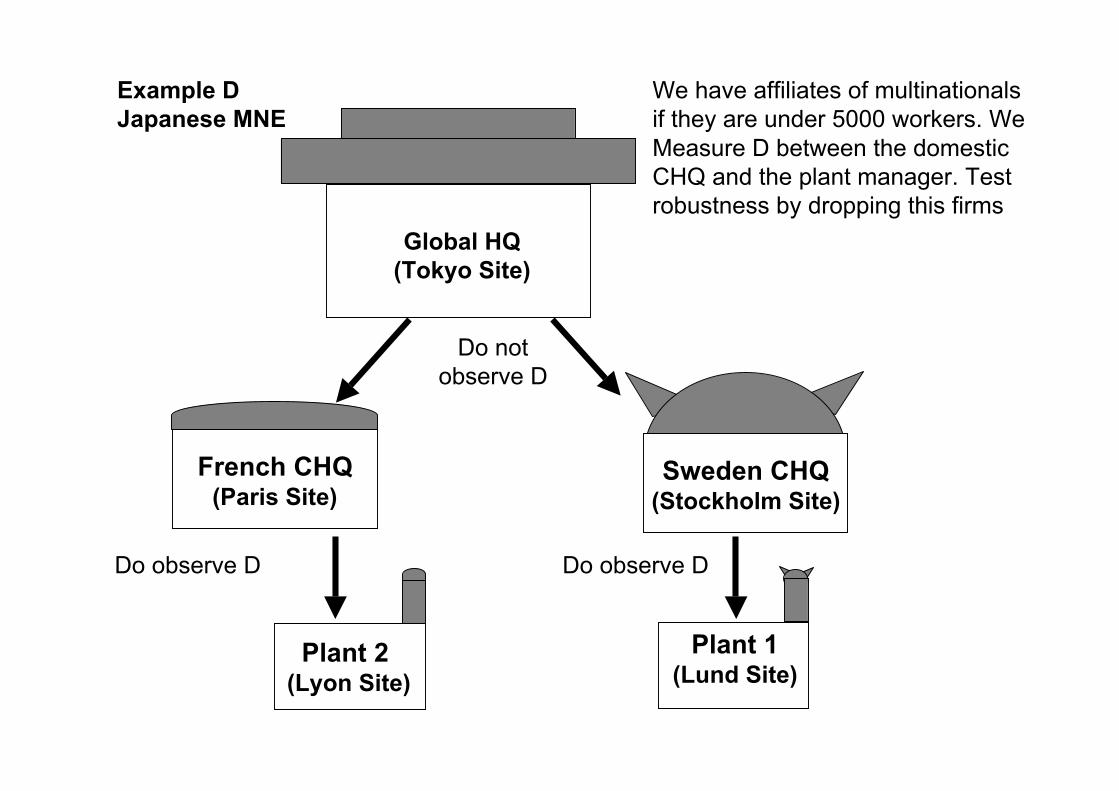
Plant 1(Lund Site)
Global HQ(Tokyo Site)
French CHQ(Paris Site)
Example DJapanese MNE
Sweden CHQ(Stockholm Site)
Plant 2 (Lyon Site)
Do notobserve D
Do observe D Do observe D
We have affiliates of multinationalsif they are under 5000 workers. WeMeasure D between the domesticCHQ and the plant manager. Testrobustness by dropping this firms
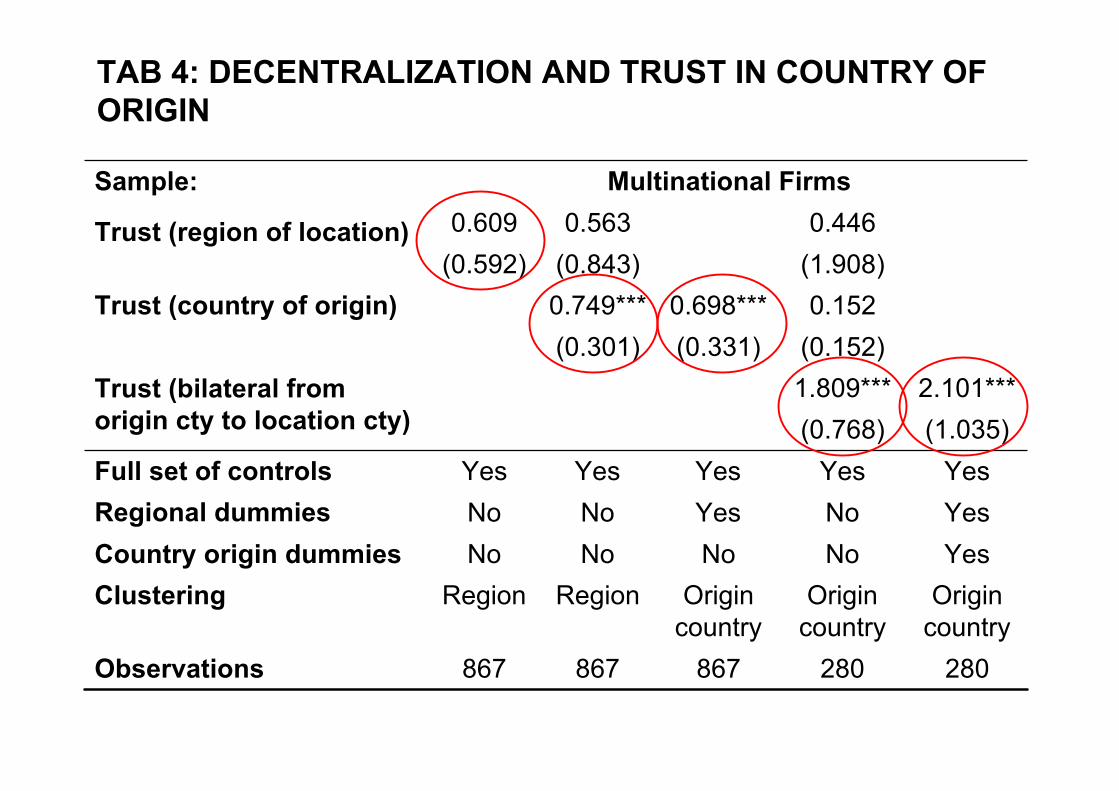
YesNoNoNoNoCountry origin dummies
Multinational FirmsSample:
Origincountry
Origincountry
Origincountry
RegionRegionClustering
(0.152)(0.331)(0.301)0.1520.698***0.749***Trust (country of origin)
280
NoYes
(0.768)1.809***
(1.908)0.446
280867867867Observations
YesYesNoNoRegional dummiesYesYesYesYesFull set of controls
(1.035)2.101***Trust (bilateral from
origin cty to location cty)
(0.843)(0.592)0.5630.609Trust (region of location)
TAB 4: DECENTRALIZATION AND TRUST IN COUNTRY OFORIGIN
DECENTRALIZATION AND RELIGION• Religion may affect decentralization via trust
– Putnam (1993), La Porta at al (1997), Guiso et al. (2004)argue that hierarchical religions may inhibit formation ofhorizontal bonds between people, lowering trust
• But religion could still play an independent role, as it couldreflect preferences for autonomy:
– Proxy for regional variations in preference forautonomy
– Cause regional variations in preferences for autonomy(e.g. Guiso, Sapienza, Zingales, 2003, on Vatican II)
DECENTRALIZATION AND RELIGION
• Measure religion using World Values Survey
• Follow La Porta et al. (1997) in defining a “Hierarchical religion”variable which is % people in the region that are Catholic,Orthodox or Muslim
• Acceptable restriction from more general model
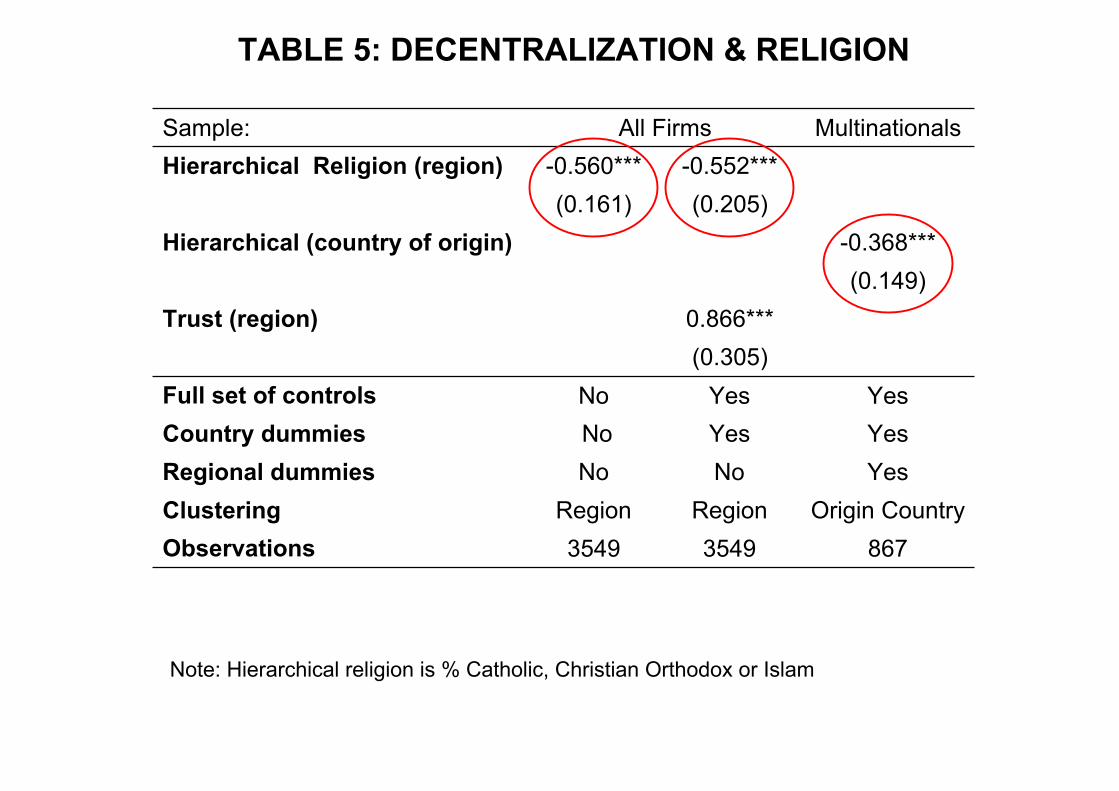
TABLE 5: DECENTRALIZATION & RELIGION
MultinationalsAll FirmsSample:
(0.149)-0.368***Hierarchical (country of origin)
YesYes NoCountry dummies
86735493549ObservationsOrigin CountryRegionRegionClustering
YesNoNoRegional dummies
YesYesNoFull set of controls(0.305)0.866***Trust (region)
(0.205)(0.161)-0.552***-0.560***Hierarchical Religion (region)
Note: Hierarchical religion is % Catholic, Christian Orthodox or Islam
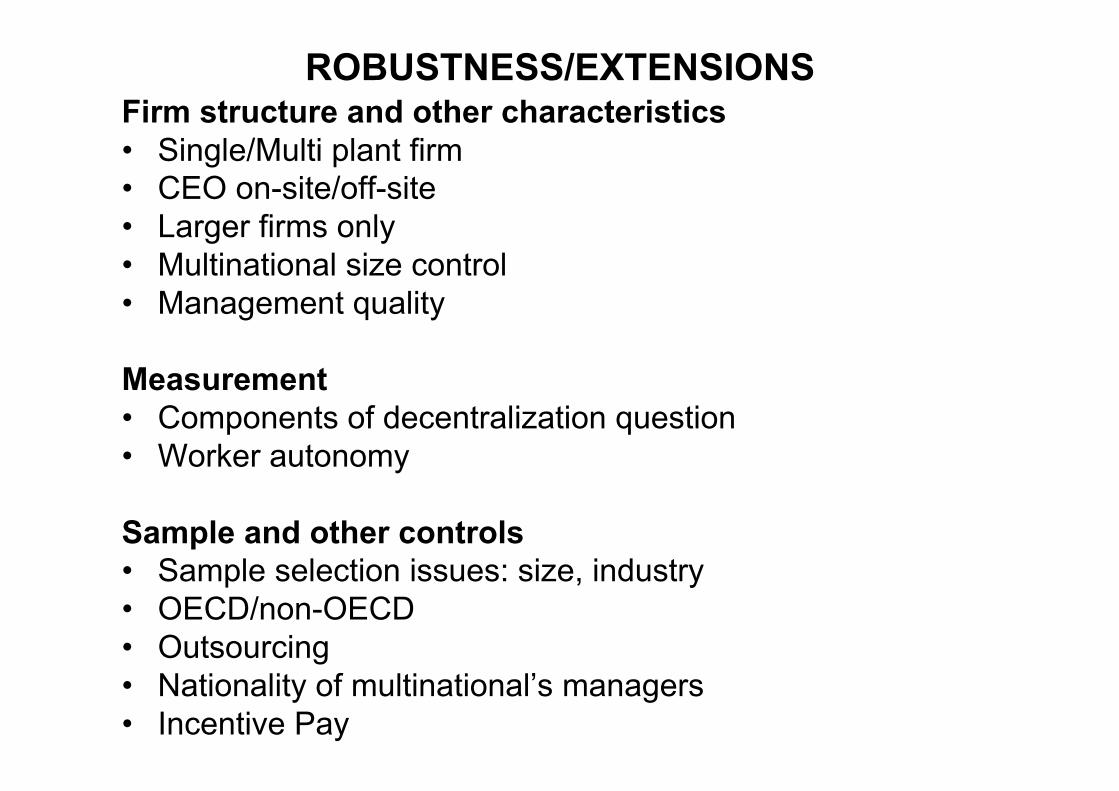
ROBUSTNESS/EXTENSIONSFirm structure and other characteristics• Single/Multi plant firm• CEO on-site/off-site• Larger firms only• Multinational size control• Management quality
Measurement• Components of decentralization question• Worker autonomy
Sample and other controls• Sample selection issues: size, industry• OECD/non-OECD• Outsourcing• Nationality of multinational’s managers• Incentive Pay
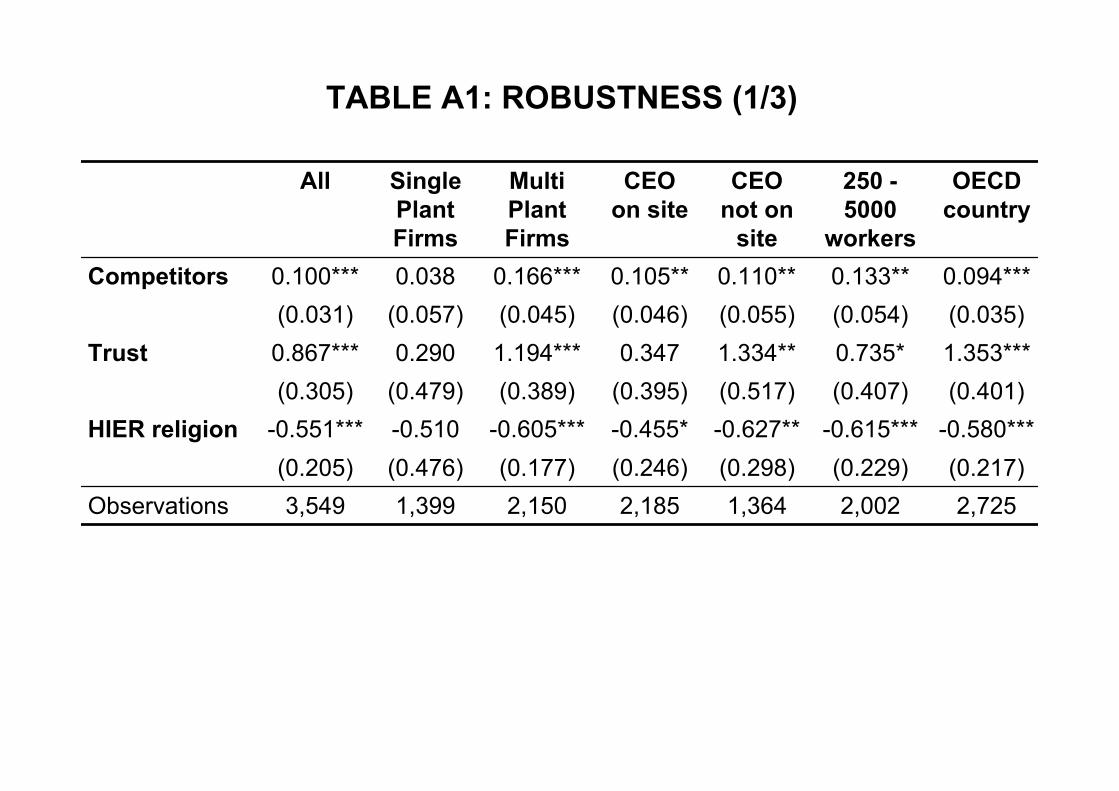
2,7252,0021,3642,1852,1501,3993,549Observations(0.217)(0.229)(0.298)(0.246)(0.177)(0.476)(0.205)
-0.580***-0.615***-0.627**-0.455*-0.605***-0.510-0.551***HIER religion(0.401)(0.407)(0.517)(0.395)(0.389)(0.479)(0.305)1.353***0.735*1.334**0.3471.194***0.2900.867***Trust(0.035)(0.054)(0.055)(0.046)(0.045)(0.057)(0.031)0.094***0.133**0.110**0.105**0.166***0.0380.100***Competitors
OECDcountry
250 -5000
workers
CEOnot on
site
CEOon site
MultiPlantFirms
SinglePlantFirms
All
TABLE A1: ROBUSTNESS (1/3)
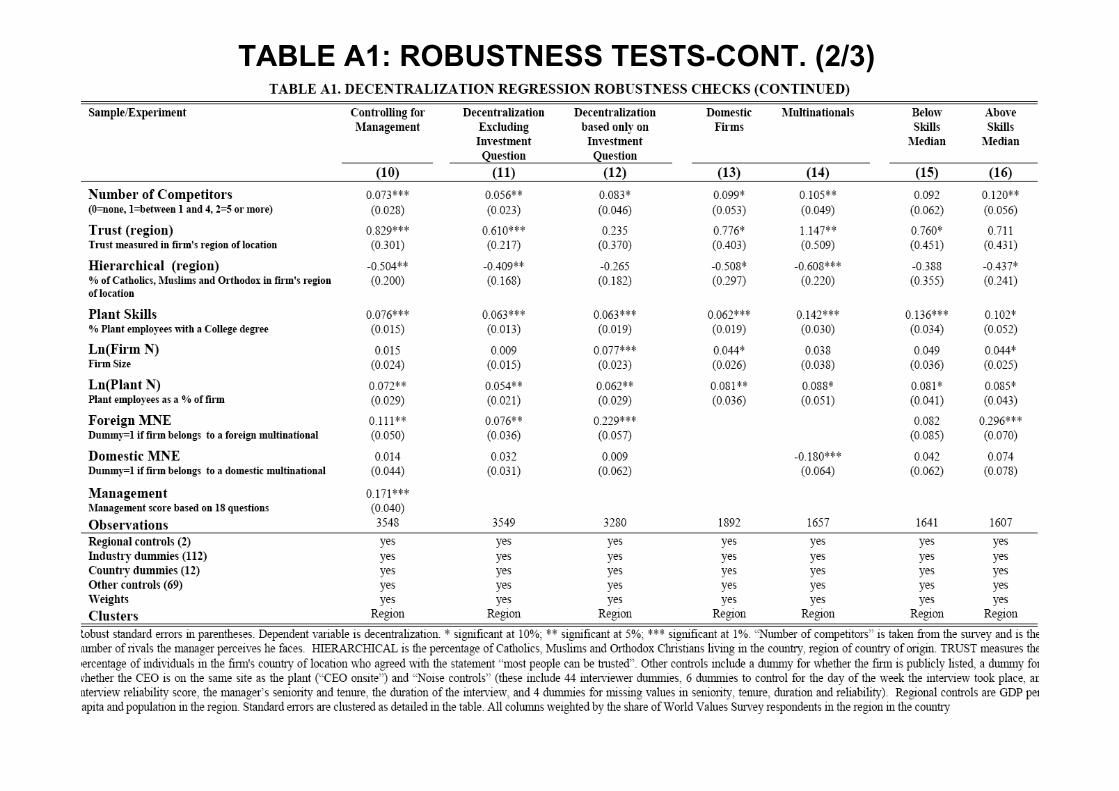
TABLE A1: ROBUSTNESS TESTS-CONT. (2/3)
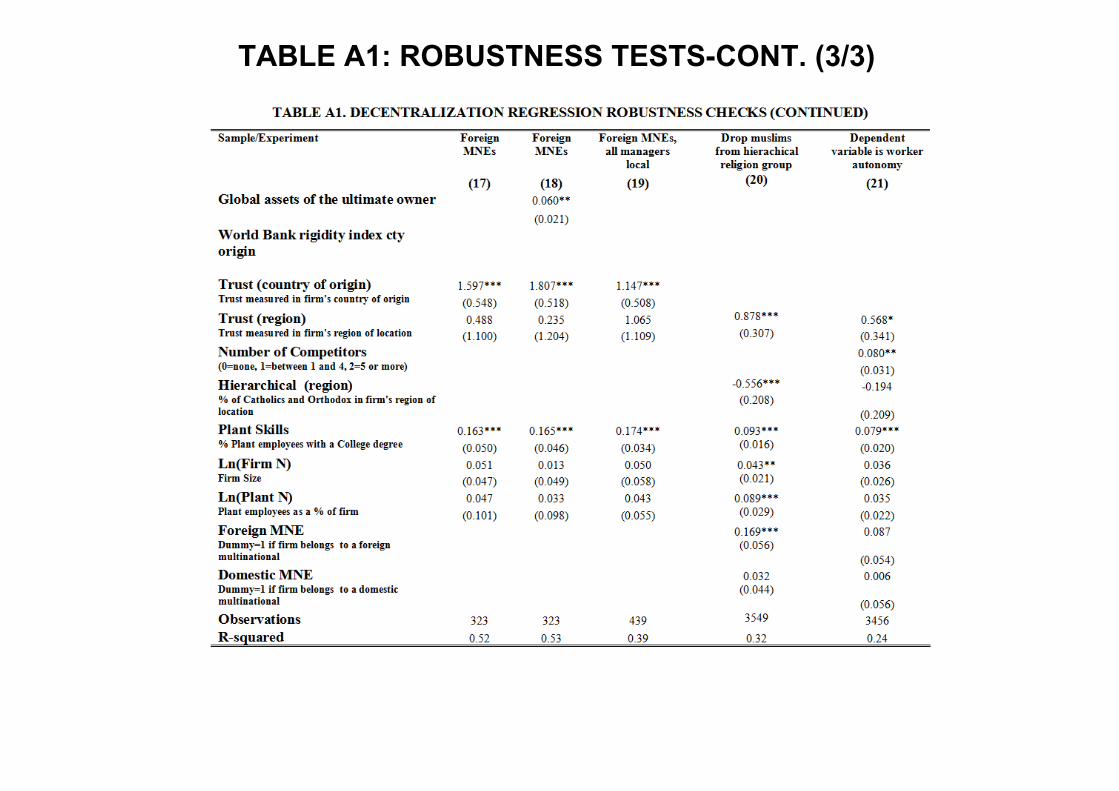
TABLE A1: ROBUSTNESS TESTS-CONT. (3/3)
• Data Collection Methodology
• Exploring the raw data
• Interpreting the data
• Quantification
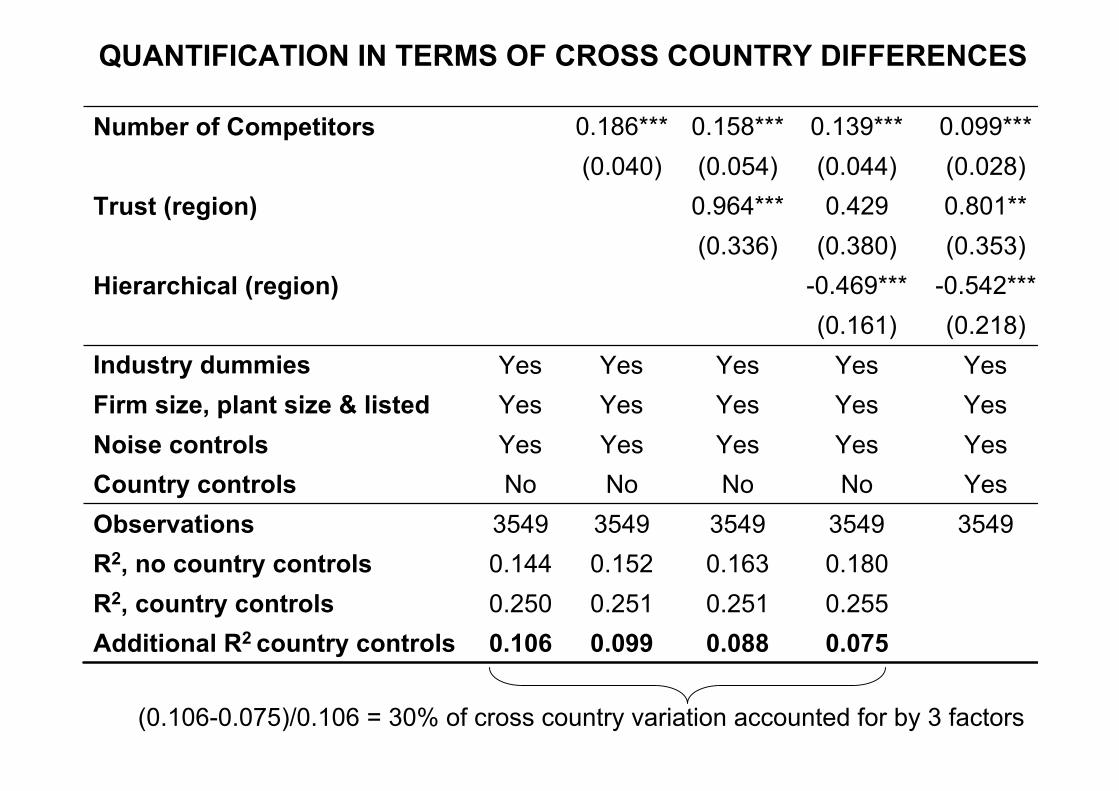
QUANTIFICATION IN TERMS OF CROSS COUNTRY DIFFERENCES
(0.106-0.075)/0.106 = 30% of cross country variation accounted for by 3 factors
(0.028)(0.044)(0.054)(0.040)0.099***0.139***0.158***0.186***Number of Competitors
YesNoNoNoNoCountry controls35493549354935493549Observations
0.1800.1630.1520.144R2, no country controls0.2550.2510.2510.250R2, country controls0.0750.0880.0990.106Additional R2 country controls
YesYesYesYesYesNoise controls
(0.353)(0.380)(0.336)0.801**0.4290.964***Trust (region)
YesYes
(0.161)-0.469***
YesYesYesYesFirm size, plant size & listedYesYesYesYesIndustry dummies
(0.218)-0.542***Hierarchical (region)
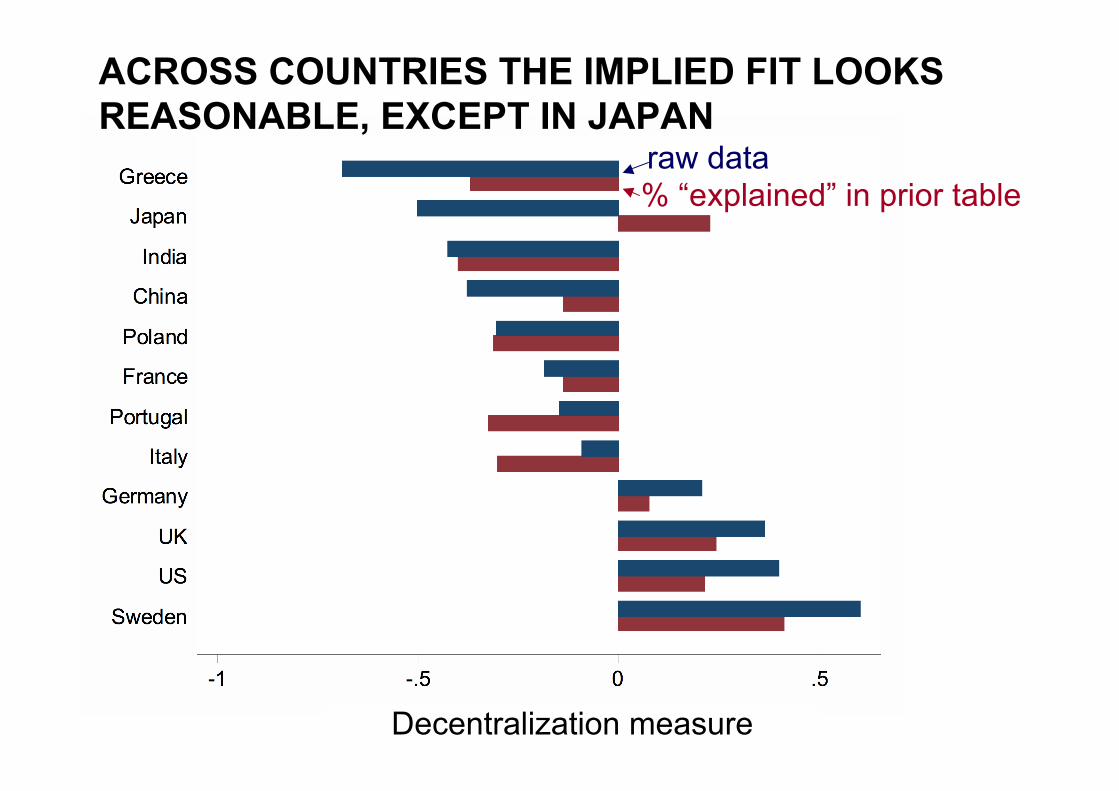
ACROSS COUNTRIES THE IMPLIED FIT LOOKSREASONABLE, EXCEPT IN JAPAN
Decentralization measure
raw data% “explained” in prior table
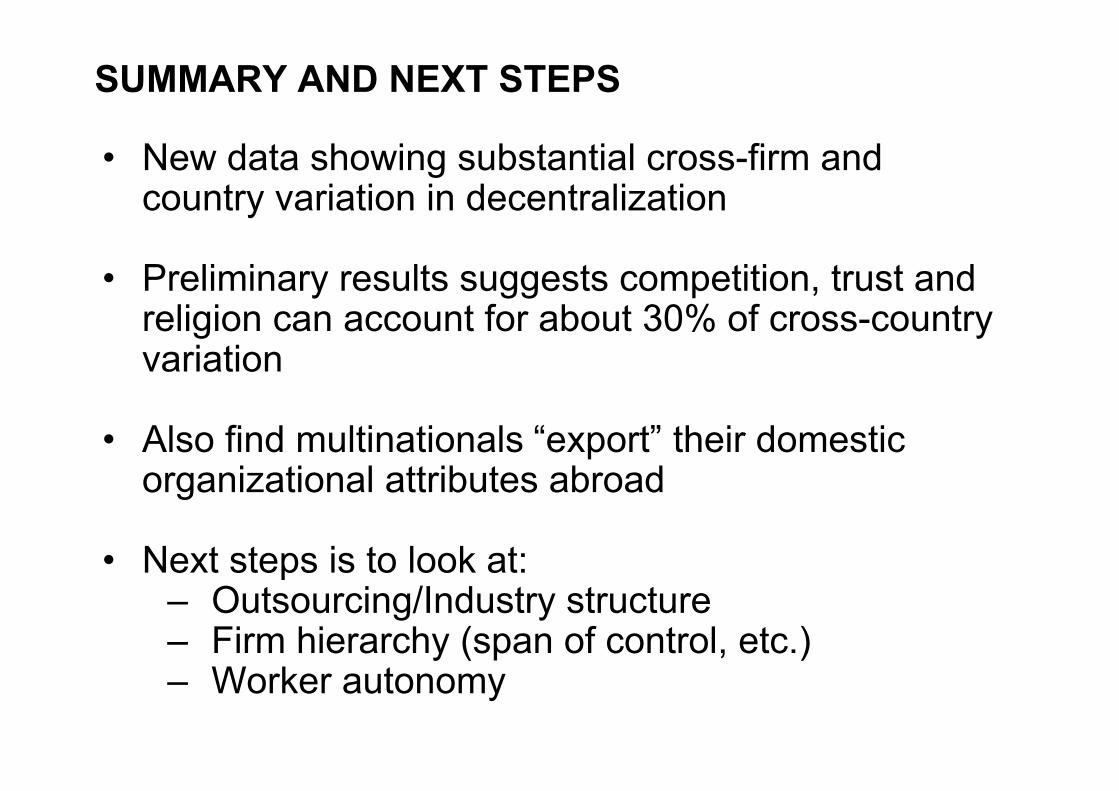
SUMMARY AND NEXT STEPS
• New data showing substantial cross-firm andcountry variation in decentralization
• Preliminary results suggests competition, trust andreligion can account for about 30% of cross-countryvariation
• Also find multinationals “export” their domesticorganizational attributes abroad
• Next steps is to look at:– Outsourcing/Industry structure– Firm hierarchy (span of control, etc.)– Worker autonomy

Quotes & Back-up

MY FAVOURITE QUOTES:
[Male manager speaking to an Australian female interviewer]
Production Manager: “Your accent is really cute and I love theway you talk. Do you fancy meeting up near the factory?”
Interviewer “Sorry, but I’m washing my hair every night for thenext month….”
The British Chat-Up
Production Manager: “Are you a Brahmin?’
Interviewer “Yes, why do you ask?”
Production manager “And are you married?”
Interviewer “No?”
Production manager “Excellent, excellent, my son is lookingfor a bride and I think you could be perfect. I must contactyour parents to discuss this”
The Indian Chat-Up
MY FAVOURITE QUOTES:
MY FAVOURITE QUOTES:
Production Manager: “I spend most of my time walkingaround cuddling and encouraging people - my staff tell methat I give great hugs”
Staff retention the American way
Production Manager: “We’re owned by the Mafia”Interviewer: “I think that’s the “Other” category……..although Iguess I could put you down as an “Italian multinational” ?”
The difficulties of coding ownership in Europe
MY FAVOURITE QUOTES:
The bizarre
Interviewer: “[long silence]……hello, hello….are you stillthere….hello”
Production Manager: “…….I’m sorry, I just got distracted bya submarine surfacing in front of my window”
The unbelievable
[Male manager speaking to a female interviewer]Production Manager: “I would like you to call me “Daddy” whenwe talk”[End of interview…]
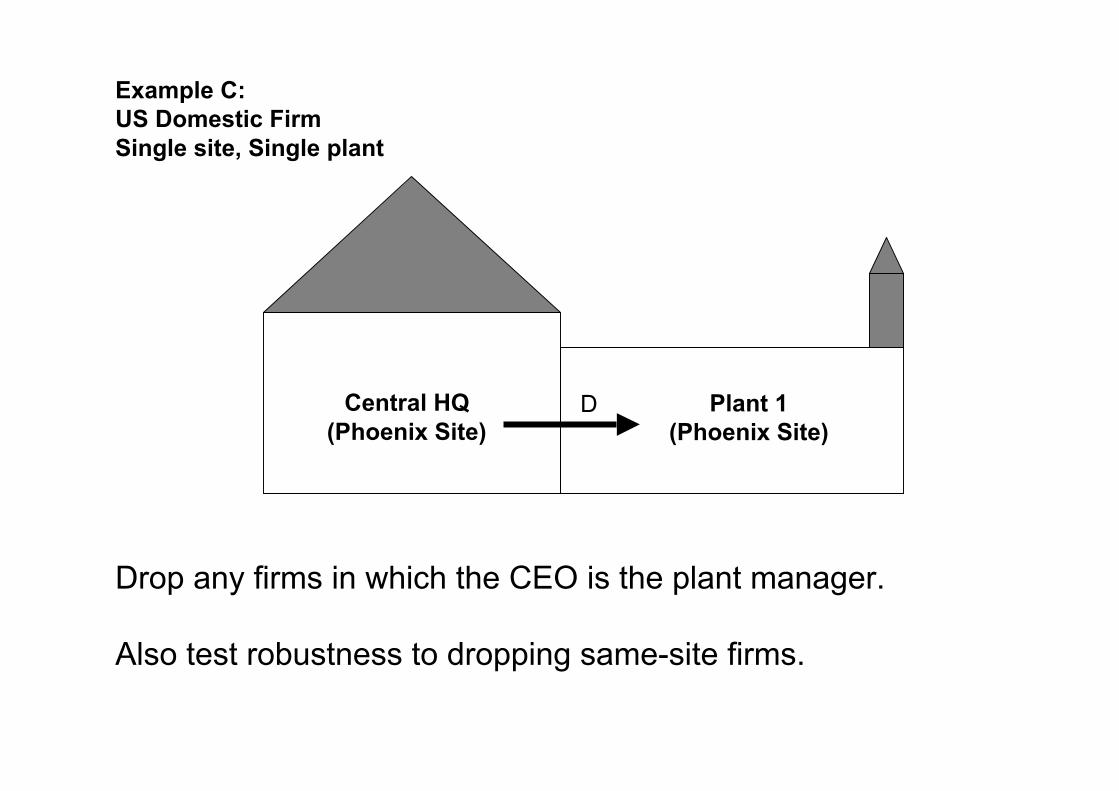
Example C:US Domestic FirmSingle site, Single plant
Central HQ(Phoenix Site)
Plant 1(Phoenix Site)
D
Drop any firms in which the CEO is the plant manager.
Also test robustness to dropping same-site firms.
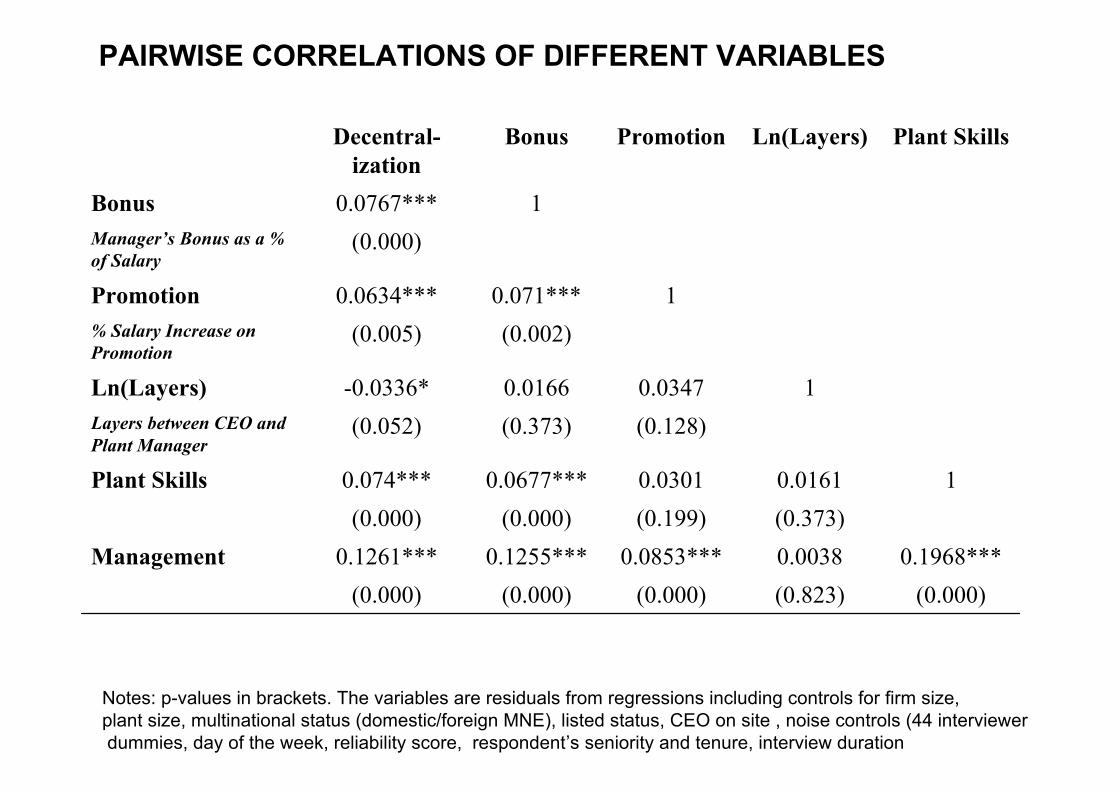
(0.000)(0.823)(0.000)(0.000)(0.000)0.1968***0.00380.0853***0.1255***0.1261***Management
(0.373)(0.199)(0.000)(0.000)10.01610.03010.0677***0.074***Plant Skills
(0.128)(0.373)(0.052)Layers between CEO andPlant Manager
10.03470.0166-0.0336*Ln(Layers)
(0.002)(0.005)% Salary Increase onPromotion
10.071***0.0634***Promotion
(0.000)Manager’s Bonus as a %of Salary
10.0767***Bonus
Plant SkillsLn(Layers)PromotionBonusDecentral-ization
Notes: p-values in brackets. The variables are residuals from regressions including controls for firm size, plant size, multinational status (domestic/foreign MNE), listed status, CEO on site , noise controls (44 interviewer dummies, day of the week, reliability score, respondent’s seniority and tenure, interview duration
PAIRWISE CORRELATIONS OF DIFFERENT VARIABLES
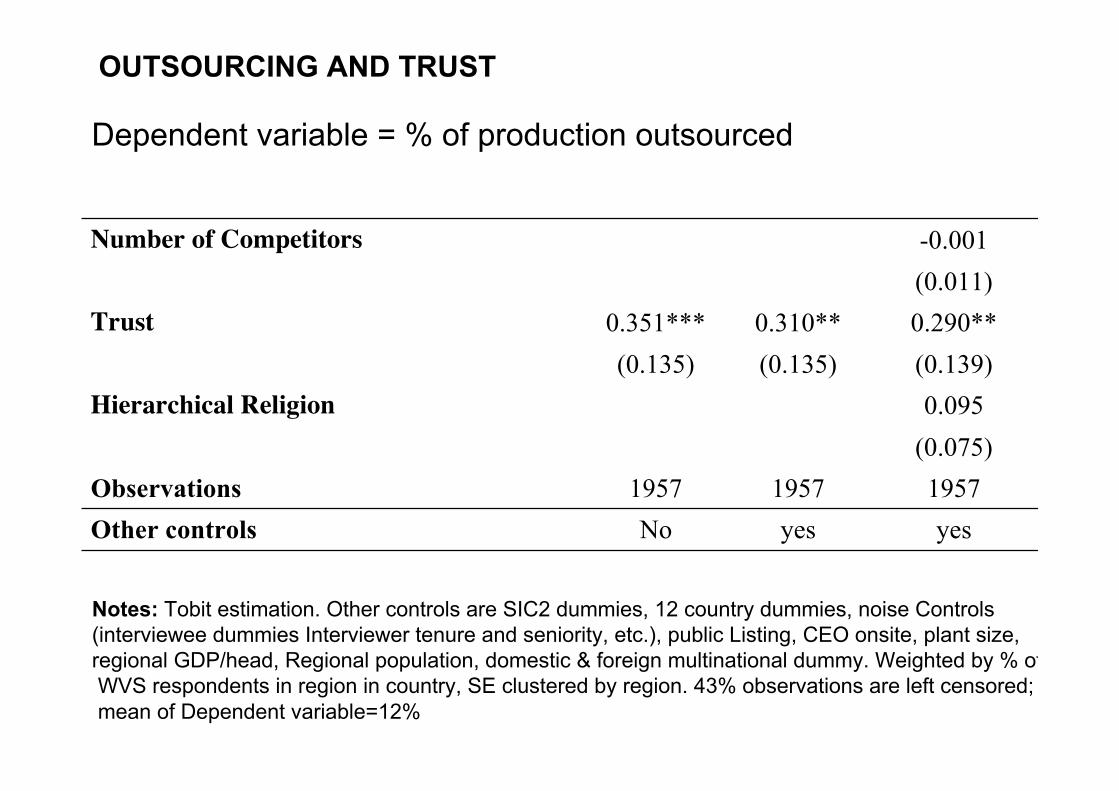
yesyesNoOther controls195719571957Observations(0.075)0.095Hierarchical Religion(0.139)(0.135)(0.135)0.290**0.310**0.351***Trust(0.011)-0.001Number of Competitors
OUTSOURCING AND TRUST
Notes: Tobit estimation. Other controls are SIC2 dummies, 12 country dummies, noise Controls (interviewee dummies Interviewer tenure and seniority, etc.), public Listing, CEO onsite, plant size, regional GDP/head, Regional population, domestic & foreign multinational dummy. Weighted by % of WVS respondents in region in country, SE clustered by region. 43% observations are left censored; mean of Dependent variable=12%
Dependent variable = % of production outsourced
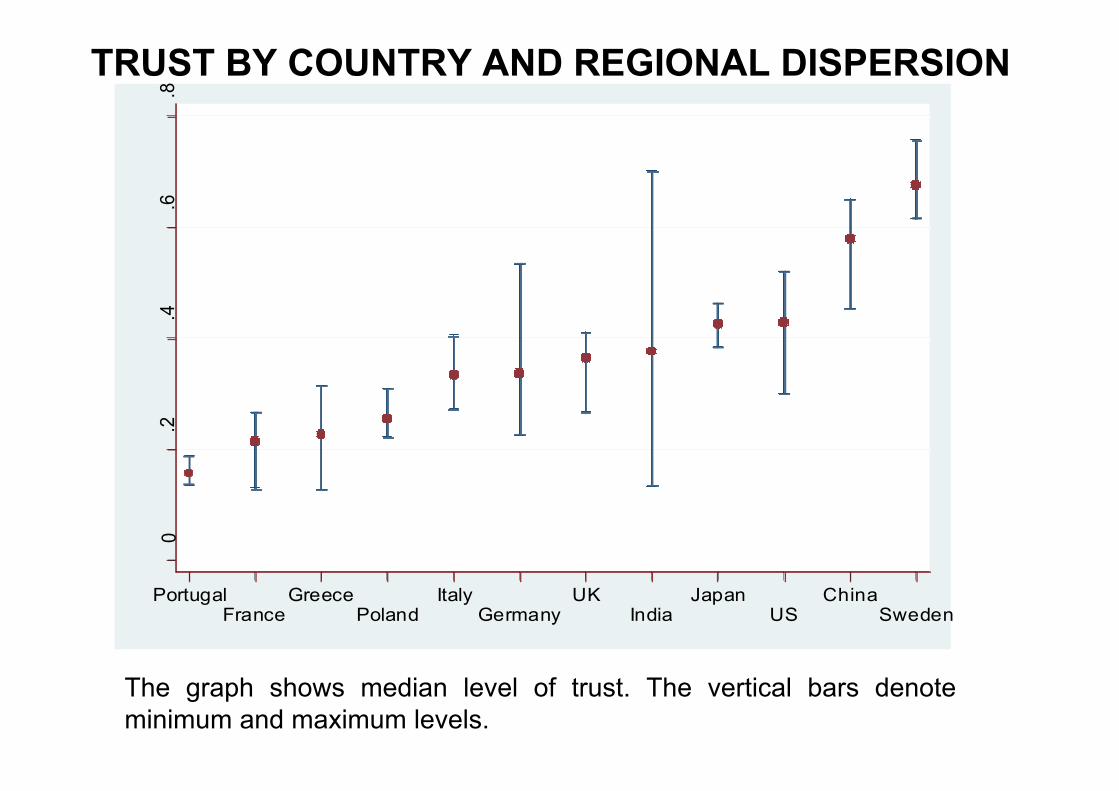
TRUST BY COUNTRY AND REGIONAL DISPERSION
0.2
.4.6
.8
PortugalFrance
GreecePoland
ItalyGermany
UKIndia
JapanUS
ChinaSweden
The graph shows median level of trust. The vertical bars denoteminimum and maximum levels.
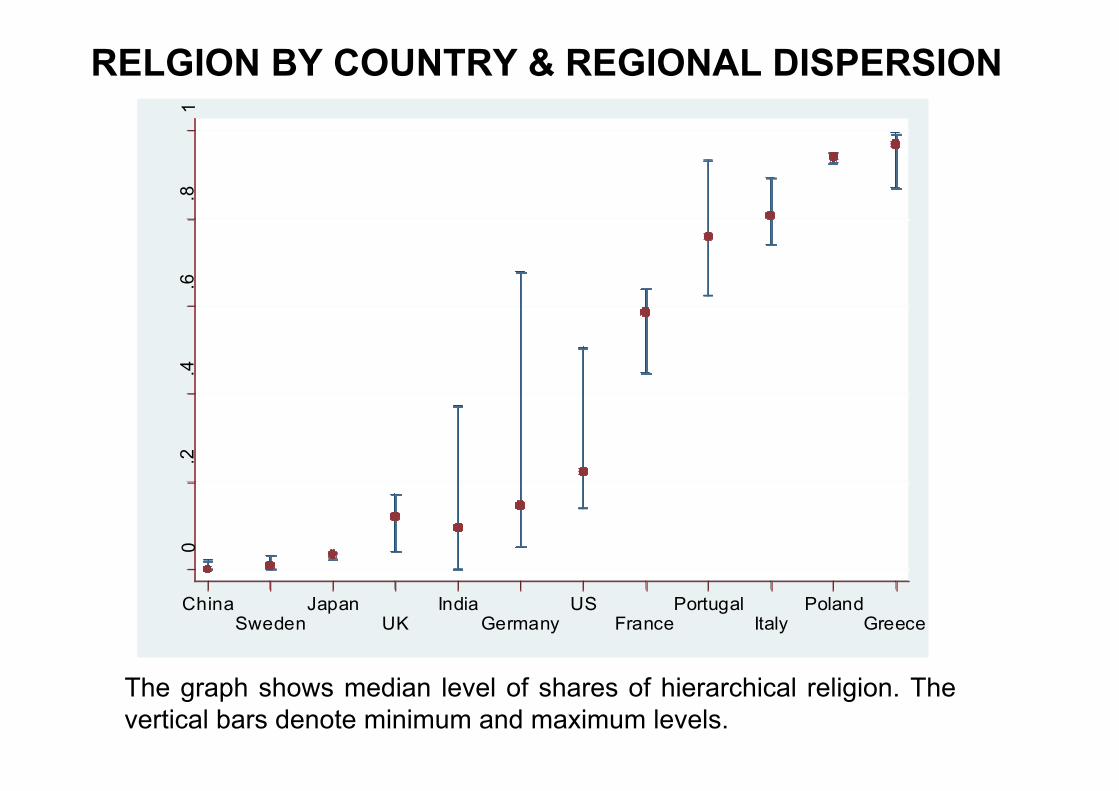
RELGION BY COUNTRY & REGIONAL DISPERSION
The graph shows median level of shares of hierarchical religion. Thevertical bars denote minimum and maximum levels.
0.2
.4.6
.81
ChinaSweden
JapanUK
IndiaGermany
USFrance
PortugalItaly
PolandGreece
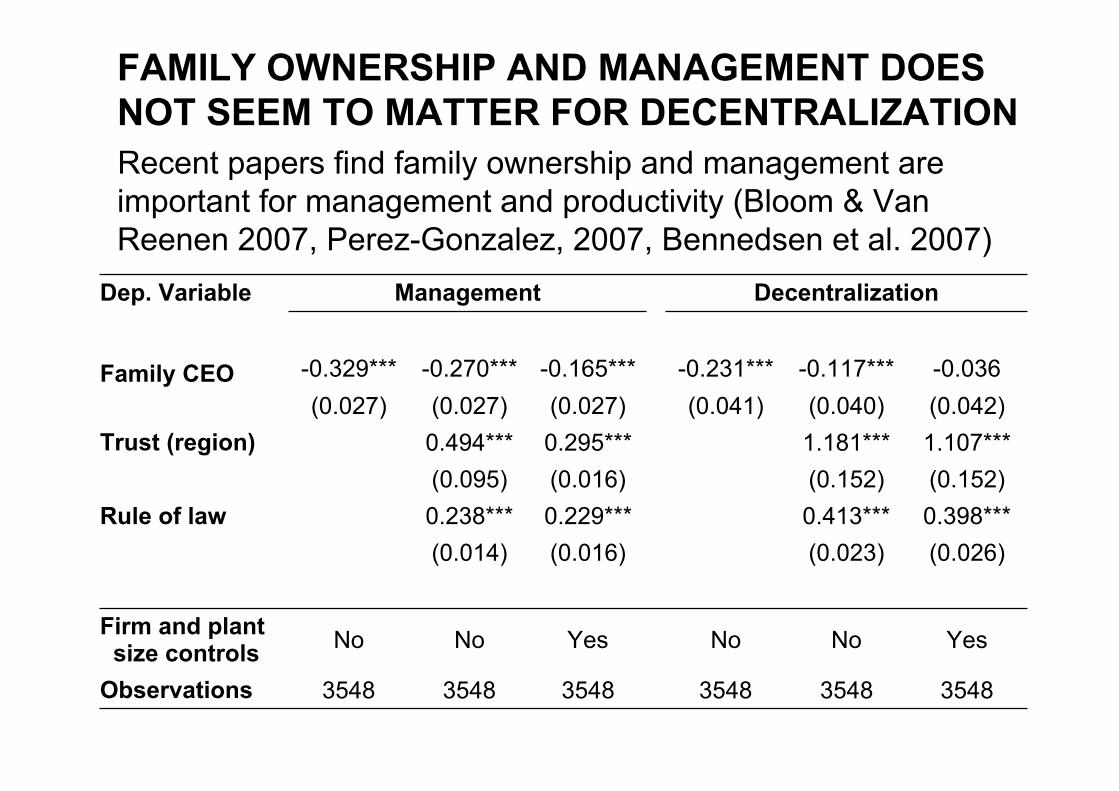
FAMILY OWNERSHIP AND MANAGEMENT DOESNOT SEEM TO MATTER FOR DECENTRALIZATIONRecent papers find family ownership and management areimportant for management and productivity (Bloom & VanReenen 2007, Perez-Gonzalez, 2007, Bennedsen et al. 2007)
3548
Yes
(0.016)0.229***(0.016)0.295***(0.027)
-0.165***
3548
No
(0.041)-0.231***
Decentralization
3548
No
(0.023)0.413***(0.152)1.181***(0.040)
-0.117***
ManagementDep. Variable
354835483548Observations
YesNoNoFirm and plant size controls
(0.026)(0.014)0.398***0.238***Rule of law(0.152)(0.095)1.107***0.494***Trust (region)(0.042)(0.027)(0.027)-0.036-0.270***-0.329***Family CEO
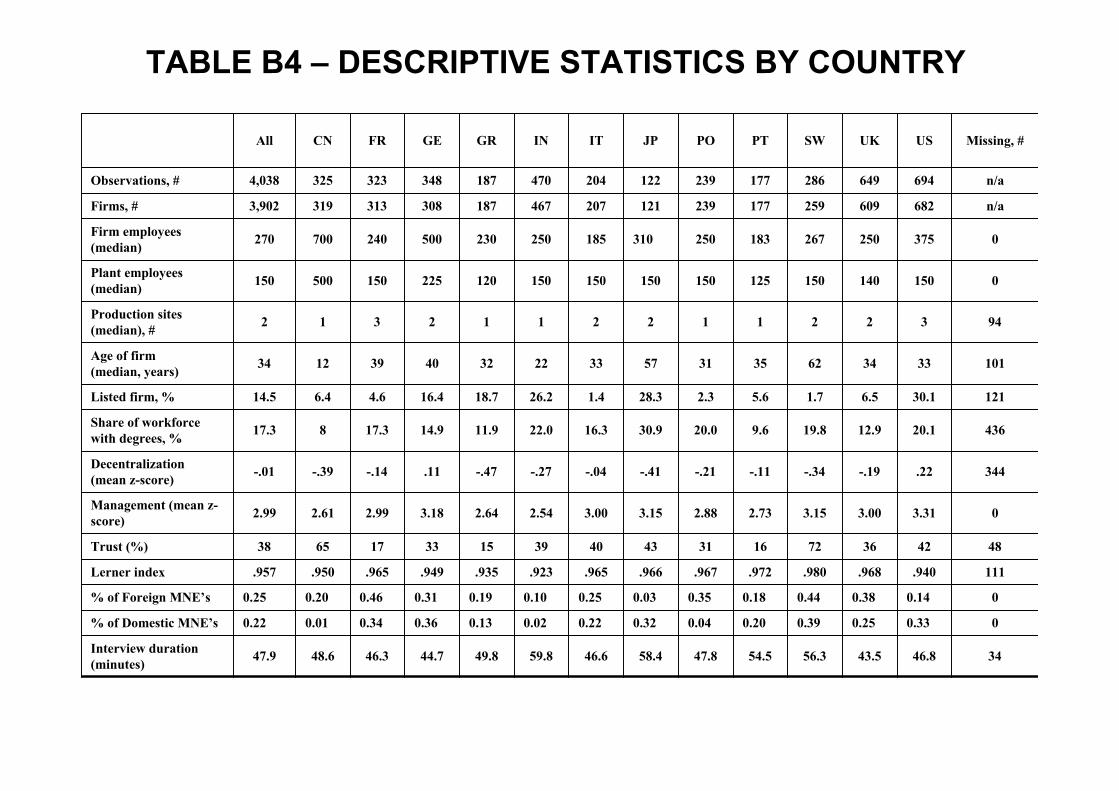
TABLE B4 – DESCRIPTIVE STATISTICS BY COUNTRY
3446.843.556.354.547.858.446.659.849.844.746.348.647.9Interview duration(minutes)
00.330.250.390.200.040.320.220.020.130.360.340.010.22% of Domestic MNE’s
00.140.380.440.180.350.030.250.100.190.310.460.200.25% of Foreign MNE’s
111.940.968.980.972.967.966.965.923.935.949.965.950.957Lerner index
4842367216314340391533176538Trust (%)
03.313.003.152.732.883.153.002.542.643.182.992.612.99Management (mean z-score)
344.22-.19-.34-.11-.21-.41-.04-.27-.47.11-.14-.39-.01Decentralization(mean z-score)
43620.112.919.89.620.030.916.322.011.914.917.3817.3Share of workforcewith degrees, %
12130.16.51.75.62.328.31.426.218.716.44.66.414.5Listed firm, %
10133346235315733223240391234Age of firm(median, years)
943221122112312Production sites(median), #
0150140150125150150150150120225150500150Plant employees(median)
0375250267183250310185250230500240700270Firm employees(median)
n/a6826092591772391212074671873083133193,902Firms, #
n/a6946492861772391222044701873483233254,038Observations, #
Missing, #USUKSWPTPOJPITINGRGEFRCNAll
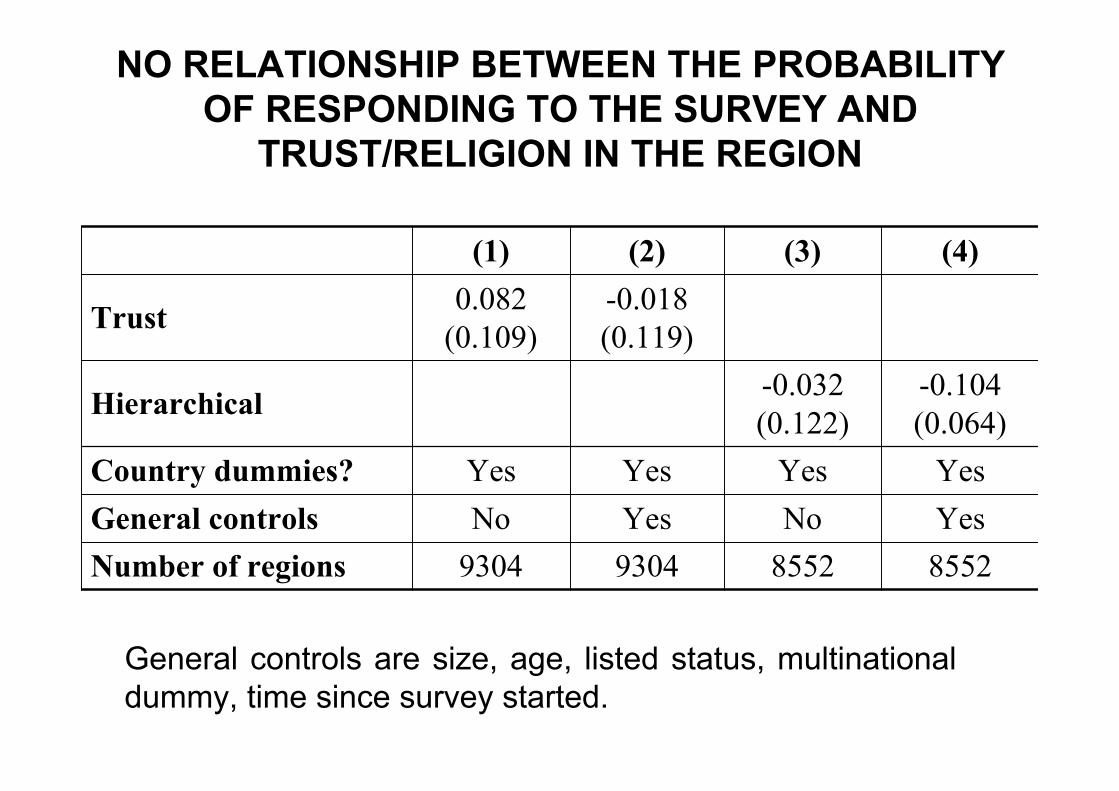
NO RELATIONSHIP BETWEEN THE PROBABILITYOF RESPONDING TO THE SURVEY AND
TRUST/RELIGION IN THE REGION
General controls are size, age, listed status, multinationaldummy, time since survey started.
8552855293049304Number of regionsYesNoYesNoGeneral controlsYesYesYesYesCountry dummies?
-0.104(0.064)
-0.032(0.122)Hierarchical
-0.018(0.119)
0.082(0.109)Trust
(4)(3)(2)(1)
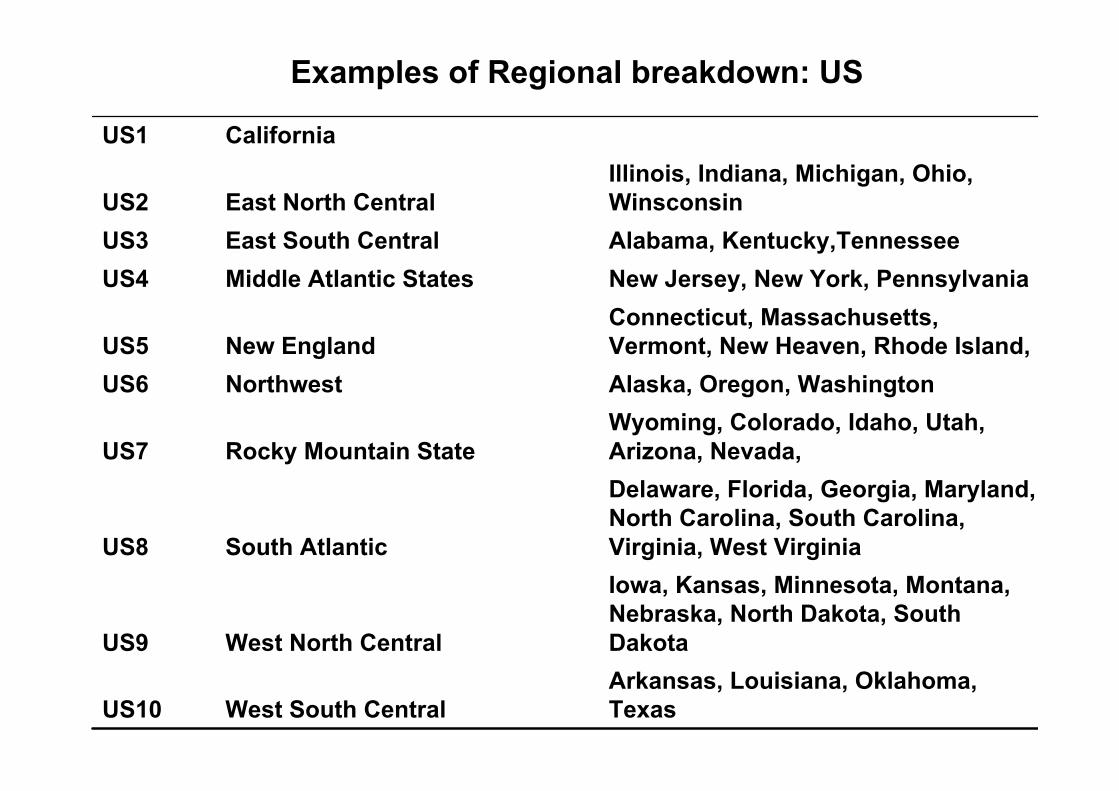
Arkansas, Louisiana, Oklahoma,TexasWest South CentralUS10
Iowa, Kansas, Minnesota, Montana,Nebraska, North Dakota, SouthDakotaWest North CentralUS9
Delaware, Florida, Georgia, Maryland,North Carolina, South Carolina,Virginia, West VirginiaSouth AtlanticUS8
Wyoming, Colorado, Idaho, Utah,Arizona, Nevada,Rocky Mountain StateUS7
Alaska, Oregon, WashingtonNorthwestUS6
Connecticut, Massachusetts,Vermont, New Heaven, Rhode Island,New EnglandUS5
New Jersey, New York, PennsylvaniaMiddle Atlantic StatesUS4Alabama, Kentucky,TennesseeEast South CentralUS3
Illinois, Indiana, Michigan, Ohio,WinsconsinEast North CentralUS2
CaliforniaUS1
Examples of Regional breakdown: US
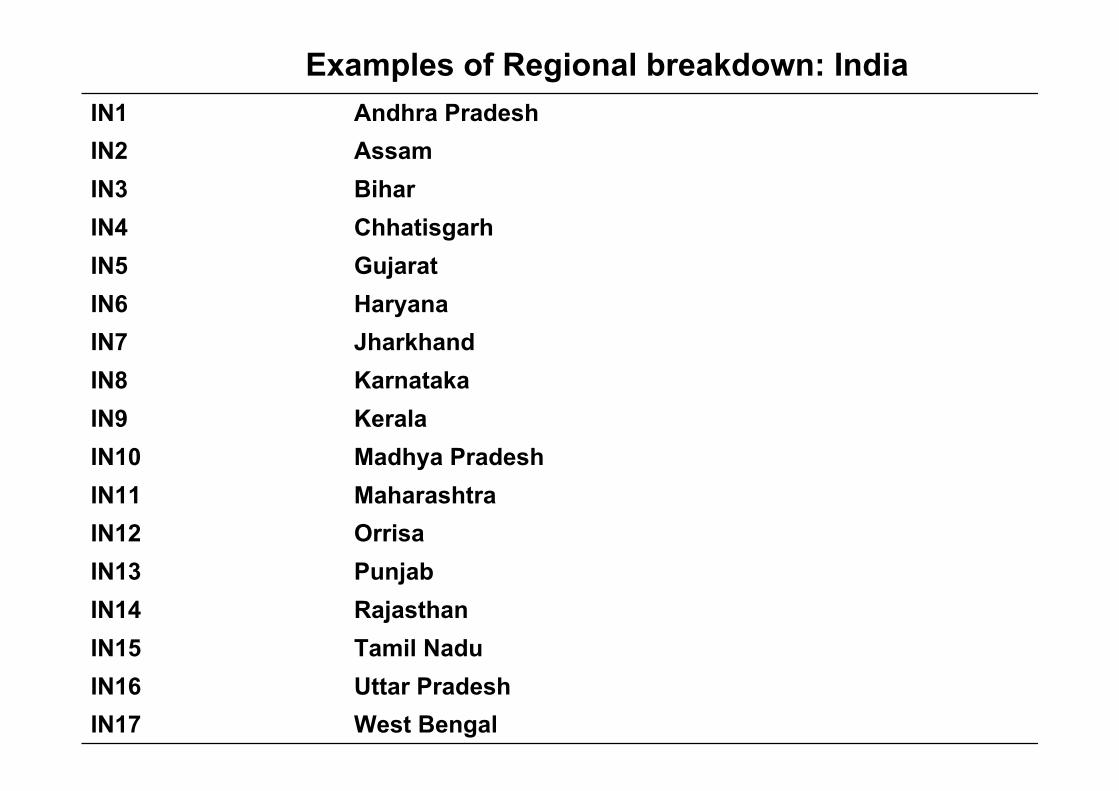
West BengalIN17Uttar PradeshIN16Tamil NaduIN15RajasthanIN14PunjabIN13OrrisaIN12MaharashtraIN11Madhya PradeshIN10KeralaIN9KarnatakaIN8JharkhandIN7HaryanaIN6GujaratIN5ChhatisgarhIN4BiharIN3AssamIN2Andhra PradeshIN1
Examples of Regional breakdown: India