Embed Size (px)
Citation preview

CFA Institute
The Performance of Equity Real Estate Investment TrustsAuthor(s): Keith V. Smith and David ShulmanSource: Financial Analysts Journal, Vol. 32, No. 5 (Sep. - Oct., 1976), pp. 61-66Published by: CFA InstituteStable URL: http://www.jstor.org/stable/4477967 .
Accessed: 17/06/2014 09:24
Your use of the JSTOR archive indicates your acceptance of the Terms & Conditions of Use, available at .http://www.jstor.org/page/info/about/policies/terms.jsp
.JSTOR is a not-for-profit service that helps scholars, researchers, and students discover, use, and build upon a wide range ofcontent in a trusted digital archive. We use information technology and tools to increase productivity and facilitate new formsof scholarship. For more information about JSTOR, please contact [email protected].
.
CFA Institute is collaborating with JSTOR to digitize, preserve and extend access to Financial AnalystsJournal.
http://www.jstor.org
This content downloaded from 194.29.185.145 on Tue, 17 Jun 2014 09:24:13 AMAll use subject to JSTOR Terms and Conditions
by Keith V. Smith and David Shulman
Institutions Beware
Te Performance of Equity Real Estate Investment Trut
While many large fortunes in this country have been made from real estate investments, most families have probably not invested in real estate beyond the equity in their own houses. And it has only been in recent years that many institutional investors have appeared to give serious thought to real estate as a potentially important part of their total portfolios.
Lack of interest in real estate may be attributed to such factors as the large investment often required, its lack of liquidity, and constraints facing many institutional investors. Moreover, the absence of a centralized market for real estate has limited the amount of information available to po- tential investors. While academicians have made comprehensive studies of achieved returns in listed stocks and bonds over long periods and under a variety of transaction cost assumptions, they have done very little of a comparable nature for real estate.'
The purpose of this study is to compare the per- formance of equity investments in real estate over the past decade with that of common stocks. One early study by Wendt and Wong suggested that returns from investment in apartment houses ex- ceeded corresponding returns from common stock investment.' A more recent academic study by Robichek, Cohn, and Pringle of several types of in- vestment assets revealed that the average yearly
1. Footnotes appear at end of article.
Keith V. Smith is Professor of Finance at the Gradu- ate School of Management, UCLA. David Shulman is an Assistant Professor at the University of California, Riverside. Research assistance for this study was pro- vided by Ms. Mary Kushner.
return from investments in farm real estate over the period 1949 to 1969 was 9.5 per cent, as compared with an average return of 11.6 per cent for com- mon stocks as represented by Standard and Poor's Industrial Stock Price Index.:' The same study showed that returns from farm real estate were neg- atively correlated with common stock returns, thus enhancing the desirability of holding both types of investments in a portfolio.
In essence, REIT's are a special type of invest- ment company that aggregates the funds of many investors into a portfolio of real estate investments. Some-perhaps most-REIT's invest only in the mortgage or debt claims on real estate projects, while others-the equity REIT's-have taken equity positions in real estate projects. One advan- tage of the equity REIT is that it permits small in- vestors to participate in the ownership of large real estate projects. A second advantage is that its shares are traded on the organized securities ex- changes alongside other common stocks, permitting direct comparison of its performance with that of common stock portfolios.
Exhibit I lists the 16 equity REIT's investigated in this study. The sample contains those equity REIT's for which complete monthly price and div- idend data were available over the four-year peri- od, December 1970 through December 1974. Complete data over the 11 -year period, December 1963 through December 1974, were available for the subsample of nine equity REIT's identified in the same exhibit.4 Average asset size as of year-end 1973 was $71.6 million for the entire sample and $70.6 million for the subsample.
Exhibit I also contains information on the degree to which the assets of these equity REIT's were invested in mortgage loans as of year-end
FINANCIAL ANALYSTS JOURNAL / SEPTEMBER-OCTOBER 1976 O 61
This content downloaded from 194.29.185.145 on Tue, 17 Jun 2014 09:24:13 AMAll use subject to JSTOR Terms and Conditions
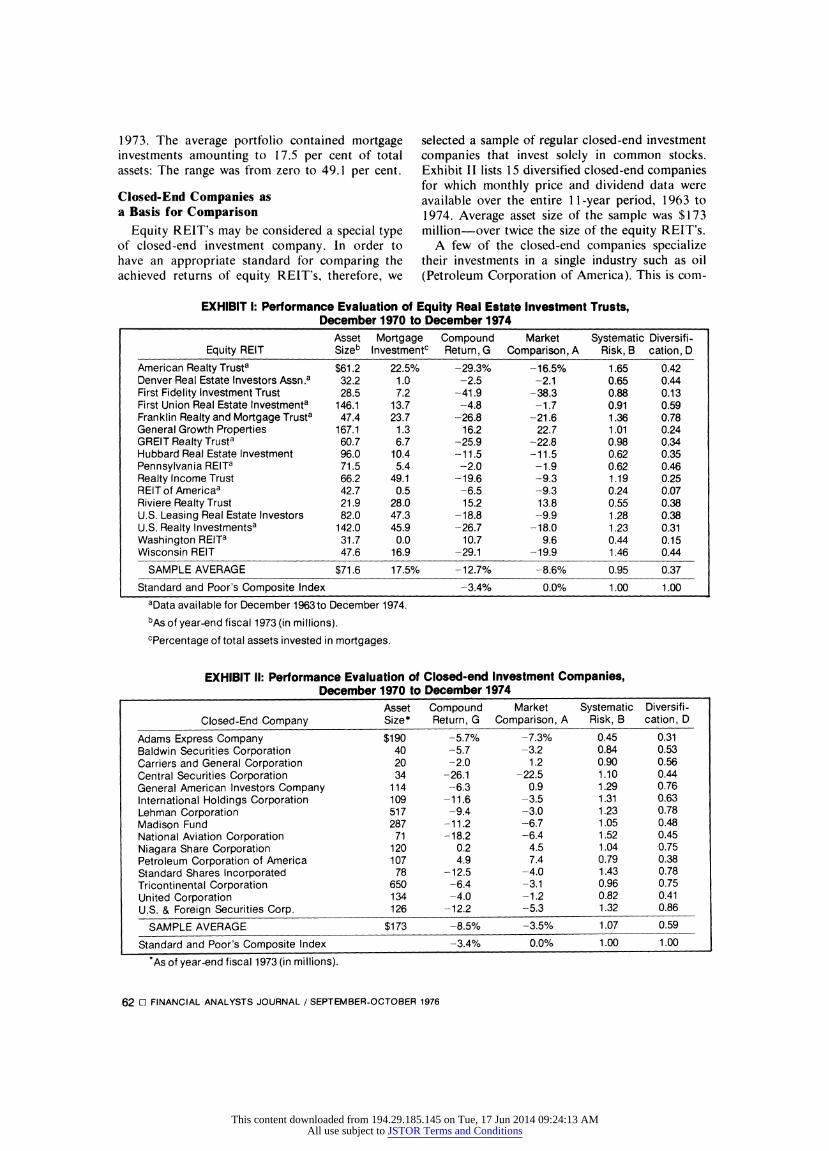
1973. The average portfolio contained mortgage investments amounting to 17.5 per cent of total assets: The range was from zero to 49.1 per cent.
Closed-End Companies as a Basis for Comparison
Equity REIT's may be considered a special type of closed-end investment company. In order to have an appropriate standard for comparing the achieved returns of equity REIT's, therefore, we
selected a sample of regular closed-end investment companies that invest solely in common stocks. Exhibit II lists 15 diversified closed-end companies for which monthly price and dividend data were available over the entire 11-year period, 1963 to 1974. Average asset size of the sample was $173 million-over twice the size of the equity REIT's.
A few of the closed-end companies specialize their investments in a single industry such as oil (Petroleum Corporation of America). This is com-
EXHIBIT 1: Performance Evaluation of Equity Real Estate Investment Trusts, December 1970 to December 1974
Asset Mortgage Compound Market Systematic Diversifi- Equity REIT Sizeb Investmentc Return, G Comparison, A Risk, B cation, D
American Realty Trusta $61.2 22.5% -29.3% -16.5% 1.65 0.42 Denver Real Estate Investors Assn.a 32.2 1.0 -2.5 -2.1 0.65 0.44 First Fidelity Investment Trust 28.5 7.2 -41.9 -38.3 0.88 0.13 First Union Real Estate Investmenta 146.1 13.7 -4.8 -1.7 0.91 0.59 Franklin Realty and Mortgage Trusta 47.4 23.7 -26.8 -21.6 1.36 0.78 General Growth Properties 167.1 1.3 16.2 22.7 1.01 0.24 GREIT Realty Trusta 60.7 6.7 -25.9 -22.8 0.98 0.34 Hubbard Real Estate Investment 96.0 10.4 -11.5 -11.5 0.62 0.35 Pennsylvania REITa 71.5 5.4 -2.0 --1.9 0.62 0.46 Realty Income Trust 66.2 49.1 -19.6 -9.3 1.19 0.25 REITof Americaa 42.7 0.5 -6.5 -9.3 0.24 0.07 Riviere Realty Trust 21.9 28.0 15.2 13.8 0.55 0.38 U.S. Leasing Real Estate Investors 82.0 47.3 -18.8 -9.9 1.28 0.38 U.S. Realty Investmentsa 142.0 45.9 -26.7 -18.0 1.23 0.31 Washington REITa 31.7 0.0 10.7 9.6 0.44 0.15 Wisconsin REIT 47.6 16.9 -29.1 -19.9 1.46 0.44
SAMPLE AVERAGE $71.6 17.5% -12.7% -8.6% 0.95 0.37
Standard and Poor's Composite Index -3.4% 0.0% 1.00 1.00
aData available for December 1963 to December 1974.
bAs of year-end fiscal 1973 (in millions).
cPercentage of total assets invested in mortgages.
EXHIBIT II: Performance Evaluation of Closed-end Investment Companies, December 1970 to December 1974
Asset Compound Market Systematic Diversifi- Closed-End Company Size* Return, G Comparison, A Risk, B cation, D
Adams Express Company $190 -5.7% -7.3% 0.45 0.31 Baldwin Securities Corporation 40 -5.7 -3.2 0.84 0.53 Carriers and General Corporation 20 -2.0 1.2 0.90 0.56 Central Securities Corporation 34 -26.1 -22.5 1.10 0.44 General American Investors Company 114 -6.3 0.9 1.29 0.76 International Holdings Corporation 109 -11.6 -3.5 1.31 0.63 Lehman Corporation 517 -9.4 -3.0 1.23 0.78 Madison Fund 287 -11.2 -6.7 1.05 0.48 National Aviation Corporation 71 -18.2 -6.4 1.52 0.45 Niagara Share Corporation 120 0.2 4.5 1.04 0.75 Petroleum Corporation of America 107 4.9 7.4 0.79 0.38 Standard Shares Incorporated 78 -12.5 -4.0 1.43 0.78 Tricontinental Corporation 650 -6.4 -3.1 0.96 0.75 United Corporation 134 -4.0 -1.2 0.82 0.41 U.S. & Foreign Securities Corp. 126 -12.2 -5.3 1.32 0.86
SAMPLE AVERAGE $173 -8.5% -3.5% 1.07 0.59
Standard and Poor's Composite Index -3.4% 0.0% 1.00 1.00
*As of year-end fiscal 1973 (in millions).
62 [l FINANCIAL ANALYSTS JOURNAL / SEPTEMBER-OCTOBER 1976
This content downloaded from 194.29.185.145 on Tue, 17 Jun 2014 09:24:13 AMAll use subject to JSTOR Terms and Conditions
parable to an equity REIT specializing in a single product such as shopping centers (General Growth Properties) or in a single geographical area (Wash- ington REIT).
We were tempted to compare the equity REIT's against the much larger universe of mutual funds, about which much more has been written in recent years. However, mutual funds are open-ended in- vestment companies that continually sell new shares or redeem shares at the per share net asset value. Thus, the capitalization of mutual funds is continually changing, whereas the capitalization of a closed-end investment company is relatively fixed over time-more nearly resembling that of the equity REIT.
One might expect the market price of a closed- end investment company to approximate the net asset value of its portfolio. It turns out, however, that closed-end shares often sell at either discounts or premiums from the underlying net asset value. The uncertainty about future discounts or pre- miums represents an additional element of risk for the owner of closed-end shares, and one that has never been adequately explained in the financial literature.5
Conceptually, an equity REIT is also subject to the discount/premium phenomenon. But the lack of continual market valuations for real estate proj- ects prevents the calculation of underlying net asset values, hence discounts or premiums, for an equity REIT. In other words, the market prices of both equity REIT's and closed-end investment com- panies may deviate from their underlying net asset values, but the extent of that deviation is only ob- served for the latter.
Investment Performance Measurements This study uses four different measures in com-
paring equity REIT's with closed-end investment companies. The first, the geometric mean return (G) of quarterly rates of return (including both ap- preciation and dividend yield) for each portfolio over a given sample period, is a relatively tradi- tional measure of performance.6
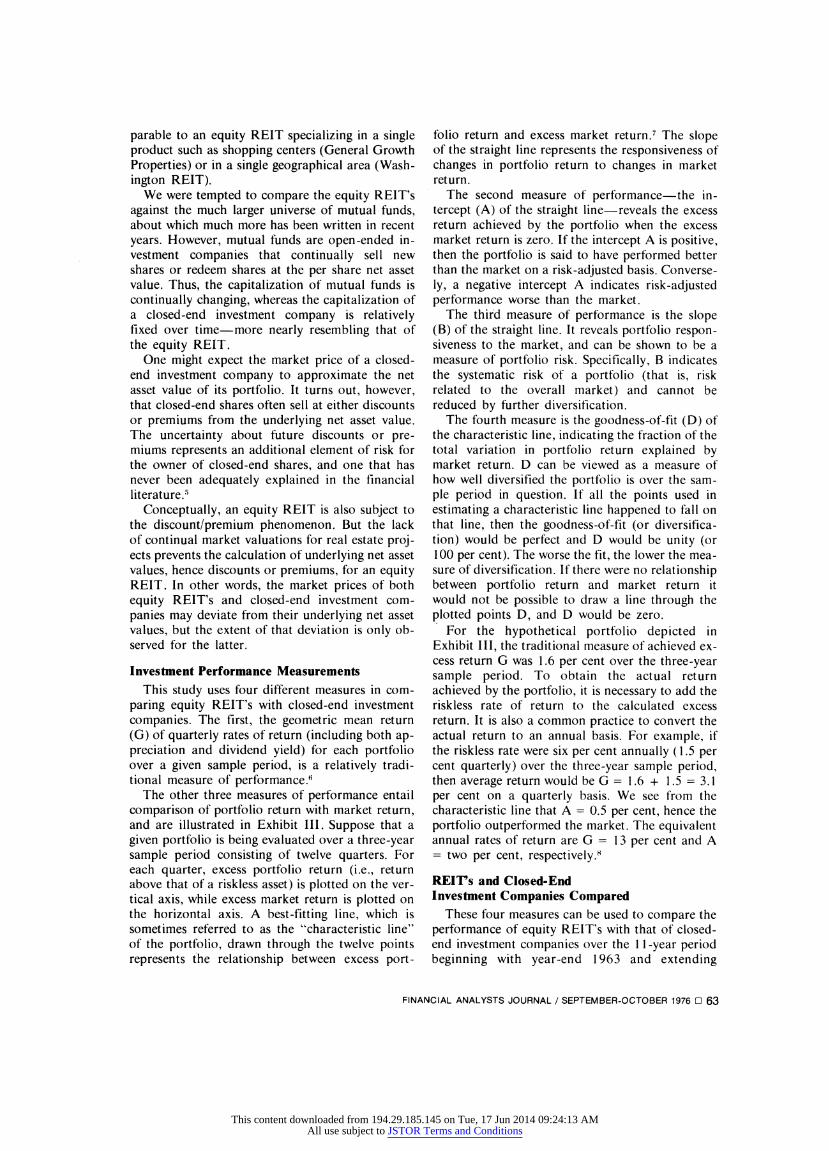
The other three measures of performance entail comparison of portfolio return with market return, and are illustrated in Exhibit III. Suppose that a given portfolio is being evaluated over a three-year sample period consisting of twelve quarters. For each quarter, excess portfolio return (i.e., return above that of a riskless asset) is plotted on the ver- tical axis, while excess market return is plotted on the horizontal axis. A best-fitting line, which is sometimes referred to as the "characteristic line" of the portfolio, drawn through the twelve points represents the relationship between excess port-
folio return and excess market return.7 The slope of the straight line represents the responsiveness of changes in portfolio return to changes in market return.
The second measure of performance-the in- tercept (A) of the straight line-reveals the excess return achieved by the portfolio when the excess market return is zero. If the intercept A is positive, then the portfolio is said to have performed better than the market on a risk-adjusted basis. Converse- ly, a negative intercept A indicates risk-adjusted performance worse than the market.
The third measure of performance is the slope (B) of the straight line. It reveals portfolio respon- siveness to the market, and can be shown to be a measure of portfolio risk. Specifically, B indicates the systematic risk of a portfolio (that is, risk related to the overall market) and cannot be reduced by further diversification.
The fourth measure is the goodness-of-fit (D) of the characteristic line, indicating the fraction of the total variation in portfolio return explained by market return. D can be viewed as a measure of how well diversified the portfolio is over the sam- ple period in question. If all the points used in estimating a characteristic line happened to fall on that line, then the goodness-of-fit (or diversifica- tion) would be perfect and D would be unity (or 100 per cent). The worse the fit, the lower the mea- sure of diversification. If there were no relationship between portfolio return and market return it would not be possible to draw a line through the plotted points D, and D would be zero.
For the hypothetical portfolio depicted in Exhibit III, the traditional measure of achieved ex- cess return G was 1.6 per cent over the three-year sample period. To obtain the actual return achieved by the portfolio, it is necessary to add the riskless rate of return to the calculated excess return. It is also a common practice to convert the actual return to an annual basis. For example, if the riskless rate were six per cent annually ( 1.5 per cent quarterly) over the three-year sample period, then average return would be G = 1.6 + 1.5 = 3.1 per cent on a quarterly basis. We see from the characteristic line that A = 0.5 per cent, hence the portfolio outperformed the market. The equivalent annual rates of return are G = 13 per cent and A = two per cent, respectively.8
REIT's and Closed-End Investment Companies Compared
These four measures can be used to compare the performance of equity REIT's with that of closed- end investment companies over the 11 -year period beginning with year-end 1963 and extending
FINANCIAL ANALYSTS JOURNAL / SEPTEMBER-OCTOBER 1976 OI 63
This content downloaded from 194.29.185.145 on Tue, 17 Jun 2014 09:24:13 AMAll use subject to JSTOR Terms and Conditions
through year-end 1974. The measures were based on quarterly returns as calculated from monthly prices and dividends for each portfolio. The market was represented by the Standard and Poor's Composite Index, and the riskless rate of return was represented by the yield on a 90-day U.S. Treasury Bill.
Calculated values of the four measures are displayed in Exhibit I for each of the 16 equity REIT's over the four-year sample period, Decem- ber 1970 through December 1974.9 Although three of the equity REIT's achieved quite respectable returns over that period, the others experienced losses ranging from -2.0 to -41.9 per cent per year. The average annual return of the sample was -12.7 per cent per year, which is considerably worse than the -3.9 per cent per year loss at- tributed to the overall market over that period. The average intercept value for the sample was -8.6 per cent, implying that the equity REIT's did over eight per cent worse than the market (as mea- sured by the intercept of their characteristic lines)
during the four-year period. At the same time, the average value of syste-
matic risk for the equity REIT's ranged from a high of 1.63 for American Realty Trust to a low of 0.24 for REIT of America, while averaging 0.95 for the entire sample. That is, the systematic risk of the equity REIT sample was slightly below the value of unity characterizing the entire stock market. The diversification measures for this sam- ple period ranged from 0.78 to 0.07, averaging only 0.37 for the 16 equity REIT's.
In contrast, the 15 closed-end companies shown in Exhibit II had an average systematic risk value of 1.07 and an average value of diversification of 0.59. Thus while the level of systematic risk in the sample of closed-end funds was somewhat above that of the entire market, the closed-end companies were better diversified than the sample of equity REIT's. Over the four years the closed-end com- panies performed better than the equity REIT's, both absolutely and relatively, displaying a geo- metric return of -8.5 per cent per year. The
EXHIBIT Ill: Illustration of Methodology for Performance Evaluation
5% -Excess Portfolio Return
4% -
Geometric Mean Return, G = 3.1%O/
Goodness-of-Fit, D = 85%
3% -
2% - * Slope, B = 0.8
Intercept, A = 0.5%
Excess Market Return
-4% -3% -2% 1% 2% 3% 4% 5% 6%
-2% -
64 O- FINANCIAL ANALYSTS JOURNAL /SEPTEMBER-OCTOBER 1976
This content downloaded from 194.29.185.145 on Tue, 17 Jun 2014 09:24:13 AMAll use subject to JSTOR Terms and Conditions
average intercept of the characteristic lines for the closed-end companies was -3.5 per cent versus -8.6 per cent for the REIT's.
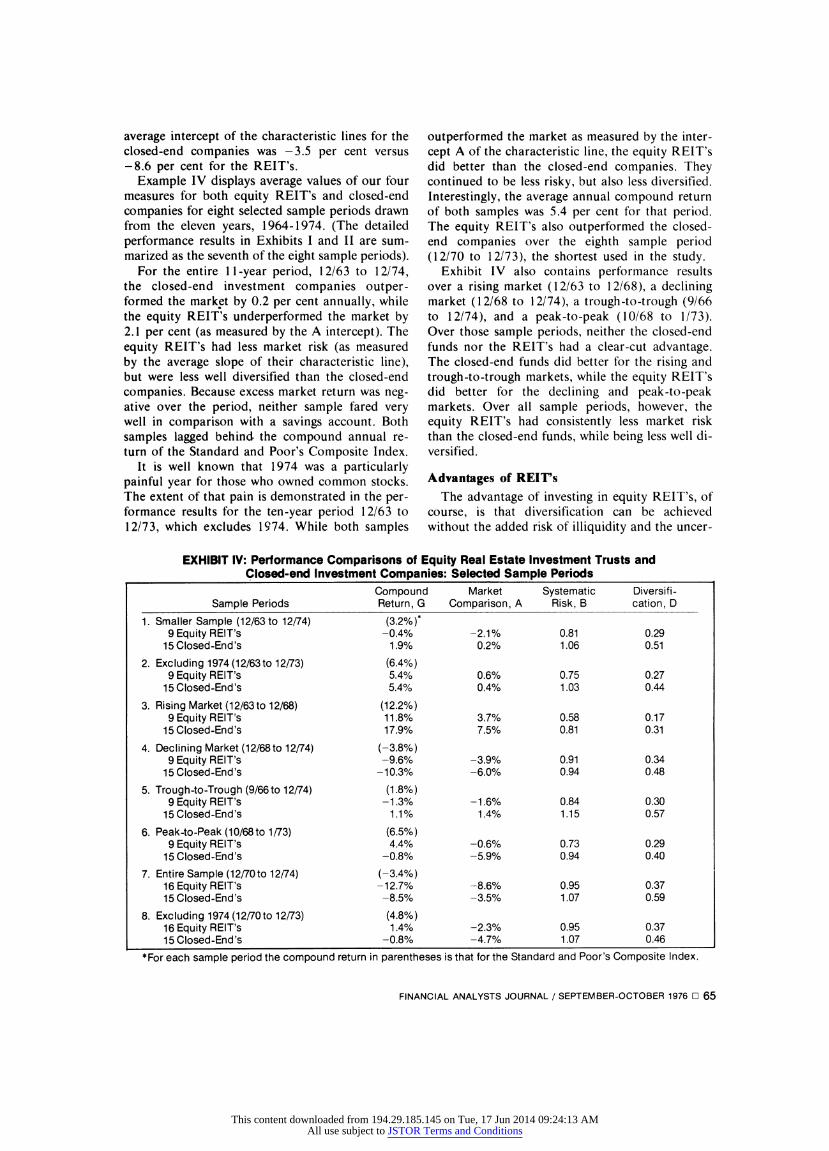
Example IV displays average values of our four measures for both equity REIT's and closed-end companies for eight selected sample periods drawn from the eleven years, 1964-1974. (The detailed performance results in Exhibits I and II are sum- marized as the seventh of the eight sample periods).
For the entire 11 -year period, 12/63 to 12/74, the closed-end investment companies outper- formed the market by 0.2 per cent annually, while the equity REIT's underperformed the market by 2.1 per cent (as measured by the A intercept). The equity REIT's had less market risk (as measured by the average slope of their characteristic line), but were less well diversified than the closed-end companies. Because excess market return was neg- ative over the period, neither sample fared very well in comparison with a savings account. Both samples lagged behind the compound annual re- turn of the Standard and Poor's Composite Index.
It is well known that 1974 was a particularly painful year for those who owned common stocks. The extent of that pain is demonstrated in the per- formance results for the ten-year period 12/63 to 12/73, which excludes 1974. While both samples
outperformed the market as measured by the inter- cept A of the characteristic line, the equity REIT's did better than the closed-end companies. They continued to be less risky, but also less diversified. Interestingly, the average annual compound return of both samples was 5.4 per cent for that period. The equity REIT's also outperformed the closed- end companies over the eighth sample period (12/70 to 12/73), the shortest used in the study.
Exhibit IV also contains performance results over a rising market (12/63 to 12/68), a declining market (12/68 to 12/74), a trough-to-trough (9/66 to 12/74), and a peak-to-peak (10/68 to 1/73). Over those sample periods, neither the closed-end funds nor the REIT's had a clear-cut advantage. The closed-end funds did better for the rising and trough-to-trough markets, while the equity REIT's did better for the declining and peak-to-peak markets. Over all sample periods, however, the equity REIT's had consistently less market risk than the closed-end funds, while being less well di- versified.
Advantages of REIrs The advantage of investing in equity REIT's, of
course, is that diversification can be achieved without the added risk of illiquidity and the uncer-
EXHIBIT IV: Performance Comparisons of Equity Real Estate Investment Trusts and Closed-end Investment Companies: Selected Sample Periods
Compound Market Systematic Diversifi- Sample Periods Return, G Comparison, A Risk, B cation, D
1. Smaller Sample (12/63 to 12/74) (3.2%) 9 Equity REIT's -0.4% -2.1% 0.81 0.29
15 Closed-End's 1.9% 0.2% 1.06 0.51
2. Excluding 1974 (12/63to 12/73) (6.4%) 9 Equity REIT's 5.4% 0.6% 0.75 0.27
15 Closed-End's 5.4% 0.4% 1.03 0.44
3. Rising Market (12/63 to 12/68) (12.2%) 9 Equity REIT's 11.8% 3.7% 0.58 0.17
15 Closed-End's 17.9% 7.5% 0.81 0.31
4. Declining Market (12/68to 12/74) (-3.8%) 9 Equity REIT's -9.6% -3.9% 0.91 0.34
15 Closed-End's -10.3% -6.0% 0.94 0.48
5. Trough-to-Trough (9/66to 12/74) (1.8%) 9 Equity REIT's -1.3% -1.6% 0.84 0.30
15 Closed-End's 1.1% 1.4% 1.15 0.57
6. Peak-to-Peak (10/68 to 1/73) (6.5%) 9 Equity REIT's 4.4% -0.6% 0.73 0.29
15 Closed-End's -0.8% -5.9% 0.94 0.40
7. Entire Sample (12/70to 12/74) (-3.4%) 16 Equity REIT's -12.7% -8.6% 0.95 0.37 15 Closed-End's -8.5% -3.5% 1.07 0.59
8. Excluding 1974 (12/70 to 12/73) (4.8%) 16 Equity REIT's 1.4% -2.3% 0.95 0.37 15 Closed-End's -0.8% -4.7% 1.07 0.46
*For each sample period the compound return in parentheses is that for the Standard and Poor's Composite Index.
FINANCIAL ANALYSTS JOURNAL / SEPTEMBER-OCTOBER 1976 O 65
This content downloaded from 194.29.185.145 on Tue, 17 Jun 2014 09:24:13 AMAll use subject to JSTOR Terms and Conditions
tainty of market value that has hampered tradi- tional real estate investments. The level of diversi- fication achieved by the equity REIT's, however, has been consistently lower than that of the closed- end companies.
Of paramount importance, the findings of our study suggest that the sample of equity REIT's, on balance, fared about the same as the sample of closed-end companies, with the latter doing some- what better over the entire 11 -year period. On average institutional portfolio managers would not have improved their overall portfolio returns by in- vesting in real estate equities. For certain sample periods, including the most recent, equity REIT's actually would have added to the substantial losses in common stocks experienced by most investors.
None of the study findings, of course, has any direct bearing on what will happen in 1976 and beyond. But if the past decade provides even a rough guide for projecting the future then, on average, equity REIT's are likely to achieve returns comparable to those of diversified port- folios of common stocks. As part of an overall in- vestment strategy, equity REIT's will conceivably offer institutions a chance to diversify their port- folios further without experiencing any significant change in expected return.
When equity REIT's appeared on the invest- ment scene, they seemed to offer (like high-tech- nology growth stocks, nursing homes, conglomer- ates, and gold before them) substantial advantages without attendant disadvantages. Their subsequent performance has proved otherwise. Real estate in- vestments have not been, and are unlikely to become, a panacea for large institutional port- folios. d
Footnotes 1. For example, see Lawrence Fisher and James H.
Lorie, "Rates of Return on Investments in Common Stocks: The Year-by-Year Record, 1926-65," Jour- nal of Business (July 1968), 291-316.
2. P.F. Wendt and S.N. Wong, "Investment Perfor- mance: Common Stocks Versus Apartment Houses," Journal of Finance (December 1965), 633-646.
3. AA. Robicheck, RA. Cohn and JJ. Pringle, "Returns on Alternative Investment Media and Im- plications for Portfolio Construction," Journal of Business (July 1972), 427-443.
4. Monthly ending prices for the equity REIT's and also for the closed-end investment companies were obtained from the Bank and Quotation Record (New York: William B. Dana Company, selected issues). Monthly dividends were obtained from the Annual Dividend Record (New York: Standard and Poor's Corporation, selected issues).
5. See Kenneth J. Boudreaux, "Discounts and
Premiums on Closed-End Mutual Funds," Journal of Business (May 1973) 515-522.
6. For real estate investments that are not traded on the organized securities exchanges, calculation of return is more complicated, particularly because of their unique tax feature. A discussion of how total return for one type of real estate investment can be decom- posed into its various components is presented in K.V. Smith and D. Shulman, "The Impact of Pro- posed Tax Legislation on Investment in New Apart- ment Buildings," Real Estate Review (Spring 1974) 37-42.
7. While the straight line can readily be drawn free- hand, it is a common practice to use the method of least squares to find the line that minimizes the squared deviation of the points about the line.
8. Specifically for compound return G, (1.03 1)4 1.130, which is the wealth relative corresponding to a 13.0 per cent rate of return. For market com- parison A, one simply multiplies to obtain (4) (0.5% ) = 2.0% .
9. For the remainder of the article, values of achieved return G are expressed as actual returns on an an- nual basis. Returns relative to the market A are also expressed on an annual basis.
Dividend 571/2? per Common Share (Formerly 52'/2c per share)
Payable: September 15, 1976 Record:August 13, 1976 Declared: July 28, 1976
Cyril J. Smith, Secretary Houston, Texas
Panhandle Eastern PIPE LINE COMPANY
Consecutive dividend payments since 1939
66 0 FINANCIAL ANALYSTS JOURNAL / SEPTEMBER-OCTOBER 1976
This content downloaded from 194.29.185.145 on Tue, 17 Jun 2014 09:24:13 AMAll use subject to JSTOR Terms and Conditions