Embed Size (px)
Citation preview
THE PERIOD OF ROTATION OF THE SUN
Student Manual
A Manual to Accompany Software for the Introductory Astronomy Lab Exercise Document SM 11: Circ.Version 1.0
Department of Physics Gettysburg College Gettysburg, PA 17325 Telephone: (717) 337-6019 email: [email protected] Database, Software, and Manuals prepared by: Laurence Marschall and Glenn Snyder (CLEA PROJECT, Gettysburg College) and Jeff Sudol (GONG Project, National Solar Observatory)
Contemporary Laboratory Experiences in Astronomy
The Period of Rotation of the Sun 2
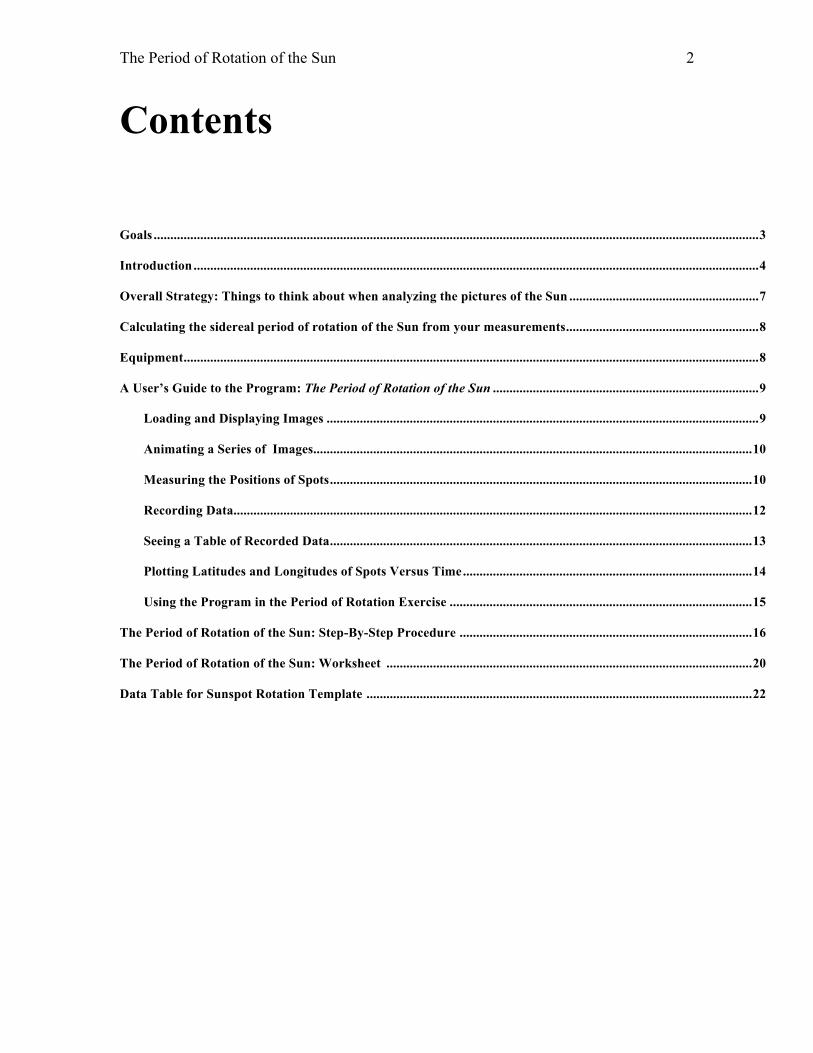
Contents Goals ...................................................................................................................................................................................... 3 Introduction .......................................................................................................................................................................... 4 Overall Strategy: Things to think about when analyzing the pictures of the Sun ......................................................... 7 Calculating the sidereal period of rotation of the Sun from your measurements .......................................................... 8 Equipment ............................................................................................................................................................................. 8 A User’s Guide to the Program: The Period of Rotation of the Sun ................................................................................ 9
Loading and Displaying Images .................................................................................................................................. 9 Animating a Series of Images .................................................................................................................................... 10 Measuring the Positions of Spots ............................................................................................................................... 10 Recording Data ............................................................................................................................................................ 12 Seeing a Table of Recorded Data ............................................................................................................................... 13 Plotting Latitudes and Longitudes of Spots Versus Time ....................................................................................... 14 Using the Program in the Period of Rotation Exercise ........................................................................................... 15
The Period of Rotation of the Sun: Step-By-Step Procedure ........................................................................................ 16 The Period of Rotation of the Sun: Worksheet .............................................................................................................. 20 Data Table for Sunspot Rotation Template .................................................................................................................... 22
The Period of Rotation of the Sun 3
LEARNING GOALS • The student should be able to state the direction of rotation of the Sun as seen from the
earth. • The student should be able to state the rate of rotation of the Sun. • The student should be able to explain how rate of rotation of the Sun can be determined
from observations of sunspots. • The student should be able to describe the appearance of sunspots, the long-term changes
in the appearance of sunspots, and the lifetimes of sunspots. • The student should develop an appreciation of the complexities in interpreting two-
dimensional photographs of the three-dimensional Sun as observed from the moving earth.
• The student should develop an appreciation of the difficulty of turning images into meaningful scientific information.
PROCEDURAL OBJECTIVES If you learn to……
• Use CLEA software to display CCD images of the Sun taken by the Gong Project
cameras. • Measure the positions of sunspots on the pictures. • Understand the relation between the x and y positions and spherical coordinates on the
curved surface of the Sun. • Determine how fast the longitude and latitude of spots on the Sun change. • Understand the relation between the angular speed of a spot and the rotation rate of the
Sun. • Understand the difference between the synodic period of rotation of the Sun and the
sidereal period of rotation of the Sun.
You should be able to……
• Select a series of images with sunspots suitable for measurement. • View an animation of the images showing the motion of the spots as the Sun rotates. • Devise a procedure for determining the apparent rotation rate of the Sun by measuring the
positions of sunspots. • Convert the apparent rotation rate of the Sun into the sidereal rate of rotation of the Sun. • Explore how the rotation rate of the Sun depends on latitude.
USEFUL TERMS YOU SHOULD REVIEW IN THIS MANUAL
Degrees Heliographic
Coordinates Julian Day Latitude Longitude Pixels
Photosphere Revolution Rotation Sidereal Rotation Period
Sunspot Synodic Rotation Period
The Period of Rotation of the Sun 4
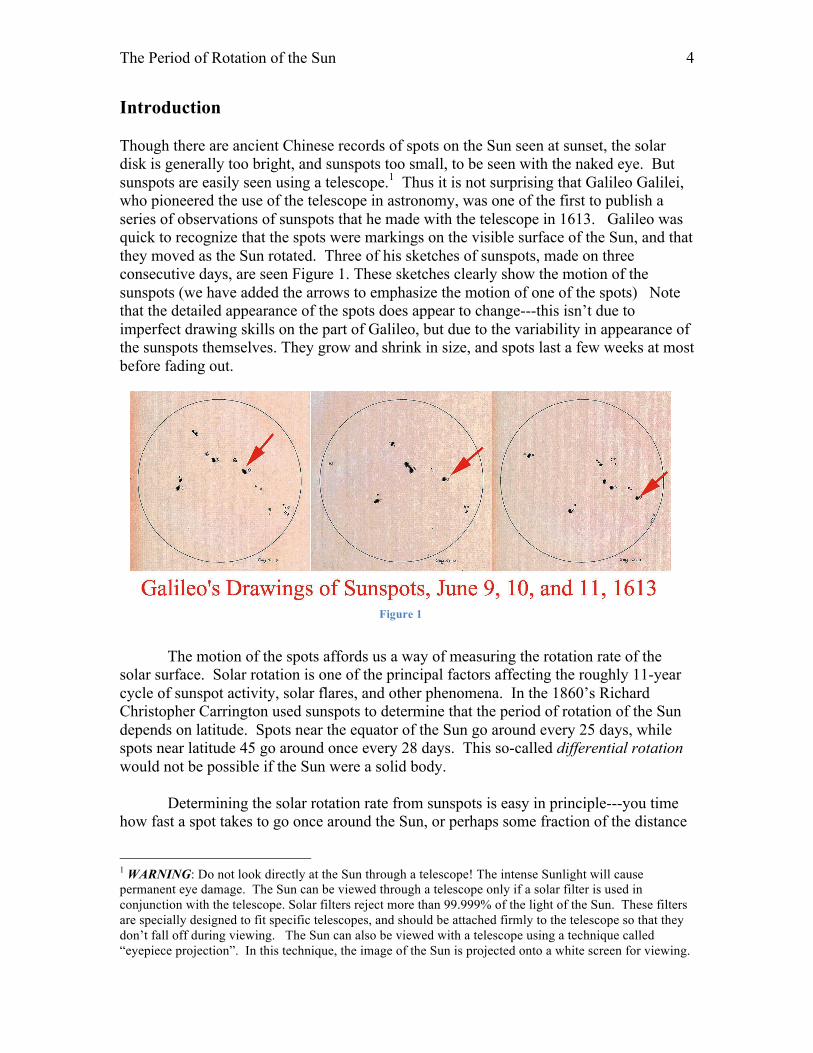
Introduction Though there are ancient Chinese records of spots on the Sun seen at sunset, the solar disk is generally too bright, and sunspots too small, to be seen with the naked eye. But sunspots are easily seen using a telescope.1 Thus it is not surprising that Galileo Galilei, who pioneered the use of the telescope in astronomy, was one of the first to publish a series of observations of sunspots that he made with the telescope in 1613. Galileo was quick to recognize that the spots were markings on the visible surface of the Sun, and that they moved as the Sun rotated. Three of his sketches of sunspots, made on three consecutive days, are seen Figure 1. These sketches clearly show the motion of the sunspots (we have added the arrows to emphasize the motion of one of the spots) Note that the detailed appearance of the spots does appear to change---this isn’t due to imperfect drawing skills on the part of Galileo, but due to the variability in appearance of the sunspots themselves. They grow and shrink in size, and spots last a few weeks at most before fading out.
The motion of the spots affords us a way of measuring the rotation rate of the
solar surface. Solar rotation is one of the principal factors affecting the roughly 11-year cycle of sunspot activity, solar flares, and other phenomena. In the 1860’s Richard Christopher Carrington used sunspots to determine that the period of rotation of the Sun depends on latitude. Spots near the equator of the Sun go around every 25 days, while spots near latitude 45 go around once every 28 days. This so-called differential rotation would not be possible if the Sun were a solid body.
Determining the solar rotation rate from sunspots is easy in principle---you time
how fast a spot takes to go once around the Sun, or perhaps some fraction of the distance
1 WARNING: Do not look directly at the Sun through a telescope! The intense Sunlight will cause permanent eye damage. The Sun can be viewed through a telescope only if a solar filter is used in conjunction with the telescope. Solar filters reject more than 99.999% of the light of the Sun. These filters are specially designed to fit specific telescopes, and should be attached firmly to the telescope so that they don’t fall off during viewing. The Sun can also be viewed with a telescope using a technique called “eyepiece projection”. In this technique, the image of the Sun is projected onto a white screen for viewing.
Figure 1
The Period of Rotation of the Sun 5
around the Sun. However it is difficult to watch the Sun continuously. The Sun is below the horizon about half of the day (except near the poles), and weather often interferes with observations. So in practice, it is rather difficult to get a continuous record of where the spots are day by day.
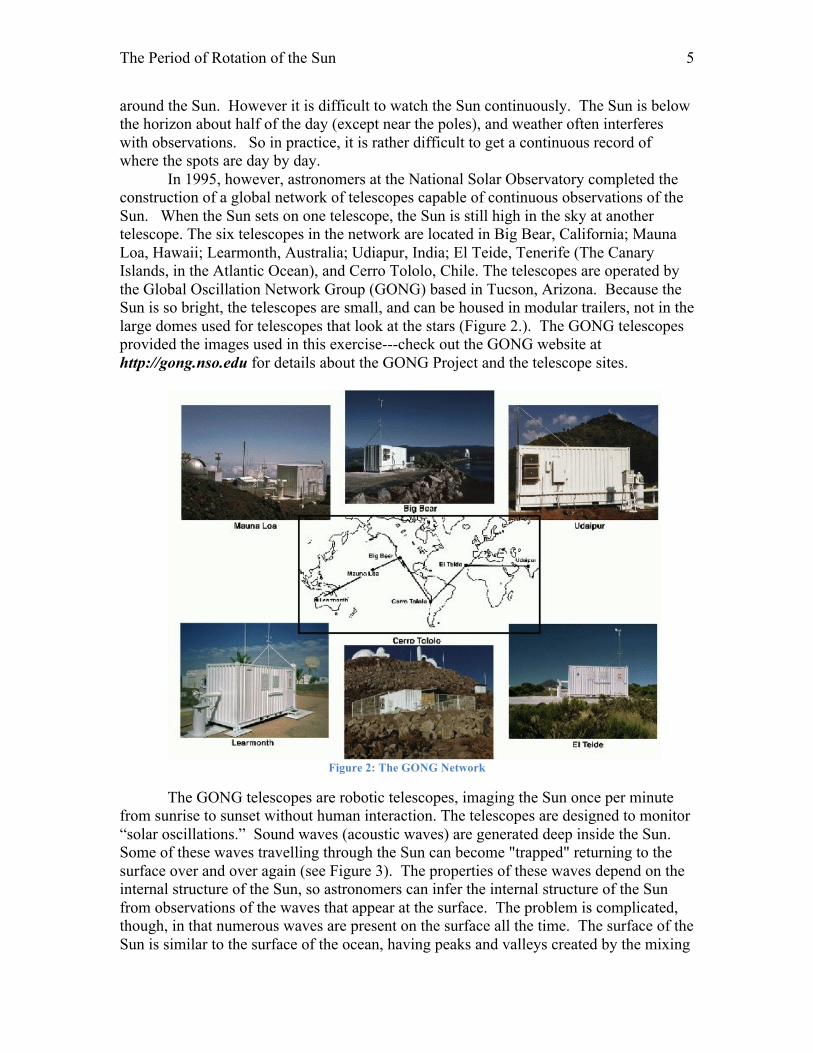
In 1995, however, astronomers at the National Solar Observatory completed the construction of a global network of telescopes capable of continuous observations of the Sun. When the Sun sets on one telescope, the Sun is still high in the sky at another telescope. The six telescopes in the network are located in Big Bear, California; Mauna Loa, Hawaii; Learmonth, Australia; Udiapur, India; El Teide, Tenerife (The Canary Islands, in the Atlantic Ocean), and Cerro Tololo, Chile. The telescopes are operated by the Global Oscillation Network Group (GONG) based in Tucson, Arizona. Because the Sun is so bright, the telescopes are small, and can be housed in modular trailers, not in the large domes used for telescopes that look at the stars (Figure 2.). The GONG telescopes provided the images used in this exercise---check out the GONG website at http://gong.nso.edu for details about the GONG Project and the telescope sites.
Figure 2: The GONG Network
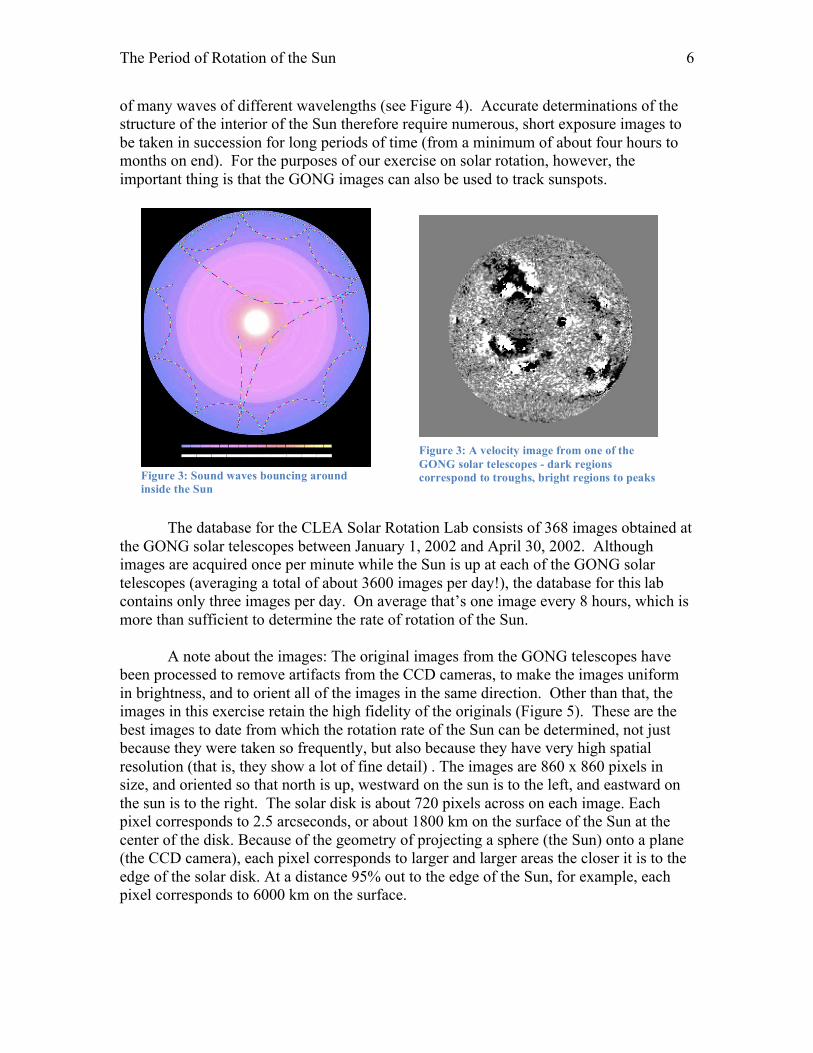
The GONG telescopes are robotic telescopes, imaging the Sun once per minute from sunrise to sunset without human interaction. The telescopes are designed to monitor “solar oscillations.” Sound waves (acoustic waves) are generated deep inside the Sun. Some of these waves travelling through the Sun can become "trapped" returning to the surface over and over again (see Figure 3). The properties of these waves depend on the internal structure of the Sun, so astronomers can infer the internal structure of the Sun from observations of the waves that appear at the surface. The problem is complicated, though, in that numerous waves are present on the surface all the time. The surface of the Sun is similar to the surface of the ocean, having peaks and valleys created by the mixing
The Period of Rotation of the Sun 6
of many waves of different wavelengths (see Figure 4). Accurate determinations of the structure of the interior of the Sun therefore require numerous, short exposure images to be taken in succession for long periods of time (from a minimum of about four hours to months on end). For the purposes of our exercise on solar rotation, however, the important thing is that the GONG images can also be used to track sunspots.
The database for the CLEA Solar Rotation Lab consists of 368 images obtained at
the GONG solar telescopes between January 1, 2002 and April 30, 2002. Although images are acquired once per minute while the Sun is up at each of the GONG solar telescopes (averaging a total of about 3600 images per day!), the database for this lab contains only three images per day. On average that’s one image every 8 hours, which is more than sufficient to determine the rate of rotation of the Sun.
A note about the images: The original images from the GONG telescopes have
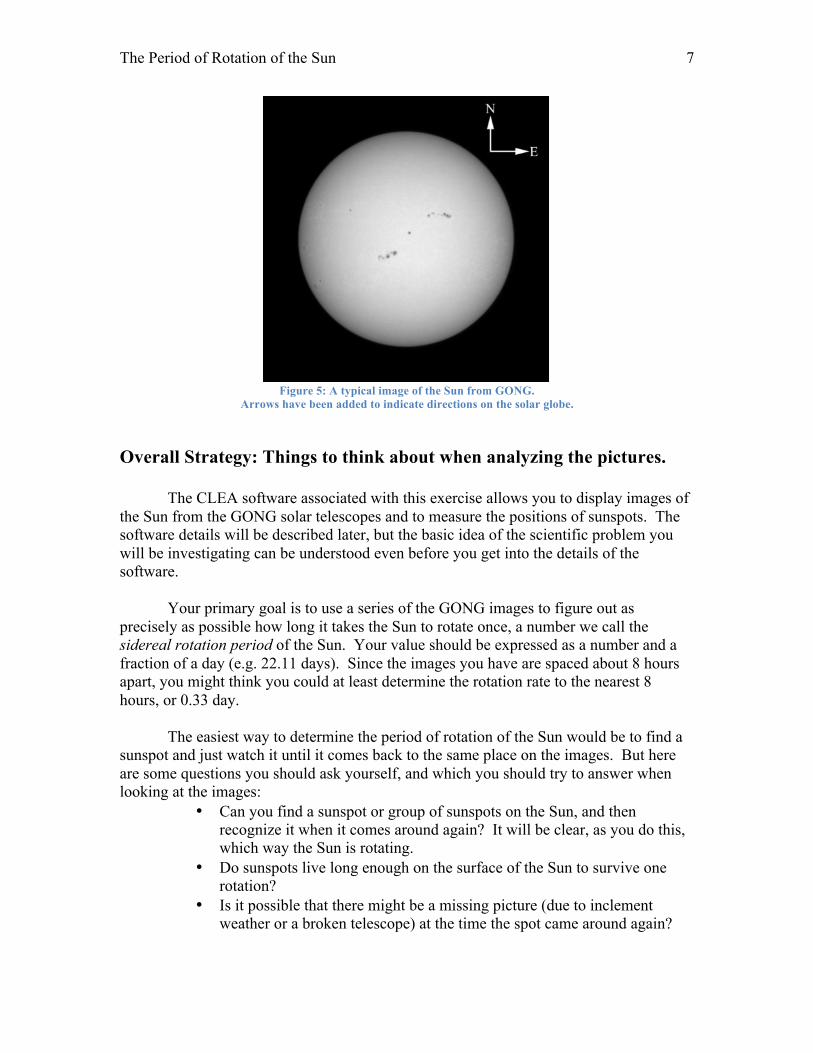
been processed to remove artifacts from the CCD cameras, to make the images uniform in brightness, and to orient all of the images in the same direction. Other than that, the images in this exercise retain the high fidelity of the originals (Figure 5). These are the best images to date from which the rotation rate of the Sun can be determined, not just because they were taken so frequently, but also because they have very high spatial resolution (that is, they show a lot of fine detail) . The images are 860 x 860 pixels in size, and oriented so that north is up, westward on the sun is to the left, and eastward on the sun is to the right. The solar disk is about 720 pixels across on each image. Each pixel corresponds to 2.5 arcseconds, or about 1800 km on the surface of the Sun at the center of the disk. Because of the geometry of projecting a sphere (the Sun) onto a plane (the CCD camera), each pixel corresponds to larger and larger areas the closer it is to the edge of the solar disk. At a distance 95% out to the edge of the Sun, for example, each pixel corresponds to 6000 km on the surface.
Figure 3: Sound waves bouncing around inside the Sun
Figure 3: A velocity image from one of the GONG solar telescopes - dark regions correspond to troughs, bright regions to peaks
The Period of Rotation of the Sun 7
Figure 5: A typical image of the Sun from GONG.
Arrows have been added to indicate directions on the solar globe.
Overall Strategy: Things to think about when analyzing the pictures.
The CLEA software associated with this exercise allows you to display images of the Sun from the GONG solar telescopes and to measure the positions of sunspots. The software details will be described later, but the basic idea of the scientific problem you will be investigating can be understood even before you get into the details of the software.
Your primary goal is to use a series of the GONG images to figure out as
precisely as possible how long it takes the Sun to rotate once, a number we call the sidereal rotation period of the Sun. Your value should be expressed as a number and a fraction of a day (e.g. 22.11 days). Since the images you have are spaced about 8 hours apart, you might think you could at least determine the rotation rate to the nearest 8 hours, or 0.33 day.
The easiest way to determine the period of rotation of the Sun would be to find a
sunspot and just watch it until it comes back to the same place on the images. But here are some questions you should ask yourself, and which you should try to answer when looking at the images:
• Can you find a sunspot or group of sunspots on the Sun, and then recognize it when it comes around again? It will be clear, as you do this, which way the Sun is rotating.
• Do sunspots live long enough on the surface of the Sun to survive one rotation?
• Is it possible that there might be a missing picture (due to inclement weather or a broken telescope) at the time the spot came around again?
The Period of Rotation of the Sun 8
• What if the rotation rate of the Sun isn’t evenly divisible by 8 hours (the average time between the GONG images in the database)? Will the spot return to exactly the same place on the images after one rotation of the Sun?
• Can you think of several strategies that don’t require you to see a sunspot make one complete rotation which you can use to determine how long it takes the Sun to rotate through a full 360 degrees? (Hint: What if you were only able to measure how long it takes to rotate through 30 degrees?)
Calculating the Sidereal Period of Rotation of the Sun From your Measurements The value you determine from Earth-based images of the Sun is what is called the synodic period of rotation. This is the apparent rotation period of the Sun as seen from the Earth, not the “true” rotation period of the Sun because the Earth is in motion, orbiting around the Sun from west to east as the Sun rotates. The “true” rotation period of the Sun, known as the sidereal period of rotation, is the time it takes for a point on the Sun to rotate once with respect to the distant stars. In the time that it takes a point on the Sun to turn 360 degrees with respect to the stars, the Earth will have moved ahead in its orbit. The Sun will have to rotate a little further to catch up to the Earth. Therefore the synodic period is a bit longer than the sidereal period. Fortunately, we can correct for this added time, since we know how fast the earth goes around the Sun (about one revolution every 365.25 days). If P is the sidereal period of rotation in days (this is what you want to determine), and S is the synodic period of rotation of the Sun in days (this is what you have measured), then
Equipment This experiment requires a Windows-based computer, the CLEA program The Period of Rotation of Rotation of the Sun, and a scientific calculator (Windows PCs have a software calculator under Accessories). The program can be accessed from ICS lab computers (running Windows) or it can be downloaded to your personal computer.
P [days] =S[days]× 365.25
S[days] + 365.25

The Period of Rotation of the Sun 9
A User’s guide to The Period of Rotation of the Sun A Program for Displaying and Measuring Sunspots on Solar Images Starting the Program Your computer should be turned on and running Windows. If you are using an ICS lab computer to run the software, click on Class Software>ASTR 150>Period of Rotation of the Sun. When the program starts, the CLEA logo should appear in a window on your screen. Go to the File menu at the top of that window, click on it, and select the Login option from the menu. Fill in the form that appears with your name (and partner’s name, if applicable). Do not use punctuation marks. Press “Tab” to move to the next text block, or click in each text block to enter the next name. Next enter the ICS Lab Computer ID (on a sticker on the computer or the table). Click in appropriate field to correct any errors. When all the information has been entered to your satisfaction, click OK to continue, and click “yes” when asked if you are finished logging in. The opening screen of the Period of Rotation of the Sun lab will then appear. Accessing the HELP Files You may, at any time, select Help from the menu to receive on-line help. Click Help located on the right hand side of the menu bar. Within Help…Topics, there are five options that you can select: Login, Files, Images, Reports, and Close the Program. LogIn informs you of the initial steps required to begin the program. Files provides information on the types of files used in this exercise. Images explains how to retrieve images, make measurements on images, and print images. Help…Topic…Reports shows you how you can review your recorded data. Close the Program gives the procedure on how to exit the program as well as a reminder of any unsaved data. About This Exercise displays the title and version number of the program as well as the copyright information. Loading and Displaying Images
When you first run the program you will see a Main File List area with two
frames, the left labeled Loaded Images List and the right labeled Image Database Directory. Both will be blank. After you load the image database from the File menu, you will see a list of the available GONG images, ordered by date, in the image database window. You can load and display an image in one of two ways. You can right-click on the date of the image you want to display, then select Load Image from the popup box that appears (which also lets you print the list of images or search for a particular date). Or you can simply double-click the left mouse button on the date of the image you want to display.
When you first load an image, its date is also displayed in the Loaded Images List. The last-selected image is automatically displayed in a large popup Image Display window.
You can display any of the images in the Loaded Images List by double clicking on the image date. Or you can use the right mouse button to bring up a pop-up menu
The Period of Rotation of the Sun 10
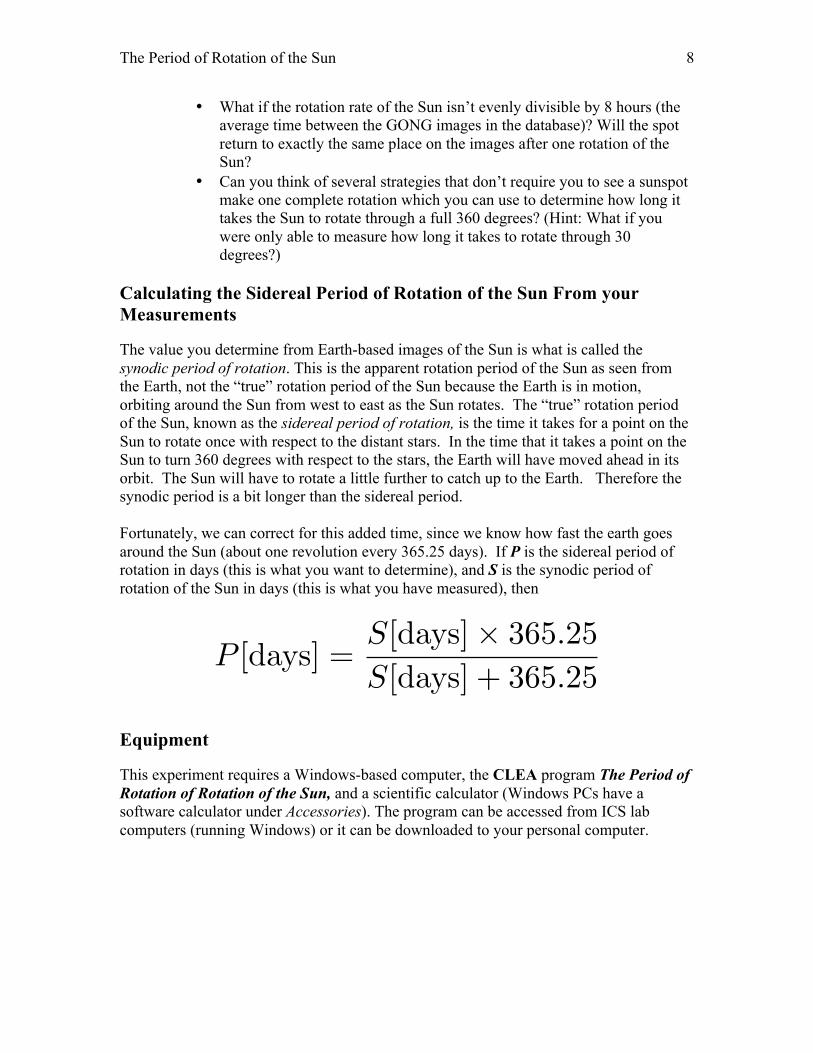
that will allow you to display the image, remove it, or remove all the images currently loaded.
Animating a Series of images
Once you have several images loaded, you can have the program display each one in sequence automatically as an animation. You can do this in either of two ways. 1) On the main menu bar over the list of images, Choose Images → Animate → On. 2) On the menu bar over the image display window, select Animation → On. You can stop the animation using the same menu bars. Measuring the Positions of Spots
The image display permits you to measure the positions of points on the Sun. To start measuring sunspot positions, choose File → Image → Measure from the menu bar at the top of the image display. A small Spot Position window will appear with digits to indicate the position of the cursor in pixels and in apparent heliographic coordinates. The position of the cursor is updated whenever you click the left mouse button, or continuously if you hold the button down. You will also see a small magnification window that shows the area around the cursor (see Figure 7). Pixels are of course just the little blocks that make up the picture, and pixel 0,0 is right in the center of the image. Apparent heliographic coordinates, however, require some explanation.
Figure 6: Main window and image display window
The Period of Rotation of the Sun 11
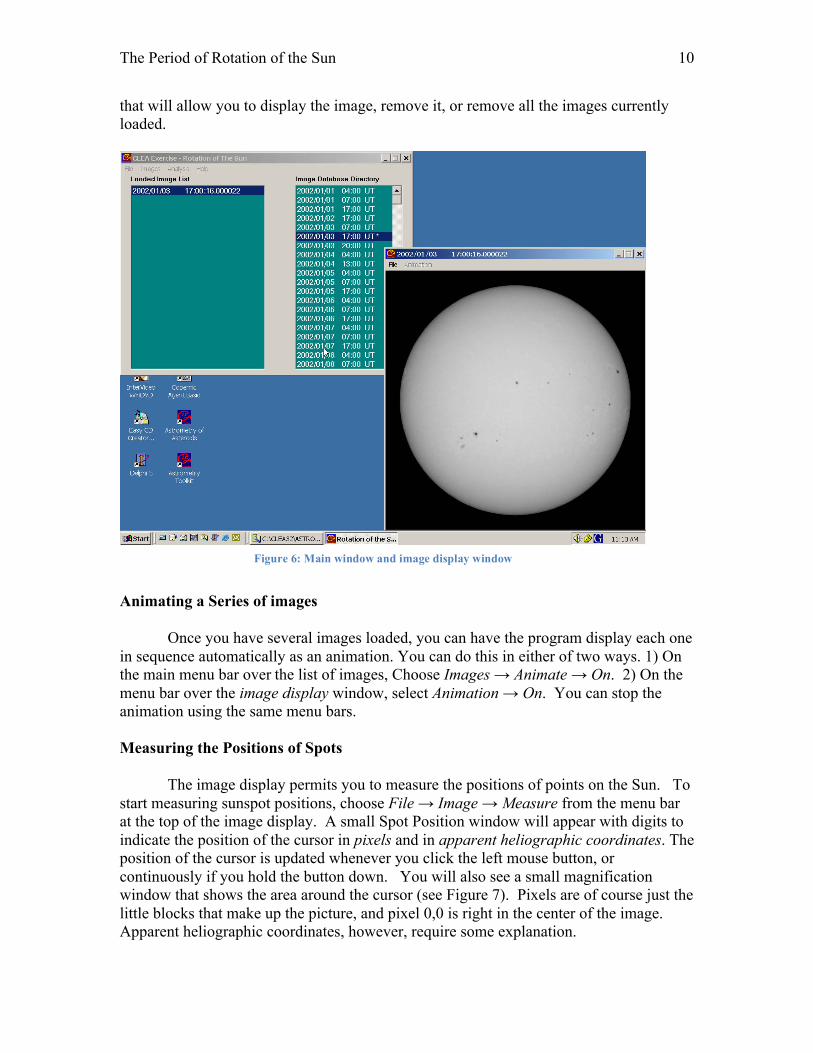
Figure 7: Measuring the positions of sunspots on solar images
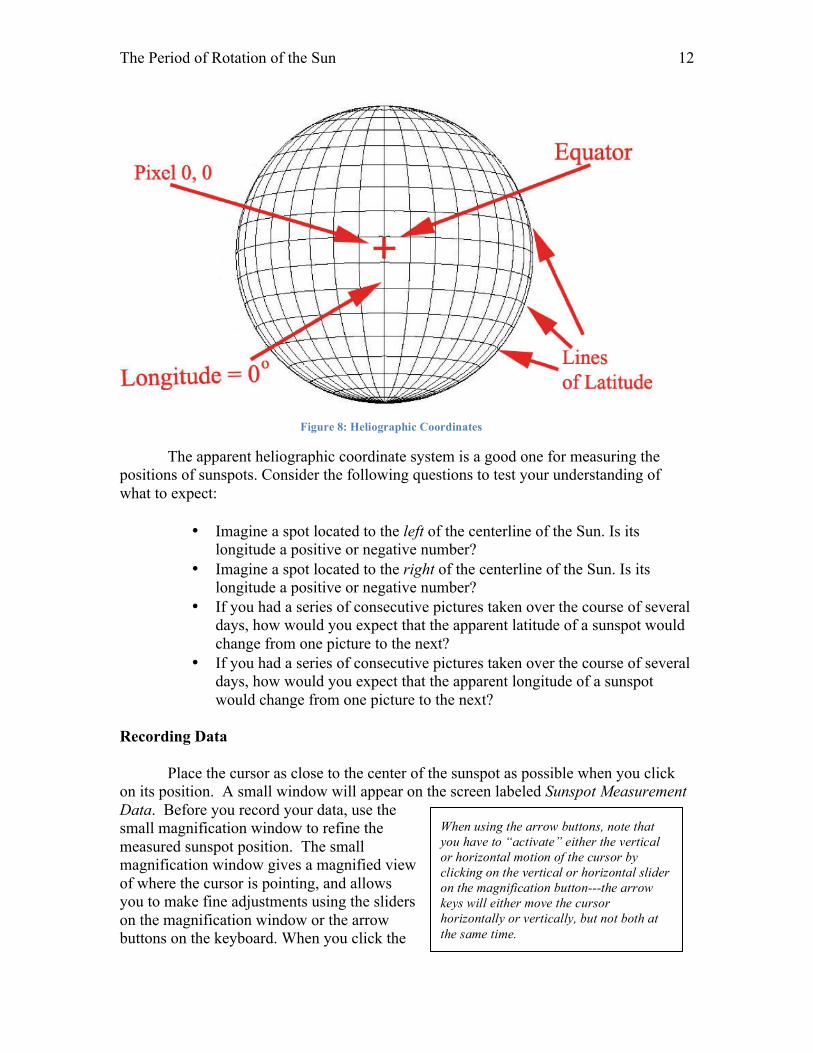
Heliographic coordinates are similar to longitude and latitude on Earth. The poles
of the Sun are at +90˚ (north) latitude and -90˚ (south) latitude. The equator of the Sun is at 0˚ latitude. The 0˚ heliographic longitude line runs right down the middle of the solar disk as you see it, with positive lines of longitude to the right, and negative ones to the left. (see figure 8). ). Unlike longitude lines on the Earth, heliographic longitude lines are not fixed to the surface of the Sun and do not rotate with the Sun! The computer uses the x and y pixel values, plus a little trigonometry, to calculate the apparent heliographic latitude and longitude for the location of the cursor on the image.
There is one complication you might want to note. Even though the center of the
solar disk in every image is at 0˚ longitude, it is not at 0˚ latitude. That is because the axis of rotation of the Sun is tilted by about 7˚ from the plane of the ecliptic (the plane of the orbit of the Earth). At some times during the year the Sun appears tipped away from us, and at other times it appears tipped toward us. Only in June and December do we see the axis at right angles to our line of sight. When measuring positions on the images, you will find that the edge of the Sun is not always ±90° heliographic longitude; this is also a result of the tilt of the solar globe.
The Period of Rotation of the Sun 12
The apparent heliographic coordinate system is a good one for measuring the positions of sunspots. Consider the following questions to test your understanding of what to expect:
• Imagine a spot located to the left of the centerline of the Sun. Is its
longitude a positive or negative number? • Imagine a spot located to the right of the centerline of the Sun. Is its
longitude a positive or negative number? • If you had a series of consecutive pictures taken over the course of several
days, how would you expect that the apparent latitude of a sunspot would change from one picture to the next?
• If you had a series of consecutive pictures taken over the course of several days, how would you expect that the apparent longitude of a sunspot would change from one picture to the next?
Recording Data
Place the cursor as close to the center of the sunspot as possible when you click
on its position. A small window will appear on the screen labeled Sunspot Measurement Data. Before you record your data, use the small magnification window to refine the measured sunspot position. The small magnification window gives a magnified view of where the cursor is pointing, and allows you to make fine adjustments using the sliders on the magnification window or the arrow buttons on the keyboard. When you click the
When using the arrow buttons, note that you have to “activate” either the vertical or horizontal motion of the cursor by clicking on the vertical or horizontal slider on the magnification button---the arrow keys will either move the cursor horizontally or vertically, but not both at the same time.
Figure 8: Heliographic Coordinates
The Period of Rotation of the Sun 13
“record” button, the image date and time and the position of the cursor are written to a data file.
There’s also a space in the Sunspot Measurement Data window to write in a letter
or number or name that identifies a particular sunspot. Of course if you’re going to be measuring the same spot on several images, be sure to use the same identification on each picture. Seeing a Table of Recorded Data
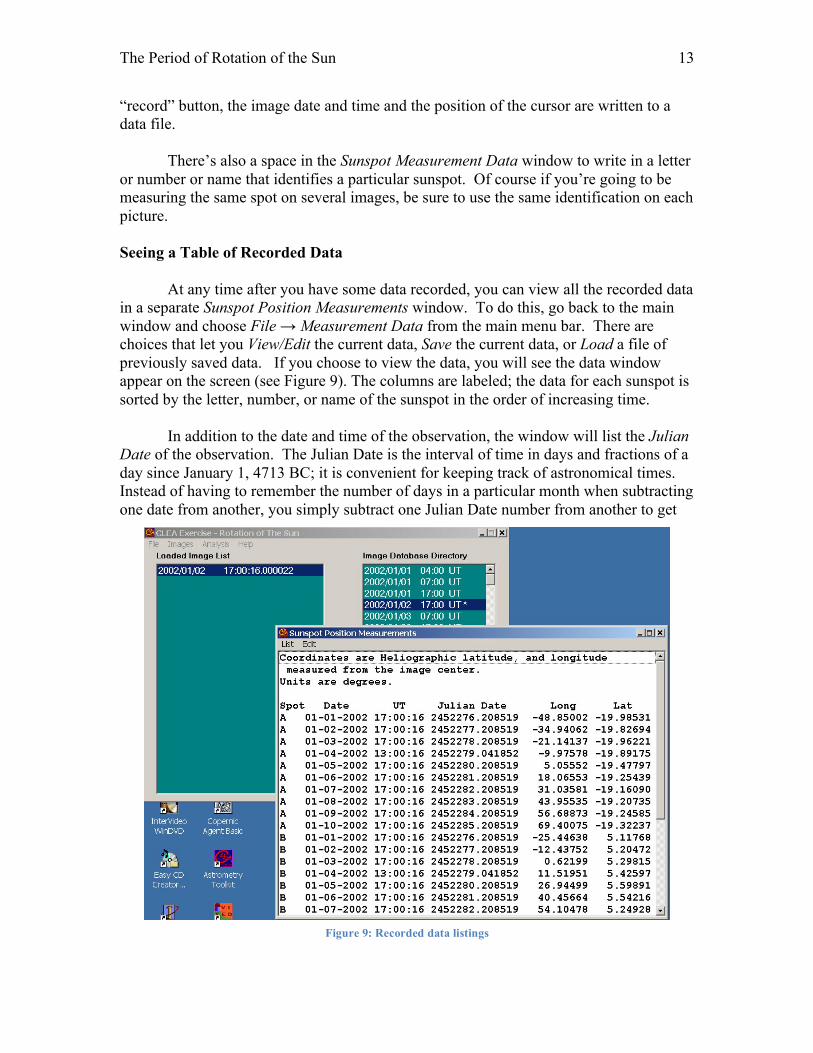
At any time after you have some data recorded, you can view all the recorded data
in a separate Sunspot Position Measurements window. To do this, go back to the main window and choose File → Measurement Data from the main menu bar. There are choices that let you View/Edit the current data, Save the current data, or Load a file of previously saved data. If you choose to view the data, you will see the data window appear on the screen (see Figure 9). The columns are labeled; the data for each sunspot is sorted by the letter, number, or name of the sunspot in the order of increasing time.
In addition to the date and time of the observation, the window will list the Julian
Date of the observation. The Julian Date is the interval of time in days and fractions of a day since January 1, 4713 BC; it is convenient for keeping track of astronomical times. Instead of having to remember the number of days in a particular month when subtracting one date from another, you simply subtract one Julian Date number from another to get
Figure 9: Recorded data listings
The Period of Rotation of the Sun 14
the number of days between two observations. A Julian Date begins at Noon, Universal Time; 0.5 day, of course, is 12 hours; each 0.0001 day is about 8 seconds.
You can print the data in the Sunspot Position Measurements window by
choosing List → Print from the menu bar. You can edit individual entries (if you made a mistake in entering data) by right-clicking the mouse on the line you want to edit. You can delete a line by selecting it and then choosing Edit → Delete Selected Measurement from the menu bar. Plotting Latitudes and Longitudes of Spots versus Time
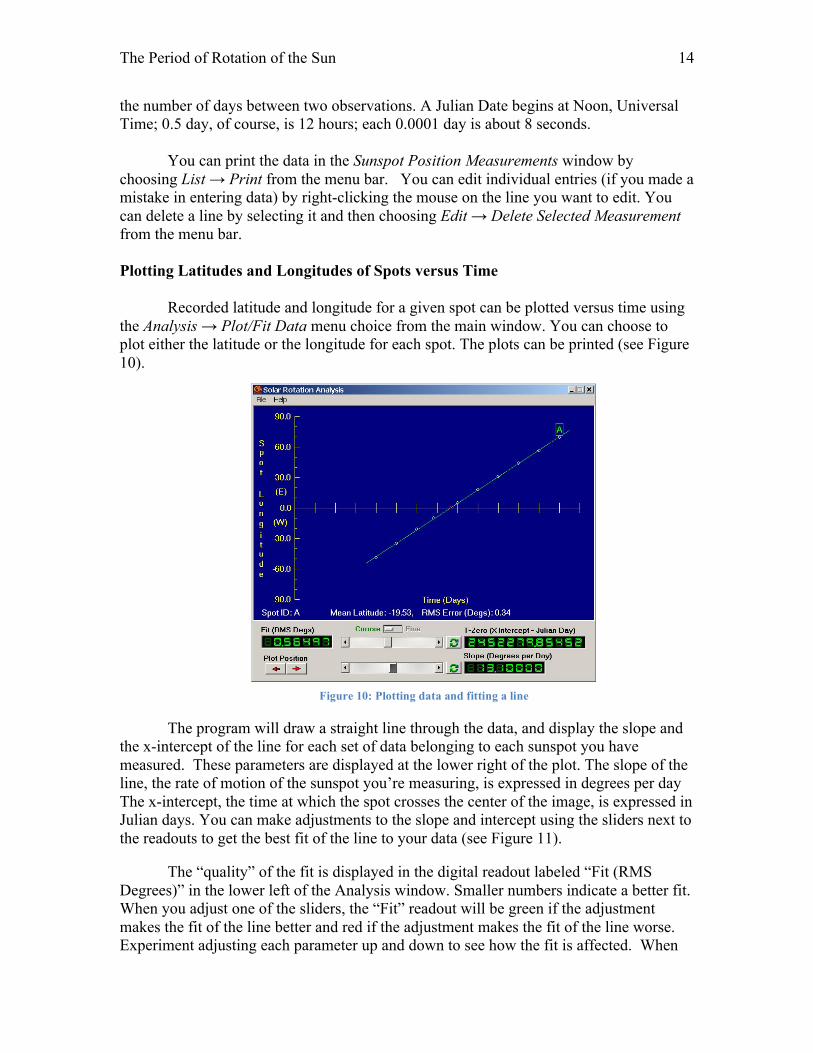
Recorded latitude and longitude for a given spot can be plotted versus time using
the Analysis → Plot/Fit Data menu choice from the main window. You can choose to plot either the latitude or the longitude for each spot. The plots can be printed (see Figure 10).
The program will draw a straight line through the data, and display the slope and the x-intercept of the line for each set of data belonging to each sunspot you have measured. These parameters are displayed at the lower right of the plot. The slope of the line, the rate of motion of the sunspot you’re measuring, is expressed in degrees per day The x-intercept, the time at which the spot crosses the center of the image, is expressed in Julian days. You can make adjustments to the slope and intercept using the sliders next to the readouts to get the best fit of the line to your data (see Figure 11).
The “quality” of the fit is displayed in the digital readout labeled “Fit (RMS
Degrees)” in the lower left of the Analysis window. Smaller numbers indicate a better fit. When you adjust one of the sliders, the “Fit” readout will be green if the adjustment makes the fit of the line better and red if the adjustment makes the fit of the line worse. Experiment adjusting each parameter up and down to see how the fit is affected. When
Figure 10: Plotting data and fitting a line
The Period of Rotation of the Sun 15
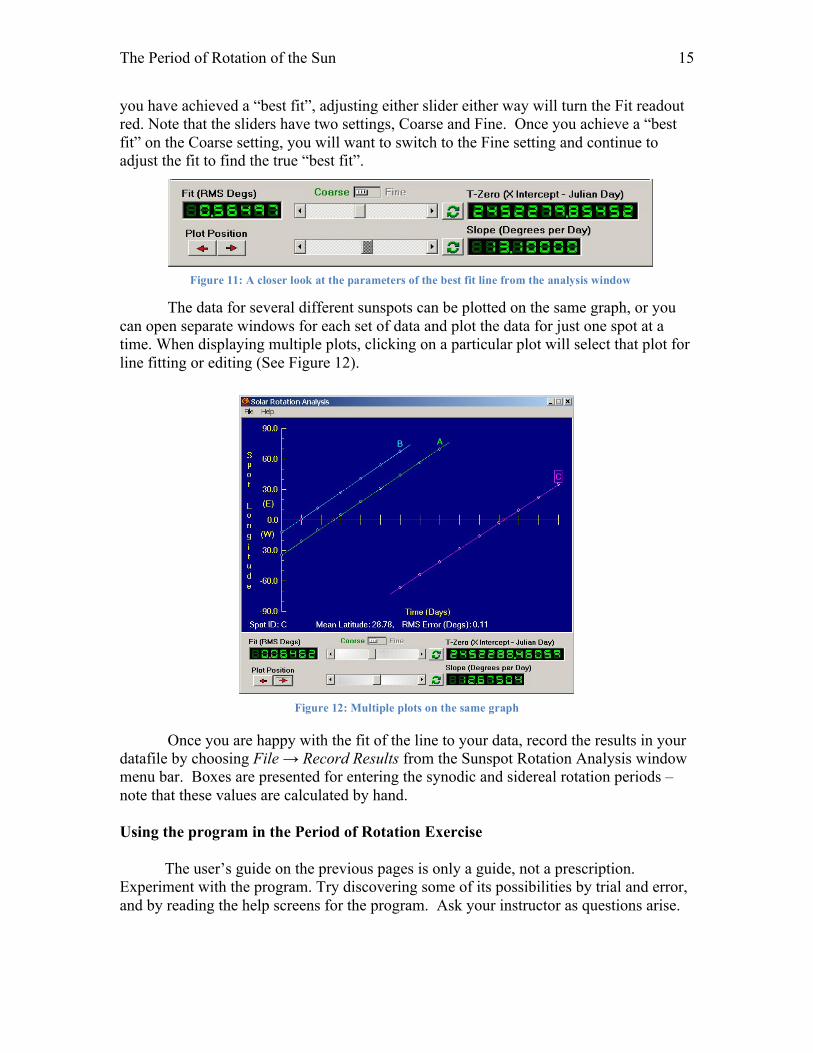
you have achieved a “best fit”, adjusting either slider either way will turn the Fit readout red. Note that the sliders have two settings, Coarse and Fine. Once you achieve a “best fit” on the Coarse setting, you will want to switch to the Fine setting and continue to adjust the fit to find the true “best fit”.
The data for several different sunspots can be plotted on the same graph, or you can open separate windows for each set of data and plot the data for just one spot at a time. When displaying multiple plots, clicking on a particular plot will select that plot for line fitting or editing (See Figure 12).
Once you are happy with the fit of the line to your data, record the results in your datafile by choosing File → Record Results from the Sunspot Rotation Analysis window menu bar. Boxes are presented for entering the synodic and sidereal rotation periods – note that these values are calculated by hand.
Using the program in the Period of Rotation Exercise
The user’s guide on the previous pages is only a guide, not a prescription. Experiment with the program. Try discovering some of its possibilities by trial and error, and by reading the help screens for the program. Ask your instructor as questions arise.
Figure 12: Multiple plots on the same graph
Figure 11: A closer look at the parameters of the best fit line from the analysis window
The Period of Rotation of the Sun 16
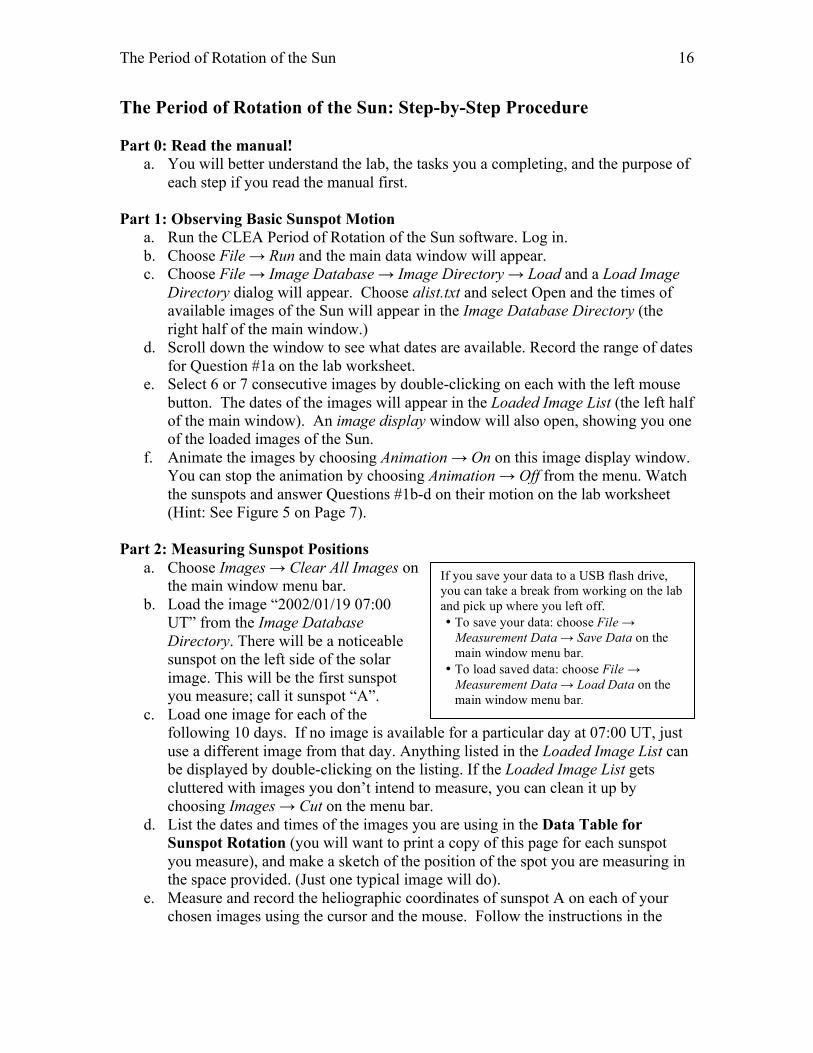
The Period of Rotation of the Sun: Step-by-Step Procedure Part 0: Read the manual!
a. You will better understand the lab, the tasks you a completing, and the purpose of each step if you read the manual first.
Part 1: Observing Basic Sunspot Motion
a. Run the CLEA Period of Rotation of the Sun software. Log in. b. Choose File → Run and the main data window will appear. c. Choose File → Image Database → Image Directory → Load and a Load Image
Directory dialog will appear. Choose alist.txt and select Open and the times of available images of the Sun will appear in the Image Database Directory (the right half of the main window.)
d. Scroll down the window to see what dates are available. Record the range of dates for Question #1a on the lab worksheet.
e. Select 6 or 7 consecutive images by double-clicking on each with the left mouse button. The dates of the images will appear in the Loaded Image List (the left half of the main window). An image display window will also open, showing you one of the loaded images of the Sun.
f. Animate the images by choosing Animation → On on this image display window. You can stop the animation by choosing Animation → Off from the menu. Watch the sunspots and answer Questions #1b-d on their motion on the lab worksheet (Hint: See Figure 5 on Page 7).
Part 2: Measuring Sunspot Positions
a. Choose Images → Clear All Images on the main window menu bar.
b. Load the image “2002/01/19 07:00 UT” from the Image Database Directory. There will be a noticeable sunspot on the left side of the solar image. This will be the first sunspot you measure; call it sunspot “A”.
c. Load one image for each of the following 10 days. If no image is available for a particular day at 07:00 UT, just use a different image from that day. Anything listed in the Loaded Image List can be displayed by double-clicking on the listing. If the Loaded Image List gets cluttered with images you don’t intend to measure, you can clean it up by choosing Images → Cut on the menu bar.
d. List the dates and times of the images you are using in the Data Table for Sunspot Rotation (you will want to print a copy of this page for each sunspot you measure), and make a sketch of the position of the spot you are measuring in the space provided. (Just one typical image will do).
e. Measure and record the heliographic coordinates of sunspot A on each of your chosen images using the cursor and the mouse. Follow the instructions in the
If you save your data to a USB flash drive, you can take a break from working on the lab and pick up where you left off. • To save your data: choose File →
Measurement Data → Save Data on the main window menu bar.
• To load saved data: choose File → Measurement Data → Load Data on the main window menu bar.
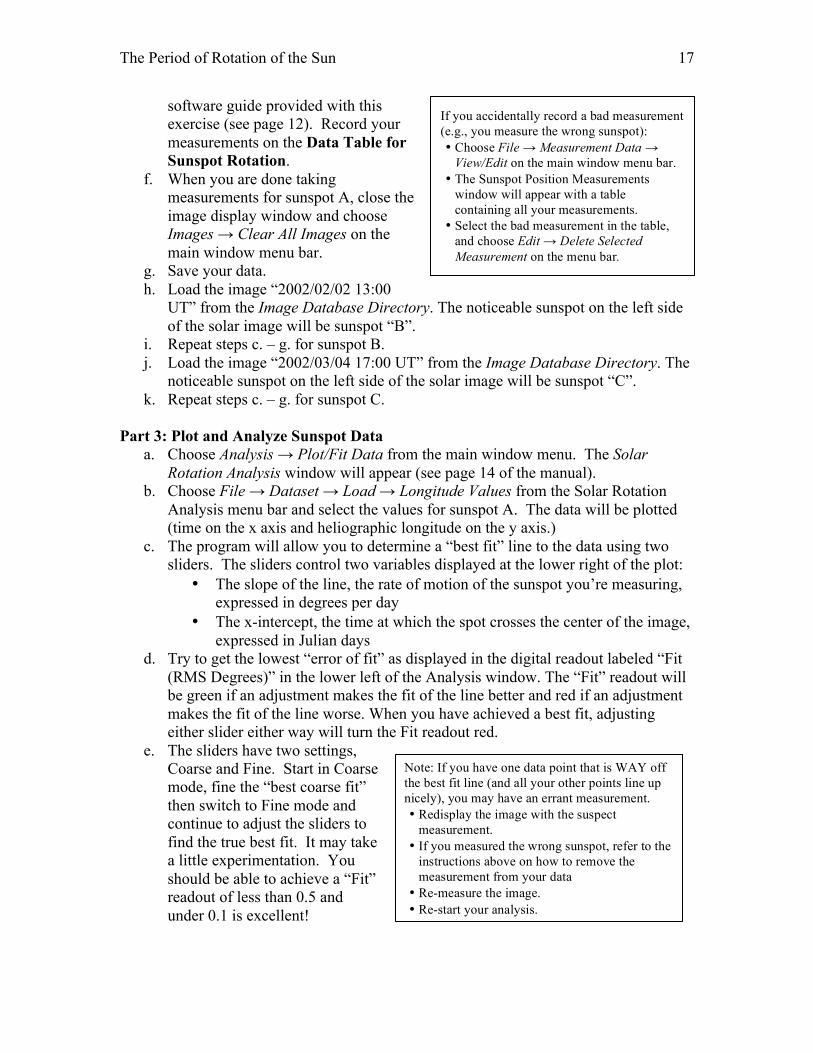
The Period of Rotation of the Sun 17
software guide provided with this exercise (see page 12). Record your measurements on the Data Table for Sunspot Rotation.
f. When you are done taking measurements for sunspot A, close the image display window and choose Images → Clear All Images on the main window menu bar.
g. Save your data. h. Load the image “2002/02/02 13:00
UT” from the Image Database Directory. The noticeable sunspot on the left side of the solar image will be sunspot “B”.
i. Repeat steps c. – g. for sunspot B. j. Load the image “2002/03/04 17:00 UT” from the Image Database Directory. The
noticeable sunspot on the left side of the solar image will be sunspot “C”. k. Repeat steps c. – g. for sunspot C.
Part 3: Plot and Analyze Sunspot Data
a. Choose Analysis → Plot/Fit Data from the main window menu. The Solar Rotation Analysis window will appear (see page 14 of the manual).
b. Choose File → Dataset → Load → Longitude Values from the Solar Rotation Analysis menu bar and select the values for sunspot A. The data will be plotted (time on the x axis and heliographic longitude on the y axis.)
c. The program will allow you to determine a “best fit” line to the data using two sliders. The sliders control two variables displayed at the lower right of the plot:
• The slope of the line, the rate of motion of the sunspot you’re measuring, expressed in degrees per day
• The x-intercept, the time at which the spot crosses the center of the image, expressed in Julian days
d. Try to get the lowest “error of fit” as displayed in the digital readout labeled “Fit (RMS Degrees)” in the lower left of the Analysis window. The “Fit” readout will be green if an adjustment makes the fit of the line better and red if an adjustment makes the fit of the line worse. When you have achieved a best fit, adjusting either slider either way will turn the Fit readout red.
e. The sliders have two settings, Coarse and Fine. Start in Coarse mode, fine the “best coarse fit” then switch to Fine mode and continue to adjust the sliders to find the true best fit. It may take a little experimentation. You should be able to achieve a “Fit” readout of less than 0.5 and under 0.1 is excellent!
If you accidentally record a bad measurement (e.g., you measure the wrong sunspot): • Choose File → Measurement Data →
View/Edit on the main window menu bar. • The Sunspot Position Measurements
window will appear with a table containing all your measurements.
• Select the bad measurement in the table, and choose Edit → Delete Selected Measurement on the menu bar.
Note: If you have one data point that is WAY off the best fit line (and all your other points line up nicely), you may have an errant measurement. • Redisplay the image with the suspect
measurement. • If you measured the wrong sunspot, refer to the
instructions above on how to remove the measurement from your data
• Re-measure the image. • Re-start your analysis.
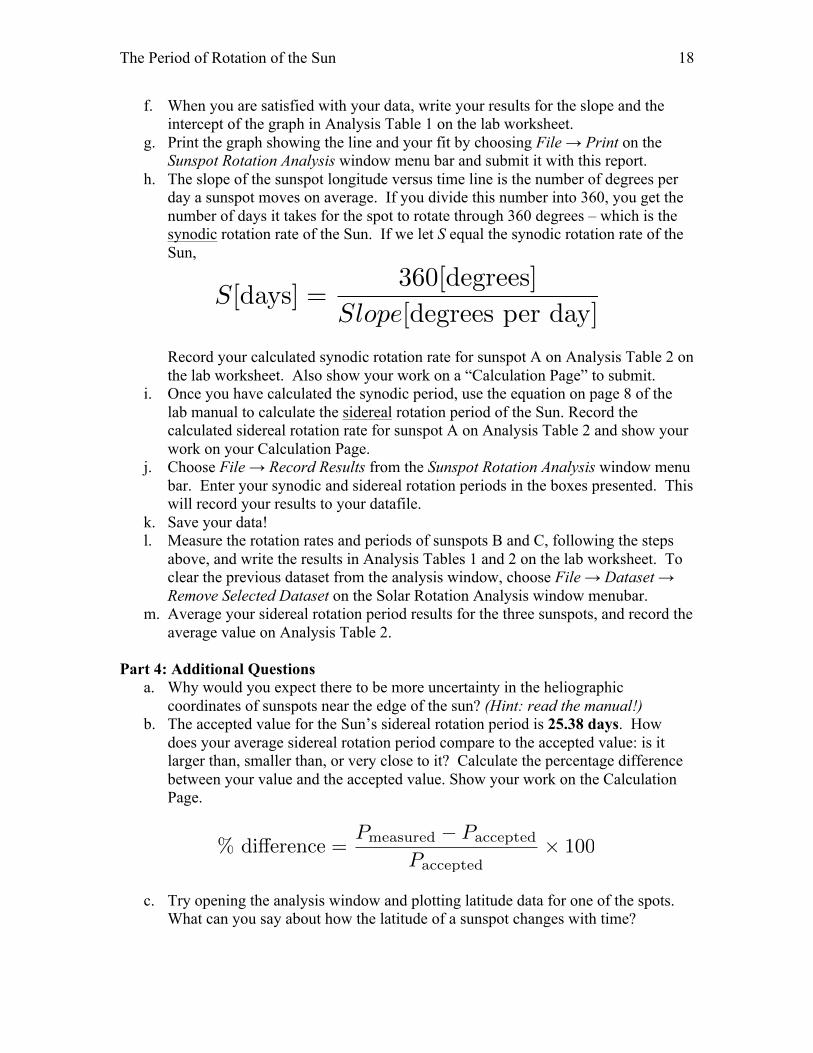
The Period of Rotation of the Sun 18
f. When you are satisfied with your data, write your results for the slope and the intercept of the graph in Analysis Table 1 on the lab worksheet.
g. Print the graph showing the line and your fit by choosing File → Print on the Sunspot Rotation Analysis window menu bar and submit it with this report.
h. The slope of the sunspot longitude versus time line is the number of degrees per day a sunspot moves on average. If you divide this number into 360, you get the number of days it takes for the spot to rotate through 360 degrees – which is the synodic rotation rate of the Sun. If we let S equal the synodic rotation rate of the Sun,
Record your calculated synodic rotation rate for sunspot A on Analysis Table 2 on the lab worksheet. Also show your work on a “Calculation Page” to submit.
i. Once you have calculated the synodic period, use the equation on page 8 of the lab manual to calculate the sidereal rotation period of the Sun. Record the calculated sidereal rotation rate for sunspot A on Analysis Table 2 and show your work on your Calculation Page.
j. Choose File → Record Results from the Sunspot Rotation Analysis window menu bar. Enter your synodic and sidereal rotation periods in the boxes presented. This will record your results to your datafile.
k. Save your data! l. Measure the rotation rates and periods of sunspots B and C, following the steps
above, and write the results in Analysis Tables 1 and 2 on the lab worksheet. To clear the previous dataset from the analysis window, choose File → Dataset → Remove Selected Dataset on the Solar Rotation Analysis window menubar.
m. Average your sidereal rotation period results for the three sunspots, and record the average value on Analysis Table 2.
Part 4: Additional Questions
a. Why would you expect there to be more uncertainty in the heliographic coordinates of sunspots near the edge of the sun? (Hint: read the manual!)
b. The accepted value for the Sun’s sidereal rotation period is 25.38 days. How does your average sidereal rotation period compare to the accepted value: is it larger than, smaller than, or very close to it? Calculate the percentage difference between your value and the accepted value. Show your work on the Calculation Page.
c. Try opening the analysis window and plotting latitude data for one of the spots. What can you say about how the latitude of a sunspot changes with time?
% difference =Pmeasured − Paccepted
Paccepted× 100
S[days] =360[degrees]
Slope[degrees per day]

The Period of Rotation of the Sun 19
Extra Credit! It is possible to demonstrate that the surface of the Sun doesn’t rotate like a solid body, but has differential rotation. You will need to select sunspots at different latitudes for this investigation.
a. From the main window, choose Analysis → Results List. For each sunspot, there will be table entries for Sidereal Rotation Period (that you entered) and Mean Lat(itude). Note that sunspots A, B, and C are all close to the Sun’s equator (-10 < Latitude < +10). Choose the one closest to the equator (Mean Latitude closest to 0) and record its Mean Latitude and Sidereal Rotation Period on the Extra Credit Analysis Table on the lab worksheet.
b. Search through the sun images to find two sunspot latitudes are further from the equator. One should be between 10 to 20 degrees latitude (or -10 to -20 degrees latitude), this will be sunspot “D”. The other should be over 20 degrees latitude (or under -20 degrees), this will be sunspot “E”.
c. Using the procedures above, determine the sidereal rotation periods for sunspots D and E. Record the date range of the used for each sunspot (i.e., first date to last date), mean latitudes and sidereal rotation periods on the Extra Credit Analysis Table.
d. How does the Sun’s rotation period change with latitude? Is it faster or slower at the equator than at higher latitudes?
What to turn in
❏ Lab worksheet (pages 20-21 of this manual) ❏ Data Tables for Sunspot Rotation (3; one for each sunspot; page 22 of this
manual) ❏ Sunspot Rotation Analysis Plots (3; one for each sunspot) ❏ Calculation Page (1 page, or more as needed)
The Period of Rotation of the Sun 20
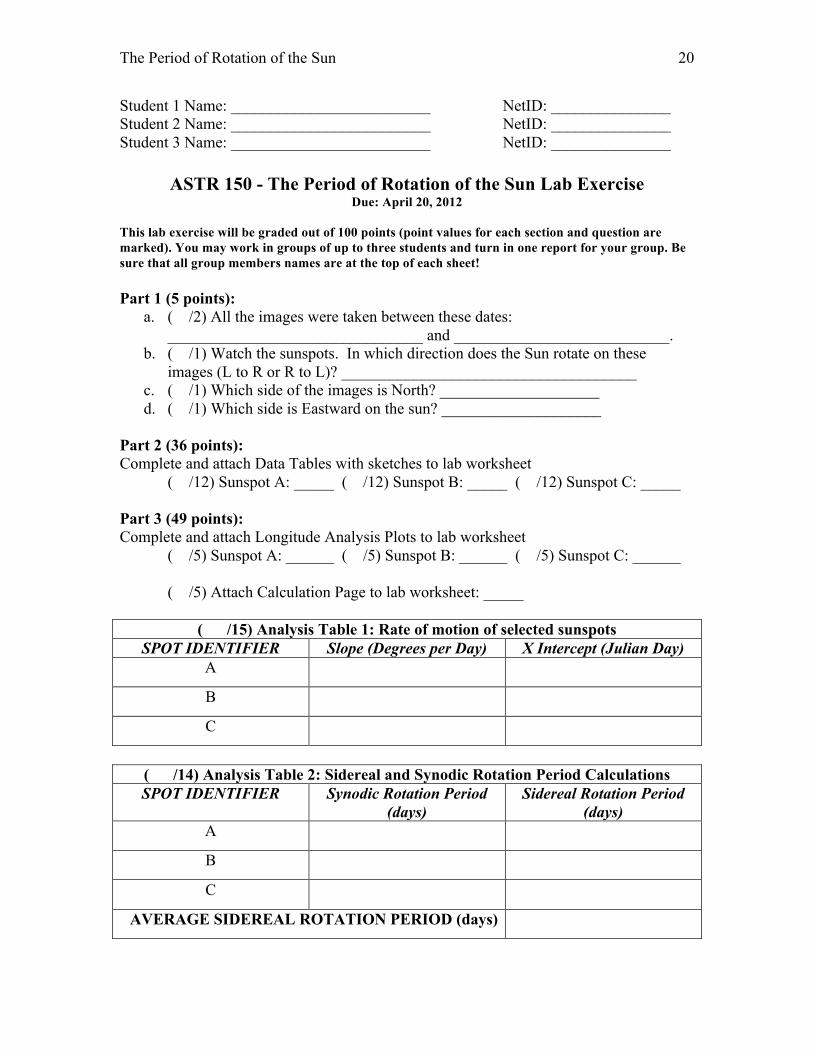
Student 1 Name: _________________________ NetID: _______________ Student 2 Name: _________________________ NetID: _______________ Student 3 Name: _________________________ NetID: _______________
ASTR 150 - The Period of Rotation of the Sun Lab Exercise Due: April 20, 2012
This lab exercise will be graded out of 100 points (point values for each section and question are marked). You may work in groups of up to three students and turn in one report for your group. Be sure that all group members names are at the top of each sheet! Part 1 (5 points):
a. ( /2) All the images were taken between these dates: ________________________________ and ___________________________.
b. ( /1) Watch the sunspots. In which direction does the Sun rotate on these images (L to R or R to L)? _____________________________________
c. ( /1) Which side of the images is North? ____________________ d. ( /1) Which side is Eastward on the sun? ____________________
Part 2 (36 points): Complete and attach Data Tables with sketches to lab worksheet
( /12) Sunspot A: _____ ( /12) Sunspot B: _____ ( /12) Sunspot C: _____ Part 3 (49 points): Complete and attach Longitude Analysis Plots to lab worksheet
( /5) Sunspot A: ______ ( /5) Sunspot B: ______ ( /5) Sunspot C: ______
( /5) Attach Calculation Page to lab worksheet: _____
( /15) Analysis Table 1: Rate of motion of selected sunspots SPOT IDENTIFIER Slope (Degrees per Day) X Intercept (Julian Day)
A
B
C
( /14) Analysis Table 2: Sidereal and Synodic Rotation Period Calculations SPOT IDENTIFIER Synodic Rotation Period
(days) Sidereal Rotation Period
(days) A
B
C
AVERAGE SIDEREAL ROTATION PERIOD (days)

The Period of Rotation of the Sun 21
Part 4 (10 points): a. ( /3) Why would you expect there to be more uncertainty in the heliographic
coordinates of sunspots near the edge of the sun?
b. ( /2) How does your average sidereal rotation period compare to the accepted value: is it larger than, smaller than, or very close to it? ( /2) Calculate the percentage difference between your value and the accepted value.
c. ( /3) What can you say about how the latitude of a sunspot changes with time?
Extra Credit (10 points):
( /8) Extra Credit Analysis Table: Sidereal Period and Latitude SPOT IDENTIFIER Date range of observations
(YYYY-MM-DD) Mean
Latitude (degrees)
Sidereal Rotation
Period (days) (Enter A, B, or C):
D
E
( /2) How does the Sun’s rotation period change with latitude: is it faster or slower at the equator than at higher latitudes?

The Period of Rotation of the Sun 22
The Period of Rotation of the Sun 23
Now
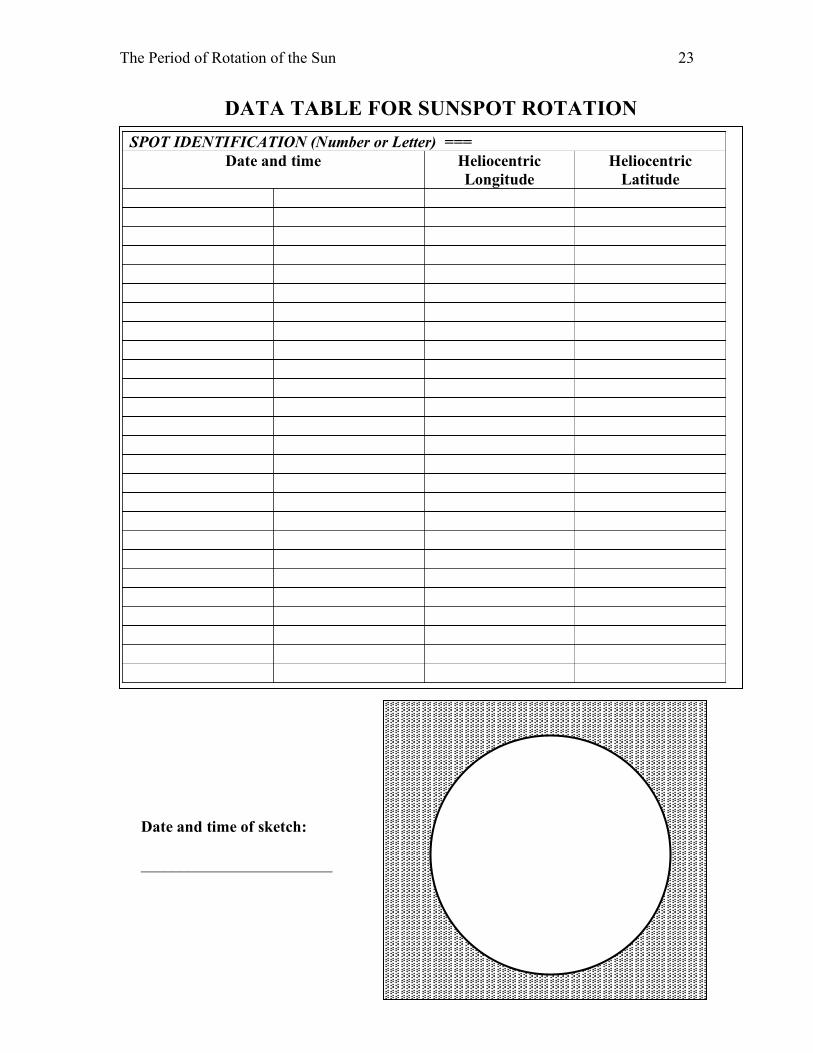
DATA TABLE FOR SUNSPOT ROTATION SPOT IDENTIFICATION (Number or Letter) ===
Date and time Heliocentric Longitude
Heliocentric Latitude
Date and time of sketch: ________________________