Embed Size (px)
Citation preview
Republic of the Philippines
Philippine Statistics Authority
ESA/STAT/AC.320/28 Expert Group Mee6ng on Data Disaggrega6on 27-‐29 June 2016 New York
The Philippine Statistics Authority (PSA) Small Area Poverty Estimation Project By Bernadette Balamban
Republic of the Philippines
Philippine Statistics Authority
The Philippine Statistics Authority (PSA) Small Area Poverty Estimation Project
Expert Group Meeting on Data Disaggregation June 27-29, 2016, New York City
Republic of the Philippines
Philippine Statistics Authority
3
Outline of Presentation
I. Introduction II. Methodology III. Some Results IV. Actual Policy Uses V. Next Steps
Republic of the Philippines
Philippine Statistics Authority
4
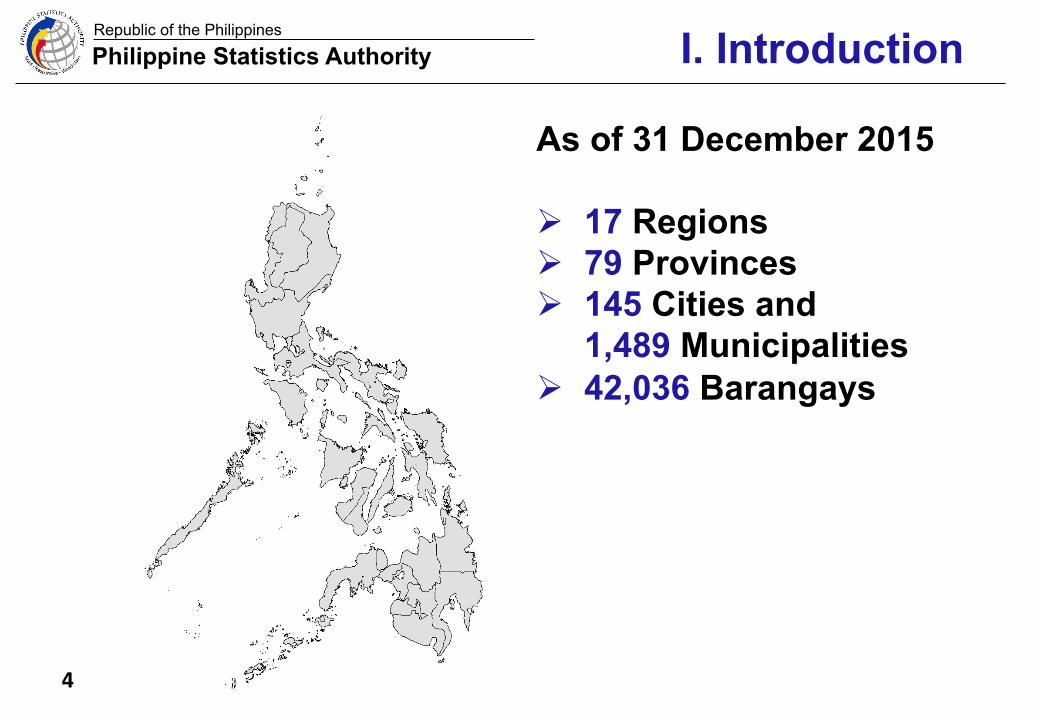
As of 31 December 2015 Ø 17 Regions Ø 79 Provinces Ø 145 Cities and
1,489 Municipalities Ø 42,036 Barangays
I. Introduction
Republic of the Philippines
Philippine Statistics Authority
5
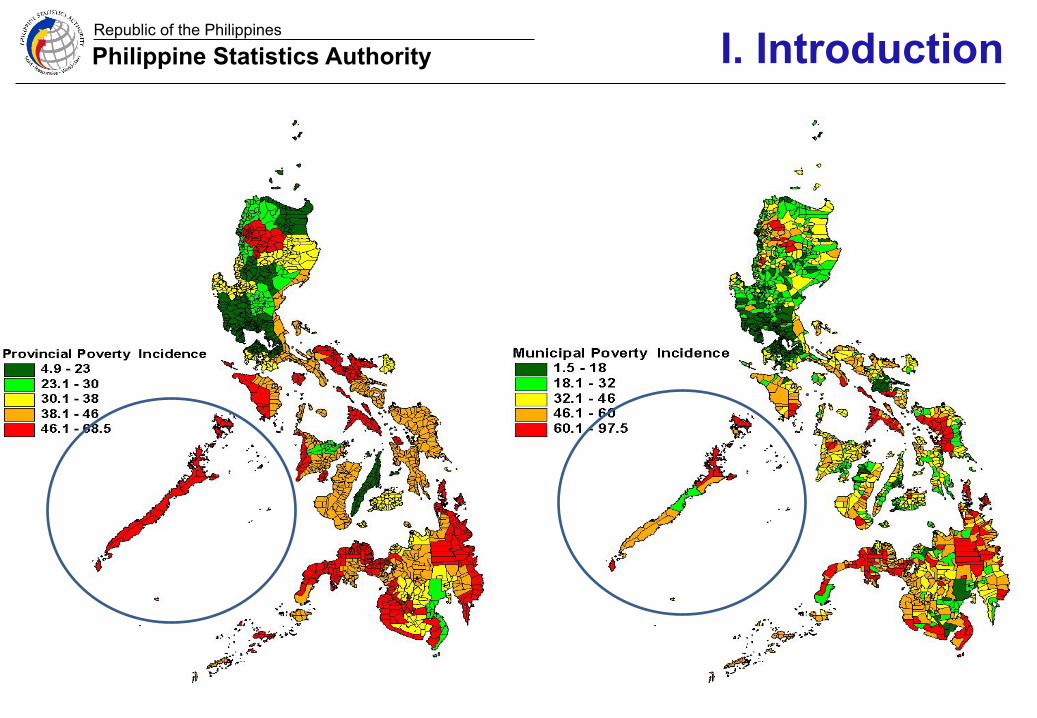
• Official poverty statistics in the Philippines are available at the national, regional and provincial levels. This are directly estimated from the Family Income and Expenditure Survey (FIES).
• However, more geographically disaggregated statistics are needed to make better decisions.
• Thus, there is a strong clamor from policymakers and program implementers for information on smaller domains like the cities and municipalities, specially for poverty statistics.
I. Introduction
Republic of the Philippines
Philippine Statistics Authority
6
I. Introduction
Republic of the Philippines
Philippine Statistics Authority
7
• Small Area Estimation could be used to target the municipalities and cities were most of the poor are found. The smaller the area, the better is the targeting.
• Given limited resources, local government officials, as well as those in the national government, would like to know how they can best allocate resources, which area needs to be prioritized.
• Programs could be better monitored if the estimates were made in smaller domains.
I. Introduction
Republic of the Philippines
Philippine Statistics Authority
8
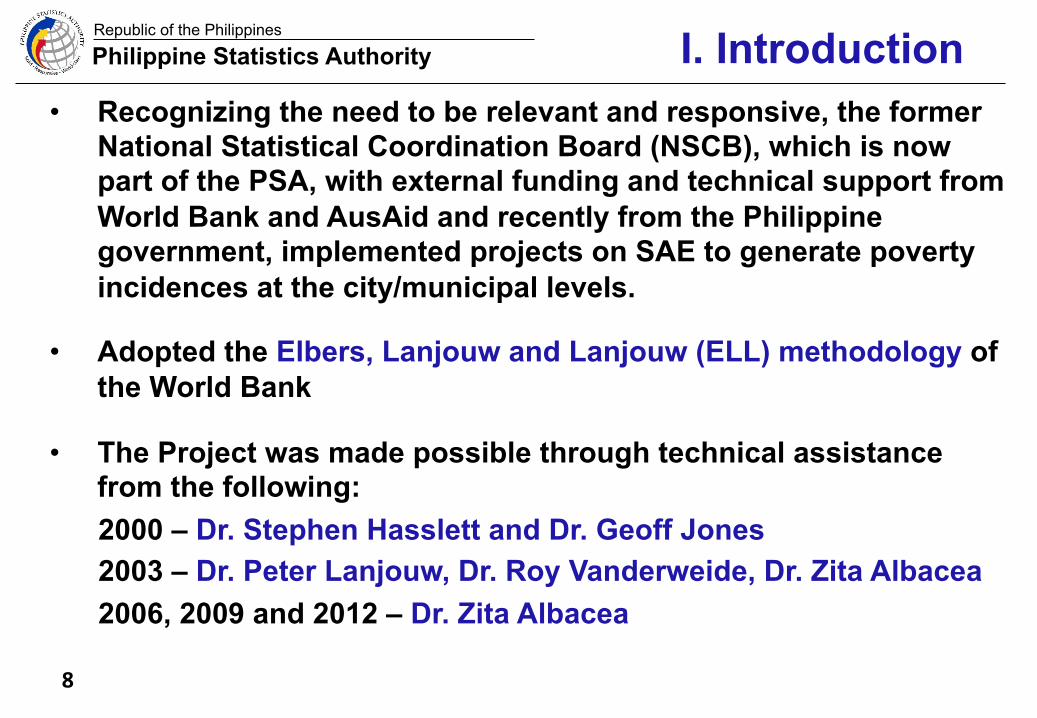
• Recognizing the need to be relevant and responsive, the former National Statistical Coordination Board (NSCB), which is now part of the PSA, with external funding and technical support from World Bank and AusAid and recently from the Philippine government, implemented projects on SAE to generate poverty incidences at the city/municipal levels.
• Adopted the Elbers, Lanjouw and Lanjouw (ELL) methodology of the World Bank
• The Project was made possible through technical assistance from the following:
2000 – Dr. Stephen Hasslett and Dr. Geoff Jones 2003 – Dr. Peter Lanjouw, Dr. Roy Vanderweide, Dr. Zita Albacea 2006, 2009 and 2012 – Dr. Zita Albacea
I. Introduction
Republic of the Philippines
Philippine Statistics Authority
9
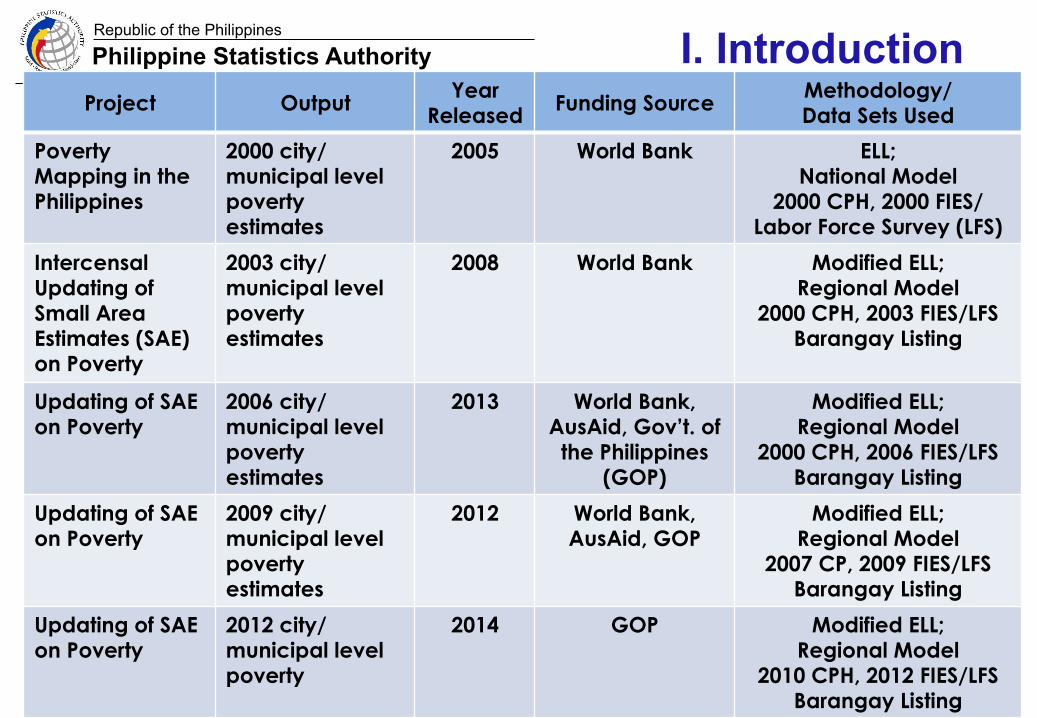
Project Output Year Released Funding Source Methodology/
Data Sets Used
Poverty Mapping in the Philippines
2000 city/ municipal level poverty estimates
2005 World Bank ELL; National Model
2000 CPH, 2000 FIES/ Labor Force Survey (LFS)
Intercensal Updating of Small Area Estimates (SAE) on Poverty
2003 city/ municipal level poverty estimates
2008 World Bank
Modified ELL; Regional Model
2000 CPH, 2003 FIES/LFS Barangay Listing
Updating of SAE on Poverty
2006 city/ municipal level poverty estimates
2013 World Bank, AusAid, Gov’t. of
the Philippines (GOP)
Modified ELL; Regional Model
2000 CPH, 2006 FIES/LFS Barangay Listing
Updating of SAE on Poverty
2009 city/ municipal level poverty estimates
2012 World Bank, AusAid, GOP
Modified ELL; Regional Model
2007 CP, 2009 FIES/LFS Barangay Listing
Updating of SAE on Poverty
2012 city/ municipal level poverty
2014 GOP Modified ELL; Regional Model
2010 CPH, 2012 FIES/LFS Barangay Listing
I. Introduction
Republic of the Philippines
Philippine Statistics Authority
10
Main idea
• Merge information from different types of data sources to come up with small area poverty estimates
• “Borrow strength” from the much more detailed coverage of the census data to supplement the direct measurements of the survey
II. Methodology
Republic of the Philippines
Philippine Statistics Authority
11
Basic procedure
• Use the household survey data to estimate a model of per capita income (Y) as a function of variables that are common to both the household survey and the census (X’s).
• Use the resulting estimated equation/model to predict per capita income for each household in the census.
• The estimated household-level per capita income are then compared with the threshold to identify poor and non-poor households.
• Proportion of poor individuals are then aggregated for small areas, such as cities and municipalities.
II. Methodology
Republic of the Philippines
Philippine Statistics Authority
12
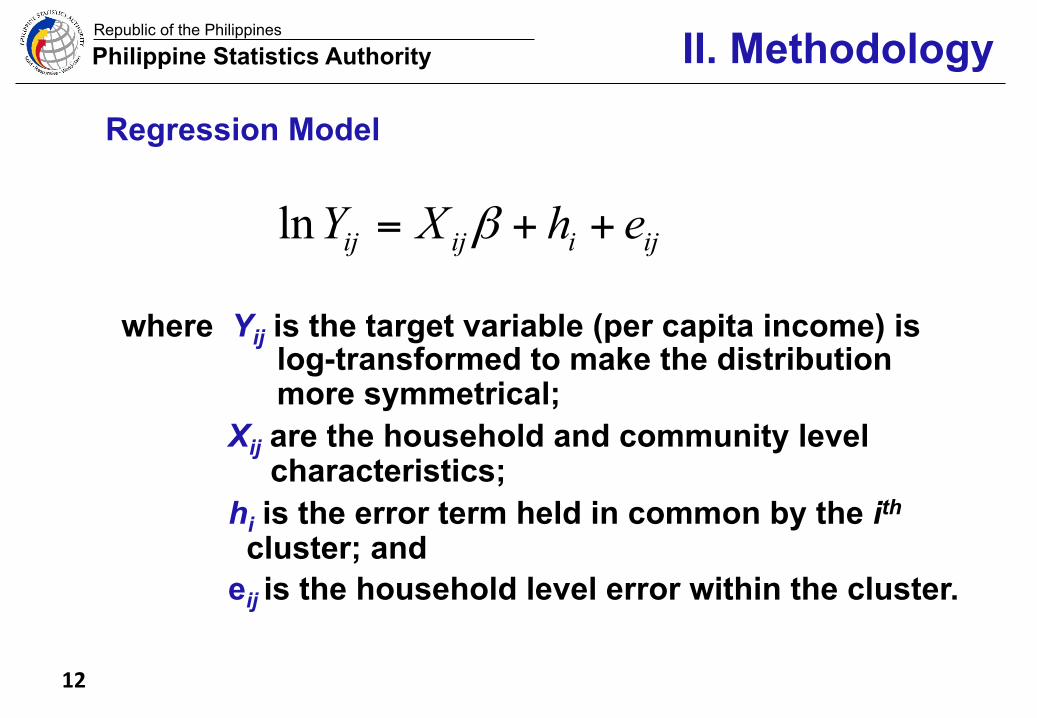
Regression Model
ln β= + +ij ij i ijY X h e
where Yij is the target variable (per capita income) is log-transformed to make the distribution more symmetrical;
Xij are the household and community level characteristics;
hi is the error term held in common by the ith cluster; and
eij is the household level error within the cluster.
II. Methodology
Republic of the Philippines
Philippine Statistics Authority
13
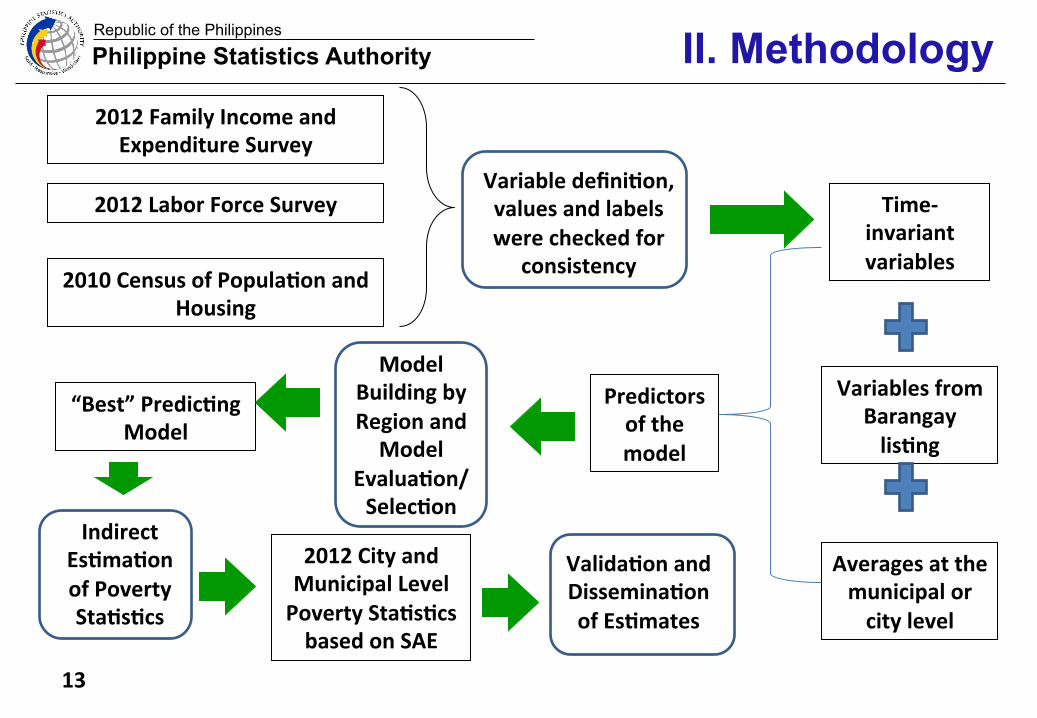
2010 Census of Popula7on and Housing
2012 Family Income and Expenditure Survey
2012 Labor Force Survey
2012 City and Municipal Level Poverty Sta7s7cs based on SAE
Time-‐invariant variables
Variables from Barangay lis7ng
Averages at the municipal or city level
Predictors of the model
“Best” Predic7ng Model
Variable defini7on, values and labels were checked for
consistency
Model Building by Region and Model
Evalua7on/Selec7on
Indirect Es7ma7on of Poverty Sta7s7cs
Valida7on and Dissemina7on of Es7mates
II. Methodology
Republic of the Philippines
Philippine Statistics Authority
14
Criteria in Choosing the “Best” Predicting Model • The relationship of the variables, whether positive or negative, on Y
is generally consistent with earlier researches on poverty (e.g. education should have a positive effect on income).
• The models should be robust, which means that small changes to
the model do not greatly affect the significance or signs of the variables.
• Estimated regional poverty incidence does not largely differ from the
official regional poverty estimates (within 2 standard error away from the official estimates). Preserve the ranking of the official provincial estimates within a region.
• ‘Good’ statistical properties of the model like acceptable model adequacy; significant regression coefficients; parsimonious model;
II. Methodology
Republic of the Philippines
Philippine Statistics Authority
15
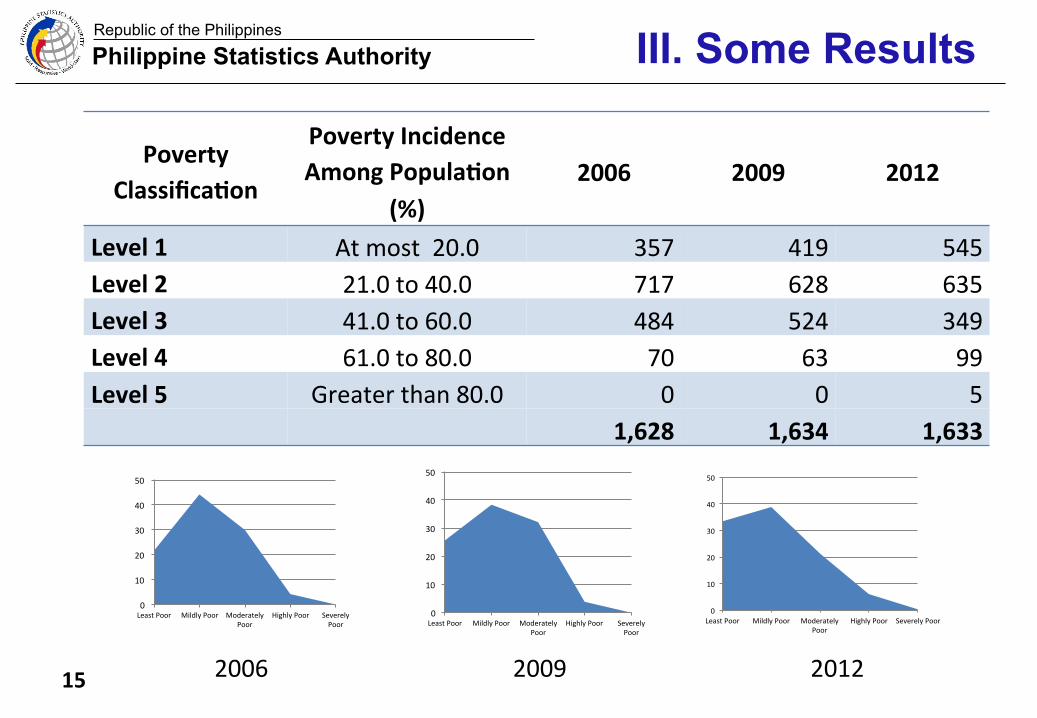
Poverty Classifica7on
Poverty Incidence Among Popula7on
(%) 2006 2009 2012
Level 1 At most 20.0 357 419 545 Level 2 21.0 to 40.0 717 628 635 Level 3 41.0 to 60.0 484 524 349 Level 4 61.0 to 80.0 70 63 99 Level 5 Greater than 80.0 0 0 5
1,628 1,634 1,633
2006 2009 2012
0
10
20
30
40
50
Least Poor Mildly Poor Moderately Poor
Highly Poor Severely Poor
0
10
20
30
40
50
Least Poor Mildly Poor Moderately Poor
Highly Poor Severely Poor
0
10
20
30
40
50
Least Poor Mildly Poor Moderately Poor
Highly Poor Severely Poor
III. Some Results
Republic of the Philippines
Philippine Statistics Authority
16
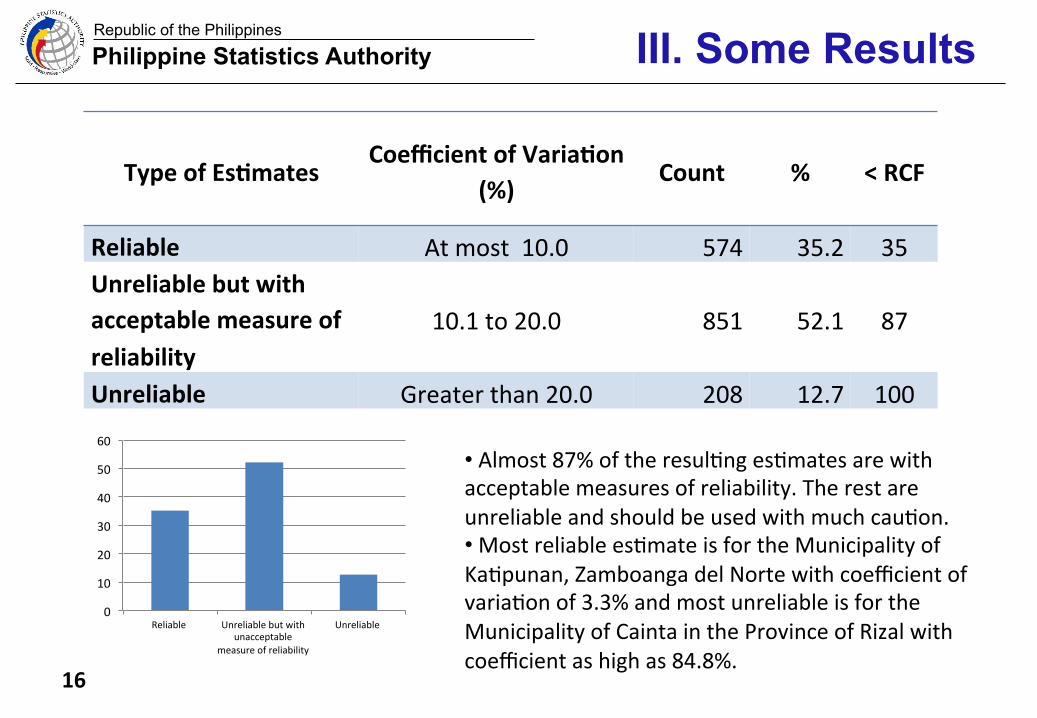
Type of Es7mates Coefficient of Varia7on
(%) Count % < RCF
Reliable At most 10.0 574 35.2 35 Unreliable but with acceptable measure of reliability
10.1 to 20.0 851 52.1 87
Unreliable Greater than 20.0 208 12.7 100
• Almost 87% of the resul6ng es6mates are with acceptable measures of reliability. The rest are unreliable and should be used with much cau6on. • Most reliable es6mate is for the Municipality of Ka6punan, Zamboanga del Norte with coefficient of varia6on of 3.3% and most unreliable is for the Municipality of Cainta in the Province of Rizal with coefficient as high as 84.8%.
0
10
20
30
40
50
60
Reliable Unreliable but with unacceptable
measure of reliability
Unreliable
III. Some Results
Republic of the Philippines
Philippine Statistics Authority
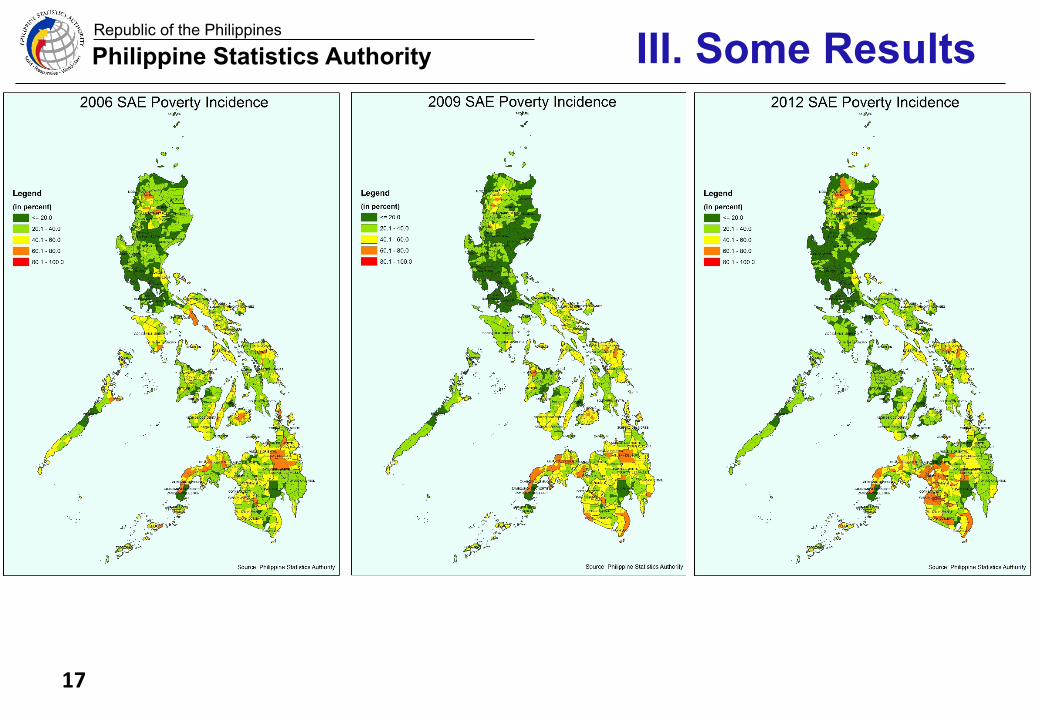
17
III. Some Results
Republic of the Philippines
Philippine Statistics Authority
18
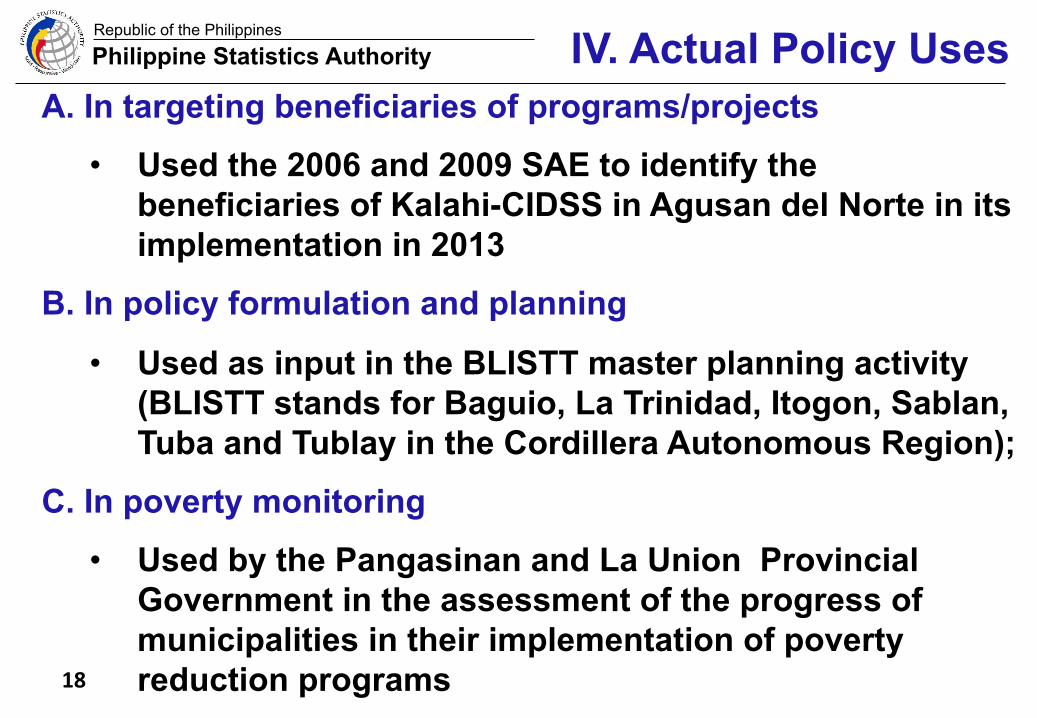
IV. Actual Policy Uses A. In targeting beneficiaries of programs/projects
• Used the 2006 and 2009 SAE to identify the beneficiaries of Kalahi-CIDSS in Agusan del Norte in its implementation in 2013
B. In policy formulation and planning
• Used as input in the BLISTT master planning activity (BLISTT stands for Baguio, La Trinidad, Itogon, Sablan, Tuba and Tublay in the Cordillera Autonomous Region);
C. In poverty monitoring
• Used by the Pangasinan and La Union Provincial Government in the assessment of the progress of municipalities in their implementation of poverty reduction programs
Republic of the Philippines
Philippine Statistics Authority
19
V. Next Steps
• Adoption of an official methodology
• Study the use of other SAE techniques
• Production of infographic materials
• Generation of 2015 city and municipal level poverty statistics in 2017-2018
• Explore the use of the SAE technique in other variables
• Adoption of the 2013 Master Sample in our household surveys, with province as domain
Republic of the Philippines
Philippine Statistics Authority
20
V. Next Steps
• Explore the possibility of using “big data” as possible input in the monitoring of SDG indicators, addressing some of the data gaps, including the challenge of disaggregation
• Pilot on Batanes-Palawan Statistical Development Project 2016-2017
Republic of the Philippines
Philippine Statistics Authority
21
Thank you! Maraming salamat po!
URL: hap://www.psa.gov.ph