Embed Size (px)
Citation preview

The power of data mining in diagnosis of childhood pneumonia
Elina Naydenova1, Athanasios Tsanas 1, Stephen Howie 2, Climent Casals-Pascual 3, Maarten De Vos 1
Abstract— Childhood pneumonia is the leading cause ofdeath of children under the age of five globally. Diagnosticinformation on presence of infection, severity and aetiology(bacterial versus viral) is crucial for appropriate treatment.However, the derivation of such information requires advancedequipment (such as X-rays) and clinical expertise to correctlyassess observational clinical signs (such as chest indrawing);both of these are often unavailable in resource-constrainedsettings. In this study, these challenges were addressed throughthe development of a suite of data mining tools, facilitatingautomated diagnosis through quantifiable features. Findingswere validated on a large dataset comprising 780 childrendiagnosed with pneumonia, and 801 age-matched healthy con-trols. Pneumonia was identified via four quantifiable vital signs(98.2% sensitivity and 97.6% specificity). Moreover, it wasshown that severity can be determined through a combinationof three vital signs and two lung sounds (72.4% sensitivity and82.2% specificity); addition of a conventional biomarker (C-reactive protein) further improved severity predictions (89.1%sensitivity and 81.3% specificity). Finally, we demonstratedthat aetiology can be determined using three vital signs anda newly proposed biomarker (Lipocalin-2) (81.8% sensitivityand 90.6% specificity). These results suggest that a suite ofcarefully designed machine learning tools can be used tosupport multi-faceted diagnosis of childhood pneumonia inresource-constrained settings, compensating for the shortageof expensive equipment and highly trained clinicians.Index Terms— Childhood Pneumonia, Machine Learning, Di-agnostics
I. INTRODUCTION
Pneumonia is the number one killer of children under theage of five (more than 1.1 million deaths annually), caus-ing more deaths than malaria, tuberculosis and HIV/AIDScombined [1], [2], [3]. More than 95% of the childhoodpneumonia cases and 99% of subsequent deaths occur indeveloping countries [2]. Appropriate diagnostic assessmentof childhood pneumonia typically relies on the use ofadvanced tools (such as X-rays and blood culture) as wellas interpretation of observational diagnostic signs (chestindrawing and nasal flaring) by highly-trained clinicians.Moreover, individual measurements are often insufficientand the clinical expert has to assess a combination of vitalsigns and other clinical characteristics for accurate diagnosis[4], [5]. However, access to high-quality healthcare mayoften be limited in many Low and Middle Income Countries(LMICs) due to a shortage of appropriate medical equipmentand clinical expertise.
Timely and accurate diagnosis that facilitates appropriatetreatment has been reported to have the potential to reducemortality by as much as 42% [3]. Most childhood pneumo-nia deaths are reported to occur in a relatively early stage ofdisease progression and complications can develop quickly.In resource-constrained settings, hospital facilities are oftenremote and community health workers (CHWs) need todifferentiate between patients who can be managed locallyand those in need of urgent referral. Thus, it is essentialthat severity can be determined as early and as accuratelyas possible in a point-of-care setting.
The World Health Organisation (WHO) has developeda set of guidelines for diagnosis of childhood pneumoniain resource-constrained settings, directing health workersthrough identification of pneumonia and antibiotic pre-scription or hospitalisation - the guidelines for IntegratedManagement of Childhood Illness (IMCI) [6]. However,a series of reports investigating the integration of these
1Institute of Biomedical Engineering, Department of Engineering Sci-ence, University of Oxford, Oxford, United Kingdom. 2Stephen Howie iswith Child Survival Theme, Medical Research Council Unit, The Gambia.3Wellcome Trust Centre for Human Genetics, Nuffield Department ofMedicine, University of Oxford, United Kingdom. Corresponding author:Elina Naydenova ([email protected])
guidelines into clinical practice worldwide have reportedreasonably high sensitivity of derived diagnosis (69%-94%),overshadowed by poor specificity (16%-67%) [7], [8], [9].Consequently, unnecessary antibiotic prescription has risen,causing depletion of drug stocks and microbial resistance.Thus, it is essential that more specific (but equally sensitive)diagnostic tools are developed, and that objective measure-ments are used to reduce intra- and inter-user valiability indiagnostic performance. Additionally, novel and affordabletools for determination of aetiology should be developed -currently, a combination of chest X-ray and blood cultureare required for this.
Machine learning has been shown to be successful as atool for strengthening diagnostic accuracy of hospitalisedpneumonia patients: in particular, (a) identifying patientssuitable for treatment at home and reducing healthcarecosts [13], [14]; and (b) predicting mortality in hospitalisedpatients [15], [16]. These studies use a wide range of ma-chine learning techniques, applied to datasets derived fromElectronic Health Records (EHR). EHR contain numerousvariables acquired by experts using advanced diagnostictools; it is unfeasible that such rich datasets could be reg-ularly obtained in resource-constrained settings. Moreover,the focus of most of these studies is pneumonia in adults andyet manifestations of the disease in children are considerablydifferent.
In contrast, research on the use of parsimonious datasets,comprising affordable point-of-care measurements for diag-nostic support of childhood pneumonia is rare. Traditionally,basic analytical tools for thresholding individual variableshave been used [10], [11], [12] but none of these variableshave been found to be both sensitive and specific enoughindividually (Fig. 1). Abeyratne et al. have reported onthe use of cough recordings, in combination with fever,deriving algorithms for automated detection of the coughsounds and subsequent identification of pneumonia. Whilstthis approach appears to deliver promising sensitivity (94%),specificity is lower (75%) and no information on severityor aetiology is derived. Additionally, the approach relies oncontinuous sound recording of the child in a hospital setting;in practice, consultation times are typically reported to beless than two minutes due to the large volume of patientsin primary care facilities and the limited tolerance youngchildren have for physical examinations [17].
Triaging systems based on data-mining of a few basicvital signs have been investigated in the context of in-fluenza and epidemic outbreaks in highly populous areas,delivering promising results (sensitivity and specificity ofapproximately 85%) [18], [19]. We propose a suite ofmachine learning techniques for automated three-fold diag-nosis of childhood pneumonia (Identification, Severity andAetiology) based on variables that: (1) could be quantifiedunambiguously; (2) have the potential to be measured af-fordably in resource-constrained settings. Such techniquescould provide health workers with essential information andfacilitate holistic evidence-based clinical decisions. In thisstudy, each of the three diagnostic aspects was addressedseparately, where (a) a minimal and most informative setof features was identified; and (b) machine learning algo-rithms were used to combine information from individualfeatures and improve diagnosis in an automated way. Thepractical limitations of feature acquisition in a point-of-caresetting were incorporated and the number of measurementsneeded during an examination was minimised. The analysispresented here builds upon a clinical study investigating thediscovery of novel pneumonia-related biomarkers [20].
(a) (b)
Fig. 1. (a) Summary of sensitivity and specificity of individual clinical characteristics, derived from applying a threshold (as per standard clinicalguidelines), as well as the Integrated Management of Childhood Illness (IMCI) guidelines [10], [11], [12]. (b) Diagnostic criteria used by a clinician todetermine pneumonia outcome.
II. DATA
The dataset analysed here was originally collected aspart of a clinical study described by Huang et al. [20].The 1581 participants were Gambian children aged 2− 59months. Various features were collected for each case. Thefull dataset consisted of 57 features (clinical characteristics),including measurable clinical variables (e.g. white blood cellcount, neutrophils, haemoglobin etc.), observational clinicalcharacteristics (e.g. sleepiness, sternal indrawing, coughheard etc.) and conventional vital signs (e.g. respiratory rate,heart rate, oxygen saturation etc.). Additionally, selectedcases also contained four biomarkers (C-reactive Protein(CRP), Lipocalin-2 (Lcn2), Haptoglobin (Hap) and CD163protein). We will demonstrate results on the followingsubsets:• Identification dataset (1581 cases, 57 features): 780
childhood pneumonia and 801 age- and gender-matched healthy controls were recruited.
• First Severity dataset (780 cases, 57 features): fromthe 780 pneumonia cases, 458 had severe and 322 hadnon-severe pneumonia.
• Second Severity dataset (180 cases, 61 features): 180 ofthe pneumonia cases contained biomarker information- 104 severe and 76 non-severe cases.
• Aetiology dataset (84 cases, 61 features): only 84 caseshad aetiology information, 22 bacterial and 62 viral, asgold standard diagnosis requires the acquisition of X-rays and blood culture.
The diagnostic outcome for each case was provided bya clinician, expanding on the WHO guidelines [21] andIMCI [6]. The criteria for identification of pneumonia andseverity determination are listed in Fig. 1 and have beendiscussed in detail by Scott et al. in their search for awidely accepted clinical criteria for pneumonia classification[22]. Additionally, X-ray end consolidation and/or a positiveblood culture result were used to differentiate bacterialfrom viral pneumonia cases. Further details on the dataacquisition process can be found in the original clinicalstudy [20].
III. METHODOLOGY
A. Preprocessing
Preprocessing of the original data was performed. Thesubstantial number of missing values (up to 42% for someof the features) was addressed through imputation: features
and cases containing less than 85% of the total numberof entries were removed; the remaining missing valueswere imputed using feature median values (feature meanimputation was also tested but was observed to deliverequivalent results). Following standard statistical machinelearning methodology, we extended the dimensionality ofthe original design matrix. Specifically, we introduced ad-ditional vectors for each feature that mirrored imputations -these vectors contained ’ones’ where imputation was doneand ’zeros’ otherwise [23]. We will refer to these vectors as”ghost vectors” throughout this study.
Several clinical features were excluded from the datasetas they are used in the clinical ’gold standard’ and cannotbe captured in a quantifiable way, e.g. ”lower chest wallindrawing”. Details can be found in the feature list in theSupplementary material-A.Data.
In addition to imputation, all features were scaled toa similar range. For continuous valued features, this wasachieved by subtracting their minimum value and dividingby their range of values. For discrete features, a vectorof ’ones’ was added and the resulting sum was dividedby the maximum values for the feature plus one, avoidingmultiple zero entries. Gaussianising of data via the Box-Coxtransformation was also attempted but had no considerableeffect on performance.
B. Feature selection
Feature selection in this study was driven by considera-tions related to data limitations and diagnostic application:• Data considerations: The curse of dimensionality has
been shown to affect even powerful classifiers such asRandom Forests (RF) and Support Vector Machines(SVM) [24], [25], [26]. Exhaustive search over allpossible feature combinations to determine the optimalfeature subset is computationally intractable, and hencewe used a number of well established feature selectionapproaches.
• Diagnostic application considerations: Point-of-carediagnostics would realistically afford a limited numberof features. Therefore, a feature selection approach thattook into account cost, acquisition time and quantifia-bility of measurements was used.
Seven feature selection techniques were used to investigatethe predictive ability of features towards the outcome:maximum relevance on the basis of the linear (Pearson)
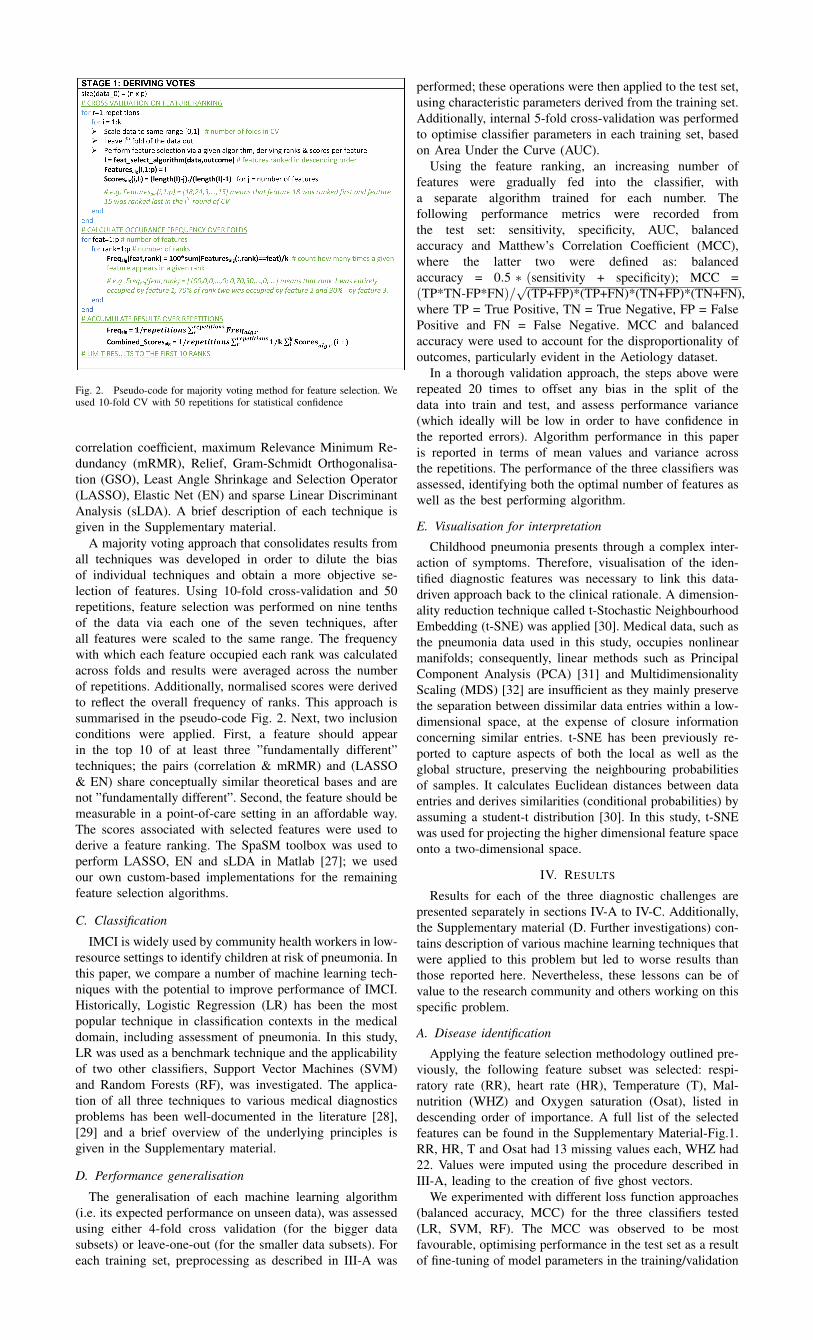
Fig. 2. Pseudo-code for majority voting method for feature selection. Weused 10-fold CV with 50 repetitions for statistical confidence
correlation coefficient, maximum Relevance Minimum Re-dundancy (mRMR), Relief, Gram-Schmidt Orthogonalisa-tion (GSO), Least Angle Shrinkage and Selection Operator(LASSO), Elastic Net (EN) and sparse Linear DiscriminantAnalysis (sLDA). A brief description of each technique isgiven in the Supplementary material.
A majority voting approach that consolidates results fromall techniques was developed in order to dilute the biasof individual techniques and obtain a more objective se-lection of features. Using 10-fold cross-validation and 50repetitions, feature selection was performed on nine tenthsof the data via each one of the seven techniques, afterall features were scaled to the same range. The frequencywith which each feature occupied each rank was calculatedacross folds and results were averaged across the numberof repetitions. Additionally, normalised scores were derivedto reflect the overall frequency of ranks. This approach issummarised in the pseudo-code Fig. 2. Next, two inclusionconditions were applied. First, a feature should appearin the top 10 of at least three ”fundamentally different”techniques; the pairs (correlation & mRMR) and (LASSO& EN) share conceptually similar theoretical bases and arenot ”fundamentally different”. Second, the feature should bemeasurable in a point-of-care setting in an affordable way.The scores associated with selected features were used toderive a feature ranking. The SpaSM toolbox was used toperform LASSO, EN and sLDA in Matlab [27]; we usedour own custom-based implementations for the remainingfeature selection algorithms.
C. Classification
IMCI is widely used by community health workers in low-resource settings to identify children at risk of pneumonia. Inthis paper, we compare a number of machine learning tech-niques with the potential to improve performance of IMCI.Historically, Logistic Regression (LR) has been the mostpopular technique in classification contexts in the medicaldomain, including assessment of pneumonia. In this study,LR was used as a benchmark technique and the applicabilityof two other classifiers, Support Vector Machines (SVM)and Random Forests (RF), was investigated. The applica-tion of all three techniques to various medical diagnosticsproblems has been well-documented in the literature [28],[29] and a brief overview of the underlying principles isgiven in the Supplementary material.
D. Performance generalisation
The generalisation of each machine learning algorithm(i.e. its expected performance on unseen data), was assessedusing either 4-fold cross validation (for the bigger datasubsets) or leave-one-out (for the smaller data subsets). Foreach training set, preprocessing as described in III-A was
performed; these operations were then applied to the test set,using characteristic parameters derived from the training set.Additionally, internal 5-fold cross-validation was performedto optimise classifier parameters in each training set, basedon Area Under the Curve (AUC).
Using the feature ranking, an increasing number offeatures were gradually fed into the classifier, witha separate algorithm trained for each number. Thefollowing performance metrics were recorded fromthe test set: sensitivity, specificity, AUC, balancedaccuracy and Matthew’s Correlation Coefficient (MCC),where the latter two were defined as: balancedaccuracy = 0.5 ∗ (sensitivity + specificity); MCC =(TP*TN-FP*FN)/
√(TP+FP)*(TP+FN)*(TN+FP)*(TN+FN),
where TP = True Positive, TN = True Negative, FP = FalsePositive and FN = False Negative. MCC and balancedaccuracy were used to account for the disproportionality ofoutcomes, particularly evident in the Aetiology dataset.
In a thorough validation approach, the steps above wererepeated 20 times to offset any bias in the split of thedata into train and test, and assess performance variance(which ideally will be low in order to have confidence inthe reported errors). Algorithm performance in this paperis reported in terms of mean values and variance acrossthe repetitions. The performance of the three classifiers wasassessed, identifying both the optimal number of features aswell as the best performing algorithm.
E. Visualisation for interpretation
Childhood pneumonia presents through a complex inter-action of symptoms. Therefore, visualisation of the iden-tified diagnostic features was necessary to link this data-driven approach back to the clinical rationale. A dimension-ality reduction technique called t-Stochastic NeighbourhoodEmbedding (t-SNE) was applied [30]. Medical data, such asthe pneumonia data used in this study, occupies nonlinearmanifolds; consequently, linear methods such as PrincipalComponent Analysis (PCA) [31] and MultidimensionalityScaling (MDS) [32] are insufficient as they mainly preservethe separation between dissimilar data entries within a low-dimensional space, at the expense of closure informationconcerning similar entries. t-SNE has been previously re-ported to capture aspects of both the local as well as theglobal structure, preserving the neighbouring probabilitiesof samples. It calculates Euclidean distances between dataentries and derives similarities (conditional probabilities) byassuming a student-t distribution [30]. In this study, t-SNEwas used for projecting the higher dimensional feature spaceonto a two-dimensional space.
IV. RESULTS
Results for each of the three diagnostic challenges arepresented separately in sections IV-A to IV-C. Additionally,the Supplementary material (D. Further investigations) con-tains description of various machine learning techniques thatwere applied to this problem but led to worse results thanthose reported here. Nevertheless, these lessons can be ofvalue to the research community and others working on thisspecific problem.
A. Disease identification
Applying the feature selection methodology outlined pre-viously, the following feature subset was selected: respi-ratory rate (RR), heart rate (HR), Temperature (T), Mal-nutrition (WHZ) and Oxygen saturation (Osat), listed indescending order of importance. A full list of the selectedfeatures can be found in the Supplementary Material-Fig.1.RR, HR, T and Osat had 13 missing values each, WHZ had22. Values were imputed using the procedure described inIII-A, leading to the creation of five ghost vectors.
We experimented with different loss function approaches(balanced accuracy, MCC) for the three classifiers tested(LR, SVM, RF). The MCC was observed to be mostfavourable, optimising performance in the test set as a resultof fine-tuning of model parameters in the training/validation
set. Specifically, for SVM, a Gaussian radial basis functionkernel, with a kernel width, γ , of 0.1 and a cost parameterof 1000, were found to deliver best performance; for RF,750 decision trees and searching over 2 variables at eachtree node were the optimal hyperparameters.
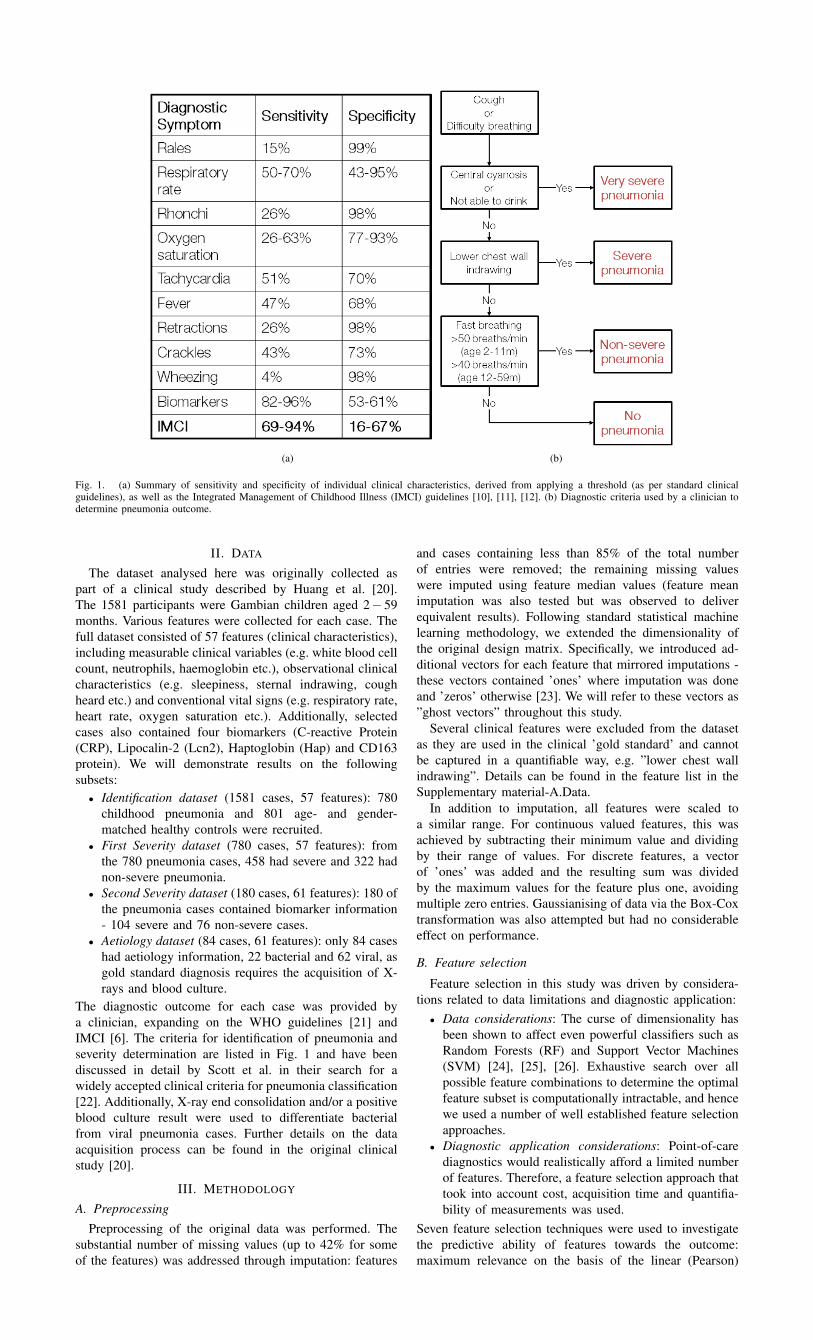
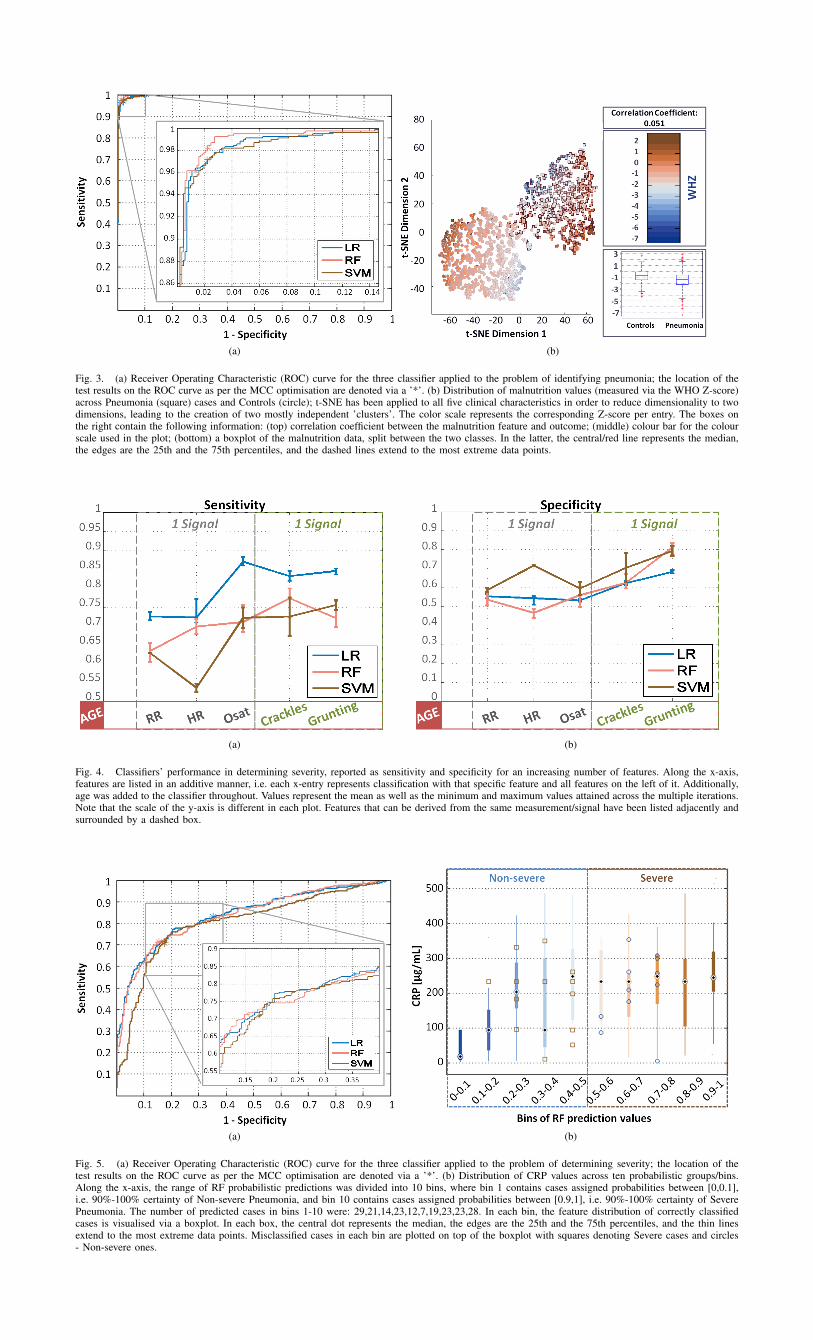
The three classification techniques exhibited comparableperformance, with somewhat more favourable sensitivityand specificity obtained with RF (Figure 3 (a)). LR wasseen to sometimes outperform SVM but exhibited largervariance. The addition of the ghost vectors had very limitedeffect on classification performance, with changes in allmetrics limited to ±1%. Taking a closer look at the RFalgorithm, four features (RR, HR, Osat and T), with theaddition of age, delivered maximal results: 98.2% (95%CI 97.9% - 98.8%) sensitivity; 97.6% (95% CI 97.1%-98.0%) specificity; 99.7% (95% CI 99.3%-99.8%) AUC;95.9% (95% CI 95.3%-96.5%) MCC. From the cases thatwere falsely classified as controls, 33% were severe pneu-monia. Moreover, reducing the number of features to three,worsened performance marginally: 98.2% (95% CI 97.8%-98.6%) sensitivity; 97.1% (95% CI 96.8%-97.5%) speci-ficity; 99.6% (95% CI 99.5%-99.6%) AUC; 95.2% (95% CI94.9%-96.1%) MCC. Somewhat surprisingly, the additionof malnutrition did not improve results. The distributionof malnutrition values across the two classes (Pneumoniaand Controls) was further examined on the basis of t-SNEdimensionality reduction (Figure 3 (b)).
B. Severity determination
The aim of this part of the analysis was to investigatewhether it is possible to predict severity using quantifiablefeatures rather than the observational features included in the’gold standard’ guidelines such as ”chest wall indrawing”.Additionally, it was also investigated whether biomarkerscould be fused with vital signs to improve severity pre-diction. For the purposes of an early warning algorithm,severity was divided into ’Non-severe’ and ’Severe’, withthe latter combining both severe and very severe pneumoniacases.
In the First Severity dataset, selected features were:RR, Osat, Crackles, Grunting, HR. In the Second Severitydataset, selected features were: RR, Grunting, Crackles,CRP, HR, Osat, CD163, Haptoglobin (haptog), Lipocalin-2 (Lcn2). A full list of the selected features is availablein the Supplementary Material-Fig.2. In the First Severitydataset, all 5 features had less than 3 missing values each,introducing 5 ghost vectors. In the Second Severity dataset,the clinical signs had no missing values and the missingvalues amongst the biomarkers were less than 8% (afterexclusion of 19 cases that were missing 7 out of 9 features),introducing four ghost vectors.
First, the mixture of vital signs and lung sounds, listedfor the First Severity dataset, was used to classify severity(Fig. 4). The following hyperparameters were found to leadto best performance: a Gaussian radial basis function kernel,with a kernel with γ of 0.01 and a cost parameter of10000 for SVM; 750 decision trees and searching over 2variables at each tree node for RF. MCC proved to be themost suitable optimisation metric. Some differences wereobserved between the classifiers: RF and SVM performedcomparably whereas LR achieved better sensitivity at thecost of specificity (Fig. 4 and Fig. 5). The addition of theghost vectors had very limited effect on classification, withchanges in all metrics limited to ±0.8%. With five features(and age): LR delivered sensitivity of 84.6% (95% CI 83.6%- 85.2%); specificity of 68.3% (95% CI 67.5%-69.3%); AUCof 83.7% (95% CI 83.2%-83.8%); MCC of 53.6% (95%CI 52.1%-55.2%); RF delivered sensitivity of 71.8% (95%CI 70.0% - 76.6%); specificity of 81.8% (95% CI 73.3%-83.5%); AUC of 83.5% (95% CI 82.5%-83.8%); MCC of52.9% (95% CI 49.6%-55.2%).
The five clinical features listed above could be extractedvia two measurements, keeping cost down, whilst alsoensuring feasibility. Biomarkers could be used to improveperformance but are associated with additional cost (both
TABLE ISENSITIVITY AND SPECIFICITY OF SEVERITY DETERMINATION. FIRST,
BIOMARKERS ARE ADDED INDIVIDUALLY, FOLLOWED BY
COMBINATIONS OF PAIRS OF THE TOP THREE PERFORMING
BIOMARKERS. WITH 5 FEATURES, LR OUTPERFORMED RF’S
SENSITIVITY; WITH MORE FEATURES, RF DELIVERED BOTH GREATER
SENSITIVITY AND SPECIFICITY.
Number Features list Sensitivity Specificityof features5* RR, HR, Osat, Crackles, Grunting 0.85 0.685** RR, HR, Osat, Crackles, Grunting 0.72 0.826** RR, HR, Osat, Crackles, Grunting + CRP 0.89 0.826** RR, HR, Osat, Crackles, Grunting + Lcn2 0.87 0.86** RR, HR, Osat, Crackles, Grunting + Haptog 0.88 0.796** RR, HR, Osat, Crackles, Grunting + CD163 0.88 0.777** RR, HR, Osat, Crackles, Grunting + CRP + Lcn2 0.91 0.787** RR, HR, Osat, Crackles, Grunting + CRP + Haptog 0.91 0.837** RR, HR, Osat, Crackles, Grunting + Lcn2 + Haptog 0.88 0.76
*Classification via LR; ** Classification via RF.
for the development of the assay, if it doesn’t exist, aswell as the cost of individual probes). Consequently, whenintroducing biomarkers to the feature set we attempted tokeep their number as low as possible (one or two) and iden-tify optimal combinations (Table I). CRP and Haptoglobin,added to the three vital signs and two lung sounds, were seento deliver best results: sensitivity of 91.4% (95% CI 89.4% -92.3%); specificity of 83.2% (95% CI 82.1%-84.2%); AUCof 94.2% (95% CI 93.7%-94.3%); MCC of 73.9% (95%CI 72.8%-77.0%). However, with just one biomarker (CRP)and the same list of remaining features, performance was notmuch worse: sensitivity of 88.5% (95% CI 87.5% - 90.4%);specificity of 82.1% (95% CI 80.0%-84.2%); AUC of 92.3%(95% CI 92.0%-94.9%); MCC of 71.8% (95% CI 68.9%-72.9%). The reported results were obtained with RF; withmore than five features, LR’s specificity fell below 60% andcomputational time with SVM was very long (17 hours forthe full validation routine, compared to 2 hours with RF).
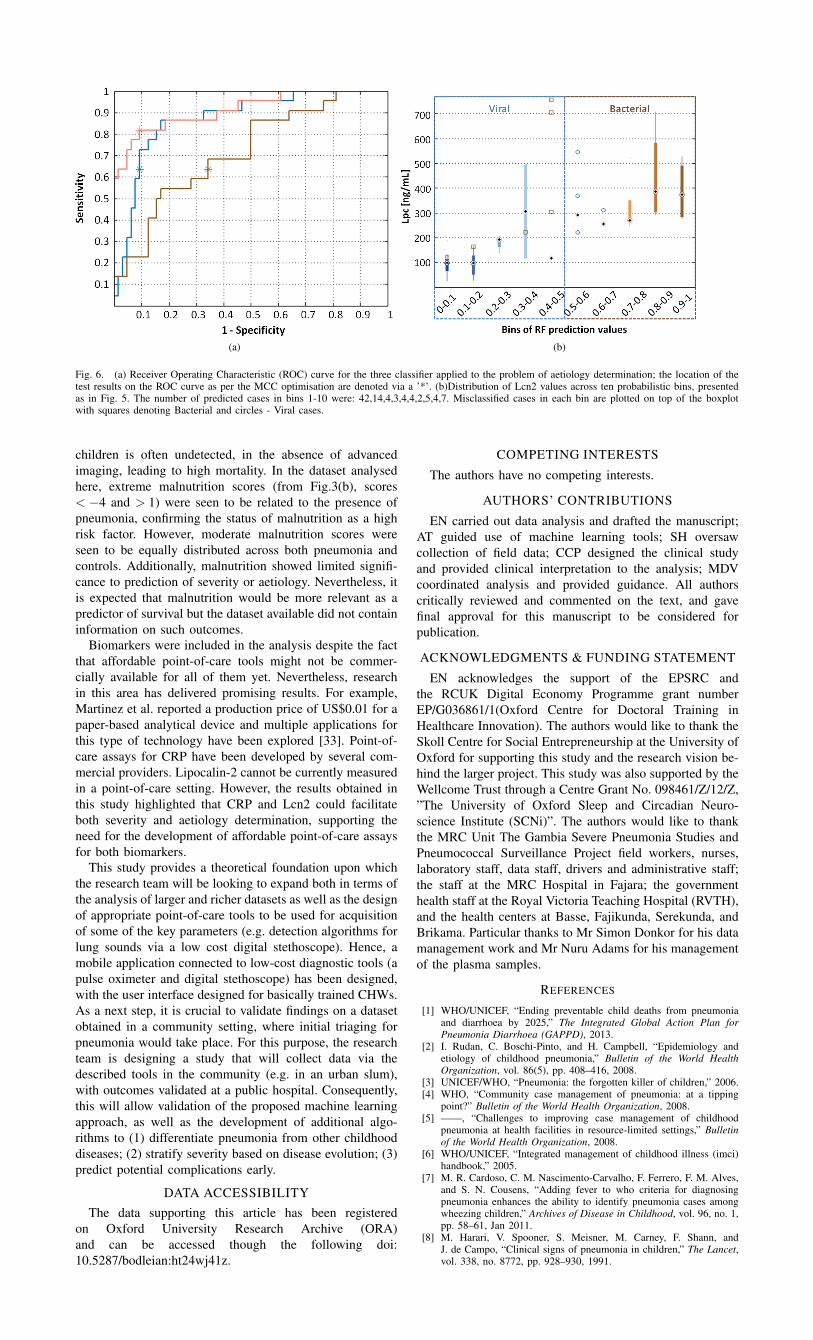
Taking a closer look at the classifier’s predictions, mostcases from both classes were classified with high level ofcertainty. To trace the roots of any uncertainty, the proba-bilistic outcomes were split into 10 bins and the distributionof individual features in each bin was investigated (CRP inFig. 5 and RR in the Supplementary Material - Fig.4). Fromthis, bins 1&2 and 9&10 contained only one misclassifiedcase and displayed a substantial difference between theirCRP and RR values. Cases with more moderate CRP andRR values led to more uncertainty and consequently highermisclassification rates.
Finally, the IMCI severity guidelines were used for com-parison, delivering 79.3% sensitivity and 67.7% specificity(First Severity dataset).
C. Aetiology determination
This part of the study explored whether a combination ofvital signs and biomarkers could be used to predict aetiology(bacterial versus viral), providing a potential alternative insettings where X-rays and blood culture labs are unavailable.
The feature selection identified six features: Lipocalin-2(Lcn2), Haptoglobin (haptog), RR, CRP, HR, CD163; a fulllist of selected features is available in the SupplementaryMaterial-Fig. 3. Missing values were imputed using themedian value of features, where imputation was under 10%in all concerned features, leading to the creation of fourghost vectors.
Optimisation of hyperparameters was performed viaMCC, selecting a γ of 0.01 and a cost parameter of 1000;and 750 decision trees and searching over 3 variables ateach tree node for RF. Substantial differences were observedin the performance of the three classifiers (Fig. 6 (a)) -SVM was seen to underperform despite efforts to fine-tunethe two relevant hyperparameters. RF was seen to deliverbetter sensitivity than LR for a comparable specificity.Similarly to the Severity-part of the study, biomarkers wereadded to the feature set, aiming to minimise the number
(a) (b)
Fig. 3. (a) Receiver Operating Characteristic (ROC) curve for the three classifier applied to the problem of identifying pneumonia; the location of thetest results on the ROC curve as per the MCC optimisation are denoted via a ’*’. (b) Distribution of malnutrition values (measured via the WHO Z-score)across Pneumonia (square) cases and Controls (circle); t-SNE has been applied to all five clinical characteristics in order to reduce dimensionality to twodimensions, leading to the creation of two mostly independent ’clusters’. The color scale represents the corresponding Z-score per entry. The boxes onthe right contain the following information: (top) correlation coefficient between the malnutrition feature and outcome; (middle) colour bar for the colourscale used in the plot; (bottom) a boxplot of the malnutrition data, split between the two classes. In the latter, the central/red line represents the median,the edges are the 25th and the 75th percentiles, and the dashed lines extend to the most extreme data points.
(a) (b)
Fig. 4. Classifiers’ performance in determining severity, reported as sensitivity and specificity for an increasing number of features. Along the x-axis,features are listed in an additive manner, i.e. each x-entry represents classification with that specific feature and all features on the left of it. Additionally,age was added to the classifier throughout. Values represent the mean as well as the minimum and maximum values attained across the multiple iterations.Note that the scale of the y-axis is different in each plot. Features that can be derived from the same measurement/signal have been listed adjacently andsurrounded by a dashed box.
(a) (b)
Fig. 5. (a) Receiver Operating Characteristic (ROC) curve for the three classifier applied to the problem of determining severity; the location of thetest results on the ROC curve as per the MCC optimisation are denoted via a ’*’. (b) Distribution of CRP values across ten probabilistic groups/bins.Along the x-axis, the range of RF probabilistic predictions was divided into 10 bins, where bin 1 contains cases assigned probabilities between [0,0.1],i.e. 90%-100% certainty of Non-severe Pneumonia, and bin 10 contains cases assigned probabilities between [0.9,1], i.e. 90%-100% certainty of SeverePneumonia. The number of predicted cases in bins 1-10 were: 29,21,14,23,12,7,19,23,23,28. In each bin, the feature distribution of correctly classifiedcases is visualised via a boxplot. In each box, the central dot represents the median, the edges are the 25th and the 75th percentiles, and the thin linesextend to the most extreme data points. Misclassified cases in each bin are plotted on top of the boxplot with squares denoting Severe cases and circles- Non-severe ones.
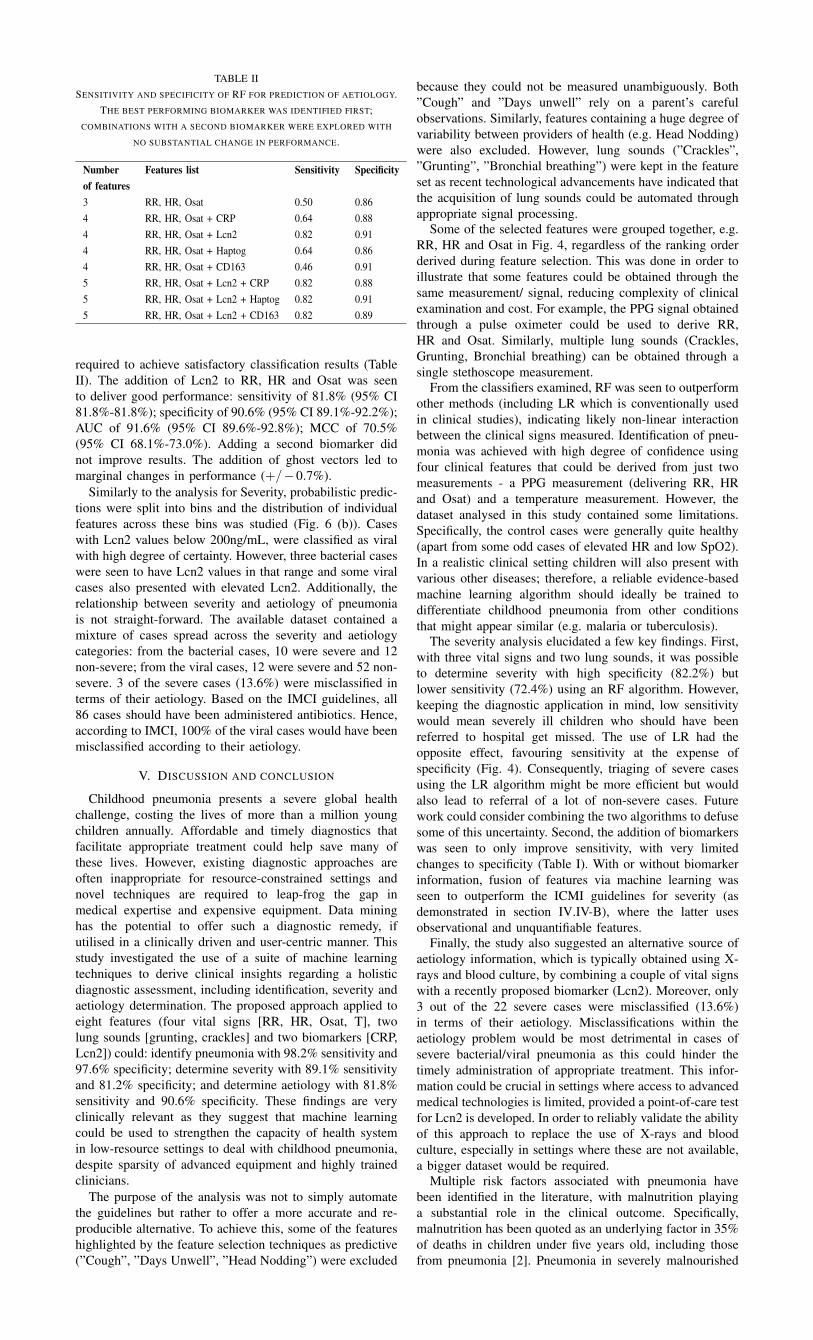
TABLE IISENSITIVITY AND SPECIFICITY OF RF FOR PREDICTION OF AETIOLOGY.
THE BEST PERFORMING BIOMARKER WAS IDENTIFIED FIRST;COMBINATIONS WITH A SECOND BIOMARKER WERE EXPLORED WITH
NO SUBSTANTIAL CHANGE IN PERFORMANCE.
Number Features list Sensitivity Specificityof features3 RR, HR, Osat 0.50 0.864 RR, HR, Osat + CRP 0.64 0.884 RR, HR, Osat + Lcn2 0.82 0.914 RR, HR, Osat + Haptog 0.64 0.864 RR, HR, Osat + CD163 0.46 0.915 RR, HR, Osat + Lcn2 + CRP 0.82 0.885 RR, HR, Osat + Lcn2 + Haptog 0.82 0.915 RR, HR, Osat + Lcn2 + CD163 0.82 0.89
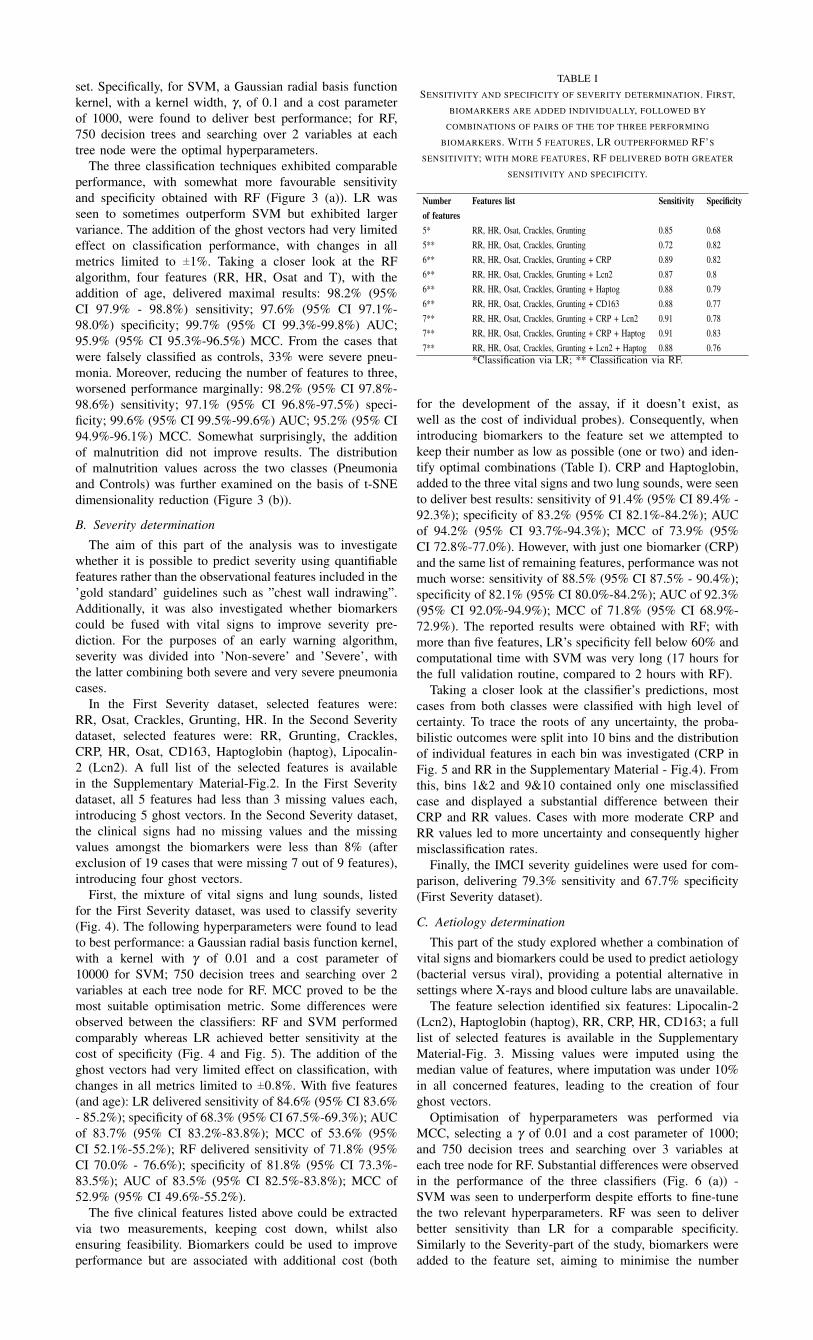
required to achieve satisfactory classification results (TableII). The addition of Lcn2 to RR, HR and Osat was seento deliver good performance: sensitivity of 81.8% (95% CI81.8%-81.8%); specificity of 90.6% (95% CI 89.1%-92.2%);AUC of 91.6% (95% CI 89.6%-92.8%); MCC of 70.5%(95% CI 68.1%-73.0%). Adding a second biomarker didnot improve results. The addition of ghost vectors led tomarginal changes in performance (+/−0.7%).
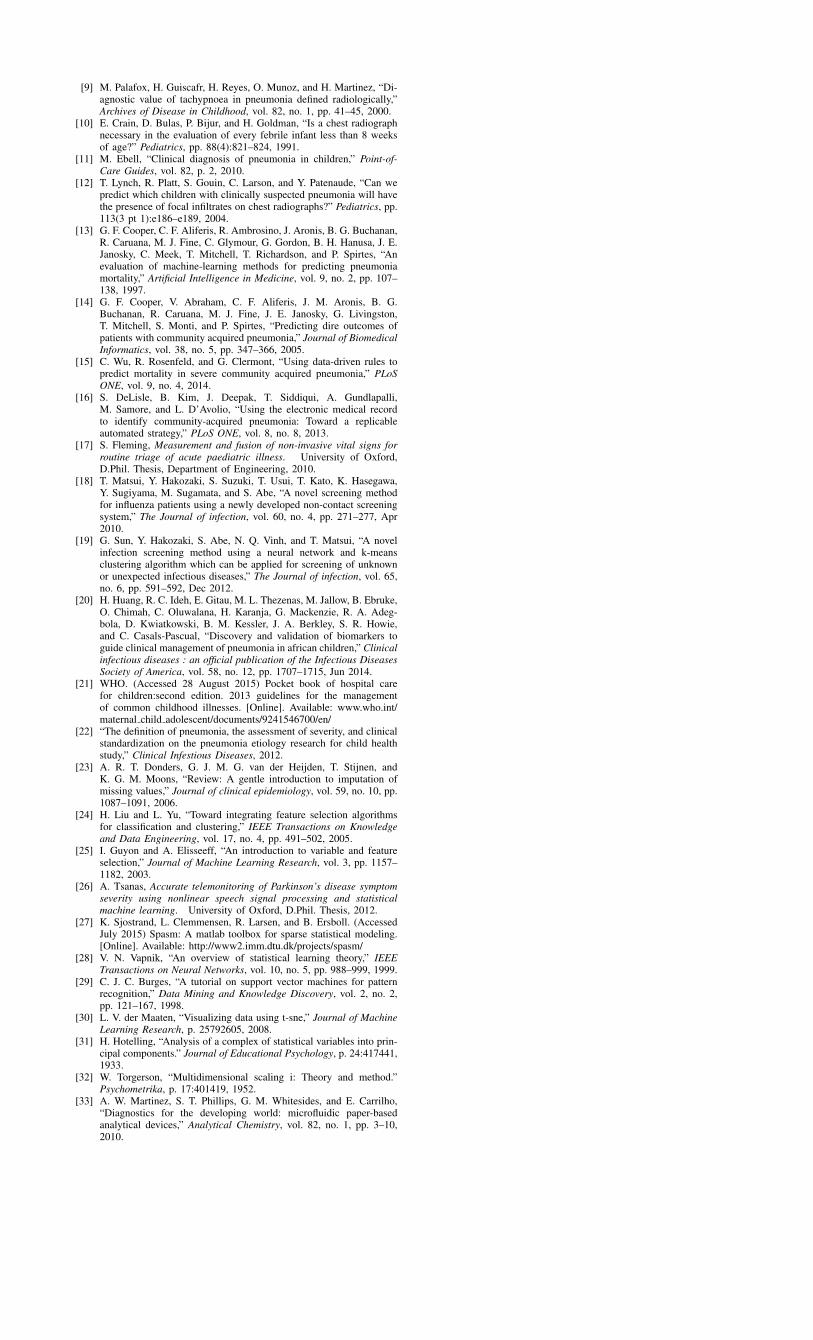
Similarly to the analysis for Severity, probabilistic predic-tions were split into bins and the distribution of individualfeatures across these bins was studied (Fig. 6 (b)). Caseswith Lcn2 values below 200ng/mL, were classified as viralwith high degree of certainty. However, three bacterial caseswere seen to have Lcn2 values in that range and some viralcases also presented with elevated Lcn2. Additionally, therelationship between severity and aetiology of pneumoniais not straight-forward. The available dataset contained amixture of cases spread across the severity and aetiologycategories: from the bacterial cases, 10 were severe and 12non-severe; from the viral cases, 12 were severe and 52 non-severe. 3 of the severe cases (13.6%) were misclassified interms of their aetiology. Based on the IMCI guidelines, all86 cases should have been administered antibiotics. Hence,according to IMCI, 100% of the viral cases would have beenmisclassified according to their aetiology.
V. DISCUSSION AND CONCLUSION
Childhood pneumonia presents a severe global healthchallenge, costing the lives of more than a million youngchildren annually. Affordable and timely diagnostics thatfacilitate appropriate treatment could help save many ofthese lives. However, existing diagnostic approaches areoften inappropriate for resource-constrained settings andnovel techniques are required to leap-frog the gap inmedical expertise and expensive equipment. Data mininghas the potential to offer such a diagnostic remedy, ifutilised in a clinically driven and user-centric manner. Thisstudy investigated the use of a suite of machine learningtechniques to derive clinical insights regarding a holisticdiagnostic assessment, including identification, severity andaetiology determination. The proposed approach applied toeight features (four vital signs [RR, HR, Osat, T], twolung sounds [grunting, crackles] and two biomarkers [CRP,Lcn2]) could: identify pneumonia with 98.2% sensitivity and97.6% specificity; determine severity with 89.1% sensitivityand 81.2% specificity; and determine aetiology with 81.8%sensitivity and 90.6% specificity. These findings are veryclinically relevant as they suggest that machine learningcould be used to strengthen the capacity of health systemin low-resource settings to deal with childhood pneumonia,despite sparsity of advanced equipment and highly trainedclinicians.
The purpose of the analysis was not to simply automatethe guidelines but rather to offer a more accurate and re-producible alternative. To achieve this, some of the featureshighlighted by the feature selection techniques as predictive(”Cough”, ”Days Unwell”, ”Head Nodding”) were excluded
because they could not be measured unambiguously. Both”Cough” and ”Days unwell” rely on a parent’s carefulobservations. Similarly, features containing a huge degree ofvariability between providers of health (e.g. Head Nodding)were also excluded. However, lung sounds (”Crackles”,”Grunting”, ”Bronchial breathing”) were kept in the featureset as recent technological advancements have indicated thatthe acquisition of lung sounds could be automated throughappropriate signal processing.
Some of the selected features were grouped together, e.g.RR, HR and Osat in Fig. 4, regardless of the ranking orderderived during feature selection. This was done in order toillustrate that some features could be obtained through thesame measurement/ signal, reducing complexity of clinicalexamination and cost. For example, the PPG signal obtainedthrough a pulse oximeter could be used to derive RR,HR and Osat. Similarly, multiple lung sounds (Crackles,Grunting, Bronchial breathing) can be obtained through asingle stethoscope measurement.
From the classifiers examined, RF was seen to outperformother methods (including LR which is conventionally usedin clinical studies), indicating likely non-linear interactionbetween the clinical signs measured. Identification of pneu-monia was achieved with high degree of confidence usingfour clinical features that could be derived from just twomeasurements - a PPG measurement (delivering RR, HRand Osat) and a temperature measurement. However, thedataset analysed in this study contained some limitations.Specifically, the control cases were generally quite healthy(apart from some odd cases of elevated HR and low SpO2).In a realistic clinical setting children will also present withvarious other diseases; therefore, a reliable evidence-basedmachine learning algorithm should ideally be trained todifferentiate childhood pneumonia from other conditionsthat might appear similar (e.g. malaria or tuberculosis).
The severity analysis elucidated a few key findings. First,with three vital signs and two lung sounds, it was possibleto determine severity with high specificity (82.2%) butlower sensitivity (72.4%) using an RF algorithm. However,keeping the diagnostic application in mind, low sensitivitywould mean severely ill children who should have beenreferred to hospital get missed. The use of LR had theopposite effect, favouring sensitivity at the expense ofspecificity (Fig. 4). Consequently, triaging of severe casesusing the LR algorithm might be more efficient but wouldalso lead to referral of a lot of non-severe cases. Futurework could consider combining the two algorithms to defusesome of this uncertainty. Second, the addition of biomarkerswas seen to only improve sensitivity, with very limitedchanges to specificity (Table I). With or without biomarkerinformation, fusion of features via machine learning wasseen to outperform the ICMI guidelines for severity (asdemonstrated in section IV.IV-B), where the latter usesobservational and unquantifiable features.
Finally, the study also suggested an alternative source ofaetiology information, which is typically obtained using X-rays and blood culture, by combining a couple of vital signswith a recently proposed biomarker (Lcn2). Moreover, only3 out of the 22 severe cases were misclassified (13.6%)in terms of their aetiology. Misclassifications within theaetiology problem would be most detrimental in cases ofsevere bacterial/viral pneumonia as this could hinder thetimely administration of appropriate treatment. This infor-mation could be crucial in settings where access to advancedmedical technologies is limited, provided a point-of-care testfor Lcn2 is developed. In order to reliably validate the abilityof this approach to replace the use of X-rays and bloodculture, especially in settings where these are not available,a bigger dataset would be required.
Multiple risk factors associated with pneumonia havebeen identified in the literature, with malnutrition playinga substantial role in the clinical outcome. Specifically,malnutrition has been quoted as an underlying factor in 35%of deaths in children under five years old, including thosefrom pneumonia [2]. Pneumonia in severely malnourished
(a) (b)
Fig. 6. (a) Receiver Operating Characteristic (ROC) curve for the three classifier applied to the problem of aetiology determination; the location of thetest results on the ROC curve as per the MCC optimisation are denoted via a ’*’. (b)Distribution of Lcn2 values across ten probabilistic bins, presentedas in Fig. 5. The number of predicted cases in bins 1-10 were: 42,14,4,3,4,4,2,5,4,7. Misclassified cases in each bin are plotted on top of the boxplotwith squares denoting Bacterial and circles - Viral cases.
children is often undetected, in the absence of advancedimaging, leading to high mortality. In the dataset analysedhere, extreme malnutrition scores (from Fig.3(b), scores< −4 and > 1) were seen to be related to the presence ofpneumonia, confirming the status of malnutrition as a highrisk factor. However, moderate malnutrition scores wereseen to be equally distributed across both pneumonia andcontrols. Additionally, malnutrition showed limited signifi-cance to prediction of severity or aetiology. Nevertheless, itis expected that malnutrition would be more relevant as apredictor of survival but the dataset available did not containinformation on such outcomes.
Biomarkers were included in the analysis despite the factthat affordable point-of-care tools might not be commer-cially available for all of them yet. Nevertheless, researchin this area has delivered promising results. For example,Martinez et al. reported a production price of US$0.01 for apaper-based analytical device and multiple applications forthis type of technology have been explored [33]. Point-of-care assays for CRP have been developed by several com-mercial providers. Lipocalin-2 cannot be currently measuredin a point-of-care setting. However, the results obtained inthis study highlighted that CRP and Lcn2 could facilitateboth severity and aetiology determination, supporting theneed for the development of affordable point-of-care assaysfor both biomarkers.
This study provides a theoretical foundation upon whichthe research team will be looking to expand both in terms ofthe analysis of larger and richer datasets as well as the designof appropriate point-of-care tools to be used for acquisitionof some of the key parameters (e.g. detection algorithms forlung sounds via a low cost digital stethoscope). Hence, amobile application connected to low-cost diagnostic tools (apulse oximeter and digital stethoscope) has been designed,with the user interface designed for basically trained CHWs.As a next step, it is crucial to validate findings on a datasetobtained in a community setting, where initial triaging forpneumonia would take place. For this purpose, the researchteam is designing a study that will collect data via thedescribed tools in the community (e.g. in an urban slum),with outcomes validated at a public hospital. Consequently,this will allow validation of the proposed machine learningapproach, as well as the development of additional algo-rithms to (1) differentiate pneumonia from other childhooddiseases; (2) stratify severity based on disease evolution; (3)predict potential complications early.
DATA ACCESSIBILITYThe data supporting this article has been registered
on Oxford University Research Archive (ORA)and can be accessed though the following doi:10.5287/bodleian:ht24wj41z.
COMPETING INTERESTS
The authors have no competing interests.
AUTHORS’ CONTRIBUTIONS
EN carried out data analysis and drafted the manuscript;AT guided use of machine learning tools; SH oversawcollection of field data; CCP designed the clinical studyand provided clinical interpretation to the analysis; MDVcoordinated analysis and provided guidance. All authorscritically reviewed and commented on the text, and gavefinal approval for this manuscript to be considered forpublication.
ACKNOWLEDGMENTS & FUNDING STATEMENT
EN acknowledges the support of the EPSRC andthe RCUK Digital Economy Programme grant numberEP/G036861/1(Oxford Centre for Doctoral Training inHealthcare Innovation). The authors would like to thank theSkoll Centre for Social Entrepreneurship at the University ofOxford for supporting this study and the research vision be-hind the larger project. This study was also supported by theWellcome Trust through a Centre Grant No. 098461/Z/12/Z,”The University of Oxford Sleep and Circadian Neuro-science Institute (SCNi)”. The authors would like to thankthe MRC Unit The Gambia Severe Pneumonia Studies andPneumococcal Surveillance Project field workers, nurses,laboratory staff, data staff, drivers and administrative staff;the staff at the MRC Hospital in Fajara; the governmenthealth staff at the Royal Victoria Teaching Hospital (RVTH),and the health centers at Basse, Fajikunda, Serekunda, andBrikama. Particular thanks to Mr Simon Donkor for his datamanagement work and Mr Nuru Adams for his managementof the plasma samples.
REFERENCES
[1] WHO/UNICEF, “Ending preventable child deaths from pneumoniaand diarrhoea by 2025,” The Integrated Global Action Plan forPneumonia Diarrhoea (GAPPD), 2013.
[2] I. Rudan, C. Boschi-Pinto, and H. Campbell, “Epidemiology andetiology of childhood pneumonia,” Bulletin of the World HealthOrganization, vol. 86(5), pp. 408–416, 2008.
[3] UNICEF/WHO, “Pneumonia: the forgotten killer of children,” 2006.[4] WHO, “Community case management of pneumonia: at a tipping
point?” Bulletin of the World Health Organization, 2008.[5] ——, “Challenges to improving case management of childhood
pneumonia at health facilities in resource-limited settings,” Bulletinof the World Health Organization, 2008.
[6] WHO/UNICEF, “Integrated management of childhood illness (imci)handbook,” 2005.
[7] M. R. Cardoso, C. M. Nascimento-Carvalho, F. Ferrero, F. M. Alves,and S. N. Cousens, “Adding fever to who criteria for diagnosingpneumonia enhances the ability to identify pneumonia cases amongwheezing children,” Archives of Disease in Childhood, vol. 96, no. 1,pp. 58–61, Jan 2011.
[8] M. Harari, V. Spooner, S. Meisner, M. Carney, F. Shann, andJ. de Campo, “Clinical signs of pneumonia in children,” The Lancet,vol. 338, no. 8772, pp. 928–930, 1991.
[9] M. Palafox, H. Guiscafr, H. Reyes, O. Munoz, and H. Martinez, “Di-agnostic value of tachypnoea in pneumonia defined radiologically,”Archives of Disease in Childhood, vol. 82, no. 1, pp. 41–45, 2000.
[10] E. Crain, D. Bulas, P. Bijur, and H. Goldman, “Is a chest radiographnecessary in the evaluation of every febrile infant less than 8 weeksof age?” Pediatrics, pp. 88(4):821–824, 1991.
[11] M. Ebell, “Clinical diagnosis of pneumonia in children,” Point-of-Care Guides, vol. 82, p. 2, 2010.
[12] T. Lynch, R. Platt, S. Gouin, C. Larson, and Y. Patenaude, “Can wepredict which children with clinically suspected pneumonia will havethe presence of focal infiltrates on chest radiographs?” Pediatrics, pp.113(3 pt 1):e186–e189, 2004.
[13] G. F. Cooper, C. F. Aliferis, R. Ambrosino, J. Aronis, B. G. Buchanan,R. Caruana, M. J. Fine, C. Glymour, G. Gordon, B. H. Hanusa, J. E.Janosky, C. Meek, T. Mitchell, T. Richardson, and P. Spirtes, “Anevaluation of machine-learning methods for predicting pneumoniamortality,” Artificial Intelligence in Medicine, vol. 9, no. 2, pp. 107–138, 1997.
[14] G. F. Cooper, V. Abraham, C. F. Aliferis, J. M. Aronis, B. G.Buchanan, R. Caruana, M. J. Fine, J. E. Janosky, G. Livingston,T. Mitchell, S. Monti, and P. Spirtes, “Predicting dire outcomes ofpatients with community acquired pneumonia,” Journal of BiomedicalInformatics, vol. 38, no. 5, pp. 347–366, 2005.
[15] C. Wu, R. Rosenfeld, and G. Clermont, “Using data-driven rules topredict mortality in severe community acquired pneumonia,” PLoSONE, vol. 9, no. 4, 2014.
[16] S. DeLisle, B. Kim, J. Deepak, T. Siddiqui, A. Gundlapalli,M. Samore, and L. D’Avolio, “Using the electronic medical recordto identify community-acquired pneumonia: Toward a replicableautomated strategy,” PLoS ONE, vol. 8, no. 8, 2013.
[17] S. Fleming, Measurement and fusion of non-invasive vital signs forroutine triage of acute paediatric illness. University of Oxford,D.Phil. Thesis, Department of Engineering, 2010.
[18] T. Matsui, Y. Hakozaki, S. Suzuki, T. Usui, T. Kato, K. Hasegawa,Y. Sugiyama, M. Sugamata, and S. Abe, “A novel screening methodfor influenza patients using a newly developed non-contact screeningsystem,” The Journal of infection, vol. 60, no. 4, pp. 271–277, Apr2010.
[19] G. Sun, Y. Hakozaki, S. Abe, N. Q. Vinh, and T. Matsui, “A novelinfection screening method using a neural network and k-meansclustering algorithm which can be applied for screening of unknownor unexpected infectious diseases,” The Journal of infection, vol. 65,no. 6, pp. 591–592, Dec 2012.
[20] H. Huang, R. C. Ideh, E. Gitau, M. L. Thezenas, M. Jallow, B. Ebruke,O. Chimah, C. Oluwalana, H. Karanja, G. Mackenzie, R. A. Adeg-bola, D. Kwiatkowski, B. M. Kessler, J. A. Berkley, S. R. Howie,and C. Casals-Pascual, “Discovery and validation of biomarkers toguide clinical management of pneumonia in african children,” Clinicalinfectious diseases : an official publication of the Infectious DiseasesSociety of America, vol. 58, no. 12, pp. 1707–1715, Jun 2014.
[21] WHO. (Accessed 28 August 2015) Pocket book of hospital carefor children:second edition. 2013 guidelines for the managementof common childhood illnesses. [Online]. Available: www.who.int/maternal child adolescent/documents/9241546700/en/
[22] “The definition of pneumonia, the assessment of severity, and clinicalstandardization on the pneumonia etiology research for child healthstudy,” Clinical Infestious Diseases, 2012.
[23] A. R. T. Donders, G. J. M. G. van der Heijden, T. Stijnen, andK. G. M. Moons, “Review: A gentle introduction to imputation ofmissing values,” Journal of clinical epidemiology, vol. 59, no. 10, pp.1087–1091, 2006.
[24] H. Liu and L. Yu, “Toward integrating feature selection algorithmsfor classification and clustering,” IEEE Transactions on Knowledgeand Data Engineering, vol. 17, no. 4, pp. 491–502, 2005.
[25] I. Guyon and A. Elisseeff, “An introduction to variable and featureselection,” Journal of Machine Learning Research, vol. 3, pp. 1157–1182, 2003.
[26] A. Tsanas, Accurate telemonitoring of Parkinson’s disease symptomseverity using nonlinear speech signal processing and statisticalmachine learning. University of Oxford, D.Phil. Thesis, 2012.
[27] K. Sjostrand, L. Clemmensen, R. Larsen, and B. Ersboll. (AccessedJuly 2015) Spasm: A matlab toolbox for sparse statistical modeling.[Online]. Available: http://www2.imm.dtu.dk/projects/spasm/
[28] V. N. Vapnik, “An overview of statistical learning theory,” IEEETransactions on Neural Networks, vol. 10, no. 5, pp. 988–999, 1999.
[29] C. J. C. Burges, “A tutorial on support vector machines for patternrecognition,” Data Mining and Knowledge Discovery, vol. 2, no. 2,pp. 121–167, 1998.
[30] L. V. der Maaten, “Visualizing data using t-sne,” Journal of MachineLearning Research, p. 25792605, 2008.
[31] H. Hotelling, “Analysis of a complex of statistical variables into prin-cipal components.” Journal of Educational Psychology, p. 24:417441,1933.
[32] W. Torgerson, “Multidimensional scaling i: Theory and method.”Psychometrika, p. 17:401419, 1952.
[33] A. W. Martinez, S. T. Phillips, G. M. Whitesides, and E. Carrilho,“Diagnostics for the developing world: microfluidic paper-basedanalytical devices,” Analytical Chemistry, vol. 82, no. 1, pp. 3–10,2010.