Embed Size (px)
Citation preview
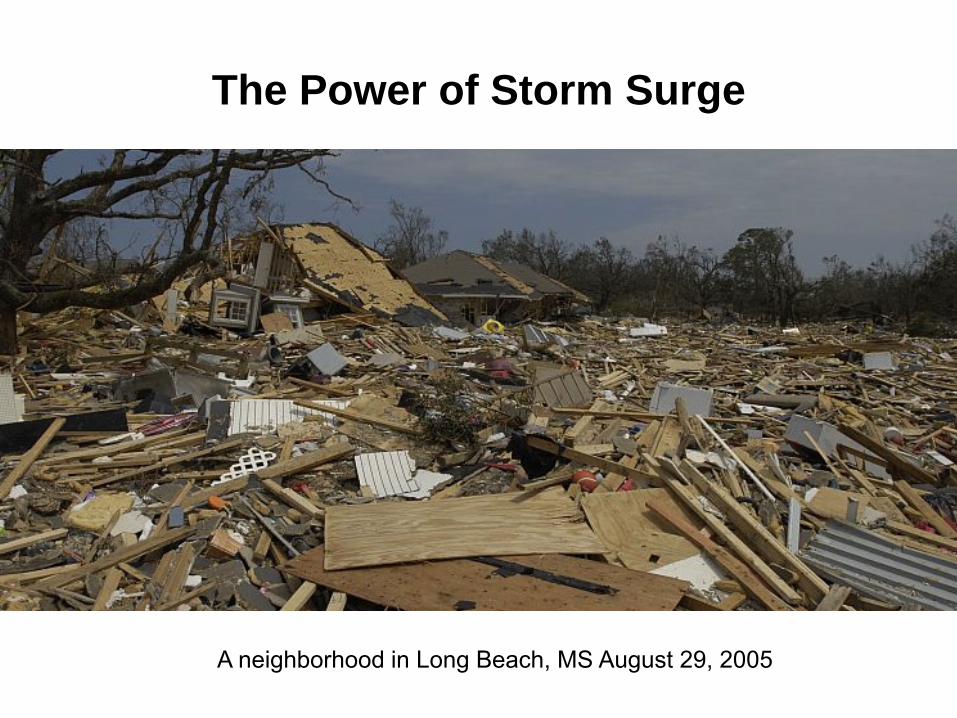
The Power of Storm Surge
A neighborhood in Long Beach, MS August 29, 2005
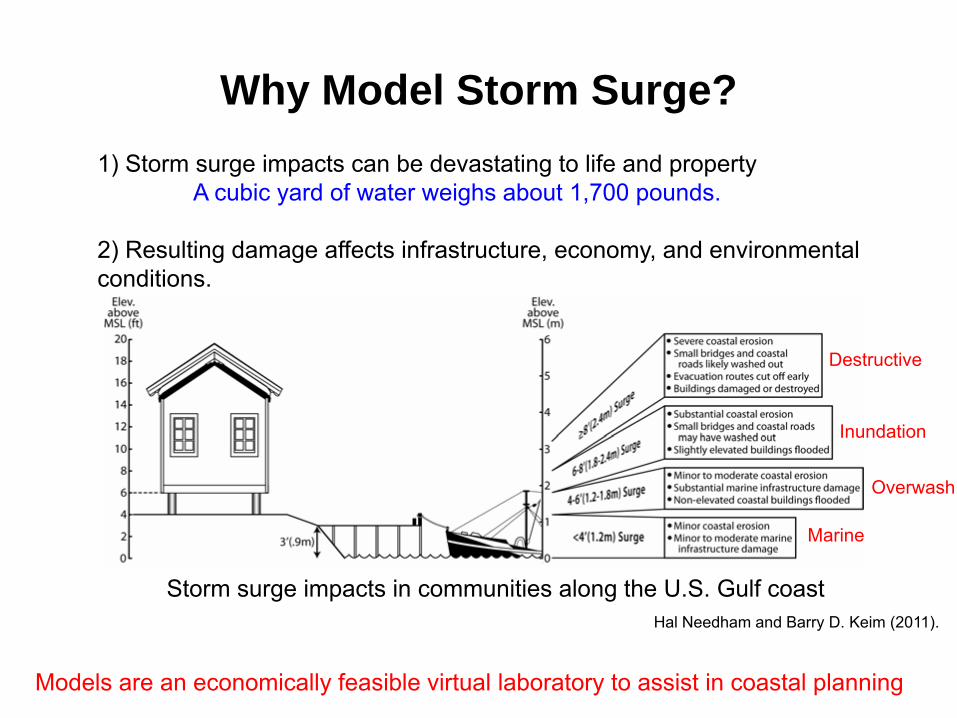
Why Model Storm Surge?
Storm surge impacts in communities along the U.S. Gulf coast
1) Storm surge impacts can be devastating to life and propertyA cubic yard of water weighs about 1,700 pounds.
2) Resulting damage affects infrastructure, economy, and environmental conditions.
Marine
Overwash
Inundation
Destructive
Hal Needham and Barry D. Keim (2011).
Models are an economically feasible virtual laboratory to assist in coastal planning
STORM SURGE MODELING
Dr. Cheryl Ann BlainNaval Research LaboratoryStennis Space Center, MS, USA
Pan-American Studies Institute, PASIUniversidad Técnica Federico Santa María,
2–13 January, 2013 — Valparaíso, Chile
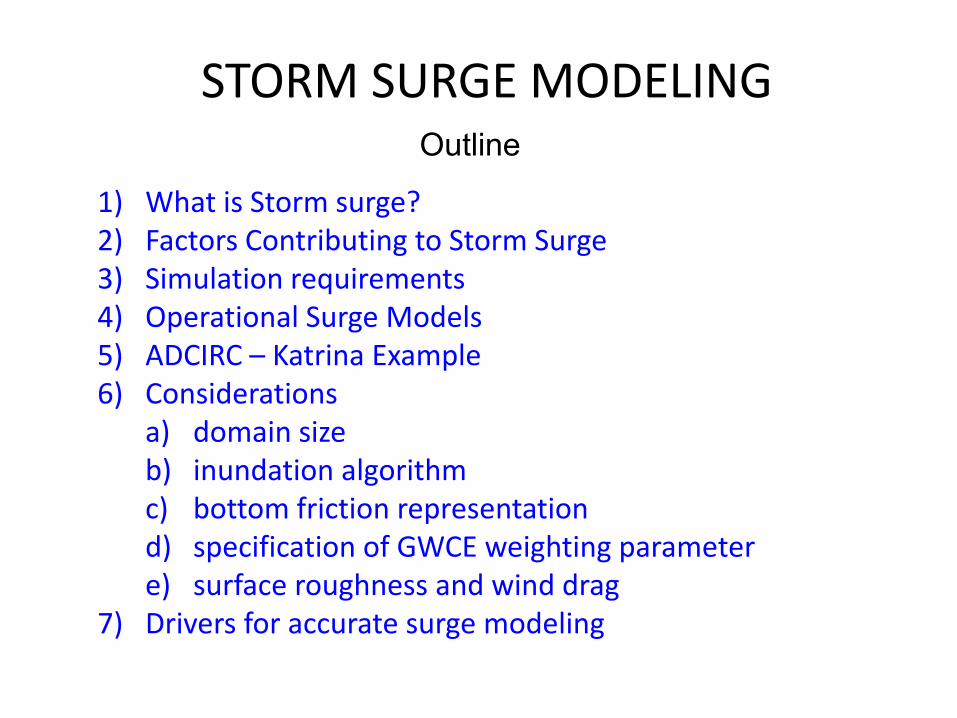
1) What is Storm surge?2) Factors Contributing to Storm Surge3) Simulation requirements4) Operational Surge Models5) ADCIRC – Katrina Example6) Considerations
a) domain sizeb) inundation algorithmc) bottom friction representationd) specification of GWCE weighting parametere) surface roughness and wind drag
7) Drivers for accurate surge modeling
Outline
STORM SURGE MODELING
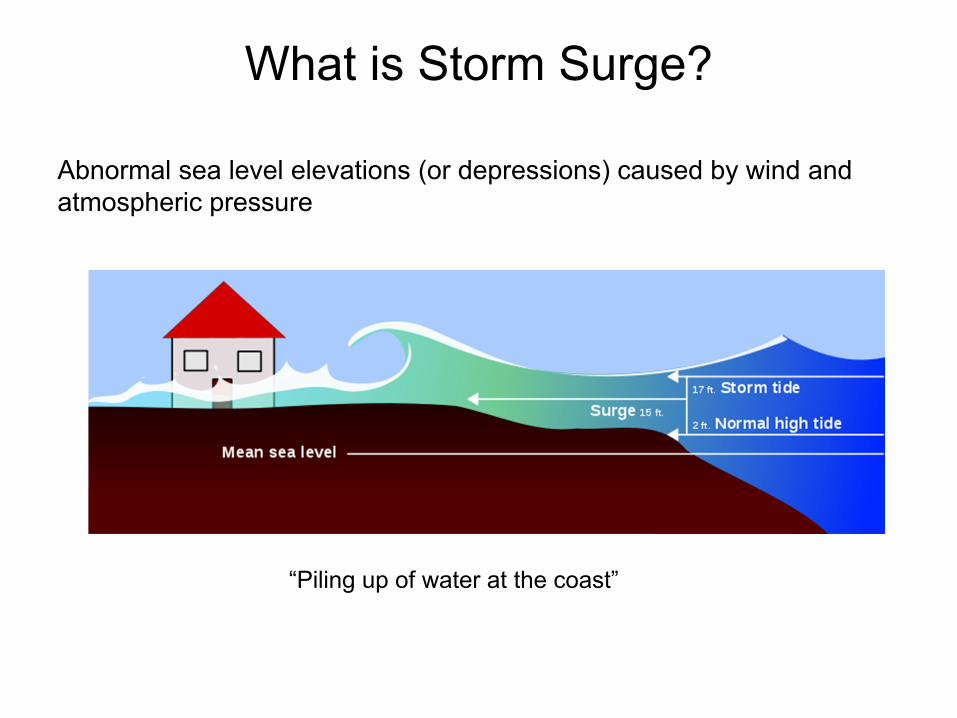
What is Storm Surge?
Abnormal sea level elevations (or depressions) caused by wind and atmospheric pressure
“Piling up of water at the coast”
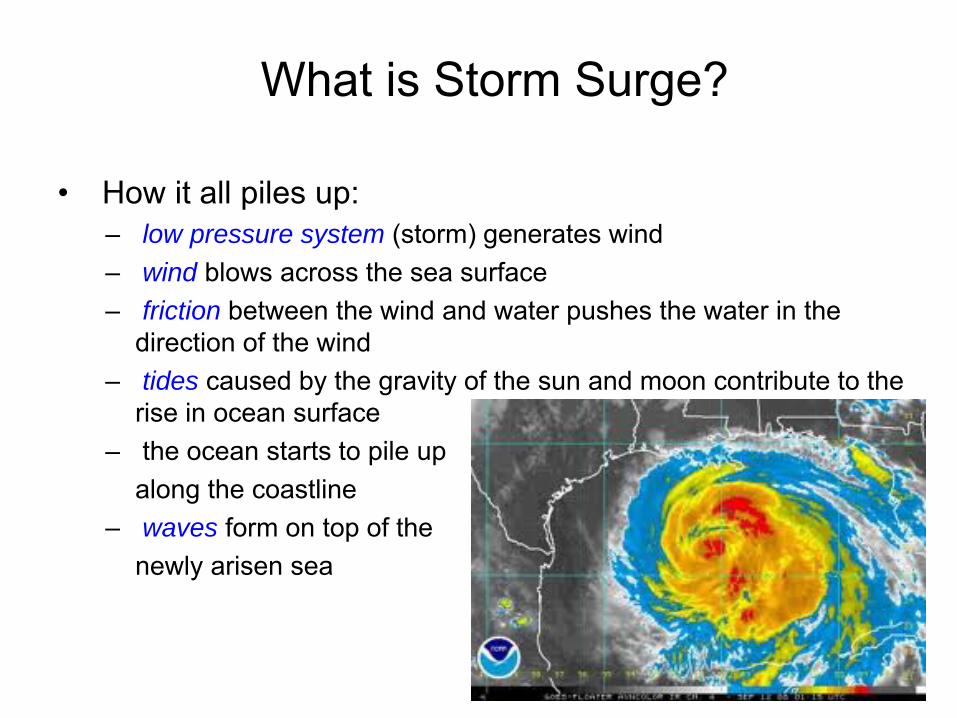
• How it all piles up:– low pressure system (storm) generates wind– wind blows across the sea surface– friction between the wind and water pushes the water in the
direction of the wind– tides caused by the gravity of the sun and moon contribute to the
rise in ocean surface– the ocean starts to pile up
along the coastline– waves form on top of the
newly arisen sea
What is Storm Surge?
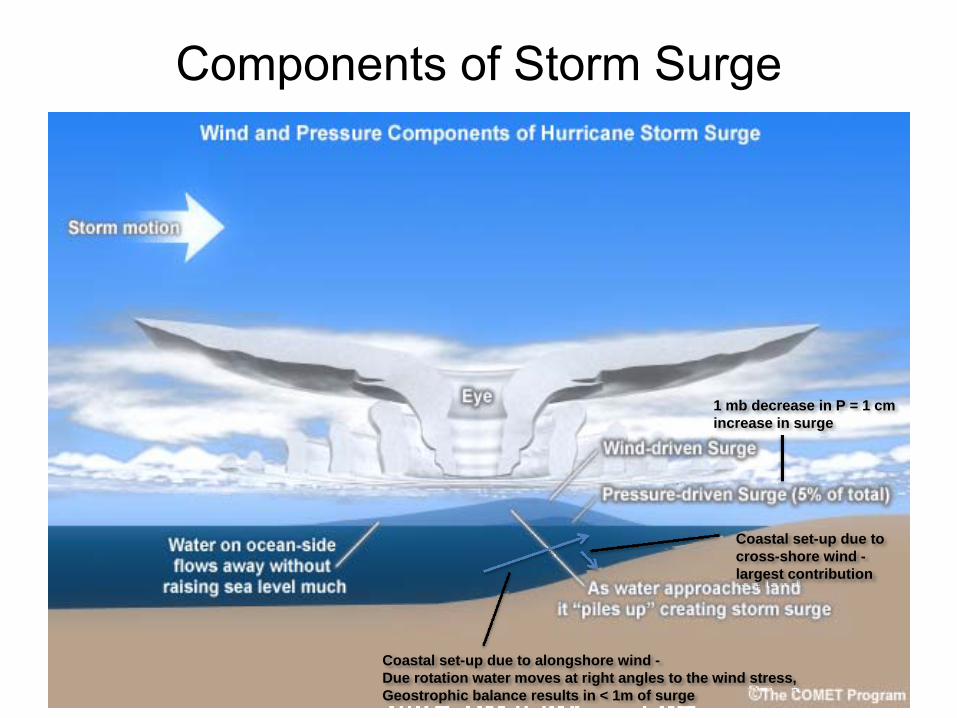
Coastal set-up due to alongshore wind -Due rotation water moves at right angles to the wind stress,Geostrophic balance results in < 1m of surge
Coastal set-up due to cross-shore wind -largest contribution
1 mb decrease in P = 1 cm increase in surge
Components of Storm Surge
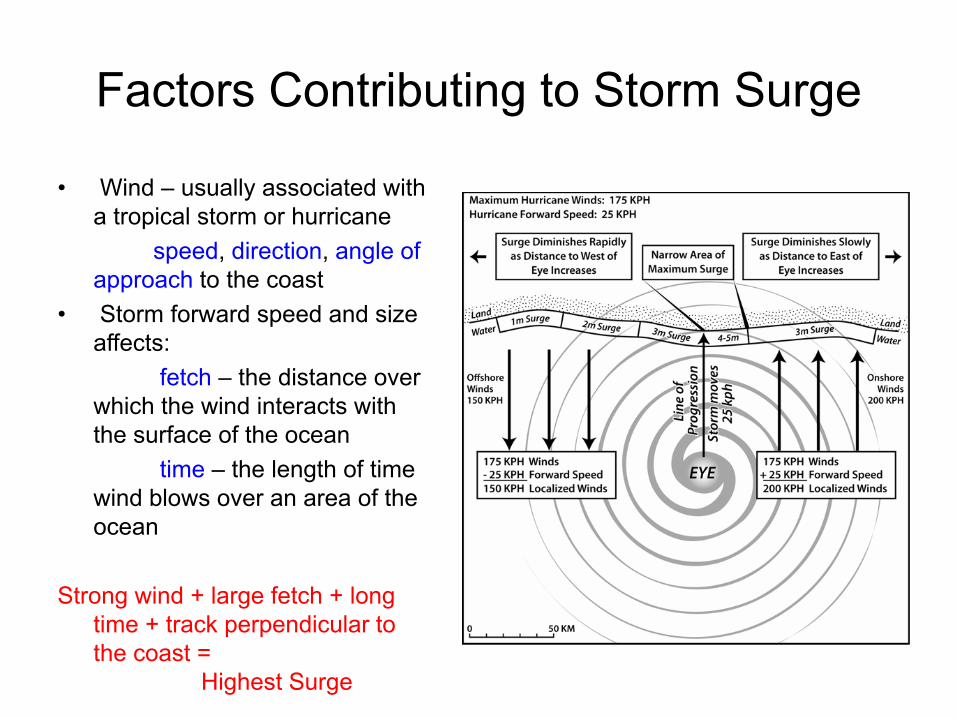
Factors Contributing to Storm Surge
• Wind – usually associated with a tropical storm or hurricane
speed, direction, angle of approach to the coast
• Storm forward speed and size affects:
fetch – the distance over which the wind interacts with the surface of the ocean
time – the length of time wind blows over an area of the ocean
Strong wind + large fetch + long time + track perpendicular to the coast =
Highest Surge
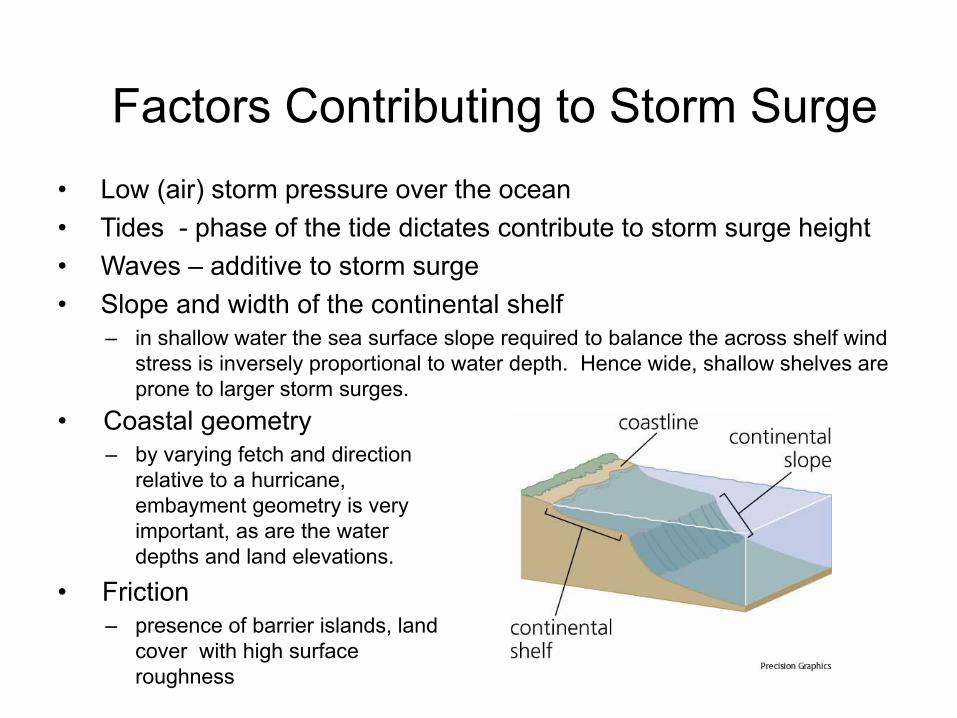
• Low (air) storm pressure over the ocean• Tides - phase of the tide dictates contribute to storm surge height• Waves – additive to storm surge• Slope and width of the continental shelf
– in shallow water the sea surface slope required to balance the across shelf wind stress is inversely proportional to water depth. Hence wide, shallow shelves are prone to larger storm surges.
• Coastal geometry – by varying fetch and direction
relative to a hurricane, embayment geometry is very important, as are the water depths and land elevations.
• Friction– presence of barrier islands, land
cover with high surface roughness
Factors Contributing to Storm Surge
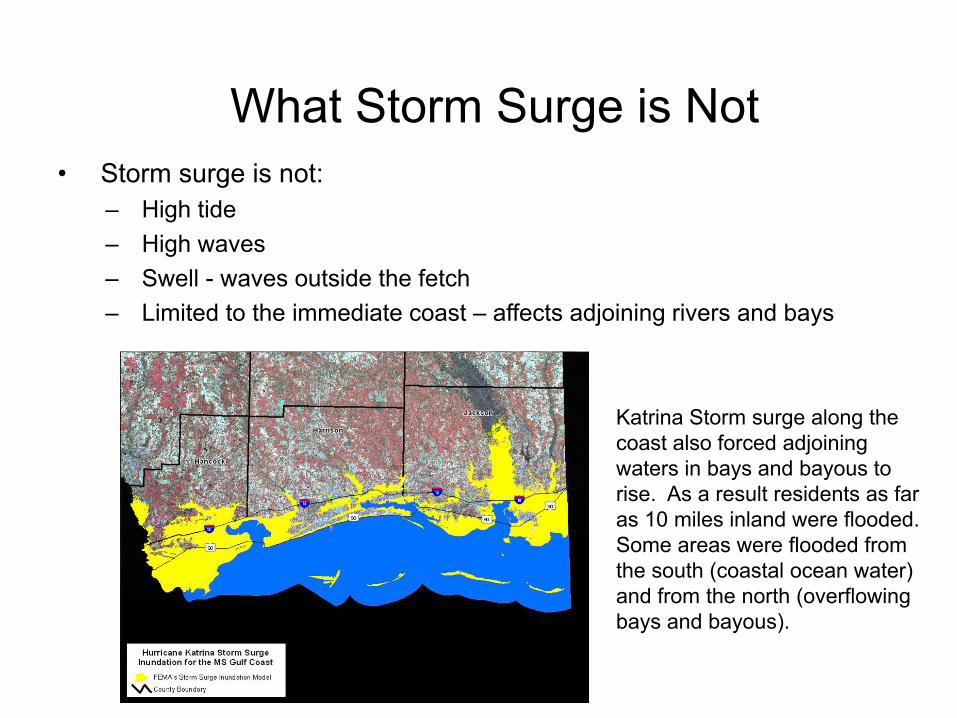
• Storm surge is not:– High tide– High waves– Swell - waves outside the fetch– Limited to the immediate coast – affects adjoining rivers and bays
What Storm Surge is Not
Katrina Storm surge along the coast also forced adjoining waters in bays and bayous to rise. As a result residents as far as 10 miles inland were flooded. Some areas were flooded from the south (coastal ocean water) and from the north (overflowing bays and bayous).
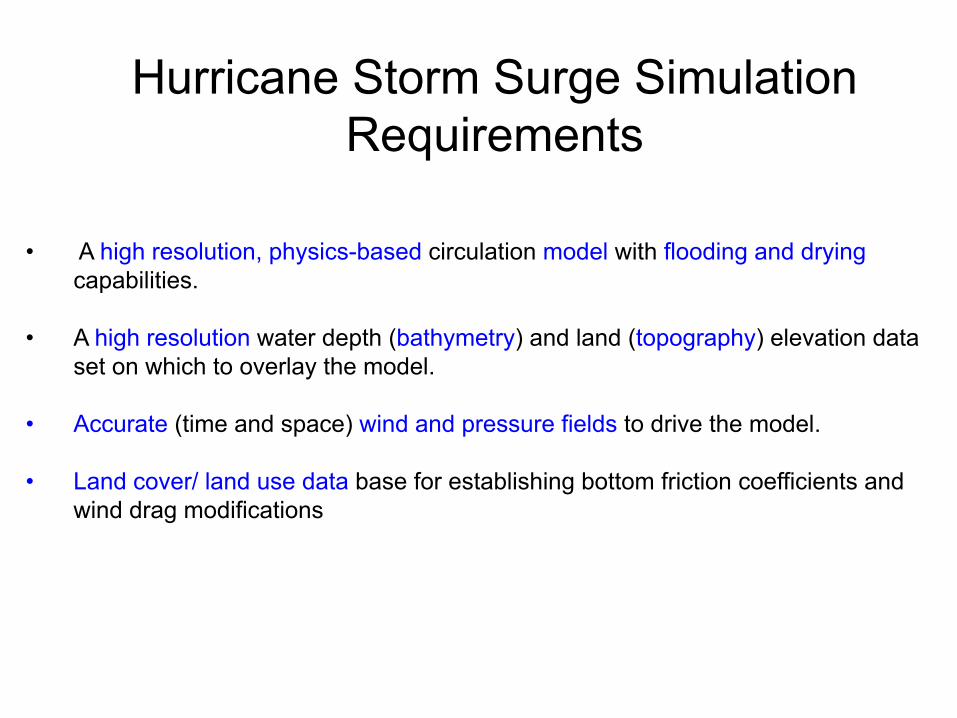
• A high resolution, physics-based circulation model with flooding and drying capabilities.
• A high resolution water depth (bathymetry) and land (topography) elevation data set on which to overlay the model.
• Accurate (time and space) wind and pressure fields to drive the model.
• Land cover/ land use data base for establishing bottom friction coefficients and wind drag modifications
Hurricane Storm Surge Simulation Requirements
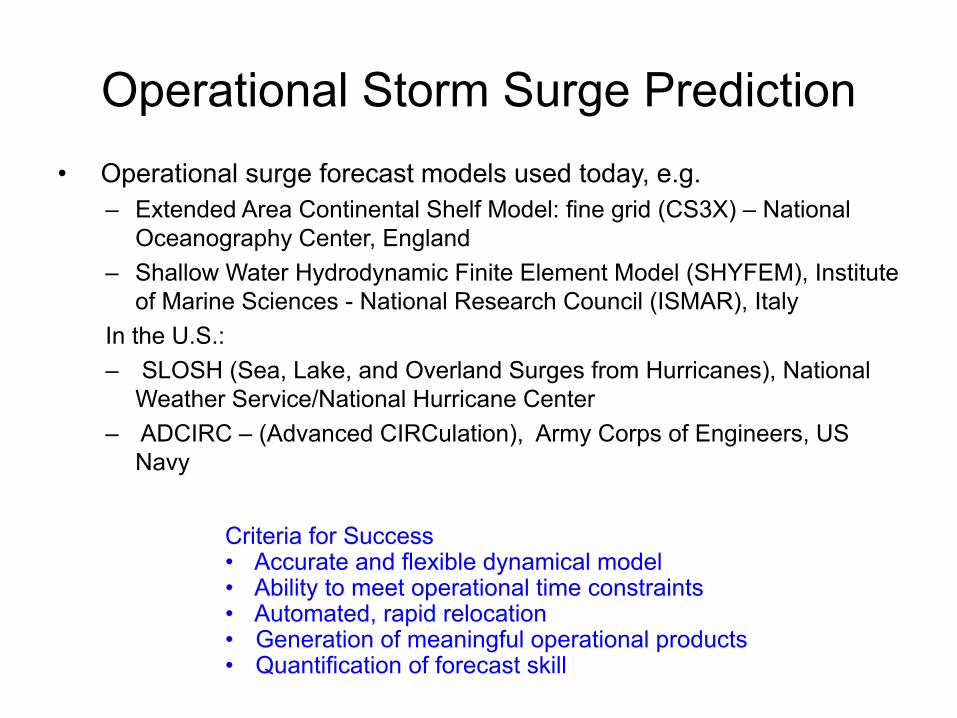
Operational Storm Surge Prediction• Operational surge forecast models used today, e.g.
– Extended Area Continental Shelf Model: fine grid (CS3X) – National Oceanography Center, England
– Shallow Water Hydrodynamic Finite Element Model (SHYFEM), Institute of Marine Sciences - National Research Council (ISMAR), Italy
In the U.S.:– SLOSH (Sea, Lake, and Overland Surges from Hurricanes), National
Weather Service/National Hurricane Center– ADCIRC – (Advanced CIRCulation), Army Corps of Engineers, US
Navy
Criteria for Success• Accurate and flexible dynamical model• Ability to meet operational time constraints• Automated, rapid relocation • Generation of meaningful operational products• Quantification of forecast skill
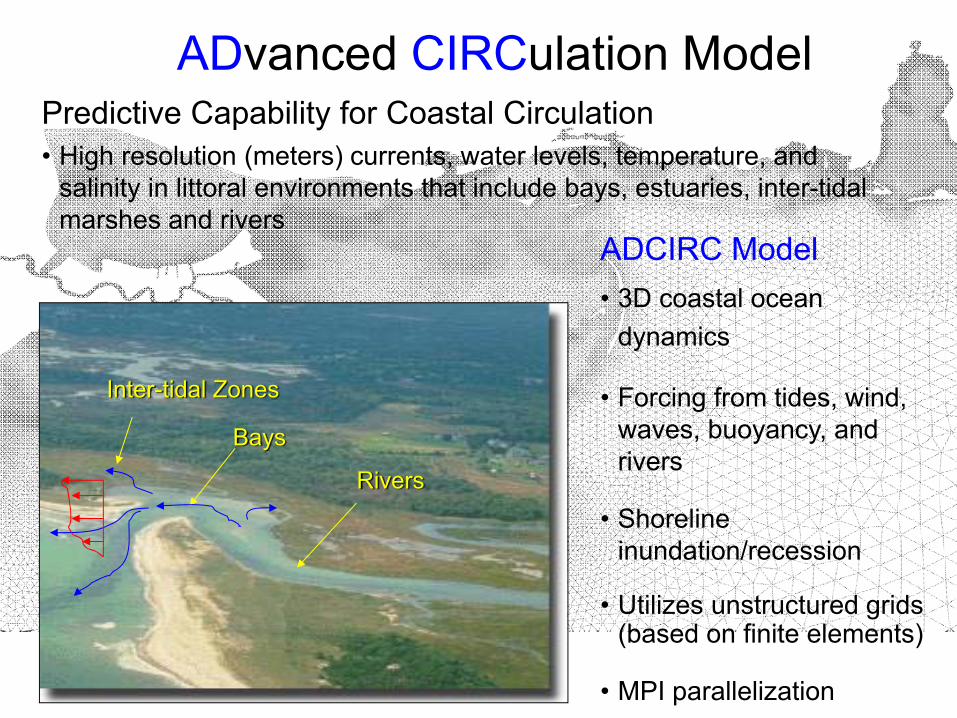
Inter-tidal Zones
Bays
Rivers
Predictive Capability for Coastal Circulation• High resolution (meters) currents, water levels, temperature, and
salinity in littoral environments that include bays, estuaries, inter-tidal marshes and rivers
ADCIRC Model• 3D coastal ocean
dynamics
• Forcing from tides, wind, waves, buoyancy, and rivers
• Shoreline inundation/recession
• Utilizes unstructured grids (based on finite elements)
• MPI parallelization
ADvanced CIRCulation Model
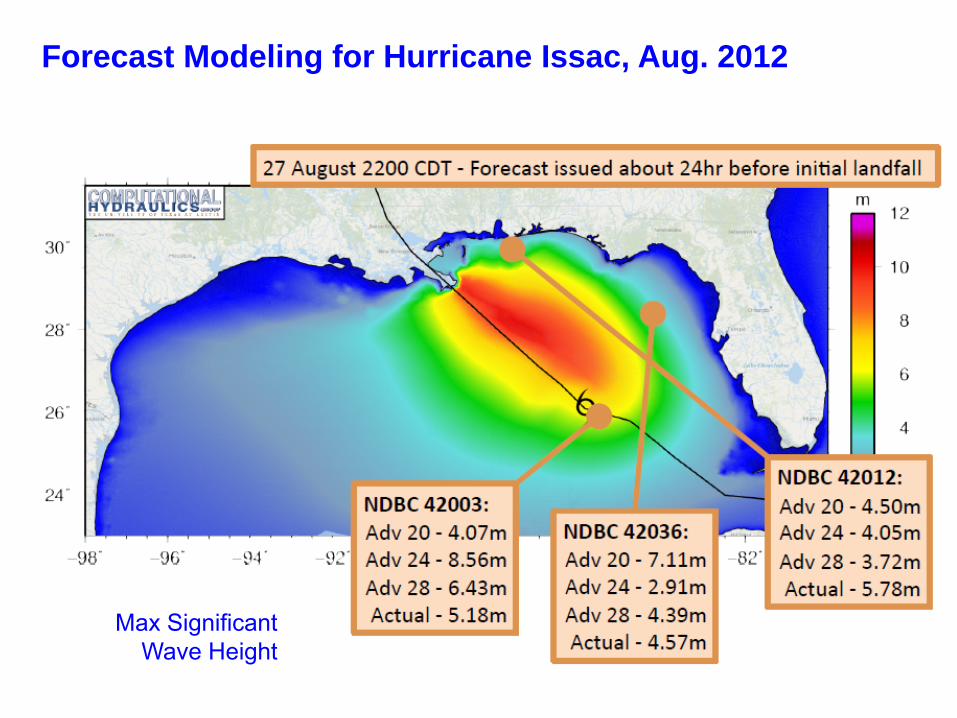
Forecast Modeling for Hurricane Issac, Aug. 2012
Max Significant Wave Height
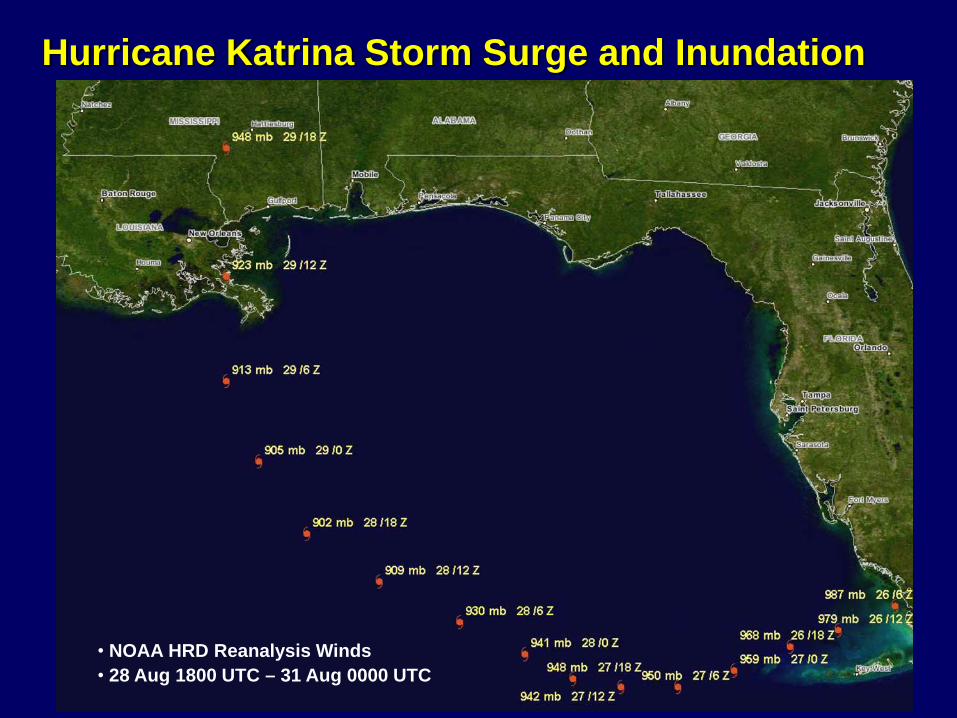
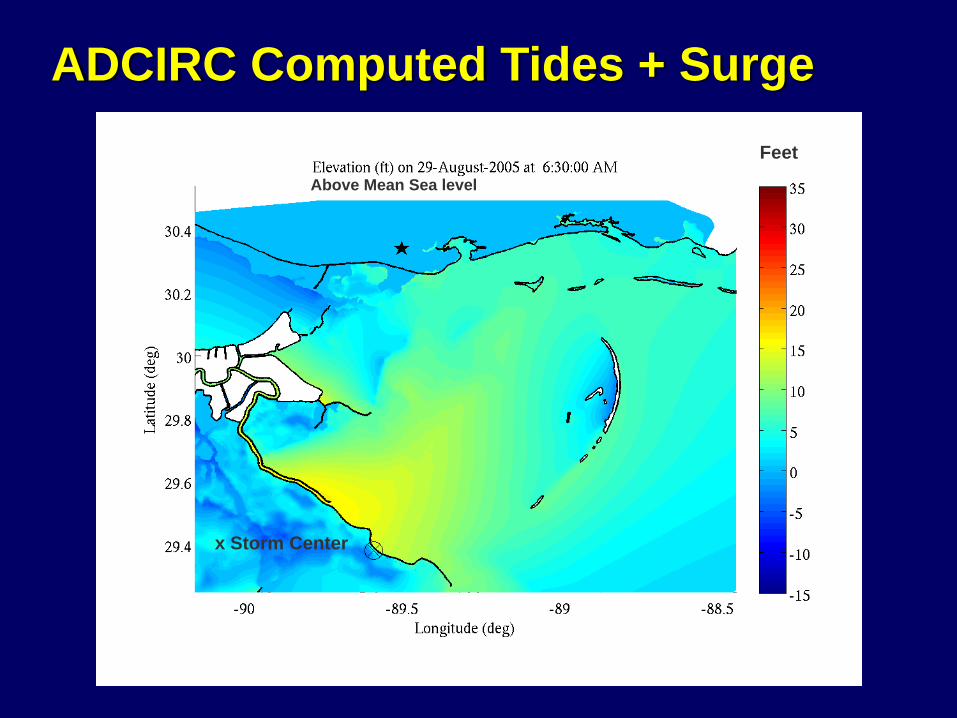
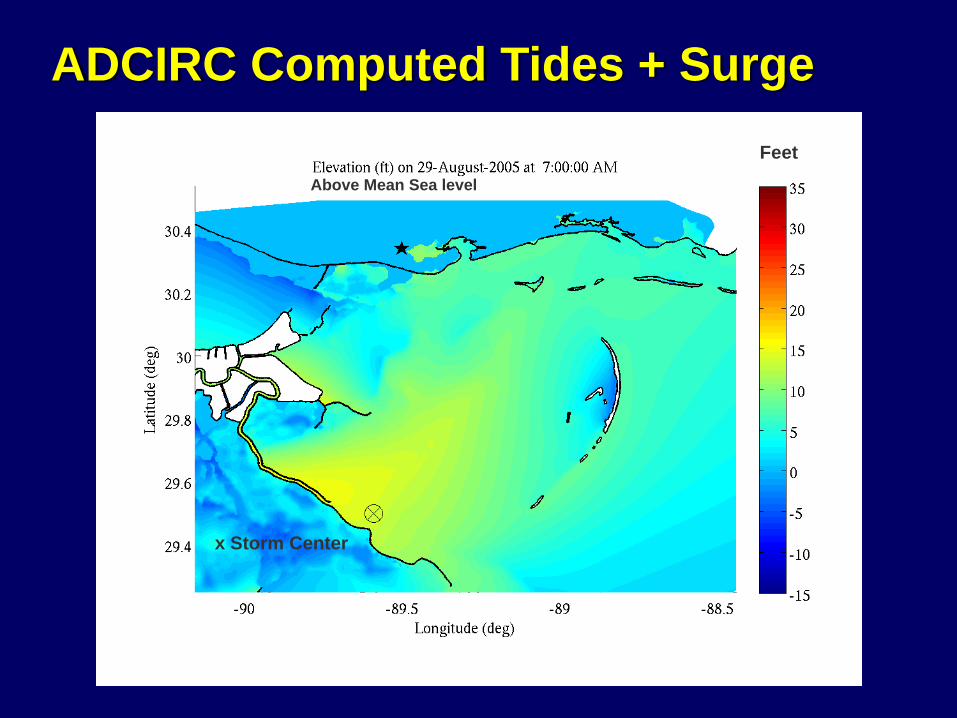
Hurricane Katrina Storm Surge and Inundation
• NOAA HRD Reanalysis Winds• 28 Aug 1800 UTC – 31 Aug 0000 UTC
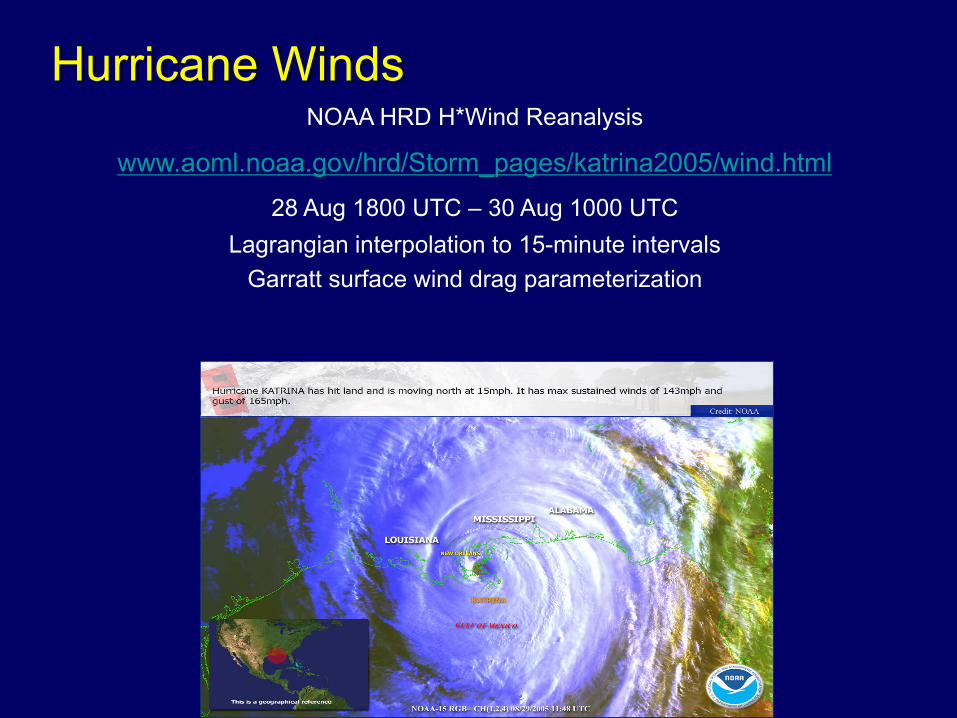
Hurricane WindsNOAA HRD H*Wind Reanalysis
www.aoml.noaa.gov/hrd/Storm_pages/katrina2005/wind.html
28 Aug 1800 UTC – 30 Aug 1000 UTCLagrangian interpolation to 15-minute intervals
Garratt surface wind drag parameterization
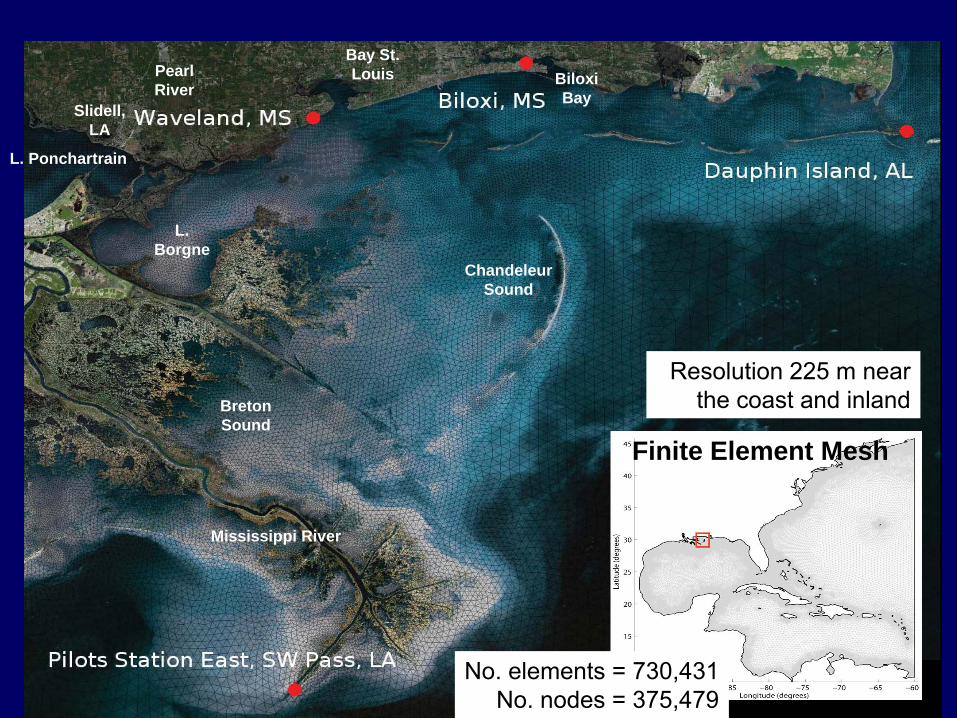
L. Ponchartrain
Slidell, LA
Pearl River
Bay St. Louis Biloxi
Bay
Mississippi River
L. Borgne
Breton Sound
Chandeleur Sound
No. elements = 730,431No. nodes = 375,479
Resolution 225 m near the coast and inland
Finite Element Mesh
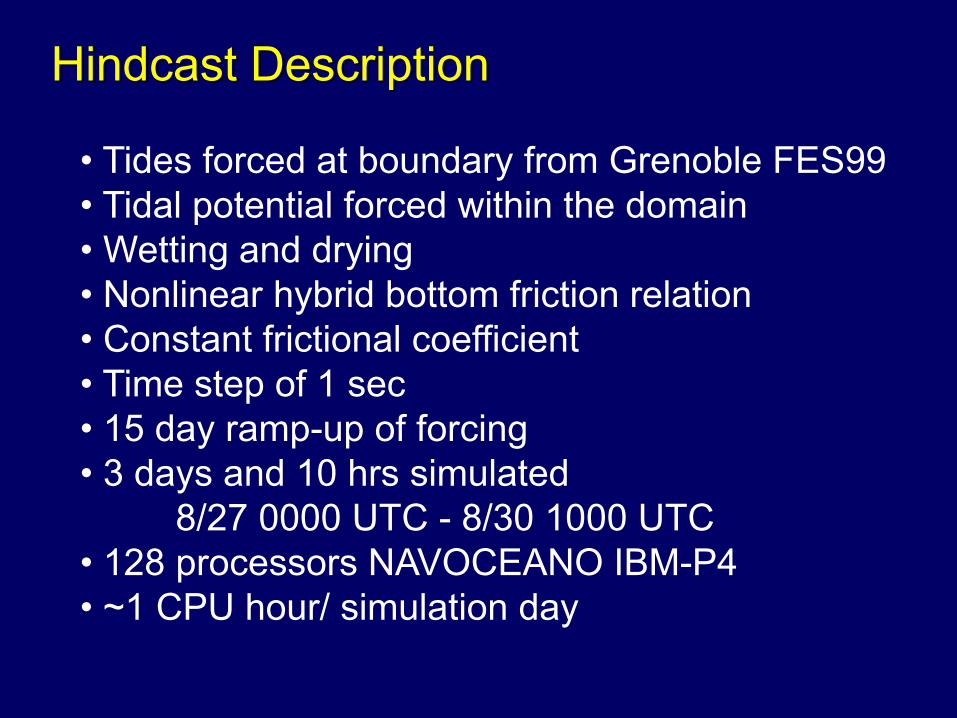
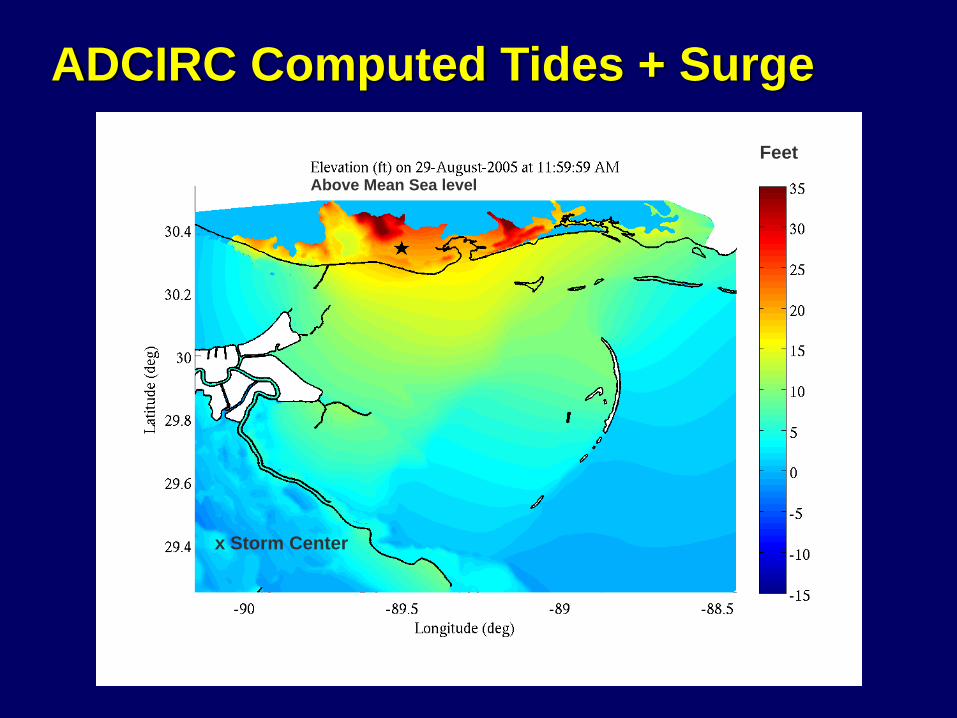
Hindcast Description
• Tides forced at boundary from Grenoble FES99• Tidal potential forced within the domain• Wetting and drying• Nonlinear hybrid bottom friction relation• Constant frictional coefficient• Time step of 1 sec• 15 day ramp-up of forcing• 3 days and 10 hrs simulated
8/27 0000 UTC - 8/30 1000 UTC• 128 processors NAVOCEANO IBM-P4 • ~1 CPU hour/ simulation day
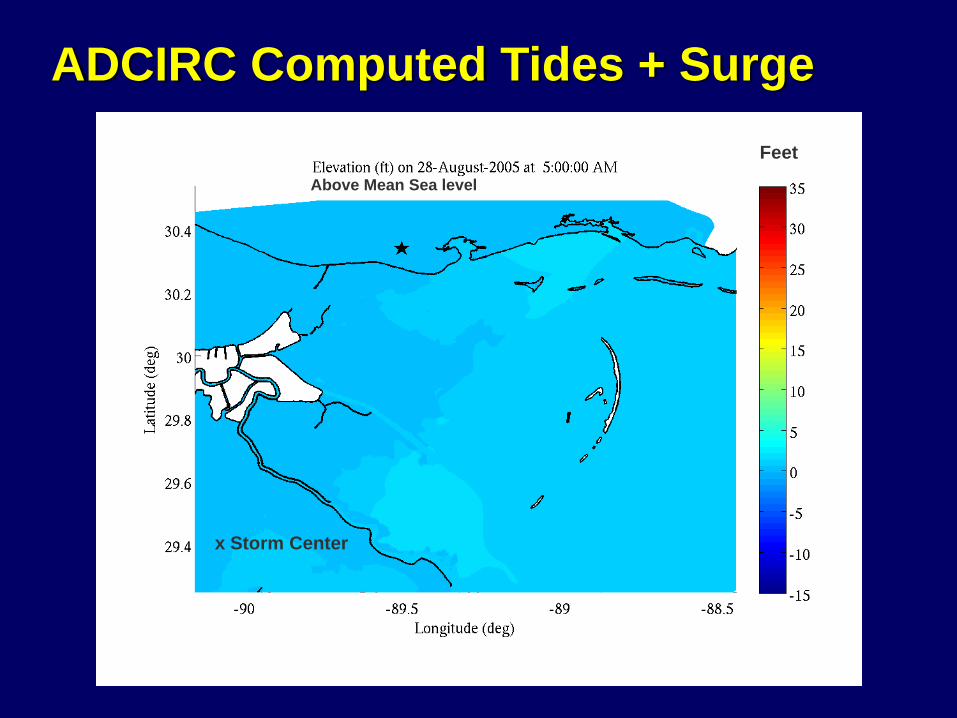
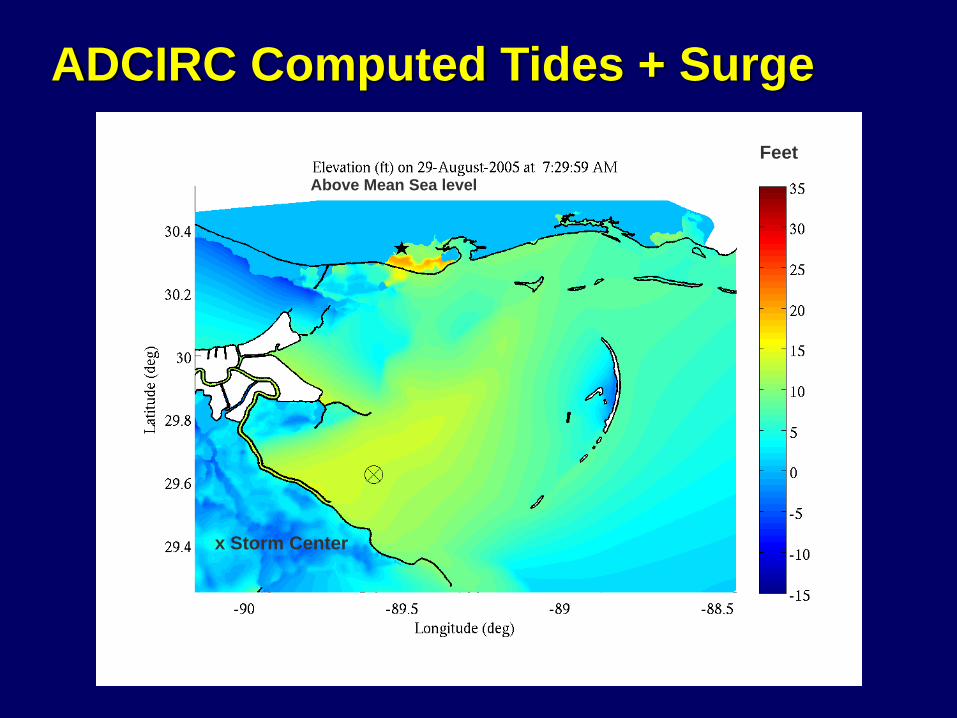
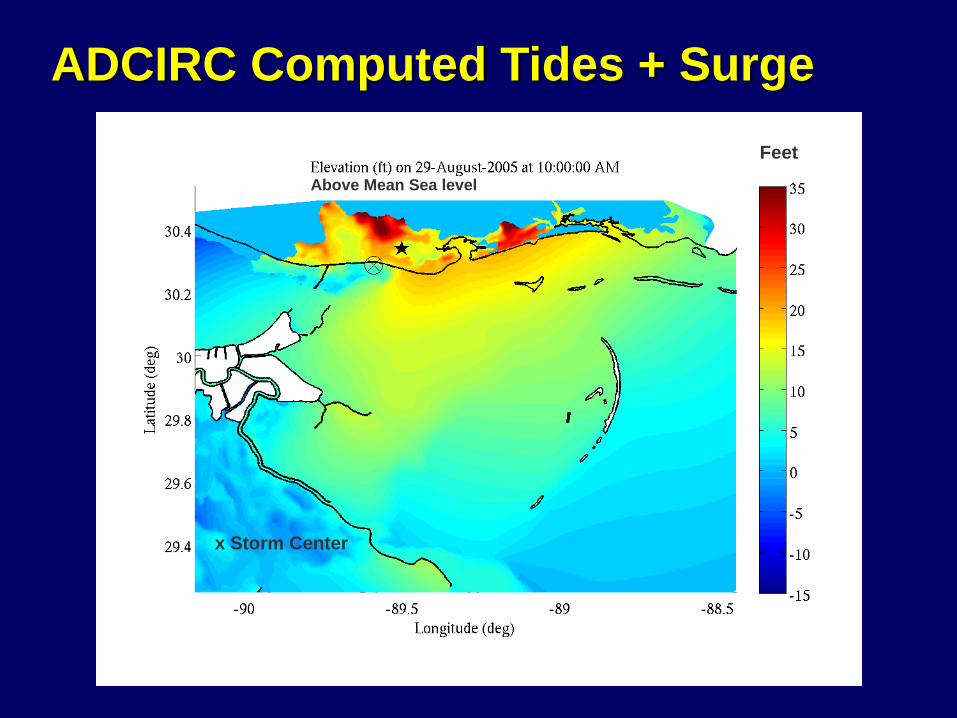
ADCIRC Computed Tides + Surge
x Storm Center
FeetAbove Mean Sea level
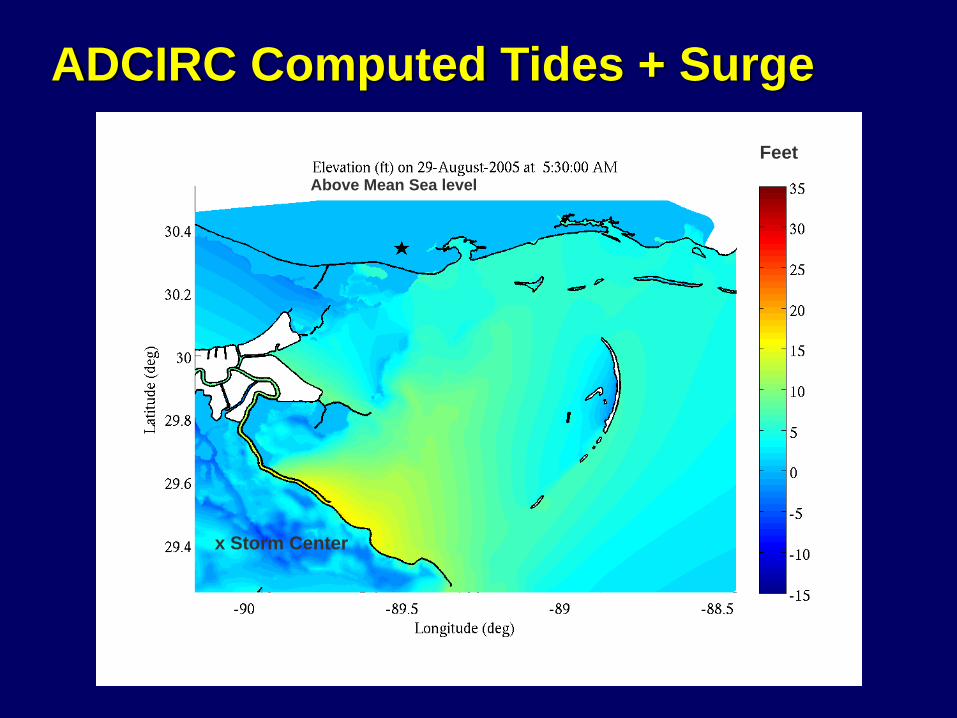
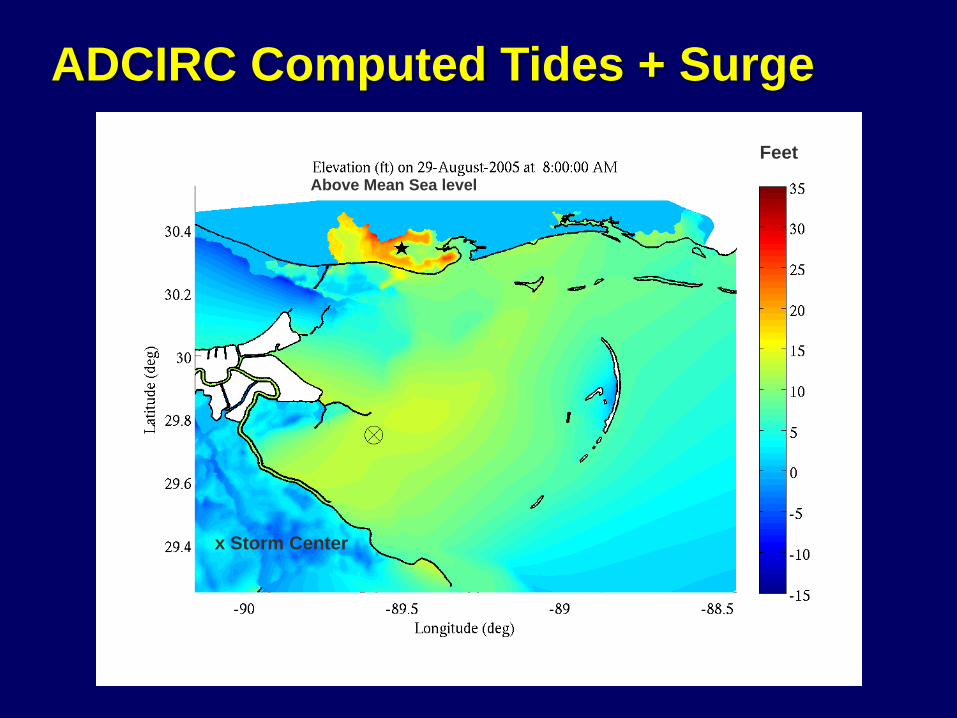
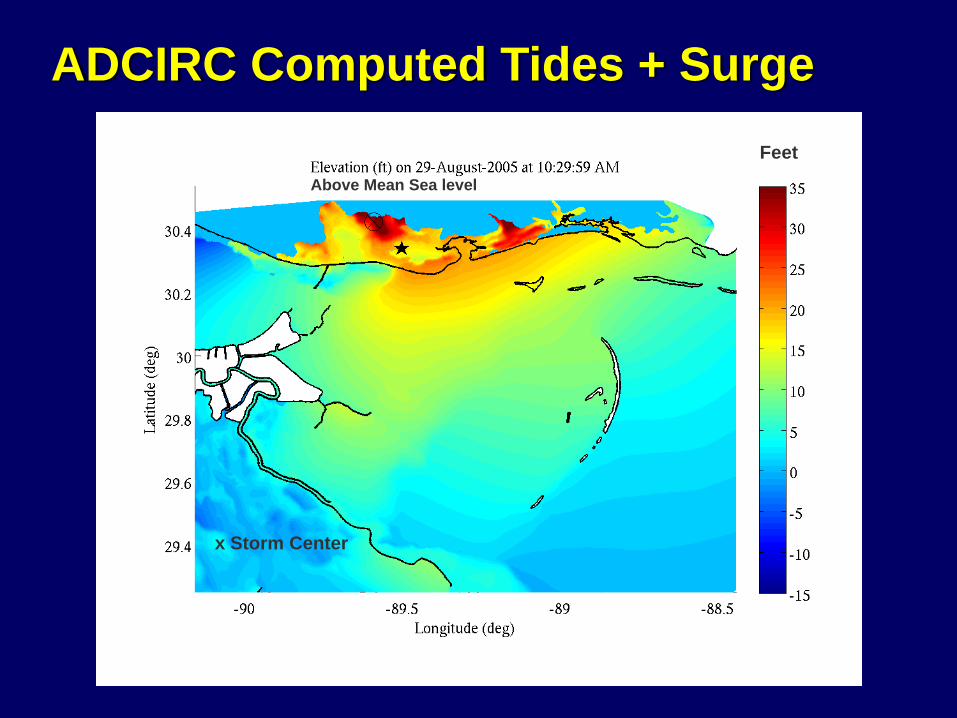
ADCIRC Computed Tides + Surge
x Storm Center
FeetAbove Mean Sea level

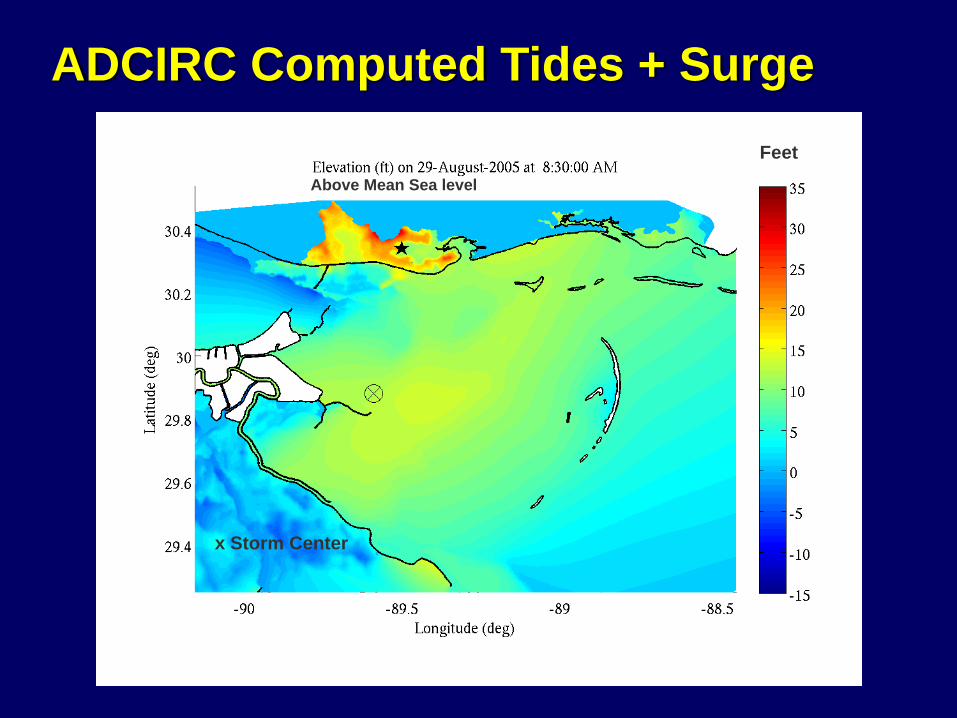
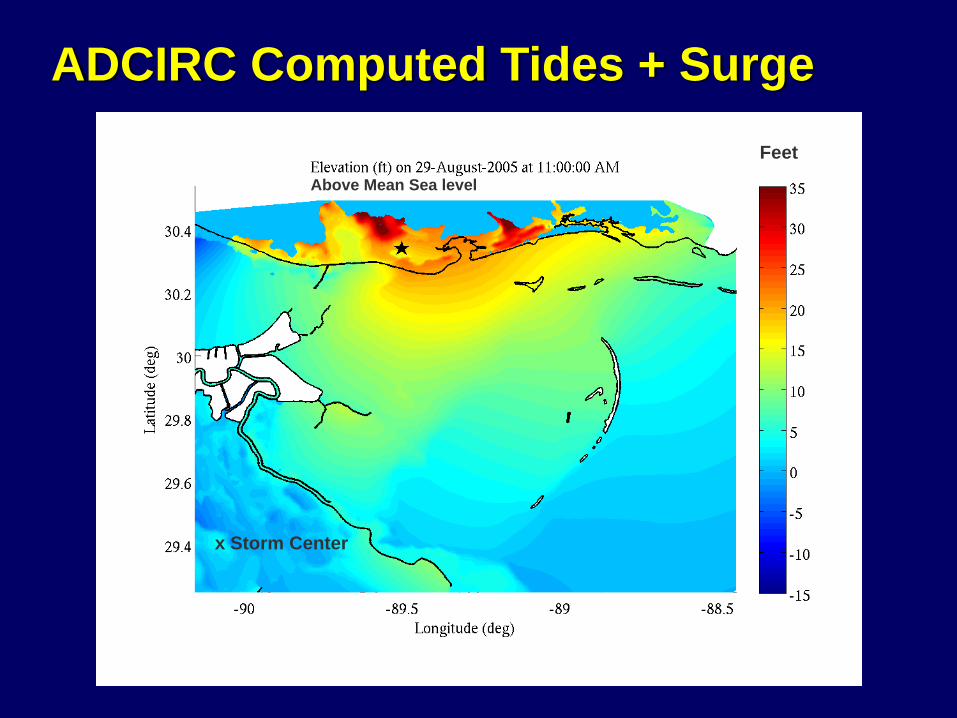
ADCIRC Computed Tides + Surge
x Storm Center
FeetAbove Mean Sea level
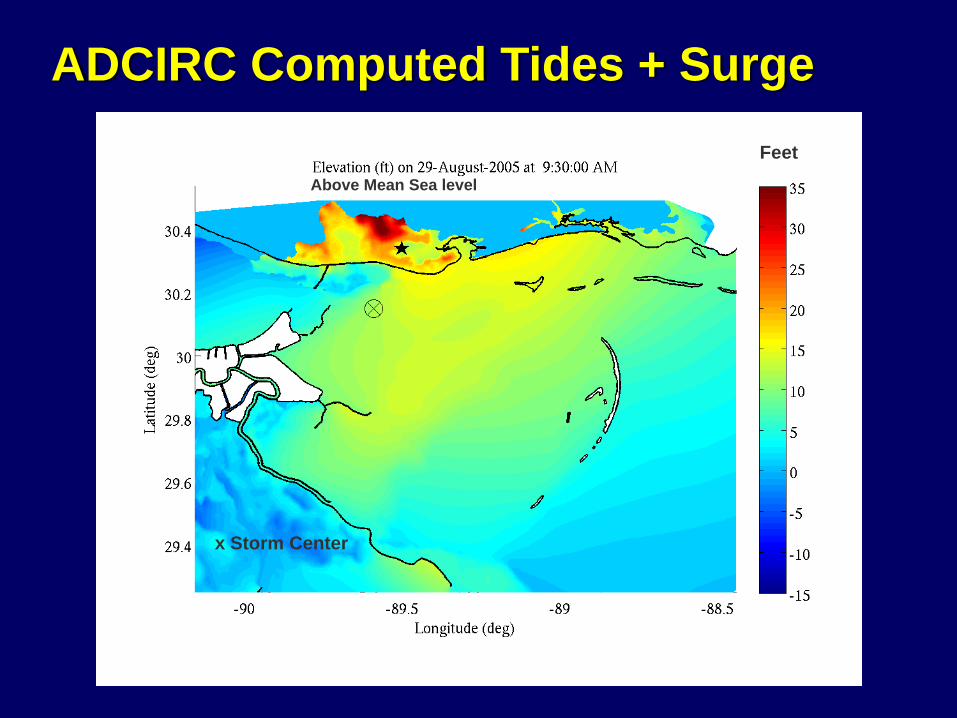
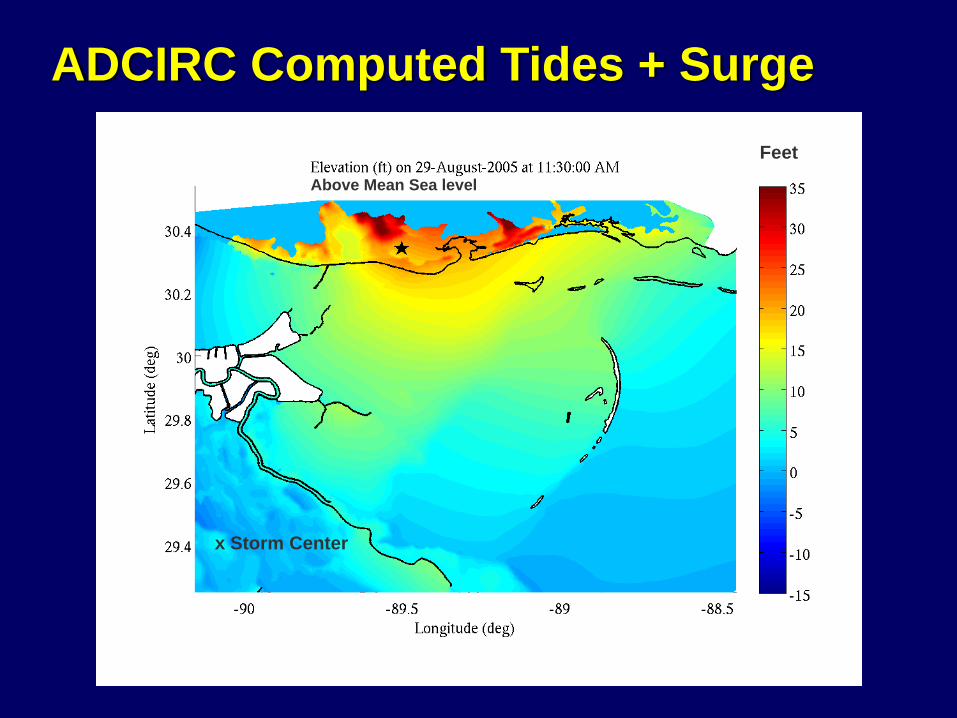
ADCIRC Computed Tides + Surge
x Storm Center
FeetAbove Mean Sea level
ADCIRC Computed Tides + Surge
x Storm Center
FeetAbove Mean Sea level
ADCIRC Computed Tides + Surge
x Storm Center
FeetAbove Mean Sea level
ADCIRC Computed Tides + Surge
x Storm Center
FeetAbove Mean Sea level
ADCIRC Computed Tides + Surge
x Storm Center
FeetAbove Mean Sea level

ADCIRC Computed Tides + Surge
x Storm Center
FeetAbove Mean Sea level
ADCIRC Computed Tides + Surge
x Storm Center
FeetAbove Mean Sea level
ADCIRC Computed Tides + Surge
x Storm Center
FeetAbove Mean Sea level
ADCIRC Computed Tides + Surge
x Storm Center
FeetAbove Mean Sea level
ADCIRC Computed Tides + Surge
x Storm Center
FeetAbove Mean Sea level
ADCIRC Computed Tides + Surge
x Storm Center
FeetAbove Mean Sea level
ADCIRC Computed Tides + Surge
Above Mean Sea level
x Storm Center
Feet
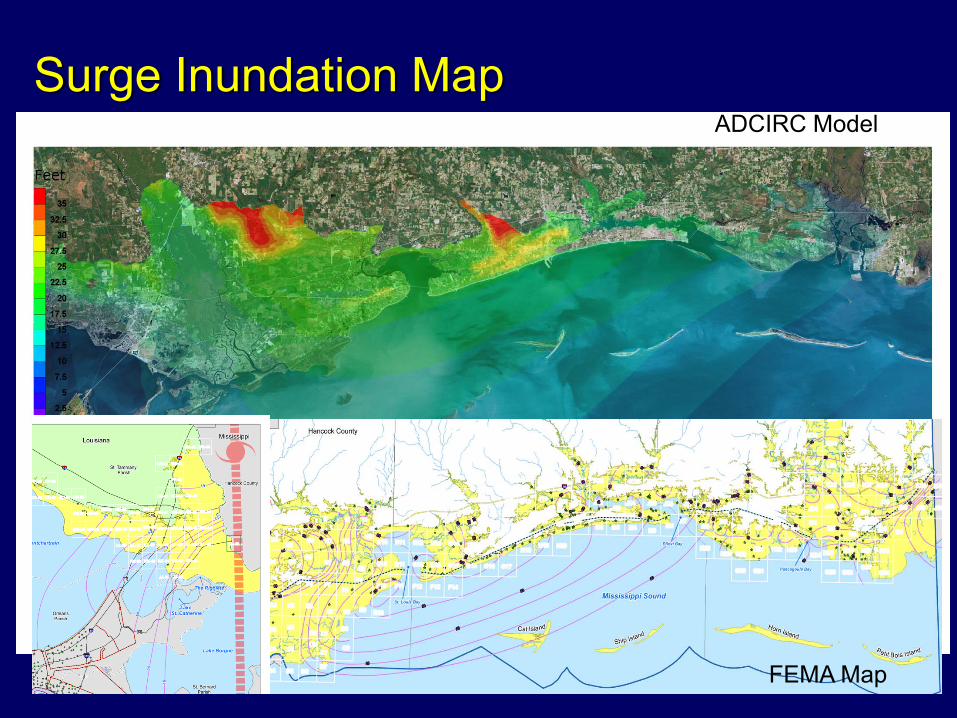
Surge Inundation MapADCIRC Model
FEMA Map
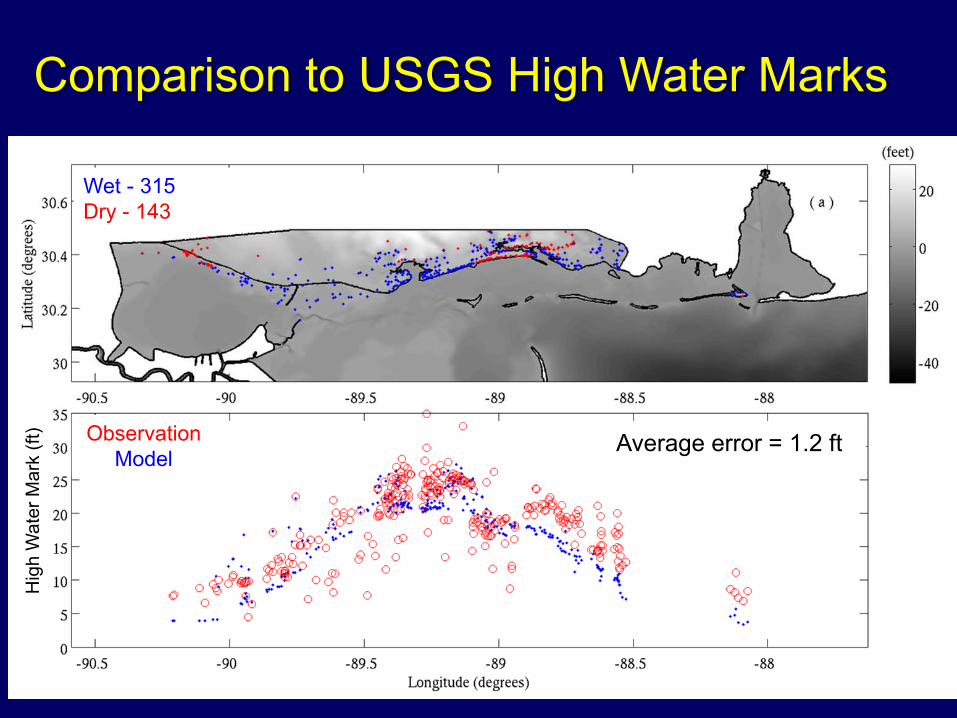
Comparison to USGS High Water Marks
Blain and Massey, in prep, 2006
Hig
h W
ater
Mar
k (ft
)
Wet - 315Dry - 143
Average error = 1.2 ftObservationModel
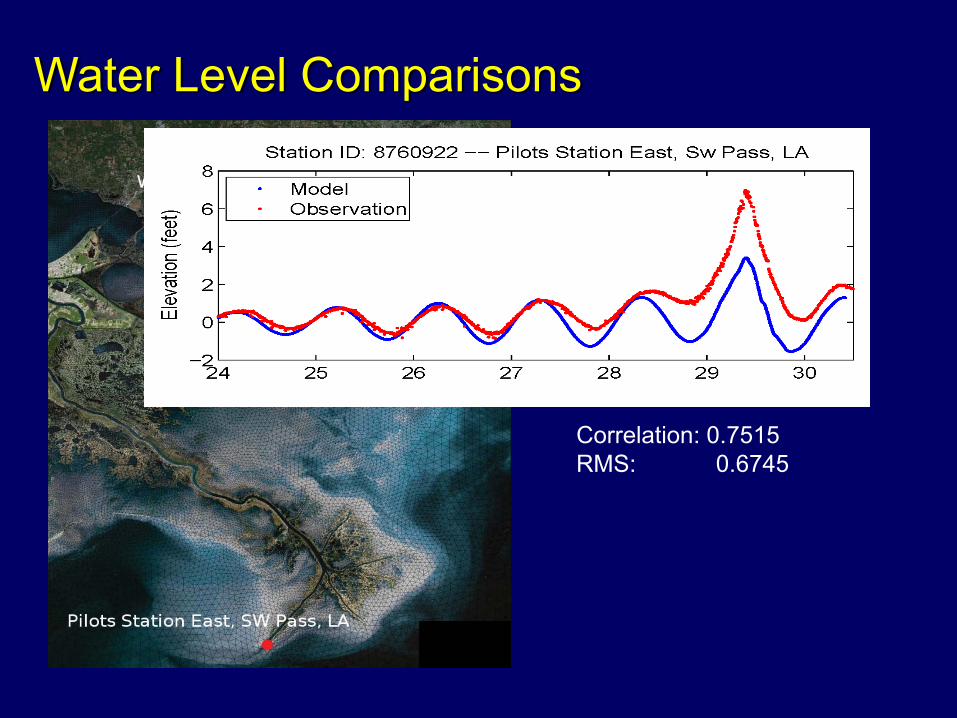
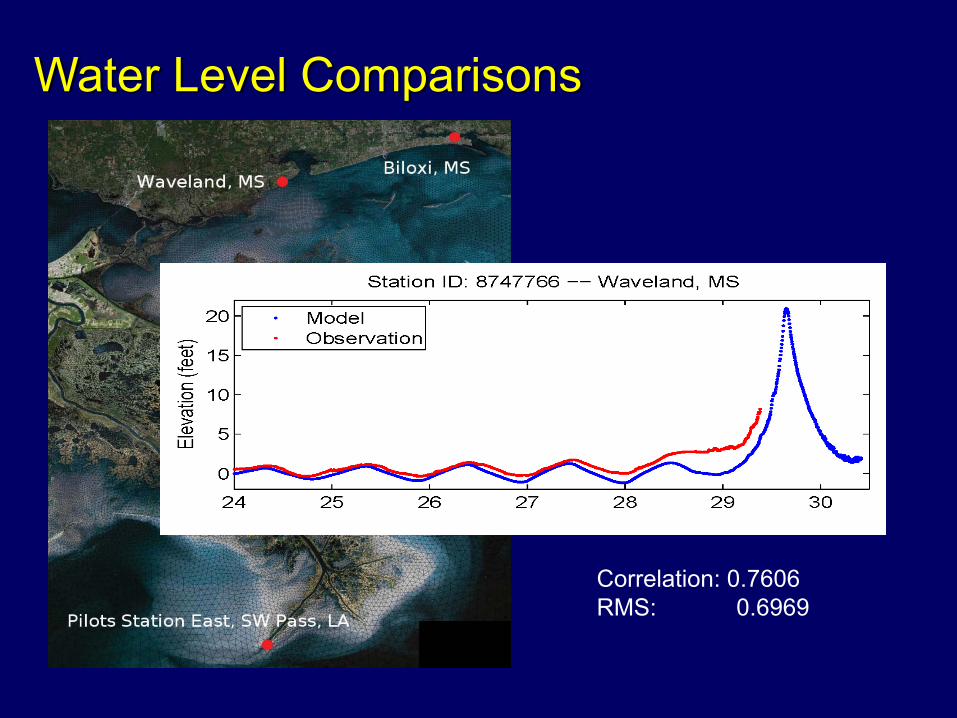
Water Level Comparisons
AugustCorrelation: 0.7515RMS: 0.6745
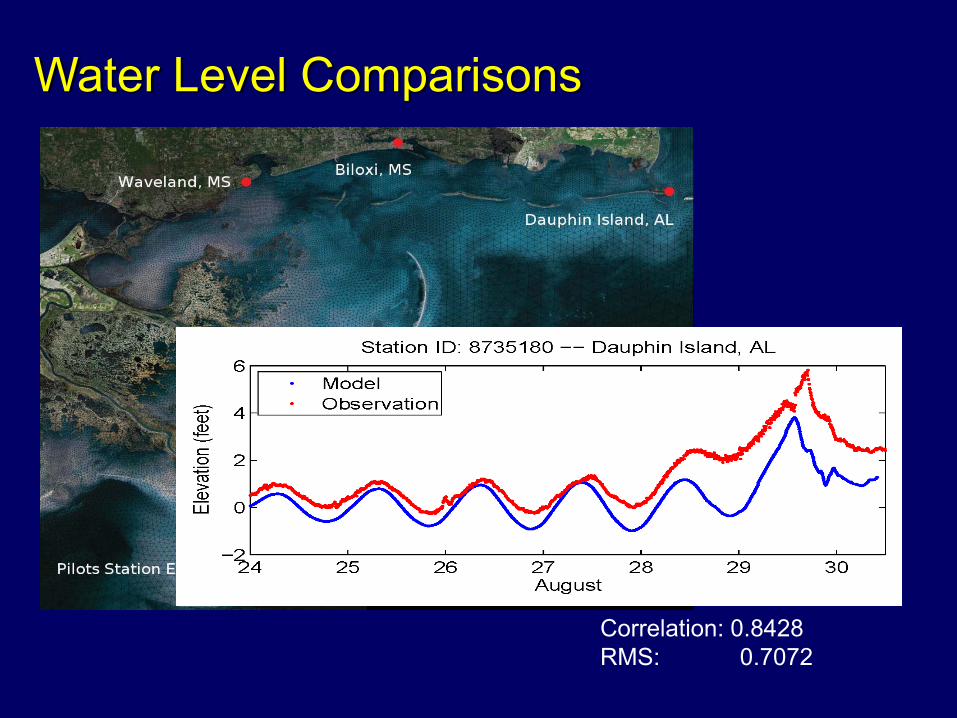
Water Level Comparisons
Correlation: 0.7606RMS: 0.6969
Water Level Comparisons
Correlation: 0.8428RMS: 0.7072
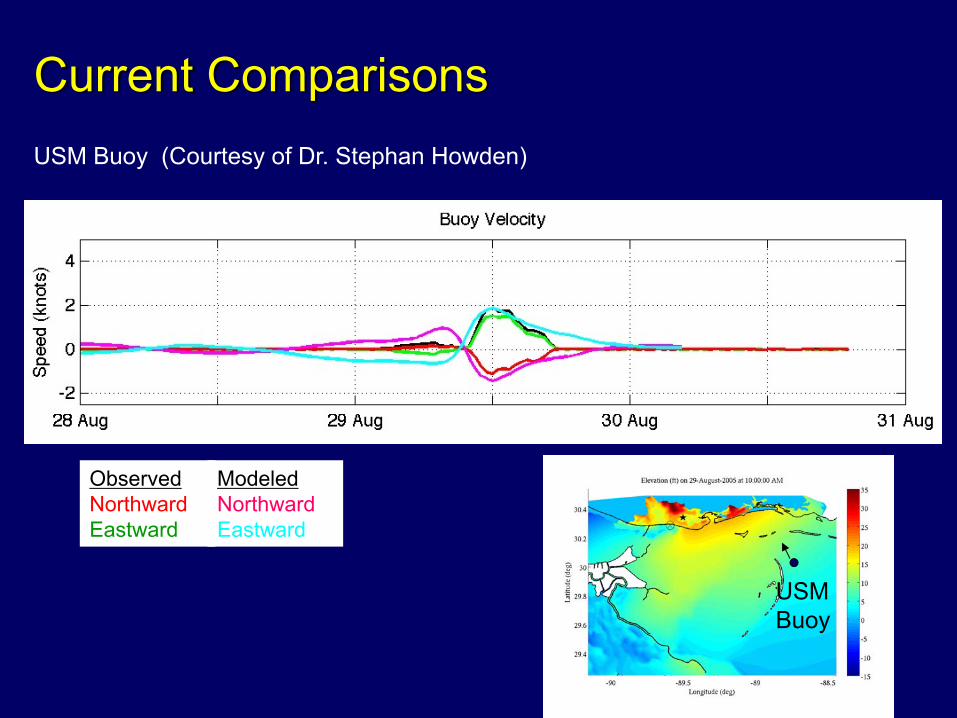
USM Buoy (Courtesy of Dr. Stephan Howden)
Current Comparisons
ObservedNorthwardEastward
ModeledNorthwardEastward
USM Buoy
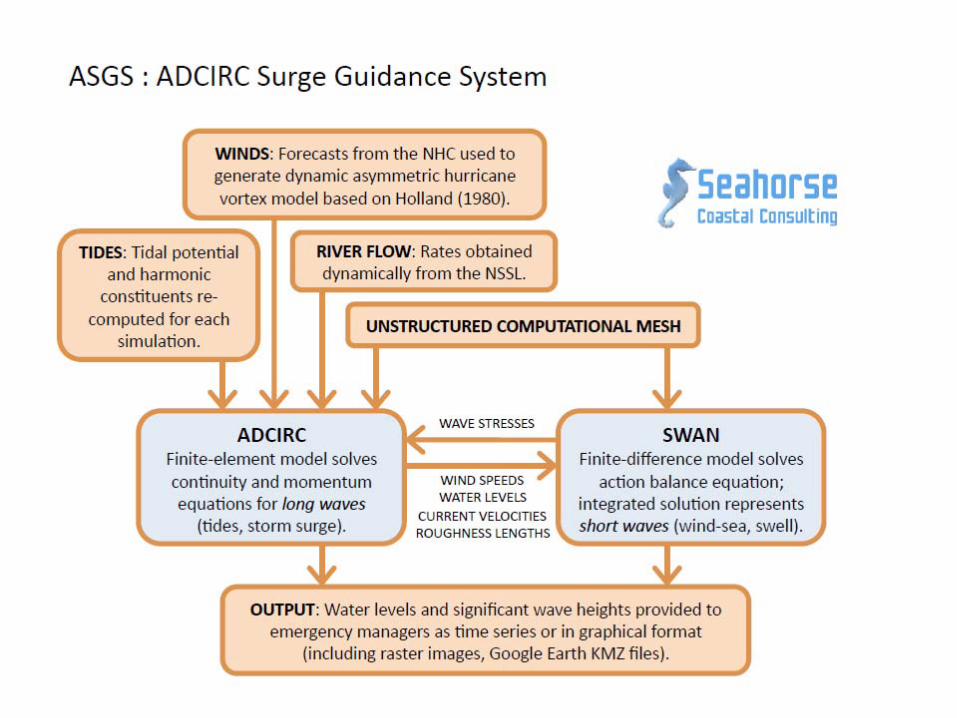
Hurricane Storm Surge Modeling
• The large domain strategy correctly captures– Basin to basin interactions– Basin to shelf dynamics– Shelf to adjacent coast/floodplain dynamics– Control structure and channel influence on flood
propagation
• The large domain strategy significantly simplifies the specification of boundary conditions by selecting hydrodynamically simple boundaries
• Localize resolution in the unstructured grid to accurately resolve the physics
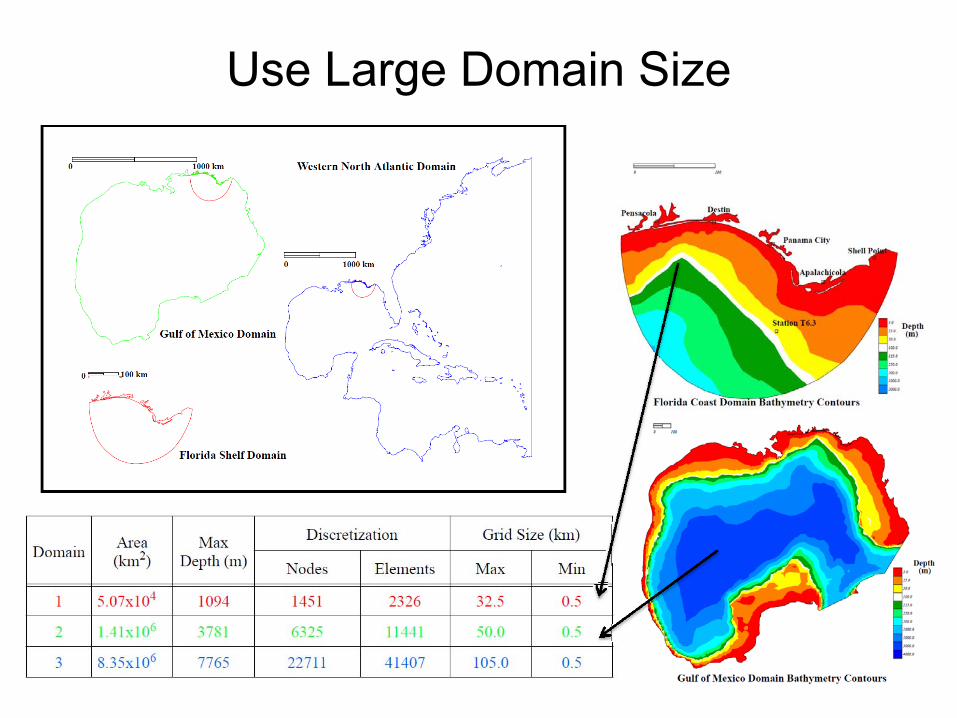
Use Large Domain Size
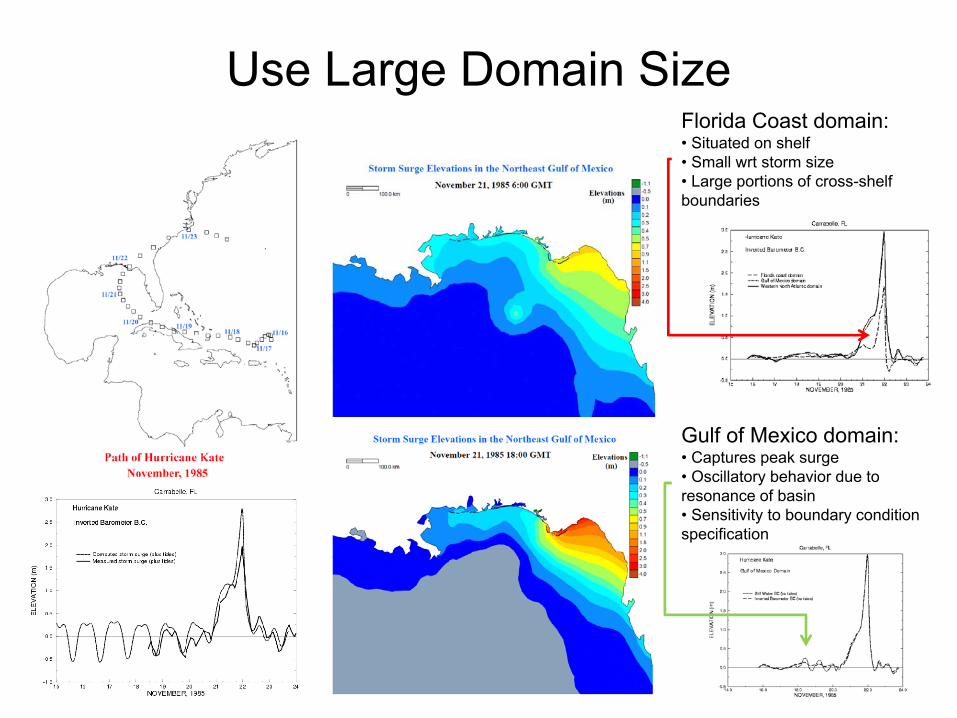
Florida Coast domain:• Situated on shelf• Small wrt storm size• Large portions of cross-shelf boundaries
Gulf of Mexico domain:• Captures peak surge• Oscillatory behavior due to resonance of basin• Sensitivity to boundary condition specification
Use Large Domain Size
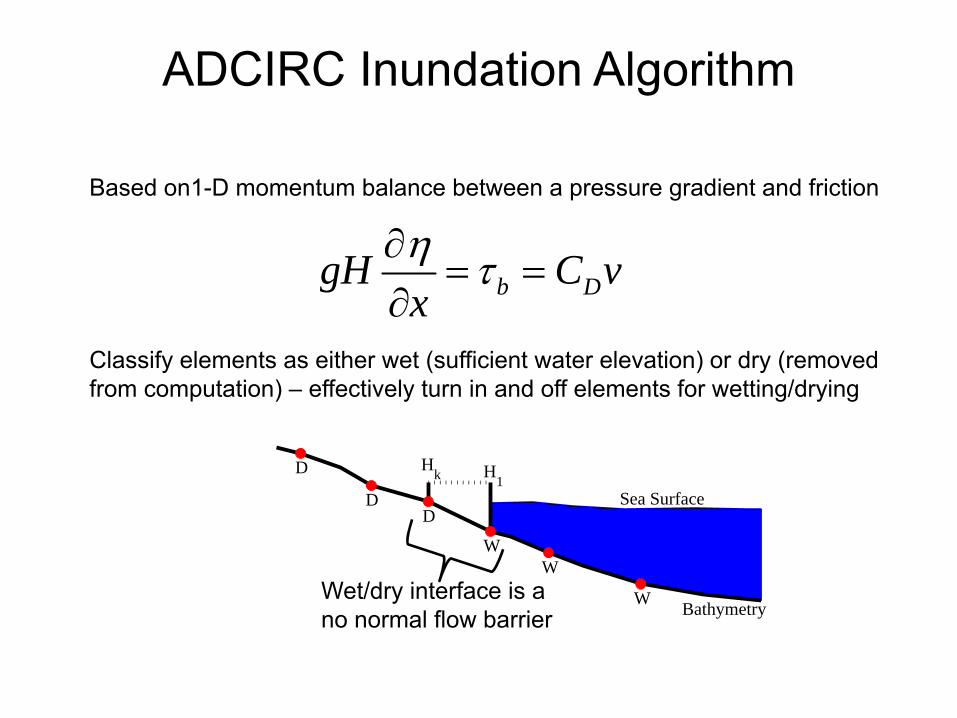
ADCIRC Inundation Algorithm
D
DD
WW
W
Hk H
1
Bathymetry
Sea Surface
Based on1-D momentum balance between a pressure gradient and friction
Classify elements as either wet (sufficient water elevation) or dry (removed from computation) – effectively turn in and off elements for wetting/drying
Wet/dry interface is a no normal flow barrier
b DgH C vxη τ∂= =
∂
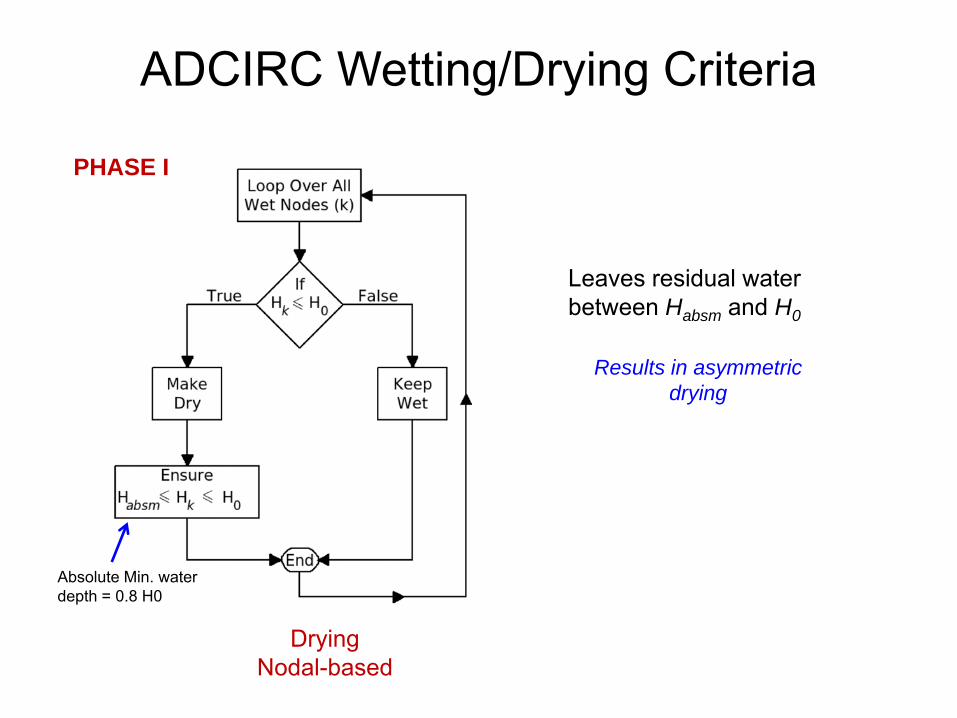
ADCIRC Wetting/Drying Criteria
DryingNodal-based
Absolute Min. water depth = 0.8 H0
PHASE I
Leaves residual water between Habsm and H0
Results in asymmetric drying
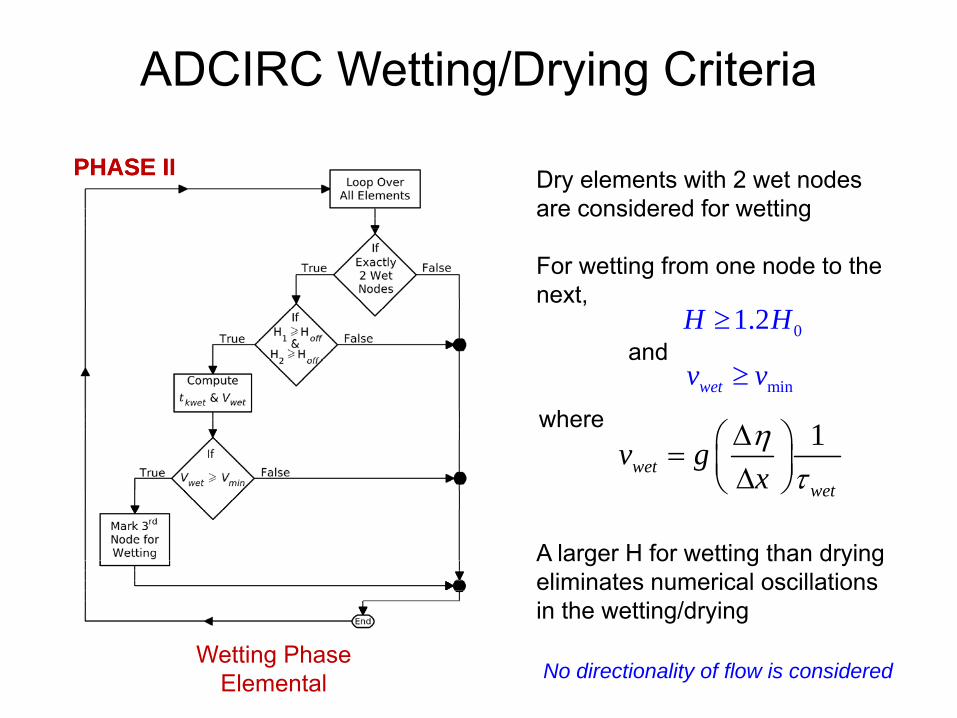
ADCIRC Wetting/Drying Criteria
Wetting PhaseElemental
PHASE IIPHASE I Dry elements with 2 wet nodes are considered for wetting
For wetting from one node to the next,
A larger H for wetting than drying eliminates numerical oscillations in the wetting/drying
No directionality of flow is considered
01.2H H≥
minwetv v≥and
where 1wet
wet
v gxη
τΔ⎛ ⎞= ⎜ ⎟Δ⎝ ⎠
0 5 10 15−0.2
−0.15
−0.1
−0.05
0
0.05
0.1
0.15
Time (hours)
Am
plitu
de (m
eter
s)
Tow
ards
Lan
d
Towards Land
Applied Elevation Forcing
Forcing shutoff after 9 hours.
1D Wetting/Drying on Gentle SlopeIssues:
• spatial asymmetry• temporal asymmetry btw wetting and drying• ponding
Solutions:• appropriate grid spacing and parameter specifications• gradient checking and smoothing• elemental averaging• moving towards DG flux-based approach
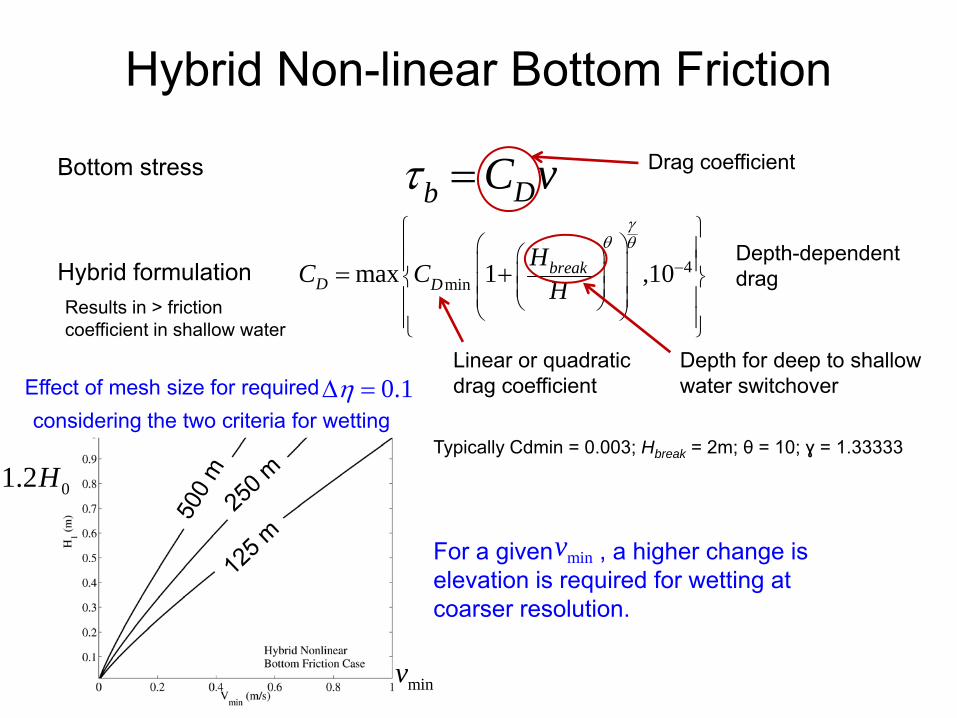
Hybrid Non-linear Bottom Friction
4minmax 1 ,10break
D DHC C
H
γθ θ
−
⎧ ⎫⎛ ⎞⎪ ⎪⎛ ⎞⎪ ⎪⎜ ⎟⎜ ⎟⎨ ⎬⎜ ⎟⎜ ⎟⎜ ⎟⎪ ⎪⎝ ⎠⎝ ⎠⎪ ⎪⎩ ⎭
= +
Db C vτ =
Hybrid formulation
Bottom stress
Depth-dependent drag
Drag coefficient
Linear or quadratic drag coefficient
Depth for deep to shallow water switchover
Results in > friction coefficient in shallow water
Typically Cdmin = 0.003; Hbreak = 2m; θ = 10; ɣ = 1.33333
Effect of mesh size for required
minv
01.2H
considering the two criteria for wetting
For a given , a higher change is elevation is required for wetting at coarser resolution.
minv
0.1ηΔ =
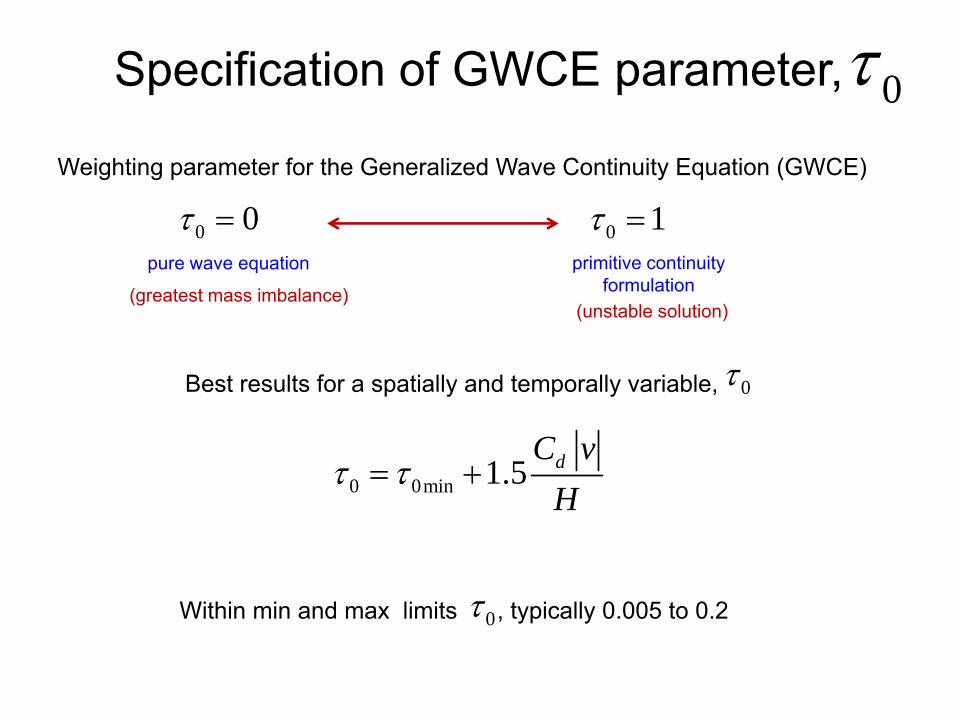
Specification of GWCE parameter,
0 0τ = 0 1τ =primitive continuity
formulationpure wave equation
(greatest mass imbalance)(unstable solution)
Weighting parameter for the Generalized Wave Continuity Equation (GWCE)
Best results for a spatially and temporally variable, 0τ
Within min and max limits , typically 0.005 to 0.2 0τ
0 0min 1.5 dC vH
τ τ= +
0τ
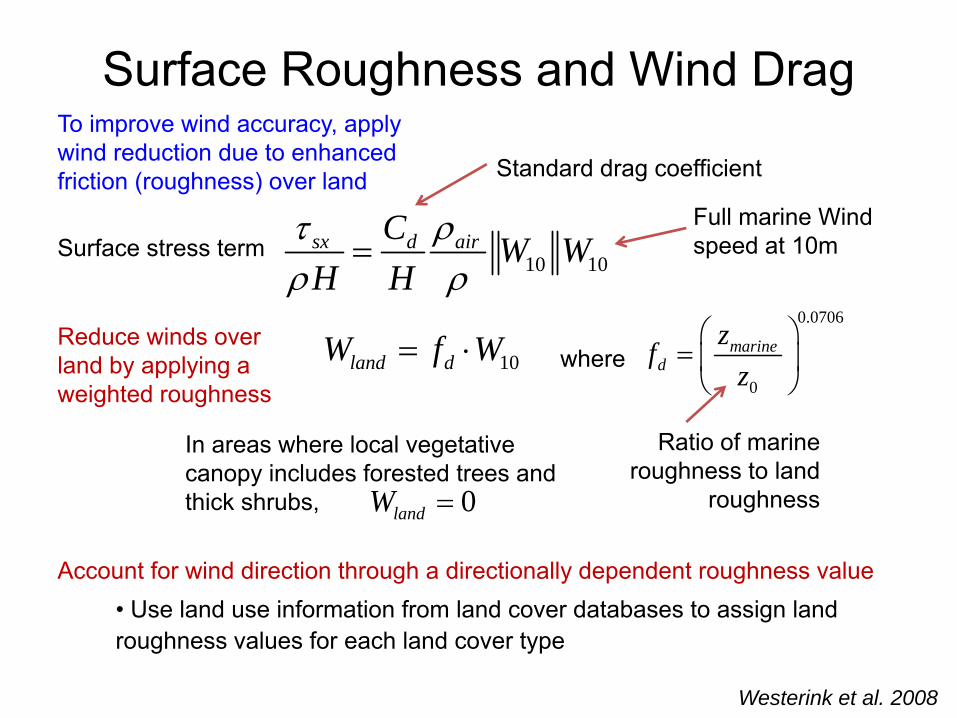
Surface Roughness and Wind Drag
10 10sx d airC W WH Hτ ρρ ρ
=Surface stress termFull marine Wind speed at 10m
Standard drag coefficient
10land dW f W= ⋅Reduce winds over land by applying a weighted roughness
where
0.0706
0
marined
zfz
⎛ ⎞= ⎜ ⎟⎝ ⎠
Ratio of marine roughness to land
roughness0landW =
In areas where local vegetative canopy includes forested trees and thick shrubs,
Account for wind direction through a directionally dependent roughness value• Use land use information from land cover databases to assign land roughness values for each land cover type
Westerink et al. 2008
To improve wind accuracy, apply wind reduction due to enhanced friction (roughness) over land
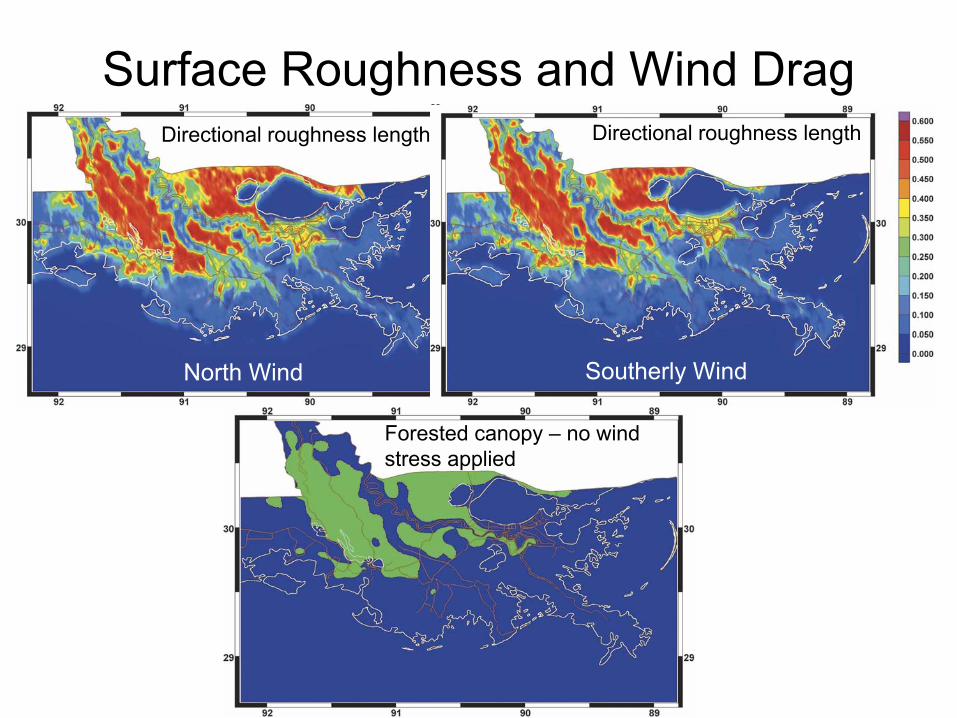
Surface Roughness and Wind Drag
North Wind Southerly Wind
Directional roughness length Directional roughness length
Forested canopy – no wind stress applied
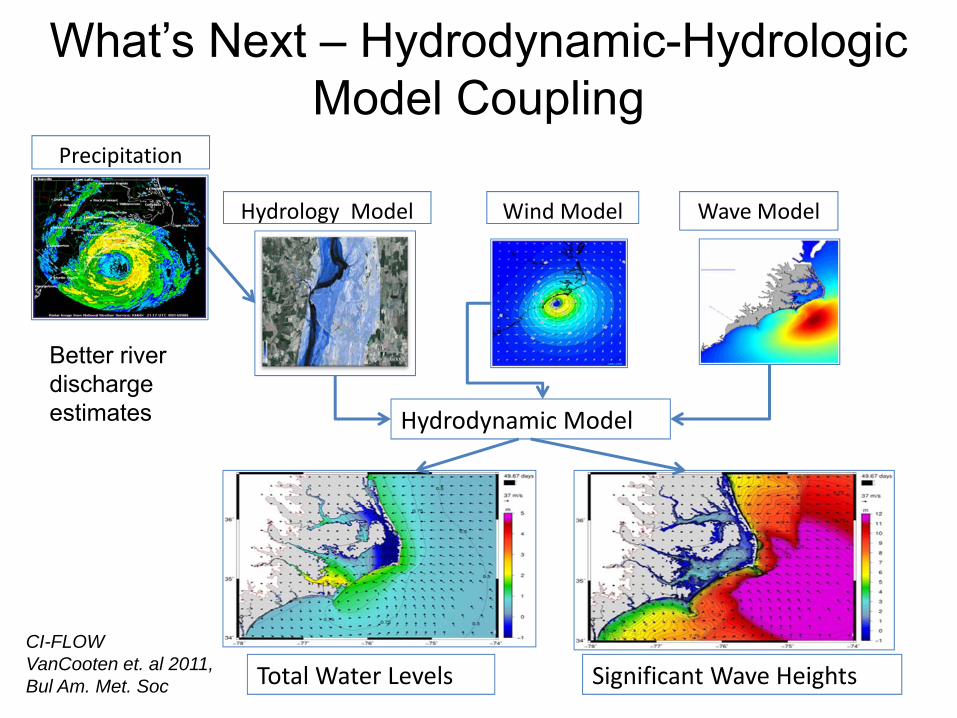
What’s Next – Hydrodynamic-Hydrologic Model Coupling
Precipitation
Wave ModelHydrology Model Wind Model
Total Water Levels Significant Wave Heights
Hydrodynamic Model
Better river discharge estimates
CI-FLOWVanCooten et. al 2011, Bul Am. Met. Soc
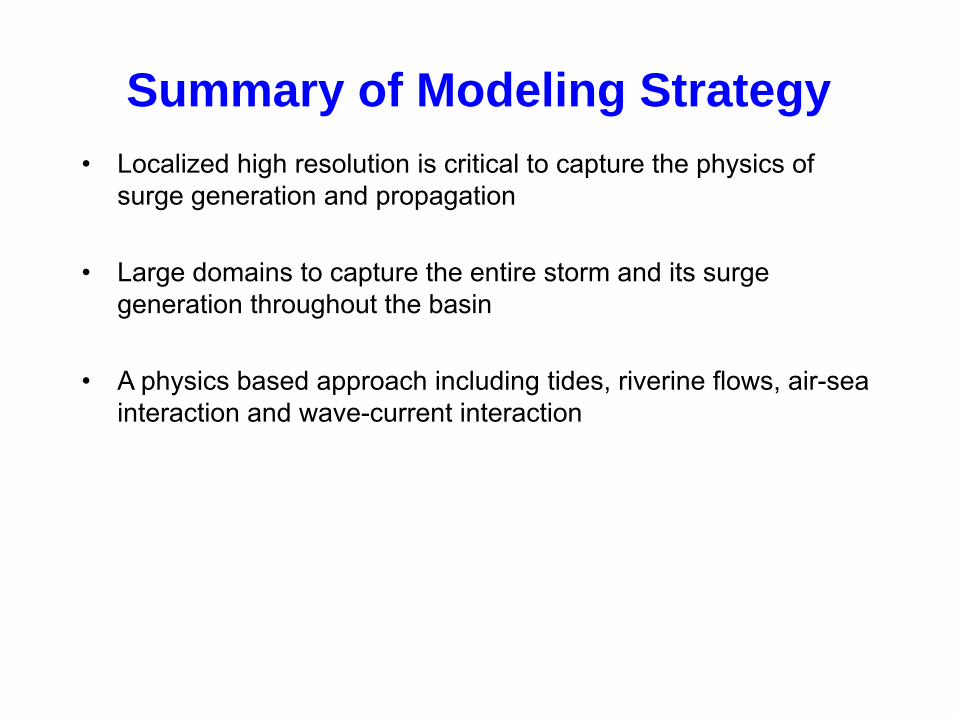
Summary of Modeling Strategy• Localized high resolution is critical to capture the physics of
surge generation and propagation
• Large domains to capture the entire storm and its surge generation throughout the basin
• A physics based approach including tides, riverine flows, air-sea interaction and wave-current interaction
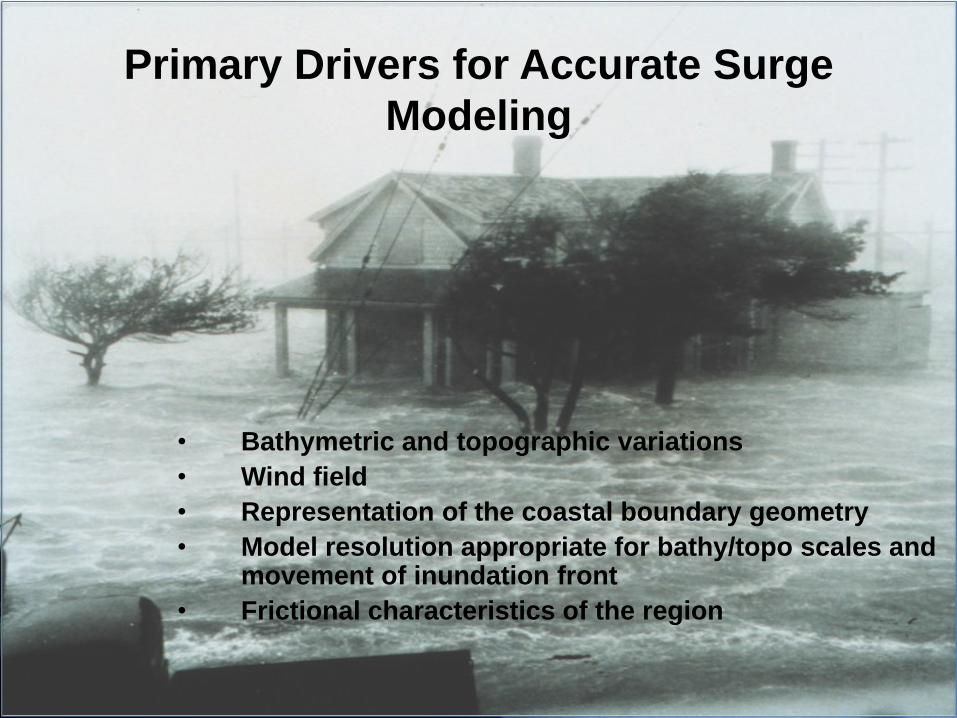
Primary Drivers for Accurate Surge Modeling
• Bathymetric and topographic variations• Wind field• Representation of the coastal boundary geometry• Model resolution appropriate for bathy/topo scales and
movement of inundation front• Frictional characteristics of the region