Embed Size (px)
Citation preview
5The Price Dynamics Around Sensex ReconstitutionsThe ICFAI Journal of APPLIED FINANCE, Vol. 9, No. 4, July 2003© 2003, The ICFAI Journal of APPLIED FINANCE.
The Price Dynamics Around SensexReconstitutions
Vijaya B Marisetty*, AV Vedpuriswar**
The price dynamics around index reconstitutions has been tested for an emerging market. Unlikedeveloped markets like the US, market efficiency during the announcement and effective dates is muchpoorer in India. We found significant price dynamics for firms added to the sensex but not for the firmsdeleted. However, we found weaker evidence of permanent downward price effects for firms deleted fromthe sensex.
* Department of Accouting and Finance, Post box: 36, Menzies Building, Monash University, Clayton, Australia-3800. Phone no: 0061-3-99058014; Fax: 0061-3-99055475; E-mail: [email protected].
** Dean, ICFAI Knowledge Center, Hyderabad, India.
Section I
IntroductionThe Bombay Stock Exchange�s (BSE) Sensitivity Index (Sensex) is one of the most popularindexes used by practitioners and researchers, to have a bird�s eye view of the Indianeconomy. The 30 constituent firms of the index represent almost 50% of the BSE totalmarket capitalization. However, they are not even half percent in terms of number ofshares in the BSE.
BSE has preset eligibility criteria for firms to be part of this elite 30 member group.The guidelines basically reflect firm performance and investors� interest. The board of BSEmeets quarterly to decide whether to delete the existing members by adding new membersbased on four major criteria namely, (1) the market capitalization of the members shouldbe always above 5% of the total market capitalization of the sensex, (2) they should havebeen traded continuously during the last one year, (3) the volume should not be less thantop 150 firms� volume during the last one year and (4) by adding new members thecorrelation between old and new index should not be lower than 0.98 in order to maintainthe continuity of the index and, apart from that, they also consider the track record andsome other undisclosed qualitative criteria.
With all these stringent criteria, BSE aims to represent the most active and valuablescrips of the stock exchange. In other words, it minimizes the efforts of individual andinstitutional investors to identify the most valuable scrips. One can argue this from theother way�most valuable scrips identified by the investors will eventually become partof sensex. No matter how it happens, the investor reactions cause sharp changes in theprices of the firms deleted or added. Investors� decisions for the changes will have a severeimpact on their wealth.
With the clearly defined criteria, it should be easy enough for the investors toanticipate which firms may be excluded and which firms may get included into sensex longbefore BSE announces such information. In fact, index funds and other mutual funds
The ICFAI Journal of APPLIED FINANCE, Vol. 9, No. 4, July 20036
should anticipate more accurately than retail investors. For instance, in case ofindividual investors, if an investor anticipates an addition in advance before theannouncement, he/she can buy the shares of the firms for far lesser premium than afterthe announcement. After the announcement, index funds buy the added firm�s shares inlarge quantities to reconstitute their portfolios creating an upward price pressure. Eventhough such a temporary price pressure results in an immediate price reversal after theeffective date, the addition to the Sensex itself may bring some permanent positiveincrease to the share price of the newly added firm.
A study on the investors� reaction to Sensex reconstitution would help to analyze thewealth effects for retail and institutional investors.
This section is followed by theories explaining the effects of inclusion and exclusionof firms from an index in section two. Section three describes the data used and themethodology adopted for this paper. The results are reported in section four. Section fiveconcludes the paper.
Section II
LiteratureAlthough, extensive research work has been done in the US on stock switches from anindex, there is no evidence of any research on Indian capital market. Researchers haveproposed different theories to explain the abnormal returns associated with indexreconstitution. Lynch and Mendenhall (1997) divided these theories broadly as follows:
� Price reversal effect. This Effect which was initially proposed by Harris and Gurel(1986). Harris and Gurel found that the price effect on the announcement andeffective days is gradually but completely reversed in the period after addition anddeletion. This has been attributed to the trading of index funds to reconstitute theirportfolios that results significant but temporary shift in the equilibrium value of theshares. This theory is consistent with the block trading literature. Chan andLakonishok (1993) and Keim and Mahadevan (1996) found temporary price shifts dueto block trading of large investors.
� Permanent price shift effect. This Effect was observed by Shleifer (1986) and Dhillonand Johnson (1991). As per permanent price shift hypothesis, the temporary shift inthe equilibrium persists, bringing the share price to a new equilibrium. While thistheory contradicts price reversal effect, the reason behind permanent shift has beenattributed to the changes in the investor revaluation.
� Information content effect. This effect was found by Jain (1987), where the marketperceives addition of a firm in the index as good news through significant positiveabnormal returns and deletion as bad news through significant negative abnormalreturns, may support the revaluation argument of permanent price shift effect.
� Liquidity effect. This Effect was found by Amihud and Mendelson (1986) is anothertheory that explains price shifts. If being a member of an index increases (decreases)firms� liquidity through the increase (decrease) in the trading volume, then theannouncement of addition (deletion) results in increase (decrease) in the price.
7The Price Dynamics Around Sensex Reconstitutions
Lynch and Mendenhall (1997) tested all the four theories on 34 additions and 33deletions in S&P 500 index during 1990 and 1995. They found strong evidence supportingprice reversal hypothesis both in additions and deletions. Weak evidence was foundsupporting permanent price shifts in additions compared to deletions. They also foundthat volume is abnormal between announcement date and the effective date. The largestabnormal volume was found a day before effective date. This was attributed to the indexfund reconstitution just a day before the effective date to obtain the least tracking error.
We use Lynch and Mendenhall (1997) framework to tests the above competinghypotheses. However, it differs in terms of the market conditions. This paper looks at anemerging market where the information dissemination process is assumed to be lessefficient. The paper also helps the policy makers to understand the informationdissemination process in such market conditions. Due to unavailability of daily tradingvolume data, the liquidity effect is not pursued in this paper.
Section III
Data and Methodology
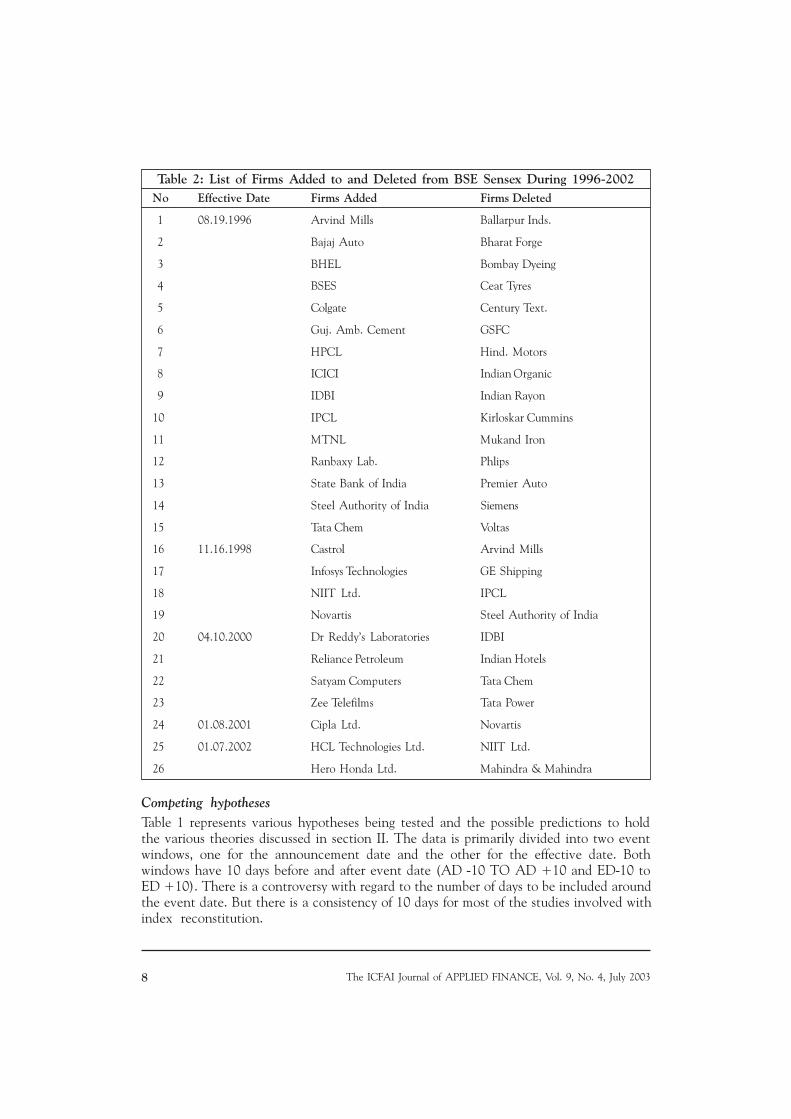
DataThe data has been obtained primarily from BSE website and PROWESS database. BSE haslisted the additions and deletions from sensex from 1986 till to date. The data includesthe company names and the effective date of addition or deletion. BSE did not mentionthe exact announcement dates. However, they provided effective dates and also mentionedannouncement is done six weeks before effective date. The daily stock prices data and dailymarket bench-mark (NSE DIFTY) data are sourced from PROWESS database from theCenter for Monitoring Indian Economy. Table 2 summarizes the sample used for the study.The table includes 52 firms which have been classified as additions and deletions of 26,each along with the effective date.
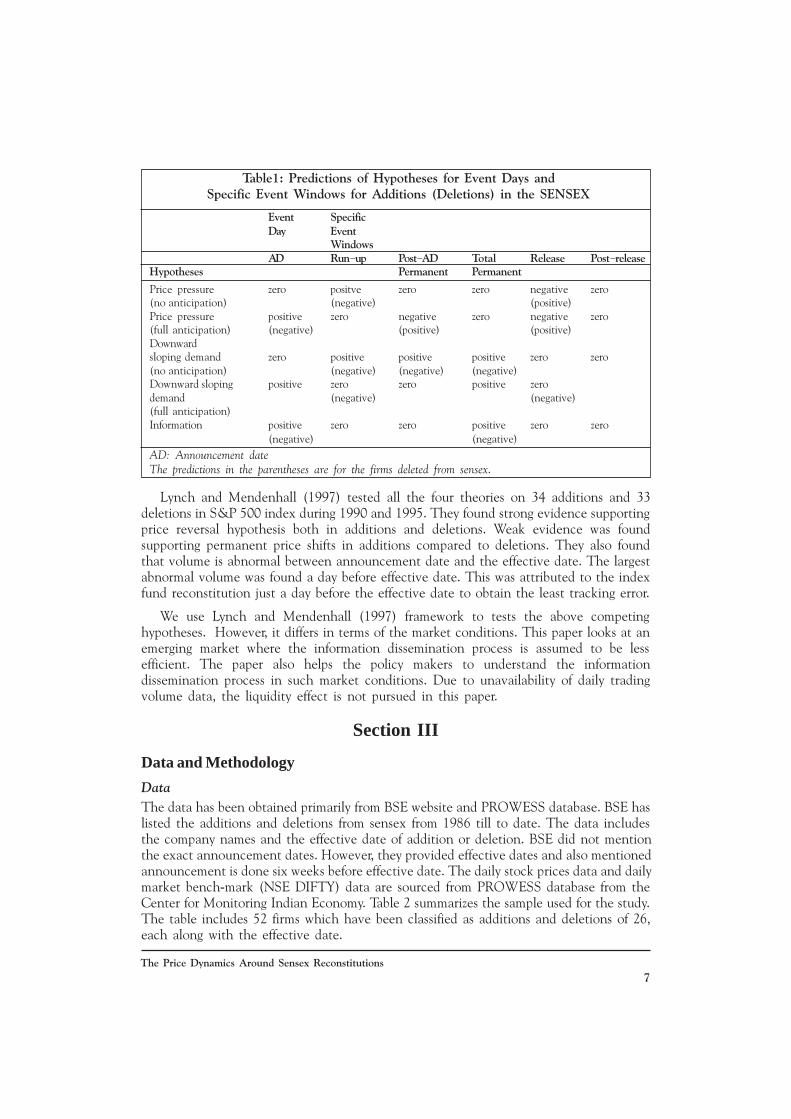
Table1: Predictions of Hypotheses for Event Days andSpecific Event Windows for Additions (Deletions) in the SENSEX
Event SpecificDay Event
WindowsAD Run- up Post- AD Total Release Post- release
Hypotheses Permanent Permanent
Price pressure zero positve zero zero negative zero(no anticipation) (negative) (positive)Price pressure positive zero negative zero negative zero(full anticipation) (negative) (positive) (positive)Downwardsloping demand zero positive positive positive zero zero(no anticipation) (negative) (negative) (negative)Downward sloping positive zero zero positive zerodemand (negative) (negative)(full anticipation)Information positive zero zero positive zero zero (negative) (negative) AD: Announcement dateThe predictions in the parentheses are for the firms deleted from sensex.
The ICFAI Journal of APPLIED FINANCE, Vol. 9, No. 4, July 20038
Competing hypothesesTable 1 represents various hypotheses being tested and the possible predictions to holdthe various theories discussed in section II. The data is primarily divided into two eventwindows, one for the announcement date and the other for the effective date. Bothwindows have 10 days before and after event date (AD -10 TO AD +10 and ED-10 toED +10). There is a controversy with regard to the number of days to be included aroundthe event date. But there is a consistency of 10 days for most of the studies involved withindex reconstitution.
Table 2: List of Firms Added to and Deleted from BSE Sensex During 1996-2002No Effective Date Firms Added Firms Deleted
1 08.19.1996 Arvind Mills Ballarpur Inds.
2 Bajaj Auto Bharat Forge
3 BHEL Bombay Dyeing
4 BSES Ceat Tyres
5 Colgate Century Text.
6 Guj. Amb. Cement GSFC
7 HPCL Hind. Motors
8 ICICI Indian Organic
9 IDBI Indian Rayon
10 IPCL Kirloskar Cummins
11 MTNL Mukand Iron
12 Ranbaxy Lab. Phlips
13 State Bank of India Premier Auto
14 Steel Authority of India Siemens
15 Tata Chem Voltas
16 11.16.1998 Castrol Arvind Mills
17 Infosys Technologies GE Shipping
18 NIIT Ltd. IPCL
19 Novartis Steel Authority of India
20 04.10.2000 Dr Reddy�s Laboratories IDBI
21 Reliance Petroleum Indian Hotels
22 Satyam Computers Tata Chem
23 Zee Telefilms Tata Power
24 01.08.2001 Cipla Ltd. Novartis
25 01.07.2002 HCL Technologies Ltd. NIIT Ltd.
26 Hero Honda Ltd. Mahindra & Mahindra
9The Price Dynamics Around Sensex Reconstitutions
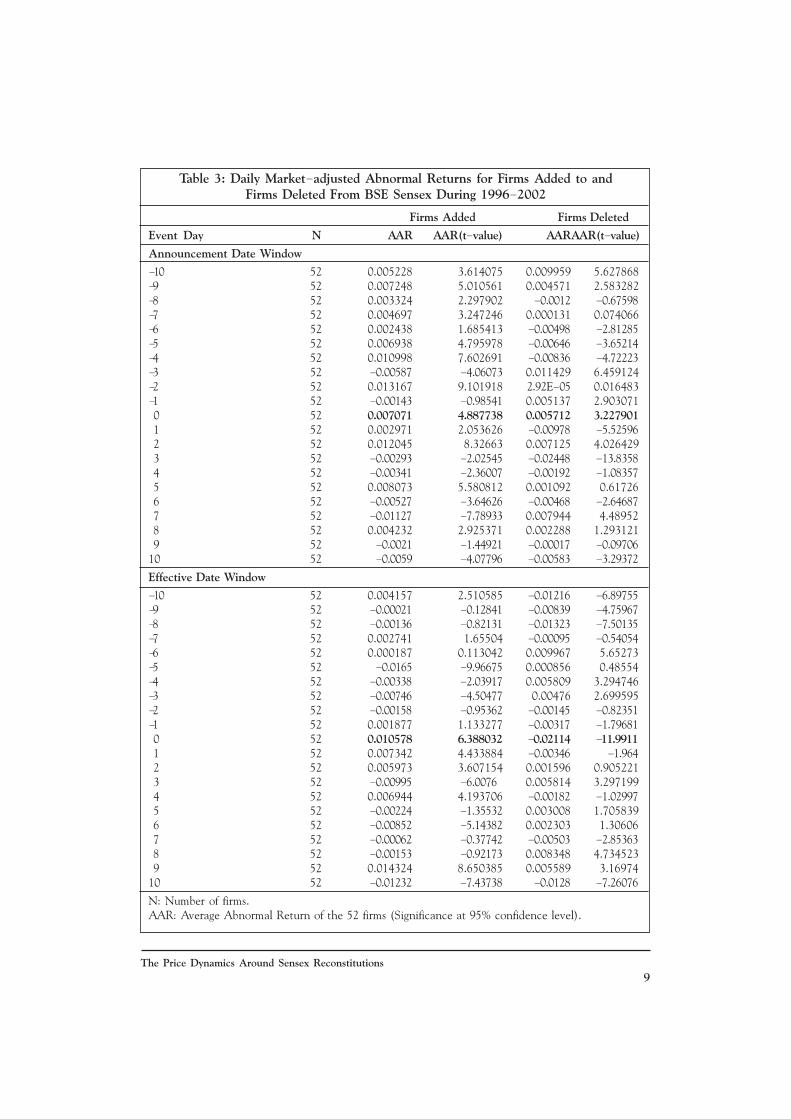
Table 3: Daily Market- adjusted Abnormal Returns for Firms Added to andFirms Deleted From BSE Sensex During 1996- 2002
Firms Added Firms Deleted
Event Day N AAR AAR(t- value) AARAAR(t- value)
Announcement Date Window
-10 52 0.005228 3.614075 0.009959 5.627868-9 52 0.007248 5.010561 0.004571 2.583282-8 52 0.003324 2.297902 - 0.0012 - 0.67598-7 52 0.004697 3.247246 0.000131 0.074066-6 52 0.002438 1.685413 - 0.00498 - 2.81285-5 52 0.006938 4.795978 - 0.00646 - 3.65214-4 52 0.010998 7.602691 - 0.00836 - 4.72223-3 52 - 0.00587 - 4.06073 0.011429 6.459124-2 52 0.013167 9.101918 2.92E- 05 0.016483-1 52 - 0.00143 - 0.98541 0.005137 2.903071 0 52 0.007071 4.887738 0.005712 3.227901 1 52 0.002971 2.053626 - 0.00978 - 5.52596 2 52 0.012045 8.32663 0.007125 4.026429 3 52 - 0.00293 - 2.02545 - 0.02448 - 13.8358 4 52 - 0.00341 - 2.36007 - 0.00192 - 1.08357 5 52 0.008073 5.580812 0.001092 0.61726 6 52 - 0.00527 - 3.64626 - 0.00468 - 2.64687 7 52 - 0.01127 - 7.78933 0.007944 4.48952 8 52 0.004232 2.925371 0.002288 1.293121 9 52 - 0.0021 - 1.44921 - 0.00017 - 0.0970610 52 - 0.0059 - 4.07796 - 0.00583 - 3.29372
Effective Date Window
-10 52 0.004157 2.510585 - 0.01216 - 6.89755-9 52 - 0.00021 - 0.12841 - 0.00839 - 4.75967-8 52 - 0.00136 - 0.82131 - 0.01323 - 7.50135-7 52 0.002741 1.65504 - 0.00095 - 0.54054-6 52 0.000187 0.113042 0.009967 5.65273-5 52 - 0.0165 - 9.96675 0.000856 0.48554-4 52 - 0.00338 - 2.03917 0.005809 3.294746-3 52 - 0.00746 - 4.50477 0.00476 2.699595-2 52 - 0.00158 - 0.95362 - 0.00145 - 0.82351-1 52 0.001877 1.133277 - 0.00317 - 1.79681 0 52 0.010578 6.388032 - 0.02114 -11.9911 1 52 0.007342 4.433884 - 0.00346 - 1.964 2 52 0.005973 3.607154 0.001596 0.905221 3 52 - 0.00995 - 6.0076 0.005814 3.297199 4 52 0.006944 4.193706 - 0.00182 - 1.02997 5 52 - 0.00224 - 1.35532 0.003008 1.705839 6 52 - 0.00852 - 5.14382 0.002303 1.30606 7 52 - 0.00062 - 0.37742 - 0.00503 - 2.85363 8 52 - 0.00153 - 0.92173 0.008348 4.734523 9 52 0.014324 8.650385 0.005589 3.1697410 52 - 0.01232 - 7.43738 - 0.0128 - 7.26076
N: Number of firms.AAR: Average Abnormal Return of the 52 firms (Significance at 95% confidence level).
The ICFAI Journal of APPLIED FINANCE, Vol. 9, No. 4, July 200310
The paper tests three of the four hypotheses discussed in section II. The event windowsare sub-divided to allow us to test these hypotheses. Apart from the Announcement Day(AD) there are four event specific windows, as shown in Table 1. The run-up windowranges from a day after the announcement day and ends at a day before effective day (ADto ED-1). Run-up window looks at the abnormal return after the announcement date.Run-up window can be used to explain price pressure effect hypothesis. For instance, ifthe investors have no anticipation of the additions/deletions then there should be nosignificant abnormal return till the announcement date. However, abnormal return shouldbe prominent during the run-up window and especially on the last day before the effectivedate. The largest abnormal return should occur just before the effective date as the indexfunds rebalance their portfolios to avoid tracking error. If there is full anticipation of thechanges, then the abnormality should be found on the announcement date and before theannouncement date. One can also interpret the results of run-up window to explaininformation hypothesis. For instance, if additions/deletions have value-based informationand no price pressure associated with it, then there should be abnormal return on the dayof announcement and there should not be any abnormality when it reaches effective date.In other words, there should be no abnormal return on the last day of the run-up window.
The next window is the post announcement date permanent window, which ranges froma day after announcement day to the 10th day from the effective date (AD +1 to ED +10).This window captures the price reversal and permanent price effects. Again, if theinvestors have full anticipation of the changes to the index and there are any pricereversals to offset the abnormality, then there should be abnormal negative (positive)returns in case of additions (deletions). Total permanent window starts from the effectivedate and ends on the 10th day after the effective date looks at the persistence in theabnormal returns started on the announcement date. The persistence in the abnormalreturn is attributed to the permanent price effect.
Release window and post release window represents the abnormal returns after the changehas occurred in the index. Release window is from the effective date to the seventh dayafter effective date and the post-release window follows till the 10th date after the effectivedate. These windows capture the price reversal effect that arises due to temporary pricepressure. There should be a complete reversal at the end of release window and thereshould be no abnormality in the post release window if markets are semi-strong efficient(Fama, 1992).
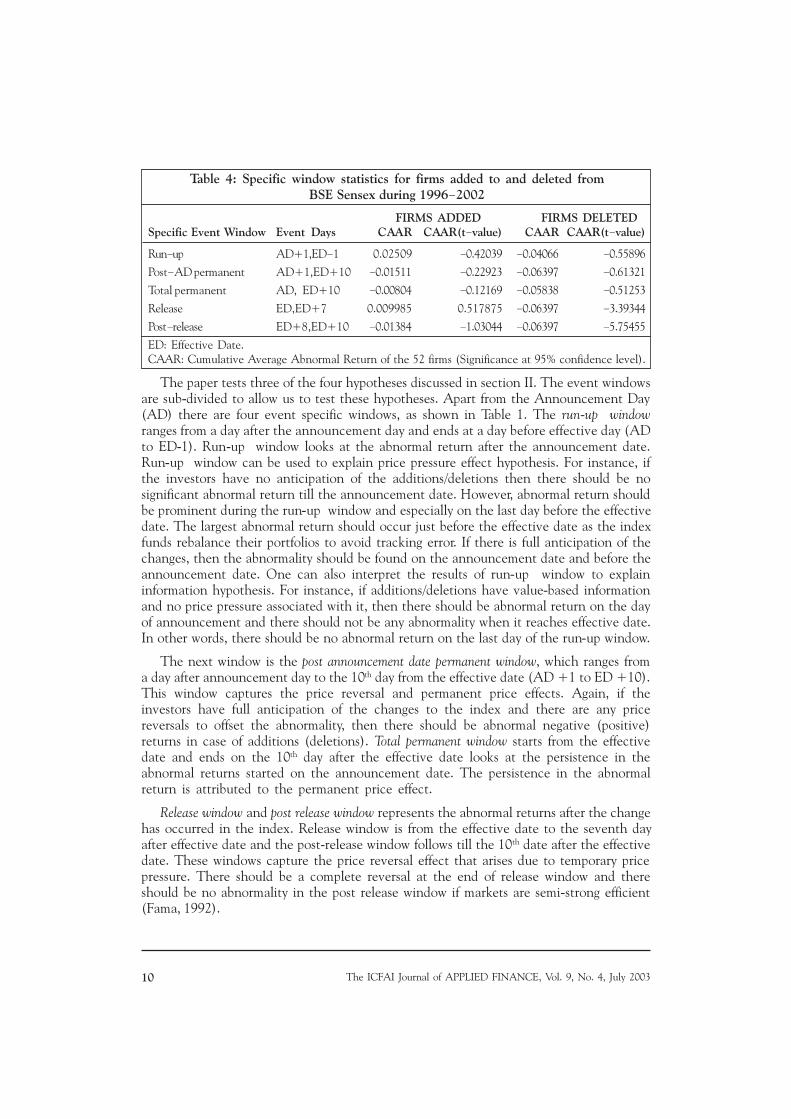
Table 4: Specific window statistics for firms added to and deleted fromBSE Sensex during 1996- 2002
FIRMS ADDED FIRMS DELETEDSpecific Event Window Event Days CAAR CAAR(t- value) CAAR CAAR(t- value)
Run- up AD+1,ED- 1 0.02509 - 0.42039 - 0.04066 - 0.55896
Post- AD permanent AD+1,ED+10 - 0.01511 - 0.22923 - 0.06397 - 0.61321
Total permanent AD, ED+10 - 0.00804 - 0.12169 - 0.05838 - 0.51253
Release ED,ED+7 0.009985 0.517875 - 0.06397 - 3.39344
Post- release ED+8,ED+10 - 0.01384 - 1.03044 - 0.06397 - 5.75455
ED: Effective Date.CAAR: Cumulative Average Abnormal Return of the 52 firms (Significance at 95% confidence level).
11The Price Dynamics Around Sensex Reconstitutions
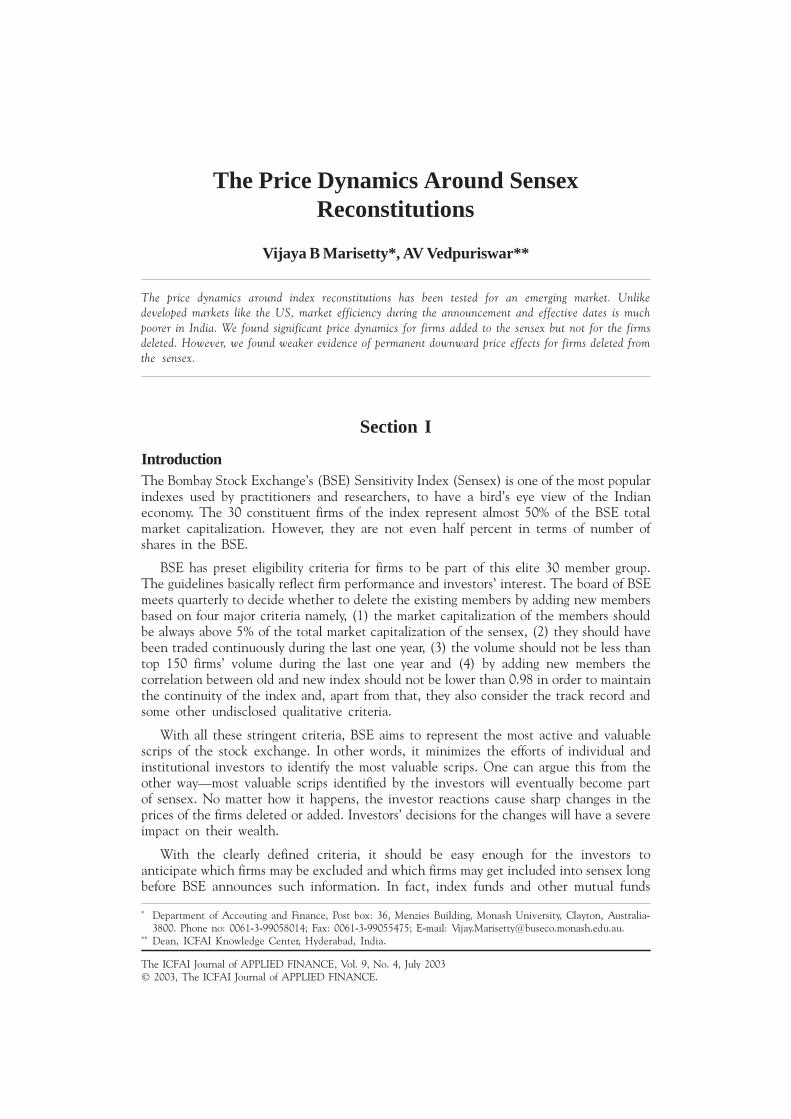
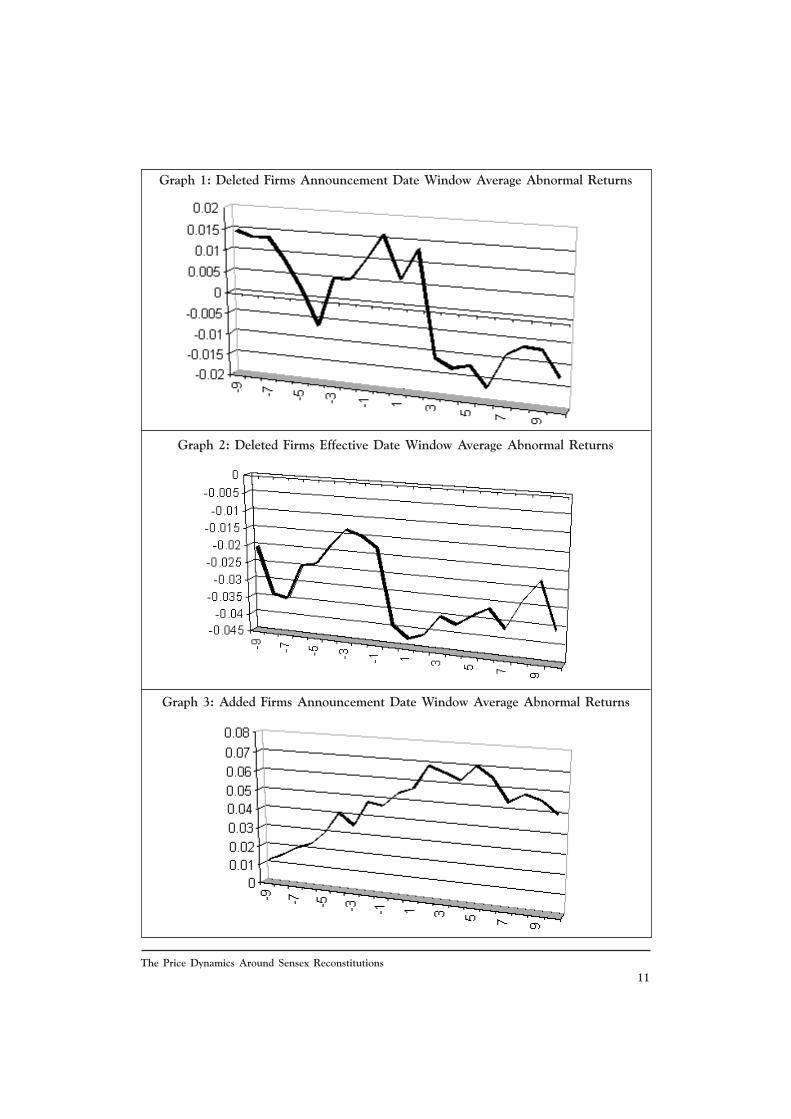
Graph 3: Added Firms Announcement Date Window Average Abnormal Returns
Graph 1: Deleted Firms Announcement Date Window Average Abnormal Returns
Graph 2: Deleted Firms Effective Date Window Average Abnormal Returns
The ICFAI Journal of APPLIED FINANCE, Vol. 9, No. 4, July 200312
MethodologyWe use event study methodology using the conventional Brown and Warner (1985) eventstudy method in order to test the price pressure, permanent effect and informationhypotheses as discussed in the above sections.
Measuring abnormal returnThere are several methods to measure the abnormal returns in the event-studyliterature. We got almost similar results for conventional risk-adjusted, mean-adjusted,market adjusted and market and risk adjusted models. The market-adjusted model resultsare reported for interpretational purposes. In a market adjusted method, Abnormal Return(ARi) of firm �i� is:
ARit = Rit � Rmt
where Rit is the continuously compounded daily return of firm �i� and Rmt is thecontinuously compounded return of the market index.
Cumulative Abnormal Return (CARi) varies with the event specific windows. Forinstance, the CARi for the run-up window is:
CARi = St= ad+1 to ED-1 ARi.
The t-statistic to test the significance of ARit is as follows:
t = ARit/SEE, where SEE = sqrt (var(ARit)/N)
where sqrt = square root ; Var= variance and N = number of observations.
The t-statistic to test the significance of CARit is as follows:
t = CARit/SEE, where SEE = sqrt (T*var(ARit)/N)
where t is the number of days in each event specific window and ARit is the AR duringthat event specific window.
Section IV
ResultsTableS 3 and 4 provide summary results of the study. Graphs 1 to 4 support the findingsreported in tableS 3 and 4. Table 3 reports the average abnormal return of 52 firms alongwith their t-values. The average abnormal returns are reported for the announcement datewindow and effective date window and they represent both additions and deletions tosensex during 1996 to 2002. The event date has significant AR�s for both additions anddeletions on announcement and effective dates with the t-values ranging from 3 to 11.Addition to sensex has provided a positive AR during both on the announcement dateand effective dates. However, for deletion from sensex has provided a positive abnormalreturn on the announcement date and a negative abnormal return on the effective date.The positive abnormal return on the announcement due to addition may imply thatinvestors consider and value additions as good news. The results also support fullanticipation hypothesis. There are signs of price reversal two days after the effective date.However, investors received 7% and 10% daily returns during the announcement day andeffective date for the firms added to sensex. The results violate market efficiencyhypothesis and represent a slow adjustment process to the information.
13The Price Dynamics Around Sensex Reconstitutions
The deleted firms exhibit surprising results. The deleted firms exhibited significantpositive results on the announcement day. However, on the effective day they havesignificant negative abnormal return. The announcement information, if not coveredextensively in the media, may lead to inconsistent reactions on the AD but the realreaction might occur on the effective date.
Table 4 reports the cumulative average abnormal return for different event specificwindows for both firms added and deleted from sensex. The results in table 4 show thatthe only significant cumulative average AR are for the deleted firms in the release andpost-release windows. The deleted firms exhibit significant negative cumulative AR�sduring the release and post-release windows. These results support slow adjustment processas discussed above. The investors react more after the effective date than on the effectivedate. In an efficient market where the information dissemination is fast, the negativereturns would have occurred before and on the announcement date. The results alsocontradict the price reversal effect for deleted firms. A deleted firm�s temporary decreasein the price should reverse back during the release window. This may suggest that thedeleted firm settles at a new equilibrium as market re-values the worth of the deleted firm.This argument supports permanent price shift in case of deleted firms, even though thereis no significant cumulative average AR in the permanent post AD window and totalpermanent window.
Graphs 1 to 3 report significant patterns in the return generation process. For instance,graph 2 supports the argument that the deleted firms reach a lowers equilibrium due tothe permanent shift after the effective date. Graph 3 shows the increasing momentum inthe prices of the added firms before the announcement date. This compliments with thefull anticipation of additions by the investors before the announcement date. However,graph 3 indicates that price reversal happens far before the effective date. This may be dueto the fact that unlike in the US, the index funds price pressure is low in India or thereare only a few index funds based on BSE index during our study period.
Section V
Concluding remarksWe analyzed the price dynamics around the sensex reconstitution using three competinghypotheses namely, price pressure hypothesis, permanent shift hypothesis and informationhypothesis. We found no consistent results that can strongly support any one of thesehypotheses. These results might be due to the low index funds activities on the sensexindex during the study period. Most of the earlier studies are based on the US stock marketwhere the influence of index funds trading during index reconstitutions is substantial.
There is evidence of investors anticipating firms being added to sensex. However, theyfail to anticipate the firms being deleted from sensex. There is considerable evidence thatthe information arrival and adjustment process in BSE is slow. There is weak evidence thatthe deleted firms will have permanent price effect. A trading strategy to profit from theannouncements would yield a significant positive market-adjusted return.
Reference # 01J-03-07-01
The ICFAI Journal of APPLIED FINANCE, Vol. 9, No. 4, July 200314
References1. www.bseindia.com2. Amihud Y, and Mendelson H, 1986. Asset pricing and bid ask spread, Journal of
Financial Economics, 17: 223-49.3. Brown S and Warner J, 1985. Using daily stock returns: The case of event studies,
Journal of Financial Economics, 14: 3-31.4. Chan L and Lakonishishok J, 1993. Institutional trades and intra-day stock price
behavior, Journal of Financial Economics, 33: 173-200.5. Dhillon U and Johnson H, 1991. Changes in S$P�s 500 list, Journal of Business, 64:
75-85.6. Fama E 1991. Efficient capital markets II, Journal of Finance, 46: 1575-1618.7. Harris L and Gurel E, 1986. Price and volume effects associated with changes in the
S&P 500 list: New evidence for the existence of price pressures, Journal of FinancialEconomics, 26: 815-29.
8. Jain P 1987. The effect on stock price from inclusion and exclusion from the S&P500, Financial Analyst Journal, 43: 58:65.
9. Keim and Mahadevan A, 1996. The upstairs market for large block transactions:analysis and measurement of price effects, Review of Financial Studies, 9: 1-36.
10. Lynch WA and Mendenhall RR, 1997. New evidence on the stock price effectsassociated with changes in the S&P 500 index, Journal of Business, 3: 351-383.
11. Shleifer A 1986. Do demand curves for stocks slope down?, Journal of Finance, 41:579-90.