Embed Size (px)
Citation preview
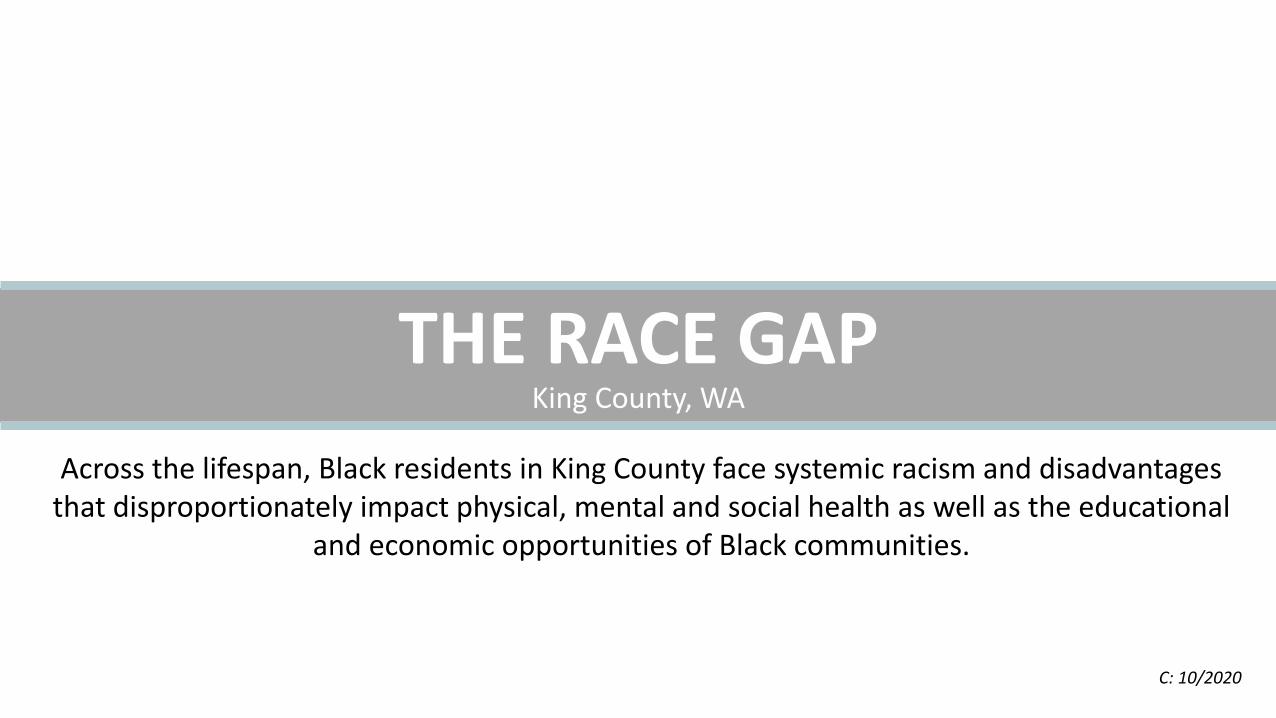
THE RACE GAP King County, WA
Across the lifespan, Black residents in King County face systemic racism and disadvantages that disproportionately impact physical, mental and social health as well as the educational
and economic opportunities of Black communities.
C: 10/2020
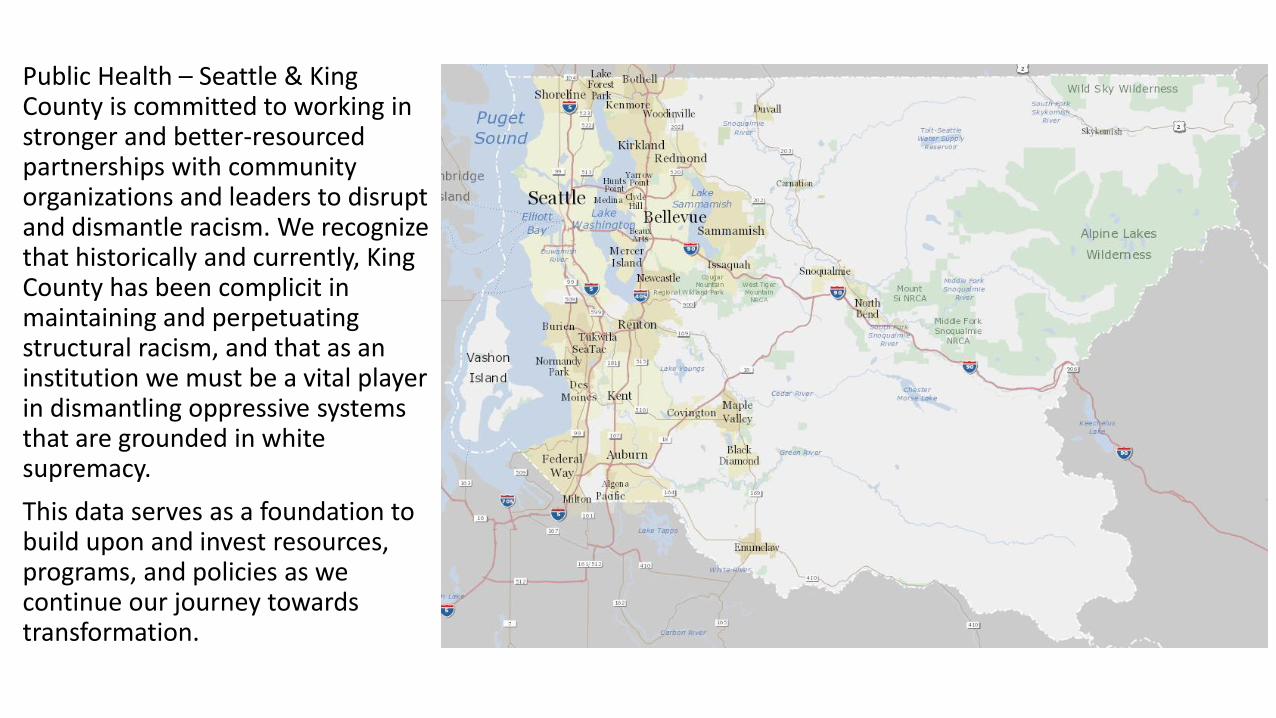
Public Health – Seattle & King County is committed to working in stronger and better-resourced partnerships with community organizations and leaders to disrupt and dismantle racism. We recognize that historically and currently, King County has been complicit in maintaining and perpetuating structural racism, and that as an institution we must be a vital player in dismantling oppressive systems that are grounded in white supremacy.
This data serves as a foundation to build upon and invest resources, programs, and policies as we continue our journey towards transformation.
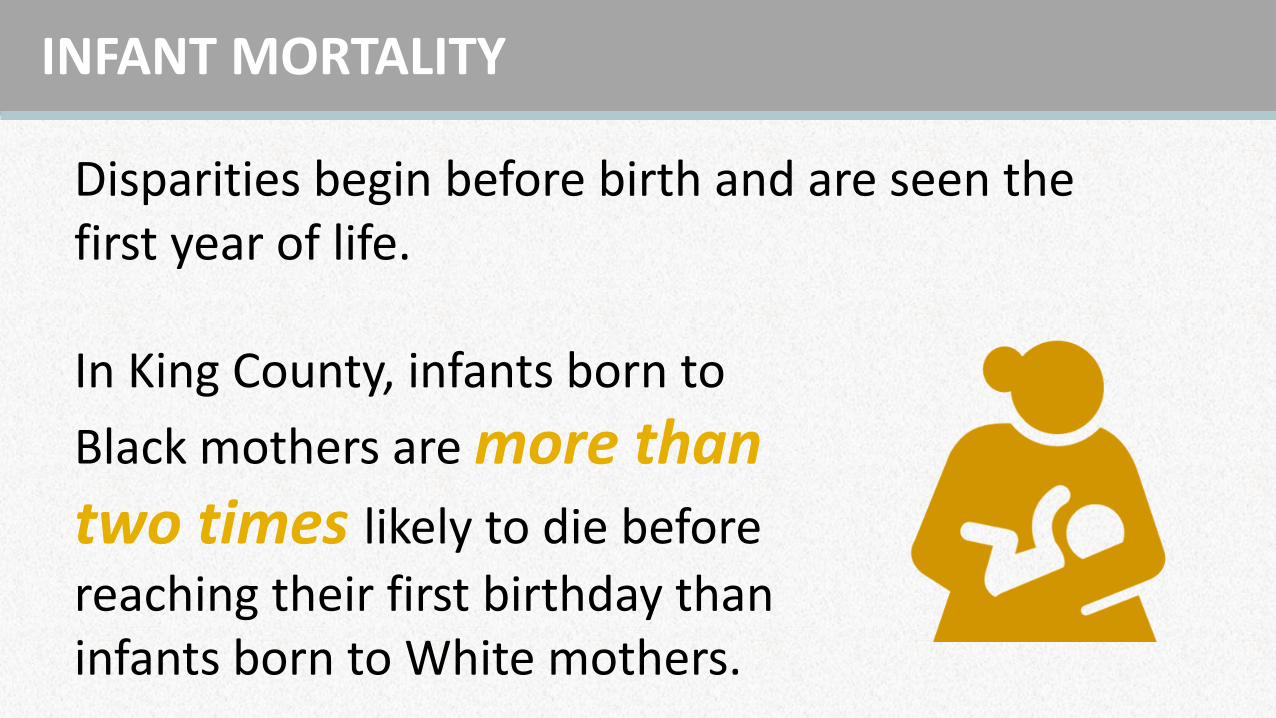
Disparities begin before birth and are seen the first year of life.
In King County, infants born to
Black mothers are more thantwo times likely to die before
reaching their first birthday than infants born to White mothers.
INFANT MORTALITY
See ‘Infant Mortality’ data online
INFANT MORTALITY
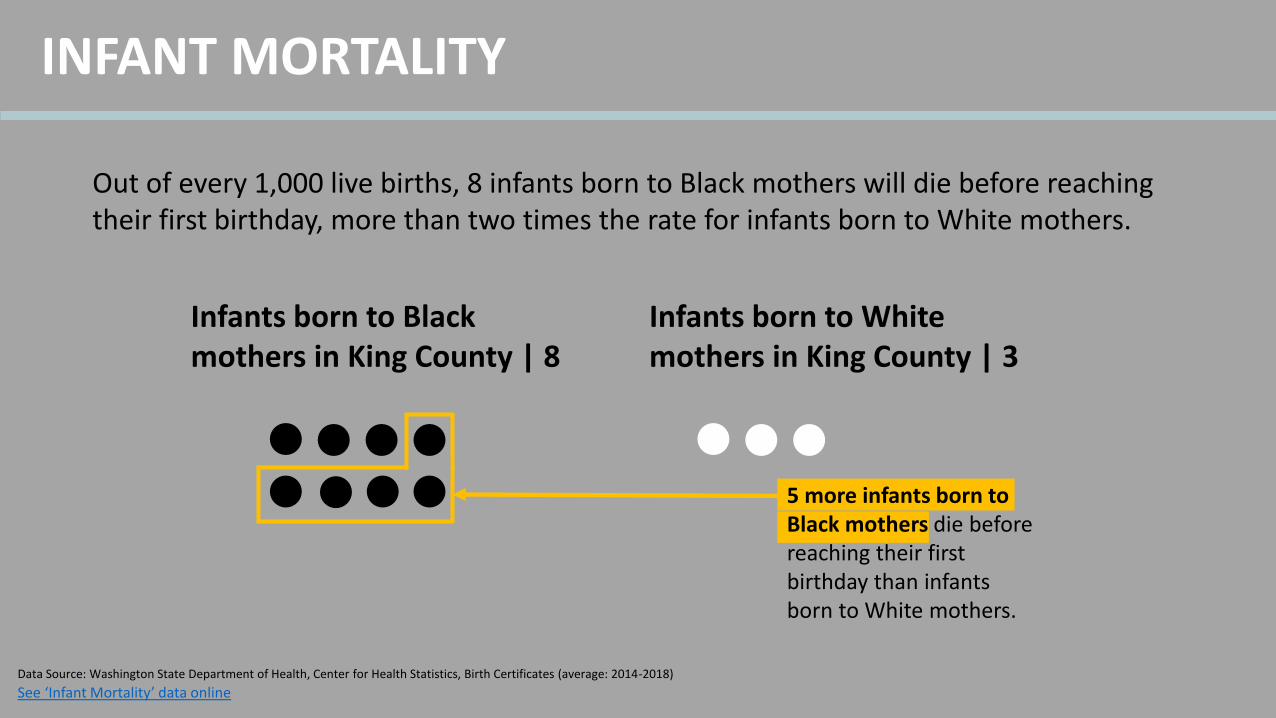
Infants born to Black mothers in King County | 8
Infants born to White mothers in King County | 3
Out of every 1,000 live births, 8 infants born to Black mothers will die before reaching their first birthday, more than two times the rate for infants born to White mothers.
5 more infants born to Black mothers die before reaching their first birthday than infants born to White mothers.
Data Source: Washington State Department of Health, Center for Health Statistics, Birth Certificates (average: 2014-2018)
INFANT MORTALITY
More and more research point to the fact that infant mortality, specifically for infants born to Black mothers, is linked to chronic stress that accumulates for Black women resulting from generational and lifetime experiences of racial discrimination and systemic oppression. This lifetime accumulation of chronic stress as well as lived experiences, impacts the health of Black women which creates disproportionate rates of infant mortality for Black infants as well as similar patterns with higher rates of low birth weight, maternal mortality, and preterm births.1,2,3
Studies that have reviewed several additional factors that could be related to infant mortality – including poor eating habits, obesity, smoking, drinking, mother’s education, mother’s income, or poor prenatal care – have not found results significant enough to fully account for the difference of rates compared to White and Black infant mortality.2,4
While health outcomes and behaviors are complex with interwoven factors, it is clear that broader inequities and discrimination – unequal access to opportunities and resources, discrimination, and systemic oppression – can all take a toll on the body and create biological changes that affects the health of mothers, newborns, and infants.
1 Coley, S. L., Nichols, T. R., Rulison, K. L., Aronson, R. E., Brown-Jeffy, S. L., & Morrison, S. D. (2016). Does Neighborhood Risk Explain Racial Disparities in Low Birth Weight among Infants Born to Adolescent Mothers?. Journal of pediatric and adolescent gynecology, 29(2), 122–129. https://doi.org/10.1016/j.jpag.2015.08.004.2Carpenter, Z. (2017, February). What’s Killing America’s Black Infants? | The Nation. Retrieved July 28, 2020, from https://www.thenation.com/article/archive/whats-killing-americas-black-infants/3Macdorman, M. F., & Mathews, T. J. (2011). Understanding Racial and Ethnic Disparities in U.S. Infant Mortality Rates Key findings Data from the 2007 linked birth/infant death data set. NCHS Data Brief. Retrieved from https://stacks.cdc.gov/view/cdc/12375. 4Wallace, M., Crear-Perry, J., Richardson, L., Tarver, M., & Theall, K. (2017). Separate and unequal: Structural racism and infant mortality in the US. Health and Place, 45, 140–144. https://doi.org/10.1016/j.healthplace.2017.03.012
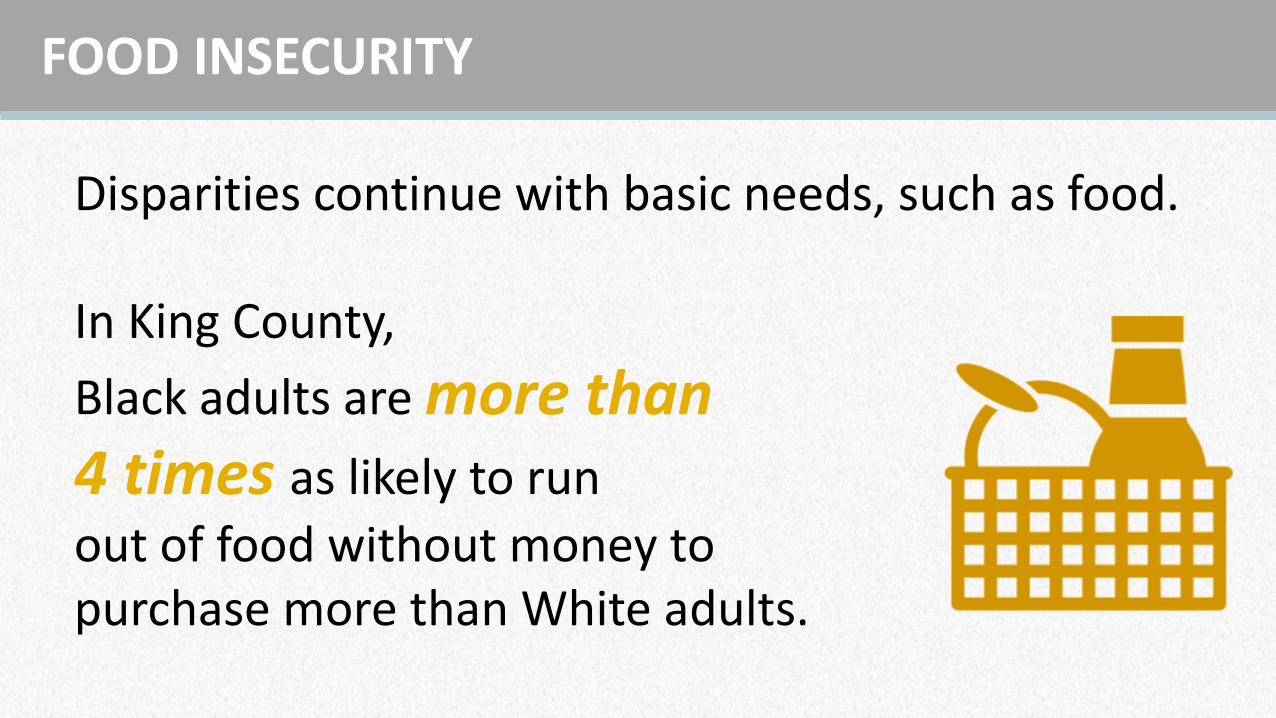
Disparities continue with basic needs, such as food.
In King County,
Black adults are more than4 times as likely to run
out of food without money to purchase more than White adults.
FOOD INSECURITY
See ‘Food insecurity’ data online
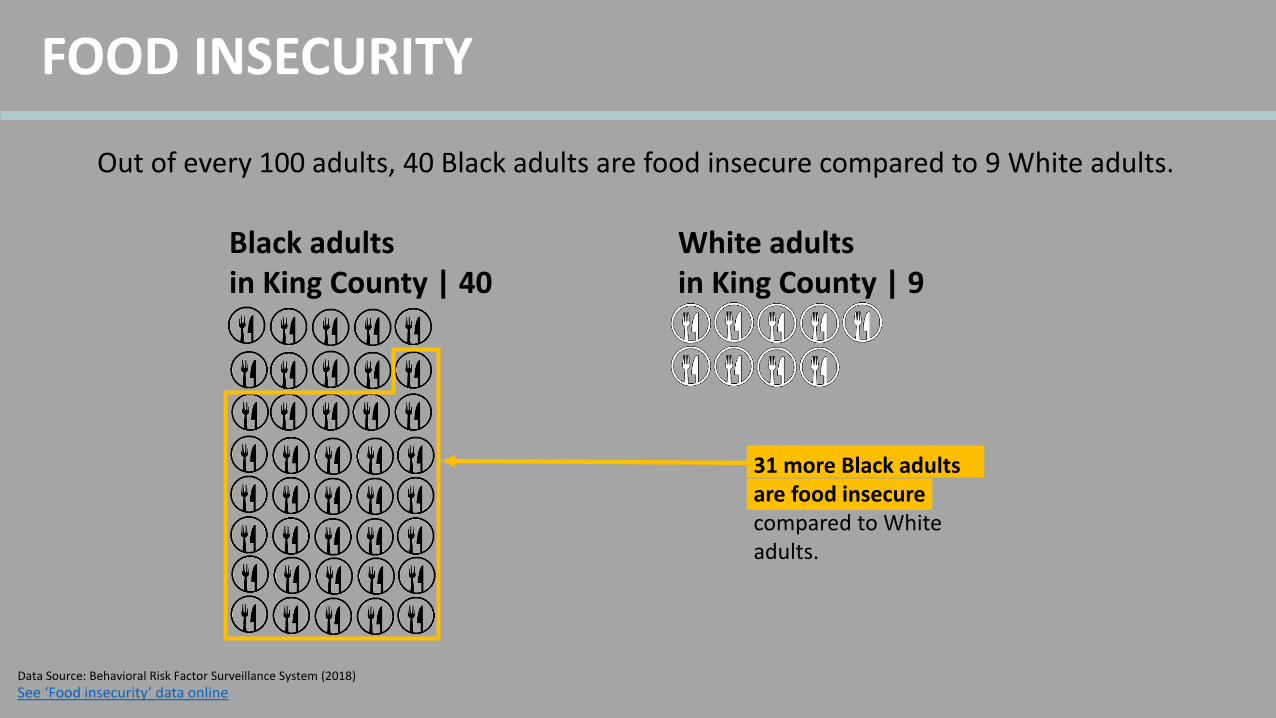
FOOD INSECURITY
Black adults in King County | 40
White adultsin King County | 9
Out of every 100 adults, 40 Black adults are food insecure compared to 9 White adults.
31 more Black adults are food insecure compared to White adults.
Data Source: Behavioral Risk Factor Surveillance System (2018)
FOOD INSECURITY
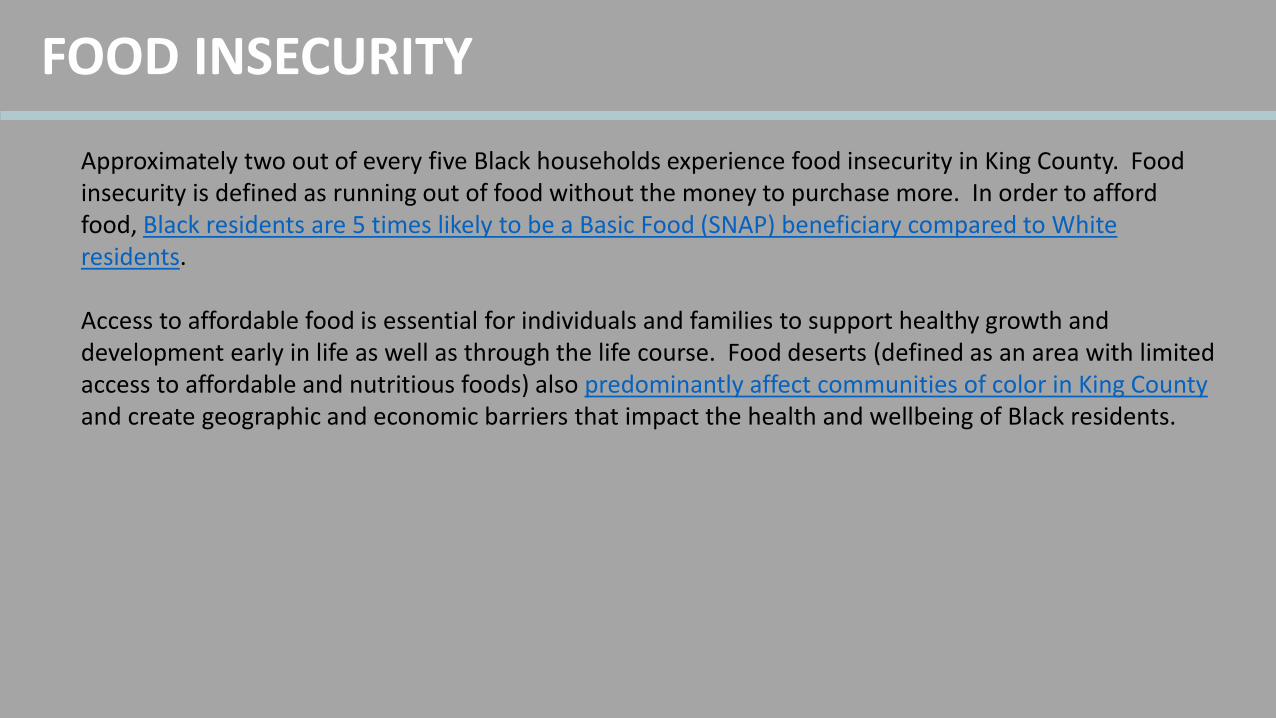
Approximately two out of every five Black households experience food insecurity in King County. Food insecurity is defined as running out of food without the money to purchase more. In order to afford food, Black residents are 5 times likely to be a Basic Food (SNAP) beneficiary compared to White residents.
Access to affordable food is essential for individuals and families to support healthy growth and development early in life as well as through the life course. Food deserts (defined as an area with limited access to affordable and nutritious foods) also predominantly affect communities of color in King County and create geographic and economic barriers that impact the health and wellbeing of Black residents.
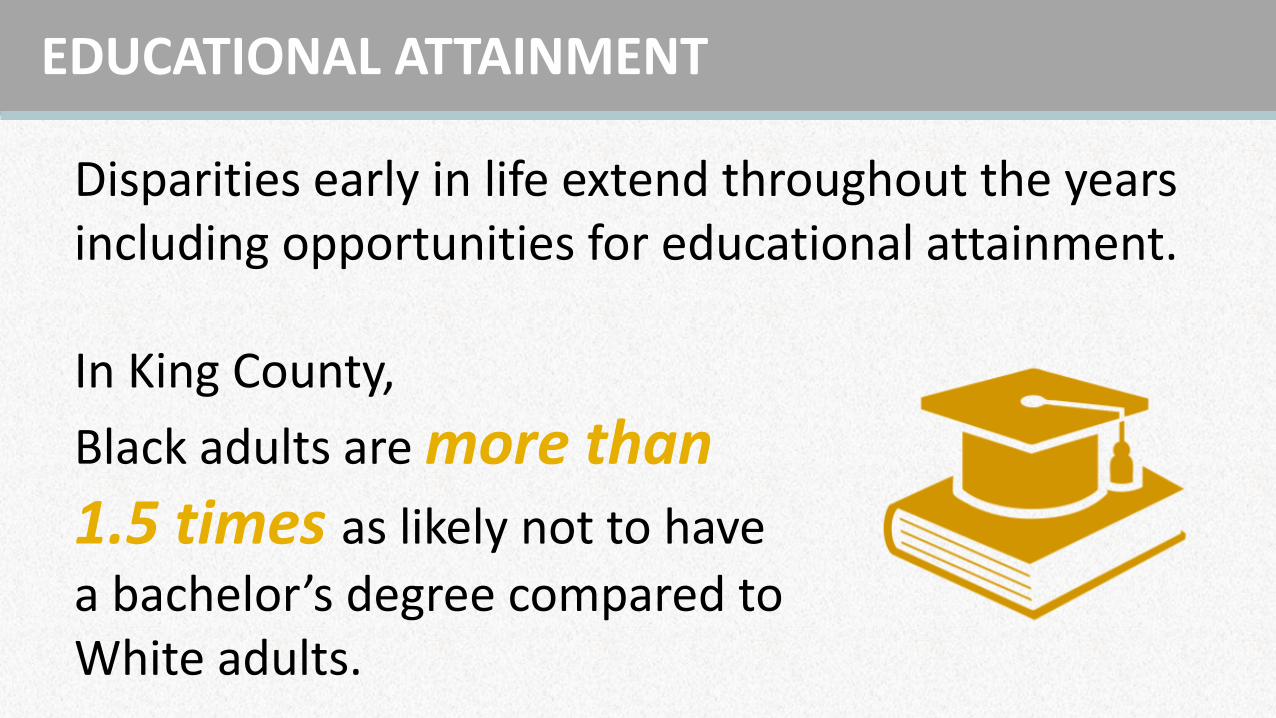
Disparities early in life extend throughout the years including opportunities for educational attainment.
In King County,
Black adults are more than1.5 times as likely not to have
a bachelor’s degree compared to White adults.
EDUCATIONAL ATTAINMENT
See ‘Educational attainment: less than bachelors degree’ data online
EDUCATIONAL ATTAINMENT
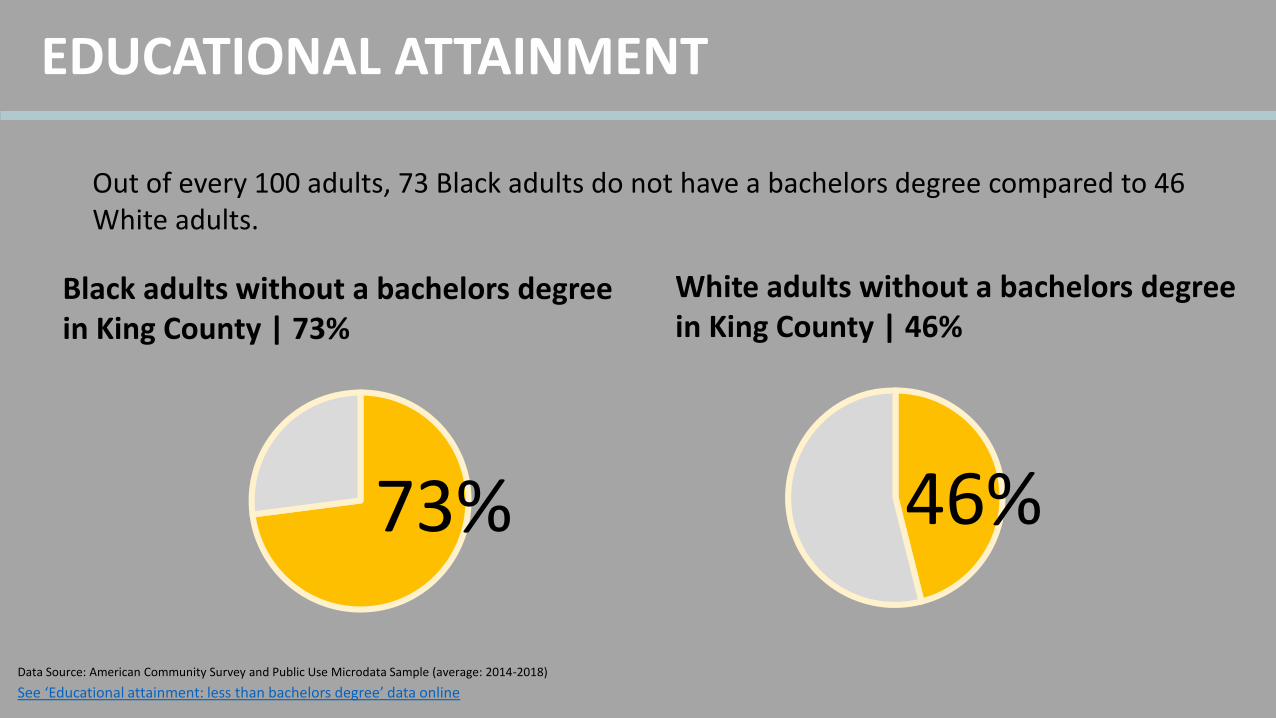
Black adults without a bachelors degreein King County | 73%
White adults without a bachelors degreein King County | 46%
Out of every 100 adults, 73 Black adults do not have a bachelors degree compared to 46 White adults.
73% 46%
Data Source: American Community Survey and Public Use Microdata Sample (average: 2014-2018)
EDUCATIONAL ATTAINMENT
Disparities in educational attainment between black individuals and white individuals start early in kindergarten through higher education in college. In King County, as early as kindergarten, only 40% of Black children are ready for kindergarten compared to 58% of White children. Kindergarten readiness is measured in 6 skills areas that are important to academic success including social-emotional, physical, language, cognitive, literacy, and math. Among 4th graders, 31% of Black students meet math standards compared to 73% White students. Black students are also much less likely to graduate from high school compared to White students.
There are also drastic disparities with school suspension and expulsion between Black and White students. Any student who is suspended or expelled is at risk to fail courses, drop out of school, or become involved with the juvenile justice system – all of which impact future education and career opportunities. In South King County, Black students are more likely to be expelled than White students for the same infractions.1
Educational opportunities and attainment contribute greatly to economic stability. The wealth and resource gap between Black and White residents in King County is tied to inequities in educational opportunities and resources for Black students.
1Cooley, S. (2017) Start With Us: Black Youth in South King County and South Seattle. Seattle, WA: Community Center for Education Results. https://roadmapproject.org/wp-content/uploads/2018/09/StartWithUsReport.pdf.
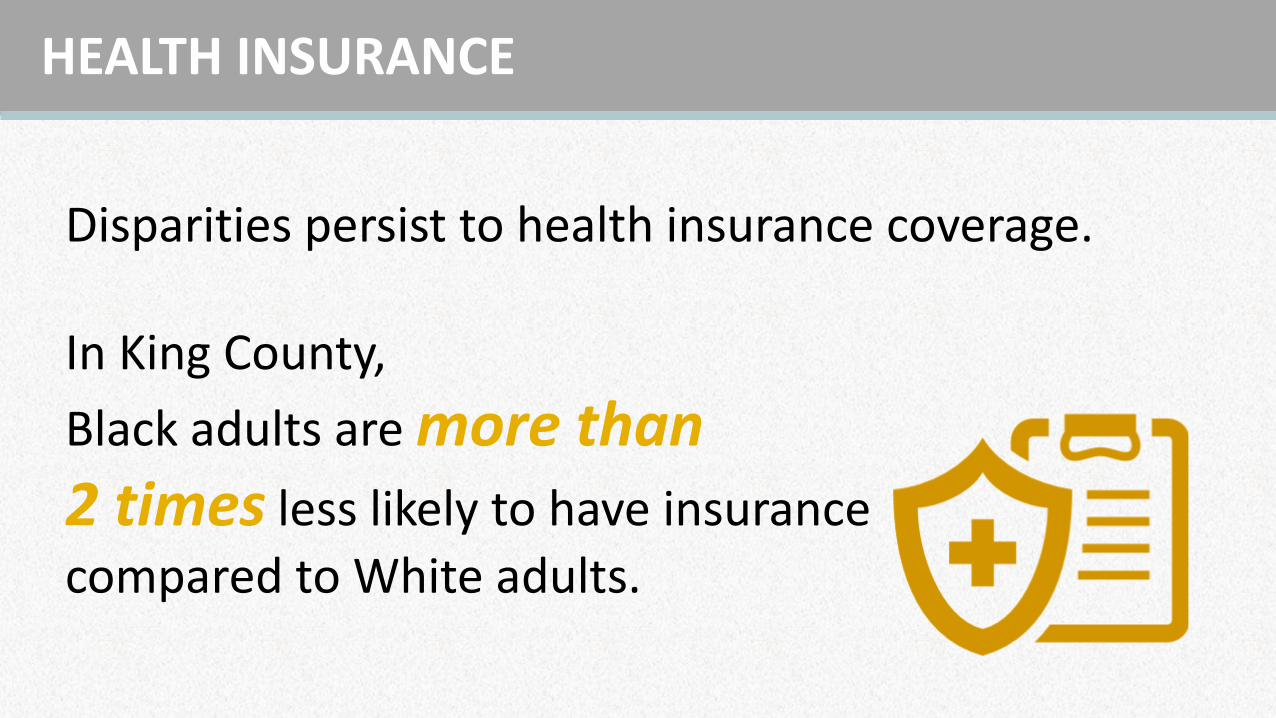
Disparities persist to health insurance coverage.
In King County,
Black adults are more than2 times less likely to have insurance
compared to White adults.
HEALTH INSURANCE
See ‘Uninsurance’ data online
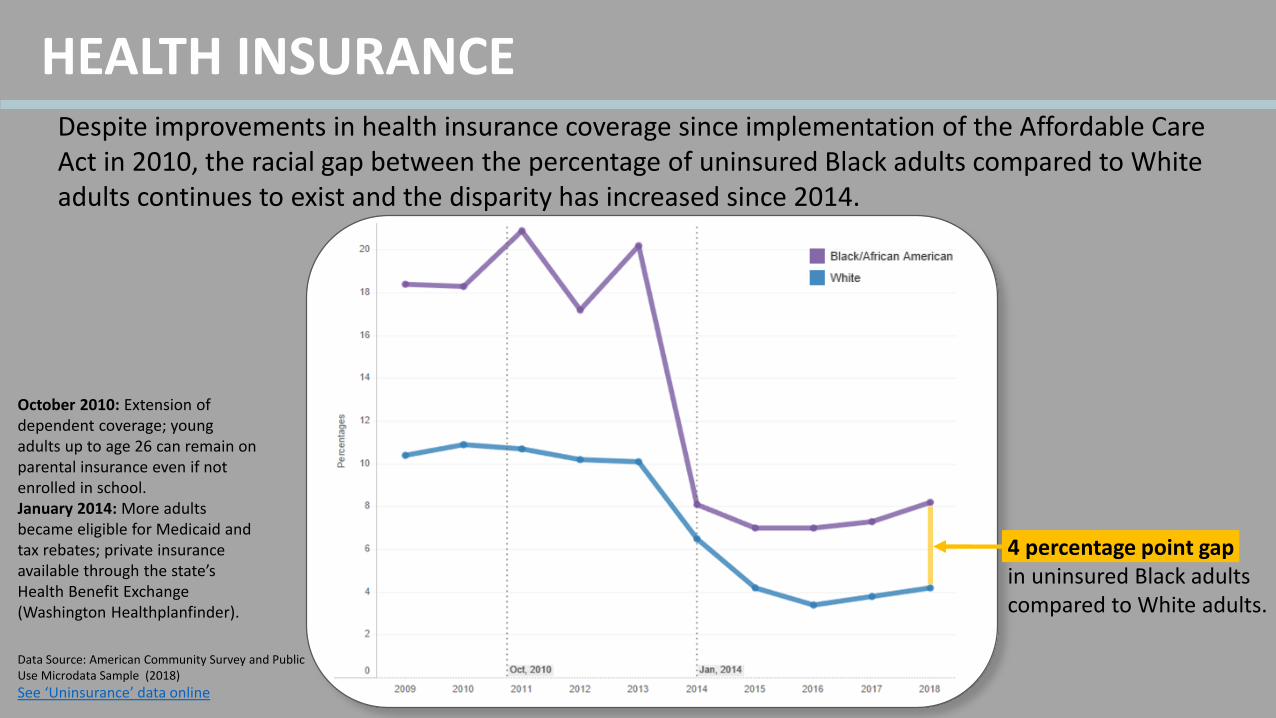
HEALTH INSURANCEDespite improvements in health insurance coverage since implementation of the Affordable Care Act in 2010, the racial gap between the percentage of uninsured Black adults compared to White adults continues to exist and the disparity has increased since 2014.
4 percentage point gap in uninsured Black adults compared to White adults.
October 2010: Extension of dependent coverage; young adults up to age 26 can remain on parental insurance even if not enrolled in school.January 2014: More adults became eligible for Medicaid and tax rebates; private insurance available through the state’s Health Benefit Exchange (Washington Healthplanfinder).
Data Source: American Community Survey and Public Use Microdata Sample (2018)
HEALTH INSURANCE
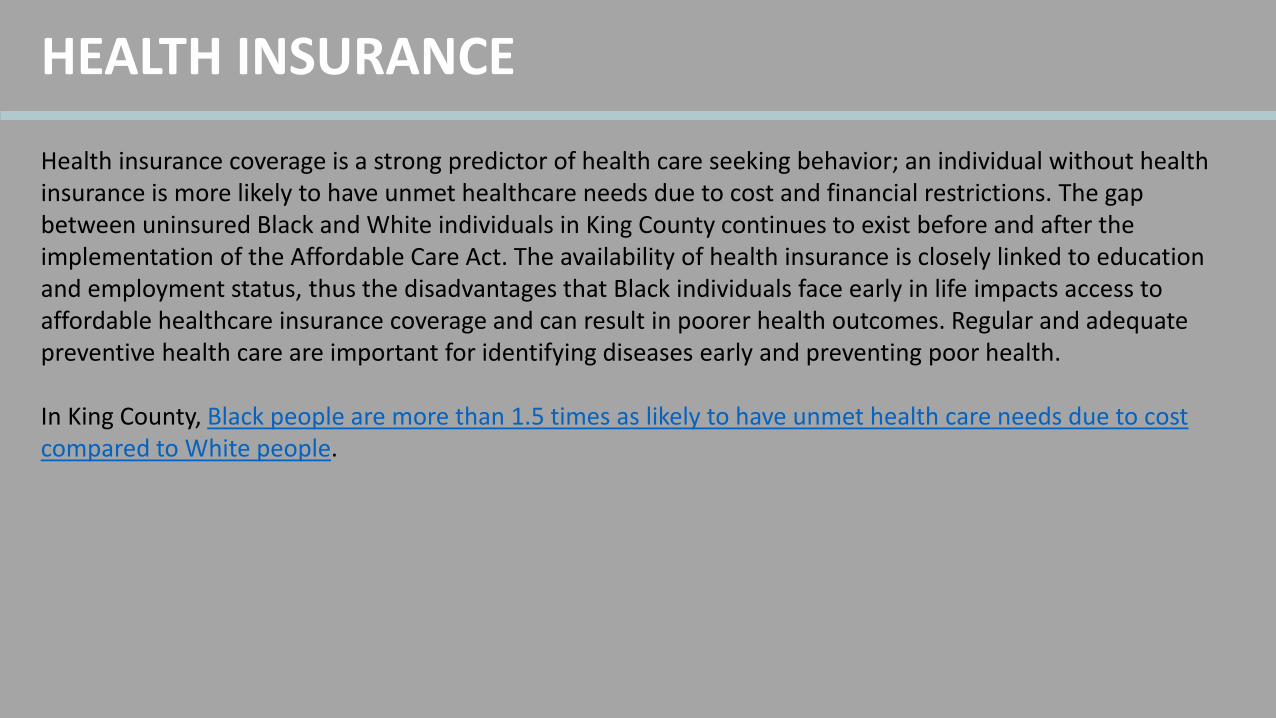
Health insurance coverage is a strong predictor of health care seeking behavior; an individual without health insurance is more likely to have unmet healthcare needs due to cost and financial restrictions. The gap between uninsured Black and White individuals in King County continues to exist before and after the implementation of the Affordable Care Act. The availability of health insurance is closely linked to education and employment status, thus the disadvantages that Black individuals face early in life impacts access to affordable healthcare insurance coverage and can result in poorer health outcomes. Regular and adequate preventive health care are important for identifying diseases early and preventing poor health.
In King County, Black people are more than 1.5 times as likely to have unmet health care needs due to cost compared to White people.
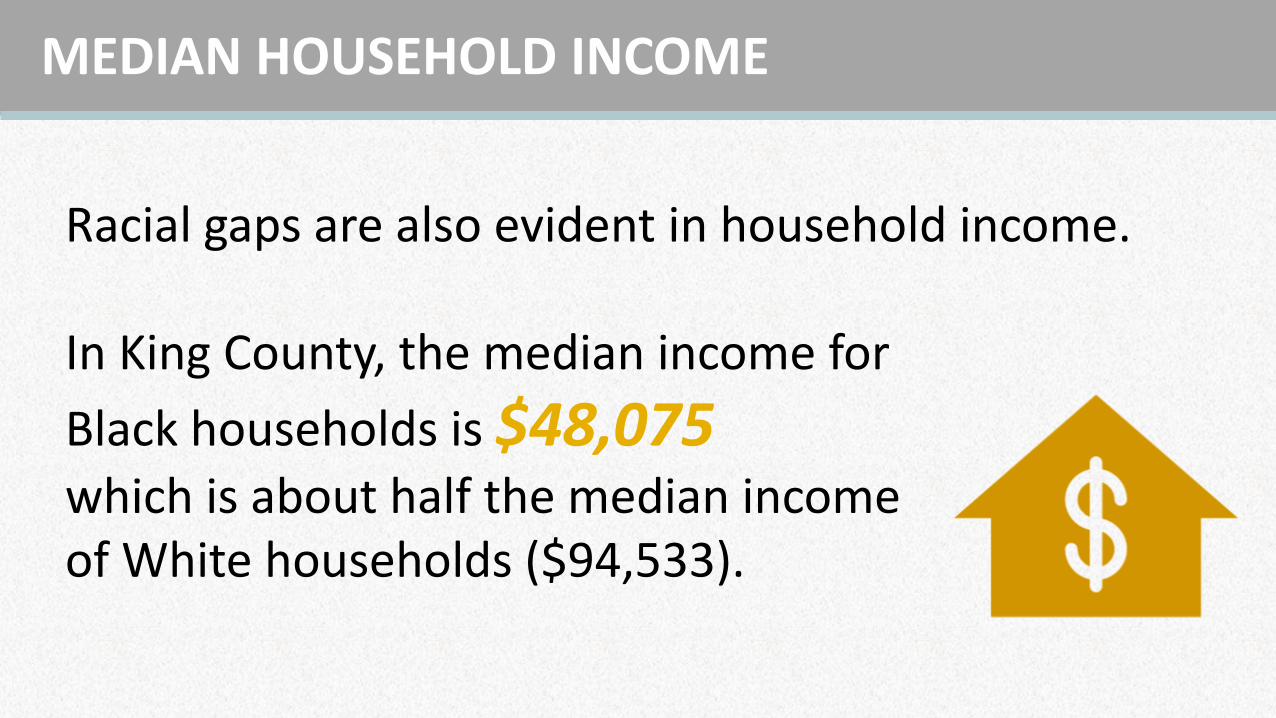
Racial gaps are also evident in household income.
In King County, the median income for
Black households is $48,075 which is about half the median income of White households ($94,533).
MEDIAN HOUSEHOLD INCOME
$48,075
$94,533
See ‘Median household income’ data online
MEDIAN HOUSEHOLD INCOME
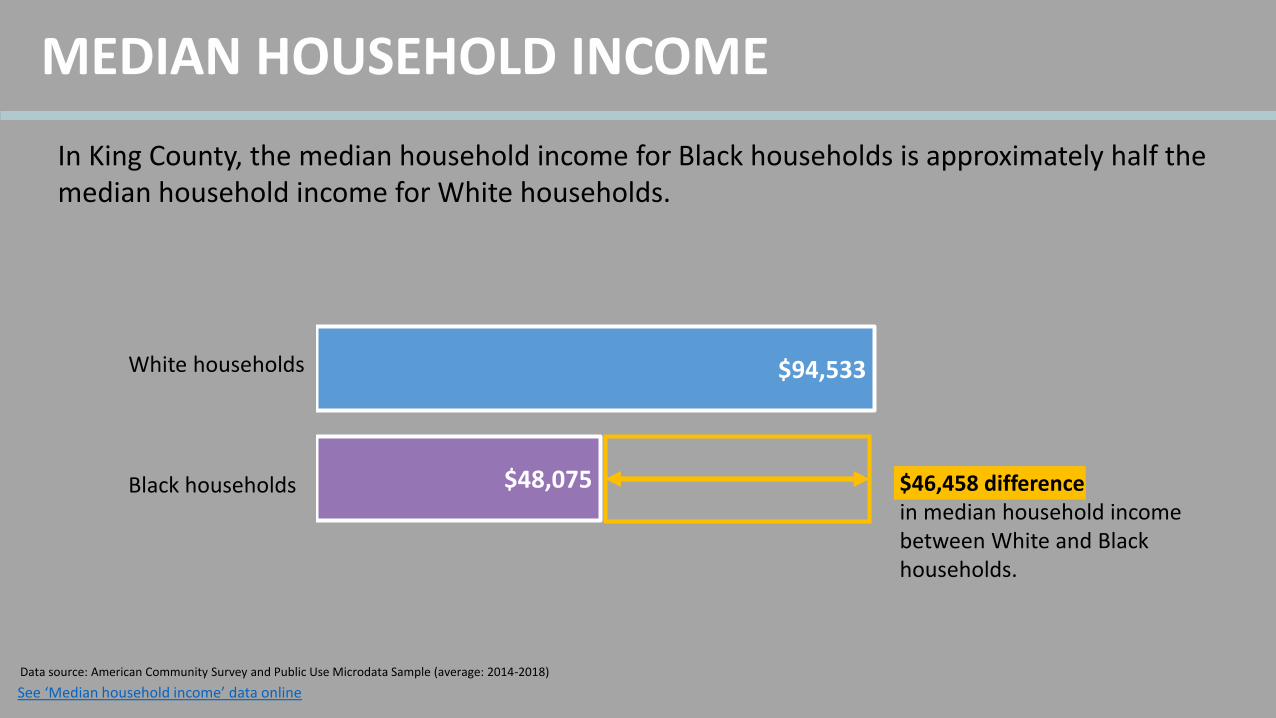
In King County, the median household income for Black households is approximately half the median household income for White households.
$46,458 difference in median household income between White and Black households.
White households
Black households
Data source: American Community Survey and Public Use Microdata Sample (average: 2014-2018)
MEDIAN HOUSEHOLD INCOME
Median household income is closely tied to educational opportunities and employment. In King County, Black adults are more then 2 times as likely to be unemployed compared to White adults which dramatically impacts the ability for Black households to afford basic needs such as food, housing, health care, and transportation.
In King County, even within the same job sector, Black adults make consistently less money than White adults. This is even more compounded by race and gender where “women of color experience the most persistent and pervasive wage gaps when compared to their White, male counterparts. The wage gaps across race/ethnicity and gender persist even when factors such as education level and job position type are accounted for.”1
1 Desrosiers, A. (2020). Wage Gaps, Unemployment, and Inequity: The Economic Impacts of A Pandemic In King County. Communities Count Blog. https://www.communitiescount.org/blog/2020/7/23/wage-gaps-unemployment-and-inequity-the-economic-impacts-of-a-pandemic-in-king-county
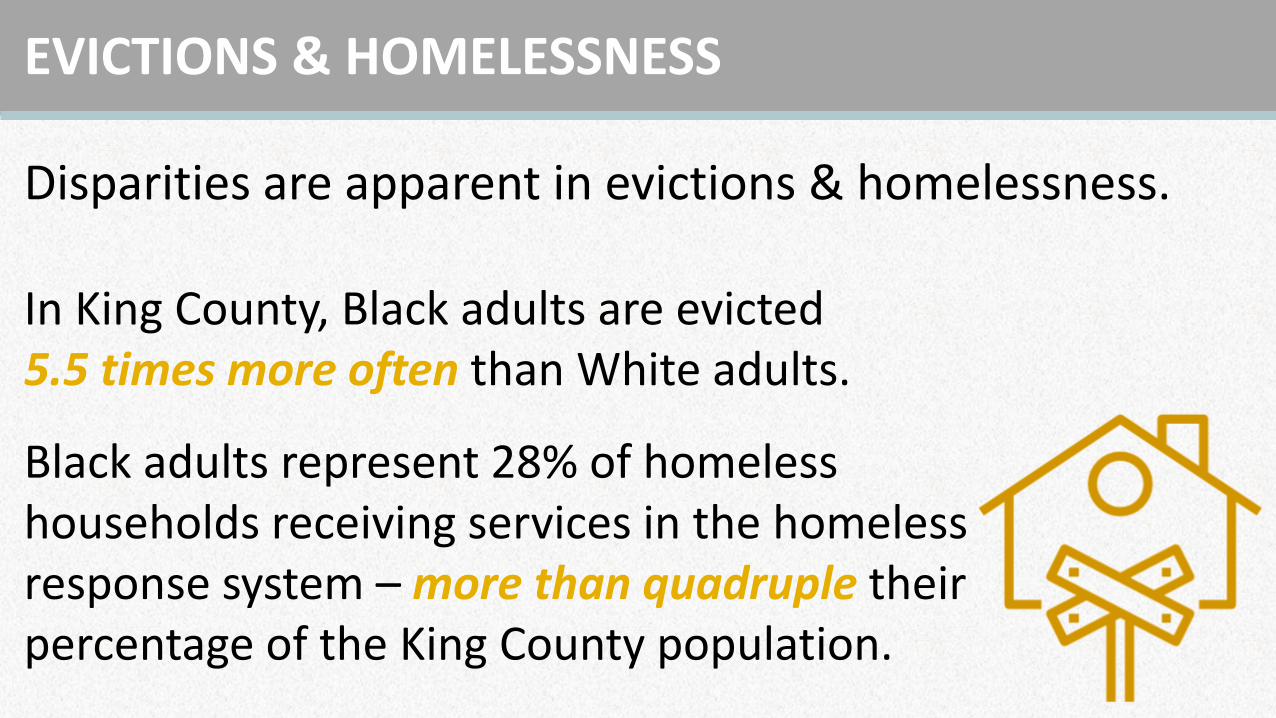
Disparities are apparent in evictions & homelessness.
In King County, Black adults are evicted5.5 times more often than White adults.
Black adults represent 28% of homeless households receiving services in the homeless response system – more than quadruple their percentage of the King County population.
EVICTIONS & HOMELESSNESS
See ‘Evictions Project’ data online
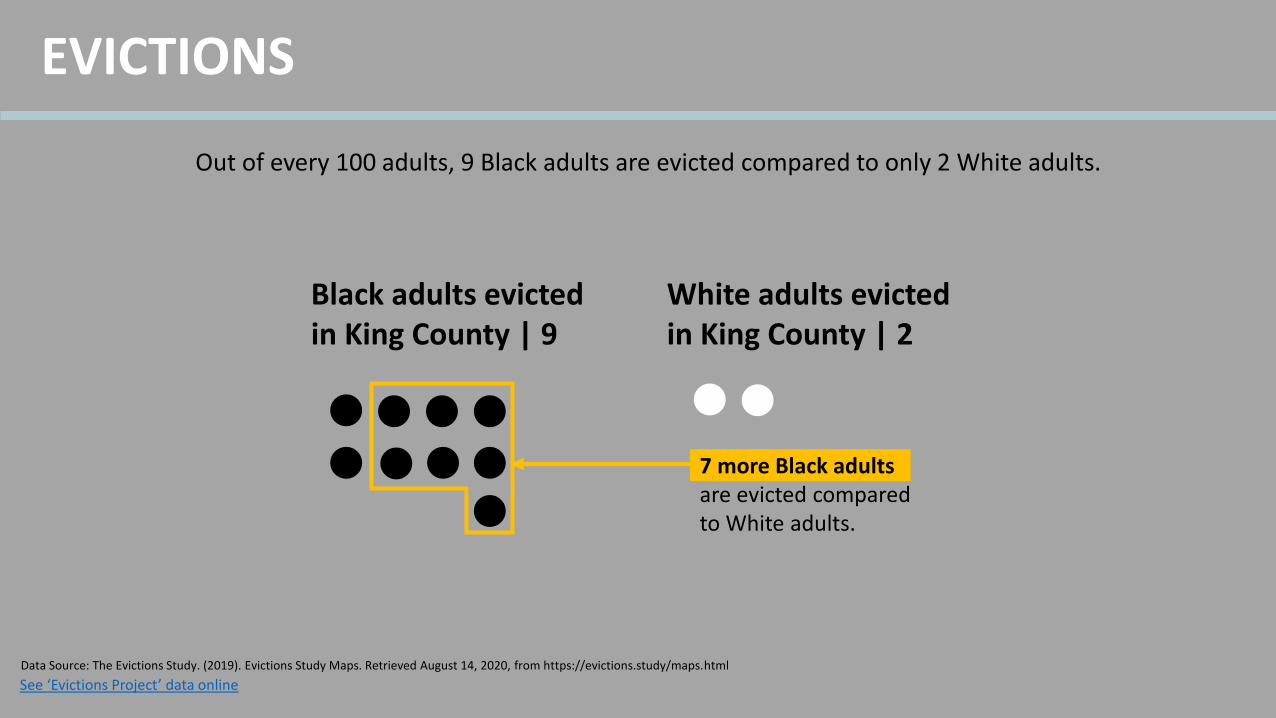
EVICTIONS
Black adults evicted in King County | 9
White adults evicted in King County | 2
Out of every 100 adults, 9 Black adults are evicted compared to only 2 White adults.
7 more Black adults are evicted compared to White adults.
Data Source: The Evictions Study. (2019). Evictions Study Maps. Retrieved August 14, 2020, from https://evictions.study/maps.html
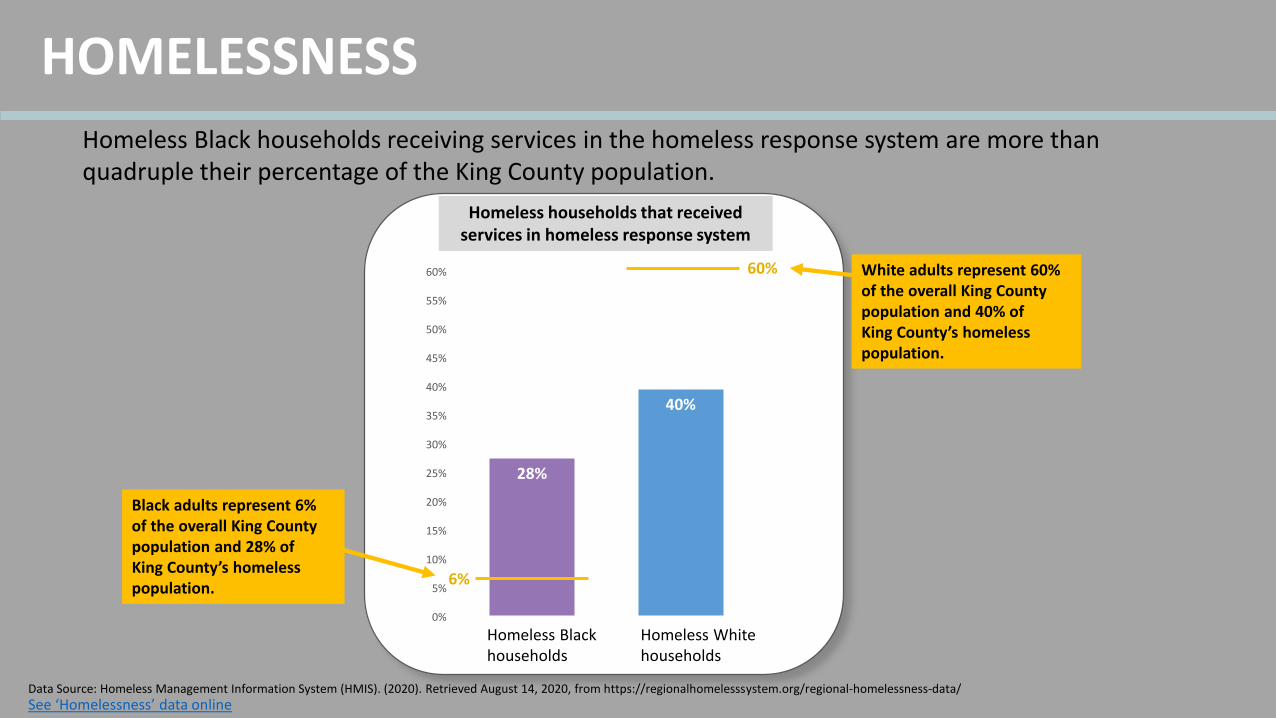
HOMELESSNESS
Homeless Black households receiving services in the homeless response system are more than quadruple their percentage of the King County population.
Homeless White households
Homeless Black households
28%
40%
0%
5%
10%
15%
20%
25%
30%
35%
40%
45%
50%
55%
60%
6%
60% White adults represent 60% of the overall King County population and 40% of King County’s homeless population.
See ‘Homelessness’ data onlineData Source: Homeless Management Information System (HMIS). (2020). Retrieved August 14, 2020, from https://regionalhomelesssystem.org/regional-homelessness-data/
Homeless households that received services in homeless response system
Black adults represent 6% of the overall King County population and 28% of King County’s homeless population.
EVICTIONS & HOMELESSNESS
Evictions in King County have disproportionately targeted communities of color, particularly Black residents, compared to White residents. This is troubling since the high rate of eviction for Black residents is “not simply due to lower incomes, but rather, it relates to the legacies of segregation that prevented many households of color from purchasing homes and participate in the building of the middle class through historical policies that subjugated and segregated persons of color. The dynamics of persistent urban segregation limits access to better neighborhoods, jobs, and class mobility and is reinforced through discrimination in housing access.”1
Evictions and homelessness go hand-in-hand and research has shown that evictions reinforce poverty as well as makes it increasingly difficult for an individual to find stable, affordable housing after an eviction notice. Research shows that housing insecurity such as receiving eviction notices is a predictor of future homelessness.2 Black residents in King County are impacted by systemic disparities related to housing insecurity – evictions and homelessness are two housing-related indicators that highlight the disproportionate experiences of Black communities in King County.
1 The Evictions Study. (2019). Evictions Study Maps. Retrieved August 14, 2020, from https://evictions.study/maps.html2 Shinn, M., Greer, A. L., Bainbridge, J., Kwon, J., & Zuiderveen, S. (2013). Efficient targeting of homelessness prevention services for families. American Journal of Public Health, 103(SUPPL. 2), S324–S330. https://doi.org/10.2105/AJPH.2013.301468
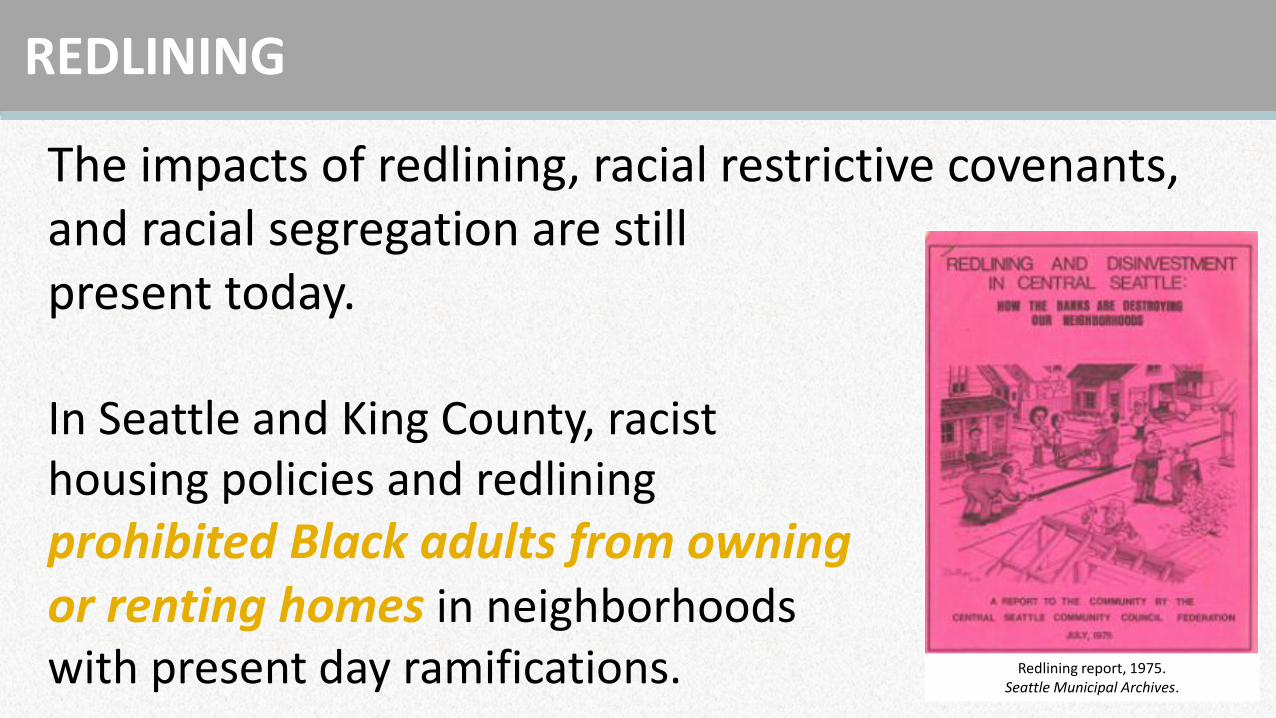
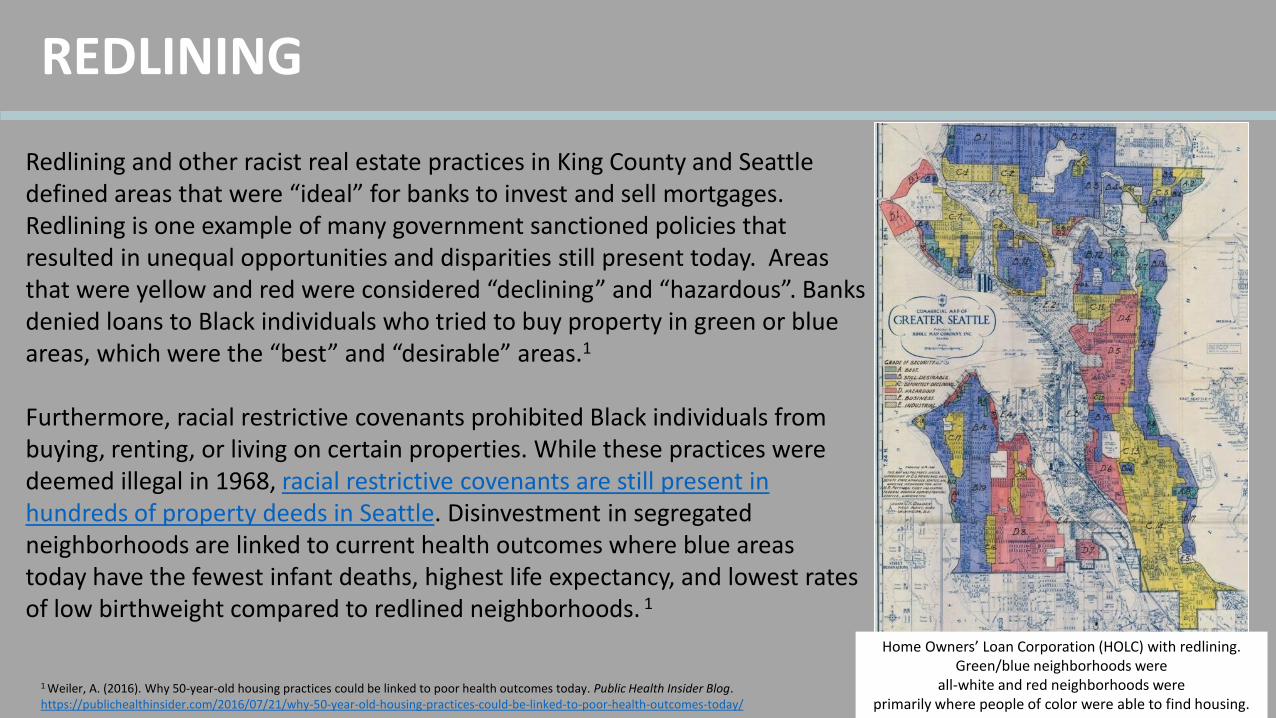
The impacts of redlining, racial restrictive covenants, and racial segregation are still present today.
In Seattle and King County, racist housing policies and redlining prohibited Black adults from owning or renting homes in neighborhoods with present day ramifications.
REDLINING
Redlining report, 1975. Seattle Municipal Archives.
REDLINING
Redlining and other racist real estate practices in King County and Seattledefined areas that were “ideal” for banks to invest and sell mortgages. Redlining is one example of many government sanctioned policies that resulted in unequal opportunities and disparities still present today. Areas that were yellow and red were considered “declining” and “hazardous”. Banks denied loans to Black individuals who tried to buy property in green or blue areas, which were the “best” and “desirable” areas.1
Furthermore, racial restrictive covenants prohibited Black individuals from buying, renting, or living on certain properties. While these practices were deemed illegal in 1968, racial restrictive covenants are still present in hundreds of property deeds in Seattle. Disinvestment in segregated neighborhoods are linked to current health outcomes where blue areastoday have the fewest infant deaths, highest life expectancy, and lowest rates of low birthweight compared to redlined neighborhoods. 1
Home Owners’ Loan Corporation (HOLC) with redlining.Green/blue neighborhoods were
all-white and red neighborhoods were primarily where people of color were able to find housing.
1 Weiler, A. (2016). Why 50-year-old housing practices could be linked to poor health outcomes today. Public Health Insider Blog. https://publichealthinsider.com/2016/07/21/why-50-year-old-housing-practices-could-be-linked-to-poor-health-outcomes-today/
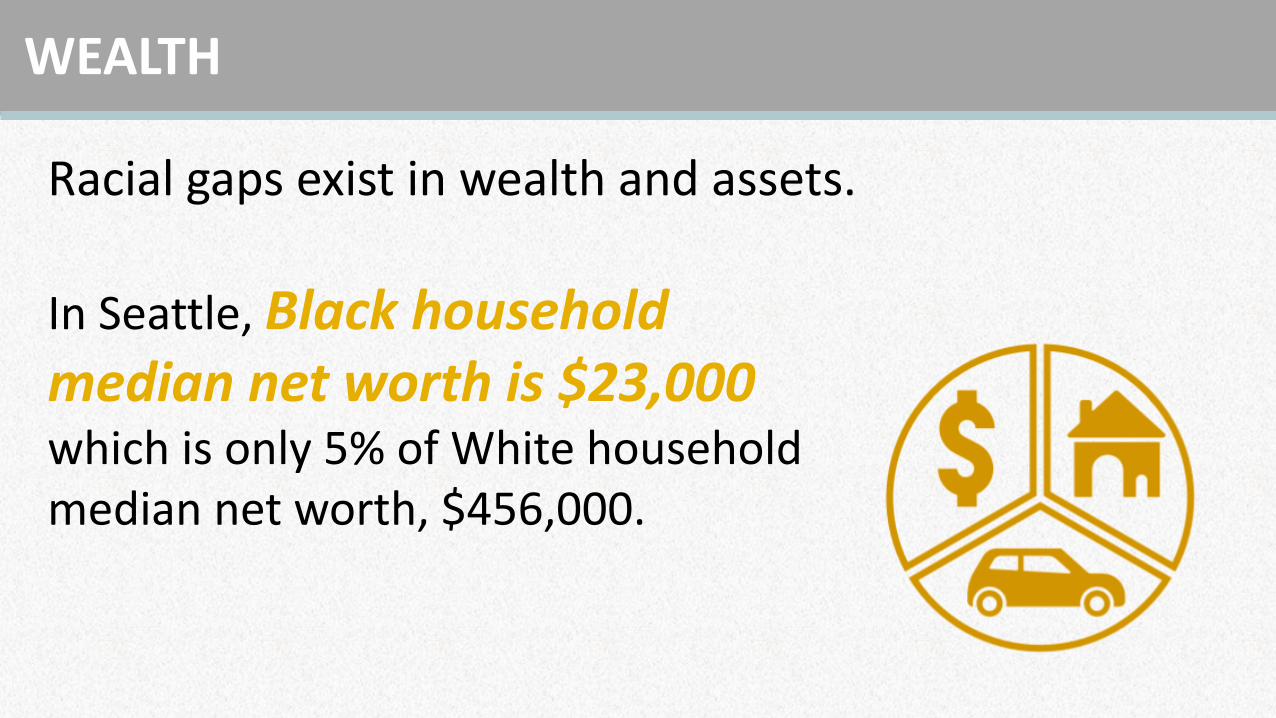
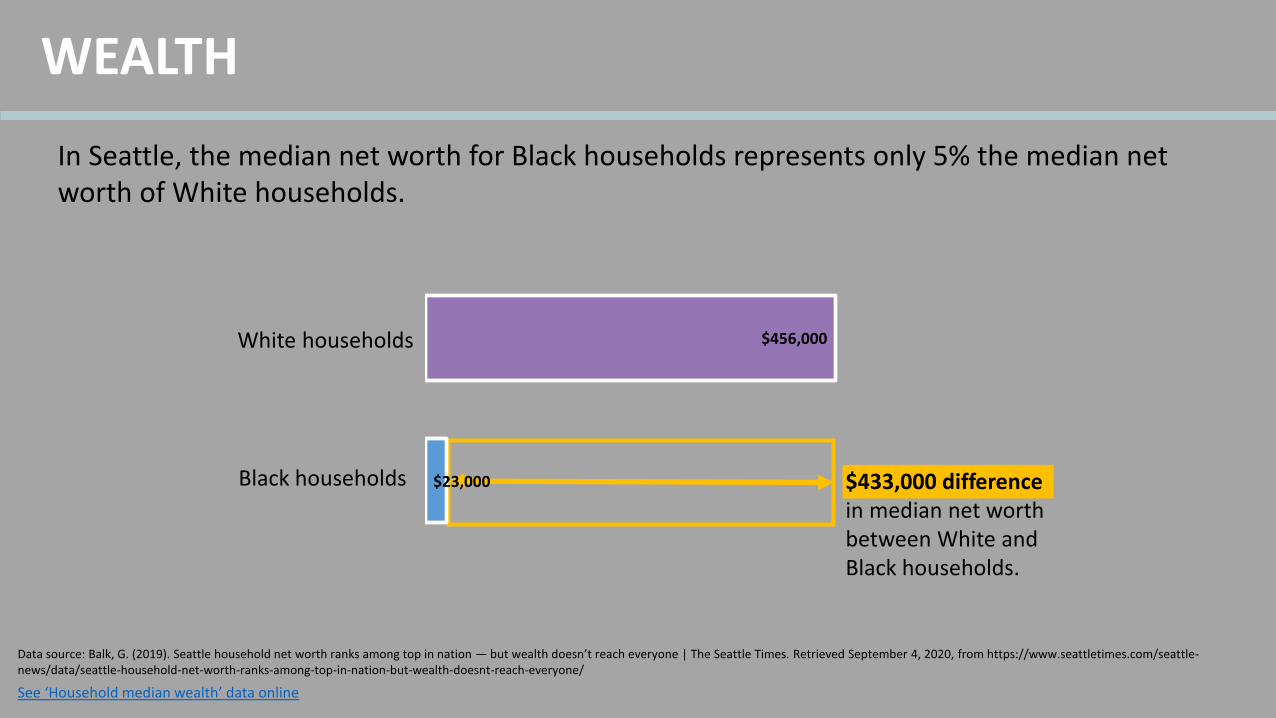
Racial gaps exist in wealth and assets.
In Seattle, Black household median net worth is $23,000 which is only 5% of White household median net worth, $456,000.
WEALTH
See ‘Household median wealth’ data online
WEALTH
In Seattle, the median net worth for Black households represents only 5% the median net worth of White households.
$433,000 difference in median net worth between White and Black households.
White households
Black households $23,000
$456,000
Data source: Balk, G. (2019). Seattle household net worth ranks among top in nation — but wealth doesn’t reach everyone | The Seattle Times. Retrieved September 4, 2020, from https://www.seattletimes.com/seattle-news/data/seattle-household-net-worth-ranks-among-top-in-nation-but-wealth-doesnt-reach-everyone/
WEALTH
A household’s net worth is calculated by summing all assets and subtracting debts. Assets include things like money in savings, investments, pensions as well as tangible things that a household could sell for money like a house, car, or boat. Debts include things like mortgages, loans, and credit card debts. The racial disparity between Black household net worth ($23,000) and White household net worth ($456,000) in Seattle is staggering. Home ownership is one of the biggest assets for a household, however, given historical racist real estate practices that denied homes to Black individuals as well as disparities in educational attainment and employment, Black individuals face many more barriers to owning a home compared to White individuals. Disparities in home ownership persist despite educational attainment since nationally, “college educated Black people are less likely to own their own homes than white people who never finished high school.”
Asset poverty is an estimation of a household’s net worth that can be used to meet expenses for up to 3 months during emergencies or times of crisis. Black households are more than 2.7 times likely to be in asset poverty than are White households in King County which dramatically impacts a Black household’s risk of severe financial instability, wealth, opportunity, and health – this is further exacerbated during COVID-19 and unemployment claims among Black workers (described later).
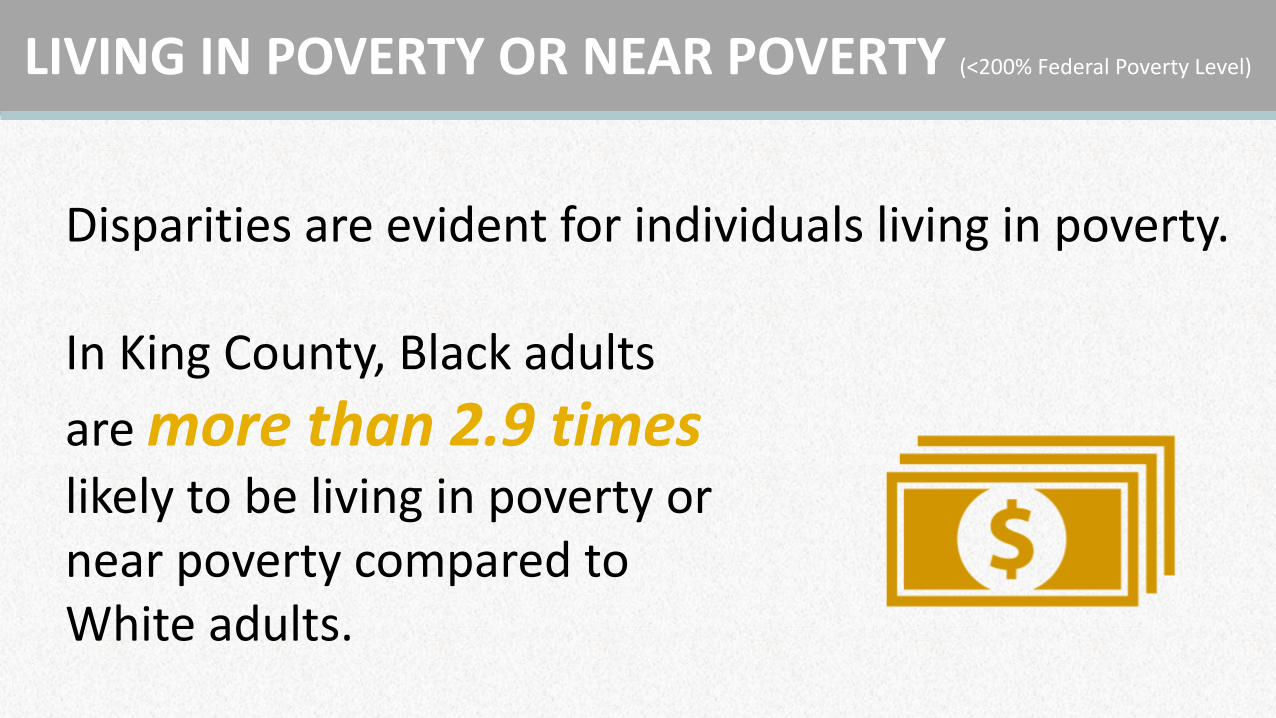
Disparities are evident for individuals living in poverty.
In King County, Black adults
are more than 2.9 times likely to be living in poverty or near poverty compared to White adults.
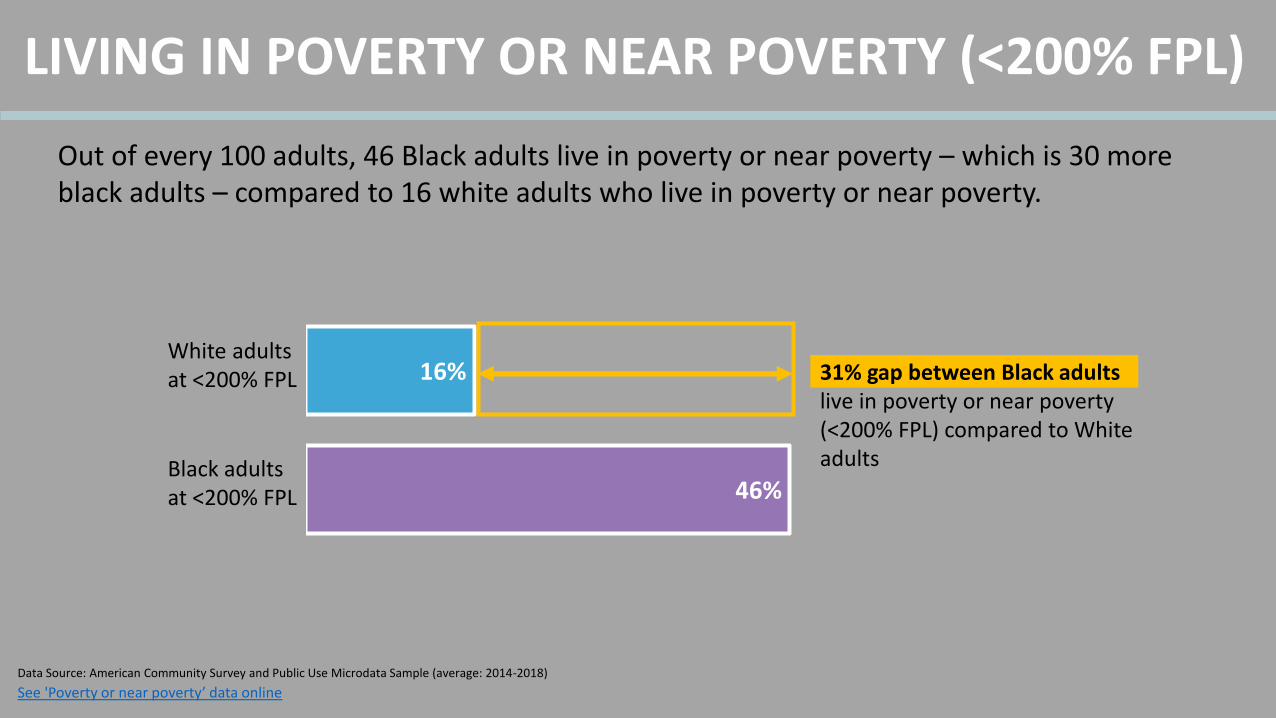
LIVING IN POVERTY OR NEAR POVERTY (<200% Federal Poverty Level)
See 'Poverty or near poverty’ data online
Out of every 100 adults, 46 Black adults live in poverty or near poverty – which is 30 more black adults – compared to 16 white adults who live in poverty or near poverty.
31% gap between Black adultslive in poverty or near poverty (<200% FPL) compared to White adults
White adults at <200% FPL
LIVING IN POVERTY OR NEAR POVERTY (<200% FPL)
Black adults at <200% FPL 46%
16%
Data Source: American Community Survey and Public Use Microdata Sample (average: 2014-2018)
Disparities in median household income, employment, and education for Black families and individuals contribute to living situations that make it difficult to afford basic needs in life. Throughout the years, systemic racism has created this gap through a series of resources and advantages that provide opportunities for White adults to more easily accumulate wealth than Black adults. Additional examples of systemic practices include redlining as well as discriminatory labor protections and conditions. In King County, the higher percent of Black individuals who are living in poverty or near poverty compared to White individuals results in increased levels of chronic stress and anxiety.
Families living in poverty or near poverty often cannot afford to live in healthy and safe housing which is associated with the availability of walkable neighborhoods that have access to affordable grocery stores. This impacts black families with young children – in King County, Black families with young children roughly 2.5 times likely to have struggled to afford transportation at least some of the time since the child was born compared to White families with young children.
LIVING IN POVERTY OR NEAR POVERTY (<200% FPL)
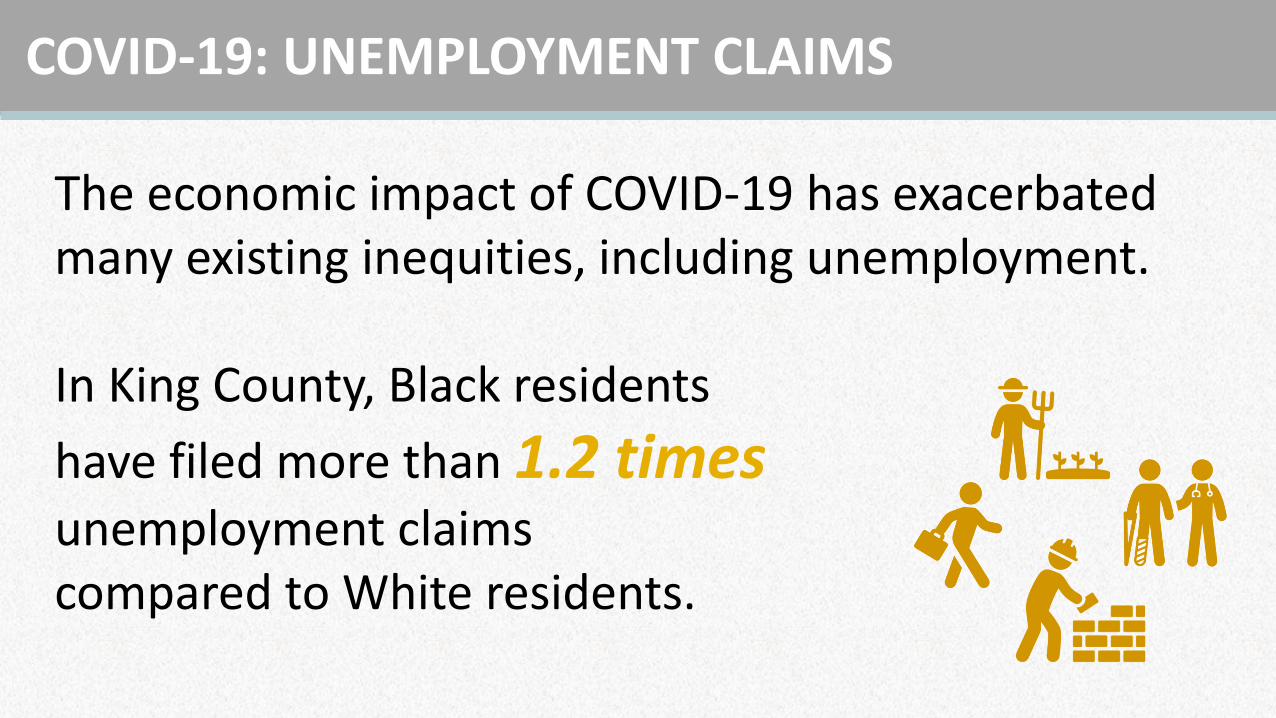
The economic impact of COVID-19 has exacerbatedmany existing inequities, including unemployment.
In King County, Black residents
have filed more than 1.2 times unemployment claimscompared to White residents.
COVID-19: UNEMPLOYMENT CLAIMS
See ‘COVID-19 & unemployment’ blog online
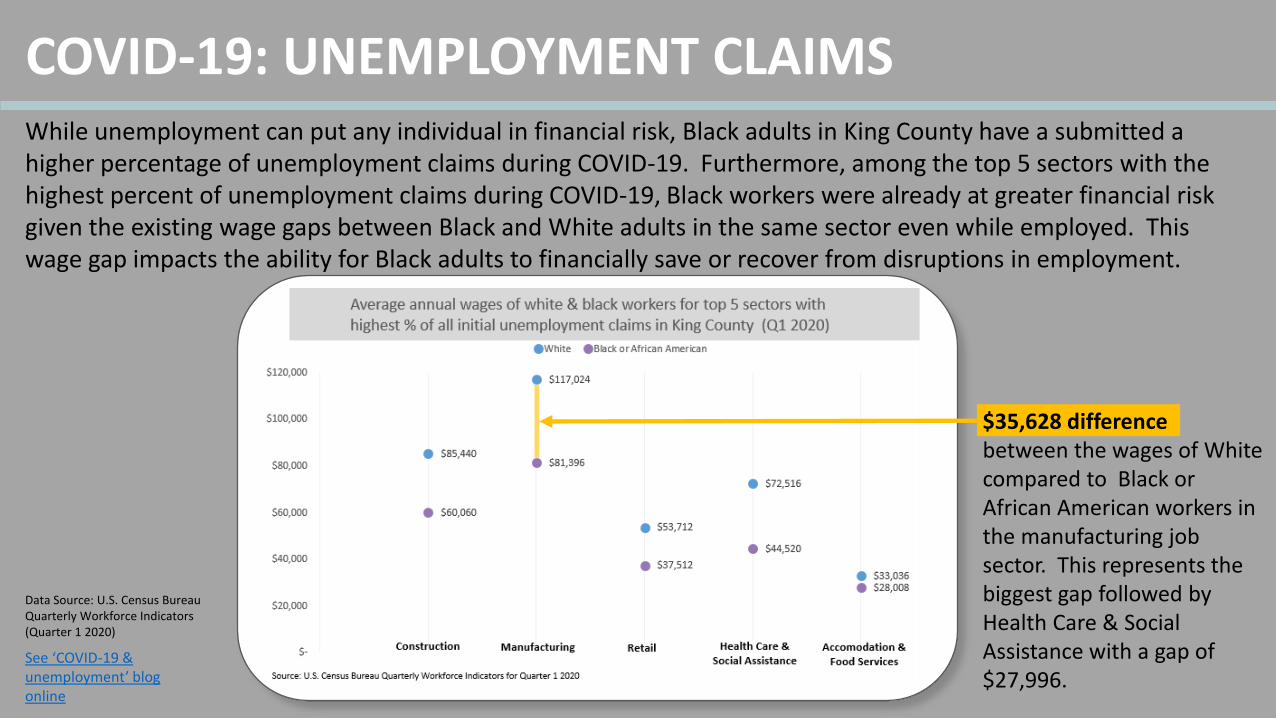
While unemployment can put any individual in financial risk, Black adults in King County have a submitted a higher percentage of unemployment claims during COVID-19. Furthermore, among the top 5 sectors with the highest percent of unemployment claims during COVID-19, Black workers were already at greater financial risk given the existing wage gaps between Black and White adults in the same sector even while employed. This wage gap impacts the ability for Black adults to financially save or recover from disruptions in employment.
COVID-19: UNEMPLOYMENT CLAIMS
$35,628 difference between the wages of White compared to Black or African American workers in the manufacturing job sector. This represents the biggest gap followed by Health Care & Social Assistance with a gap of $27,996.
Data Source: U.S. Census Bureau Quarterly Workforce Indicators (Quarter 1 2020)
COVID-19 has impacted every individual and resident living in King County. However, for communities of color, including Black residents, COVID-19 has further exacerbated existing disparities since Black individuals and households already faced additional barriers and/or unequal opportunities for meeting basic needs as well as generating a livable income.
Within the five job sectors that have been most impacted by unemployment claims (manufacturing, construction, health care & social assistance, retail trade, accommodation & food services), communities of color and Black adults made less money than White adults even within the same job sector. Furthermore, while Black adults represent 7% of the population in King County, 32% of 2-1-1 calls seeking social service support identify as Black individuals. This represents a “4.5-fold degree of disproportionately in needs among Black populations, relative to their size of the county’s population.” 1 Unemployment claims since the onset of COVID-19 highlights the fact that it has disproportionately “…left many communities vulnerable to the severe impacts of job loss and the related risk of losing access to basic needs, including safe and stable housing, consistent access to nutritious food, and accessible, necessary healthcare”.2
COVID-19: UNEMPLOYMENT CLAIMS
1 (2020). Learning about basic needs during social distancing through 2-1-1, part 2: who is calling and why. Communities Count Blog. https://www.communitiescount.org/blog/2020/6/9/learning-about-basic-needs-during-social-distancing-through-211-who-is-calling-and-why2 Desrosiers, A. (2020). Wage Gaps, Unemployment, and Inequity: The Economic Impacts of A Pandemic In King County. Communities Count Blog. https://www.communitiescount.org/blog/2020/7/23/wage-gaps-unemployment-and-inequity-the-economic-impacts-of-a-pandemic-in-king-county
COVID-19 CASES
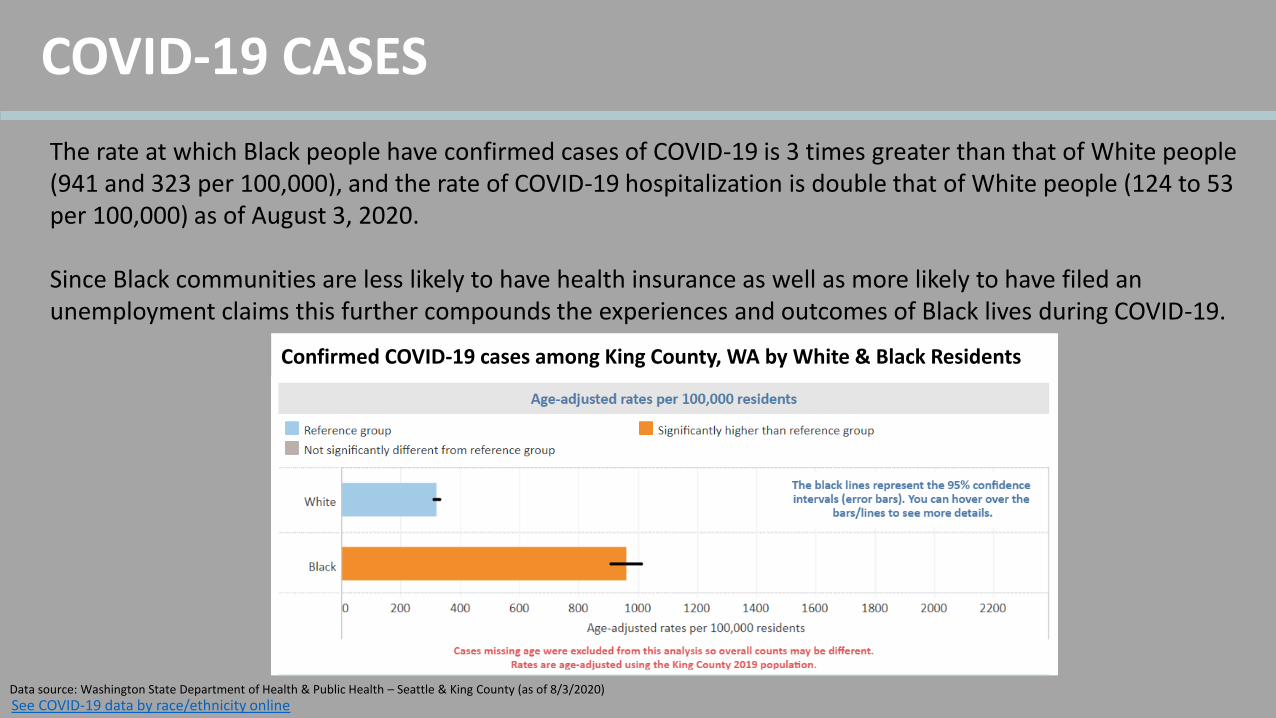
The rate at which Black people have confirmed cases of COVID-19 is 3 times greater than that of White people (941 and 323 per 100,000), and the rate of COVID-19 hospitalization is double that of White people (124 to 53 per 100,000) as of August 3, 2020.
Since Black communities are less likely to have health insurance as well as more likely to have filed an unemployment claims this further compounds the experiences and outcomes of Black lives during COVID-19.
Confirmed COVID-19 cases among King County, WA by White & Black Residents
Data source: Washington State Department of Health & Public Health – Seattle & King County (as of 8/3/2020)
See COVID-19 data by race/ethnicity online
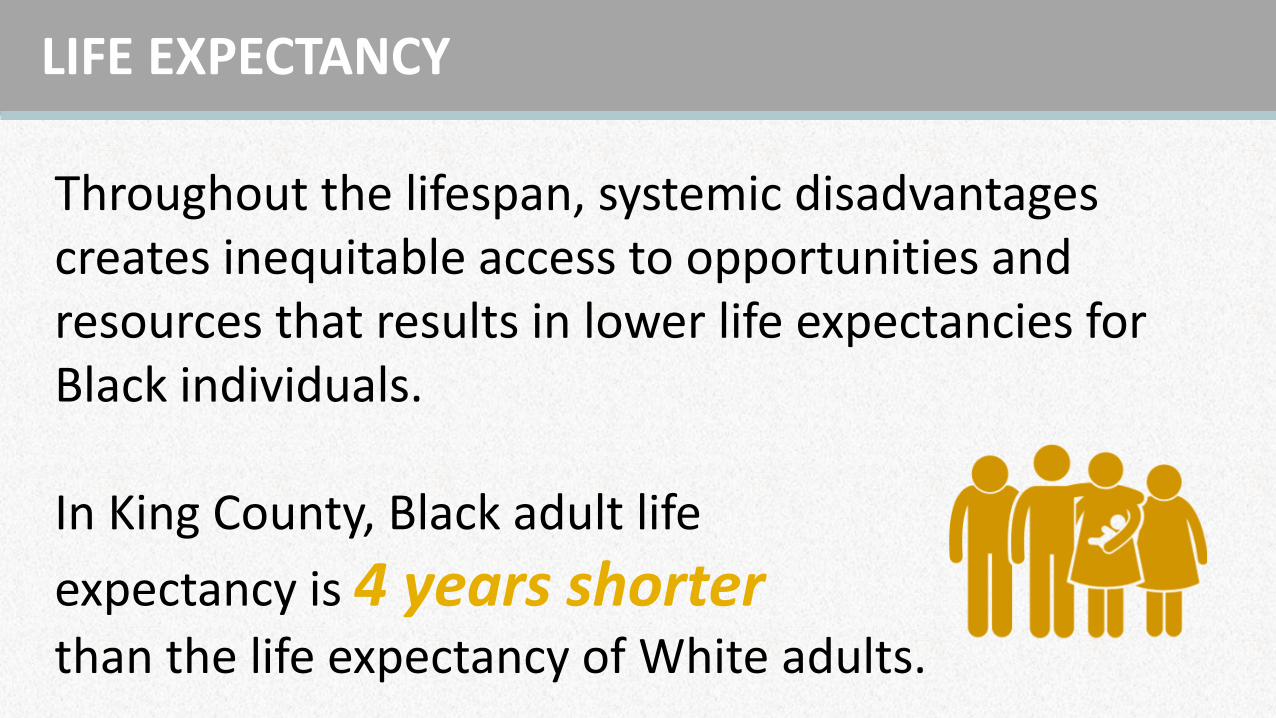
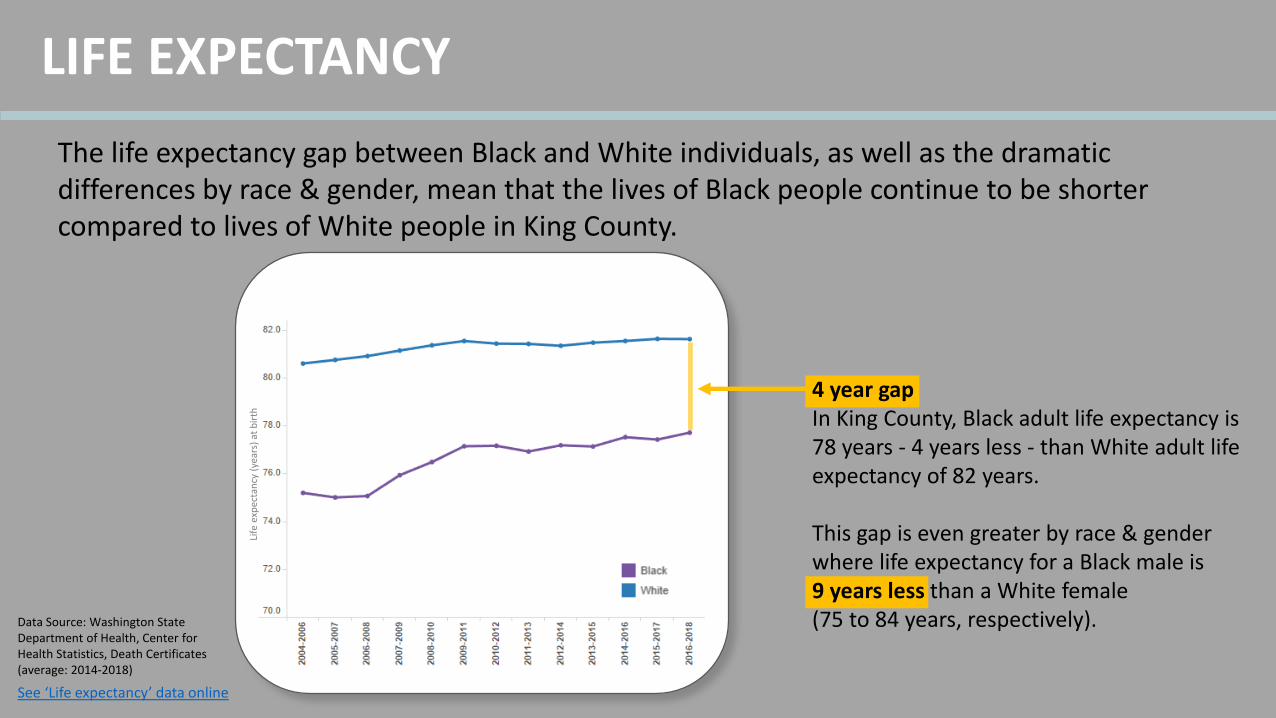
Throughout the lifespan, systemic disadvantages creates inequitable access to opportunities and resources that results in lower life expectancies for Black individuals.
In King County, Black adult life
expectancy is 4 years shorterthan the life expectancy of White adults.
LIFE EXPECTANCY
See ‘Life expectancy’ data online
LIFE EXPECTANCY
The life expectancy gap between Black and White individuals, as well as the dramatic differences by race & gender, mean that the lives of Black people continue to be shorter compared to lives of White people in King County.
4 year gap In King County, Black adult life expectancy is 78 years - 4 years less - than White adult life expectancy of 82 years.
This gap is even greater by race & gender where life expectancy for a Black male is9 years less than a White female (75 to 84 years, respectively).Data Source: Washington State
Department of Health, Center for Health Statistics, Death Certificates (average: 2014-2018)
Life
exp
ecta
ncy
(ye
ars)
at
bir
th
LIFE EXPECTANCY
The chronic stress that accumulates over a lifetime for Black individuals results from generational and lifetime experiences of racial discrimination. Government sanctioned policies and practices including education, homeownership, and employment - rather than genetics, individual choice, or culture – have created an environment that supports the upward mobility of White individuals at the cost of Black individuals. This pervasive and daily systemic disadvantages disproportionately impacts the health, social, mental, as well as economic opportunities and resources for Black communities takes a toll on the body.
In King County, Black infants at birth have a life expectancy that is 4 years shorter than the life expectancy of White infants at birth. The inequitable opportunities for infant mortality, food security, educational attainment, health insurance coverage, median household income, poverty, and unemployment all contribute to a shorter lifespan.
During COVID-19, the racial gap between Black communities compared to White communities in King County has widened even more. King County must be a vital player in dismantling oppressive systems, investing in programs and support, as well as valuing the lives and livelihoods of our Black communities. As we work across basic needs and social determinants of health, these data serve as a foundation to build upon and invest resources, programs, and policies as we continue our journey towards transformation.
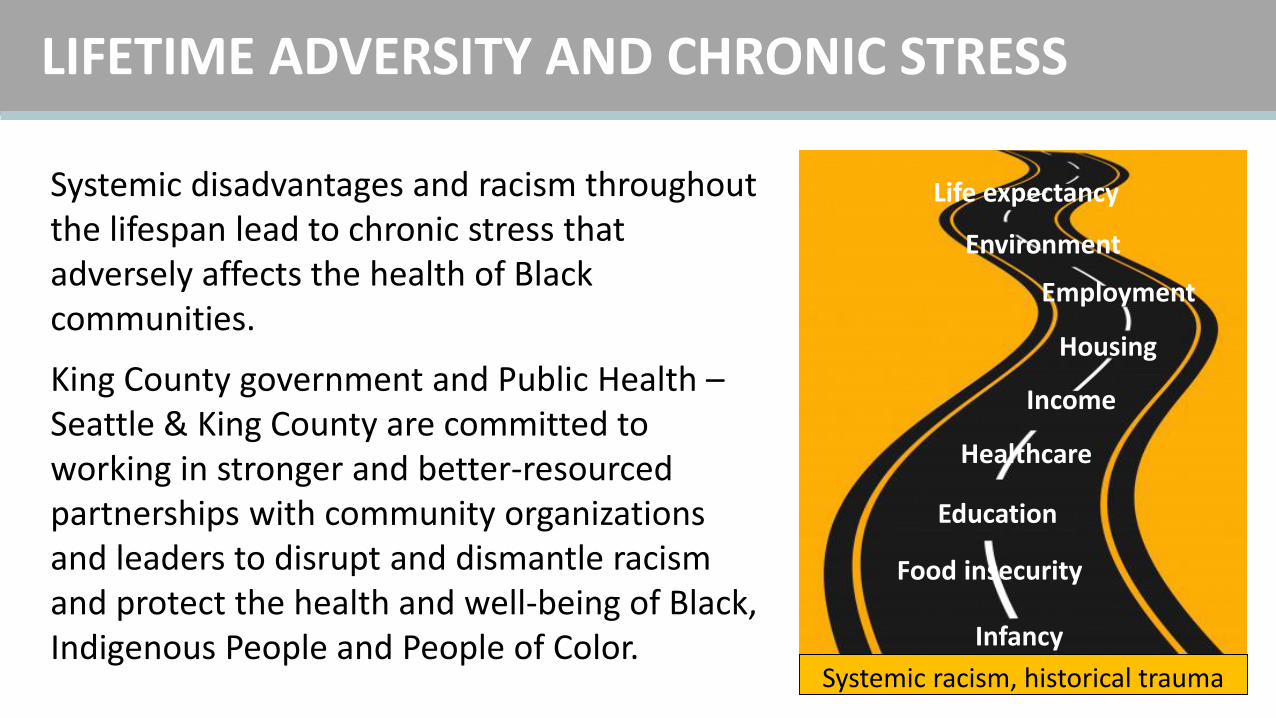
Systemic disadvantages and racism throughout the lifespan lead to chronic stress that adversely affects the health of Black communities.
King County government and Public Health –Seattle & King County are committed to working in stronger and better-resourced partnerships with community organizations and leaders to disrupt and dismantle racism and protect the health and well-being of Black, Indigenous People and People of Color.
LIFETIME ADVERSITY AND CHRONIC STRESS
Systemic racism, historical trauma
Infancy
Food insecurity
Healthcare
Education
Employment
Income
Housing
Life expectancy
Environment
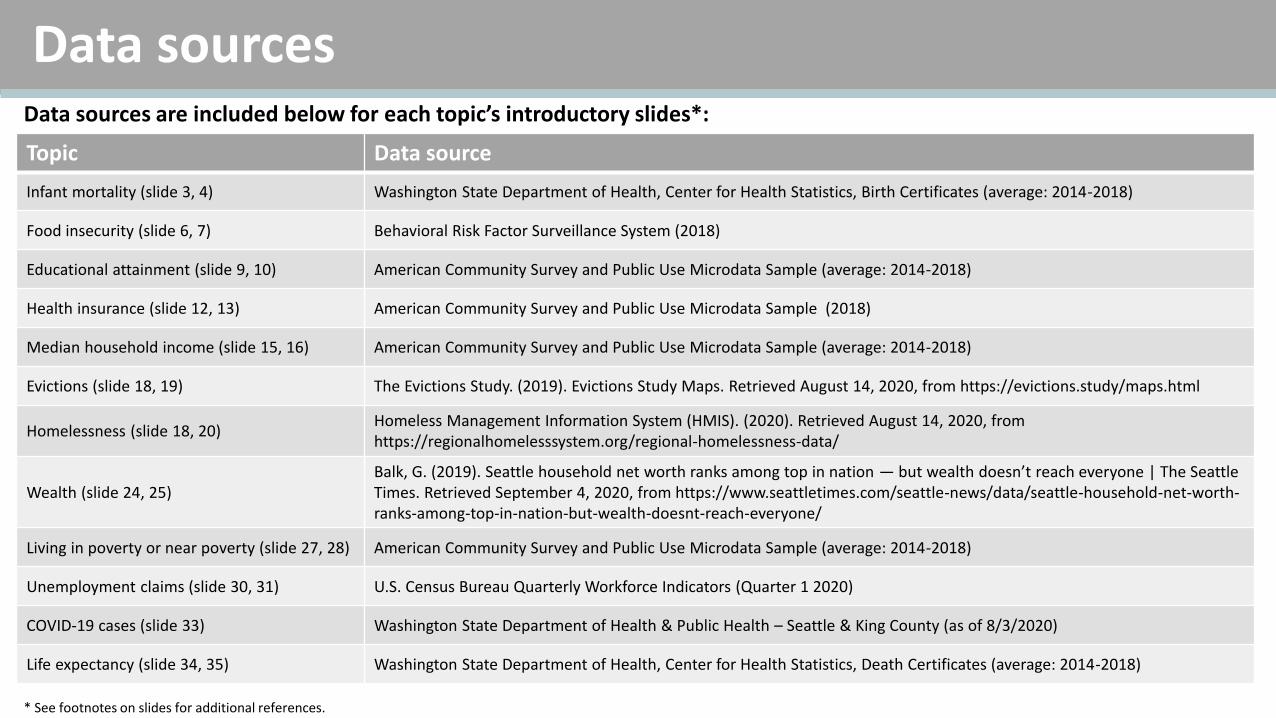
Data sourcesData sources are included below for each topic’s introductory slides*:
Topic Data source
Infant mortality (slide 3, 4) Washington State Department of Health, Center for Health Statistics, Birth Certificates (average: 2014-2018)
Food insecurity (slide 6, 7) Behavioral Risk Factor Surveillance System (2018)
Educational attainment (slide 9, 10) American Community Survey and Public Use Microdata Sample (average: 2014-2018)
Health insurance (slide 12, 13) American Community Survey and Public Use Microdata Sample (2018)
Median household income (slide 15, 16) American Community Survey and Public Use Microdata Sample (average: 2014-2018)
Evictions (slide 18, 19) The Evictions Study. (2019). Evictions Study Maps. Retrieved August 14, 2020, from https://evictions.study/maps.html
Homelessness (slide 18, 20)Homeless Management Information System (HMIS). (2020). Retrieved August 14, 2020, from https://regionalhomelesssystem.org/regional-homelessness-data/
Wealth (slide 24, 25)Balk, G. (2019). Seattle household net worth ranks among top in nation — but wealth doesn’t reach everyone | The Seattle Times. Retrieved September 4, 2020, from https://www.seattletimes.com/seattle-news/data/seattle-household-net-worth-ranks-among-top-in-nation-but-wealth-doesnt-reach-everyone/
Living in poverty or near poverty (slide 27, 28) American Community Survey and Public Use Microdata Sample (average: 2014-2018)
Unemployment claims (slide 30, 31) U.S. Census Bureau Quarterly Workforce Indicators (Quarter 1 2020)
COVID-19 cases (slide 33) Washington State Department of Health & Public Health – Seattle & King County (as of 8/3/2020)
Life expectancy (slide 34, 35) Washington State Department of Health, Center for Health Statistics, Death Certificates (average: 2014-2018)
* See footnotes on slides for additional references.