Embed Size (px)
Citation preview
PREPRINT
The Recombination Project: Analyzing Recombination Frequencies
Using Crowdsourced Data
Blaine T. Bettinger, Ph.D., J.D. The Genetic Genealogist (www.TheGeneticGenealogist.com)
February 20, 2017
ABSTRACT
The Recombination Project examines the recombination that occurs during a single maternal
meiosis. By comparing the autosomes and X chromosome of a grandchild to his or her maternal
grandmother or grandfather, the recombination events that occurred during the formation of the
egg that would become the grandchild can be identified. Using the popular third-party tool
GEDmatch (www.gedmatch.com), recombination events in 250 grandchild/grandparent
comparisons – crowdsourced from genetic genealogists – were visualized and quantified.
Observed recombination frequencies for the autosomes and X chromosome were calculated and
compared to expected recombination frequencies. I find a mean maternal genome-wide
recombination frequency of 40.8, which aligns very well with previous studies. The data also
suggests that recombination occurs with greater frequency than expected based on the Poisson
distribution. I also find that in 96% of recombinations, at least one autosome was inherited without
undergoing recombination, and in one example a total of 10 chromosomes were inherited without
recombination. The data also shows that the smallest autosomes, 21 and 22, are often inherited
from a grandmother or grandfather without recombination (43.6% and 37.2% of recombinations,
respectively). This may have an impact on IBD matching on chromosomes 21 and 22.
1. INTRODUCTION
Understanding recombination is one of the most important aspects of autosomal DNA analysis for
ancestry comparison. The growing size of autosomal DNA databases allows for the collection and
analysis of recombination on a massive scale. Although there are several studies examining
recombination frequencies per genome per meiosis1, there are few if any studies reporting
recombination frequencies per chromosome per meiosis.
The Recombination Project has its roots in a previous crowdsourced project, the X-DNA
Inheritance Project. Genealogists using DNA evidence often view the X chromosome as being
fundamentally different from the autosomes. Although the inheritance pattern of the X
chromosome is significantly different, it was previously unclear whether the recombination
frequency of the X chromosome was significantly different from recombination frequency of the
autosomes. As the X-DNA Inheritance Project progressed, it became clear that without
understanding the recombination frequencies of the autosomes, it was not possible to understand
how the X chromosome might vary from those frequencies. Unfortunately, this information was
not readily identified following a literature search. Accordingly, the Recombination Project was
PREPRINT
created to study recombination frequencies of all autosomes and the X chromosome. Because the
Recombination Project has its roots in the study of the X chromosome, the data collected for
analysis was from maternal grandparents only.
During recombination, chromosomal crossover can occur between any of the four chromatids (two
sister chromatids and two non-sister chromatids). Since crossover events between sister
chromatids cannot be detected using the methods described here, this report only examines
recombination events between non-sister chromatids. Indeed, most recombination studies examine
only recombination between non-sister chromatids.
2. METHODS
Data Collection
Data was collected from participants using Google Forms, which collected the submissions into a
spreadsheet. The Google Form (available at https://goo.gl/forms/gg2n9SSUUKQSt5KG3)
contained data entry fields for: (i) Grandchild’s GEDmatch kit number; (ii) Maternal grandfather’s
GEDmatch kit number; (iii) Maternal grandmother’s GEDmatch kit number; (iv) Permission to
use the One-to-One and X One-to-One tools to analyze the data; (v) Request for acknowledgement
that all individuals associated with the provided GEDmatch kit numbers have provided consent
for the project.
A total of 280 submissions were made to the Recombination Project as of February 20, 2017
(beginning January 19, 2017). For analysis, the submissions were downloaded as an Excel
spreadsheet.
Data Curation
Submissions without permission to use the One-to-One and X One-to-One tools to analyze the
data, and submissions without acknowledgement that all individuals associated with the provided
GEDmatch kit numbers have provided consent for the project, were removed from the project.
Additionally, several submissions revealed no relationship between the alleged grandchild and
grandparent, while several submissions shared X-DNA but no autosomal DNA. These submissions
were removed from the project.
The first 250 usable submissions were used for the analysis described herein.
Identification of Recombination Points
Autosomal DNA recombination events were identified by comparing the grandchild’s DNA to one
grandparent’s DNA using the One-to-One tool at GEDmatch (www.gedmatch.com). Although
numerous submissions included both maternal grandparents, only one grandparent was used for
analysis. Since both grandparents were maternal, it was expected that the recombination profiles
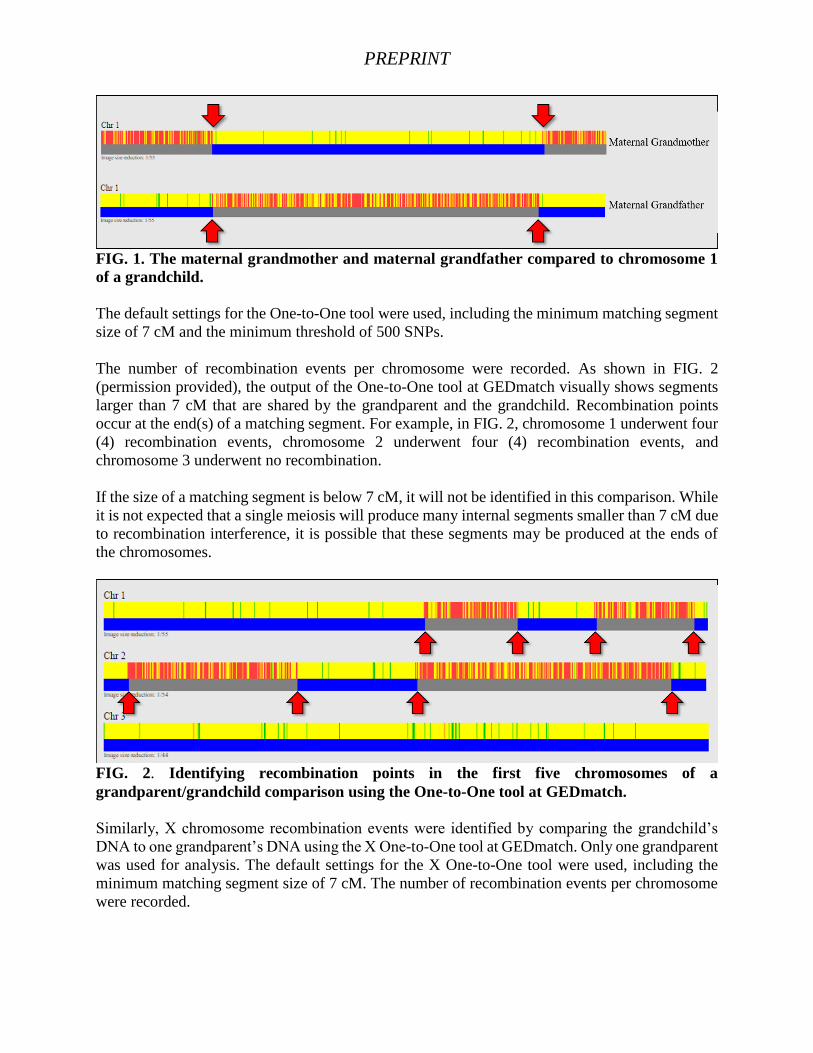
would be mirror images of each other. For example, as shown in FIG. 1 (permission provided), the
number of recombination events is the same whether using the maternal grandfather or the
maternal grandmother. Spot checking of several submissions confirmed this pattern.
PREPRINT
FIG. 1. The maternal grandmother and maternal grandfather compared to chromosome 1
of a grandchild.
The default settings for the One-to-One tool were used, including the minimum matching segment
size of 7 cM and the minimum threshold of 500 SNPs.
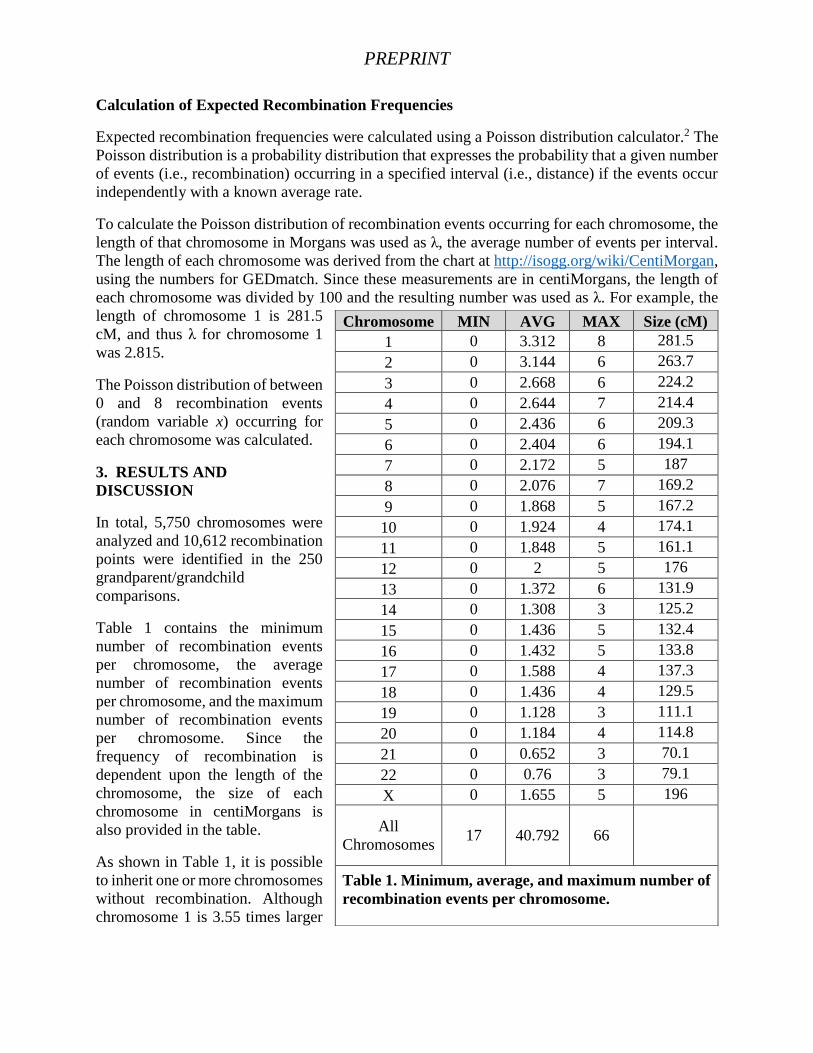
The number of recombination events per chromosome were recorded. As shown in FIG. 2
(permission provided), the output of the One-to-One tool at GEDmatch visually shows segments
larger than 7 cM that are shared by the grandparent and the grandchild. Recombination points
occur at the end(s) of a matching segment. For example, in FIG. 2, chromosome 1 underwent four
(4) recombination events, chromosome 2 underwent four (4) recombination events, and
chromosome 3 underwent no recombination.
If the size of a matching segment is below 7 cM, it will not be identified in this comparison. While
it is not expected that a single meiosis will produce many internal segments smaller than 7 cM due
to recombination interference, it is possible that these segments may be produced at the ends of
the chromosomes.
FIG. 2. Identifying recombination points in the first five chromosomes of a
grandparent/grandchild comparison using the One-to-One tool at GEDmatch.
Similarly, X chromosome recombination events were identified by comparing the grandchild’s
DNA to one grandparent’s DNA using the X One-to-One tool at GEDmatch. Only one grandparent
was used for analysis. The default settings for the X One-to-One tool were used, including the
minimum matching segment size of 7 cM. The number of recombination events per chromosome
were recorded.
PREPRINT
Calculation of Expected Recombination Frequencies
Expected recombination frequencies were calculated using a Poisson distribution calculator.2 The
Poisson distribution is a probability distribution that expresses the probability that a given number
of events (i.e., recombination) occurring in a specified interval (i.e., distance) if the events occur
independently with a known average rate.
To calculate the Poisson distribution of recombination events occurring for each chromosome, the
length of that chromosome in Morgans was used as λ, the average number of events per interval.
The length of each chromosome was derived from the chart at http://isogg.org/wiki/CentiMorgan,
using the numbers for GEDmatch. Since these measurements are in centiMorgans, the length of
each chromosome was divided by 100 and the resulting number was used as λ. For example, the
length of chromosome 1 is 281.5
cM, and thus λ for chromosome 1
was 2.815.
The Poisson distribution of between
0 and 8 recombination events
(random variable x) occurring for
each chromosome was calculated.
3. RESULTS AND
DISCUSSION
In total, 5,750 chromosomes were
analyzed and 10,612 recombination
points were identified in the 250
grandparent/grandchild
comparisons.
Table 1 contains the minimum
number of recombination events
per chromosome, the average
number of recombination events
per chromosome, and the maximum
number of recombination events
per chromosome. Since the
frequency of recombination is
dependent upon the length of the
chromosome, the size of each
chromosome in centiMorgans is
also provided in the table.
As shown in Table 1, it is possible
to inherit one or more chromosomes
without recombination. Although
chromosome 1 is 3.55 times larger
Chromosome MIN AVG MAX Size (cM)
1 0 3.312 8 281.5
2 0 3.144 6 263.7
3 0 2.668 6 224.2
4 0 2.644 7 214.4
5 0 2.436 6 209.3
6 0 2.404 6 194.1
7 0 2.172 5 187
8 0 2.076 7 169.2
9 0 1.868 5 167.2
10 0 1.924 4 174.1
11 0 1.848 5 161.1
12 0 2 5 176
13 0 1.372 6 131.9
14 0 1.308 3 125.2
15 0 1.436 5 132.4
16 0 1.432 5 133.8
17 0 1.588 4 137.3
18 0 1.436 4 129.5
19 0 1.128 3 111.1
20 0 1.184 4 114.8
21 0 0.652 3 70.1
22 0 0.76 3 79.1
X 0 1.655 5 196
All
Chromosomes 17 40.792 66
Table 1. Minimum, average, and maximum number of
recombination events per chromosome.
PREPRINT
than chromosome 22, for example, it is still possible to inherit chromosome 1 without it undergoing
recombination.
The maximum number of recombination events for all chromosomes was eight (8) for
chromosome 1, although this was rare. Out of the 250 analyses of chromosome 1, only one of them
experienced eight (8) recombination events.
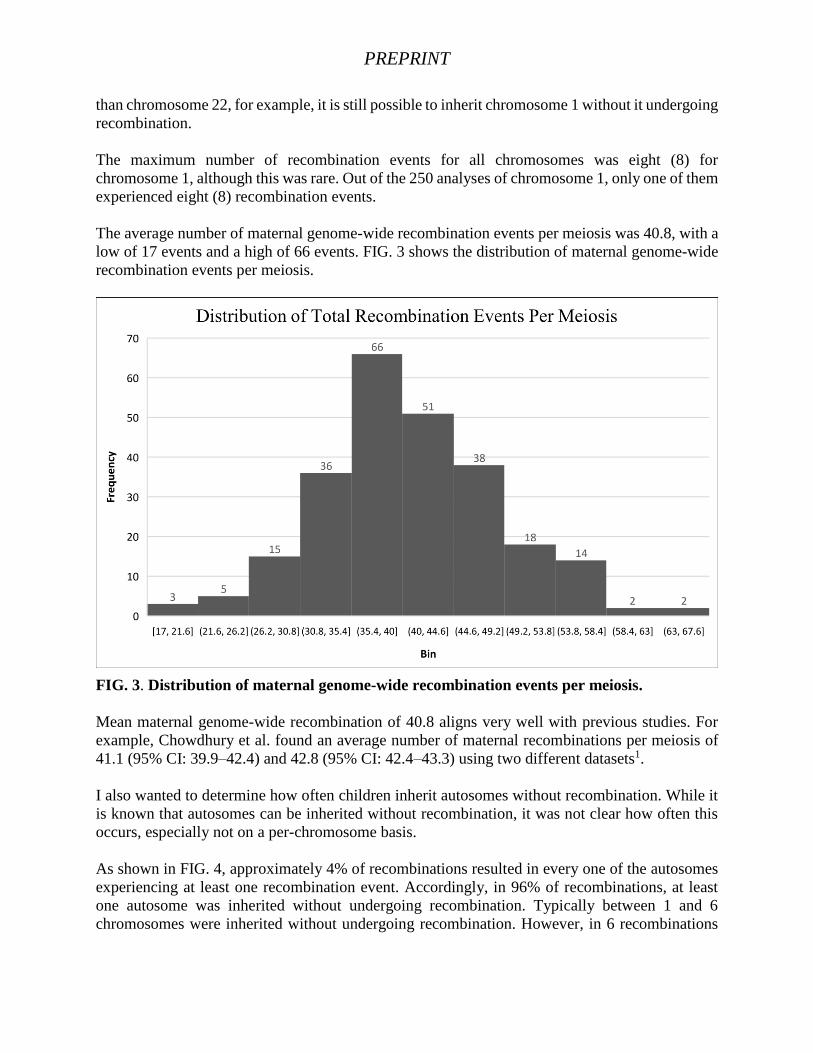
The average number of maternal genome-wide recombination events per meiosis was 40.8, with a
low of 17 events and a high of 66 events. FIG. 3 shows the distribution of maternal genome-wide
recombination events per meiosis.
FIG. 3. Distribution of maternal genome-wide recombination events per meiosis.
Mean maternal genome-wide recombination of 40.8 aligns very well with previous studies. For
example, Chowdhury et al. found an average number of maternal recombinations per meiosis of
41.1 (95% CI: 39.9–42.4) and 42.8 (95% CI: 42.4–43.3) using two different datasets1.
I also wanted to determine how often children inherit autosomes without recombination. While it
is known that autosomes can be inherited without recombination, it was not clear how often this
occurs, especially not on a per-chromosome basis.
As shown in FIG. 4, approximately 4% of recombinations resulted in every one of the autosomes
experiencing at least one recombination event. Accordingly, in 96% of recombinations, at least
one autosome was inherited without undergoing recombination. Typically between 1 and 6
chromosomes were inherited without undergoing recombination. However, in 6 recombinations
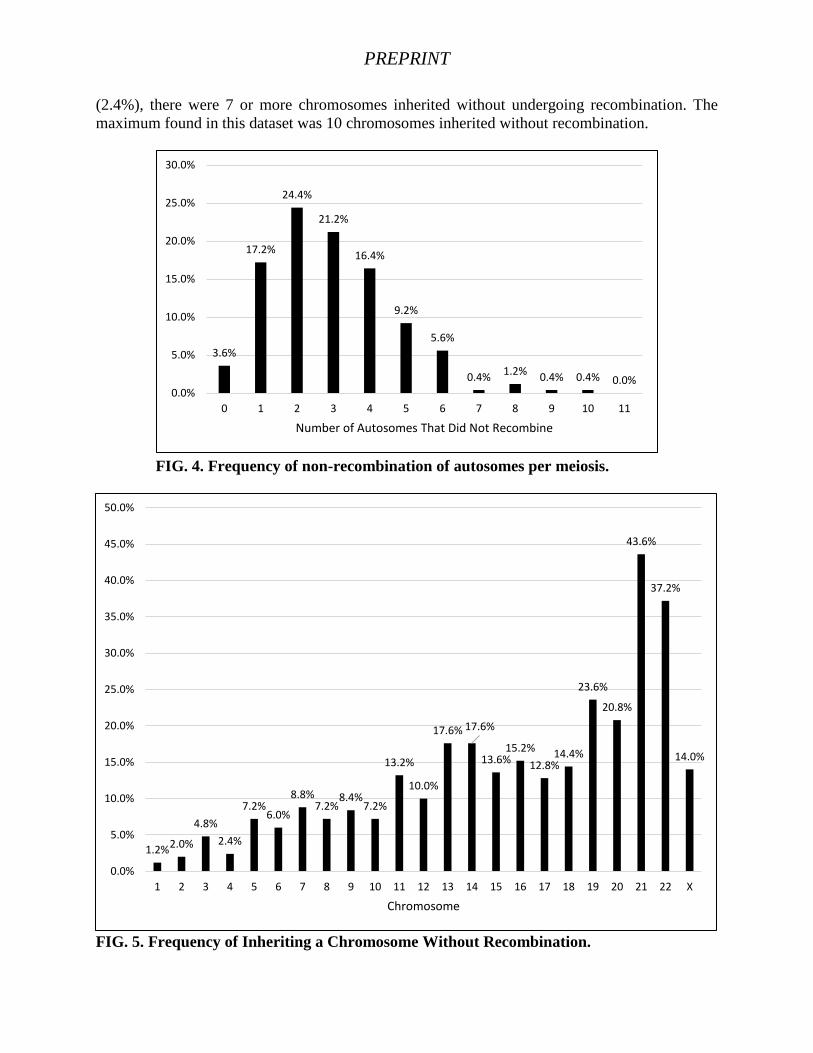
PREPRINT
(2.4%), there were 7 or more chromosomes inherited without undergoing recombination. The
maximum found in this dataset was 10 chromosomes inherited without recombination.
FIG. 4. Frequency of non-recombination of autosomes per meiosis.
FIG. 5. Frequency of Inheriting a Chromosome Without Recombination.
3.6%
17.2%
24.4%
21.2%
16.4%
9.2%
5.6%
0.4%1.2%
0.4% 0.4% 0.0%0.0%
5.0%
10.0%
15.0%
20.0%
25.0%
30.0%
0 1 2 3 4 5 6 7 8 9 10 11
Number of Autosomes That Did Not Recombine
1.2%2.0%
4.8%
2.4%
7.2%6.0%
8.8%7.2%
8.4%7.2%
13.2%
10.0%
17.6% 17.6%
13.6%15.2%
12.8%14.4%
23.6%
20.8%
43.6%
37.2%
14.0%
0.0%
5.0%
10.0%
15.0%
20.0%
25.0%
30.0%
35.0%
40.0%
45.0%
50.0%
1 2 3 4 5 6 7 8 9 10 11 12 13 14 15 16 17 18 19 20 21 22 X
Chromosome
PREPRINT
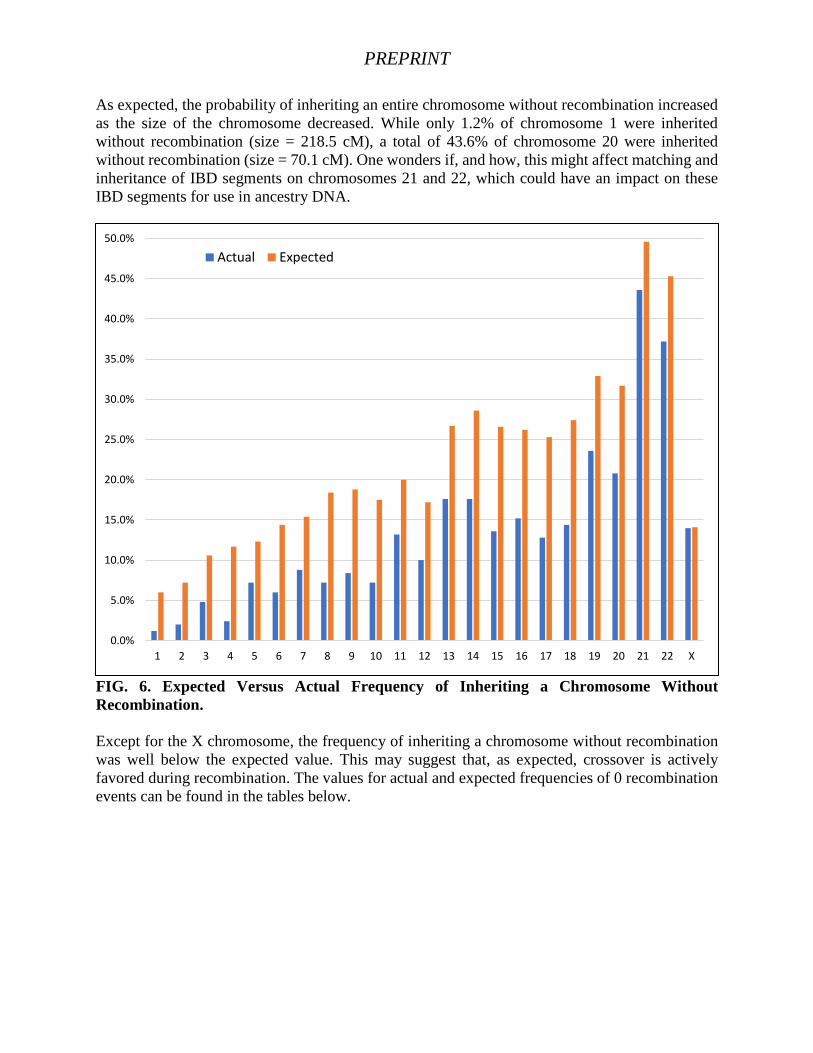
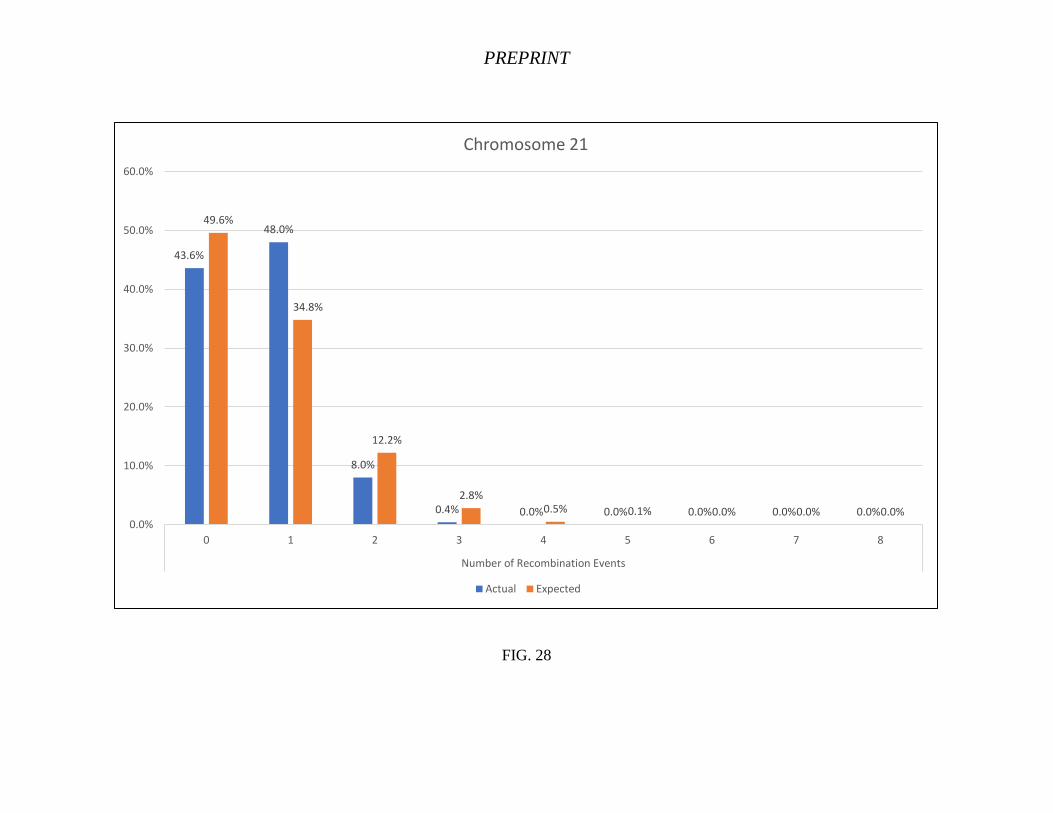
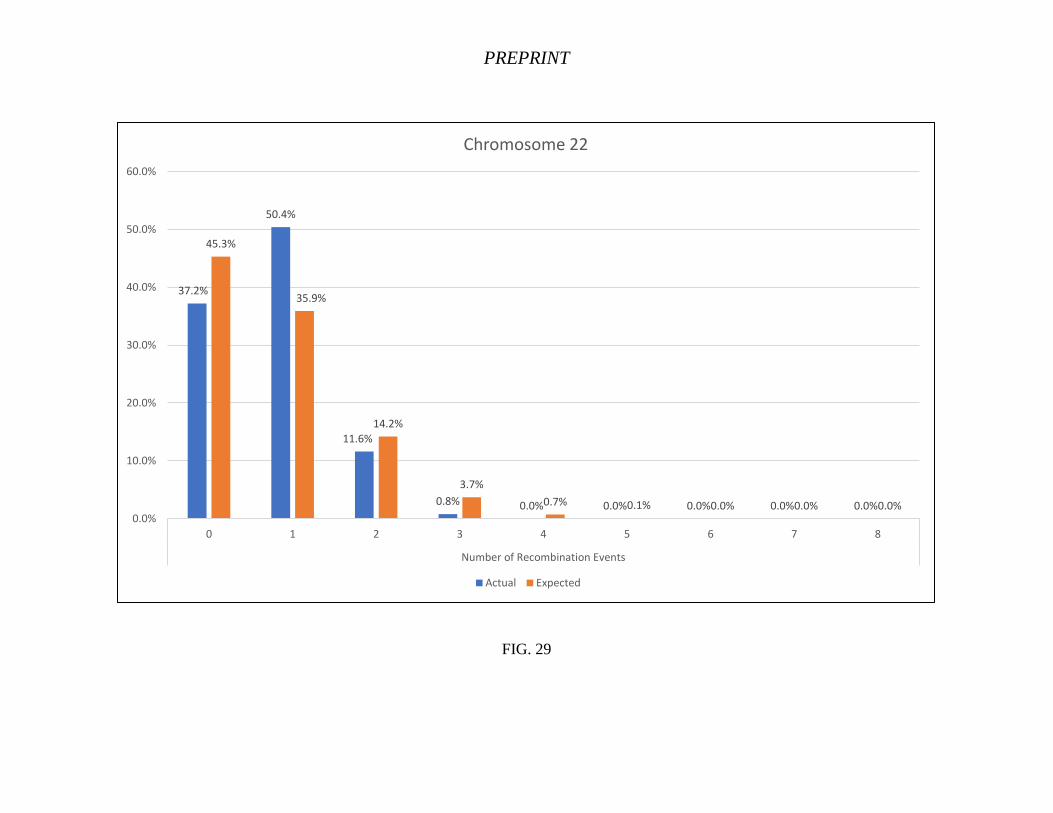
As expected, the probability of inheriting an entire chromosome without recombination increased
as the size of the chromosome decreased. While only 1.2% of chromosome 1 were inherited
without recombination (size = 218.5 cM), a total of 43.6% of chromosome 20 were inherited
without recombination (size = 70.1 cM). One wonders if, and how, this might affect matching and
inheritance of IBD segments on chromosomes 21 and 22, which could have an impact on these
IBD segments for use in ancestry DNA.
FIG. 6. Expected Versus Actual Frequency of Inheriting a Chromosome Without
Recombination.
Except for the X chromosome, the frequency of inheriting a chromosome without recombination
was well below the expected value. This may suggest that, as expected, crossover is actively
favored during recombination. The values for actual and expected frequencies of 0 recombination
events can be found in the tables below.
0.0%
5.0%
10.0%
15.0%
20.0%
25.0%
30.0%
35.0%
40.0%
45.0%
50.0%
1 2 3 4 5 6 7 8 9 10 11 12 13 14 15 16 17 18 19 20 21 22 X
Actual Expected
PREPRINT
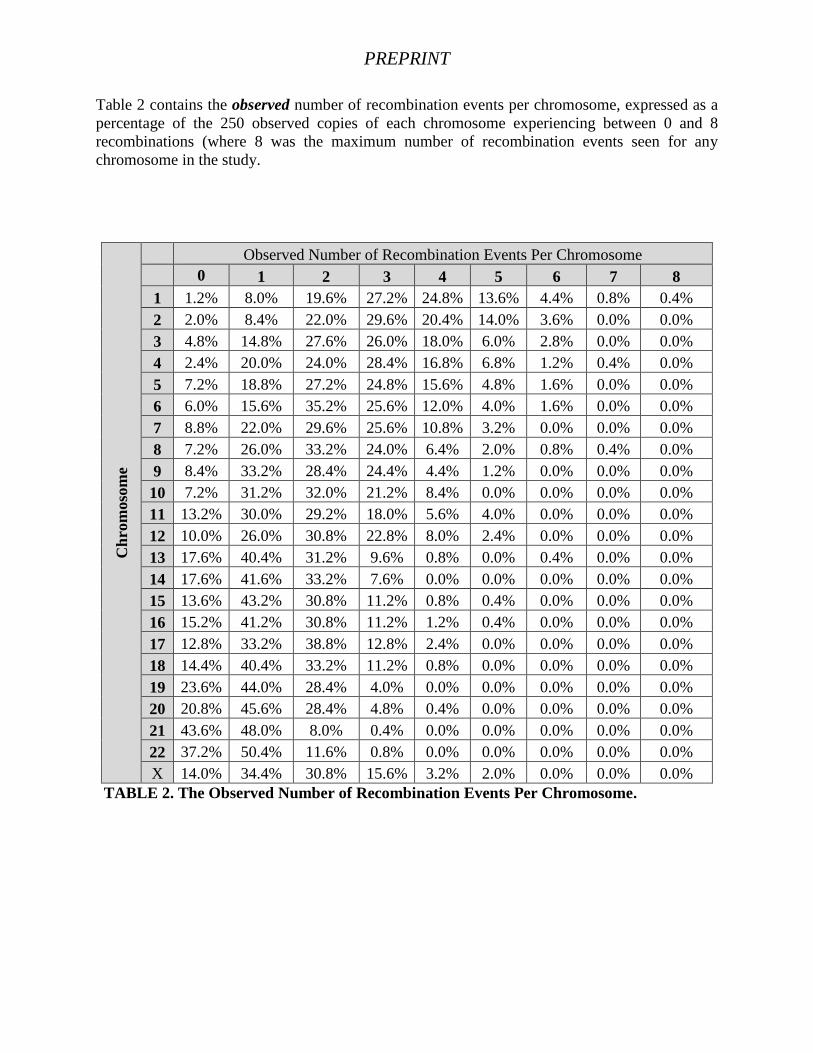
Table 2 contains the observed number of recombination events per chromosome, expressed as a
percentage of the 250 observed copies of each chromosome experiencing between 0 and 8
recombinations (where 8 was the maximum number of recombination events seen for any
chromosome in the study.
Ch
rom
oso
me
Observed Number of Recombination Events Per Chromosome
0 1 2 3 4 5 6 7 8
1 1.2% 8.0% 19.6% 27.2% 24.8% 13.6% 4.4% 0.8% 0.4%
2 2.0% 8.4% 22.0% 29.6% 20.4% 14.0% 3.6% 0.0% 0.0%
3 4.8% 14.8% 27.6% 26.0% 18.0% 6.0% 2.8% 0.0% 0.0%
4 2.4% 20.0% 24.0% 28.4% 16.8% 6.8% 1.2% 0.4% 0.0%
5 7.2% 18.8% 27.2% 24.8% 15.6% 4.8% 1.6% 0.0% 0.0%
6 6.0% 15.6% 35.2% 25.6% 12.0% 4.0% 1.6% 0.0% 0.0%
7 8.8% 22.0% 29.6% 25.6% 10.8% 3.2% 0.0% 0.0% 0.0%
8 7.2% 26.0% 33.2% 24.0% 6.4% 2.0% 0.8% 0.4% 0.0%
9 8.4% 33.2% 28.4% 24.4% 4.4% 1.2% 0.0% 0.0% 0.0%
10 7.2% 31.2% 32.0% 21.2% 8.4% 0.0% 0.0% 0.0% 0.0%
11 13.2% 30.0% 29.2% 18.0% 5.6% 4.0% 0.0% 0.0% 0.0%
12 10.0% 26.0% 30.8% 22.8% 8.0% 2.4% 0.0% 0.0% 0.0%
13 17.6% 40.4% 31.2% 9.6% 0.8% 0.0% 0.4% 0.0% 0.0%
14 17.6% 41.6% 33.2% 7.6% 0.0% 0.0% 0.0% 0.0% 0.0%
15 13.6% 43.2% 30.8% 11.2% 0.8% 0.4% 0.0% 0.0% 0.0%
16 15.2% 41.2% 30.8% 11.2% 1.2% 0.4% 0.0% 0.0% 0.0%
17 12.8% 33.2% 38.8% 12.8% 2.4% 0.0% 0.0% 0.0% 0.0%
18 14.4% 40.4% 33.2% 11.2% 0.8% 0.0% 0.0% 0.0% 0.0%
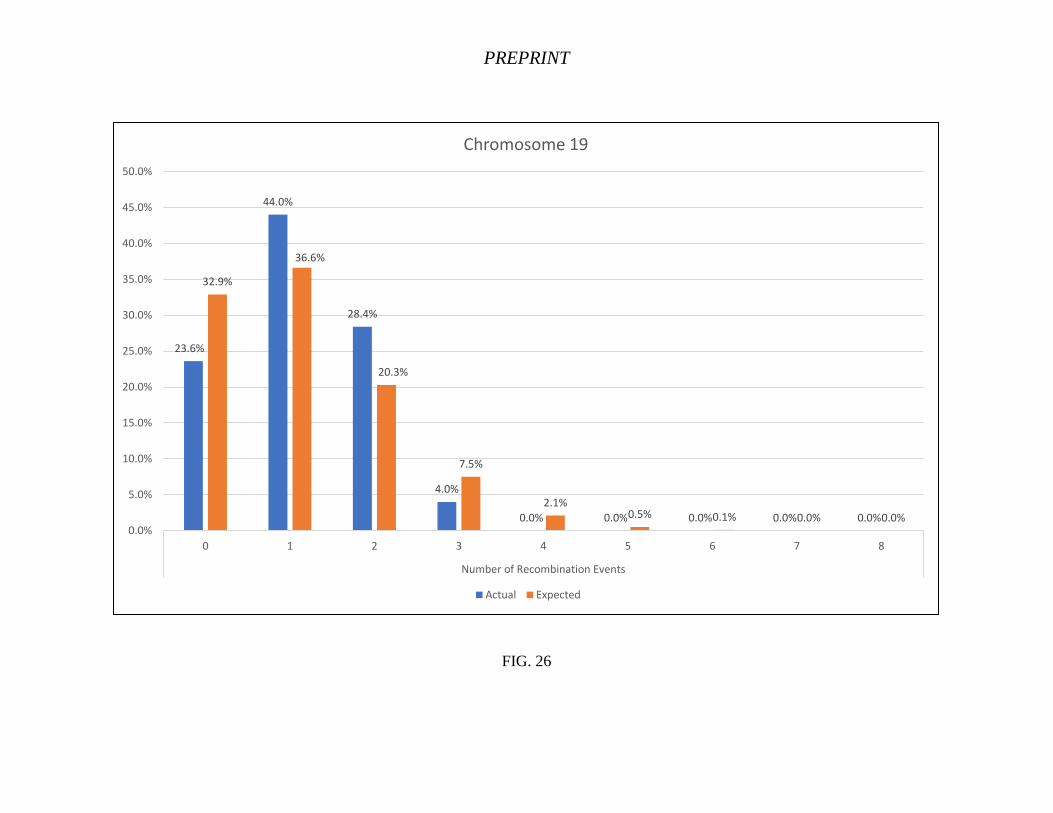
19 23.6% 44.0% 28.4% 4.0% 0.0% 0.0% 0.0% 0.0% 0.0%
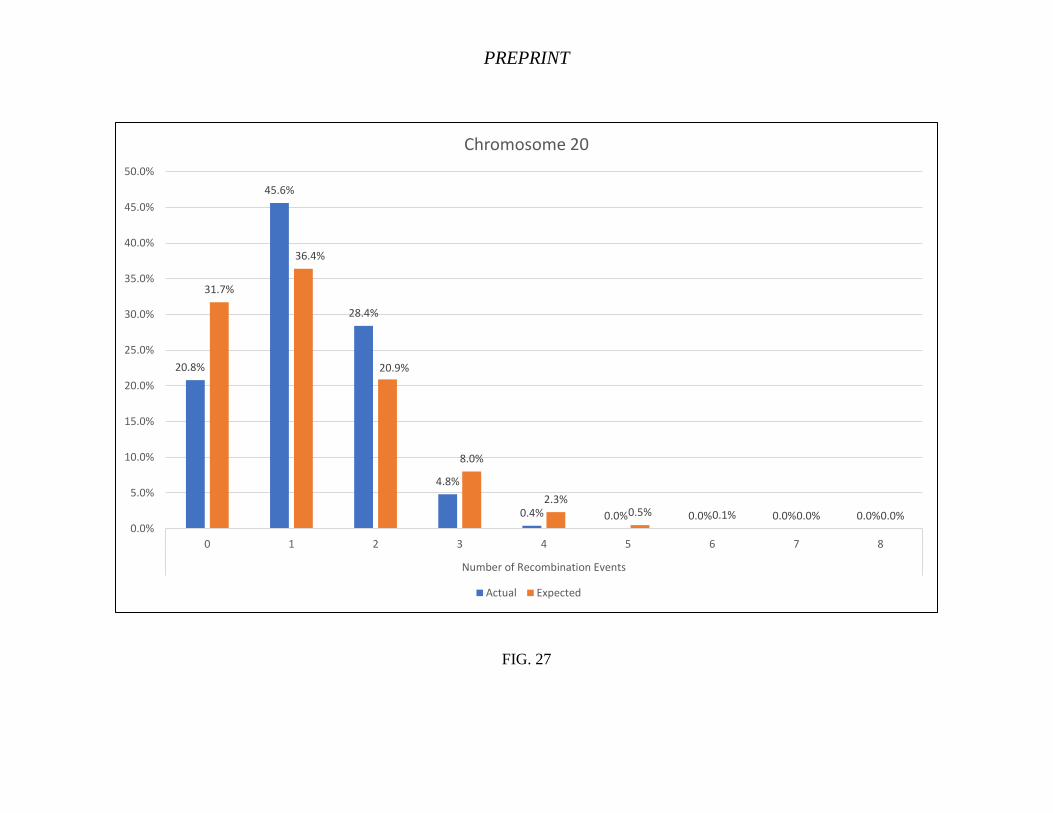
20 20.8% 45.6% 28.4% 4.8% 0.4% 0.0% 0.0% 0.0% 0.0%
21 43.6% 48.0% 8.0% 0.4% 0.0% 0.0% 0.0% 0.0% 0.0%
22 37.2% 50.4% 11.6% 0.8% 0.0% 0.0% 0.0% 0.0% 0.0%
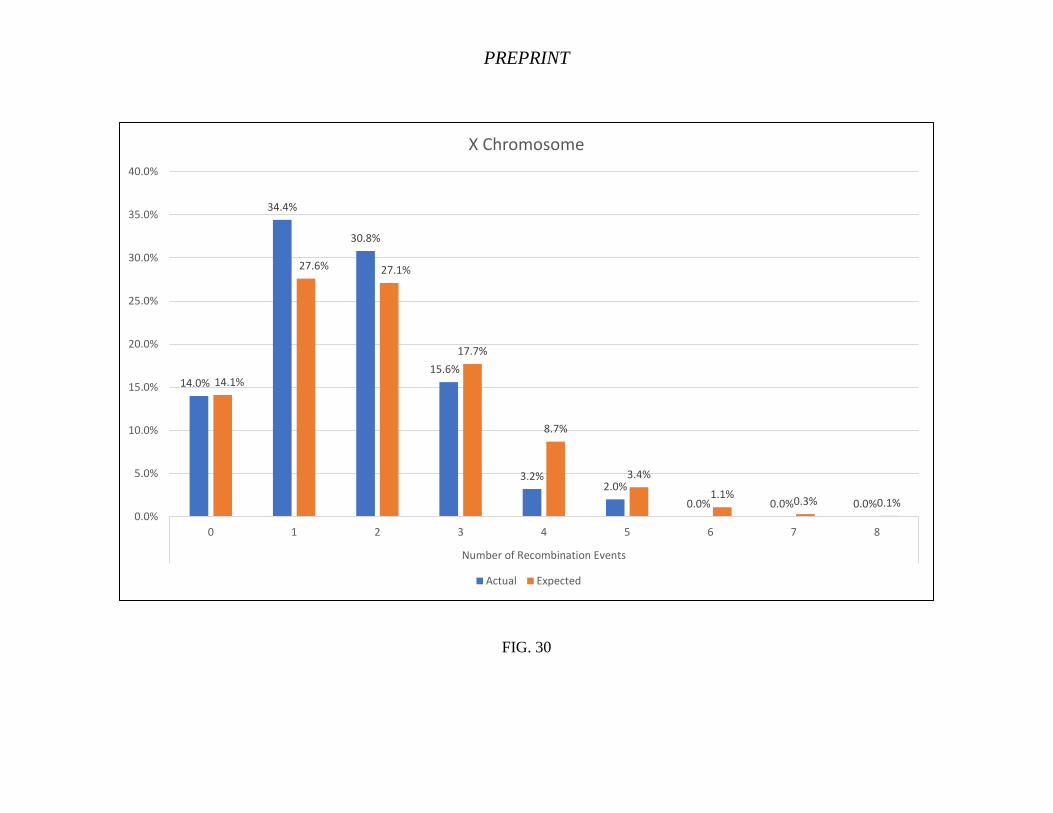
X 14.0% 34.4% 30.8% 15.6% 3.2% 2.0% 0.0% 0.0% 0.0%
TABLE 2. The Observed Number of Recombination Events Per Chromosome.
PREPRINT
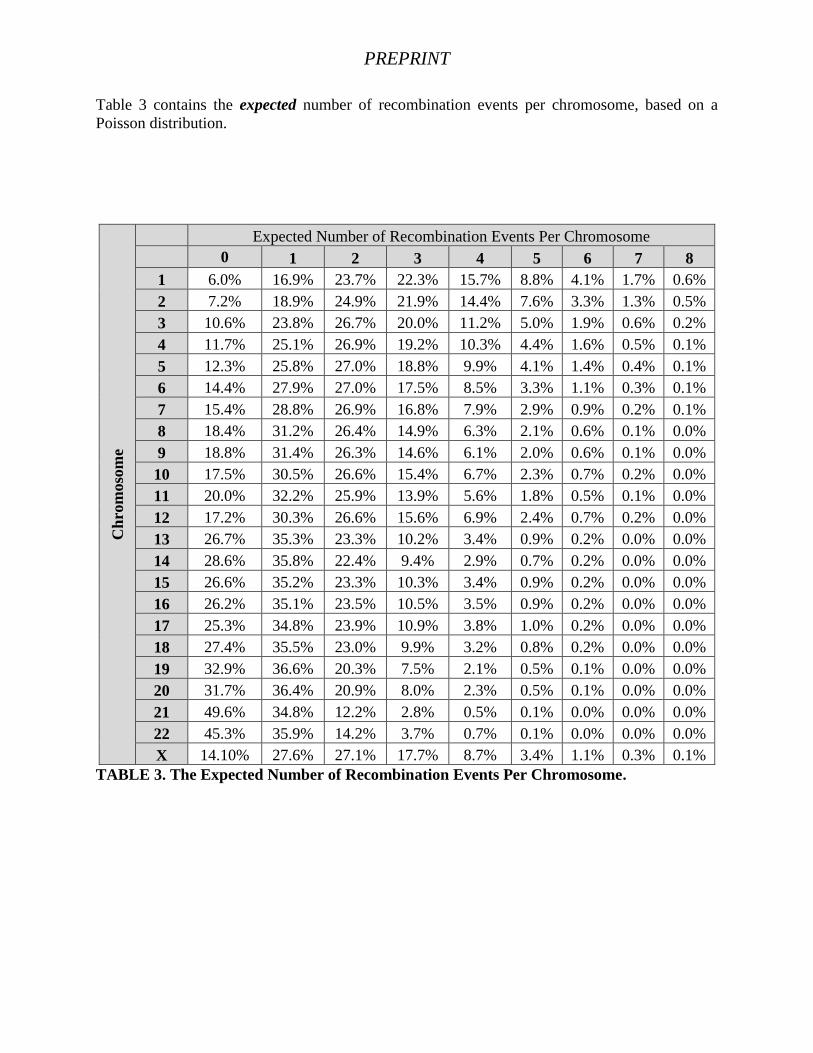
Table 3 contains the expected number of recombination events per chromosome, based on a
Poisson distribution.
Ch
rom
oso
me
Expected Number of Recombination Events Per Chromosome
0 1 2 3 4 5 6 7 8
1 6.0% 16.9% 23.7% 22.3% 15.7% 8.8% 4.1% 1.7% 0.6%
2 7.2% 18.9% 24.9% 21.9% 14.4% 7.6% 3.3% 1.3% 0.5%
3 10.6% 23.8% 26.7% 20.0% 11.2% 5.0% 1.9% 0.6% 0.2%
4 11.7% 25.1% 26.9% 19.2% 10.3% 4.4% 1.6% 0.5% 0.1%
5 12.3% 25.8% 27.0% 18.8% 9.9% 4.1% 1.4% 0.4% 0.1%
6 14.4% 27.9% 27.0% 17.5% 8.5% 3.3% 1.1% 0.3% 0.1%
7 15.4% 28.8% 26.9% 16.8% 7.9% 2.9% 0.9% 0.2% 0.1%
8 18.4% 31.2% 26.4% 14.9% 6.3% 2.1% 0.6% 0.1% 0.0%
9 18.8% 31.4% 26.3% 14.6% 6.1% 2.0% 0.6% 0.1% 0.0%
10 17.5% 30.5% 26.6% 15.4% 6.7% 2.3% 0.7% 0.2% 0.0%
11 20.0% 32.2% 25.9% 13.9% 5.6% 1.8% 0.5% 0.1% 0.0%
12 17.2% 30.3% 26.6% 15.6% 6.9% 2.4% 0.7% 0.2% 0.0%
13 26.7% 35.3% 23.3% 10.2% 3.4% 0.9% 0.2% 0.0% 0.0%
14 28.6% 35.8% 22.4% 9.4% 2.9% 0.7% 0.2% 0.0% 0.0%
15 26.6% 35.2% 23.3% 10.3% 3.4% 0.9% 0.2% 0.0% 0.0%
16 26.2% 35.1% 23.5% 10.5% 3.5% 0.9% 0.2% 0.0% 0.0%
17 25.3% 34.8% 23.9% 10.9% 3.8% 1.0% 0.2% 0.0% 0.0%
18 27.4% 35.5% 23.0% 9.9% 3.2% 0.8% 0.2% 0.0% 0.0%
19 32.9% 36.6% 20.3% 7.5% 2.1% 0.5% 0.1% 0.0% 0.0%
20 31.7% 36.4% 20.9% 8.0% 2.3% 0.5% 0.1% 0.0% 0.0%
21 49.6% 34.8% 12.2% 2.8% 0.5% 0.1% 0.0% 0.0% 0.0%
22 45.3% 35.9% 14.2% 3.7% 0.7% 0.1% 0.0% 0.0% 0.0%
X 14.10% 27.6% 27.1% 17.7% 8.7% 3.4% 1.1% 0.3% 0.1%
TABLE 3. The Expected Number of Recombination Events Per Chromosome.
PREPRINT
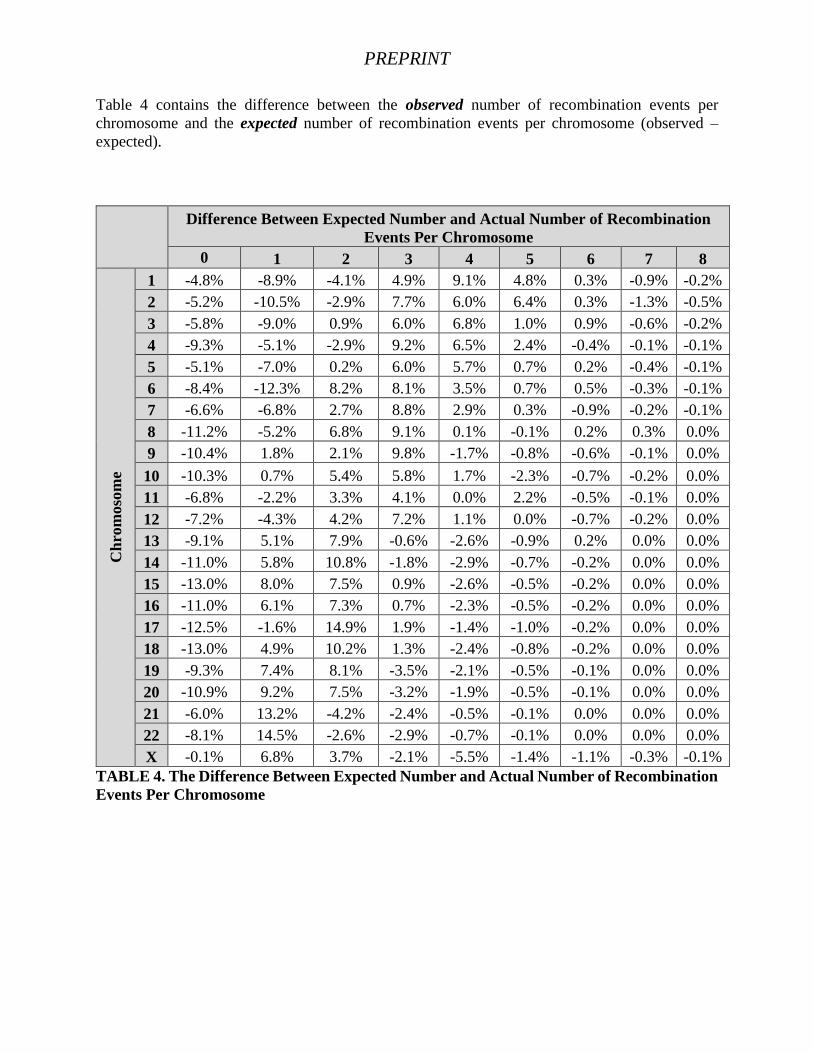
Table 4 contains the difference between the observed number of recombination events per
chromosome and the expected number of recombination events per chromosome (observed –
expected).
Difference Between Expected Number and Actual Number of Recombination
Events Per Chromosome
0 1 2 3 4 5 6 7 8
Ch
rom
oso
me
1 -4.8% -8.9% -4.1% 4.9% 9.1% 4.8% 0.3% -0.9% -0.2%
2 -5.2% -10.5% -2.9% 7.7% 6.0% 6.4% 0.3% -1.3% -0.5%
3 -5.8% -9.0% 0.9% 6.0% 6.8% 1.0% 0.9% -0.6% -0.2%
4 -9.3% -5.1% -2.9% 9.2% 6.5% 2.4% -0.4% -0.1% -0.1%
5 -5.1% -7.0% 0.2% 6.0% 5.7% 0.7% 0.2% -0.4% -0.1%
6 -8.4% -12.3% 8.2% 8.1% 3.5% 0.7% 0.5% -0.3% -0.1%
7 -6.6% -6.8% 2.7% 8.8% 2.9% 0.3% -0.9% -0.2% -0.1%
8 -11.2% -5.2% 6.8% 9.1% 0.1% -0.1% 0.2% 0.3% 0.0%
9 -10.4% 1.8% 2.1% 9.8% -1.7% -0.8% -0.6% -0.1% 0.0%
10 -10.3% 0.7% 5.4% 5.8% 1.7% -2.3% -0.7% -0.2% 0.0%
11 -6.8% -2.2% 3.3% 4.1% 0.0% 2.2% -0.5% -0.1% 0.0%
12 -7.2% -4.3% 4.2% 7.2% 1.1% 0.0% -0.7% -0.2% 0.0%
13 -9.1% 5.1% 7.9% -0.6% -2.6% -0.9% 0.2% 0.0% 0.0%
14 -11.0% 5.8% 10.8% -1.8% -2.9% -0.7% -0.2% 0.0% 0.0%
15 -13.0% 8.0% 7.5% 0.9% -2.6% -0.5% -0.2% 0.0% 0.0%
16 -11.0% 6.1% 7.3% 0.7% -2.3% -0.5% -0.2% 0.0% 0.0%
17 -12.5% -1.6% 14.9% 1.9% -1.4% -1.0% -0.2% 0.0% 0.0%
18 -13.0% 4.9% 10.2% 1.3% -2.4% -0.8% -0.2% 0.0% 0.0%
19 -9.3% 7.4% 8.1% -3.5% -2.1% -0.5% -0.1% 0.0% 0.0%
20 -10.9% 9.2% 7.5% -3.2% -1.9% -0.5% -0.1% 0.0% 0.0%
21 -6.0% 13.2% -4.2% -2.4% -0.5% -0.1% 0.0% 0.0% 0.0%
22 -8.1% 14.5% -2.6% -2.9% -0.7% -0.1% 0.0% 0.0% 0.0%
X -0.1% 6.8% 3.7% -2.1% -5.5% -1.4% -1.1% -0.3% -0.1%
TABLE 4. The Difference Between Expected Number and Actual Number of Recombination
Events Per Chromosome
PREPRINT
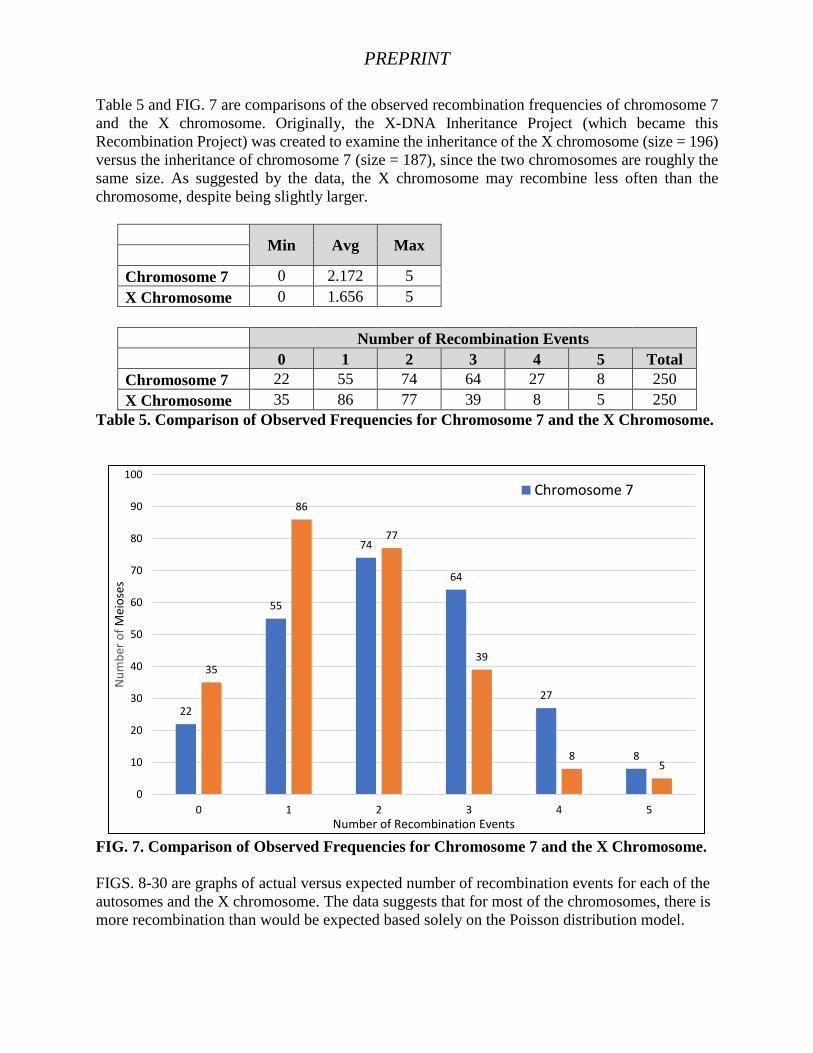
Table 5 and FIG. 7 are comparisons of the observed recombination frequencies of chromosome 7
and the X chromosome. Originally, the X-DNA Inheritance Project (which became this
Recombination Project) was created to examine the inheritance of the X chromosome (size = 196)
versus the inheritance of chromosome 7 (size = 187), since the two chromosomes are roughly the
same size. As suggested by the data, the X chromosome may recombine less often than the
chromosome, despite being slightly larger.
Min Avg Max
Chromosome 7 0 2.172 5 X Chromosome 0 1.656 5
Number of Recombination Events
0 1 2 3 4 5 Total
Chromosome 7 22 55 74 64 27 8 250
X Chromosome 35 86 77 39 8 5 250
Table 5. Comparison of Observed Frequencies for Chromosome 7 and the X Chromosome.
FIG. 7. Comparison of Observed Frequencies for Chromosome 7 and the X Chromosome.
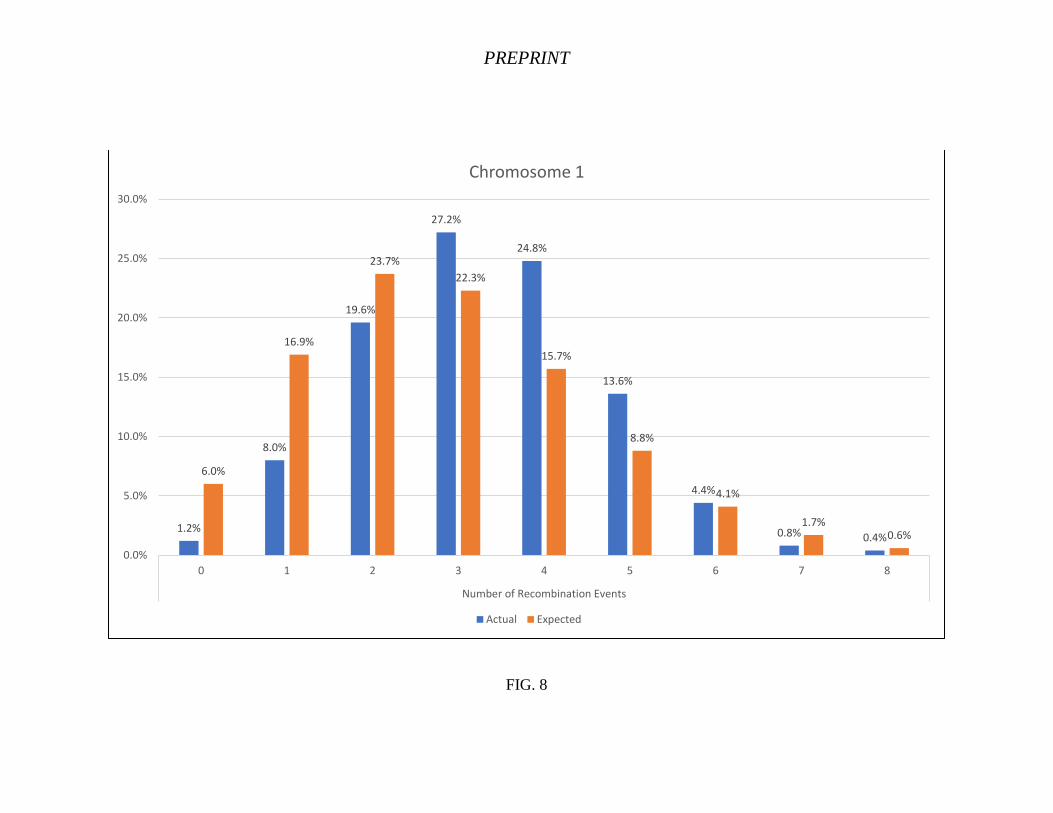
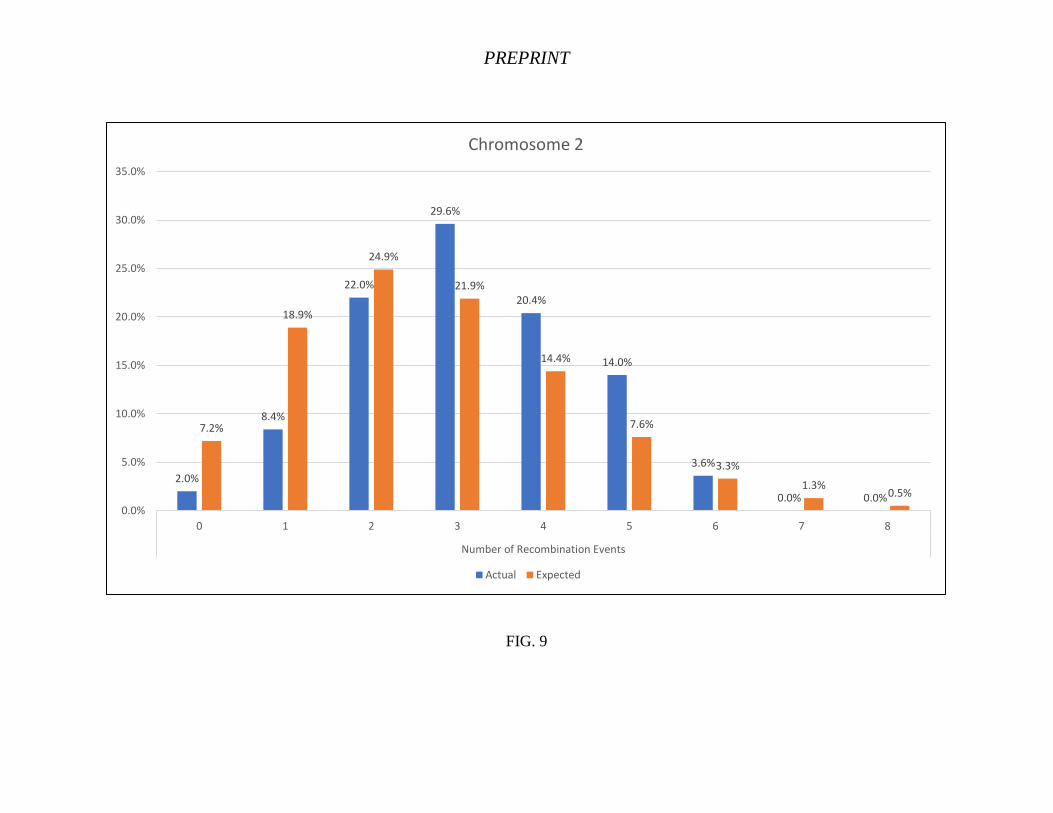
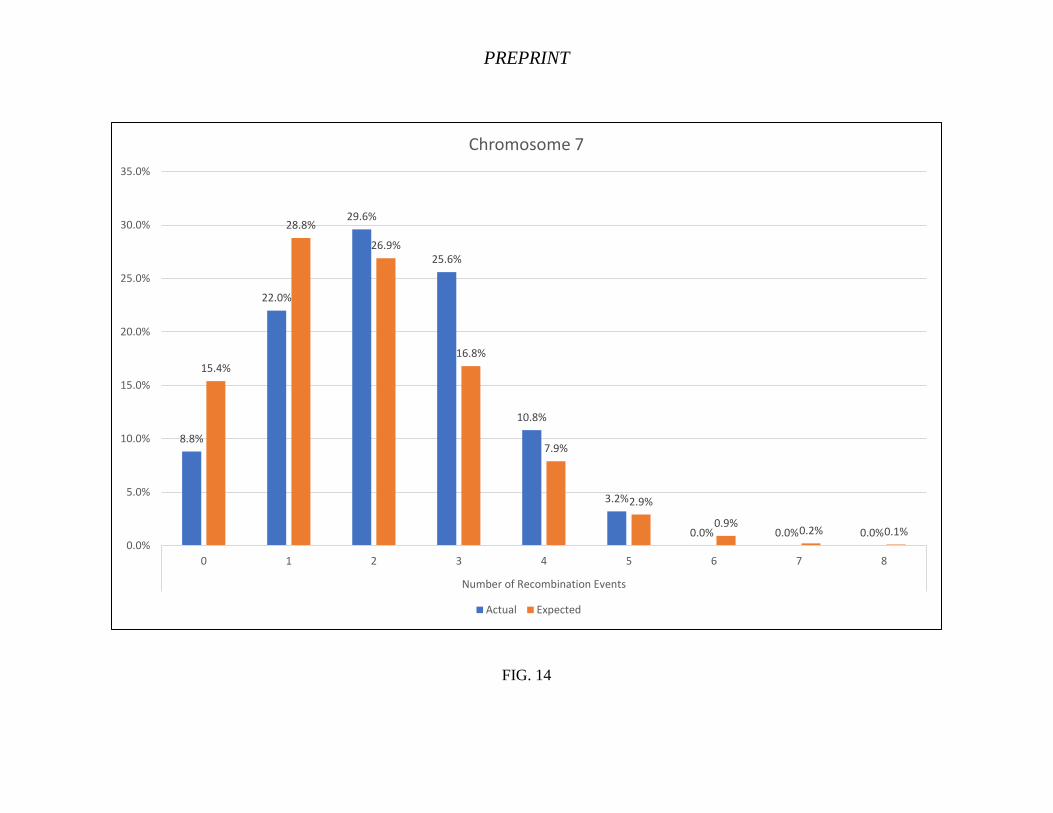
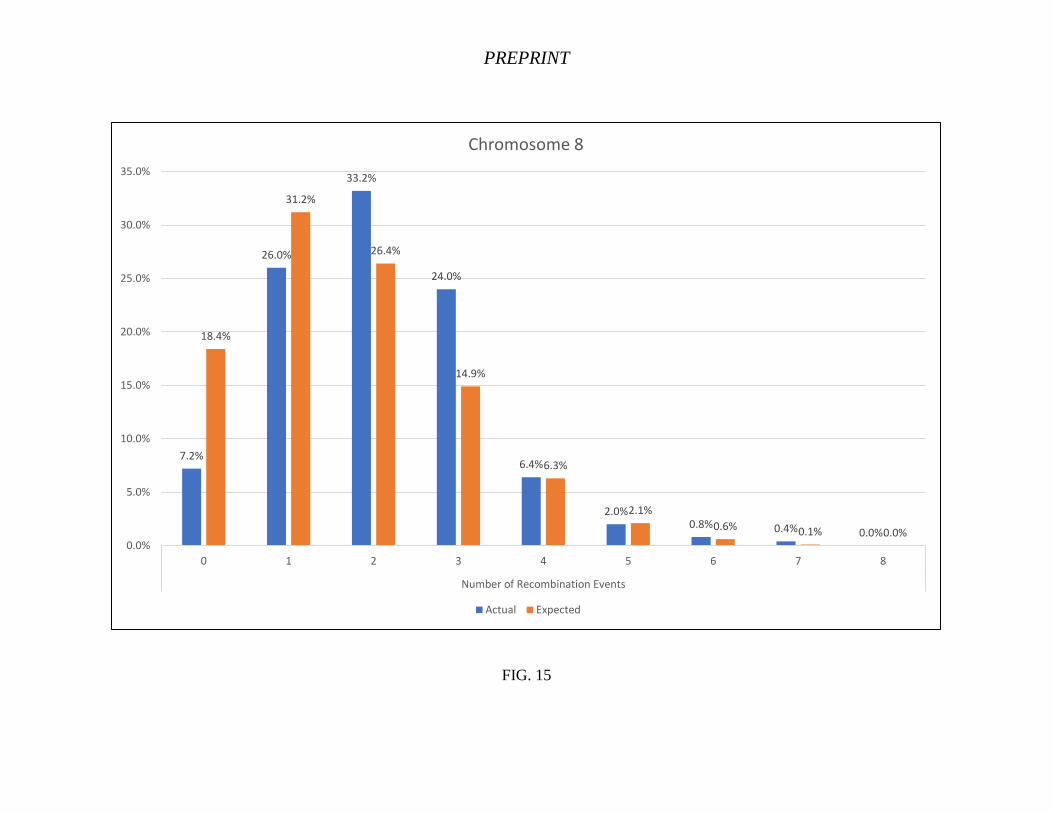
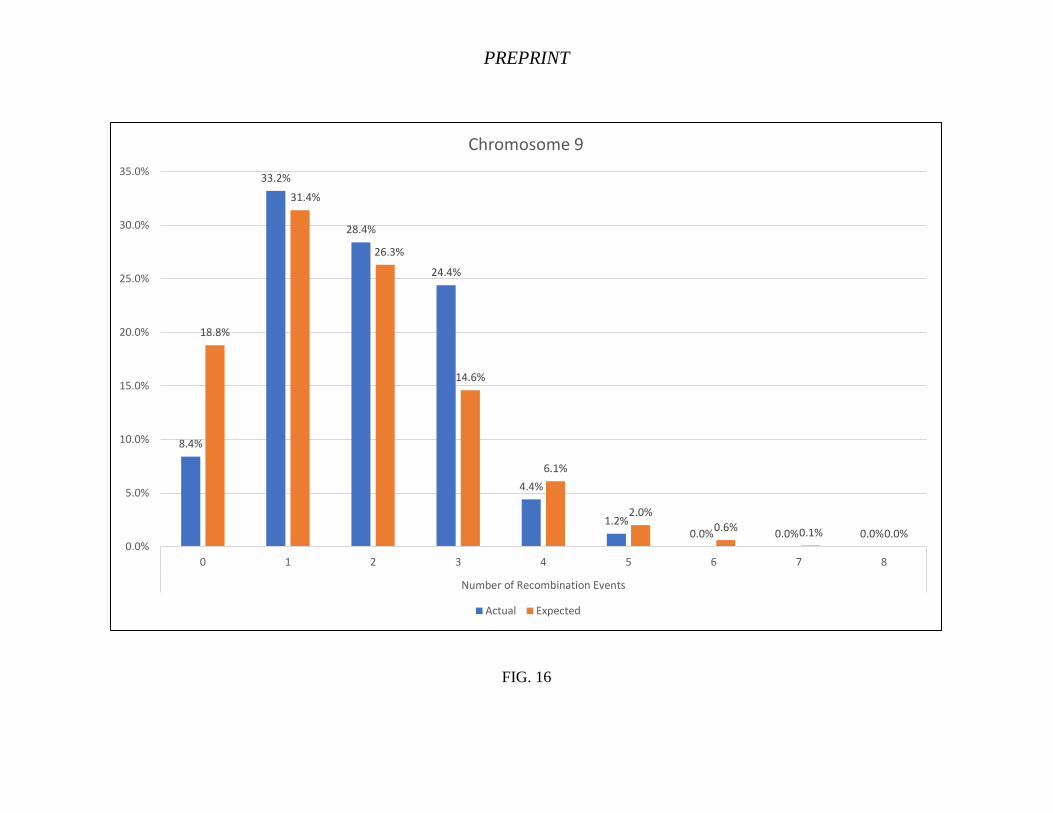
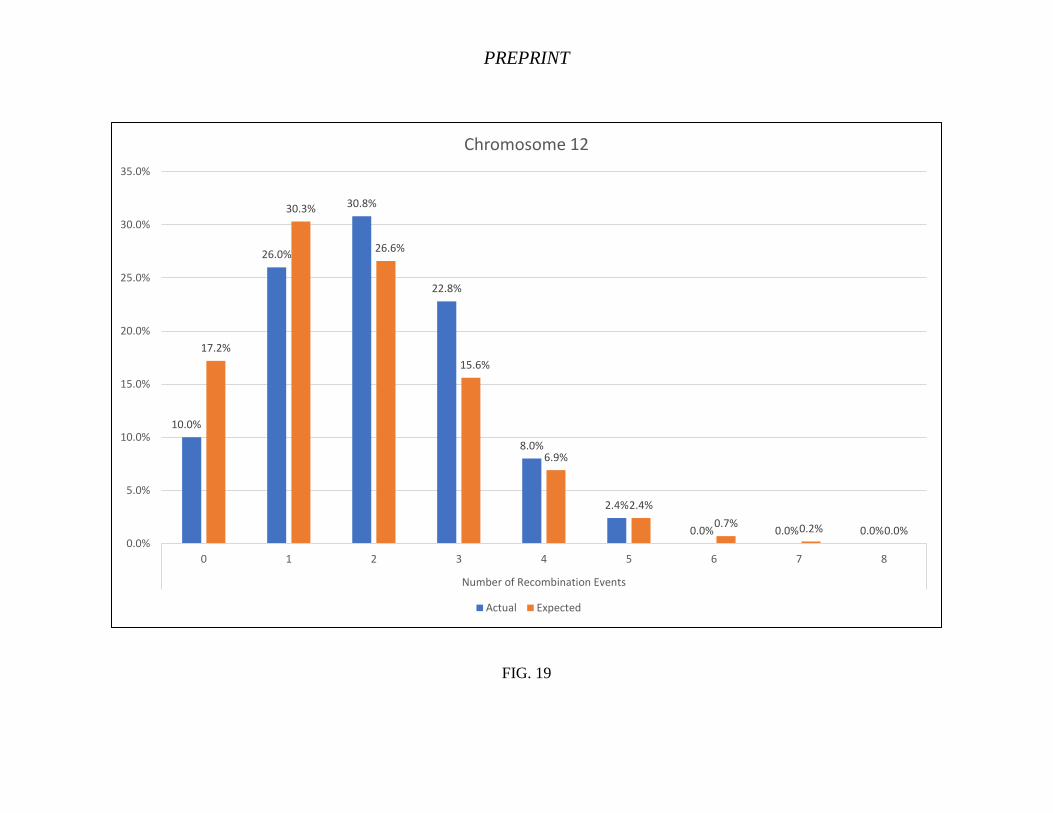
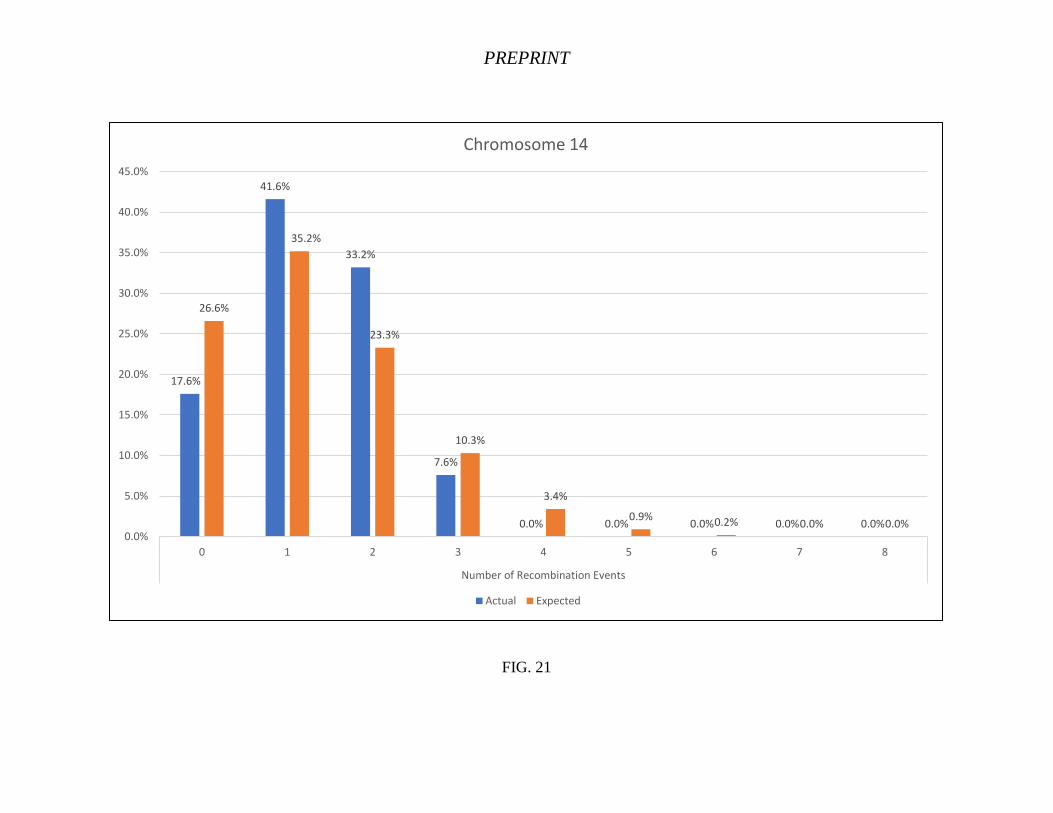
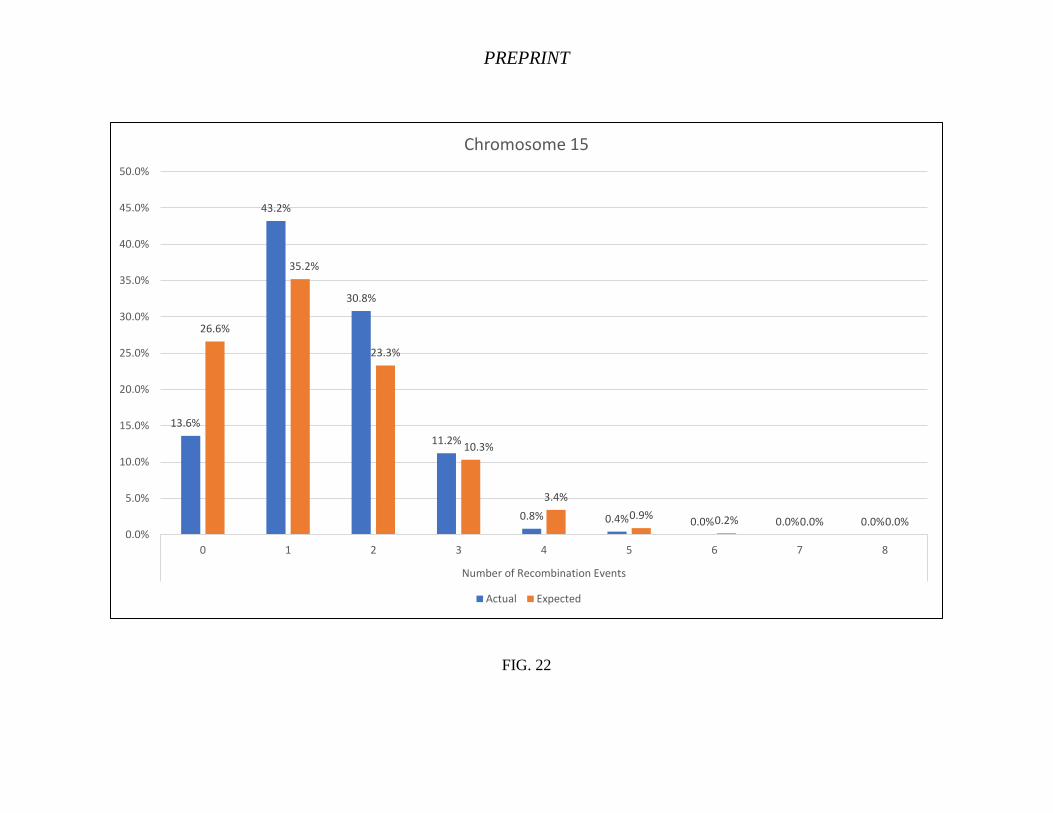
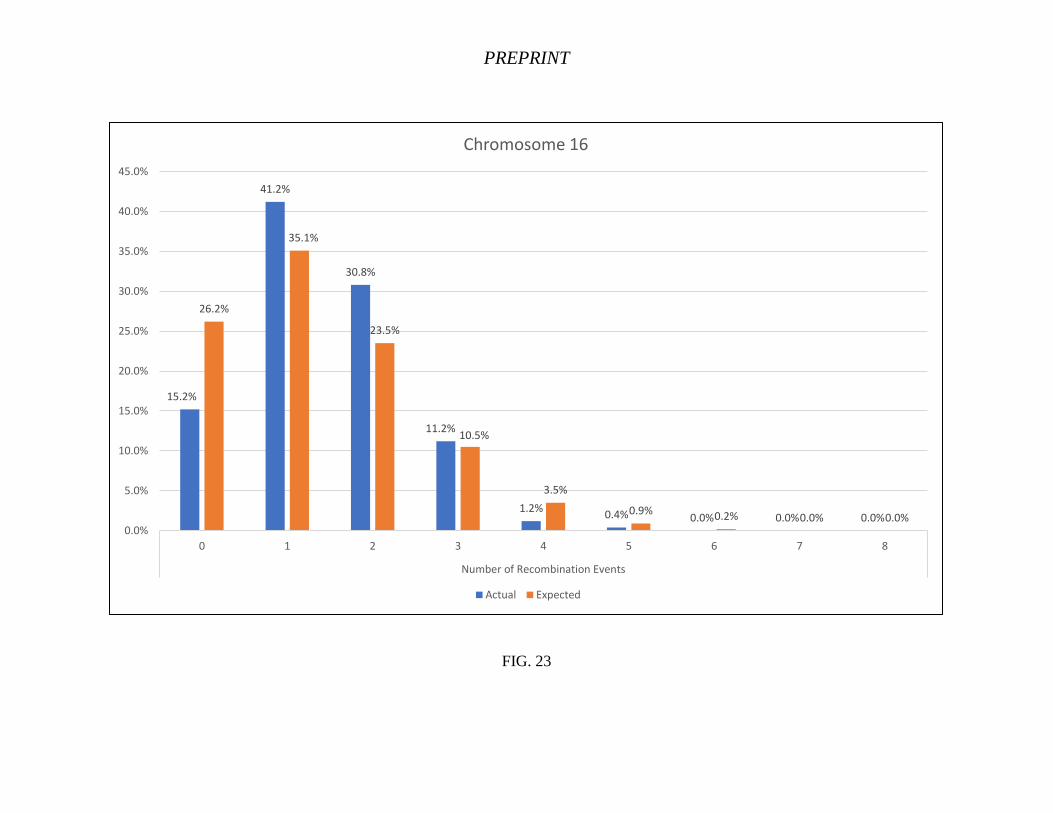
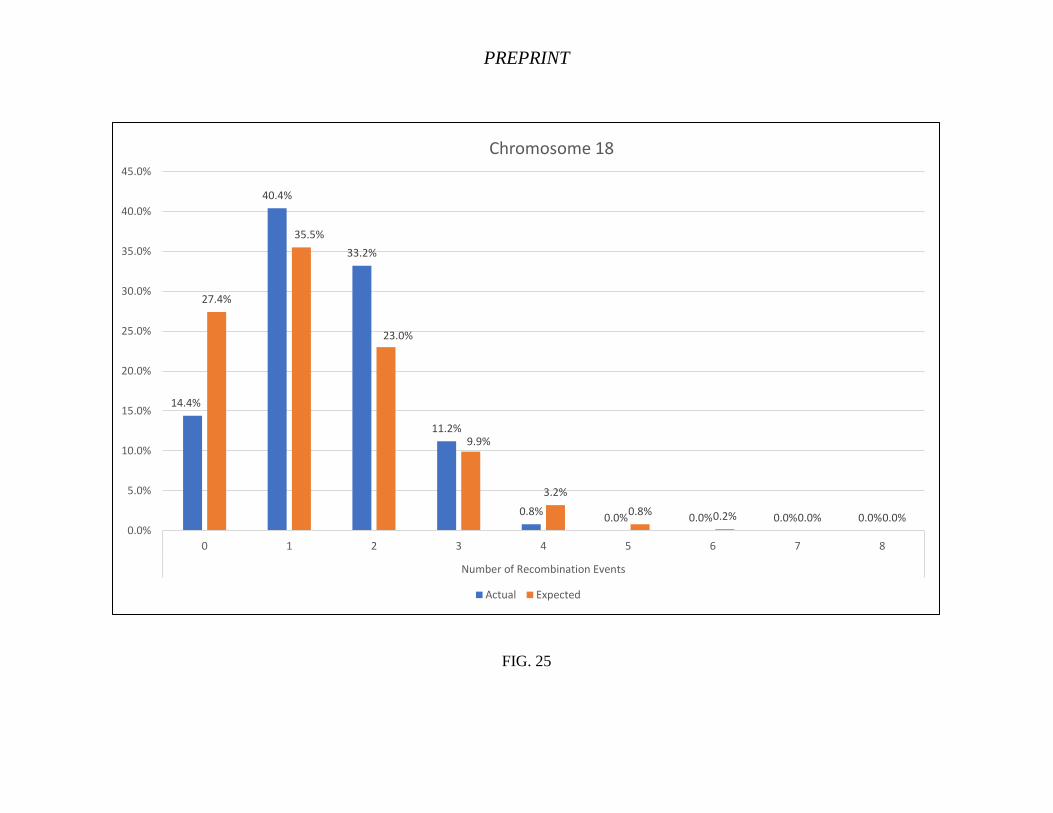
FIGS. 8-30 are graphs of actual versus expected number of recombination events for each of the
autosomes and the X chromosome. The data suggests that for most of the chromosomes, there is
more recombination than would be expected based solely on the Poisson distribution model.
22
55
74
64
27
8
35
86
77
39
85
0
10
20
30
40
50
60
70
80
90
100
0 1 2 3 4 5
Nu
mb
er o
f M
eio
ses
Number of Recombination Events
Chromosome 7
PREPRINT
ACKNOWLEDGEMENTS
I would like to thank Andrew Millard and Ann Turner for their suggestion and instructions in the
ISOGG Facebook group (https://www.facebook.com/groups/isogg) to include the expected
recombination distributions for the chromosomes.
I would also like to thank Curtis Rogers and John Olson, the founders of GEDmatch. Without
GEDmatch, this analysis would have been much more complicated, and nearly impossible.
Lastly, and most importantly, I would like to thank the hundreds of genetic genealogists who
volunteered their time and GEDmatch kit numbers to the Recombination Project. Without them,
this research would not be possible.
REFERENCES
1. Chowdhury, R., P.R. Bois, E. Feingold, S.L. Sherman, and V.G Cheung (2009). “Genetic
Analysis of Variation in Human Meiotic Recombination.” PloS Genetics 5(9): e1000648
(http://dx.doi.org/10.1371/journal.pgen.1000648).
2. Easycalculation, Poisson Distribution Calculator
(https://www.easycalculation.com/statistics/poisson-distribution.php).
PREPRINT
FIG. 8
1.2%
8.0%
19.6%
27.2%
24.8%
13.6%
4.4%
0.8% 0.4%
6.0%
16.9%
23.7%
22.3%
15.7%
8.8%
4.1%
1.7%0.6%
0.0%
5.0%
10.0%
15.0%
20.0%
25.0%
30.0%
0 1 2 3 4 5 6 7 8
Number of Recombination Events
Chromosome 1
Actual Expected
PREPRINT
FIG. 9
2.0%
8.4%
22.0%
29.6%
20.4%
14.0%
3.6%
0.0% 0.0%
7.2%
18.9%
24.9%
21.9%
14.4%
7.6%
3.3%
1.3%0.5%
0.0%
5.0%
10.0%
15.0%
20.0%
25.0%
30.0%
35.0%
0 1 2 3 4 5 6 7 8
Number of Recombination Events
Chromosome 2
Actual Expected
PREPRINT
FIG 10
4.8%
14.8%
27.6%
26.0%
18.0%
6.0%
2.8%
0.0% 0.0%
10.6%
23.8%
26.7%
20.0%
11.2%
5.0%
1.9%
0.6% 0.2%
0.0%
5.0%
10.0%
15.0%
20.0%
25.0%
30.0%
0 1 2 3 4 5 6 7 8
Number of Recombination Events
Chromosome 3
Actual Expected
PREPRINT
FIG. 11
2.4%
20.0%
24.0%
28.4%
16.8%
6.8%
1.2%0.4% 0.0%
11.7%
25.1%
26.9%
19.2%
10.3%
4.4%
1.6%0.5% 0.1%
0.0%
5.0%
10.0%
15.0%
20.0%
25.0%
30.0%
0 1 2 3 4 5 6 7 8
Number of Recombination Events
Chromosome 4
Actual Expected
PREPRINT
FIG. 12
7.2%
18.8%
27.2%
24.8%
15.6%
4.8%
1.6%
0.0% 0.0%
12.3%
25.8%
27.0%
18.8%
9.9%
4.1%
1.4%0.4% 0.1%
0.0%
5.0%
10.0%
15.0%
20.0%
25.0%
30.0%
0 1 2 3 4 5 6 7 8
Number of Recombination Events
Chromosome 5
Actual Expected
PREPRINT
FIG. 13
6.0%
15.6%
35.2%
25.6%
12.0%
4.0%
1.6%
0.0% 0.0%
14.4%
27.9%27.0%
17.5%
8.5%
3.3%
1.1%0.3% 0.1%
0.0%
5.0%
10.0%
15.0%
20.0%
25.0%
30.0%
35.0%
40.0%
0 1 2 3 4 5 6 7 8
Number of Recombination Events
Chromsome 6
Actual Expected
PREPRINT
FIG. 14
8.8%
22.0%
29.6%
25.6%
10.8%
3.2%
0.0% 0.0% 0.0%
15.4%
28.8%
26.9%
16.8%
7.9%
2.9%
0.9%0.2% 0.1%
0.0%
5.0%
10.0%
15.0%
20.0%
25.0%
30.0%
35.0%
0 1 2 3 4 5 6 7 8
Number of Recombination Events
Chromosome 7
Actual Expected
PREPRINT
FIG. 15
7.2%
26.0%
33.2%
24.0%
6.4%
2.0%0.8% 0.4% 0.0%
18.4%
31.2%
26.4%
14.9%
6.3%
2.1%
0.6% 0.1% 0.0%0.0%
5.0%
10.0%
15.0%
20.0%
25.0%
30.0%
35.0%
0 1 2 3 4 5 6 7 8
Number of Recombination Events
Chromosome 8
Actual Expected
PREPRINT
FIG. 16
8.4%
33.2%
28.4%
24.4%
4.4%
1.2%0.0% 0.0% 0.0%
18.8%
31.4%
26.3%
14.6%
6.1%
2.0%
0.6% 0.1% 0.0%0.0%
5.0%
10.0%
15.0%
20.0%
25.0%
30.0%
35.0%
0 1 2 3 4 5 6 7 8
Number of Recombination Events
Chromosome 9
Actual Expected

PREPRINT
FIG. 17
7.2%
31.2%32.0%
21.2%
8.4%
0.0% 0.0% 0.0% 0.0%
17.5%
30.5%
26.6%
15.4%
6.7%
2.3%
0.7% 0.2% 0.0%0.0%
5.0%
10.0%
15.0%
20.0%
25.0%
30.0%
35.0%
0 1 2 3 4 5 6 7 8
Number of Recombination Events
Chromosome 10
Actual Expected

PREPRINT
FIG. 18
13.2%
30.0%29.2%
18.0%
5.6%
4.0%
0.0% 0.0% 0.0%
20.0%
32.2%
25.9%
13.9%
5.6%
1.8%0.5% 0.1% 0.0%
0.0%
5.0%
10.0%
15.0%
20.0%
25.0%
30.0%
35.0%
0 1 2 3 4 5 6 7 8
Number of Recombination Events
Chromosome 11
Actual Expected
PREPRINT
FIG. 19
10.0%
26.0%
30.8%
22.8%
8.0%
2.4%
0.0% 0.0% 0.0%
17.2%
30.3%
26.6%
15.6%
6.9%
2.4%
0.7% 0.2% 0.0%0.0%
5.0%
10.0%
15.0%
20.0%
25.0%
30.0%
35.0%
0 1 2 3 4 5 6 7 8
Number of Recombination Events
Chromosome 12
Actual Expected

PREPRINT
FIG. 20
17.6%
40.4%
31.2%
9.6%
0.8%0.0% 0.4% 0.0% 0.0%
26.7%
35.3%
23.3%
10.2%
3.4%
0.9% 0.2% 0.0% 0.0%0.0%
5.0%
10.0%
15.0%
20.0%
25.0%
30.0%
35.0%
40.0%
45.0%
0 1 2 3 4 5 6 7 8
Number of Recombination Events
Chromosome 13
Actual Expected
PREPRINT
FIG. 21
17.6%
41.6%
33.2%
7.6%
0.0% 0.0% 0.0% 0.0% 0.0%
26.6%
35.2%
23.3%
10.3%
3.4%
0.9% 0.2% 0.0% 0.0%0.0%
5.0%
10.0%
15.0%
20.0%
25.0%
30.0%
35.0%
40.0%
45.0%
0 1 2 3 4 5 6 7 8
Number of Recombination Events
Chromosome 14
Actual Expected
PREPRINT
FIG. 22
13.6%
43.2%
30.8%
11.2%
0.8% 0.4% 0.0% 0.0% 0.0%
26.6%
35.2%
23.3%
10.3%
3.4%
0.9% 0.2% 0.0% 0.0%0.0%
5.0%
10.0%
15.0%
20.0%
25.0%
30.0%
35.0%
40.0%
45.0%
50.0%
0 1 2 3 4 5 6 7 8
Number of Recombination Events
Chromosome 15
Actual Expected
PREPRINT
FIG. 23
15.2%
41.2%
30.8%
11.2%
1.2%0.4% 0.0% 0.0% 0.0%
26.2%
35.1%
23.5%
10.5%
3.5%
0.9% 0.2% 0.0% 0.0%0.0%
5.0%
10.0%
15.0%
20.0%
25.0%
30.0%
35.0%
40.0%
45.0%
0 1 2 3 4 5 6 7 8
Number of Recombination Events
Chromosome 16
Actual Expected

PREPRINT
FIG. 24
12.8%
33.2%
38.8%
12.8%
2.4%
0.0% 0.0% 0.0% 0.0%
25.3%
34.8%
23.9%
10.9%
3.8%
1.0%0.2% 0.0% 0.0%
0.0%
5.0%
10.0%
15.0%
20.0%
25.0%
30.0%
35.0%
40.0%
45.0%
0 1 2 3 4 5 6 7 8
Number of Recombination Events
Chromosome 17
Actual Expected
PREPRINT
FIG. 25
14.4%
40.4%
33.2%
11.2%
0.8%0.0% 0.0% 0.0% 0.0%
27.4%
35.5%
23.0%
9.9%
3.2%
0.8% 0.2% 0.0% 0.0%0.0%
5.0%
10.0%
15.0%
20.0%
25.0%
30.0%
35.0%
40.0%
45.0%
0 1 2 3 4 5 6 7 8
Number of Recombination Events
Chromosome 18
Actual Expected
PREPRINT
FIG. 26
23.6%
44.0%
28.4%
4.0%
0.0% 0.0% 0.0% 0.0% 0.0%
32.9%
36.6%
20.3%
7.5%
2.1%0.5% 0.1% 0.0% 0.0%
0.0%
5.0%
10.0%
15.0%
20.0%
25.0%
30.0%
35.0%
40.0%
45.0%
50.0%
0 1 2 3 4 5 6 7 8
Number of Recombination Events
Chromosome 19
Actual Expected
PREPRINT
FIG. 27
20.8%
45.6%
28.4%
4.8%
0.4% 0.0% 0.0% 0.0% 0.0%
31.7%
36.4%
20.9%
8.0%
2.3%0.5% 0.1% 0.0% 0.0%
0.0%
5.0%
10.0%
15.0%
20.0%
25.0%
30.0%
35.0%
40.0%
45.0%
50.0%
0 1 2 3 4 5 6 7 8
Number of Recombination Events
Chromosome 20
Actual Expected
PREPRINT
FIG. 28
43.6%
48.0%
8.0%
0.4% 0.0% 0.0% 0.0% 0.0% 0.0%
49.6%
34.8%
12.2%
2.8%0.5% 0.1% 0.0% 0.0% 0.0%
0.0%
10.0%
20.0%
30.0%
40.0%
50.0%
60.0%
0 1 2 3 4 5 6 7 8
Number of Recombination Events
Chromosome 21
Actual Expected
PREPRINT
FIG. 29
37.2%
50.4%
11.6%
0.8% 0.0% 0.0% 0.0% 0.0% 0.0%
45.3%
35.9%
14.2%
3.7%
0.7% 0.1% 0.0% 0.0% 0.0%0.0%
10.0%
20.0%
30.0%
40.0%
50.0%
60.0%
0 1 2 3 4 5 6 7 8
Number of Recombination Events
Chromosome 22
Actual Expected
PREPRINT
FIG. 30
14.0%
34.4%
30.8%
15.6%
3.2%2.0%
0.0% 0.0% 0.0%
14.1%
27.6% 27.1%
17.7%
8.7%
3.4%
1.1%0.3% 0.1%
0.0%
5.0%
10.0%
15.0%
20.0%
25.0%
30.0%
35.0%
40.0%
0 1 2 3 4 5 6 7 8
Number of Recombination Events
X Chromosome
Actual Expected