Embed Size (px)
Citation preview
Policy Research Working Paper 7023
The Reduction of Child Mortality in the Middle East and North Africa
A Success Story
Farrukh Iqbal Youssouf Kiendrebeogo
Middle East and North Africa RegionOffice of the Chief EconomistSeptember 2014
WPS7023P
ublic
Dis
clos
ure
Aut
horiz
edP
ublic
Dis
clos
ure
Aut
horiz
edP
ublic
Dis
clos
ure
Aut
horiz
edP
ublic
Dis
clos
ure
Aut
horiz
edP
ublic
Dis
clos
ure
Aut
horiz
edP
ublic
Dis
clos
ure
Aut
horiz
edP
ublic
Dis
clos
ure
Aut
horiz
edP
ublic
Dis
clos
ure
Aut
horiz
ed
Produced by the Research Support Team
Abstract
The Policy Research Working Paper Series disseminates the findings of work in progress to encourage the exchange of ideas about development issues. An objective of the series is to get the findings out quickly, even if the presentations are less than fully polished. The papers carry the names of the authors and should be cited accordingly. The findings, interpretations, and conclusions expressed in this paper are entirely those of the authors. They do not necessarily represent the views of the International Bank for Reconstruction and Development/World Bank and its affiliated organizations, or those of the Executive Directors of the World Bank or the governments they represent.
Policy Research Working Paper 7023
This paper is a product of the Office of the Chief Economist, Middle East and North Africa Region. It is part of a larger effort by the World Bank to provide open access to its research and make a contribution to development policy discussions around the world. Policy Research Working Papers are also posted on the Web at http://econ.worldbank.org. The authors may be contacted at [email protected].
Although child mortality rates have declined all across the developing world over the past 40 years, they have declined the most in the Middle East and North Africa region. This paper documents this remarkable experience and shows that it is broad based in the sense that all countries in the Middle East and North Africa experienced significant declines in child mortality over this period and each country did better than most of its comparators. In looking for the sources of the region’s performance edge, the paper confirms the
importance of such determinants of child mortality as income growth, education stock, public spending on health, urbanization, and food sufficiency. In addition, the paper establishes that the initial level of mortality has a substan-tial influence on the pace of subsequent child mortality decline. Of these factors, food sufficiency status is found to contribute to the region’s performance edge over all devel-oping regions, while the other factors are found to matter to varying degrees in selected pairwise regional comparisons.
The Reduction of Child Mortality in the Middle East and North Africa: A Success Story
Farrukh Iqbal and Youssouf Kiendrebeogo*
Key words: Middle East, child mortality, food subsidies, public health spending, economic development
JEL: H510, I130, O150, O530
*Farrukh Iqbal and Youssouf Kiendrebeogo are based in the Office of the Chief Economist of the Middle East and North Africa Region (MNACE) at the World Bank. They are grateful to MNACE colleagues and to Enis Baris and Aakanksha Pande for comments and suggestions provided on earlier versions of this paper.

This paper reviews the experience of the Middle East and North Africa (MENA) region in reducing child mortality rates over the four decade long period between 1970 and 2010, with a view to comparing the region’s achievements with those of other regions.1
The paper is organized in four sections. In Section A, we provide an overview of the MENA region’s experience with child mortality over the past 40 years. In Section B, we measure the performance of 17 MENA countries against comparators and show that most MENA countries have done relatively better in reducing child mortality over time. In Section C, we compare across regions using population weighted averages and find that the MENA region exhibits the biggest improvement in child mortality rates among all developing country regions. In Section D, we investigate the sources of MENA’s performance through econometric analysis. We find that child mortality is affected (to a statistically significant degree) by such factors as the initial level of mortality, income growth, public spending on health, education, urbanization and food sufficiency.
A. Declining Child Mortality in MENA
Figure 1 below shows how child mortality rates (measured as the number of deaths of children of below five years of age per 1000 live births) have declined in the 17 MENA countries for which we have data for the period 1970-2010.
The following observations can be read off Figure 1:
• There was great variation among initial child mortality levels in 1970 with the highest rate being that of Yemen (321 per 1000) and the lowest being that of Lebanon (59 per 1000).
• All 17 MENA countries experienced declining child mortality to 2010. This is consistent with global experience over this period.
• However, some MENA countries did better than others. This suggests that differences in country circumstances, institutions and policies have played a role in determining differences in country performance with respect to child mortality reduction.
• Variation in child mortality rates across countries declined substantially between 1970 and 2010. This suggests that a “catch-up” or convergence phenomenon was also at work, with countries with high initial rates catching up with those with low initial rates.
1 Child mortality is among the eight target areas of the Millennium Development Goals (MDGs) for the period 1990-2015. While this paper does not focus on this aspect of child mortality, some of its empirical findings are relevant for an assessment of the design of the MDGs.
2
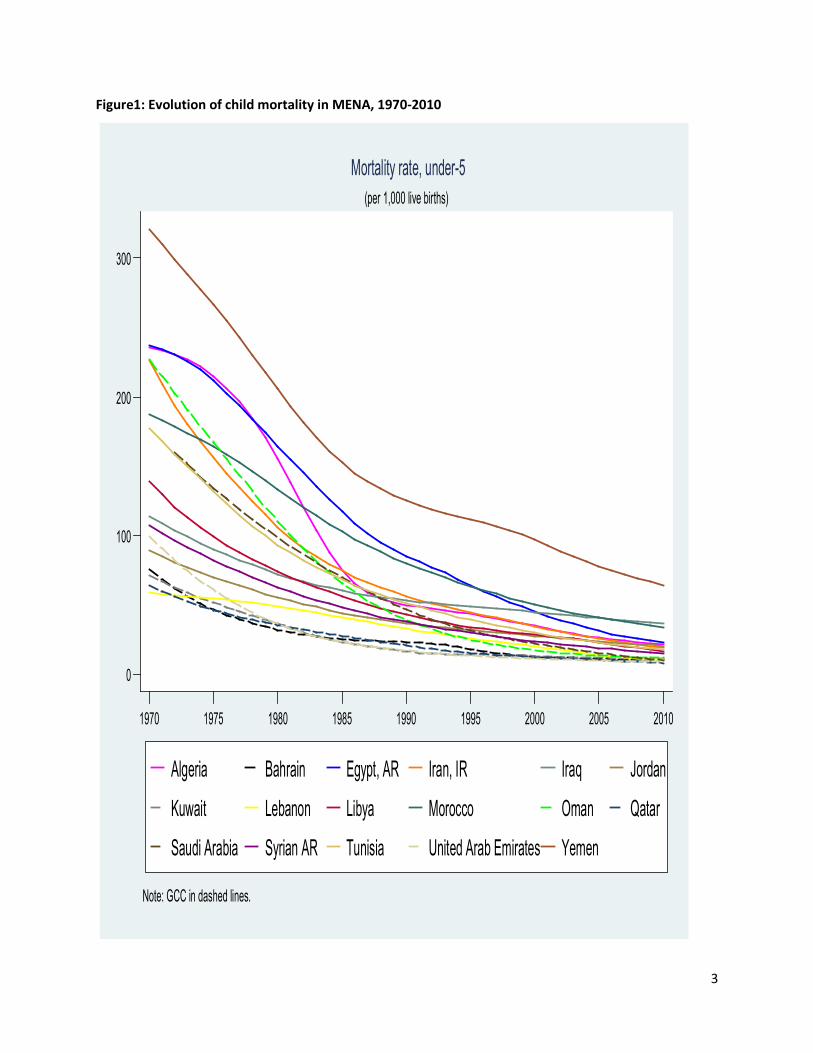
Figure1: Evolution of child mortality in MENA, 1970-2010
0
100
200
300
1970 1975 1980 1985 1990 1995 2000 2005 2010
Algeria Bahrain Egypt, AR Iran, IR Iraq Jordan
Kuwait Lebanon Libya Morocco Oman Qatar
Saudi Arabia Syrian AR Tunisia United Arab Emirates Yemen
Note: GCC in dashed lines.
(per 1,000 live births)
Mortality rate, under-5
3
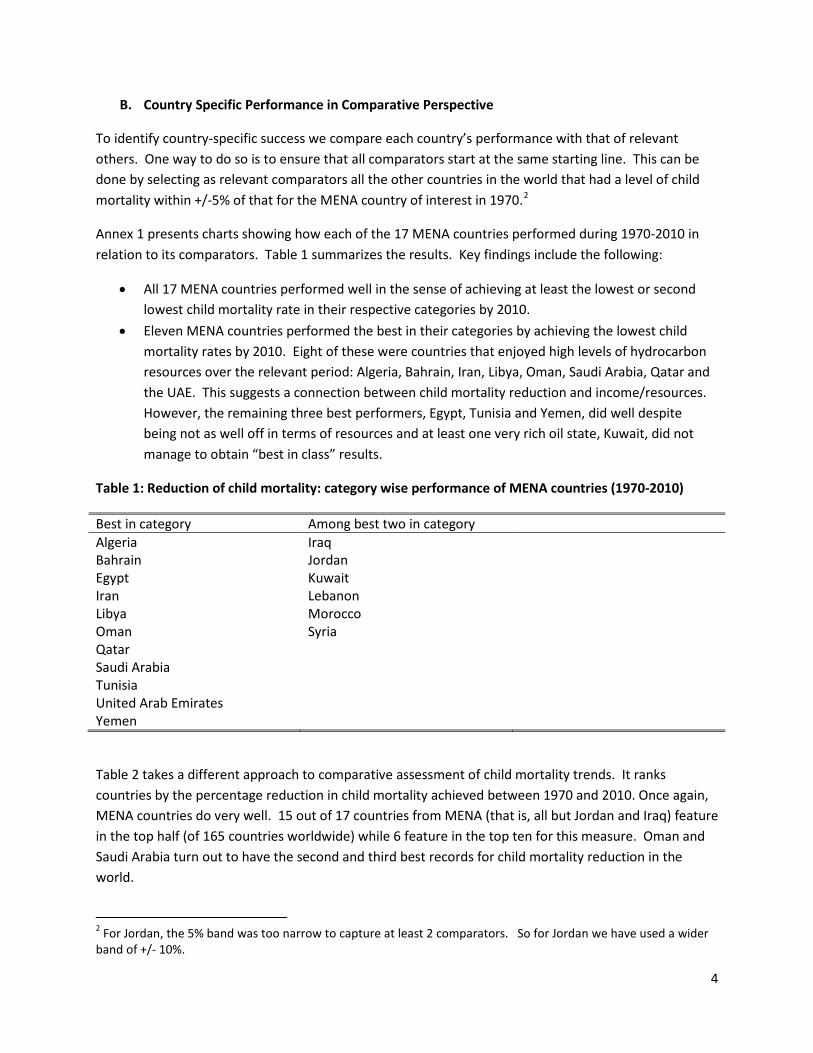
B. Country Specific Performance in Comparative Perspective
To identify country-specific success we compare each country’s performance with that of relevant others. One way to do so is to ensure that all comparators start at the same starting line. This can be done by selecting as relevant comparators all the other countries in the world that had a level of child mortality within +/-5% of that for the MENA country of interest in 1970.2
Annex 1 presents charts showing how each of the 17 MENA countries performed during 1970-2010 in relation to its comparators. Table 1 summarizes the results. Key findings include the following:
• All 17 MENA countries performed well in the sense of achieving at least the lowest or second lowest child mortality rate in their respective categories by 2010.
• Eleven MENA countries performed the best in their categories by achieving the lowest child mortality rates by 2010. Eight of these were countries that enjoyed high levels of hydrocarbon resources over the relevant period: Algeria, Bahrain, Iran, Libya, Oman, Saudi Arabia, Qatar and the UAE. This suggests a connection between child mortality reduction and income/resources. However, the remaining three best performers, Egypt, Tunisia and Yemen, did well despite being not as well off in terms of resources and at least one very rich oil state, Kuwait, did not manage to obtain “best in class” results.
Table 1: Reduction of child mortality: category wise performance of MENA countries (1970-2010)
Best in category Among best two in category Algeria Bahrain Egypt Iran Libya Oman Qatar Saudi Arabia Tunisia United Arab Emirates Yemen
Iraq Jordan Kuwait Lebanon Morocco Syria
Table 2 takes a different approach to comparative assessment of child mortality trends. It ranks countries by the percentage reduction in child mortality achieved between 1970 and 2010. Once again, MENA countries do very well. 15 out of 17 countries from MENA (that is, all but Jordan and Iraq) feature in the top half (of 165 countries worldwide) while 6 feature in the top ten for this measure. Oman and Saudi Arabia turn out to have the second and third best records for child mortality reduction in the world.
2 For Jordan, the 5% band was too narrow to capture at least 2 comparators. So for Jordan we have used a wider band of +/- 10%.
4
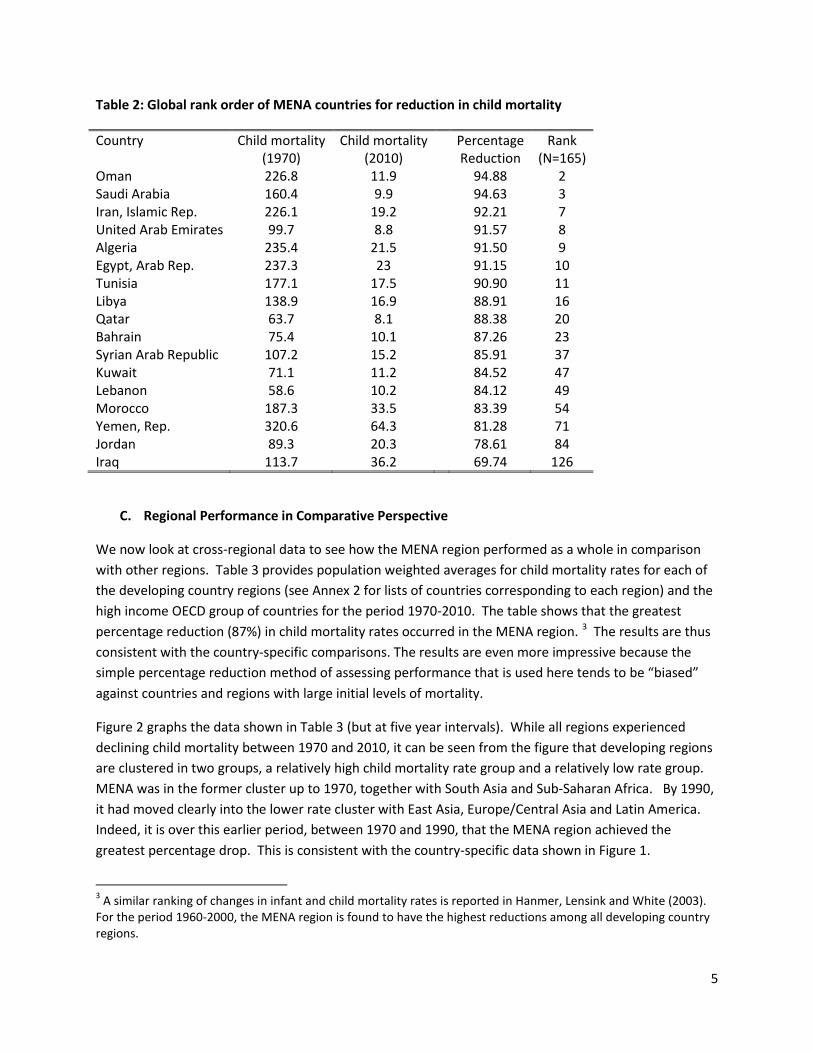
Table 2: Global rank order of MENA countries for reduction in child mortality
Country Child mortality (1970)
Child mortality (2010)
Percentage Reduction
Rank (N=165)
Oman 226.8 11.9 94.88 2 Saudi Arabia 160.4 9.9 94.63 3 Iran, Islamic Rep. 226.1 19.2 92.21 7 United Arab Emirates 99.7 8.8 91.57 8 Algeria 235.4 21.5 91.50 9 Egypt, Arab Rep. 237.3 23 91.15 10 Tunisia 177.1 17.5 90.90 11 Libya 138.9 16.9 88.91 16 Qatar 63.7 8.1 88.38 20 Bahrain 75.4 10.1 87.26 23 Syrian Arab Republic 107.2 15.2 85.91 37 Kuwait 71.1 11.2 84.52 47 Lebanon 58.6 10.2 84.12 49 Morocco 187.3 33.5 83.39 54 Yemen, Rep. 320.6 64.3 81.28 71 Jordan 89.3 20.3 78.61 84 Iraq 113.7 36.2 69.74 126
C. Regional Performance in Comparative Perspective
We now look at cross-regional data to see how the MENA region performed as a whole in comparison with other regions. Table 3 provides population weighted averages for child mortality rates for each of the developing country regions (see Annex 2 for lists of countries corresponding to each region) and the high income OECD group of countries for the period 1970-2010. The table shows that the greatest percentage reduction (87%) in child mortality rates occurred in the MENA region. 3 The results are thus consistent with the country-specific comparisons. The results are even more impressive because the simple percentage reduction method of assessing performance that is used here tends to be “biased” against countries and regions with large initial levels of mortality.
Figure 2 graphs the data shown in Table 3 (but at five year intervals). While all regions experienced declining child mortality between 1970 and 2010, it can be seen from the figure that developing regions are clustered in two groups, a relatively high child mortality rate group and a relatively low rate group. MENA was in the former cluster up to 1970, together with South Asia and Sub-Saharan Africa. By 1990, it had moved clearly into the lower rate cluster with East Asia, Europe/Central Asia and Latin America. Indeed, it is over this earlier period, between 1970 and 1990, that the MENA region achieved the greatest percentage drop. This is consistent with the country-specific data shown in Figure 1.
3 A similar ranking of changes in infant and child mortality rates is reported in Hanmer, Lensink and White (2003). For the period 1960-2000, the MENA region is found to have the highest reductions among all developing country regions.
5
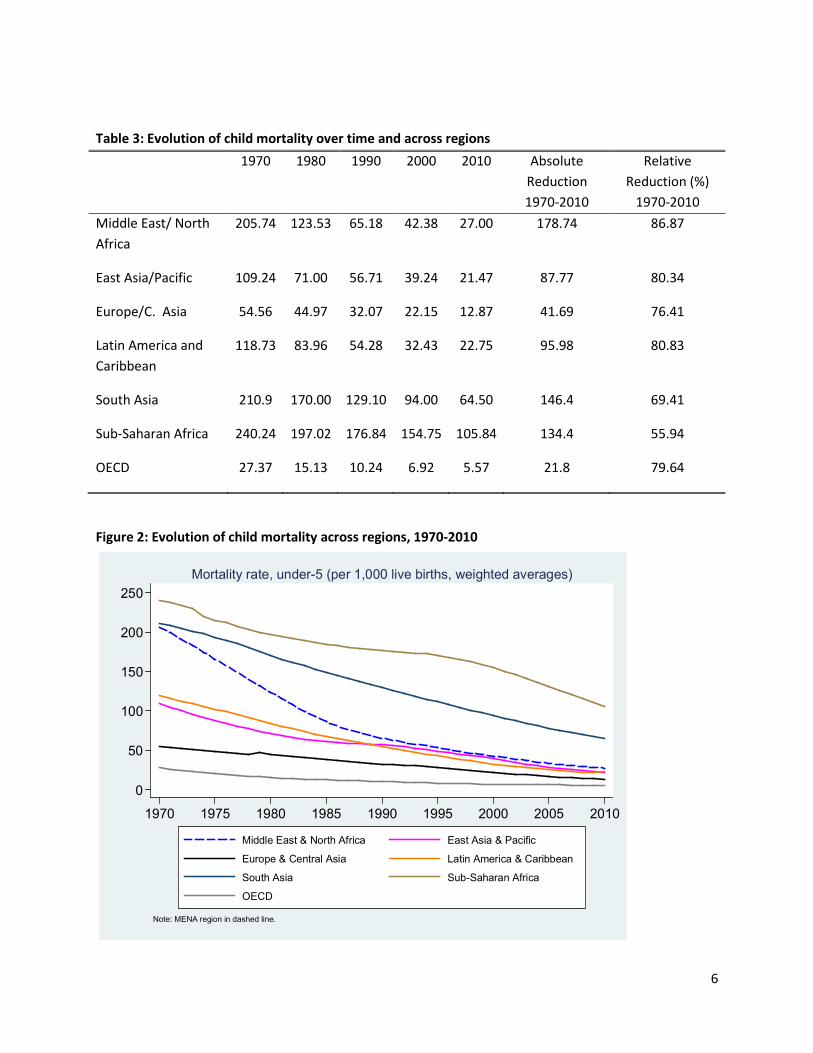
Table 3: Evolution of child mortality over time and across regions 1970 1980 1990 2000 2010 Absolute
Reduction 1970-2010
Relative Reduction (%)
1970-2010 Middle East/ North Africa
205.74 123.53 65.18 42.38 27.00 178.74 86.87
East Asia/Pacific 109.24 71.00 56.71 39.24 21.47 87.77 80.34
Europe/C. Asia 54.56 44.97 32.07 22.15 12.87 41.69 76.41
Latin America and Caribbean
118.73 83.96 54.28 32.43 22.75 95.98 80.83
South Asia 210.9 170.00 129.10 94.00 64.50 146.4 69.41
Sub-Saharan Africa 240.24 197.02 176.84 154.75 105.84 134.4 55.94
OECD 27.37 15.13 10.24 6.92 5.57 21.8 79.64
Figure 2: Evolution of child mortality across regions, 1970-2010
0
50
100
150
200
250
1970 1975 1980 1985 1990 1995 2000 2005 2010
Middle East & North Africa East Asia & Pacific
Europe & Central Asia Latin America & Caribbean
South Asia Sub-Saharan Africa
OECD
Note: MENA region in dashed line.
Mortality rate, under-5 (per 1,000 live births, weighted averages)
6

D. Sources of Comparative Performance: An Econometric Approach
What accounts for the better comparative performance of the MENA region? From the general literature we know that such factors as income, public spending on health, education, urbanization and food intake are plausible determinants of child mortality. When considering changes over time, it is important also to consider the initial level of child mortality from which a country starts. The rationale for these factors is further discussed below.
Initial level of child mortality: It is natural to expect that, all other things being equal, a country that has a low level of child mortality to begin with will find it difficult to reduce this rate further while countries with higher rates will find it easier to do so. The likelihood of catch-up or convergence is hinted at, for MENA countries at least, in Figure 1 which shows that the dispersion of child mortality rates clearly declined among MENA countries over the period 1970-2010. On the other hand, it could be argued that countries with high levels of infant mortality may be too poor to address their public health challenges and so may find it harder to reduce child mortality, suggesting a “poverty trap” phenomenon. So whether or not catch-up is happening will depend on whether or not we are able to control for variables that reflect the availability and use of public and private resources to improve child health.4
Growth of income: Income is a relevant determinant because it proxies for (a) the availability of private resources to spend on food, health care and sanitation for one’s family and (b) provided there is a good taxation system in place, the availability of public resources with which to implement public health interventions and health care facilities. All other things being equal, the faster income grows in a country, the faster one might expect it to reduce child mortality. In the regression analysis that follows, we use the growth rate of the economy, averaged over the forty year period, as our measure of income growth.
Public spending on health: This is a more direct measure of the amount of public resources that are devoted to obtaining good health outcomes in a country. We expect higher levels of spending to be associated with faster declines in child mortality. This is expected to be of special relevance to the MENA region because most countries there had adopted a model of publicly financed and delivered provision of medical services by the 1960s and continued to implement this model into current times. Indeed, in some MENA countries, health care was even written into the constitution as a human right to be ensured by government (Kronfol, 2012). Lebanon is possibly the only MENA country where the private sector has had a more prominent role than the public sector in the provision of medical services. In our regression analysis, we have used the ratio of public spending on health to GDP (averaged over 1985-2000) to capture the role of public resources.
Education: Education contributes to the reduction of child mortality through spreading knowledge within households about good childcare, nutrition and wellness practices. Infants and children have a better chance of survival if they get better nutrition and healthcare at home (including through exposure to preventative practices like washing one’s hands and wearing shoes while outside and so on). Our
4 The decline of child mortality over time can also be modelled as an S-shaped curve (see Clemens et.al. 2007 for a discussion). We have not explored this nonlinear option here.
7
empirical measure is the stock of education (years of schooling per person available from Barro and Lee, 2013) averaged over 1970-2010.
Food sufficiency: Adequacy of food among mothers is likely to be related positively to higher baby weight, better health at birth, and higher levels of breastfeeding and thus to better chances for baby and child survival. Similarly, adequacy of food among children is likely to lead to stronger and healthier children with a reduced susceptibility to disease and death. In the regression analysis below we have included a variable called “undernourishment” which measures food intake status. This measure is available from the WDI database but only since 1992 and so the average over 1992-2010 is used in the empirical work.5
Urbanization: The link between urbanization and child mortality could go either way. Greater urbanization usually reflects higher population densities. On the positive side, this means that a given health facility is likely to be able to cover more people in more urban settings. Thus, all other things being equal, urbanization should result in greater economies of scale from health spending and better health outcomes, including for child mortality. More urban settings are also likely to be associated with easier access to health facilities through better transport than more rural settings. On the negative side, greater population densities could also be associated with higher probabilities of disease incidence and dissemination. So the net effect of urbanization must be established empirically. Our measure for urbanization is the ratio of the urban to the total population, averaged over 1970-2010.
Regression Results
Role of main control variables: The results (see columns 1 and 2 in Table 4) show that the control variables are all significant and carry the expected signs.6 Higher levels of GDP growth, public health spending, education and urbanization are all found to be positively correlated with child mortality decline while undernourishment is found to be negatively correlated.7
Income growth is strongly significant. This is similar to results found in earlier studies such as Filmer and Pritchett (1999) and Gupta et.al. (2002). Public health spending is also significant in all the regressions reported here. Earlier studies report both insignificant (see McGuire, 2006; Filmer and Pritchett, 1999)
5 The measure is called “Prevalence of Undernourishment” in the WDI database and refers to the proportion of the population whose food intake is insufficient to meet minimum dietary energy requirements continuously. The statistical methodology note in the database states: “Data on undernourishment are from the Food and Agriculture Organization (FAO) of the United Nations and measure food deprivation based on average food available for human consumption per person, the level of inequality in access to food, and the minimum calories required for an average person.” This measure is among those used to track the Millennium Development Goal targets related to poverty and hunger (MDG1C). 6 The results reported here cover developing countries only. As a check for robustness, we have run the same regressions on a larger sample including high income OECD countries as well. The results for the larger sample are similar to those reported here in terms of signs and levels of significance of the included variables. 7 The relevant elasticities, calculated at regressor means, are as follows: initial mortality 1.32; real per capita GDP growth 0.11; health spending to GDP 0.11; years of schooling 0.18; urbanization 0.06 and undernourishment -0.17.
8
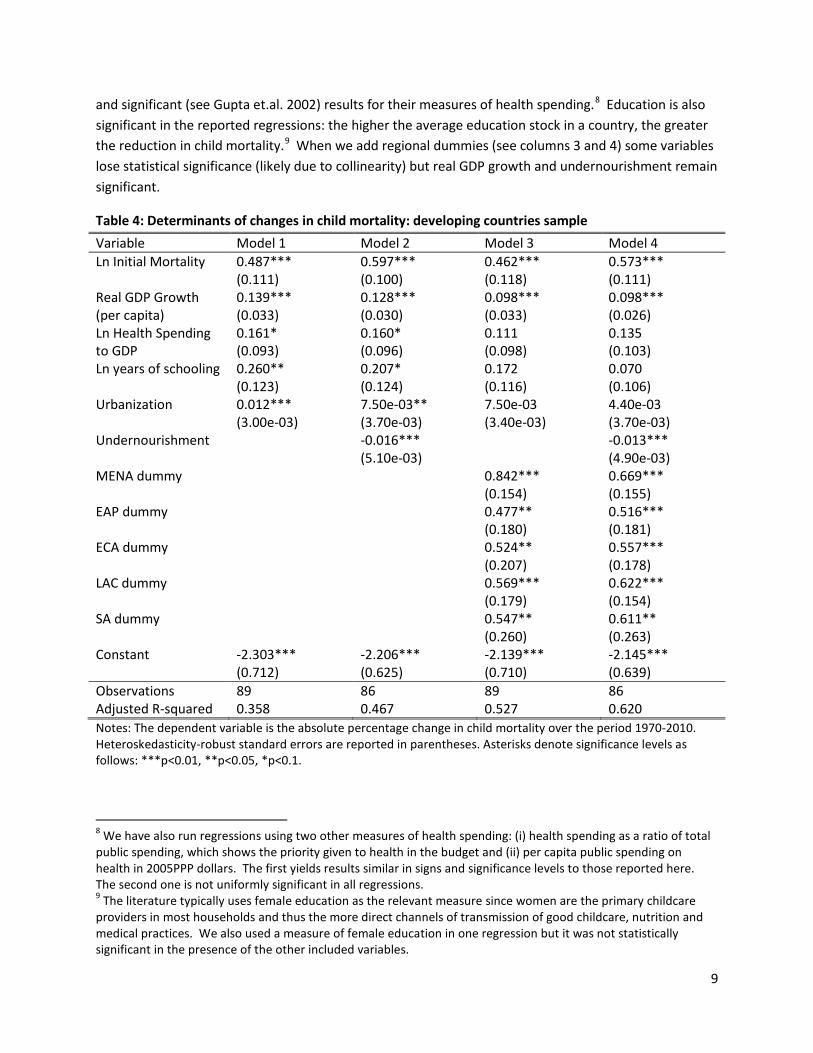
and significant (see Gupta et.al. 2002) results for their measures of health spending.8 Education is also significant in the reported regressions: the higher the average education stock in a country, the greater the reduction in child mortality.9 When we add regional dummies (see columns 3 and 4) some variables lose statistical significance (likely due to collinearity) but real GDP growth and undernourishment remain significant.
Table 4: Determinants of changes in child mortality: developing countries sample Variable Model 1 Model 2 Model 3 Model 4 Ln Initial Mortality 0.487***
(0.111) 0.597*** (0.100)
0.462*** (0.118)
0.573*** (0.111)
Real GDP Growth (per capita)
0.139*** (0.033)
0.128*** (0.030)
0.098*** (0.033)
0.098*** (0.026)
Ln Health Spending to GDP
0.161* (0.093)
0.160* (0.096)
0.111 (0.098)
0.135 (0.103)
Ln years of schooling 0.260** (0.123)
0.207* (0.124)
0.172 (0.116)
0.070 (0.106)
Urbanization 0.012*** (3.00e-03)
7.50e-03** (3.70e-03)
7.50e-03 (3.40e-03)
4.40e-03 (3.70e-03)
Undernourishment -0.016*** (5.10e-03)
-0.013*** (4.90e-03)
MENA dummy 0.842*** (0.154)
0.669*** (0.155)
EAP dummy 0.477** (0.180)
0.516*** (0.181)
ECA dummy 0.524** (0.207)
0.557*** (0.178)
LAC dummy 0.569*** (0.179)
0.622*** (0.154)
SA dummy 0.547** (0.260)
0.611** (0.263)
Constant -2.303*** (0.712)
-2.206*** (0.625)
-2.139*** (0.710)
-2.145*** (0.639)
Observations 89 86 89 86 Adjusted R-squared 0.358 0.467 0.527 0.620 Notes: The dependent variable is the absolute percentage change in child mortality over the period 1970-2010. Heteroskedasticity-robust standard errors are reported in parentheses. Asterisks denote significance levels as follows: ***p<0.01, **p<0.05, *p<0.1.
8 We have also run regressions using two other measures of health spending: (i) health spending as a ratio of total public spending, which shows the priority given to health in the budget and (ii) per capita public spending on health in 2005PPP dollars. The first yields results similar in signs and significance levels to those reported here. The second one is not uniformly significant in all regressions. 9 The literature typically uses female education as the relevant measure since women are the primary childcare providers in most households and thus the more direct channels of transmission of good childcare, nutrition and medical practices. We also used a measure of female education in one regression but it was not statistically significant in the presence of the other included variables.
9
Role of initial mortality: While our results are similar to those of earlier studies, note that we are not asking the same question. While earlier studies have modelled the determinants of the level of child mortality at a given point in time, we model the determinants of the change in child mortality over time. This formulation of the question supports the use of an “initial conditions” variable, namely, the initial level of child mortality in 1970. This turns out to be uniformly significant and to have a very substantial elasticity of 1.32. The positive sign of the initial level of mortality shows that convergence or catch-up does indeed occur; the higher the initial child mortality level in 1970 the greater is the reduction over time (though we might note once again that the true relationship here may be a non-linear S-shape). This result is of relevance to the debate on the design of MDG targets (see Clemens et al., 2007). The substantial role of initial mortality in determining the pace of subsequent declines in child mortality suggests that this factor should have been taken into consideration in designing the relevant MDG target.
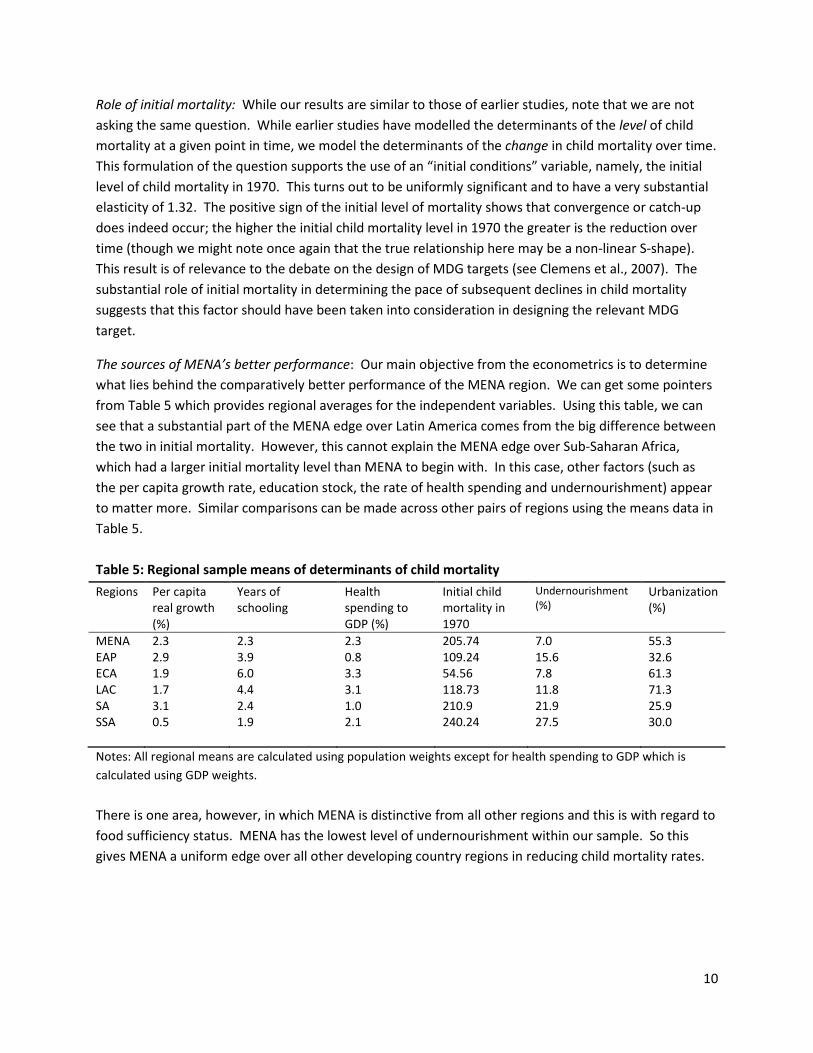
The sources of MENA’s better performance: Our main objective from the econometrics is to determine what lies behind the comparatively better performance of the MENA region. We can get some pointers from Table 5 which provides regional averages for the independent variables. Using this table, we can see that a substantial part of the MENA edge over Latin America comes from the big difference between the two in initial mortality. However, this cannot explain the MENA edge over Sub-Saharan Africa, which had a larger initial mortality level than MENA to begin with. In this case, other factors (such as the per capita growth rate, education stock, the rate of health spending and undernourishment) appear to matter more. Similar comparisons can be made across other pairs of regions using the means data in Table 5. Table 5: Regional sample means of determinants of child mortality Regions Per capita
real growth (%)
Years of schooling
Health spending to GDP (%)
Initial child mortality in 1970
Undernourishment (%)
Urbanization (%)
MENA EAP ECA LAC SA SSA
2.3 2.9 1.9 1.7 3.1 0.5
2.3 3.9 6.0 4.4 2.4 1.9
2.3 0.8 3.3 3.1 1.0 2.1
205.74 109.24 54.56 118.73 210.9 240.24
7.0 15.6 7.8 11.8 21.9 27.5
55.3 32.6 61.3 71.3 25.9 30.0
Notes: All regional means are calculated using population weights except for health spending to GDP which is calculated using GDP weights. There is one area, however, in which MENA is distinctive from all other regions and this is with regard to food sufficiency status. MENA has the lowest level of undernourishment within our sample. So this gives MENA a uniform edge over all other developing country regions in reducing child mortality rates.
10
The statistical role of undernourishment can be seen further in columns 2, 3 and 4 in Table 4.10 Column 2 shows that undernourishment is significantly and negatively associated with child mortality decline: the worse the level of undernourishment the slower the decline in child mortality over time. By comparing the R-squared terms between columns 1 and 2 we can see that including this measure in the regression improves its explanatory power substantially (inducing a jump in the adjusted R-squared of 11 basis points or roughly 30%). Another way to see the role of this variable is to compare the coefficient values for the regional dummies across columns 3 and 4. The coefficient on the regional dummy for MENA is significantly smaller in column 4 when “undernourishment” is included in the regression as compared to column 3 when it is excluded, thus showing that it accounts for a substantial part of the effect that the regional dummy captures otherwise. For no other region is there a similarly large effect.11 Finally, we would note that the elasticity of the undernourishment variable is -0.17; in other words, a 10% increase in undernourishment would generate a decline in child mortality that is 1.7% less rapid. This elasticity is almost as large as that for education stock which is 0.18 and higher than the elasticities for real per capita GDP growth and health spending to GDP. Why does MENA have the lowest level of “undernourishment” among all developing country regions on average? One possible reason is the widespread practice in the region of subsidizing food. Virtually all countries in the MENA region have subsidized basic food items for significant periods of time over the past 40 years and especially in the earlier half.12 While such subsidies can be costly from a fiscal point of view (and are often inefficiently implemented) they do ensure that lower income segments of the population have access to a decent standard of food consumption.
10 We have run regressions using “depth of food deficit” as an alternative measure of food intake status. This variable is also available in the WDI database as of 1992. It gives the same results in terms of sign and statistical significance as “undernourishment.” 11 Just to be clear, we are speaking only with respect to the observed and included variables. Since the regional dummies continue to be significant, and since the R-squared term is no higher than 0.62, the possibility exists that some unobserved or unincluded variables may also be responsible for the MENA edge in performance. 12 A discussion of selected food subsidy programs in MENA countries and their distributional impact is provided in Iqbal, 2006, pp.58-63.
11

References
Barro, R. and Lee, J., (2013), “A New Data Set of Educational Attainment in the World, 1950-2010” Journal of Development Economics, 104:184-198
Clemens, M.A., Kenny, C.J., and Moss, T.J. (2007), The Trouble with the MDGs: Confronting Expectations of Aid and Development Success. World Development, 35:5, 735-751
Filmer, D. and Pritchett, L. (1999), The Impact of Public Spending on Health: Does Money Matter? Social Science and Medicine, 49:10, 1309-1323.
Gupta, S., Verhoeven, M., and Tiongson, E.R (2003), Public Spending on Health Care and the Poor, Health Economics, 12:8, 685-696.
Hanmer, L., Lensink, R., and White, H., (2003), Infant and Child Mortality in Developing Countries: Analyzing the Data for Robust Determinants. Journal of Development Studies, 40:1, 101-118.
Iqbal, F., (2006), Sustaining Gains in Poverty Reduction and Human Development in the Middle East and North Africa, World Bank, Washington D.C.
Kronfol,N. (2012), Historical Development of Health Systems in the Arab Countries: A Review. Eastern Mediterranean Health Journal, 18:11, 1151-1156.
McGuire, J. (2006), Basic Health Care Provision and Under-5 Mortality: A Cross-National Study of Developing Countries. World Development, 34:3, 405-425.
12
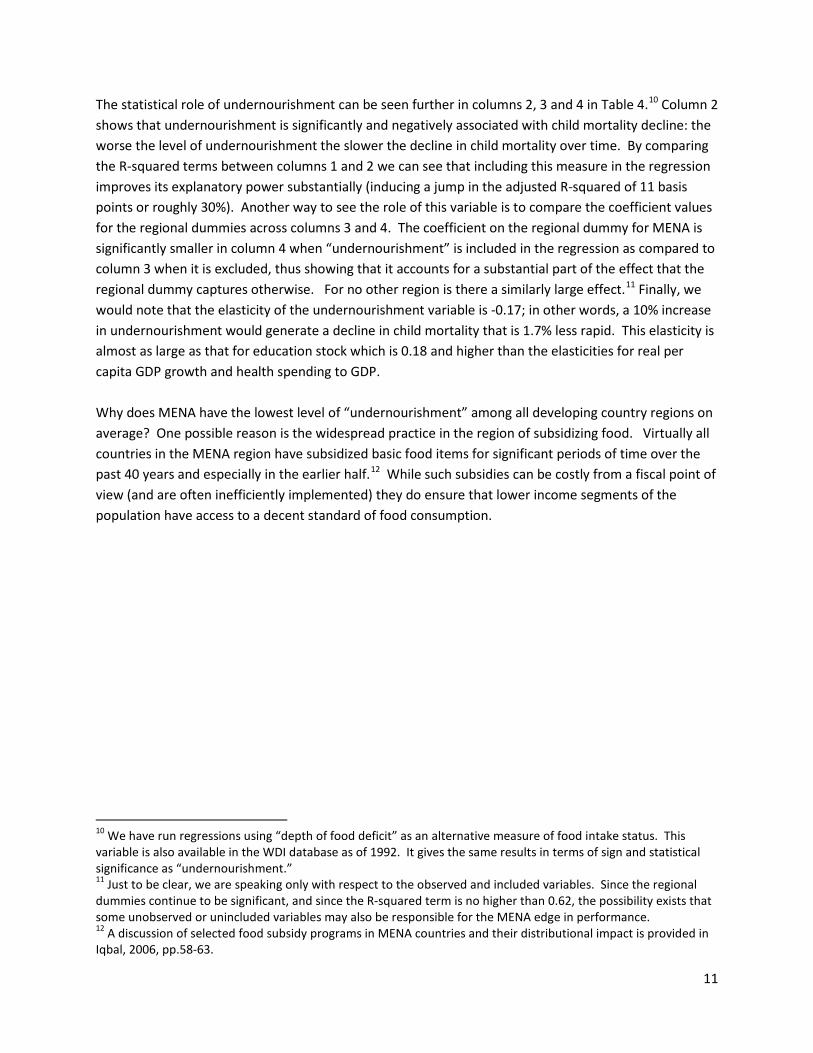
Annex 1: Country charts showing evolution of child mortality in relation to comparators from 1970 Algeria
Bahrain
0
50
100
150
200
250
1970 1975 1980 1985 1990 1995 2000 2005 2010
Algeria Bolivia
Burundi Cote d'Ivoire
Ethiopia Haiti
Note: Starting line: countries with +/-5% higher/lower levels.
Mortality rate, under-5 (per 1,000 live births)
0
20
40
60
80
1970 1975 1980 1985 1990 1995 2000 2005 2010
Bahrain Argentina
Costa Rica Guyana
Paraguay Seychelles
Note: Starting line: countries with +/-5% higher/lower levels.
Mortality rate, under-5 (per 1,000 live births)
13
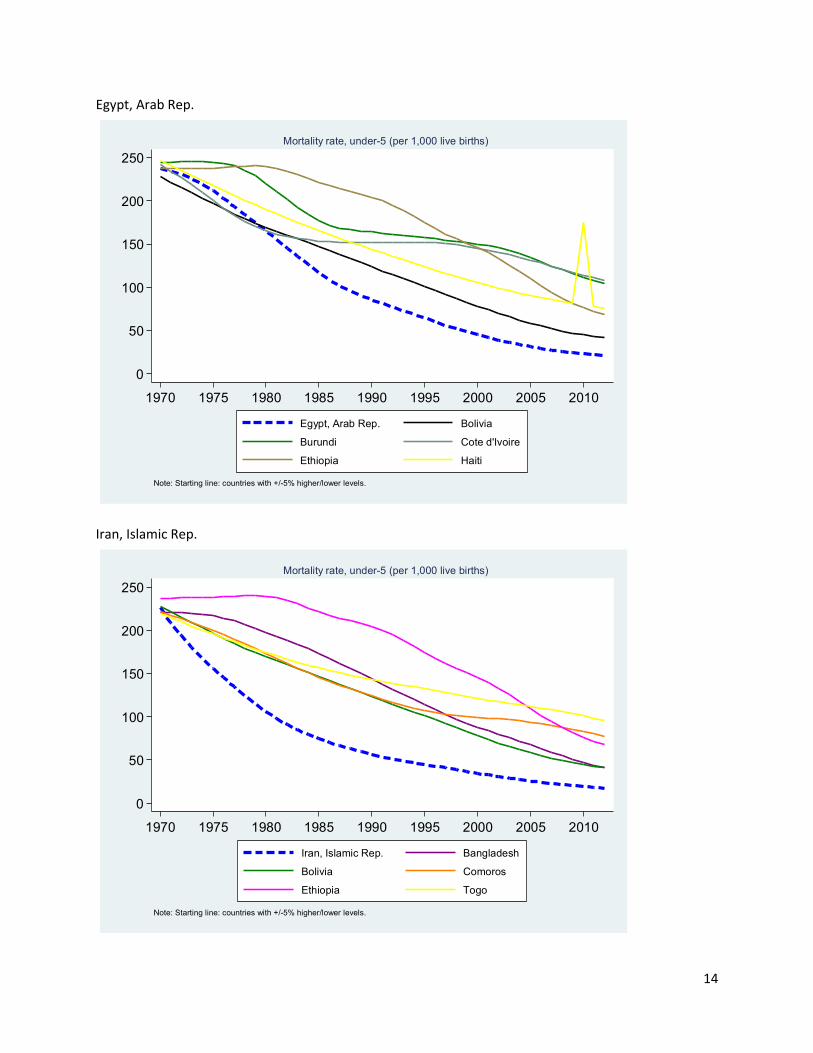
Egypt, Arab Rep.
Iran, Islamic Rep.
0
50
100
150
200
250
1970 1975 1980 1985 1990 1995 2000 2005 2010
Egypt, Arab Rep. Bolivia
Burundi Cote d'Ivoire
Ethiopia Haiti
Note: Starting line: countries with +/-5% higher/lower levels.
Mortality rate, under-5 (per 1,000 live births)
0
50
100
150
200
250
1970 1975 1980 1985 1990 1995 2000 2005 2010
Iran, Islamic Rep. Bangladesh
Bolivia Comoros
Ethiopia Togo
Note: Starting line: countries with +/-5% higher/lower levels.
Mortality rate, under-5 (per 1,000 live births)
14
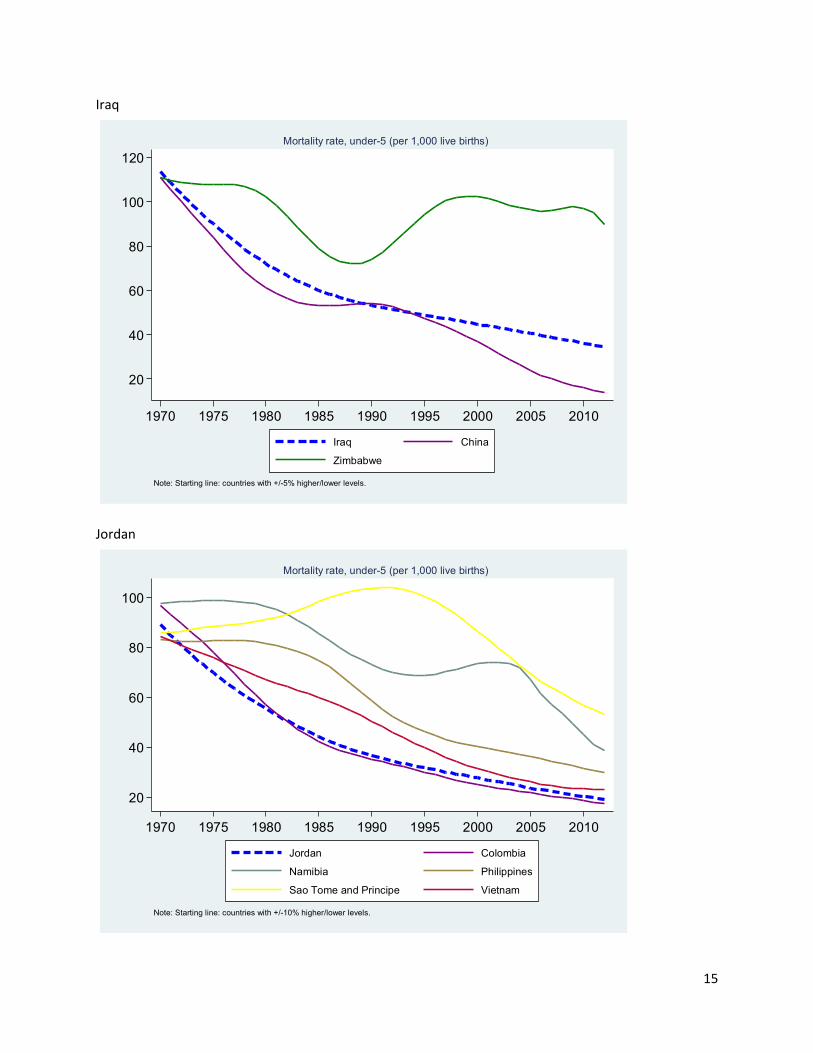
Iraq
Jordan
20
40
60
80
100
120
1970 1975 1980 1985 1990 1995 2000 2005 2010
Iraq China
Zimbabwe
Note: Starting line: countries with +/-5% higher/lower levels.
Mortality rate, under-5 (per 1,000 live births)
20
40
60
80
100
1970 1975 1980 1985 1990 1995 2000 2005 2010
Jordan Colombia
Namibia Philippines
Sao Tome and Principe Vietnam
Note: Starting line: countries with +/-10% higher/lower levels.
Mortality rate, under-5 (per 1,000 live births)
15
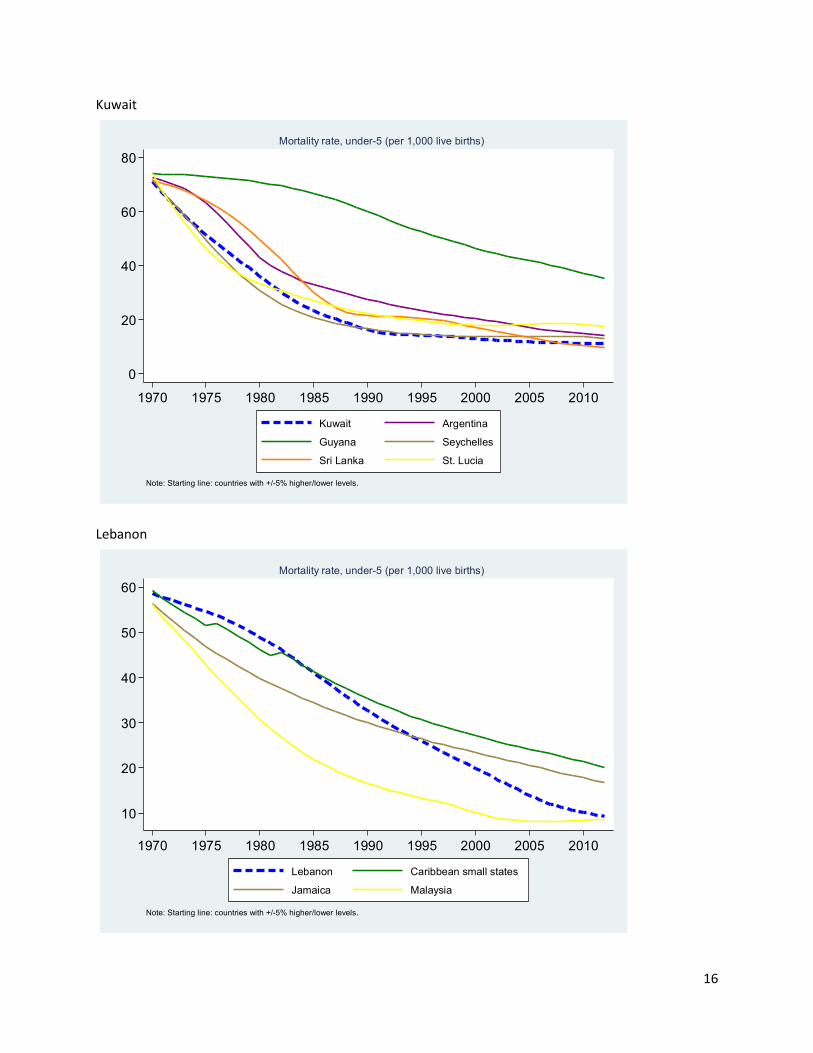
Kuwait
Lebanon
0
20
40
60
80
1970 1975 1980 1985 1990 1995 2000 2005 2010
Kuwait Argentina
Guyana Seychelles
Sri Lanka St. Lucia
Note: Starting line: countries with +/-5% higher/lower levels.
Mortality rate, under-5 (per 1,000 live births)
10
20
30
40
50
60
1970 1975 1980 1985 1990 1995 2000 2005 2010
Lebanon Caribbean small states
Jamaica Malaysia
Note: Starting line: countries with +/-5% higher/lower levels.
Mortality rate, under-5 (per 1,000 live births)
16
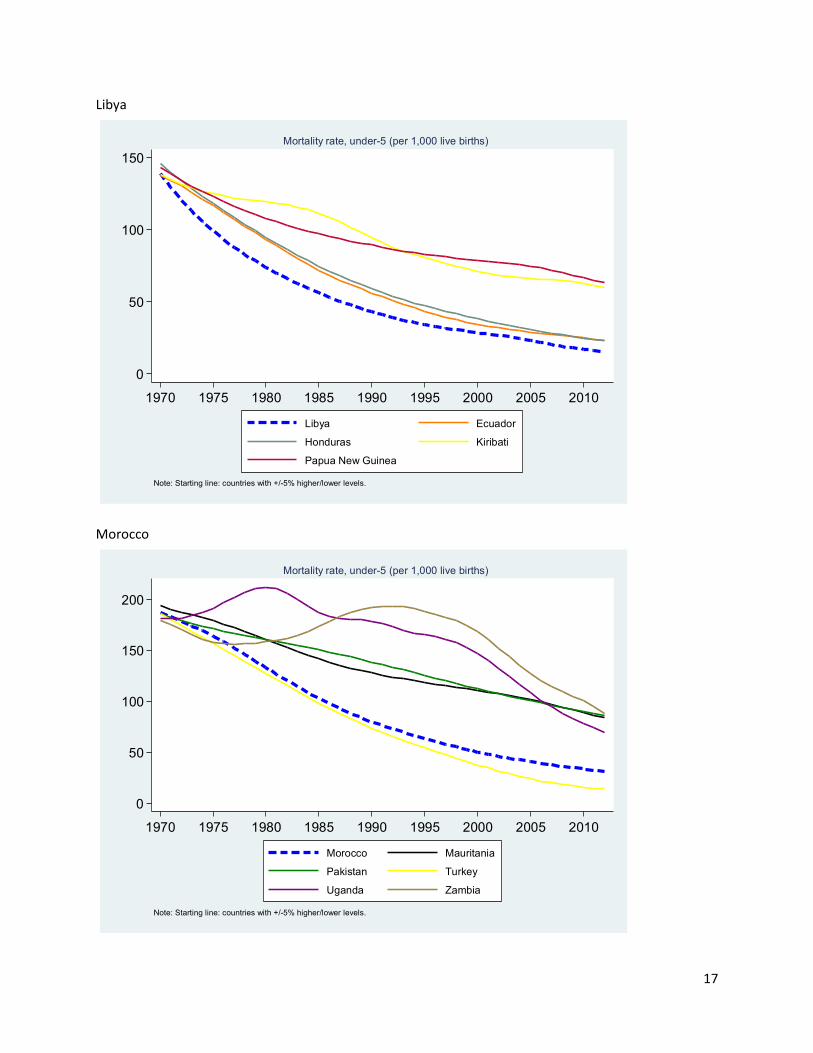
Libya
Morocco
0
50
100
150
1970 1975 1980 1985 1990 1995 2000 2005 2010
Libya Ecuador
Honduras Kiribati
Papua New Guinea
Note: Starting line: countries with +/-5% higher/lower levels.
Mortality rate, under-5 (per 1,000 live births)
0
50
100
150
200
1970 1975 1980 1985 1990 1995 2000 2005 2010
Morocco Mauritania
Pakistan Turkey
Uganda Zambia
Note: Starting line: countries with +/-5% higher/lower levels.
Mortality rate, under-5 (per 1,000 live births)
17
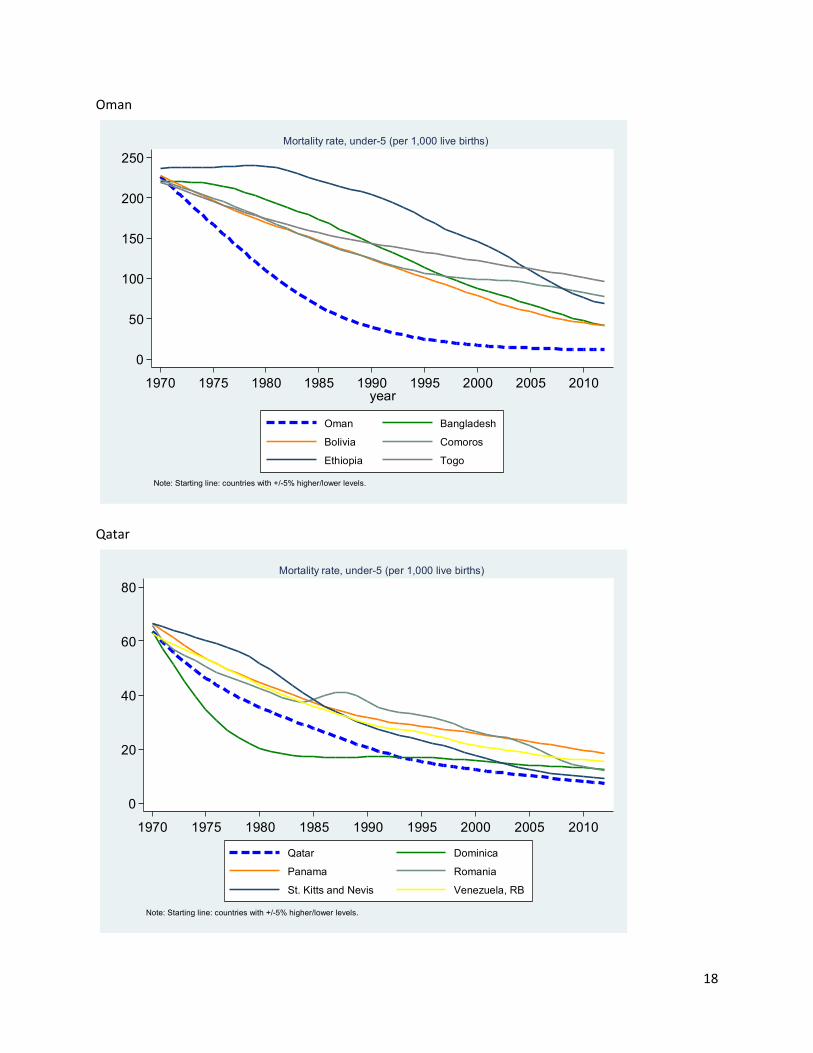
Oman
Qatar
0
50
100
150
200
250
1970 1975 1980 1985 1990 1995 2000 2005 2010year
Oman Bangladesh
Bolivia Comoros
Ethiopia Togo
Note: Starting line: countries with +/-5% higher/lower levels.
Mortality rate, under-5 (per 1,000 live births)
0
20
40
60
80
1970 1975 1980 1985 1990 1995 2000 2005 2010
Qatar Dominica
Panama Romania
St. Kitts and Nevis Venezuela, RB
Note: Starting line: countries with +/-5% higher/lower levels.
Mortality rate, under-5 (per 1,000 live births)
18
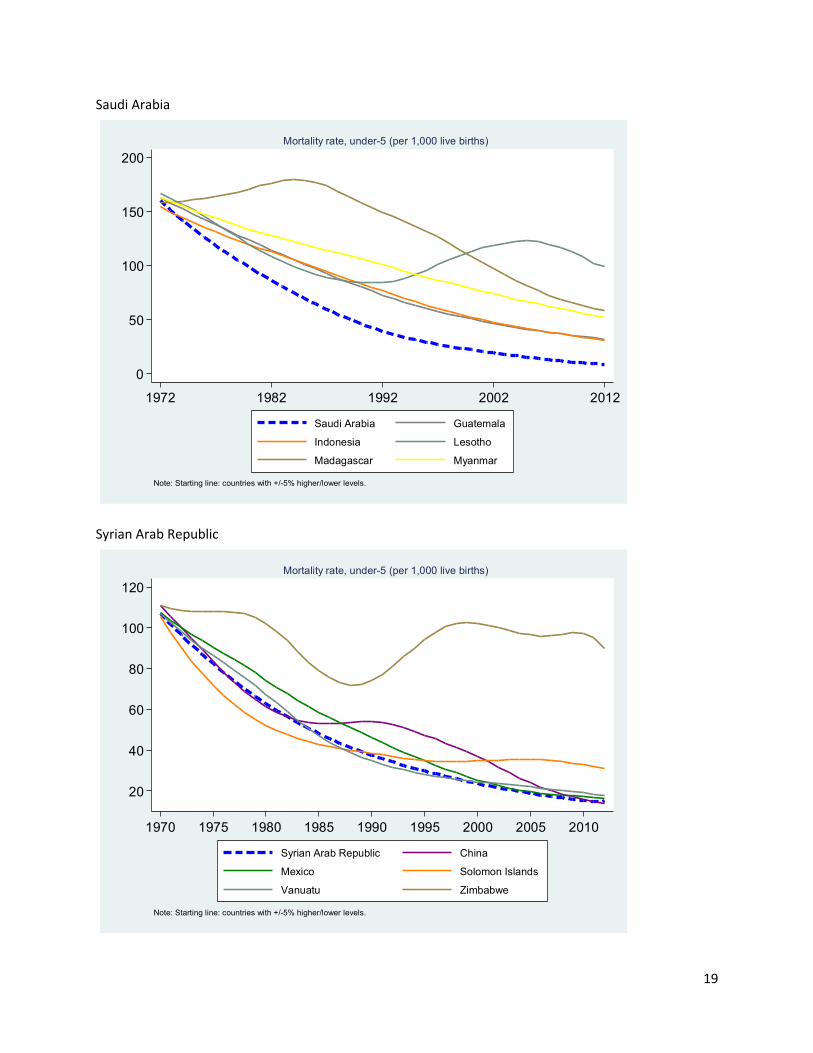
Saudi Arabia
Syrian Arab Republic
0
50
100
150
200
1972 1982 1992 2002 2012
Saudi Arabia Guatemala
Indonesia Lesotho
Madagascar Myanmar
Note: Starting line: countries with +/-5% higher/lower levels.
Mortality rate, under-5 (per 1,000 live births)
20
40
60
80
100
120
1970 1975 1980 1985 1990 1995 2000 2005 2010
Syrian Arab Republic China
Mexico Solomon Islands
Vanuatu Zimbabwe
Note: Starting line: countries with +/-5% higher/lower levels.
Mortality rate, under-5 (per 1,000 live births)
19
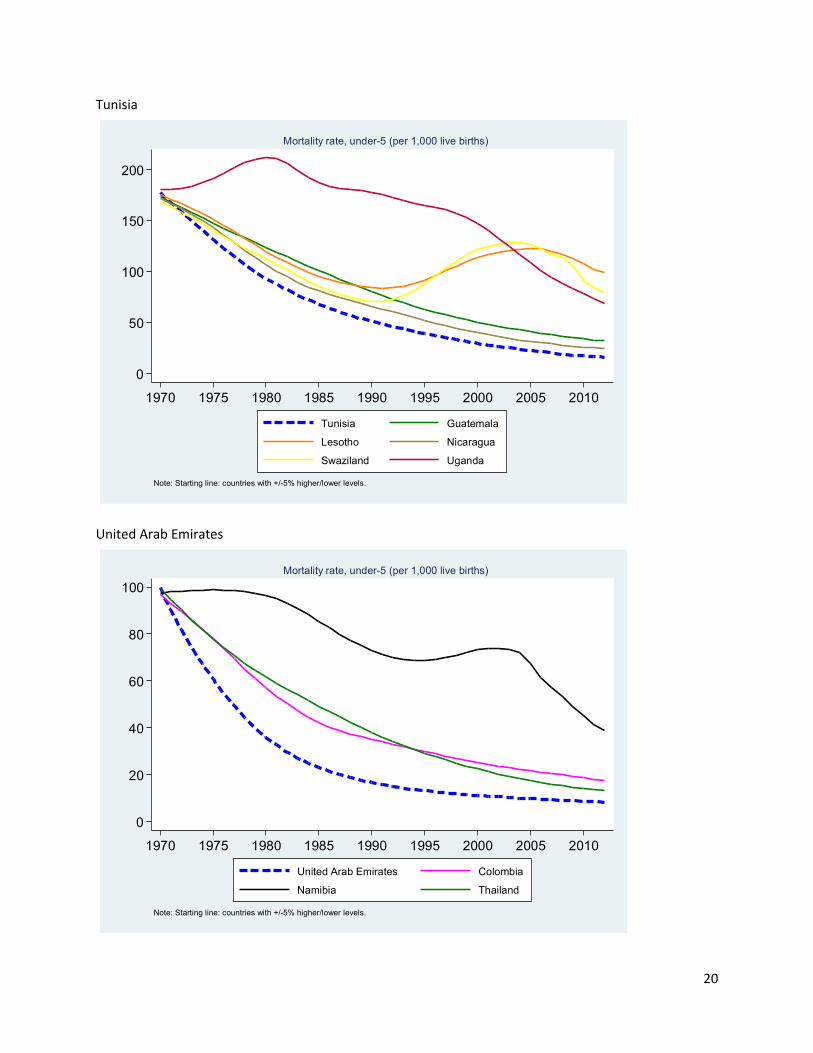
Tunisia
United Arab Emirates
0
50
100
150
200
1970 1975 1980 1985 1990 1995 2000 2005 2010
Tunisia Guatemala
Lesotho Nicaragua
Swaziland Uganda
Note: Starting line: countries with +/-5% higher/lower levels.
Mortality rate, under-5 (per 1,000 live births)
0
20
40
60
80
100
1970 1975 1980 1985 1990 1995 2000 2005 2010
United Arab Emirates Colombia
Namibia Thailand
Note: Starting line: countries with +/-5% higher/lower levels.
Mortality rate, under-5 (per 1,000 live births)
20
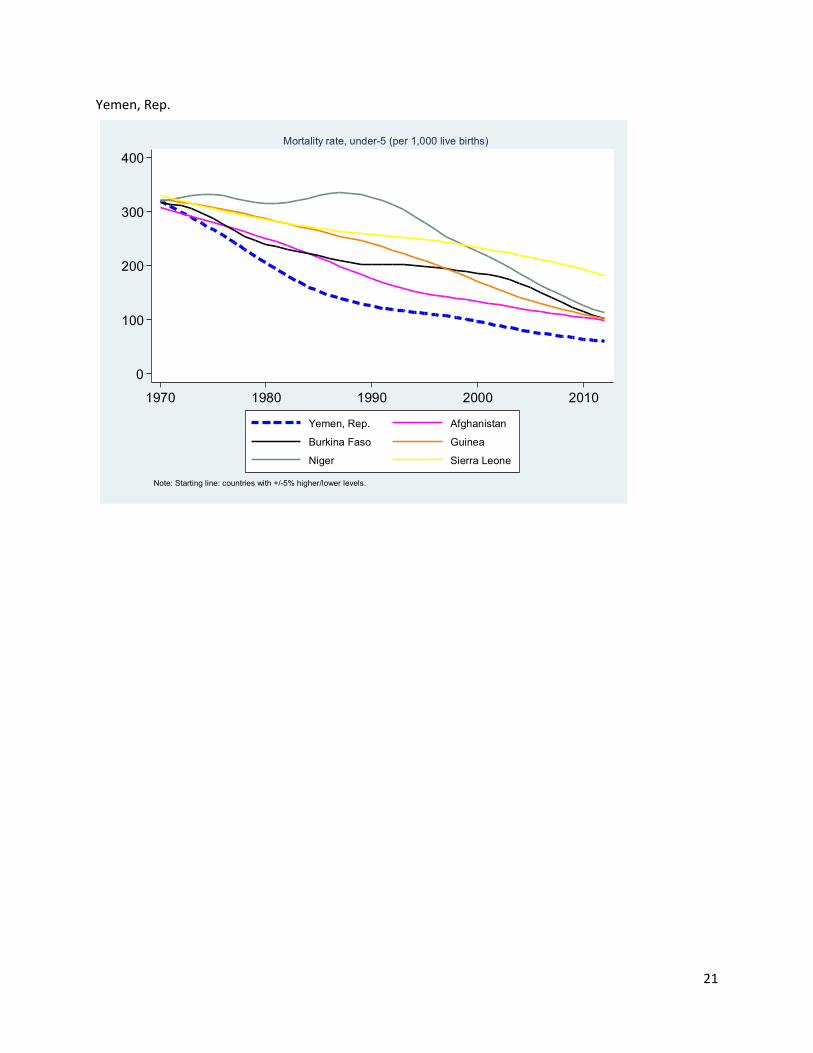
Yemen, Rep.
0
100
200
300
400
1970 1980 1990 2000 2010
Yemen, Rep. Afghanistan
Burkina Faso Guinea
Niger Sierra Leone
Note: Starting line: countries with +/-5% higher/lower levels.
Mortality rate, under-5 (per 1,000 live births)
21
Annex 2: Regional country composition
East Asia and Pacific (EAP): American Samoa, Australia, Brunei Darussalam, Cambodia, China, Fiji, French Polynesia, Guam, Hong Kong SAR, China, Indonesia, Japan, Kiribati, Korea, Dem. Rep., Korea, Rep., Lao PDR, Macao SAR, China, Malaysia, Micronesia, Fed. Sts., Mongolia, Myanmar, New Caledonia, New Zealand, Northern Mariana Islands, Palau, Papua New Guinea, Philippines, Singapore, Solomon Islands, Thailand, Timor-Leste, Tonga, Tuvalu, Vanuatu, Vietnam.
Europe and Central Asia (ECA): Albania, Andorra, Armenia, Austria, Azerbaijan, Belarus, Belgium, Bosnia and Herzegovina, Bulgaria, Channel Islands, Croatia, Cyprus, Czech Republic, Denmark, Estonia, Faeroe Islands, Finland, France, Georgia, Germany, Greece, Greenland, Hungary, Iceland, Ireland, Isle of Man, Italy, Kazakhstan, Kosovo, Kyrgyz Republic, Latvia, Liechtenstein, Lithuania, Luxembourg, Macedonia, FYR, Moldova, Monaco, Montenegro, Netherlands, Norway, Poland, Portugal, Romania, Russian Federation, San Marino, Serbia, Slovak Republic, Slovenia, Spain, Sweden, Switzerland, Tajikistan, Turkey, Turkmenistan, Ukraine, United Kingdom, Uzbekistan.
Latin America and the Caribbean (LAC): Antigua and Barbuda, Argentina, Aruba, Bahamas, The, Barbados, Belize, Bolivia, Brazil, Cayman Islands, Chile, Colombia, Costa Rica, Cuba, Curacao, Dominica, Dominican Republic, Ecuador, El Salvador, Grenada, Guatemala, Guyana, Haiti, Honduras, Jamaica, Mexico, Nicaragua, Panama, Paraguay, Peru, Puerto Rico, Sint Maarten (Dutch part), St. Kitts and Nevis, St. Lucia, St. Martin (French part), St. Vincent and the Grenadines, Suriname, Trinidad and Tobago, Turks and Caicos Islands, Uruguay, Venezuela, RB, Virgin Islands (U.S.).
Middle East and North Africa (MENA): Algeria, Bahrain, Egypt, Arab Rep., Iran, Islamic Rep., Iraq, Jordan, Kuwait, Lebanon, Libya, Morocco, Oman, Qatar, Saudi Arabia, Syrian Arab Republic, Tunisia, United Arab Emirates, West Bank and Gaza, Yemen, Rep.
South Asia (SA): Afghanistan, Bangladesh, Bhutan, India, Maldives, Nepal, Pakistan, Sri Lanka.
Sub-Saharan Africa (SSA): Angola, Benin, Botswana, Burkina Faso, Burundi, Cameroon, Cape Verde, Central African Republic, Chad, Comoros, Congo, Dem. Rep., Congo, Rep., Cote d'Ivoire, Equatorial Guinea, Eritrea, Ethiopia, Gabon, Gambia, The, Ghana, Guinea, Guinea-Bissau, Kenya, Lesotho, Liberia, Madagascar, Malawi, Mali, Mauritania, Mauritius, Mozambique, Namibia, Niger, Nigeria, Rwanda, Sao Tome and Principe, Senegal, Seychelles, Sierra Leone, Somalia, South Africa, Sudan, Swaziland, Tanzania, Togo, Uganda, Zambia, Zimbabwe.
22

Annex 3: Variable definitions and sources
Variable Variable definition Source Child mortality Mortality rate, under-5 (per 1,000 live births) WDI Real per capita GDP growth Annual percentage change in 2005 PPP dollars WDI Health spending to GDP Public spending on health as a % of GDP IMF Average years of schooling Years of formal schooling received per person over age 15 Barro and Lee (2013) Undernourishment Prevalence of undernourishment (% of population) WDI Urbanization Urban population (% of total) WDI
23