Embed Size (px)
Citation preview
1
The relationship between Financial Participation Plans and Company Financial Performance Evidence from a Dutch Longitudinal Panel
Paper for the Mid Year Fellows Conference,
SMLR, Rutgers University NJ, 25 February 2011
DRAFT, Please do not quote
Any comments highly appreciated!
16 February 2011
Geert BRAAM and Erik POUTSMA Institute for Management Research, Nijmegen School of Management
Radboud University, PO Box 9108 HK Nijmegen, Netherlands Tel. +31 24 3611608 / Fax. +31 24 3611933
Correspondence: [email protected]
Abstract
This study investigates the relationship between several forms of financial participation
(profit sharing, stock options and shares) and company financial performance for the period
of 1992 – 2009 comprising 2216 observations. Using a unique dataset of a panel of
companies listed on the Euronext Amsterdam Stock Exchange, we are not only able to
distinguish between forms of participation but also to what extend these plans are narrow-
based, directed to top management and executives only, or broad-based, targeted to all
employees. The panel data allows us also to take into account time lag effects, as profit
sharing is usually said to have short term effects while stock options and share plans are
more targeted to longer term impact. We used accounting and market-based indicators for
company financial performance such as ROE, ROA, earnings per share and dividend yield.
The results of the econometric panel analysis using STATA 10 show that when firm size,
period and fixed firm effects, or industry and random firm effects are controlled for, in
comparison with companies with no plan, broad-based profit sharing and share plans and
combinations of these plans show systematically significant higher positive relationships
with many performance indicators than narrow-based plans. We discuss the findings in light
of future directions of research, in particular also by adding more employment, qualitative
and social performance data.
2
The Influence of Financial Participation on Company Performance.
Evidence from a Dutch Longitudinal Panel
1. Introduction
The growing body of research on the relationship between financial participation and
firm performance indicates that the adoption of schemes which allow for employee
participation in profits and/or share ownership and options plans is often associated with
higher levels of productivity or other outcomes. However, most studies focus on specific
forms of financial participation and do not compare the impact of different forms of financial
participation in one study simultaneously. A second shortcoming of most studies is that they
often use dummies for the existence of a scheme while not specifying the spread and
coverage in the firm. Finally, studies are mainly cross sectional with problems addressing
causality. In this paper we are able to overcome these shortcomings in using a longitudinal
panel of companies with three forms of narrow and broad-based financial participation plans
(profit sharing, share plans and option plans) where we are able to approach the causal
relationship with performance.
The results show that when firm, period, size and industry effects are controlled for,
in comparison with companies with no plan, broad-based profit sharing and share plans
show systematically significant higher positive relationships with many performance
indicators than narrow-based plans. In addition, both the option plans for top management
and the broad-based option plans are negatively related with firm performance in
comparison with companies with no plan. However, broad-based option plans in
combination with broad-based profit sharing plans have the opposite effect on firm
performance, suggesting synergic impacts since one type of plan may compensate for
disadvantages of the other plan.
This study contributes to the literature in several ways …
The remainder of the article is structured as follows. First, we review related
literature and develop hypotheses regarding the relationship between several forms of
financial participation and company financial performance. Next the research method is

3
described, and the results are presented and discussed. Finally, we draw conclusions, discuss
limitations of our study, and point out directions for further research.
2. Literature and hypotheses
Since the 1970s a growing number of studies focused on the relationship between financial
participation and changes in attitudes and behaviour of employees as well as firm
performance. Much of this research originates from experiences in the USA and UK, while
limited amount of research is found in continental Europe and other parts of the world.
Most of the studies focus on one type of financial participation, i.e. profit sharing or
employee share ownership or stock options. In addition, the research is divided in a branch
focussing on schemes for executives separated from the branch of research on so-called
broad-based employee share ownership. Similar theoretical arguments are used for the
impact of narrow and broad-based schemes, such as the agency and incentives approach,
but there are also important differences. We follow Klein (1987) who argues that there are
three main arguments for the impact of financial participation schemes on attitude and
behaviour of employees.
(1) The ownership impact, also called the intrinsic motivating effect; this implies that simply
through the fact of receiving a share of the company employees develop the feeling of co-
ownership and act accordingly. Pierce et al. (1991, 2001, 2003) emphasize the importance of
psychological ownership. The argument is that ownership changes the mindset in such a way
that psychological ownership is developed, which causes changes in attitudes and behaviour.
Several empirical studies support this view (Kaarsemaker, 2006; Pendleton, 2001; Pendleton
et al., 1998; Wagner et al., 2003). This is expressed in extra effort to keep the sustain the
company and the ownership and to protect the company from external threats.
(2) The motivation impact, also called the extrinsic effect; employees deliver extra effort
because they expect to receive an extra reward in the end.
(3) The commitment impact, also called the instrumental effect; through financial
participation and alignment of interests, both employees and employer act upon the
4
common interest. This is expressed by a focus on profit and profitability of the firm, a
willingness to participate in strategic decision making and a focus on cost effective working.
The subsequent literature more or less supports these effects, while other literature
tries to find moderators and intervening variables to clarify the hypothesized effects.
Usually, the behavioural impacts under study are extra effort, cooperation and citizenship
behaviour, turnover and commitment.
Most studies focus on specific forms of financial participation such as employee share
ownership plans (ESOPs), profit sharing (deferred or cash) or stock options. However, there
are important differences between these schemes in nature and in its incentive effects,
especially the difference between shares related schemes and profit sharing arrangements.
The last one is typically directed to the short term (in case of cash) and is an expression of
past performance, while the others are much more directed to the long term and focused on
future performance with some risk included. A profit share is also easier to allocate in cash
which makes the incentive effective more direct and stronger. In addition, there are more
studies on broad-based share plans and broad-based profit share plans than on broad-based
options, partly due to availability of data. Many studies focused on narrow-based option
plans. We now proceed with a short summary of research results.
Since the 1970s a large number of studies looked into the relationship between share
plans and attitudes and behaviour of employees. Most studies were performed in the UK
and USA. Of the more than 50 studies, two third noted a positive relationship with attitudes
and behaviour while the others did not show clear results (Kaarsemaker, 2006). Also the
relationship between share plans and performance is frequently investigated. Since the
1970s, we note more than 70 studies where the research focused on profit, productivity and
ROE. In part the research also used more subjective evaluations of relative performance. A
number of studies deliver overviews of the results (Conte and Svejnar 1990; Dougouliagos
1995; Kruse and Blasi 1997; Pérotin and Robinson 2003). In summary, most studies conclude
a small positive effect of share plans on productivity. This relationship is stronger in case of
broader coverage and spread of shares among employees. However, most studies are cross
sectional which makes drawing conclusions on causal inferences difficult. The few studies
5
that use longitudinal panel data show positive effects *of … on …+ on the longer term (Kruse,
1992, 1993; Fakhfakh & Pérotin, 2000; Jones & Kato, 1995).
The relationship between profit sharing and performance is also investigated many
times. The general outcome is that the relationship is positive. The review and metastudies
of Doucouliagos (1995) and Kruse en Blasi (1997) show in general and for the countries
where the studies are performed, positive significant effect of profit sharing plans on
productivity, while share plans show neutral or weak positive relationships.
The objectives of stock option plans are to attract, motivate and bind executives and
employees. The aim is to attract and commit less risk averse employees who accept that part
of their remuneration lies in the future and is risky (Hall en Murphy, 2002). Because most
employees and top management are risk averse the incentive effect of option plans might
not be substantial. Important is also to what extent options are part of salary or mainly
developed as a perk, an extra bonus. In case of executives and management options may be
a substantial part of salary, while in case of broad-based plans this is usually not the case.
Not much incentive effect is expected from broad-based plans. In addition, like in most
collective rewards, the free rider effect in large groups will lower the performance effect
(Lazear 2002). Another critic on stock option plans is that it might be a very costly type of
remuneration. Since options are risky a risk premium is expected and needed. In case of top
managers this might boost the number of options to cover the risk. If then options should
appear on the profit and loss account, this remuneration might be less cost effective.
Compared with share plans, option plans may be less risky but at the same time it
generates less ownership feelings. Ownership might occur at the point of exercise but in
practice in most cases the shares are sold immediately. Commitment effect of options may
develop as long as the vesting period which is comparable with deferred profit sharing
schemes (in the Netherlands usually 4 years in order to benefit from tax exemption).
Critics suggest that options are not very effective since management may have
possibilities for earnings management where options are part of strategies to extract the
most personal benefits, the ‘rent extraction perspective’ (Bartov and Mohanram, 2004).
Besides, management may use put option to lower the risk of lower benefits. Finally, the
6
move to accounting standards where options are more and more expensed makes option
plans an unfavorable form of remuneration.
Most research on stock options focuses on options for executives and managers and
show mixed results on performance. There are only a few studies that focus on broad-based
plans. In a UK study a positive relation was found between broad option plans and
performance, but due to the nature of the study – cross sectional - the causal order could
not be decided (Conyon en Freeman 2000). A more in depth study is performed by the
Rutgers University (Blasi et al. 2000, Sesil et al. 2001). In this study of USA companies
positive relationships were found between broad-based option plans and a serie of
performance indicators in comparison with companies that have no broad-based plan.
However, the study included many companies from biotechnology en computer industry
where substantial option plans are common; this is not the case in the Netherlands.
Important is to note is that studies do not or cannot make a distinction between
different types of plans. That is, studies cannot conclude if the effect is attributed to the plan
under study while there may be also other plans in place. Moreover, the existence of a
combination of plans may have synergic impacts on performance because one type of plan
may compensate for disadvantages of the other plan. For instance, the short term effect of
profit sharing combined with the longer term effect of share plans; or ownership effects
combined with motivation effects. There are hardly any studies that investigated the
interaction of different plans. Aan exemption might be Robinson & Wilson (2006), who, in
the passing, found that the combination of profit sharing and share plans is positively related
to higher efficiency compared with companies with no plans.
Hypotheses:
Following Klein’s model and the studies discussed, we formulate the following hypotheses.
Share plans have a long term impact due to ownership and commitment. This is dependent
on the amount of shares; in case of top management, the effect may be stronger than in
case of broad-based plans.
H1 Share plans for top management (1a) and broad-based share plans (1b) have a longer
term positive relationship with firm performance.
7
According to the model of Klein profit sharing may have a direct short term motivation
effect. In case of broad-based profit sharing plans the free rider effect may limit the effect.
H2 Profit sharing plans for top management (2a) and broad-based profit sharing plans
(2b) have a short term positive relationship with firm performance.
According to Klein’s model option plans have no clear direction of the impact. These plans
do not develop ownership. Motivation and commitment might be boosted only for the
period before exercise. Due to the larger substance of these plans for top management than
broad-based plans, the effects may only appear with top management plans. However, since
earnings management may manipulate the use of options, the impact on sustained
performance may be limited.
H3 Option plans for top management (3a) and broad-based option plans (3b) have
neutral impact on firm performance on the longer term.
Finally, we can formulate complementarity hypotheses.
H4a Profit sharing plans in combination with share plans are positively associated with firm
performance on the short and longer term.
H4b Profit sharing plans in combination with option plans are positive associated with firm
performance on the short and longer term.
3. Research method
3.1 Sample
In order to test the hypotheses, we used a sample of 2216 observations over an eighteen-
year period for 195 non-financial companies that were publicly listed on the Euronext
Amsterdam Stock Exchange for the period of 1992 – 2009 [accounting years). We excluded
the financial firms because the performance information of financial firms may bias the
results as a consequence of the unique nature of performance measurement in this sector.
8
Our sample is composed of publicly traded firms operating in a variety of different
industries, including 34 different two-digit standard industrial classification (SIC) codes.
To collect the data, we used different sources. First, data on general firm information
and information about firm performance were collected from Amadeus and REACH. The
Amadeus database contains financial information on over 11 million public and private
companies in 41 European countries. REACH (Review and Analysis of Companies in Holland)
a comprehensive database of approximately the 5.000 most important Dutch companies
including financial, historical and marketing data.
Second, data on several forms of financial participation reports were collected from
Company.info. Company.info is a database that contains comprehensive information about
more than 2 million public Dutch firms. Two independent raters with a background in
business administration and economics used content analysis to code the information
disclosed per firm per year in predefined coding categories. For each company they assessed
per year whether the company used the narrow or broad-based financial share plans, profit
sharing and/or option plans. Finally, the data on general firm information and firm
performance and firms’ use of the different types of financial participation plans was merged
yielding a complete data set.
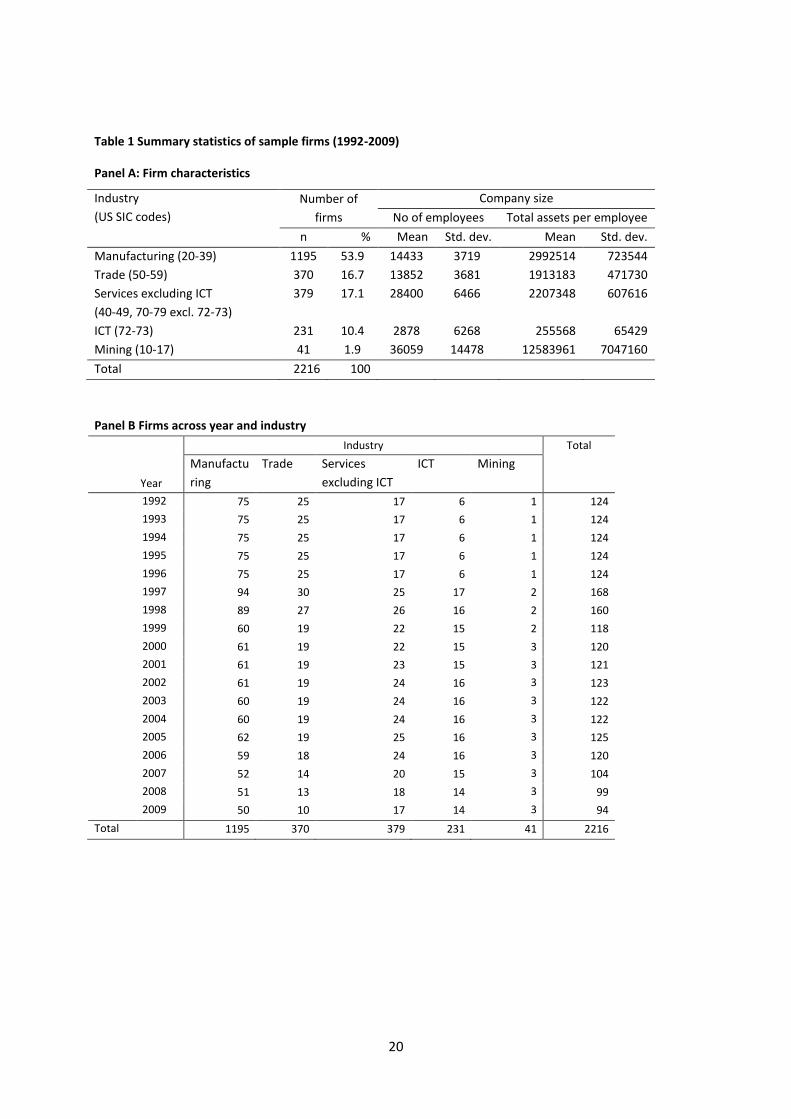
Table 1 presents descriptive statistics. Panel A shows the distribution of sample firms
across industry and size, while Panel B presents that distribution across year and industry. In
Panel A and B we clustered the sample firms in 5 maind industry groups (SIC codes):
Manufacturing (20-39), Trade (50-59), Services excluding ICT ( 40-49, 70-79 excl. 72-73), ICT
(72-73) and Mining (10-17).1 Among these industry groups manufacturing is well
represented with 1025 observations (55%), trade with 335 observations (18%) and services
with 298 observations (16%). ICT has 197 observations (11%), while mining represents two
companies (1%).
[Insert Table 1]
3.2 Variable measurement
3.2.1 Dependent variables
1 Our sample is composed of publicly traded firms operating in a variety of different industries, including 34
different two-digit standard industrial classification (SIC) codes,. However, because for 5 industries we had less than ten observations, we reclassified our sample in these five main groups.
9
To measure firm financial performance we used six different measures of performance that
we classified in three groups: accounting-based, accounting and market-based, and market-
based measures. The accounting-based performance measures Return on equity (ROE) and
Return on assets (ROA) were based on the information disclosed in a company’s (annual)
financial report. The accounting and market-based performance indicators Earnings per
share (Eps) and Shareholders’equity per share (Seps) were calculated using information
disclosed in a company’s financial statements and information on the number of outstanding
shares. Finally, the market-based performance indicators Dividend Yield and Exchange rate
per AEX point reflected a firm’s performance on the stock market. The dividend yield
indicates how high the dividend per share price is, while the exchange rate per AEX-point
indicates the outperformance of the share compared to the AEX index. Please note that
these performance indictors measured different aspects of firm performance. For example,
dividend payments are usually because relatively stable, while share price fluctuate more.
An increase in a firm’s stock exchange price leads to an increase in the exchange rate per
AEX point, but to decreases of the dividend yield, ceteris paribus. Table 2 provides an
overview of the performance indicators.
3.2.1 Independent variables
To assess companies’ use of the different forms of financial participation plans we used
dummy variables. Two independent raters with a background in business administration and
economics used content analysis to code the information disclosed per firm per year. Using
data from Company.info, the raters read the entire contents of the corporate annual reports
to assess whether a company used share plans, profits sharing plans and/or stock option
plans for each year that the company was stock exchange listed. In addition, they assessed
whether these financial plans were narrow-based (top management only) or broad-based
(financial participation plans for management and employees). During these content
analyses some judgment was exercised. To control for subjectivity, in the event of
differences in judgment between the raters, the best interpretation was discussed in a
meeting of the raters and the authors of this paper.
10
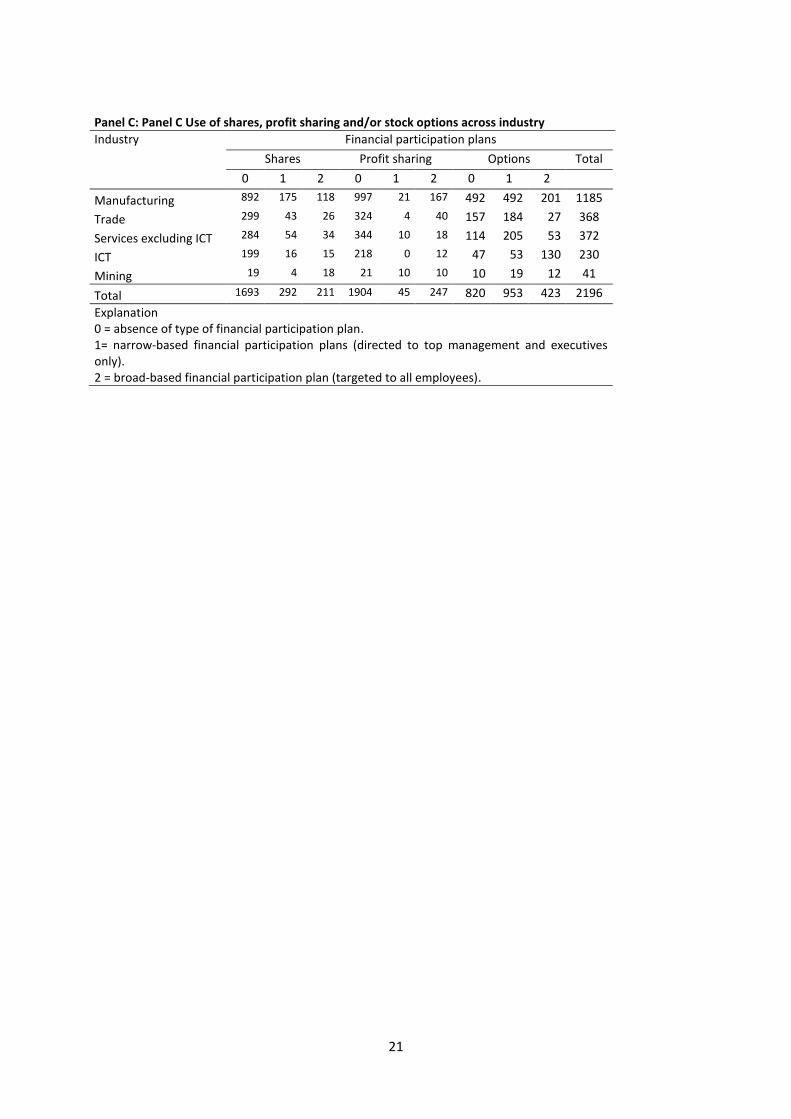
Table 1, Panel C presents the distribution of the sample firms across industry and use
of share plans, profit sharing plans and/or stock option plans. As far as the data were
available, 17%, 14% and 65% of the sample firms used respectively share, profit sharing and
option plans. In addition, Panel C shows whether these financial participation plans used
were narrow- or broad-based. Respectively 8%, 2% and 45% of the firms used narrow-based
share, profit sharing and option plans, while respectively 9%, 12% and 21% of the firms used
broad-based share, profit sharing and option plans.
Data on share plans were collected with a one-year lag effect because share plans
have a longer term effect on firm performance relatively to profit sharing plans. As a
consequence of institutional constraints (tax regulation), options plans have the relatively
longest term impact on firm performance. Data on option plans were collected with a four-
year lag effect. For robustness reasons we also examined the relationships between firm
performance and profit share plans with a one-year lag, share plans with a two-year lag, and
option plans with a three-year and five-year lag. Additional analysis showed that the results
were qualitatively similar when using different time lags for the different forms of financial
participation. We reports the results with profit-sharing plans with no time lag, share plans
with one-year lag and option plans with a four-year lag.
3.2.1 Control variables
We included company size and year dummies, and firm fixed effects as control
variables. The natural logarithm of total assets was included to proxy for the size of the
company. The year dummies were included to control for omitted variables that vary over
time but are constant between the firms. Finally the fixed firm effects were included to
control for omitted variables that differ between the firms but are constant over time. When
the results the Hausman test showed that we could use random effects estimators, we also
included a time-invariant vector of industry dummies to control for industry effects on
company performance.
3.3 Analysis

11
Our hypotheses were tested using panel data regression techniques with Stata 10. Panel
data regression techniques have the advantage to incorporate both the cross-sectional
information reflected in the differences between the firms, and information in the time-
series or within-subject information reflected in the changes within the firms over time
(Wooldridge, 2002). As a consequence, panel data analysis makes it possible to control for
some types of omitted variables, i.e. firm fixed and year effects.
To test our hypotheses, we estimated the following general panel data model:
PERFi,j,t = β0 + β2 STMi,t + β3 SBBi,t + β4 PSTMi,t + β5 PSBBi,t + β6 OTMi,t + β7 OBBi,t
+ β81 STMi,t * PSTMi,t + β82 PSTMi,t * OTMi,t + β83 STMi,t * OTMi,t + β84 STMi,t * PSTMi,t * OTMi,t
+ β91 SBBi,t * PSBBi,t + β92 PSBBi,t * OBBi,t + β93 SBBi,t * OBBi,t + β94 SBBi,t * PSBBi,t * OBBi,t
+ β10 LNTAi,t + β11 FFEi + β12 YEARt + εt
where,
PERFi,j,t = performance of firm i in year t measured by performance indictor j;
with j = Return on equity (ROE); Return on assets (ROA); Earnings per share (Eps); Shareholders’equity per share (Seps); Dividend Yield (DY); Exchange rate per AEX point (EXPAEX).
STMi,t = dummy variable coded as 1 if firm i has narrow-based (top management only) share plans in year t and 0 otherwise;
SBBi,t = dummy variable coded as 1 if firm i has broad-based share plans in year t and 0 otherwise;
PSTMi,t = dummy variable coded as 1 if firm i has narrow-based (top management only) profit sharing plans in year t and 0 otherwise;
PSBBi,t = dummy variable coded as 1 if firm i has broad-based profit sharing plans in year t and 0 otherwise;
OTMi,t = dummy variable coded as 1 if firm i has narrow-based (top management only) option plans in year t and 0 otherwise;
OBBi,t = dummy variable coded as 1 if firm i has broad-based option plans in year t and 0 otherwise;
LNTAi,t = company size measured by its natural logarithm of total assets of firm i in year t;
FFEi = fixed effect of firm i.
YEAR = a vector of year dummies.

12
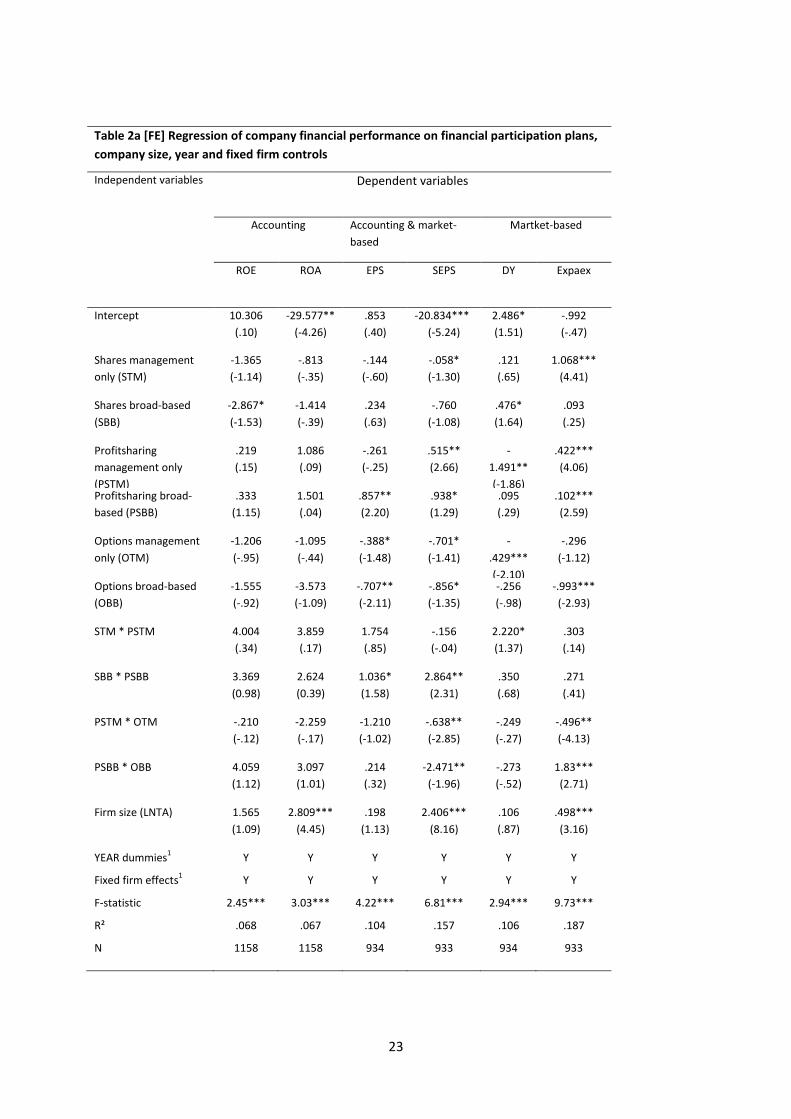
We applied a Hausman test to test whether the random effects estimators were
unbiased. The results of this test showed that when using our dependent variables EPS, SEPS
and Expaex we had to use fixed effect estimators, while random effects estimators could be
used for ROE, ROA and DY. If random effects are present, then the random effects estimator
is preferred for its greater precision. In addition, the random effects estimator permits to
estimate the effects of time-invariant variables. For this reason, we included a vector
industry dummies when using random effects estimators.
13
4. Results
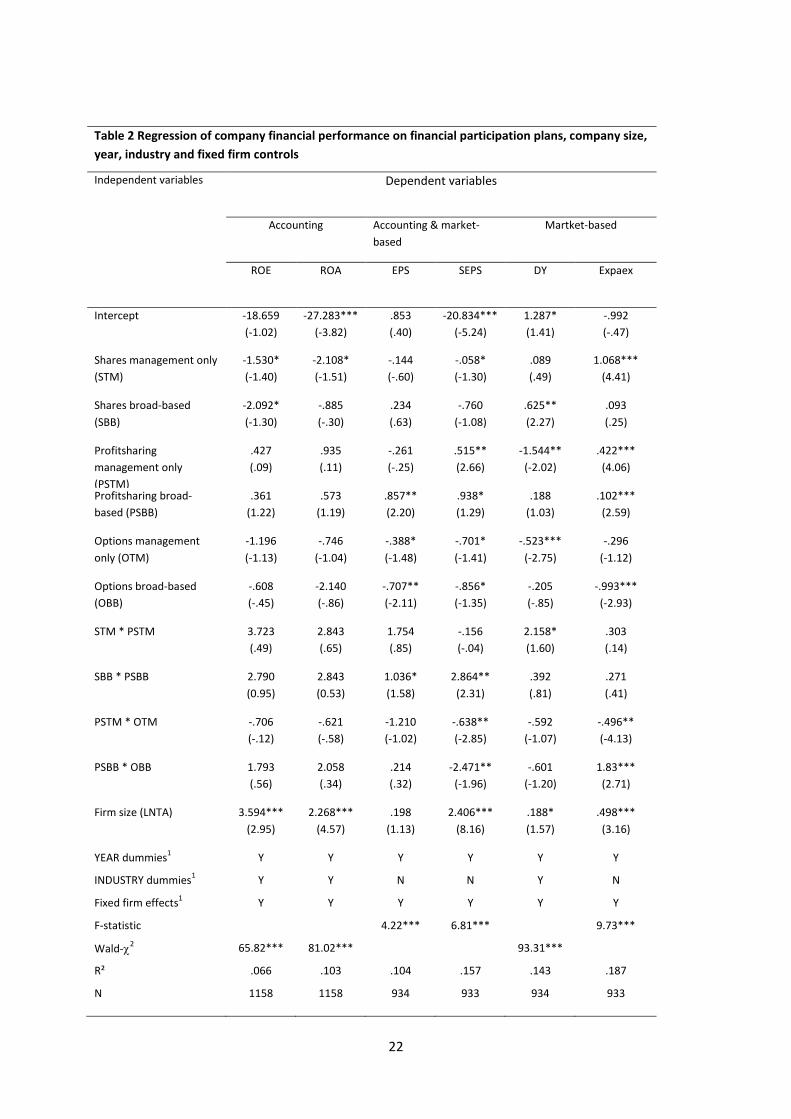
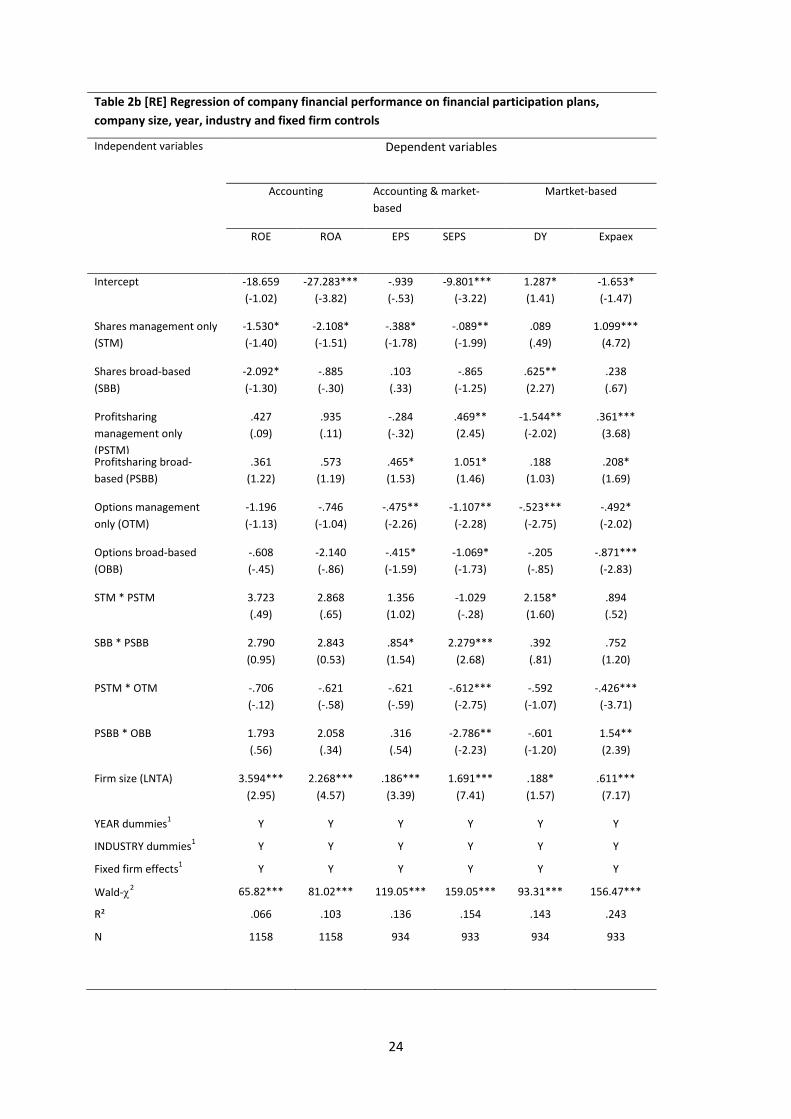
Table 2 reports the results of the regression analyses for the hypothesized
relationships between share, profit sharing and option plans, the combinations of profit
sharing plans and share or option plans, and firm performance.
[Insert Table 2]
H1 predicts a positive longer term relationship between share plans for top
management (1a) and broad-based share plans (1b) and firm performance. Table 2 showed
that the relationships between share plans for top management and company performance
were mixed. The results showed a positive association between narrow-based share plans
and firm performance when the performance was measured with market-based measures
Dividend yield and Exchange rate per AEX point. The coefficients which estimated the
difference between expected performance for firms with and without share plans for top
management once variation in performance related to profit sharing and option plans, firm
size, period and fixed firm effects, or industry and random firm effects had been partialed
out showed that share plans for top management were positively and significantly
associated with Exchange rate per AEX point (β = 1.06, p.<0.01), while its association with
Dividend yield was also positive but not significant. These finding suggest that firms with
narrow-based share plans perform on average significantly better on the stock market than
firms without narrow-based share plans, controlling for all other factors specified in the
model. However, contrary to the expectation, share plans for top management were
significantly negatively related to Shareholders’ equity per share (β = .05, p.<0.10), whereas
its associations with ROE, ROA and Earnings per share were also negative but not significant.
In addition, broad-based share plans were positively related to firm performance
when the performance was measured using the measures Earnings per share, Dividend yield
and Exchange rate per AEX point. The positive association with Dividend yield was significant
(β = 0.62, p.<0.05), while the positive relationships between broad-based employee share
plans and Earnings per share and Exchange rate per AEX point were not significant. Contrary
to the expectations, broad-based share plans were marginally significantly negatively related
to ROE (β = -2.09, p.<0.10), while its association with ROA and Shareholders’ equity per
share were also negative but not significant. Together these results show partial support for
14
H1 suggesting a positive longer term relationship between narrow- and broad-based share
plans and market-based firm performance.
H2 predicts a short term positive relationship between profit sharing plans for top
management (2a) and broad-based profit sharing plans (2b) and firm performance. The
results showed that profit sharing plans for top management were significantly positively
related to Shareholders’ equity per share (β = .55, p.<0.01) and Exchange rate per AEX point
(β = .42, p.<0.01), while its association with ROE and ROA were also positive but not
significant. However, contrary to the expectation, these narrow-based financial participation
plans were negatively related to Earnings per share and Dividend Yield, whereas its
association with Dividend Yield was also significant (β = -1.54, p.<0.05). These findings lead
to rejection of H2a.
Broad-based profit sharing plans were consistently positively related to firm
performance. The associations with Earnings per share (β = .85, p.<0.05), Shareholders’
equity per share (β = .98, p.<0.10) and Exchange rate per AEX point (β = .10,p.<0.01) were
significant, while the relationships with ROE, ROA and Dividend Yield were also positive but
not significant. These findings suggest that, when the other independent variables in the
equations are controlled for, firms with broad-based profit sharing plans on average have a
better short-term performance than firms that do not have these profit sharing plans. It
provides support for H2b suggesting that broad-based profit sharing plans positively
influence company performance.
H3 predicts a neutral impact of option plans for top management (3a) and broad-
based option plans (3b) on firm performance on the longer term. In spite of the fact that we
expected neutral relationships between narrow- and broad-based options plans and firm
performance, our findings consistently showed negative associations between narrow- and
broad-based options plans and the accounting- and market-based firm measures of firm
performance. Option plans for top management were significantly negatively related to
Earnings per share (β = -.38, p.<0.10), Shareholders’ equity per share (β = -.70, p.<0.10) and
Dividend Yield (β = -.53, p.<0.01), while the negative relationship between these narrow-
based participation plans and ROE, ROA and Exchange rate per AEX point were not
significant. Broad-based option plans were significantly negatively associated with Earnings
per share (β = -.70, p.<0.05), Shareholders’ equity per share (β = -.85, p.<0.10) and Exchange
rate per AEX point (β = -.99, p.<0.01). The relationships between broad-based option plans
15
and ROE, ROA and Dividend yield were also negative but not significant. Contrary to our
expectations, these findings thus consistently show negative associations suggesting that
both the option plans for top management and the broad-based option plans have a
negative impact on firm performance on the longer term. As a consequence, we have to
reject H3a and H3b.
Finally, to test whether the existence of these combinations of plans may have
synergic impacts on performance since one type of plan may compensate for disadvantages
of the other plan, H4 predicts that profit sharing plans in combination with narrow- and
broad-based share plans (4a) or option plans (4b) are positively associated with firm
performance on the short and longer term. Table 2 shows the results to test whether the
existence of these combinations of plans may have synergic impacts on performance since
one type of plan may compensate for disadvantages of the other plan. The findings in Table
2 show that profit sharing plans in combination with share plans for top management were
significantly positively associated with Dividend yield (β = 2.158, p.<0.10). At the same time,
the interaction effects of these combinations of narrow-based participation plans are
positively but not significantly related to ROE, ROA, Earnings per share and Exchange rate
per AEX point. However, the interaction effect of profit sharing and share plans for top
management on Shareholders’ equity per share was negatively but relatively small and not
significant. In addition, the results consistently show positive relationships between broad-
based profit sharing plans in combination with share plans and firm performance. The
positive association with Earnings per share (β = 1.03, p.<0.10) and Exchange rate per AEX
point (β = 2.86, p.<0.05) were also significant. These findings suggest that the subset of firm
having both broad-based profit sharing and share plans on average perform better than
firms that do not have these plans, while controlling for all other factors specified in the
model. Together these results provide support for H4a. It suggests that the combinations of
narrow- and broad-based profit sharing and share plans have a positive short and longer
term effect on firm performance.
Finally, table 2 shows the results to test hypothesis H4b, which predicts a positive
association between profit sharing plans in combination with option plans and firm
performance on the short and longer term. Contrary to the expectations, the interaction
effects of the narrow-based combinations of profit sharing and option plans on firm
16
performance were consistently negative. The negative associations between the
combinations of profit sharing and option plans for top management and Shareholders’
equity per share (β = -63, p.<0.05) and Exchange rate per AEX point (β = -.49, p.<0.01) were
also significant.
The relationships between broad-based combinations of profit sharing and option
plans and firm performance were inconsistent. The interaction effect of the combination of
broad-based profit sharing and option plans on Exchange rate per AEX point was positive
and significant (β = 1.83, p.<0.01). However, the interaction effect of the combination of
broad-based profit sharing and option plans on shareholders’ equity per share was
significant but negative (β = -2.47, p.<0.05). The relationships between the combination of
broad-based profit sharing and option plans and ROA, ROA, Earnings per share and Dividend
Yield were not significant.
These findings suggest that narrow-based combinations of profit sharing and option
plans have a negative impact on firm performance on the short and longer term relative to
firms that do not have profit sharing and option plans for top management, while the broad-
based combinations of profit sharing and option plans do not have differential effects on
firm performance. Together these findings lead to the rejection of H4b.
In sum, the results support H2b and H4a and provide partial support for H1. These
findings suggest that broad-based profit sharing and share plans and combinations of these
plans positively affect firm performance relative to firms that do not have these financial
participation plans. Narrow-based share plans and combinations of profit sharing and share
plans for top management positively affect market-based firm performance relative to firms
that do not have these financial participation plans.
5. Conclusion and discussion
This paper assessed the relationship between financial participation and firm
performance using a longitudinal panel of companies with narrow and broad-based financial
participation plans (profit sharing, share plans and option plans). The results show that when
firm, period, size and industry effects are controlled for, in comparison with companies with
no plan, broad-based profit sharing and share plans show systematically significant higher
17
positive relationships with many performance indicators than narrow-based plans. In
addition, both the option plans for top management and the broad-based option plans are
negatively related with firm performance in comparison with companies with no plan.
However, broad-based option plans in combination with broad-based profit sharing plans
have the opposite effect on firm performance, suggesting synergic impacts since one type of
plan may compensate for disadvantages of the other plan.
References
GB: include Bartov and Mohanram, 2004 Blair, M.(1995). Ownership and Control: Rethinking corporate governance for the twenty-first century,
Washington DC: Brookings Institution. Blasi, Joseph and Douglas L. Kruse, 1996, “Employee stock ownership and corporate performance
among public companies”, Industrial & Labor Relations Review, 50, 1; pp. 60-80. Blasi, Joseph, Douglas Kruse, James Sesil, Maya Kroumova, and Ed Carberry. 2000. Stock Options,
Corporate Performance and Organizational Change. Oakland, Ca.: National Center for Employee Ownership. (www.nceo.org/library/optionreport.html )
Conte, M. and Svenjar 1990. ‘The performance effects of employee ownership plans’ In Blinder, A. Paying for Productivity: a Look at the Evidence. Washington DC: Brookings Institution.
Conyon Martin J. and Richard B. Freeman, 2001, “Shared modes of compensation and firm performance: UK evidence”, NBER working paper series.
Doucouliagos, C., 1995, “Worker participation and productivity in labor-managed and participatory capitalist firms: A meta-analysis”, Industrial and Labor Relations Review, 49, 1, pp 58-78.
Estrin, Saul, Paul Grout and Sushil Wadhwani, 1987, “Profit sharing and employee share ownership”, Economic Policy, April, pp.13-62.
Estrin, Saul and Derek C. Jones, 1995, “Worker participation, employee ownership, and productivity: Results from French producer co-operatives”, Advances in the Economic Analysis of Participatory and Labor-Managed Firms, vol 5, pp 3-24.
Estrin, Saul, Derek C. Jones and Jan Svejnar, 1987, “The productivity effects of worker participation: Producer cooperatives in Western Economies,” Journal of Comparative Economics, 11(1), March, pp. 40-61.
Fakhfakh Fathi, 1998, “Sharing schemes and productivity: An empirical analysis based on large French firms using production functions and frontiers”, Advances in the Economic Analysis of Participatory and Labor-Managed Firms, vol 6, pp115-134.
Fakhfakh Fathi and Virginie Pérotin, 2000, “The effects of profit-sharing schemes on enterprise performance in France”, Economic Analysis, 3, 2, pp 93 - 111.
Hall, Brian and Kevin. Murphy, 2002, Stock options for undiversified executives,Journal of Accounting and Economics,
Jones, Derek C. and Takao Kato, 1995, “The productivity effects of employee stock ownership plans and bonuses: Evidence from Japanese panel data”, American Economic Review, 85, 3, pp. 391-414.
18
Jones, Derek C. and Takao Kato, 1993, “On the scope, nature and effects of employee ownership in Japan”, Industrial and Labor Relations Review, 46, pp. 352-367.
Kaarsemaker, E. (2006). Employee Ownership and Human resource Management. A Theoretical and Empirical Treatise with a Digression on the Dutch Context. Doctoral Dissertation, Radboud University: Nijmegen
Kaarsemaker, E., and Poutsma, E. (2006) ‘The Fit of Employee Ownership With Other Human Resource Management Practices: Theoretical and Empirical Suggestions Regarding the Existence of an Ownership High-Performance Work System, or Theory O’. Economic and Industrial Democracy. 27(2) 669-685.
Klein, K. (1987). ‘Employee stock ownership and employee attitudes: a test of three models.’ Journal of Applied Psychology, 72(2), 319-332.
Kruse, 1991 “Profit sharing and employment variability: Microeconomic evidence on the Weitzman theory”, Industrial and Labor Relations Review, 44, pp 437-453.
Kruse, Douglas L, 1992, “Profit sharing and productivity: Microeconomic evidence from the United States”, Economic Journal, 102, 410, pp 24-36.
Kruse, Douglas L., 1993, Profit Sharing - Does It Make a Difference ? Kalamazoo (Mich, US): W.E. Upjohn Institute for Employment Research.
Kruse, Douglas L. and Joseph Blasi, 1997, “Employee ownership, employee attitudes, and firm performance: A review of the evidence”, in David Lewin, Daniel J.B. Mitchell, and Mahmood A. Zaidi (eds.), The Human Resource Management Handbook, Part 1, JAI Press (Greenwich, CT, US).
Kruse, Douglas L., Richard B. Freeman, and Joseph R. Blasi (Eds) (2010) Shared Capitalism at Work Employee Ownership, Profit and Gain Sharing, and Broad-Based Stock Options. Chicago: University of Chicago Press, 2010
Kruse, Douglas L.,1999, “Economic democracy or just another risk for workers? Reviewing the evidence on employee ownership and profit sharing”, paper presented at the Conference on Democracy, Participation and Economic Development, Columbia University, April.
Kruse, Douglas L., 2002, “Research evidence on prevalence and effects of employee ownership”, paper presented in testimony before the Subcommittee on Employer-Employee Relations, Committee on Education and the Workforce, US House of Representatives, 13 Feb. , http://www.nceo.org/library/kruse_testimony.html.
Lazear, Edward P, 1995, Personnel Economics. Cambridge (MA, US): MIT Press. Lazear, Edward, 2002, Output-based pay: incentives, retention or sorting, Unpublished paper, Hoover
Institution and Graduate School of Business, Stanford University Meihuizen, Hanne E., 2000, “Productivity effects of employee stock ownership and employee stock
option plans in firms listed on the Amsterdam stock exchange: An empirical analysis”, paper presented at the 10th congress of the International Association for the Economics of Participation, Trento (Italy).
OECD, 1995, “Profit Sharing in OECD Countries”, Chapter Four, Employment Outlook, pp. 139 – 169. Pendleton, A. (2001). Employee ownership, participation and governance: a study of ESOPs in the UK.
London and New York: Routledge. Pendleton, A. (2005). ‘Employee share ownership, employment relationships, and corporate
governance’ in Harley, B., Hyman, J. and Thompson, P. (eds.) Participation and Democracy at Work: Essays in Honour of Harvie Ramsay. London: Palgrave.
Pendleton, A. (2006). ‘Incentives, Monitoring, and Employee Stock Ownership Plans: New Evidence and Interpretations.’ Industrial Relations, 45(4): 753–777.
Pendleton, A (2009) ‘Employee participation in employee share ownership: an evaluation of the factors associated with participation and contributions in Save As You Earn plans’, British Journal of Management, forthcoming
Pendleton, Andrew, Erik Poutsma, Chris Brewster and Jos van Ommeren, 2001,Employee Share Ownership and Profit Sharing in the European Union. Dublin:European Foundation for the Improvement of Living and Working Conditions.
19
Pendleton, A., Wilson, N. and Wright, M. (1998). ‘The perception and effects of share ownership: empirical evidence from employee buy-outs.’ British Journal of Industrial Relations, 36(1), 99-123.
Pérotin, V. and Robinson, A. (2003). 'Employee participation in profit and ownership: a review of the issues and evidence'. Luxembourg: European Parliament.
Pierce, Jon L., Stephen A. Rubenfeld, and Susan Morgan. Employee ownership: A conceptual model of process and effects. Academy of Management Review, 1991, 16, 121-144.
Pierce, Jon L., Tatiana Kostova, and Kurt T. Dirks. Toward a theory of psychological ownership in organizations. Academy of Management Review, 2001, 26, 298-310.
Pierce, Jon L., Tatiana Kostova, and Kurt T. Dirks. The state of psychological ownership: Integrating and extending a century of research. Review of General Psychology, 2003, 7, 1, 84-107.
Poole, M. (1989). The origins of economic democracy: profit-sharing and employee-shareholding schemes. London: Routledge.
Poutsma, Erik, 2001, Recent Trends in Employee Financial Particiaption in the European Union. Luxembourg: Office for the Official Publications of the European Communities.
Robinson, A., and Wilson, N. (2006). ‘Employee financial participation and productivity: an empirical reappraisal.’ British Journal of Industrial Relations, 44(1), 31-50.
Sesil, James, Maya Kroumova, Joseph Blasi, and Douglas Kruse, 2002, Broad-based employee stock options in US 'new economy' firms, British Journal of Industrial Relations, 40: 273-294.
Uvalic, Milica. 1991. The PEPPER Report: Promotion of Employee Participation in Profits and Enterprise Results, Supplement 3/91, Social Europe. Luxembourg: Office for Official Publications of the European Communities
Vaughan Whitehead, D. (1995) Workers’ Financial Participation: East-West Experiences. Geneva: International Labour Office.
Wagner, S., Parker, C. and Christiansen, N. (2003). ‘Employees that think and act like owners: effects of ownership beliefs and behaviors on organizational effectiveness.’ Personnel Psychology, 56(4), 847-871.
Wooldridge, J.M. (2002). Econometric analysis of cross section and panel data. The MIT Press, Cambridge, Massachusetts.
20
Table 1 Summary statistics of sample firms (1992-2009)
Panel A: Firm characteristics
Industry
(US SIC codes)
Number of
firms
Company size
No of employees Total assets per employee
n % Mean Std. dev. Mean Std. dev.
Manufacturing (20-39) 1195 53.9 14433 3719 2992514 723544
Trade (50-59) 370 16.7 13852 3681 1913183 471730
Services excluding ICT
(40-49, 70-79 excl. 72-73)
379 17.1 28400 6466 2207348 607616
ICT (72-73) 231 10.4 2878 6268 255568 65429
Mining (10-17) 41 1.9 36059 14478 12583961 7047160
Total 2216 100
Panel B Firms across year and industry
Year
Industry Total
Manufactu
ring
Trade Services
excluding ICT
ICT Mining
1992 75 25 17 6 1 124
1993 75 25 17 6 1 124
1994 75 25 17 6 1 124
1995 75 25 17 6 1 124
1996 75 25 17 6 1 124
1997 94 30 25 17 2 168
1998 89 27 26 16 2 160
1999 60 19 22 15 2 118
2000 61 19 22 15 3 120
2001 61 19 23 15 3 121
2002 61 19 24 16 3 123
2003 60 19 24 16 3 122
2004 60 19 24 16 3 122
2005 62 19 25 16 3 125
2006 59 18 24 16 3 120
2007 52 14 20 15 3 104
2008 51 13 18 14 3 99
2009 50 10 17 14 3 94
Total 1195 370 379 231 41 2216
21
Panel C: Panel C Use of shares, profit sharing and/or stock options across industry
Industry
Financial participation plans
Shares Profit sharing Options Total
0 1 2 0 1 2 0 1 2
Manufacturing 892 175 118 997 21 167 492 492 201 1185
Trade 299 43 26 324 4 40 157 184 27 368
Services excluding ICT 284 54 34 344 10 18 114 205 53 372
ICT 199 16 15 218 0 12 47 53 130 230
Mining 19 4 18 21 10 10 10 19 12 41
Total 1693 292 211 1904 45 247 820 953 423 2196
Explanation 0 = absence of type of financial participation plan. 1= narrow-based financial participation plans (directed to top management and executives only). 2 = broad-based financial participation plan (targeted to all employees).
22
Table 2 Regression of company financial performance on financial participation plans, company size,
year, industry and fixed firm controls
Independent variables Dependent variables
Accounting Accounting & market-
based
Martket-based
ROE ROA EPS SEPS DY Expaex
Intercept -18.659
(-1.02)
-27.283***
(-3.82)
.853
(.40)
-20.834***
(-5.24)
1.287*
(1.41)
-.992
(-.47)
Shares management only
(STM)
-1.530*
(-1.40)
-2.108*
(-1.51)
-.144
(-.60)
-.058*
(-1.30)
.089
(.49)
1.068***
(4.41)
Shares broad-based
(SBB)
-2.092*
(-1.30)
-.885
(-.30)
.234
(.63)
-.760
(-1.08)
.625**
(2.27)
.093
(.25)
Profitsharing
management only
(PSTM)
.427
(.09)
.935
(.11)
-.261
(-.25)
.515**
(2.66)
-1.544**
(-2.02)
.422***
(4.06)
Profitsharing broad-
based (PSBB)
.361
(1.22)
.573
(1.19)
.857**
(2.20)
.938*
(1.29)
.188
(1.03)
.102***
(2.59)
Options management
only (OTM)
-1.196
(-1.13)
-.746
(-1.04)
-.388*
(-1.48)
-.701*
(-1.41)
-.523***
(-2.75)
-.296
(-1.12)
Options broad-based
(OBB)
-.608
(-.45)
-2.140
(-.86)
-.707**
(-2.11)
-.856*
(-1.35)
-.205
(-.85)
-.993***
(-2.93)
STM * PSTM 3.723
(.49)
2.843
(.65)
1.754
(.85)
-.156
(-.04)
2.158*
(1.60)
.303
(.14)
SBB * PSBB 2.790
(0.95)
2.843
(0.53)
1.036*
(1.58)
2.864**
(2.31)
.392
(.81)
.271
(.41)
PSTM * OTM -.706
(-.12)
-.621
(-.58)
-1.210
(-1.02)
-.638**
(-2.85)
-.592
(-1.07)
-.496**
(-4.13)
PSBB * OBB 1.793
(.56)
2.058
(.34)
.214
(.32)
-2.471**
(-1.96)
-.601
(-1.20)
1.83***
(2.71)
Firm size (LNTA) 3.594***
(2.95)
2.268***
(4.57)
.198
(1.13)
2.406***
(8.16)
.188*
(1.57)
.498***
(3.16)
YEAR dummies
1 Y Y Y Y Y Y
INDUSTRY dummies
1 Y Y N N Y N
Fixed firm effects1 Y Y Y Y Y Y
F-statistic 4.22*** 6.81*** 9.73***
Wald-
2 65.82*** 81.02*** 93.31***
R² .066 .103 .104 .157 .143 .187
N 1158 1158 934 933 934 933
23
Table 2a [FE] Regression of company financial performance on financial participation plans,
company size, year and fixed firm controls
Independent variables Dependent variables
Accounting Accounting & market-
based
Martket-based
ROE ROA EPS SEPS DY Expaex
Intercept 10.306
(.10)
-29.577**
(-4.26)
.853
(.40)
-20.834***
(-5.24)
2.486*
(1.51)
-.992
(-.47)
Shares management
only (STM)
-1.365
(-1.14)
-.813
(-.35)
-.144
(-.60)
-.058*
(-1.30)
.121
(.65)
1.068***
(4.41)
Shares broad-based
(SBB)
-2.867*
(-1.53)
-1.414
(-.39)
.234
(.63)
-.760
(-1.08)
.476*
(1.64)
.093
(.25)
Profitsharing
management only
(PSTM)
.219
(.15)
1.086
(.09)
-.261
(-.25)
.515**
(2.66)
-
1.491**
(-1.86)
.422***
(4.06)
Profitsharing broad-
based (PSBB)
.333
(1.15)
1.501
(.04)
.857**
(2.20)
.938*
(1.29)
.095
(.29)
.102***
(2.59)
Options management
only (OTM)
-1.206
(-.95)
-1.095
(-.44)
-.388*
(-1.48)
-.701*
(-1.41)
-
.429***
(-2.10)
-.296
(-1.12)
Options broad-based
(OBB)
-1.555
(-.92)
-3.573
(-1.09)
-.707**
(-2.11)
-.856*
(-1.35)
-.256
(-.98)
-.993***
(-2.93)
STM * PSTM 4.004
(.34)
3.859
(.17)
1.754
(.85)
-.156
(-.04)
2.220*
(1.37)
.303
(.14)
SBB * PSBB 3.369
(0.98)
2.624
(0.39)
1.036*
(1.58)
2.864**
(2.31)
.350
(.68)
.271
(.41)
PSTM * OTM -.210
(-.12)
-2.259
(-.17)
-1.210
(-1.02)
-.638**
(-2.85)
-.249
(-.27)
-.496**
(-4.13)
PSBB * OBB 4.059
(1.12)
3.097
(1.01)
.214
(.32)
-2.471**
(-1.96)
-.273
(-.52)
1.83***
(2.71)
Firm size (LNTA) 1.565
(1.09)
2.809***
(4.45)
.198
(1.13)
2.406***
(8.16)
.106
(.87)
.498***
(3.16)
YEAR dummies
1 Y Y Y Y Y Y
Fixed firm effects1 Y Y Y Y Y Y
F-statistic 2.45*** 3.03*** 4.22*** 6.81*** 2.94*** 9.73***
R² .068 .067 .104 .157 .106 .187
N 1158 1158 934 933 934 933
24
Table 2b [RE] Regression of company financial performance on financial participation plans,
company size, year, industry and fixed firm controls
Independent variables Dependent variables
Accounting Accounting & market-
based
Martket-based
ROE ROA EPS SEPS DY Expaex
Intercept -18.659
(-1.02)
-27.283***
(-3.82)
-.939
(-.53)
-9.801***
(-3.22)
1.287*
(1.41)
-1.653*
(-1.47)
Shares management only
(STM)
-1.530*
(-1.40)
-2.108*
(-1.51)
-.388*
(-1.78)
-.089**
(-1.99)
.089
(.49)
1.099***
(4.72)
Shares broad-based
(SBB)
-2.092*
(-1.30)
-.885
(-.30)
.103
(.33)
-.865
(-1.25)
.625**
(2.27)
.238
(.67)
Profitsharing
management only
(PSTM)
.427
(.09)
.935
(.11)
-.284
(-.32)
.469**
(2.45)
-1.544**
(-2.02)
.361***
(3.68)
Profitsharing broad-
based (PSBB)
.361
(1.22)
.573
(1.19)
.465*
(1.53)
1.051*
(1.46)
.188
(1.03)
.208*
(1.69)
Options management
only (OTM)
-1.196
(-1.13)
-.746
(-1.04)
-.475**
(-2.26)
-1.107**
(-2.28)
-.523***
(-2.75)
-.492*
(-2.02)
Options broad-based
(OBB)
-.608
(-.45)
-2.140
(-.86)
-.415*
(-1.59)
-1.069*
(-1.73)
-.205
(-.85)
-.871***
(-2.83)
STM * PSTM 3.723
(.49)
2.868
(.65)
1.356
(1.02)
-1.029
(-.28)
2.158*
(1.60)
.894
(.52)
SBB * PSBB 2.790
(0.95)
2.843
(0.53)
.854*
(1.54)
2.279***
(2.68)
.392
(.81)
.752
(1.20)
PSTM * OTM -.706
(-.12)
-.621
(-.58)
-.621
(-.59)
-.612***
(-2.75)
-.592
(-1.07)
-.426***
(-3.71)
PSBB * OBB 1.793
(.56)
2.058
(.34)
.316
(.54)
-2.786**
(-2.23)
-.601
(-1.20)
1.54**
(2.39)
Firm size (LNTA) 3.594***
(2.95)
2.268***
(4.57)
.186***
(3.39)
1.691***
(7.41)
.188*
(1.57)
.611***
(7.17)
YEAR dummies
1 Y Y Y Y Y Y
INDUSTRY dummies1 Y Y Y Y Y Y
Fixed firm effects1 Y Y Y Y Y Y
256.47*** Wald-
2 65.82*** 81.02*** 119.05*** 159.05*** 93.31*** 156.47***
R² .066 .103 .136 .154 .143 .243
N 1158 1158 934 933 934 933
25
***, ** and * indicate statistical significance at the 1 percent, 5 percent, and 10 percent levels respectively (t-
values in parentheses). H1 and H2 are tested one-tailed; H3 and H4 are tested two-tailed.
Explanation of the variables
Dependent variables: ROE = Return on equity; ROA = return on total assets; Eps= earnings per share; Seps =
Shareholders’equity per share; Dy = dividend yield; Expaex = exchange rate per AEX point.
Independent variables: STM = dummy variable coded as 1 if firm has narrow-based (top management only)
share plans and 0 otherwise; SBB = dummy variable coded as 1 if firm has broad-based share plans and 0
otherwise; PSTM = dummy variable coded as 1 if firm has narrow-based (top management only) profit sharing
plans and 0 otherwise; PSBB = dummy variable coded as 1 if firm has broad-based profit sharing plans and 0
otherwise; OTM = dummy variable coded as 1 if firm has narrow-based (top management only) option plans and
0 otherwise; OBB = dummy variable coded as 1 if firm has broad-based option plans and 0 otherwise; LNTA =
company size measured by firm’s natural logarithm of total assets; YEAR = a vector of year dummies.
INDUSTRY = a vector of industry dummies based on the Standard Industrial Classification System two-digit
code for industry sector; FFE = firm fixed effect.
1 Results on the year dummies, two-digit industry dummies and fixed firm effects are not reported for
parsimony.