Embed Size (px)
Citation preview
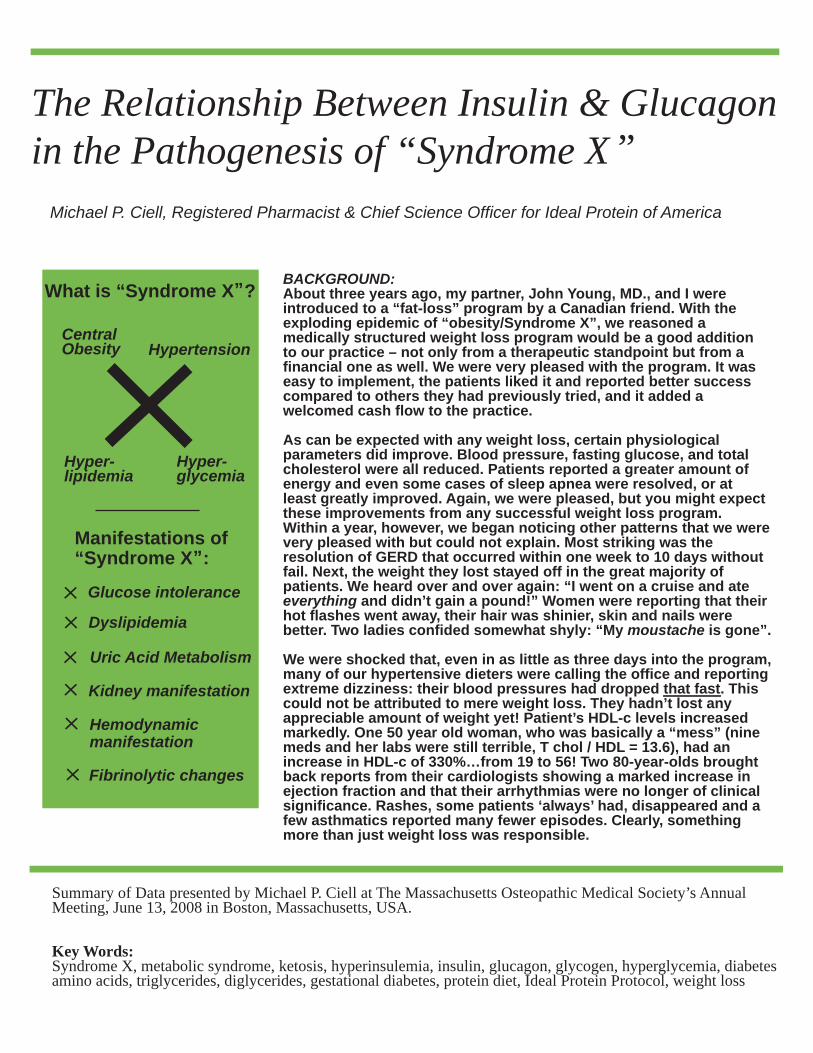
The Relationship Between Insulin & Glucagonin the Pathogenesis of “Syndrome X
BACKGROUND:About three years ago, my partner, John Young, MD., and I were introduced to a “fat-loss” program by a Canadian friend. With the exploding epidemic of “obesity/Syndrome X”, we reasoned a medically structured weight loss program would be a good addition to our practice – not only from a therapeutic standpoint but from a financial one as well. We were very pleased with the program. It was easy to implement, the patients liked it and reported better success compared to others they had previously tried, and it added a welcomed cash flow to the practice.
As can be expected with any weight loss, certain physiological parameters did improve. Blood pressure, fasting glucose, and total cholesterol were all reduced. Patients reported a greater amount of energy and even some cases of sleep apnea were resolved, or at least greatly improved. Again, we were pleased, but you might expect these improvements from any successful weight loss program.Within a year, however, we began noticing other patterns that we were very pleased with but could not explain. Most striking was the resolution of GERD that occurred within one week to 10 days without fail. Next, the weight they lost stayed off in the great majority of patients. We heard over and over again: “I went on a cruise and ate everything and didn’t gain a pound!” Women were reporting that their hot flashes went away, their hair was shinier, skin and nails were better. Two ladies confided somewhat shyly: “My moustache is gone”.
We were shocked that, even in as little as three days into the program, many of our hypertensive dieters were calling the office and reporting extreme dizziness: their blood pressures had dropped that fast. This could not be attributed to mere weight loss. They hadn’t lost any appreciable amount of weight yet! Patient’s HDL-c levels increased markedly. One 50 year old woman, who was basically a “mess” (nine meds and her labs were still terrible, T chol / HDL = 13.6), had an increase in HDL-c of 330%…from 19 to 56! Two 80-year-olds brought back reports from their cardiologists showing a marked increase in ejection fraction and that their arrhythmias were no longer of clinical significance. Rashes, some patients ‘always’ had, disappeared and a few asthmatics reported many fewer episodes. Clearly, something more than just weight loss was responsible.
Michael P. Ciell, Registered Pharmacist & Chief Science Officer for Ideal Protein of America
What is “Syndrome X ?
Summary of Data presented by Michael P. Ciell at The Massachusetts Osteopathic Medical Society’s Annual Meeting, June 13, 2008 in Boston, Massachusetts, USA.
Key Words:Syndrome X, metabolic syndrome, ketosis, hyperinsulemia, insulin, glucagon, glycogen, hyperglycemia, diabetesamino acids, triglycerides, diglycerides, gestational diabetes, protein diet, Ideal Protein Protocol, weight loss
LSU School of Human Ecology, Baton Rouge, LA
Pennington Biomedical ResearchCenter, LSU System, Baton Rouge, LA
Bissoon Institute of Mesotherapy New York, NY
Lionel Bissoon DO
Glucose intolerance
“
Tom S. Guillot MD FACS
Central ObesityNikhil V. Dhurandhar PhD
Ying Yu MS
Hyper-glycemia
Hyper-lipidemia
Hypertension
Manifestations of “Syndrome X :
Dyslipidemia
Uric Acid Metabolism
Kidney manifestation
Hemodynamic manifestation
Fibrinolytic changes
"
“
“
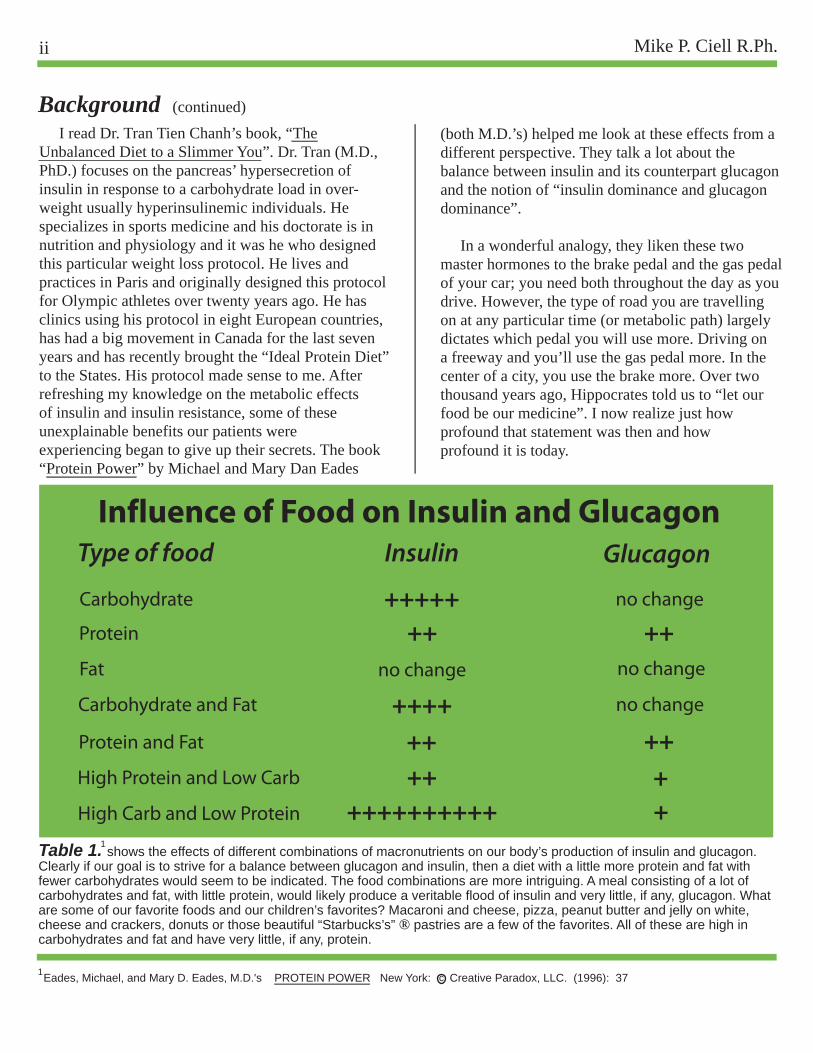
Mike P. Ciell R.Ph.ii
I read Dr. Tran Tien Chanh’s book, “The Unbalanced Diet to a Slimmer You”. Dr. Tran (M.D., PhD.) focuses on the pancreas’ hypersecretion of insulin in response to a carbohydrate load in over-weight usually hyperinsulinemic individuals. He specializes in sports medicine and his doctorate is in nutrition and physiology and it was he who designed this particular weight loss protocol. He lives and practices in Paris and originally designed this protocol for Olympic athletes over twenty years ago. He has clinics using his protocol in eight European countries, has had a big movement in Canada for the last seven years and has recently brought the “Ideal Protein Diet” to the States. His protocol made sense to me. Afterrefreshing my knowledge on the metabolic effects of insulin and insulin resistance, some of theseunexplainable benefits our patients wereexperiencing began to give up their secrets. The book“Protein Power” by Michael and Mary Dan Eades
Background (continued)
Mechanism of Action
Table 1. shows the effects of different combinations of macronutrients on our body’s production of insulin and glucagon.Clearly if our goal is to strive for a balance between glucagon and insulin, then a diet with a little more protein and fat withfewer carbohydrates would seem to be indicated. The food combinations are more intriguing. A meal consisting of a lot ofcarbohydrates and fat, with little protein, would likely produce a veritable flood of insulin and very little, if any, glucagon. Whatare some of our favorite foods and our children’s favorites? Macaroni and cheese, pizza, peanut butter and jelly on white, cheese and crackers, donuts or those beautiful “Starbucks’s” ® pastries are a few of the favorites. All of these are high in carbohydrates and fat and have very little, if any, protein.
Table 1 LipoLaser Demographics
(both M.D.’s) helped me look at these effects from adifferent perspective. They talk a lot about thebalance between insulin and its counterpart glucagonand the notion of “insulin dominance and glucagondominance”.
In a wonderful analogy, they liken these two master hormones to the brake pedal and the gas pedal of your car; you need both throughout the day as youdrive. However, the type of road you are travellingon at any particular time (or metabolic path) largelydictates which pedal you will use more. Driving ona freeway and you’ll use the gas pedal more. In thecenter of a city, you use the brake more. Over twothousand years ago, Hippocrates told us to “let ourfood be our medicine”. I now realize just howprofound that statement was then and how profound it is today.
Influence of Food on Insulin and GlucagonType of food Insulin Glucagon
Carbohydrate
Protein
Fat
Carbohydrate and Fat
Protein and Fat
High Protein and Low Carb
High Carb and Low Protein ++++++++++ ++++
++++no change
+++++++ no change
++no change
no change
++++
1
1Eades, Michael, and Mary D. Eades, M.D.'s PROTEIN POWER New York: Creative Paradox, LLC. (1996): 37c
iiiThe Relationship Between Insulin and Glucagon in the Pathogenesis of “Syndrome X”
Methods
Figure 1
Figure 2
Figure 3
The Roles of Insulin and Glucagon
Type of food
Insulin Glucagon
Carbohydrate
Protein
Fat
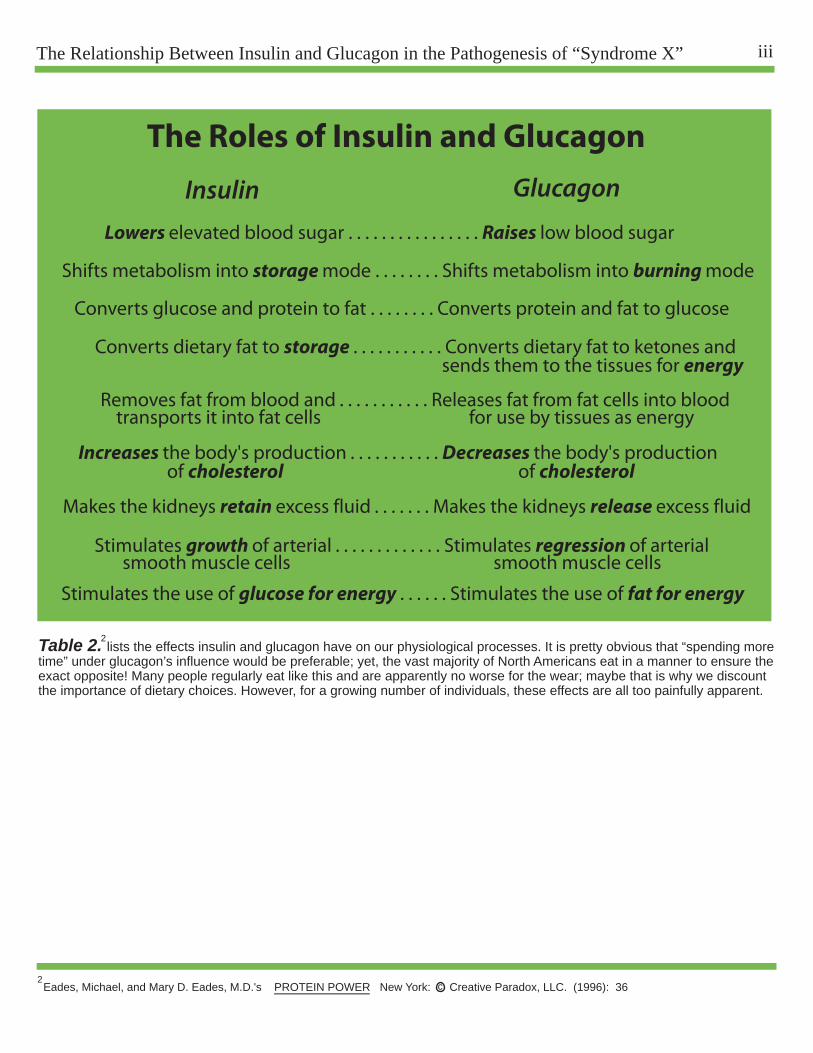
Lowers elevated blood sugar . . . . . . . . . . . . . . . . Raises low blood sugar
Protein and Fat
High Protein and Low Carb
High Carb and Low Protein ++++++++++
++++
++++no change
+++++++ no change
++no change
no change
++++
Shifts metabolism into storage mode . . . . . . . . Shifts metabolism into burning mode
Converts glucose and protein to fat . . . . . . . . Converts protein and fat to glucose
transports it into fat cells for use by tissues as energy
of cholesterol of cholesterol
smooth muscle cells smooth muscle cells
Table 2. lists the effects insulin and glucagon have on our physiological processes. It is pretty obvious that “spending moretime” under glucagon’s influence would be preferable; yet, the vast majority of North Americans eat in a manner to ensure theexact opposite! Many people regularly eat like this and are apparently no worse for the wear; maybe that is why we discountthe importance of dietary choices. However, for a growing number of individuals, these effects are all too painfully apparent.
Eades, Michael, and Mary D. Eades, M.D.'s PROTEIN POWER New York: Creative Paradox, LLC. (1996): 36
2
2c
Converts dietary fat to storage . . . . . . . . . . . Converts dietary fat to ketones and sends them to the tissues for energy
Removes fat from blood and . . . . . . . . . . . Releases fat from fat cells into blood
Increases the body's production . . . . . . . . . . . Decreases the body's production
Makes the kidneys retain excess fluid . . . . . . . Makes the kidneys release excess fluid
Stimulates growth of arterial . . . . . . . . . . . . . Stimulates regression of arterial
Stimulates the use of glucose for energy . . . . . . Stimulates the use of fat for energy
Mike P. Ciell R.Ph.iv
For the last thirty years, the following has been our dietary recommendations: low-fat/no fat (particularly saturated fats), limited fat-free dairy products, and limited red meat, avoid shellfish and organ meats (particularly liver) which are all very high in cholesterol. Don’t consume too many eggs, better to use the whites or “Egg Beaters®”. And above all, base your diet on “complex carbohydrates with at least 60% of your daily caloric intake consisting of whole grains, fruits and vegetables”. The food manufacturers enthusiastically jumped on this and all manners of new “fat-free” products emerged (’fat-free’, by the way, means the product does not contain an appreciable amount of diglycer-ides, which, of course, the body converts intotriglycerides!). Less milk was consumed, beingreplaced with ‘more healthy’ juice drinks and remember the Lender’s® bagel commercial thatsaid: “Lender’s Bagels, who knew they were this good for you?”.
I grew up in the 50’s and 60’s, and we ate considerably different then. Bacon and eggs was the standard breakfast (unless we were running late for school, then we grabbed a bowl of cereal....which didn’t have little pieces of marshmellows and bizarre colors). On Sundays, after church, we had a bigbrunch that consisted of a huge omelet or quicheloaded with some of our garden grown vegetablesand sides of Taylor® pork roll, Habersatt® scrapple(both Philly favorites) or homemade Italian sausage.After school, we drank lots of milk–whole milk,with all the fat-right out of the bottle (unless Momwas around). Thursday night was liver and onions,Friday (the only day we didn’t eat meat) was Mrs.Paul’s® Fish Sticks, or Campbell’s® Oyster Stew(creamy, fatty, loaded with cholesterol and delicious)or if in season, shad roe wrapped in bacon!
From kindergarden through the sixth grade, I attended three different schools. In those seven years,
OBESITY: The Epidemic of the21st Century
Mechanism of Action
Table 1. shows the effects of different combinations of macronutrients on our body's production of insulin and glucagon.Clearly if our goal is to strive for a balance between glucagon and insulin, then a diet with a little more protein and fat withfewer carbohydrates would seem to be indicated. The food combinations are more intriguing. A meal consisting of a lot ofcarbohydrates and fat, with little protein, would likely produce a veritable flood of insulin and very little, if any, glucagon. Whatare some of our favorite foods and our children's favorties? Macaroni and cheese, pizza, peanut butter and jelly on white, cheese and crackers, donuts or those beautiful "Starbucks's" pastries are a few of the favorites. All of these are high in carbohydrates and fat and have very little, if any, protein.
Table 1 LipoLaser Demographics
I recall only FIVE “fat kids”. After forty years, I canstill remember their names–that’s how rate “fat kids”were then! My how things have changed.
Today’s healthy breakfast (not counting Pop Tarts®or Toaster Strudel®) might be a whole wheat bagelwith a glass of fresh, organic orange juice (totalcarbohydrates: 38 grams and 26 grams respectively= 74 grams... not counting and spread on the bagel).A child’s size serving of cereal (1 oz.), eight ouncesof low-fat milk and a glass of “OJ” would yield 25 g+ 12 g + 26 g for a total of 63 g of carbohydrates. Ifwe subtract the grams of dietary fiber (about three ineach case) we have two breakfasts containing 71 and 60 grams of total “impact” carbohydrates.Metabolically speaking, that is the equivalent of 18 and 15 teaspoons of pure sugar respectively. We must realize every four grams of carbohydrates (less gramsof fiber) is turned into a teaspoonful of sugar in ourbodies...sometimes quickly, sometimes a little slower,but that is its end metabolic fate!
Dr. Eades states that a 2200 Kcal daily diet containing 60% carbohydrates is the equivalent of two full cups of sugar. Even if we say a 2500 Kcal (amply allowing for extra fiber) contains two cups of sugar, the fact is startling just the same. School lunch menus (all meticulously balanced by dietitians) usually contain the perennial favorites such as macaroni and cheese, peanut butter and jelly, grilled cheese sandwiches and pizza. Drink choices still include milk, but the juices, sweet teas, sodas and Gatorades® appear to be more popular. How many “fat kids” do we see in our schools today?
The National Institutes of Health’s newsletter (NIH NEWS) and The New England Journal of Medicine both published a study in March of 2005 that warned, for the first time in history, a generation may have a shorter life expectancy than the preceding one. The reason for this is the staggering rate at which obesity is occurring.
Influence of Food on Insulin and Glucagon
Type of food Insulin Glucagon
Carbohydrate
Protein
Fat
Carbohydrate and Fat
Protein and Fat
High Protein and Low Carb
High Carb and Low Protein ++++++++++ ++++
++++no change
+++++++ no change
++no change
no change
++++
R
31
Eades, Michael, and Mary D. Eades, M.D.'s PROTEIN POWER New York: Creative Paradox, LLC. (1996): 37
c
R
R
R
R
R
R
R
R
Olshansky, S., Jay, et. al. “A Protein Decline in Life Expectancy in the United States in the 21st Century.” New Engl J Med. Vol. 352 No. 11 (March 17, 2005): 1138-1145.
3
vThe Relationship Between Insulin and Glucagon in the Pathogenesis of “Syndrome X”
Methods
Figure 1
Figure 2
Figure 3
Type of foodCarbohydrate
Protein
Fat
Protein and Fat
High Protein and Low Carb
High Carb and Low Protein ++++++++++
++++
++++no change
+++++++ no change
++no change
no change
++++
The Roles of Insulin and Glucagon
Insulin Glucagon
Lowers elevated blood sugar . . . . . . . . . . . . . . . . Raises low blood sugar
Shifts metabolism into storage mode . . . . . . . . Shifts metabolism into burning mode
Converts glucose and protein to fat . . . . . . . . Converts protein and fat to glucose
Converts dietary fat to storage . . . . . . . . . . . Converts dietary fat to ketones and sends them to the tissues for energy
Removes fat from blood and . . . . . . . . . . Releases fat from fat cells into the blood transports it into fat cells for use by tissues as energy
Increases the body’s production . . . . . . . . . . Decreases the body’s production of cholesterol of cholesterol
Makes the kidneys retain excess fluid . . . . . . Makes the kidneys release excess fluid
Stimulates the growth of arterial . . . . . . . . . . . . . . Stimulates regression of arterial smooth muscle cells smooth muscle cells
Stimulates the use of glucose for energy . . . . . . Stimulates the use of fat for energy
Levine, S., et. al. “Surge in Childhood Obesity May Threaten a Generation.” The St. Petersburg Times (as published in The Washington Post).(May 20, 2008): 1.
2
4
c
The May 20, 2008 issue of our local paper, The St. Petersburg Times, had a front page article on childhood obesity. It stated among other things: �“Although the rest of the nation is much heavier too,among those ages 6 to 19 the rate of obesity has notjust doubled, as with their parents and grandparents,but has more than tripled.”
Alarming statistics, as well might be expected, give rise to theories and studies. Genetic pre-disposition is a big focus, especially since we have decoded the genome. Although this no doubt may play some role, such a dramatic change in one generation would not be scientifically congruent to support such a genetic shift. A large focus is now being concentrated to hyperglycemia during pregnancy but at levels lower than the diagnostic criteria for diabetes. Two studies recently published in another issue of The New England Journal of Medicine recently explored this. In the first, (The HAPO Study–Hyperglycemia and Adverse Pregnancy Outcomes) 25,505 pregnant women underwent a 75 g glucose tolerance test at 24 to 32 weeks gestation. Data remained blinded if the fasting plasma glucose was 105 mg/dl or less and the two hour plasma glucose was 200 mg/dl or less. Their conclusions were summarized: “Our results indicate strong, continuous associations of maternal glucose levels below those diagnostic of diabetes with increased birth weight and increased cord-blood serum C-peptide levels”.
The second study involved 751 women diagnosedwith gestational diabetes and in the same gestational stage as the above study. They were randomized to be treated with metformin (and insulin if needed) or just insulin alone. The object ofthe study was to judge the safety and efficacy ofmetformin compared to the traditional insulin alone
Obesity Epidemic (continued)
4
5
therapy and to see if there was any effect on the composite outcomes of babies compared to thosewhose mothers received the insulin alone therapy. Theconclusions stated: “In women with gestational diabetes mellitus, metformin (alone or with insulin) is not associated with increased perinatal complications as compared with insulin. The women preferred metfrominto insulin treatment.”
It would logically follow that the next study would be to treat a group of pregnant women with elevated plasma glucose, but at levels below what would be considered diagnostic of gestational diabetes, with metformin/insulin versus a untreated control group. The composite outcomes of the neonates would be compared, and we would see if an indication for treatment of such a population is warranted. In fact, Donald R. Coustan, MD, Professor and Chair of Obstetrics and Gynecology at the Warren Alpert Medical School of Brown University (and one of the authors of the HAPO Study), announced recently that a conference will be held in June to discuss the pro’s and con’s of treating elevated glycemia in pregnancy. He stated: “For now, doctors will still use the glucose threshold that they’re currently using”.
This line of reasoning is rather disturbing in that we are focusing on treating symptoms and ignoring the physiological underpinnings. Hyperglycemia, yet subclinical for a diagnosis of diabetes, is a symptom of what? I would suggest the most likely cause would be insulin resistance brought about by constantly elevated levels of insulin (hyperinsulinemia) due to a diet too rich in carbohydrates. Not once did any of the researchers look at maternal insulin levels nor did they discuss the maternal diet, leaving that, no doubt, to registered dietitians. If that in fact is the case, we’llknow the moms will be getting a diet largely based oncomplex carbohydrates and low in fat and cholesterol
6
7
Metzger, B.E., et. al. “Hyperglycemia and Adverse Pregnancy Outcomes.” N Engl J Med Vol. 358 No. 19 (May 8, 2008): 1191-2002.5
Rowan, J., A., et. al. “Metformin versus Insulin for the Treatment of Gestational Diabetes.” N Engl J Med Vol. 358 No. 19 (May 8, 2008): 2003-20056
Gordan, S., “High Blood Sugar Tied to Pregnancy Complications.” HealthDay News (May 2008): http://www.healthday.com7
Mike P. Ciell R.Ph.vi
(which is usually associated with one ‘skimpy’ in protein). The very diet that will ensure a copioussecretion of insulin! It would have been interestingto have had insulin levels drawn in addition to theplasma glucose–both in the fasting state and two hours post glucose challenge. In our practice, a fasting insulin level above 10 microunits/ml or a two hour post-glucose challenge level above 30 microunits/ml would have automatically caused usto look at the diet. If appropriate, the carbohydratecontent would have been decreased by one-half,making up the calorie deficit with protein and“good” fats and re-testing the patient in one week(adjusting again “PRN”). Here, they are contem-plating administering insulin! The very fact thatmetformin is effective (cases where added insulinwas not required) in tempering their hyperglycemiashould be a diagnostic criterion all by itself that these women are insulin resistant. The liver releasesglycogen when blood glucose becomes low, as normal levels are reached insulin is secreted and this inhibits the further release of glycogen. In aninsulin resistant individual, the liver does not respond to the proper level of insulin and it continues to release glycogen and blood sugar continues to rise. Metformin is used to block the release of glycogen by the liver.
Now, let’s turn our attention to the fetus in all ofthese ‘experiments’. The little human is developingin a proverbial “sea of insulin” due to the mother’shyperinsulinemia. What physiological consequencesmay ensue? Certainly large birth weight, increasedcord-blood C-peptide and hypoglycemia at birthwould be consistent with this, and these are exactlythe types of babies we are seeing. These children,due to the maternal environment, are being born,maybe not genetically, but certainly environmentally,predispositioned to developing insulin resistance atan early age. Following weaning, smashed bananasand rice cereal are some of the first “sweet” foodsgiven to children. All carbohydrates or worse, carbohydrates and fat, is the very combinationguaranteed to produce the most insulin. Then they
OBESITY: The Epidemic of the21st Century
Mechanism of Action
Table 1. shows the effects of different combinations of macronutrients on our body’s production of insulin and glucagon.Clearly if our goal is to strive for a balance between glucagon and insulin, then a diet with a little more protein and fat withfewer carbohydrates would seem to be indicated. The food combinations are more intriguing. A meal consisting of a lot ofcarbohydrates and fat, with little protein, would likely produce a veritable flood of insulin and very little, if any, glucagon. Whatare some of our favorite foods and our children’s favorties? Macaroni and cheese, pizza, peanut butter and jelly on white, cheese and crackers, donuts or those beautiful “Starbucks’s” pastries are a few of the favorites. All of these are high in carbohydrates and fat and have very little, if any, protein.
Table 1 LipoLaser Demographics
graduate to the “Happy Meals” and the “Juicy Juice”and here we go! This, I truly believe, is the root cause of the explosion in childhood obesity we havewitnessed in the last 15 years or so. Mark my words,if these pre-diabetic, hyperglycemic “moms-to-be”are treated with insulin during their pregnancies,the situation will worsen rapidly; that is just thephysiological/biochemical fact of the matter.
The following paper is an examination of “Syndrome X” from the perspective of “glucagon versus insulin dominance”. The biochemistry and cellular physiology described herein comes straight out of medical school textbooks (I even purchased the latest edition of Harper’s Illustrated Biochemistry to be certain everything is up-to-date). Other references cited are from prestigious, peer-reviewed professional journals. Please keep in mind, we will be discussing the pathological condition of “Syndrome X” so many of the dietary recommendations may seem moot or ‘not applicable’ if we view them from a normal physiologic state (“I can eat whatever I want and do just fine, thank you”). We at Ideal Protein of America have a medically designed, precise protocol. As with any other treatment plan, there is a separate protocol for the treatment of the acute condition and a different one for the maintenance phase (in stark contrast to USDA guidelines where “one size fits all”).
We, in America, and the rest of the world is notfar behind, are facing a healthcare crisis of unparalleled scope. “Syndrome X” and all of its co-morbidities have spiralled out of control and continueto get worse not better every year. We cannot affordto keep doing the same things with the same mindsetand expect improvements, in other words, we mustnot be content to merely treat the symptoms whileignoring the underlying pathophysiology of the disease process. The seven year “VADT” Study(Veterans Affairs Diabetes Trial) published in theDecember 18, 2008 edition of The New EnglandJournal of Medicine illustrates this point. Eighteenhundred diabetic veterans at 20 VA medical centers
Influence of Food on Insulin and Glucagon
Type of food Insulin Glucagon
Carbohydrate
Protein
Fat
Carbohydrate and Fat
Protein and Fat
High Protein and Low Carb
High Carb and Low Protein ++++++++++ ++++
++++no change
+++++++ no change
++no change
no change
++++
R
1
Eades, Michael, and Mary D. Eades, M.D.’s PROTEIN POWER New York: Creative Paradox, LLC. (1996): 37
c
RR
RR
R
R
R
R
3
Obesity Epidemic (continued)
1The Relationship Between Insulin and Glucagon in the Pathogenesis of “Syndrome X”
Methods
Figure 1
Figure 2
Figure 3
Type of foodCarbohydrate
Protein
Fat
Protein and Fat
High Protein and Low Carb
High Carb and Low Protein ++++++++++
++++
++++no change
+++++++ no change
++no change
no change
++++
The Roles of Insulin and Glucagon
Insulin Glucagon
Lowers elevated blood sugar . . . . . . . . . . . . . . . . Raises low blood sugar
Shifts metabolism into storage mode . . . . . . . . Shifts metabolism into burning mode
Converts glucose and protein to fat . . . . . . . . Converts protein and fat to glucose
Converts dietary fat to storage . . . . . . . . . . . Converts dietary fat to ketones and sends them to the tissues for energy
Removes fat from blood and . . . . . . . . . . Releases fat from fat cells into the blood transports it into fat cells for use by tissues as energy
Increases the body’s production . . . . . . . . . . Decreases the body’s production of cholesterol of cholesterol
Makes the kidneys retain excess fluid . . . . . . Makes the kidneys release excess fluid
Stimulates the growth of arterial . . . . . . . . . . . . . . Stimulates regression of arterial smooth muscle cells smooth muscle cells
Stimulates the use of glucose for energy . . . . . . Stimulates the use of fat for energy
Levine, S., et. al. “Surge in Childhood Obesity May Threaten a Generation.” The St. Petersburg Times (as published in The Washington Post).(May 20, 2008): 1.
2
4
c
What is “Syndrome X”?
4
5
2
1
Metzger, B.E., et. al. “Hyperglycemia and Adverse Pregnancy Outcomes.” N Engl J Med Vol. 358 No. 19 (May 8, 2008): 1191-2002.5
Rowan, J., A., et. al. “Metformin versus Insulin for the Treatment of Gestational Diabetes.” N Engl J Med Vol. 358 No. 19 (May 8, 2008): 2003-20056
Gordan, S., “High Blood Sugar Tied to Pregnancy Complications.” HealthDay News (May 2008): http://www.healthday.com7
were divided into two groups. One group received“standard treatment” for blood glucose control whilethe other received “intensive control”, mainly through higher doses of medication. At the end of thestudy, the surprising result was that these two groupsdid not vary statistically with respect to cardiac�events nor were there any added benefits for the kidneys or eyes in the “intensively controlled group”.Treating the symptoms of “Syndrome X” (hyperglycemia, hyperlipidemia, hypertension, etc.)pharmacologically is certainly not without merit, butit is not enough and does not address preventativemeasures, unless prescribing “statins” to nine-year-olds is considered to be “preventative medicine”.Understanding the relationship between insulin and glucagon, hyperinsulinemia, the adequate amount of protein in the diet, proper acid/base balancing, therole of inflammation, etc., must be addressed to form atruly comprehensive treatment protocol as well as delineating good preventative guidelines.
A commonly accepted definition of “Syndrome X” might be a generalized disorder whose four hallmark symptoms are hyperglycemia, hyperlipidemia, hypertension and central obesity. Presenting with two of the above is generally considered the diagnostic criteria for this disorder. Gerald Reaven, MD (Professor Emeritus-Active of Medicine at Stanford University) was the first to use the term in 1988, saying he preferred it to names like “Metabolic Syndrome” or the “Deadly Quartet”. He said “many of the manifestations of the disorder might not be considered ‘metabolic’ (i.e. increases in plasminogen activator inhibitor –1 (PAI-1) a factor regulating the process of fibrinolysis), and the “Deadly Quartet” implies obesity is an essential component while many very obese persons may have nothing resembling the syndrome (Sumo wrestlers may be an example)”.
Semantics aside, the real significance of Dr. Reaven’s work was to establish, for the first time, the link between insulin resistance (primarily with regard to insulin stimulated glucose disposal by muscle and insulin regulation of lipolysis in adipose tissue) and the four hallmark symptoms of this syndrome. He reasoned that insulin’s first function will always be to mediate glucose uptake by the muscles. If glucose levels remain elevated (due to the muscles’ insulin resistance) the pancreas will continue to produce more insulin in an attempt to control the high glycemia. Complications now appear because many of the other tissues/organs still retain their sensitivity to insulin.
The kidney is a good example. Insulin stimulates sodium retention by the kidney, thus contributing to waterretention and hypertension. Dr. Reaven cites polycystic ovary syndrome (hypersecretion of androgens from the
ovary) as another example of insulin sensitive organs being affected. Basically the ovary, being constantly exposed to higher than normal levels of insulin, increases its testosterone production accordingly. Thus, the insulin resistance of one tissue with the compensatory hyper-insulinemia that ensues will lead to many other insulin sensitive tissues being affected and complicating the entire physiological picture of that individual. Our complete understanding of this principle is necessary so that a protocol addressing the cause of the problem may be designed, instead of merely treating the symptoms as isolated and unrelated pathologies.
According to Dr. Reaven, “The manifestations of Syndrome X can be divided into six major categories:
1. Glucose intolerance: Individuals with Syndrome X don’t have diabetes, by definition, but their plasma glucose concentration is higher than those individuals who don’t have Syndrome X.2. Dyslipidemia: The characteristic findings are high plasma triglycerides and low HDL-cholesterol. The insulin resistance and compensatory hyperinsulinemia cause the liver to produce more triglyceride rich VLDL, thus increasing the plasma triglyceride concentration. Cholesterol ester transfer protein (CETP) transfers cholesterol from HDL to VLDL, exchanging it for triglycerides. Therefore, the HDL cholesterol falls. The increased VLDL also reduces the ability to remove postprandial newly absorbed chylomicrons. In Syndrome X, VLDL, chylomicrons and their metabolic remnants (chylomicron and VLDL remnants) are removed more slowly from the plasma by virtue of their increased concentrations, resulting in increased postprandial lipemia. In addition, there is a shift in the LDL particle diameter to smaller and denser LDL particles.3. Uric acid metabolism: There is a tendency to increased serum uric acid concentration. There is a decrease in the ability of the kidney to excrete uric acid; therefore, renal uric acid clearance is decreased.4. Kidney manifestation: There is an increased salt retention. It appears that half the patients with hypertension are insulin resistant. From population-based studies, the best predictor of hypertension developing has been hyperinsulinemiaas a surrogate measure of insulin resistance.5. Hemodynamic manifestations: There is evidence that the sympathetic nervous system activity is increased in insulin resistant individuals. This is another example of other tissues reacting to the hyperinsulinemia.6. Fibrinolytic changes: There is an increase in PAI-1, with a resultant decrease in fibrinolysis. The increase in fibrinogen tends to increase coagulation.
All of these manifestations can have some role in the development of coronary heart disease.”
As Dr. Reaven points out, the insulin resistant / hyper-insulinemic patient is at a greatly increased risk for developing CHD. Let’s briefly look at insulin’s role in the mechanisms involved in the etiology of hypertension and CHD.
Mike P. Ciell R.Ph.2
protein). The very diet that will ensure a copioussecretion of insulin! It would have been interestingto have had insulin levels drawn in addition to theplasma glucose--both in the fasting state and two hours post glucose challenge. In our practice, a fasting insulin level above 10 microunits/ml or a two hour post-glucose challenge level above 30 microunits/ml would have automatically cuased usto look at the diet. If appropriate, the carbohydratecontent would have been decreased by one-half,making up the calorie deficit with protein and"good" fats and re-testing the patient in one week(adjusting again "PRN"). Here, they are contem-plating administering insulin! The very fact thatmetformin is effective (cases where added insulinwas not required) in tempering their hyperglycemiashould be a diagnostic criterion all by itself that these women are insulin resistant. The liver releasesglycogen when blood glucose becomes low, as normal levels are reached insulin is secreted and this inhibits the further release of glycogen. In aninsulin resistant individual, the liver does not respond to the proper level of insulin and it continues to release glycogen and blood sugar continues to rise. Metformin is used to block the release of glycogen by the liver.
Now, let's turn our attention to the fetus in all ofthese 'experiments'. The little human is developingin a proverbial "sea of insulin" due to the mother'shyperinsulinemia. What physiological consequencesmay ensue? Certainly large birth weight, increasedcord-blood C-peptide and hypoglycemia at birthwould be consistent with this, and these are exactlythe types of babies we are seeing. These children,due to the maternal environment, are being born,maybe not genetically, but certainly environmentally,predispositioned to developing insulin resistance atan early age. Following weaning, smashed bananasand rice cereal are some of the first "sweet" foodsgiven to children. All carbohydrates or worse, carbohydrates and fat, is the very combination
OBESITY: The Epidemic of the21st Century
Mechanism of Action
Table 1. shows the effects of different combinations of macronutrients on our body's production of insulin and glucagon.Clearly if our goal is to strive for a balance between glucagon and insulin, then a diet with a little more protein and fat withfewer carbohydrates would seem to be indicated. The food combinations are more intriguing. A meal consisting of a lot ofcarbohydrates and fat, with little protein, would likely produce a veritable flood of insulin and very little, if any, glucagon. Whatare some of our favorite foods and our children's favorties? Macaroni and cheese, pizza, peanut butter and jelly on white, cheese and crackers, donuts or those beautiful "Starbucks's" pastries are a few of the favorites. All of these are high in carbohydrates and fat and have very little, if any, protein.
Clinician's Notes
guaranteed to produce the most insulin. Then theygraduate to the "Happy Meals" and the "Juicy Juice"and here we go! This, I truly believe, is the root cause of the explosion in childhood obesity we havewitnessed in the last 15 years or so. Mark my words,if these pre-diabetic, hyperglycemic "moms-to-be"are treated with insulin during their pregnancies,the situation will worsen rapidly; that is just thephysiological/biochemical fact of the matter.
We, in America, and the rest of the world is notfar behind, are facing a healthcare crisis of unparalleled scope. "Syndrome X" and all of its co-morbidities have spiraled out of control and continueto get worse not better every year. We cannot affordto keep doing the same things with the same mindsetand expect improvements, in other words, we mustnot be content to merely treat the symptoms whileignoring the underlying pathophysiology of the disease process. The seven year "VADT" Study(Veterans Affairs Diabetes Trial) published in theDecember 18, 2008 edition of hte New EnglandJournal of Medicine illustrates this point. Eighteenhundred diabetic veterans at 20 VA medical centerswere divided into two groups. One group received"standard treatment" for blood glucose control whilethe other received "intensive control", mainly through higher doses of medication. At the end of thestudy, the surprising result was that these two groupsdid not vary statistically with respect to cardiac�events nor were there any added benefits for the kidneys or eyes in the "intensively controlled group".Treating the symptoms of "Syndrome X" (hyperglycemia, hyperlipidemia, hypertension, etc.)pharmacologically is certainly not without merit, butit is not enough and does not address preventativemeasures, unless prescribing "statins" to nine yearolds is considered to be "preventative medicine".Understanding the relationship between insulin and glucagon, hyperinsulinemia, the adequate amount of protein in the diet, proper acid/base balancing, therole of inflamation, etc., must be addressed to form atruly comprehensive treatment protocol as well as delineating good preventative guidelines.
Influence of Food on Insulin and Glucagon
Type of food Insulin Glucagon
Carbohydrate
Protein
Fat
Carbohydrate and Fat
Protein and Fat
High Protein and Low Carb
High Carb and Low Protein ++++++++++ ++++
++++no change
+++++++ no change
++no change
no change
++++
R
1
Eades, Michael, and Mary D. Eades, M.D.'s PROTEIN POWER New York: Creative Paradox, LLC. (1996): 37
c
RR
RR
R
R
R
R
3
Syndrome X (continued)
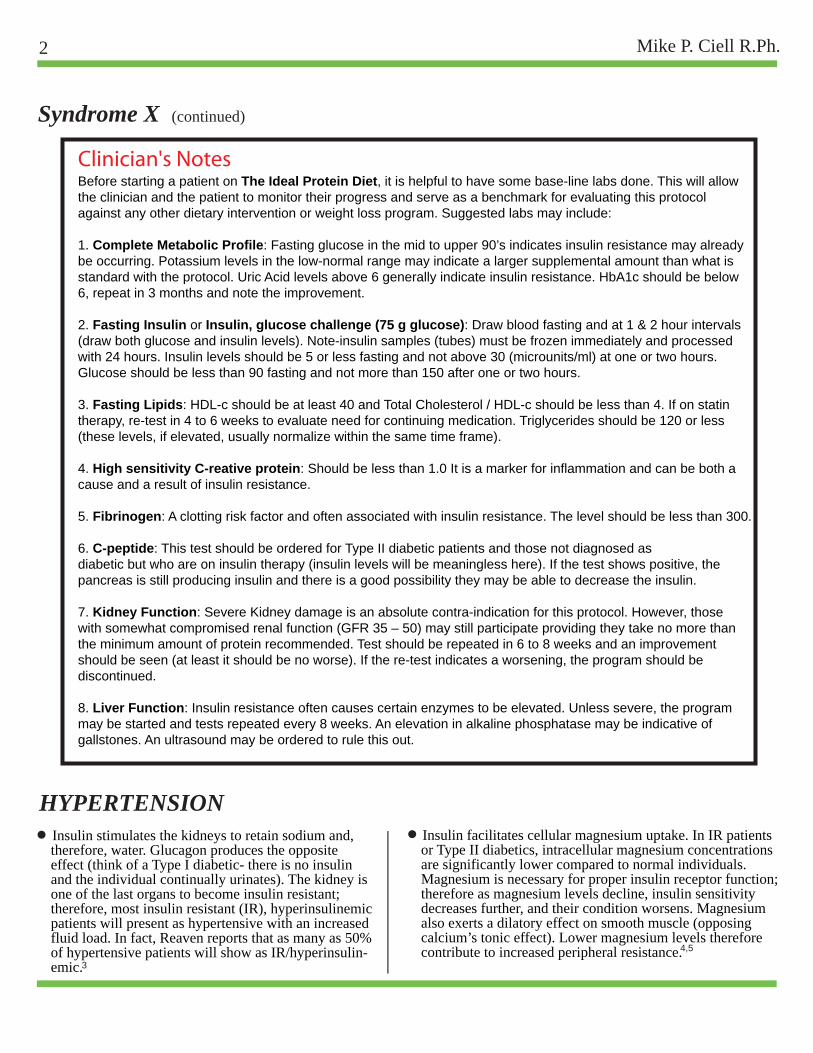
Before starting a patient on The Ideal Protein Diet, it is helpful to have some base-line labs done. This will allow the clinician and the patient to monitor their progress and serve as a benchmark for evaluating this protocol against any other dietary intervention or weight loss program. Suggested labs may include:
1. Complete Metabolic Profile: Fasting glucose in the mid to upper 90’s indicates insulin resistance may already be occurring. Potassium levels in the low-normal range may indicate a larger supplemental amount than what is standard with the protocol. Uric Acid levels above 6 generally indicate insulin resistance. HbA1c should be below 6, repeat in 3 months and note the improvement.
2. Fasting Insulin or Insulin, glucose challenge (75 g glucose): Draw blood fasting and at 1 & 2 hour intervals (draw both glucose and insulin levels). Note-insulin samples (tubes) must be frozen immediately and processed with 24 hours. Insulin levels should be 5 or less fasting and not above 30 (microunits/ml) at one or two hours. Glucose should be less than 90 fasting and not more than 150 after one or two hours.
3. Fasting Lipids: HDL-c should be at least 40 and Total Cholesterol / HDL-c should be less than 4. If on statin therapy, re-test in 4 to 6 weeks to evaluate need for continuing medication. Triglycerides should be 120 or less (these levels, if elevated, usually normalize within the same time frame).
4. High sensitivity C-reative protein: Should be less than 1.0 It is a marker for inflammation and can be both a cause and a result of insulin resistance.
5. Fibrinogen: A clotting risk factor and often associated with insulin resistance. The level should be less than 300.
6. C-peptide: This test should be ordered for Type II diabetic patients and those not diagnosed asdiabetic but who are on insulin therapy (insulin levels will be meaningless here). If the test shows positive, the pancreas is still producing insulin and there is a good possibility they may be able to decrease the insulin.
7. Kidney Function: Severe Kidney damage is an absolute contra-indication for this protocol. However, those with somewhat compromised renal function (GFR 35 – 50) may still participate providing they take no more than the minimum amount of protein recommended. Test should be repeated in 6 to 8 weeks and an improvement should be seen (at least it should be no worse). If the re-test indicates a worsening, the program should be discontinued.
8. Liver Function: Insulin resistance often causes certain enzymes to be elevated. Unless severe, the program may be started and tests repeated every 8 weeks. An elevation in alkaline phosphatase may be indicative of gallstones. An ultrasound may be ordered to rule this out.
HYPERTENSION
Syndrome X (continued)
• Insulin stimulates the kidneys to retain sodium and, therefore, water. Glucagon produces the opposite effect (think of a Type I diabetic- there is no insulin and the individual continually urinates). The kidney is one of the last organs to become insulin resistant; therefore, most insulin resistant (IR), hyperinsulinemic patients will present as hypertensive with an increased fluid load. In fact, Reaven reports that as many as 50% of hypertensive patients will show as IR/hyperinsulin- emic.
• Insulin facilitates cellular magnesium uptake. In IR patients or Type II diabetics, intracellular magnesium concentrations are significantly lower compared to normal individuals. Magnesium is necessary for proper insulin receptor function; therefore as magnesium levels decline, insulin sensitivity decreases further, and their condition worsens. Magnesium also exerts a dilatory effect on smooth muscle (opposing calcium’s tonic effect). Lower magnesium levels therefore contribute to increased peripheral resistance.4,5
3The Relationship Between Insulin and Glucagon in the Pathogenesis of “Syndrome X”
Methods
Figure 1
Figure 2
Figure 3
Type of foodCarbohydrate
Protein
Fat
Protein and Fat
High Protein and Low Carb
High Carb and Low Protein ++++++++++
++++
++++no change
+++++++ no change
++no change
no change
++++
The Roles of Insulin and Glucagon
Insulin Glucagon
Lowers elevated blood sugar . . . . . . . . . . . . . . . . Raises low blood sugar
Shifts metabolism into storage mode . . . . . . . . Shifts metabolism into burning mode
Converts glucose and protein to fat . . . . . . . . Converts protein and fat to glucose
Converts dietary fat to storage . . . . . . . . . . . Converts dietary fat to ketones and sends them to the tissues for energy
Removes fat from blood and . . . . . . . . . . Releases fat from fat cells into the blood transports it into fat cells for use by tissues as energy
Increases the body's production . . . . . . . . . . Decreases the body's production of cholesterol of cholesterol
Makes the kidneys retain excess fluid . . . . . . Makes the kidneys release excess fluid
Stimulates the growth of arterial . . . . . . . . . . . . . . Stimulates regression of arterial smooth muscle cells smooth muscle cells
Stimulates the use of glucose for energy . . . . . . Stimulates the use of fat for energy
Levine, S., et. al. "Surge in Childhood Obesity May Threaten a Generation." The St. Petersburg Times (as published in The Washington Post).(May 20, 2008): 1.
2
7,8,9,10
c
HYPERTENSION (continued)
4
5
11,12,13
6
Metzger, B.E., et. al. "Hyperglycemia and Adverse Pregnancy Outcomes." N Engl J Med Vol. 358 No. 19 (May 8, 2008): 1191-2002.5
Rowan, J., A., et. al. "Metformin versus Insulin for the Treatment of Gestational Diabetes." N Engl J Med Vol. 358 No. 19 (May 8, 2008): 2003-20056
Gordan, S., "High Blood Sugar Tied to Pregnancy Complications." HealthDay News (May 2008): http://www.healthday.com7
• Insulin strongly stimulates the release (or gene expression) of vascular endothelial growth factor (VEGF). This causes proliferation of the smooth muscle cells of the arteries and arterioles making them less elastic and decreasing the lumen diameter; pressure increases and the heart works harder. VEGF expression is also strongly implicated in tumor angiogenesis. Administration of ‘insulin receptor sensitizers’ (i.e. thiazolidendiones: piglitazone (Actos®) or rosiglitazone (Avandia®) can exacerbate this condition. This is particularly dangerous if used in conjunction with insulin therapy. Troglitazone (Rezulin®) was approved in 1997 by the FDA with the indication for use with Type II diabetic patients currently receiving 30 or more units of insulin daily, but whose hyperglycemia was still inadequately controlled (HbA1c greater than 8.5%). In March 2000, Rezulin® was recalled from the market due to concerns (increased deaths) from liver toxicity. Implications in heart failure and ‘adverse cardiovascular events’ from this class of drugs illustrates a point. When we increase a receptors’ sensitivity, we increase the sensitivity of ALL of those receptors not just the ones concerned with the drug’s
main effect. Here, we want the glucose disposing effect of insulin magnified on the muscle cells which have lost their sensitivity to insulin; but, at the same time, we increase insulin’s side-effect profile – maybe dangerously – on other tissues which also respond to insulin but have retained their “original sensitivity” to the hormone.
• Insulin resistance and hyperinsulinemia were strongly correlated with increased levels of aldosterone, renin, and sympathetic hyperactivity in two recent Italian studies and one German study. Increases in aldosterone would lend to potassium wasting, another observation cited, and may in part explain insulin’s sodium sparing effects on the kidney. Conclusions were that these factors may contribute to the cause and maintenance of hypertension in insulin-resistant subjects.
• It has been shown that direct pressure (i.e. fat mass) on the kidney is sufficient to markedly increase blood pressure. Therefore, it has been postulated that the abdominal fat frequently associated with Syndrome X may, in itself, be a direct contributing factor in the etiology of hypertension in this patient population.
Clinician's NotesWhen beginning the Ideal Protein Protocol, the hypertensive patient should be instructed to monitor his/her blood pressure and report any dizziness or orthostatic hypotension. More often than not, these patients will undergo a pronounced diuresis within one week – some within 4 days. The decreased levels of insulin secreted (due to low carbohydrate consumption) seems to have an immediate effect on the kidney which now will function normally and cease to retain sodium.
Adjustments (downward) in doses of anti-hypertensive medications may have to be contemplated. For patients requiring continued anti-hypertensive therapy until an effective weight loss occurs, these modifications have proven beneficial in most cases:
1. D/C thiazide type diuretics (sulfonylureas such as glyburide and tolbutamide and the structurally similar thiazides can compromise fatty acid oxidation in the mitochondria by inhibiting the enzyme carnitine-palmitoyl transferase I). Thus, the full benefit of the “fat-loss” program as well as reduction in plasma triglycerides may not be as pronounced as we would expect.
2. ACE inhibitors are fine, but do not use single tablet combinations with a thiazide (ex. Enalapril is fine, enalapril/HCTZ should be D/C’d).
3. If a diuretic is still needed, consider a low-dose loop-type diuretic (ex. 10 mg furosemide or 0.25 to 0.5 mg bumetanide).
4. If an ACE inhibitor or an ARB is not on the patient’s regimen, consider adding one temporarily OR use a combination of a low-dose loop diuretic with spironolactone 12.5 to 25 mg QD.
5. Hypertensive patients (as well as all patients on this protocol) should be advised to watch for signs of potassium deficiency (i.e muscle weakness or fatigue).
Mike P. Ciell R.Ph.4OBESITY: The Epidemic of the21st Century
Mechanism of Action
Influence of Food on Insulin and Glucagon
Type of food Insulin Glucagon
Carbohydrate
Protein
Fat
Carbohydrate and Fat
Protein and Fat
High Protein and Low Carb
High Carb and Low Protein ++++++++++ ++++
++++no change
+++++++ no change
++no change
no change
++++
R
1
Eades, Michael, and Mary D. Eades, M.D.'s PROTEIN POWER New York: Creative Paradox, LLC. (1996): 37
c
RR
RR
R
R
R
R14
CORNOARY ARTERY DISEASE
Syndrome X (continued)
• As previously stated, insulin stimulates the growth of smooth muscle cells in the walls of the arteries. Glucagon inhibits this.
• Insulin contributes to an increased oxidation of the LDL particle and, in the IR state, a higher average blood sugar level. Both of these result in a greater degree of LDL damage by glycation (the attachment of glucose molecules to the lipoprotein molecule). All of this increases the probability that the altered LDL will become “misdirected” into the arterial wall. Once in the intima of the artery, these damaged LDL particles will attract macrophages. These cells will phagocytize the particles (themselves becoming foam cells), inflam- mation will occur and ultimately incorporating this damaged cholesterol into the forming plaque.
• Insulin increases the production of fibrinogen, the substance that begins the process of clot formation. This material forms web-like strands that trap RBCs, WBCs and platelets as they flow by thickening the blood and thus making it more prone to clot. Coupled with this is the fact that insulin resistance increases expression of PAI-1 (an inhibitor of tPA and uPA/urokinase – so called “clot busters”). In fact, a study published in 2006 concludes ominously that “insulin resistance induced accumulation of PAI-1 in the heart, particularly in the zones of infraction. Such increases may contribute to fibrosis and diastolic dysfunction typical late after infraction in patients with insulin resistance.”
• Glycation, mentioned above, is not just confined to lipoproteins. The term refers to the attachment of glucose to any protein forming so called “AGEs” (advanced glycated end products) and has become a common topic in the area of anti-agingmedicine (the ‘pun’ probably was intended). Thus, glucose may attach to other proteins in the blood making it thicker and “stickier” (actually this is the basis for the HBA1c test which determines glucose control over a three month period i.e. how much glucose was attached to the hemoglobin). Taking all of the above in consideration, it can easily be seen why insulin resistance/hyper- insulinemia poses such a great risk of coronary artery disease in such patients.
• Insulin drives the kidneys to waste magnesium and potassium, which in time, can lead to electrolyte imbalances within cardiac cells and predispose a patient to abnormal cardiac rhythms. An Italian study, published in 2006, looked at electrolytes of a cohort of patients and found that those who later suffered a stroke showed “significantly higher plasma glucose and insulin concentrations, higher creatinine and a modified serum electrolyte pattern characterized by significantly lower
potassium and magnesium levels, and by hypercalcemia and hyperphosphatemia. This pattern is the physiological consequence of the attendant compensatory hyperinsulinemia.”
Obesity is the abnormal accumulation of excess body fat and is almost always linked to excessive caloric intake, but the actual storage of fat is more directly linked to the many physiological effects of the hormones insulin and glucagon. Of course, the extreme example is the Type I diabetic, who in the absence of insulin, can eat continually and still lose weight. As Dr. Eades states, “it’s not a matter of how much is consumed but the result of a complicated interplay among insulin, glucagon and what and how much is consumed.”
“The Flow of Fat”
We burn food via one pathway and store it via another. Both processes can occur simultaneously, but usually one is the predominant metabolic pathway. What is important after time is the net direction of the flow of fat. If the ‘burning pathway’ predominates, you will lose fat. Conversely, if the storage pathway is dominant, you will store fat. This flow of fat arises from three sources: the fat you eat, the fat released from storage by the adipocytes, and the fat you make – mostly from excess carbohydrates and the consequent release of insulin. The fat either goes to the adipocytes for storage or to the muscles and other tissues to be oxidized for energy. The good news, and the core of the Ideal Protein Protocol, is that you can regulate which biochemical pathway the fat goes down simply by your choice of foods. Your food choices will determine if you are insulin dominant or glucagon dominant!
Regulating the ‘Flow of Fat’
• Fat moves through the blood as triacylglycerols (triglycerides) which are composed of three molecules of fatty acids attached to a glycerol molecule.
• At the cellular surfaces of muscle cells, heart cells, liver cells and other tissues, there are enzymes that break-off the fatty acids from the glycerol; and the free fatty acid can now enter the cell’s cytoplasm.
• Once in the cytoplasm, they can enter the mitochondria to be oxidized for energy, but it is here that they encounter the first hormonal regulation point: the outer mitochondrial membrane.
• To enter the mitochondria, they need L-carnitine (a molecule that acts as a ‘shuttle’ to carry the fatty acids across the membrane). The ‘shuttle’ is an enzyme called carnitine-palmitoyl transferase I.
15
OBESITY
16
18
17
5The Relationship Between Insulin and Glucagon in the Pathogenesis of “Syndrome X”
Methods
Figure 1
Figure 2
Figure 3
Type of foodCarbohydrate
Protein
Fat
Protein and Fat
High Protein and Low Carb
High Carb and Low Protein ++++++++++
++++
++++no change
+++++++ no change
++no change
no change
++++
The Roles of Insulin and Glucagon
Insulin Glucagon
Lowers elevated blood sugar . . . . . . . . . . . . . . . . Raises low blood sugar
Shifts metabolism into storage mode . . . . . . . . Shifts metabolism into burning mode
Converts glucose and protein to fat . . . . . . . . Converts protein and fat to glucose
Converts dietary fat to storage . . . . . . . . . . . Converts dietary fat to ketones and sends them to the tissues for energy
Removes fat from blood and . . . . . . . . . . Releases fat from fat cells into the blood transports it into fat cells for use by tissues as energy
Increases the body's production . . . . . . . . . . Decreases the body's production of cholesterol of cholesterol
Makes the kidneys retain excess fluid . . . . . . Makes the kidneys release excess fluid
Stimulates the growth of arterial . . . . . . . . . . . . . . Stimulates regression of arterial smooth muscle cells smooth muscle cells
Stimulates the use of glucose for energy . . . . . . Stimulates the use of fat for energy
Levine, S., et. al. "Surge in Childhood Obesity May Threaten a Generation." The St. Petersburg Times (as published in The Washington Post).(May 20, 2008): 1.
2
4
c
OBESITY (continued)
4
5
22
19
Metzger, B.E., et. al. "Hyperglycemia and Adverse Pregnancy Outcomes." N Engl J Med Vol. 358 No. 19 (May 8, 2008): 1191-2002.5
Rowan, J., A., et. al. "Metformin versus Insulin for the Treatment of Gestational Diabetes." N Engl J Med Vol. 358 No. 19 (May 8, 2008): 2003-20056
Gordan, S., "High Blood Sugar Tied to Pregnancy Complications." HealthDay News (May 2008): http://www.healthday.com7
• Insulin inhibits this enzyme (‘the shuttle system’) and the fatty acids cannot enter the mitochondria. Basically they are re-routed to the adipocytes for storage via the bloodstream after first being reconstituted to triglycerides.
• Glucagon, as might be expected, has the opposite effect. It mobilizes stored energy so that it is readily available for ‘cellular fuel’. Not only does glucagon cause the release of glycogen from the muscles and liver, but it also enhances the activity of CPT-1(the carnitine shuttle) thus greatly increasing the rate at which the free fatty acids can enter the mitochondria. Therefore under glucagon’s influence, the ‘flow of fat’ is directed to the mitochondria of energy producing cells and away from the fat repositories of the adipocytes.
• The physiology of the fat cell (the adipocyte) is a little different. These are merely storage vats for fat globules. Again, at the surface of these cells, enzymes are present – exquisitely regulated by insulin and glucagon. Their function is to control the flow of fat either into the adipocyte for storage or release stored fuel (fat) into the circulation so that it can be available as an energy source. Lipoprotein-lipase causes fatty acids to enter the fat cell – and keeps them there! Two other enzymes, Hormone- sensitive lipase (HSL) and the recently discovered Adipose-triglyceride Lipase (ATGL) do the exact opposite: they release fat from the adipocyte. Insulin enhances the action of Lipoprotein lipase and glucagon inhibits its action. Likewise, glucagon stimulates the activities of HSL and ATGL, while insulin inhibits these two enzymes. A study published in the Journal of Chemical Endocrinology and Metabolism (June 2007) showed that the expression of HSL and ATGL was greatly suppressed in the obese, insulin resistant state.
• Due to a particularly “cruel little twist” of physiology, the very act of losing weight, increases the activity of the ‘fat storing’ Lipoprotein lipase and keeps it at a high level of activity for several months (probably some evolutionary survival mechanism). If we now add insulin to this already “ramped-up” enzyme (which will even increase its activity further) it becomes easy to understand why 95% of people who have successfully lost weight regain it! These poor souls, usually acting under the advice of well meaning professionals, rely on a “healthy balanced diet” usually consisting of a diet based on complex carbohydrates and very low amounts of fat-the very food combination that assures a copious secretion of insulin! Because of these guidelines, the medical community as a whole has greater success treating cancer than it does treating obesity/Syndrome X. As the doctors Eades point out, “it’s amazing that even
5% of successful dieters manage to keep it off – but that may correlate with the percentage of overweight people who don’t have hyperinsulinemia and IR.”
What About Diet Pills?
When an overweight, insulin resistant individual begins a diet, episodes of reactive hypoglycemia are likely to occur. This is particularly true if the dieter chooses a hypocaloric regimen based on high carbohydrates and little fat. They consume the carbohydrates, the body produces an exaggerated amount of insulin in turn, their blood sugar drops and they get severe cravings and eat again (they can’t help it). The rationale for prescribing “catecholamine analogs” (such as phenteramine or benzadrine – ‘in the old days’) is two-fold. First, it will ameliorate the hunger. Second, it will enhance the catabolic processes of lipolysis, glycogenolysis and gluconeogenesis (‘speeds up the metabolism’). This seems logical and dieters do lose weight on programs such as this.
We know when the blood glucose falls the body responds in many ways. Glucagon is secreted by the pancreas and the adrenals produce norepinephrine, epinephrine (a.k.a. adrenaline) both catecholamines and cortisol. This causes glycogen to be released by the liver and free fatty acids are released due to the stimulation of HSL by glucagon and the catecholamines (epi and norepi).
A study published in 2001 investigated the roles of catecholamines on HSL (by the way hormone-sensitive lipase was named because it responds to a variety of substances like the hormones insulin and glucagon and the catecholamines). Basically two groups of subjects, one with ‘normal’ levels of insulin and the other with higher levels of insulin, were exposed to endogenous catecholamines (secretion of which was induced by stressing the subjects). Fasting plasma free fatty acid concentrations were similar in both groups. Ten minutes after initiating stress, plasma FFA levels increased 53% in the normal insulin group while the FFA levels of the insulin dominant subjects remained unchanged. It may be inferred by this that insulin overrides any stimulation of HSL induced by catecholamines; therefore, the weight loss most affected by using “diet drugs” may be more of lean muscle mass (via glycogenolysis and gluconeogenesis) rather than the loss of fat. Losing muscle mass in the Ideal Protein Protocol is unacceptable. This will lower the metabolic rate so maintaining the weight loss will be even more difficult. Moreover, it is dangerous. The cardiovascular risks previously described for hyperinsulinemic individuals makes giving stimulants a “dicey” business. The “Phen-Fen” protocol is a great example of how risky this can be…remember, the heart is a muscle!
20
21
6 Mike P. Ciell R.Ph.
Methods
Figure 1
Figure 2
Figure 3
Type of foodCarbohydrate
Protein
Fat
Protein and Fat
High Protein and Low Carb
High Carb and Low Protein ++++++++++
++++
++++no change
+++++++ no change
++no change
no change
++++
The Roles of Insulin and Glucagon
Insulin Glucagon
Lowers elevated blood sugar . . . . . . . . . . . . . . . . Raises low blood sugar
Shifts metabolism into storage mode . . . . . . . . Shifts metabolism into burning mode
Converts glucose and protein to fat . . . . . . . . Converts protein and fat to glucose
Converts dietary fat to storage . . . . . . . . . . . Converts dietary fat to ketones and sends them to the tissues for energy
Removes fat from blood and . . . . . . . . . . Releases fat from fat cells into the blood transports it into fat cells for use by tissues as energy
Increases the body's production . . . . . . . . . . Decreases the body's production of cholesterol of cholesterol
Makes the kidneys retain excess fluid . . . . . . Makes the kidneys release excess fluid
Stimulates the growth of arterial . . . . . . . . . . . . . . Stimulates regression of arterial smooth muscle cells smooth muscle cells
Stimulates the use of glucose for energy . . . . . . Stimulates the use of fat for energy
Levine, S., et. al. "Surge in Childhood Obesity May Threaten a Generation." The St. Petersburg Times (as published in The Washington Post).(May 20, 2008): 1.
2
4
c
KETOGENESIS/KETOSIS
4
5
24
23
Metzger, B.E., et. al. "Hyperglycemia and Adverse Pregnancy Outcomes." N Engl J Med Vol. 358 No. 19 (May 8, 2008): 1191-2002.5
Rowan, J., A., et. al. "Metformin versus Insulin for the Treatment of Gestational Diabetes." N Engl J Med Vol. 358 No. 19 (May 8, 2008): 2003-20056
Gordan, S., "High Blood Sugar Tied to Pregnancy Complications." HealthDay News (May 2008): http://www.healthday.com7
• Insulin inhibits this enzyme (‘the shuttle system’) and the fatty acids cannot enter the mitochondria. Basically they are re-routed to the adipocytes for storage via the bloodstream after first being reconstituted to triglycerides.
• Glucagon, as might be expected, has the opposite effect. It mobilizes stored energy so that it is readily available for ‘cellular fuel’. Not only does glucagon cause the release of glycogen from the muscles and liver, but it also enhances the activity of CPT-1(the carnitine shuttle) thus greatly increasing the rate at which the free fatty acids can enter the mitochondria. Therefore under glucagon’s influence, the ‘flow of fat’ is directed to the mitochondria of energy producing cells and away from the fat repositories of the adipocytes.
• The physiology of the fat cell (the adipocyte) is a little different. These are merely storage vats for fat globules. Again, at the surface of these cells, enzymes are present – exquisitely regulated by insulin and glucagon. Their function is to control the flow of fat either into the adipocyte for storage or release stored fuel (fat) into the circulation so that it can be available as an energy source. Lipoprotein-lipase causes fatty acids to enter the fat cell – and keeps them there! Two other enzymes, Hormone- sensitive lipase (HSL) and the recently discovered Adipose-triglyceride Lipase (ATGL) do the exact opposite: they release fat from the adipocyte. Insulin enhances the action of Lipoprotein lipase and glucagon inhibits its action. Likewise, glucagon stimulates the activities of HSL and ATGL, while insulin inhibits these two enzymes. A study published in the Journal of Chemical Endocrinology and Metabolism (June 2007) showed that the expression of HSL and ATGL was greatly suppressed in the obese, insulin resistant state.
• Due to a particularly “cruel little twist” of physiology, the very act of losing weight, increases the activity of the ‘fat storing’ Lipoprotein lipase and keeps it at a high level of activity for several months (probably some evolutionary survival mechanism). If we now add insulin to this already “ramped-up” enzyme (which will even increase its activity further) it becomes easy to understand why 95% of people who have successfully lost weight regain it! These poor souls, usually acting under the advice of well meaning professionals, rely on a “healthy balanced diet” usually consisting of a diet based on complex carbohydrates and very low amounts of fat-the very food combination that assures a copious secretion of insulin! Because of these guidelines, the medical community as a whole has greater success treating cancer than it does treating obesity/Syndrome X. As the doctors Eades point out, “it’s amazing that even 5% of successful dieters manage to keep it off – but that
One must keep in mind, that although fats are both oxidized to acetyl-CoA and synthesized from acetyl Co-A, they are not simply the reverse of the same biochemical reaction! These processes take place in two different compartments of the cell: (1) Fats are made in the cytosol and oxidized in the mitochondria. (2) Fats get ‘burnt’ under glucagon’s influence and created under insulin’s influence.
Under certain conditions such as starvation, untreated Type I diabetes, or going on a carbohydrate restricted diet, the body is forced to utilize stored or dietary fat and protein (again dietary or catabolized muscle) as its primary sources of energy. Because of the increased rate of oxidation of fatty acids, intermediary products called ketone bodies can build up in the liver. These are acidic substances, and if enough of them build up, they can precipitate a dangerous condition called ketoacidosis, which can quickly become fatal (basically the acidic condition of the blood prevents it from carrying sufficient oxygen). This can only occur in individuals with Type I diabetes or individuals with severe liver or kidney disease. In a ‘normal’, healthy person, the pathological state of ketoacidosis can not occur. The reason for this is simple. They produce insulin and the two organs responsible for disposing/metabolizing the ketonic bodies are functional. While the body is burning fat, it is also creating glucose through gluconeogenesis (via protein catabolism); and to a smaller extent utilizing the glycerol molecules cleaved off of the triglycerides when the free fatty acids are ‘liberated’ as additional substrates in this process. As glucose levels rise, insulin is secreted. When the concentration in the blood reaches a certain level, the process of ketogenesis is inhibited. Gluconeogenesis occurs in the liver and, unknown to many people, also inthe kidneys – which actually produce about 54% of the glucose generated from the entire gluconeogenic process. Thus, the process of ketogenesis is a component of normal metabolism – it would only be considered pathological in certain disease states.
The body also has another ‘built-in safety mechanism’ to prevent ketoacidosis. While in the ketogenic state, the liver and kidneys are engaged in gluconeogenesis, or the production of glucose as described above. This must occur simultaneously with ketogenesis as some of the cells of the brain, the nucleated blood cells and cells of the adrenal
20
21
Clinician's NotesThe dieter should never be hungry on the Ideal Protein Protocol. Hunger usually is a result of too many carbohydrates. Check the Weekly Meal Plan for ‘forbidden items’ AND amounts of food eaten. Make sure no meals were skipped and they consumed all salads and vegetables.
medulla (there may be a few others) must have glucose as their sole source of energy (most of the other cells of the body actually do quite well using ketonic bodies as their fuel). As these processes occur, nitrogenous wastes accumulate and ammonia is produced. When the body becomes acidic, ammonia can “pick-up” a hydrogen ion, forming the ammonium ion and decreasing the level of acid as a result. The ammonium ion then reacts with the ‘alpha-amino nitrogen’ of aspartate and by a series of five catalytic reactions; urea is ultimately produced and excreted.
It must be emphasized that the Ideal Protein Protocol is a very alkaline protocol (that will be discussed in a following section on acid/base balancing). Providing sufficient alkaline minerals helps the body maintain the proper concentration of the bicarbonate ion in the blood (an important acid/base buffer) and represents another way the body’s physiology copes with an acid overload.
Again, the Standard Ideal Protein Protocol is contra-indicated for Type I diabetics and those suffering from liver or kidney disease. For all others, it is not only perfectly safe, but it just represents normal metabolism albeit using a metabolic pathway that is not frequently required given today’s standard high carbohydrate based diet. Remember, there is a treatment phase of this protocol (fat loss) and a maintenance phase (weight maintenance) and they are two entirely different metabolic formats.
20
25
6 Mike P. Ciell R.Ph.
Methods
Figure 1
Figure 2
Figure 3
Type of foodCarbohydrate
Protein
Fat
Protein and Fat
High Protein and Low Carb
High Carb and Low Protein ++++++++++
++++
++++no change
+++++++ no change
++no change
no change
++++
The Roles of Insulin and Glucagon
Insulin Glucagon
Lowers elevated blood sugar . . . . . . . . . . . . . . . . Raises low blood sugar
Shifts metabolism into storage mode . . . . . . . . Shifts metabolism into burning mode
Converts glucose and protein to fat . . . . . . . . Converts protein and fat to glucose
Converts dietary fat to storage . . . . . . . . . . . Converts dietary fat to ketones and sends them to the tissues for energy
Removes fat from blood and . . . . . . . . . . Releases fat from fat cells into the blood transports it into fat cells for use by tissues as energy
Increases the body's production . . . . . . . . . . Decreases the body's production of cholesterol of cholesterol
Makes the kidneys retain excess fluid . . . . . . Makes the kidneys release excess fluid
Stimulates the growth of arterial . . . . . . . . . . . . . . Stimulates regression of arterial smooth muscle cells smooth muscle cells
Stimulates the use of glucose for energy . . . . . . Stimulates the use of fat for energy
Levine, S., et. al. "Surge in Childhood Obesity May Threaten a Generation." The St. Petersburg Times (as published in The Washington Post).(May 20, 2008): 1.
2
4
c
KETOGENESIS/KETOSIS (continued)
4
5
26
23
Metzger, B.E., et. al. "Hyperglycemia and Adverse Pregnancy Outcomes." N Engl J Med Vol. 358 No. 19 (May 8, 2008): 1191-2002.5
Rowan, J., A., et. al. "Metformin versus Insulin for the Treatment of Gestational Diabetes." N Engl J Med Vol. 358 No. 19 (May 8, 2008): 2003-20056
Gordan, S., "High Blood Sugar Tied to Pregnancy Complications." HealthDay News (May 2008): http://www.healthday.com7
• Insulin inhibits this enzyme (‘the shuttle system’) and the fatty acids cannot enter the mitochondria. Basically they are re-routed to the adipocytes for storage via the bloodstream after first being reconstituted to triglycerides.
• Glucagon, as might be expected, has the opposite effect. It mobilizes stored energy so that it is readily available for ‘cellular fuel’. Not only does glucagon cause the release of glycogen from the muscles and liver, but it also enhances the activity of CPT-1(the carnitine shuttle) thus greatly increasing the rate at which the free fatty acids can enter the mitochondria. Therefore under glucagon’s influence, the ‘flow of fat’ is directed to the mitochondria of energy producing cells and away from the fat repositories of the adipocytes.
• The physiology of the fat cell (the adipocyte) is a little different. These are merely storage vats for fat globules. Again, at the surface of these cells, enzymes are present – exquisitely regulated by insulin and glucagon. Their function is to control the flow of fat either into the adipocyte for storage or release stored fuel (fat) into the circulation so that it can be available as an energy source. Lipoprotein-lipase causes fatty acids to enter the fat cell – and keeps them there! Two other enzymes, Hormone- sensitive lipase (HSL) and the recently discovered Adipose-triglyceride Lipase (ATGL) do the exact opposite: they release fat from the adipocyte. Insulin enhances the action of Lipoprotein lipase and glucagon inhibits its action. Likewise, glucagon stimulates the activities of HSL and ATGL, while insulin inhibits these two enzymes. A study published in the Journal of Chemical Endocrinology and Metabolism (June 2007) showed that the expression of HSL and ATGL was greatly suppressed in the obese, insulin resistant state.
• Due to a particularly “cruel little twist” of physiology, the very act of losing weight, increases the activity of the ‘fat storing’ Lipoprotein lipase and keeps it at a high level of activity for several months (probably some evolutionary survival mechanism). If we now add insulin to this already “ramped-up” enzyme (which will even increase its activity further) it becomes easy to understand why 95% of people who have successfully lost weight regain it! These poor souls, usually acting under the advice of well meaning professionals, rely on a “healthy balanced diet” usually consisting of a diet based on complex carbohydrates and very low amounts of fat-the very food combination that assures a copious secretion of insulin! Because of these guidelines, the medical community as a whole has greater success treating cancer than it does treating obesity/Syndrome X. As the doctors Eades point out, “it’s amazing that even 5% of successful dieters manage to keep it off – but that
Elevated total cholesterol (TC) with an elevated LDL fraction and lower than desirable HDL fraction are all hallmarks of “Syndrome X” or more precisely IR/hyperinsulinemia. These patients routinely present with TC/HDL ratios of much greater than four (undesirable) and LDL/HDL ratios of greater than three – also undesirable. Dietary sources of cholesterol have little effect on the patient’s plasma cholesterol levels contributing at best to perhaps 20% of the body’s total cholesterol (perhaps that is why the addition of Zetia® to a statin didn’t really show any added benefit). Eighty percent of the total cholesterol is synthesized by the body, primarily in the liver although the intestines, the skin and some other tissues also contribute.
The cells of the body require a certain amount of cholesterol at any given time, and if there is an insufficient amount available from dietary sources, the cells simply produce more. Conversely, the more that is available from our food, the less the cells need to make. This is particularly interesting with hyperinsulinemic/IR individuals. In 2003, a study in Finland compared the rates of cholesterol synthesis and absorption between insulin sensitive men and insulin resistant/hyperinsulinemic men. The authors of the study found insulin resistant men synthesized more cholesterol and absorbed less than their
20
21
Clinician's Notes“KETO-STIX”: Sooner or later you will encounter a patient who comes in all concerned ‘that the program isn’t working!’ They will tell you that they are not in ketosis and sometimes hold up a “used” Keto-stix and say “See, it’s not purple!” Explain to them that “ketosis” is not an ‘all or none’ proposition. During the program, they will be deriving much of their energy from ketogenesis, but it’s never 100%. Also explain that this test is used to detect the presence of ketone bodies in the urine that the body was unable to use for fuel. As they progress in the program (usually by 2 to 3 weeks) the body has had enough time to get all of the necessary enzymes synthesized so that it may burn more of these ketone bodies more efficiently – thus fewer will be excreted. At this point, if they are exercising, they may never “spill’ any in the urine. Also excess ketones may be eliminated via the lungs (acetone breath) and/or in the feces (probably dependent on individual biochemical idiosyncrasies). For all of these reasons, the “dip-stick test” is not a reliable method by which to gauge progress. The weekly food diary, if totally honest, is the ‘gold standard’ by which to gauge compliance.
Progress on the program MUST consist of another method besides a mere scale. Body measurements are key. After a few weeks muscle mass is going to increase and this will show as “less weight lost” if going by the scale alone. In a professional setting, we highly recommend the Tanita® scale as an addition to your clinic. This will show lean muscle (fat–free mass), % cellular hydration, and fat mass. The ‘higher end’ models also give a print-out that maybe placed in the patient’s weekly progress chart. This is an excellent clinical tool, and we encourage you to incorporate it into your practice. We would discourage the use of “Keto-Stix” by your patients or staff.
medulla (there may be a few others) must have glucose as their sole source of energy (most of the other cells of the body actually do quite well using ketonic bodies as their fuel). As these processes occur, nitrogenous wastes accumulate and ammonia is produced. When the body becomes acidic, ammonia can “pick-up” a hydrogen ion, forming the ammonium ion and decreasing the level of acid as a result. The ammonium ion then reacts with the ‘alpha-amino nitrogen’ of aspartate and by a series of five catalytic reactions; urea is ultimately produced and excreted.
It must be emphasized that the Ideal Protein Protocol is a very alkaline protocol (that will be discussed in a following section on acid/base balancing). Providing sufficient alkaline minerals helps the body maintain the proper concentration of the bicarbonate ion in the blood (an important acid/base buffer) and represents another way the body’s physiology copes with an acid overload.
Again, the Standard Ideal Protein Protocol is contra-indicated for Type I diabetics and those suffering from liver or kidney disease. For all others, it is not only perfectly safe, but it just represents normal metabolism albeit using a metabolic pathway that is not frequently required given today’s standard high carbohydrate based diet. Remember, there is a treatment phase of this protocol (fat loss) and a maintenance phase (weight maintenance) and they are two entirely different metabolic formats.
27
25
7The Relationship Between Insulin and Glucagon in the Pathogenesis of “Syndrome X”
CHOLESTEROL insulin sensitive counterparts. They reported: “Fasting insulin was more strongly correlated with cholesterol synthesis than were BMI or the rates of WBGU (whole blood glucose uptake), and no association of peripheral FFA levels with cholesterol metabolism was observed. These findings imply that the regulation of cholesterol metabolism by hyperinsulinemia, itself or as a marker of hepatic insulin resistance, is the link between insulin resistance and cholesterol metabolism.”
This is very interesting and should give us pause to consider recommending high carbohydrate/low fat diets for these patients. Carbohydrates (although usually cholesterol free) will cause a surge of insulin in these individuals leading to increased cholesterol synthesis, and remember 80% of our total cholesterol is synthesized in vivo. On the other hand, recommending a diet low in carbohydrates and higher in fat and protein will reduce insulin levels; and because of this patient population’s decreased absorption of cholesterol, the amounts associated with common protein/fat foods (i.e., eggs, dairy and meat) should be of minor concern. Dr. Eades states that “the key to lowering cholesterol levels is not in the restriction of dietary cholesterol or fat but in the dietary manipulation of the internal cholesterol regulatory system.”
8 Mike P. Ciell R.Ph.
Methods
Figure 1
Figure 2
Figure 3
Type of foodCarbohydrate
Protein
Fat
Protein and Fat
High Protein and Low Carb
High Carb and Low Protein ++++++++++
++++
++++no change
+++++++ no change
++no change
no change
++++
2
c
CHOLESTEROL (continued)
4
5
3
23
Why Cholesterol Levels Get Out of Control
Cholesterol is a very important compound in human physiology and the body requires a lot of it. Cholesterol is the substrate for all of the sex hormones, all of the adrenal corticoids, keeps the skin ‘water-proof’, and when sunlight strikes the skin, the cholesterol is transformed into vitamin D . Cholesterol is important in wound healing and is the major component of scar tissue. It comprises the bulk of the nerves’ myelin sheath and gives structure to our cell membranes, also helping control the flow of nutrients into the cell and the egress of metabolic wastes. In addition, when it is conjugated into bile acids, it aids in the digestion of fats and the absorption of oil soluble vitamins. Sufficient bile acids are also required to keep free cholesterol (in the liver and gall bladder) from precipitating and forming stones. In fact, the only negative about cholesterol, albeit a big negative, is when there are excess amounts and it ends up being deposited in the walls of the blood vessels.
So why does this occur; do we just make too much? As we have seen, our cells require a lot of cholesterol to fulfill all of the fore-mentioned tasks and, therefore, needs a steady supply. Our cells receive cholesterol from two sources: either they “pull” it from the bloodstream or they make it themselves – or both. Problems arise due to a little “‘quirk” in our ‘micro-anatomy’. Since the interior of the cell is where “cholesterol processing” takes place, it here where the cholesterol ‘sensors’ are located. These are called SSDs or Sterol Sensing Domains, and they are located on the endoplasmic reticulum (ER) of the cell (also located on the ER are the proteins (enzymes) HMG-CoA reductase and SREBP –Sterol Regulated Element Binding Protein). If the level of cholesterol becomes insufficient, these sensors send signals to increase the supply – either make more or get some from the blood. It is by this means that the cell (primarily liver cells) can ensure an adequate supply of cholesterol when it requires it. The “quirk” is that there are no sensors in the blood vessels, so there cannot be a negative feed-back loop to control blood levels of cholesterol. The cells never get “gummed up” with excess cholesterol, because they can sense the levels inside and make adjustments accordingly. This is not the case with the walls of the arteries. Because the sensors are located within the cells, they have no way of knowing the levels of cholesterol outside the cell (i.e., in the blood stream); of course, this can cause problems. Fortunately, there is a way around this “anatomical quirk”.
The Flow of Cholesterol in the Body
Our society’s preoccupation with cholesterol has spawned an enormous industry (or perhaps it is
20
21
Clinician's Notes
27
25
7The Relationship Between Insulin and Glucagon in the Pathogenesis of “Syndrome X”
visa-versa) whose mission is to devise all manners and means to lower our levels of this substance. We have drugs, fiber supplements, herbs, teas, garlic, cereals, unsaturated oils, red wine, etc. all promising to lower your cholesterol. In sorting out all of this from a clinical and therapeutic perspective, it helps to keep the focus on the “three major players” of the cholesterol transport system. This, by the way, is an excellent way to convey a working understanding of a complex system to your patients.
Because cholesterol is a waxy substance, it (like the fats) cannot be transported in a water-based blood stream. To make them water soluble, these substances must be joined to proteins (which act as ‘carriers’). There are the VLDL (very low density lipoprotein) molecules, the LDL (low density lipoprotein) molecules, and the HDL (high density lipoprotein) molecules – the heaviest and densest of the lot. These proteins can be thought of as “bus-lines”. The VLDL and the LDL ‘bus-lines’ carry passengers (triglycerides and cholesterol) to the various cells of the body, and the HDL line carries excess or unused cholesterol back to the liver to be conjugated into bile acids for elimination from circulation. A ‘trip’ on the bus-lines may go as follows: The VLDL bus leaves the liver carrying mainly triglycerides and a little bit of cholesterol. As it moves through the blood stream, it “drops off” the TGs to various cells either to be used as fuel or to be stored as fat. When these have been dropped off, the VLDL picks up more cholesterol and the bus “changes” into a LDL ‘bus’ carrying only cholesterol to all the tissues of the body. There are three “stops” where the cholesterol can get off. First, they can be summoned by cells in need of cholesterol by way of the cell’s LDL receptors (these basically pull the cholesterol off the LDL bus and into the cell). Second, the cholesterol may get returned to the liver and be eliminated from the circulation (this is known as RCT or reverse cholesterol transport in biochemical parlance). Lastly, and most unfortunately, they can be deposited in the walls of the arteries. The HDL line “picks up” or scavenges excess cholesterol from the tissues of the body –including the lining of the arteries. The HDL bus then transfers these “passengers” to a VLDL bus, turning it into an LDL bus which then carries the excess cholesterol back to the terminal (the liver) for disposal. These “buses” run all the time, and how much cholesterol is deposited in the tissues is greatly influenced by the ratio of LDL to HDL (or clinically LDL / HDL).
Although lowering total cholesterol is important, it is more important (in terms of clinical outcomes) as to wherethe cholesterol “gets off”. So giving a diet low in cholesterol and fat while high in fiber and carbohydrates may lower the total cholesterol, but if it also lowers the HDL fraction too much, we will still have cholesterol accumulating in places it should not.
8 Mike P. Ciell R.Ph.
Methods
Figure 1
Figure 2
Figure 3
Type of foodCarbohydrate
Protein
Fat
Protein and Fat
High Protein and Low Carb
High Carb and Low Protein ++++++++++
++++
++++no change
+++++++ no change
++no change
no change
++++
2
c
CHOLESTEROL (continued)
4
5
29Keeping Cholesterol Off the Arterial Walls
Recall that the cells’ cholesterol sensors are located inside the cell. When they detect a need for cholesterol, two mechanisms are triggered. First, the cell can make “LDL receptors” and send these to the cell’s surface where they ‘bind’ LDL particles passing by in the blood. Once attached, the LDL is brought inside the cell and enzymes remove the cholesterol. The LDL receptor can return to the surface and ‘capture’ another. The cell may also “ramp-up” the cholesterol making ‘enzyme machinery’ within and start production (called de novo synthesis) of its own cholesterol. As would be expected, if one system slows down, the other increases ensuring the adequate amount of cholesterol is obtained. When the need has been met, these processes then slow down until the cell’s sensors again signal a need for more cholesterol. If one system could do all the work, would the other one shut down?
Researchers explored this very premise. One group bred strains of mice that possessed five times the number of LDL receptors as the normal (control) mice. Both groups were fed diets very high in cholesterol, saturated fats and bile acids. When their lipid profiles were compared, the control group-as would be expected-showed very high levels of cholesterol while the group with the “extra receptors” maintained normal levels of cholesterol.
It was obvious from this experiment that increasing LDL receptors was a very good thing indeed. This led to the idea that if we can’t alter people’s genes, could we shut down the cell’s ability to manufacture cholesterol and force the cell to make more LDL receptors? This is what led to the development of Mevacor®, the first “statin” drug, and it worked great! The ‘statins’ work by inhibiting the rate-limiting step in the cell’s assembly line that produces endogenous cholesterol. This step is the enzyme 3-hydroxy-3 methylglutaryl Co-enzymeA reductase (HMG-CoA reductase). If the cell cannot use this enzyme, then its production of cholesterol falls and it must ramp-up the synthesis of LDL receptors to make up the short-fall. Results were amazing! We now had a way to control this artery clogging demon! However, there was just one problem.
When you inhibit an enzyme, you inhibit it all the time, and if this particular enzyme has other functions, well they stop too. Because of this, we started seeing muscular problems, gallbladder problems, liver problems and even cognitive problems…some very serious with the widespread use of these new drugs. Duane Graveline,
2028
Clinician's Notes
27
30
9The Relationship Between Insulin and Glucagon in the Pathogenesis of “Syndrome X”
MD, USAF Flight Surgeon and NASA astronaut wrote a book about his personal experience with Liptor. It details the amnesia he suffered on two occasions. He started the drug, had an episode then D/C’d it. His doctor then re-started it, on a lower dose, and the symptoms came back – a lot worse. One of the problems is that these drugs also inhibit the rate limiting step in the production of enzyme Co-Q-10. This molecule is also known as ubiquinone in British medicine (perhaps because it is ubiquitous). Co-Q-10 acts as an anti-oxidant in the cells’ membranes, keeping the lipid bi-layer from oxidizing (basically turning into plastic), protects the cholesterol in the cellular membrane from oxidation, and is critical for the optimal production of energy in the mitochondria of the cell (which may explain the ‘weakness’ many patients experience). Merek, who first produced Mevacor® and then later, Zocor® was so concerned about this that they filed a patent in 1989 (US Patent No. 4933165) for the inclusion of enzyme Co-Q-10 in their statin drugs lovastatin (Mevacor®) and simvastatin (Zocor®). The following is a claim in the patent:
“(1) A pharmaceutical composition comprising a pharmaceutical carrier and an effective antihypercholesterolemic amount of an HMG-CoA reductase inhibitor and an amount of Co-enzyme Q sub10 effective to counteract HMG-CoA reductase inhibitor associated skeletal muscle myopathy.”
For whatever reason, this newly patented formula was never brought to market. So what do we do, control our cholesterol with the effective drugs and maybe suffer the side-effects, or is there a better way?
Controlling Cholesterol With Our Diet
Inhibiting the enzyme HMG-CoA reductase has proven itself to work very well with respect to controlling cholesterol levels. However, the standard pharmaceutical solution does leave something to be desired, to say the least. Is there perhaps another way to do this minus the side effects? The answer is yes, and it goes back to those master hormones: insulin and glucagon.
Following a meal, levels of nutrients (glucose, triglycerides, amino acids) begin to rise in the blood. The amounts of these nutrients dictate the ratio of levels of insulin and glucagon which the body adjusts to maintain homeostasis (refer to Table 1. on page ii). Keep in mind, individuals with insulin resistance (IR) will produce an exaggerated amount of insulin. As these nutrients begin to enter the cells, the processes of metabolism (glycolysis, glycogenolysis, lipolysis and lipogenesis) “re-adjust” themselves depending on the amounts and proportions of what foods were ingested as well as the metabolic rate.
10 Mike P. Ciell R.Ph.
Methods
Figure 1
Figure 2
Figure 3
Type of foodCarbohydrate
Protein
Fat
Protein and Fat
High Protein and Low Carb
High Carb and Low Protein ++++++++++
++++
++++no change
+++++++ no change
++no change
no change
++++
2
c
CHOLESTEROL (continued)
4
5
3
29
Because we are designed for survival, our bodies will always burn the sugar (glucose and its storage form glycogen) first and utilize the fat last (fat, containing 9 Kcal of energy per gram as opposed to 4 Kcal per gram for carbohydrates, and protein makes it a more efficient material as energy storage).
In a meal that consists of large amounts of carbohydrates with little fat or protein, a combination guaranteeing a large release of insulin (remember a much greater release in the IR/hyperinsulinemic individual), let’s follow what happens in terms of cholesterol production. The large quantity of carbohydrates (i.e. glucose) will be directed into the cells under insulin’s influence and this ready source of energy will be consumed first and the liver will transform any extra glucose to triglyceride molecules (this is assuming the glycogen stores are full). We will discuss cells other than adipocytes first.
• As the triglyceride (TG) comes into contact with the cellular membrane, enzymes cleave it into free fatty acids (FFAs) and glycerol. The FFAs now enter the cytoplasm of the cell.
• These FFAs are activated by ATP and an enzyme called acyl-CoA synthetase (or thiokinase) to molecules of Acyl-CoA.
• Now, here’s the determining step in the fate of the original TG (recall that it can enter the mitochondria to be used as fuel or it can be ‘rerouted’ to the adipocyte for storage as fat). If glucagon were ‘dominant’ at this point, it would activate the enzyme carnitine-palmitoyl tranferase I (CPT-1) and the acyl-CoA would be ‘hooked up’ to the CTP-1 ‘shuttle’ and be carried into the mitochondrias’ “furnace”. Because insulin is the dominant metabolic hormone in this scenario (IR individual and a ‘high insulin producing meal combination’), the shuttle enzyme (CPT-1) is inhibited by insulin and the acyl-CoA is re-routed. But it doesn’t quite leave the cell just yet.
• Because insulin is now directing the body to store fat, it must prepare the adipocyte to accommodate the incoming volume; and because that entails the cell membrane expanding and cholesterol is an essential component of the membrane, the cell will require more. Insulin will simultaneously activate the enzyme lipoprotein-lipase to open the “gates” of the adipocyte for TG storage.
• Now, the cholesterol ‘sensors’ we mentioned earlier are activated and signal our cell to get some
20
31,32
Clinician's Notes
27
30
9The Relationship Between Insulin and Glucagon in the Pathogenesis of “Syndrome X”
cholesterol. It can either make more LDL receptors, or make some de novo. Again, because insulin is directing the show, it activates the enzyme HMG-CoA synthetase (located on the ER of the cell). This enzyme joins units of acyl-CoA together to form HMG-CoA. This intermediary product is acted on by another “ER” enzyme, HMG-CoA reductase (the rate- limiting step of cholesterol synthesis and the enzyme which the statin-class drugs inhibit) and the process of making cholesterol is up and running.
• The take home message is this: Telling insulin resistant/hyperinsulinemic patients to base their diets on the standard “Food Pyramid Guidelines” of 60% carbohydrates and little fat will ONLY SET THEM UP TO STORE FAT AND MAKE CHOLESTEROL. TRIGLYCERIDE LEVELS WILL CONTINUE TO WORSEN AS WILL THEIR CHOLESTEROL. AT THIS JUNCTURE, PRESCRIBING A STATIN MAY BE THE ONLY CLINICAL RECOURSE.
Keeping the Carbohydrates Low Changes theBiochemical Pathway
Now, let’s observe how the metabolic pathways are altered simply by changing the ratio of macronutrients in the diet. Again, referring to Table 1 (page ii), we will see that if we keep the carbohydrates low and increase the amount of fat and protein, we will have a great effect on the ratio of insulin to glucagon.
Following a meal, the blood glucose rises and insulin is secreted. The glucose begins to enter the muscle cells; however due to the consumption of few carbohydrates, the ready supply of glucose in the blood soon begins to decrease. This is particularly profound in IR /hyperinsulinemic individuals and the phenomenon is called “reactive hypoglycemia”. When the blood glucose falls to a certain level, the pancreas now secretes glucagon and the adrenals secrete epinephrine, norepinephrine and cortisol as it attempts to maintain homeostasis with respect to blood glucose levels. The first effect of glucagon is to immediately stop the secretion of insulin. The next effect is to cause the liver and skeletal muscles to release some glycogen, which will be converted into glucose. More importantly, the triglycerides now become a source of energy. Let’s go back to the previous scenario and see how things change:
• Again, the TGs come into contact with the liver cells’ membranes and are split into FFAs and glycerol. The FFAs enter the cell and are activated to molecules of Acyl-CoA by the action of thiokinase.
10 Mike P. Ciell R.Ph.
Methods
Figure 1
Figure 2
Figure 3
Type of foodCarbohydrate
Protein
Fat
Protein and Fat
High Protein and Low Carb
High Carb and Low Protein ++++++++++
++++
++++no change
+++++++ no change
++no change
no change
++++
Levine, S., et. al. "Surge in Childhood Obesity May Threaten a Generation." The St. Petersburg Times (as published in The Washington Post).(May 20, 2008): 1.
2
4
c
CHOLESTEROL (continued)
4
5
3
37
Metzger, B.E., et. al. "Hyperglycemia and Adverse Pregnancy Outcomes." N Engl J Med Vol. 358 No. 19 (May 8, 2008): 1191-2002.5
Rowan, J., A., et. al. "Metformin versus Insulin for the Treatment of Gestational Diabetes." N Engl J Med Vol. 358 No. 19 (May 8, 2008): 2003-20056
Gordan, S., "High Blood Sugar Tied to Pregnancy Complications." HealthDay News (May 2008): http://www.healthday.com7
• Now because glucagon is the dominant metabolic hormone, the ‘shuttle’ (enzyme CTP-1) is activated – NOT inhibited as it was with insulin – and the acyl CoA molecules may enter the mitochondria – to be used as an energy source. Simultaneously at the adipocyte, glucagon along with epinephrine and norepinephrine has inhibited the “fat-storing enzyme” lipoprotein lipase and has activated the enzymes HSL and ATGL causing the adipocytes to release stored TGs.
• If at this point the body requires cholesterol, a different mechanism comes into play. Again the sensors, the SSDs, send out the signal cholesterol is needed, but glucagons has shutdown the important ‘cholesterol making enzyme’ HMG-CoA reductase (just like the ‘statins’ do). Therefore, the cell cannot use the de novo pathway.
• As a recourse, SREBP is activated which directs the protein manufacturing machinery of the endoplasmic reticulum to produce new LDL receptors (the final ‘touches’ are put on these new receptors in the golgi apparatus of the cells by a process called glycosylation). These new LDL receptors now go to the cell’s surface and “capture cholesterol filled LDL particles” and bring the cholesterol back inside the cell.
• The net result is a ‘flow of fat’ out of storage and its mobilization for an energy source. The de novo synthesis of cholesterol is inhibited, and the body is forced to use the cholesterol present in the blood stream.
The Clinical Bottom Line
a. Fats (TGs) are being used as an energy source so plasma levels of triglycerides drop dramatically and quickly (usually with in a month of the dietary change).
b. Total cholesterol levels, particularly the LDL fraction, are significantly reduced.
c. Compared to a high carbohydrate/low fat diet, increasing dietary fat and protein will lead to a significant increase in HDL-c.
d. Changing the ratio of insulin to glucagon, the patient will be in a “fat burning mode” as opposed to a “fat storing mode” and the percentage of body fat will decrease (they will experience a ‘quality weight loss’).
20
33
Clinician's Notes“KETO-STIX”: Sooner or later you will encounter a patient who comes in all concerned ‘that the program isn’t working!’ They will tell you that they are not in ketosis and sometimes hold up a “used” Keto-stix and say “See, it’s not purple!” Explain to them that “ketosis” is not an ‘all or none’ proposition. During the program, they will be deriving much of their energy from ketogenesis, but it’s never 100%. Also explain that this test is used to detect the presence of ketone bodies in the urine that the body was unable to use for fuel. As they progress in the program (usually by 2 to 3 weeks) the body has had enough time to get all of the necessary enzymes synthesized so that it may burn more of these ketone bodies more efficiently – thus fewer will be excreted. At this point, if they are exercising, they may never “spill’ any in the urine. Also excess ketones may be eliminated via the lungs (acetone breath) and/or in the feces (probably dependent on individual biochemical idiosyncrasies). For all of these reasons, the “dip-stick test” is not a reliable method by which to gauge progress. The weekly food diary, if totally honest, is the ‘gold standard’ by which to gauge compliance.
Progress on the program MUST consist of another method besides a mere scale. Body measurements are key. After a few weeks muscle mass is going to increase and this will show as “less weight lost” if going by the scale alone. In a professional setting, we highly recommend the Tanita® scale as an addition to your clinic. This will show lean muscle (fat –free mass), % cellular hydration, and fat mass. The ‘higher end’ models also give a print-out that maybe placed in the patient’s weekly progress chart. This is an excellent clinical tool, and we encourage you to incorporate it into your practice. We would discourage the use of “Keto-Stix” by your patients or staff.
34
35
11The Relationship Between Insulin and Glucagon in the Pathogenesis of “Syndrome X”
e. Keeping the insulin levels low by dietary means will improve insulin sensitivity in hyperinsulinemic/IR patients. This will be confirmed by monitoring fasting insulin levels and re-administration of the “75 gram” glucose challenge test. You absolutely have the ability, not only to improve the symptoms of “Syndrome X” but also the method to begin to reverse it.
Year after year, study after study, and our own clinical experience plus that of hundreds of other practitioners has done nothing but confirm the above mentioned physiological improvements. A paper published in The New England Journal of Medicine in May, 2003 concluded this: “Severely obese subjects with a high prevalence of diabetes or the Metabolic Syndrome lost more weight during 6 months on a carbohydrate-restricted diet than on a calorie and fat-restricted diet, with a relative improvement in insulin sensitivity and triglyceride levels, even after adjustment for the amount of weight lost.” Conclusions from a study published in the Annals of Internal Medicine in May 2004 echoed the same opinion: “Compared with a low-fat diet, a low-carbohydrate diet program had better participant retention and greater weight loss. During active weight loss, serum triglyceride levels decreased more and high-density lipoprotein cholesterol levels increased more with a low-carbohydrate diet than with a low-fat diet.”
Gerald M. Reaven, MD (the one who first coined the term “Syndrome X”) summed up nicely his experience with hyperinsulinemic/IR patients on a high carbohydrate/lowfat diet versus a low carbohydrate/high fat diet in a 2001 article published in San Francisco Medicine. Dr. Reaven states that “the most dramatic improvements in the manifestations of Syndrome X occur in overweight, insulin-resistant/hyperinsulinemic individuals when they lose weight. However, there appears to be little or no evidence, as long as the energy content is kept constant, that low fat/high carbohydrate diets will directly improve insulin sensitivity. On the other hand, there is considerable evidence that isocaloric diets low in fat and enriched in carbohydrates will accentuate the manifestations of Syndrome X. The more insulin resistant an individual, the greater is the amount of insulin that must be secreted in response to a carbohydrate-enriched diet in order to maintain glucose homeostasis. Thus, the inevitable and consistently replicated effect of replacing saturated fat with carbohydrates in insulin resistant individuals is to increase the concentration of triglyceride-rich lipoproteins, both fasting and postprandial. The increase in the ambient TG-rich lipoproteins seen following low fat/high carbohydrate diets is associated with a decrease in HDL-cholesterol concentration; and more recently, it appears that such diets will change the LDL subclass pattern to “B” in half the individuals who had either pattern “A” or
36
36
36
36
12 Mike P. Ciell R.Ph.
Methods
Figure 1
Figure 2
Figure 3
Type of foodCarbohydrate
Protein
Fat
Protein and Fat
High Protein and Low Carb
High Carb and Low Protein ++++++++++
++++
++++no change
+++++++ no change
++no change
no change
++++
2
c
CHOLESTEROL (continued)
4
5
3
37
an intermediate pattern at the outset. Given the evidence that low fat/ high carbohydrate diets do not modify the basic defects in Syndrome X (insulin resistance) and accentuates all of its metabolic manifestations, there seems to be little rationale for substituting saturated fat with carbohydrates. This is particularly true in light of the multiple observations that replacing saturated fat with mono-saturated or polyunsaturated fat, or both, will lead to the same fall in LDL-cholesterol without any of the adverse metabolic effects seen with low fat carbohydrate diets.”
We are faced with an epidemic that is snowballing out of control. We, as clinicians, have a choice. We can continue to recommend the same “balanced diet with the
20
33 Clinician's Notes1. Starting a patient on the Ideal Protein Protocol will result in a rapid decrease in serum triglycerides in those patients whose levels are elevated. It has been the experience of our clinics that medications prescribed for lowering triglycerides i.e. gemfribrozal, fenofibrate) may be discontinued right from the outset. Of course, the practitioner may choose to wait for one month until a follow-up lipid panel confirms the fact that the medication is no longer needed.
2. For patients taking statin drugs, our recommendations would be as follows: Obtain a base-line fasting lipid panel. You may, at the outset, decrease the dosage of the statin by one-half.
3. Re-test cholesterol levels in one month and adjust dosage or discontinue the medication as warranted.
38,39
35
11The Relationship Between Insulin and Glucagon in the Pathogenesis of “Syndrome X”
36
36
36 36
majority of calories derived from complex carbohydrates and low in fat and cholesterol” and continue to pharmacologically treat their worsening symptoms – a strategy that has repeatedly been proven to be a therapeutic failure. Or, on the other hand, through a simple, medically derived and biochemically sound, dietary intervention, begin to attack the problem at its source and actually help these souls begin to reverse the metabolic maladies of this syndrome.
Remember, the National Institutes of Health stated that this current generation will be the first, in history, to have a projected life expectancy shorter than the previous one. The reason for this is obesity and the metabolic consequences thereof.
EICOSANOIDS: HOW THEBODY CONTROLS INFLAMMATIONFatty acids serve many important functions in the body. As we have discussed, they can be “re-converted” to triglycerides and stored as fat, they can be utilized as a rich source of energy, they can be transformed into phospholipids and become integral parts of the cellular membranes, and they can be converted into cholesterol; however, there are two “special types” of fatty acids that, in addition to playing roles in all of the above-mentioned physiological processes, have other unique properties. We humans cannot synthesize these molecules and must obtain them from dietary sources (hence the name ‘essential fatty acids’). These are the “Omega-3 oils” and the “Omega-6
oils”. The “omega nomenclature” simply means that the first carbon-to-carbon double bond occurs at carbon #3 from the ‘omega-end’ (i.e., the non-acid end) of the fatty acid molecule. Similarly, an omega-6 fatty acid would have the first carbon double band at carbon #6 from the omega-end. Omega-6 oils are most commonly derived from plant sources. Most vegetable oils, as well as most ‘seed oils’, contain predominately omega-6 fatty acids. Flax seed oil (an exception) contains a high percentage (57%) of alpha linolenic acid, an omega-3 oil, and canola oil also contains some omega-3s, although only about 10%.
Common sources of omega-3 oils are the “marine oils” such as fish oil, cod liver oil and krill oil. Although the body may use omega-3 and the omega-6 fatty acids like other fatty acids, these two groups have another unique and very important physiological function. They are the building blocks or substrates (particularly the omega-6 oils such as linoleic acid) for a class of compounds referred to as eicosanoids. The word is derived from the Greek word meaning twenty (eikosi). These are a family of at least 100 compounds all containing 20 carbon atoms. Arguably these
12 Mike P. Ciell R.Ph.
Methods
Figure 1
Figure 2
Figure 3
Type of foodCarbohydrate
Protein
Fat
Protein and Fat
High Protein and Low Carb
High Carb and Low Protein ++++++++++
++++
++++no change
+++++++ no change
++no change
no change
++++
Levine, S., et. al. "Surge in Childhood Obesity May Threaten a Generation." The St. Petersburg Times (as published in The Washington Post).(May 20, 2008): 1.
2
4
c
CHOLESTEROL (continued)
4
5
3
37
Metzger, B.E., et. al. "Hyperglycemia and Adverse Pregnancy Outcomes." N Engl J Med Vol. 358 No. 19 (May 8, 2008): 1191-2002.5
Rowan, J., A., et. al. "Metformin versus Insulin for the Treatment of Gestational Diabetes." N Engl J Med Vol. 358 No. 19 (May 8, 2008): 2003-20056
Gordan, S., "High Blood Sugar Tied to Pregnancy Complications." HealthDay News (May 2008): http://www.healthday.com7
substances, even though they may only exist for seconds or milli-seconds before being degraded, (and that is why we do not have standard laboratory tests to ascertain their concentrations) may be some of the most powerful substances in the body in terms of orchestrating profound physiological effects. These ‘biochemical controllers” work not only inside the cell, but also serve as “mini-hormones’ in that they signal adjacent cells to perform specific tasks. Eicosanoids control coagulation and anti-coagulation of the blood, they can control dilation and constriction of the bronchioles, and they are responsible for the degree of inflammation associated with the immune response (i.e. how much fever, how much pain, how much swelling is produced during a “counter-attack” on an invading pathogen). In layman’s terms, they ‘send out the cavalry AND call it back’. In other words, eicosanoids instigate the inflammatory processes and attenuate them – they modulate the degree and intensity of the immune response ensuring the minimum amount of ‘collateral damage’ is done). Pharmacologically, we can only increase the immune response or suppress it…..we cannot modulate it!
How important is all of this in your daily clinical practice? How many anti-inflammatory drugs do you prescribe, both steroidal and non-steroidal? If you are questioning the profound impact these short-lived “little things” have on human physiology, look at the records of Bextra® and Vioxx® and look at the side-effect profile of the corticosteroids. Obviously as clinicians we want to alleviate the pain, inflammation and collateral tissue destruction associated with increased levels of certain ecoisanoids such as leukotrienes, thromboxanes, interferons, interleukines and prostaglandins. In conditions such as rheumatoid arthritis, Crohn’s disease, pelvic inflammatory disease, colitis or any “itis”, there is an exaggerated immune response. So logically, we prescribe ‘immuno-supressants’ in an attempt to ameliorate the symptoms. However, there is only so far we can go along this path until side-effects, usually manifestations of a suppressed immune system, come back to haunt us and we then attempt to counter-act these problems by prescribing immuno-stimulants (such as Epogen® for instance). Let’s consider for a moment the impact our diet plays in all of this. Table 3 (pg. 14) liststhe two general classes of eicosanoids and their physiological effects. Notice how insulin and glucagon influence the expression of the two classes. It is apparent that one would probably prefer to live the majority of one’s life under the direction of the series one eicosanoids, although at times, the series two eicosanoids are very important. If you have an infection, you need an inflammatory response – but not too much. If you are
20
33
Clinician's Notes1. Starting a patient on the Ideal Protein Protocol will result in a rapid decrease in serum triglycerides in those patients whose levels are elevated. It has been the experience of our clinics that medications prescribed for lowering triglycerides i.e. gemfribrozal, fenofibrate) may be discontinued right from the outset. Of course, the practitioner may choose to wait for one month until a follow-up lipid panel confirms the fact that the medication is no longer needed.
2. For patients taking statin drugs, our recommendations would be as follows: Obtain a base-line fasting lipid panel. You may, at the outset, decrease the dosage of the statin by one-half.
3. Re-test cholesterol levels in one month and adjust dosage or discontinue the medication as warranted.
38,39
35
13The Relationship Between Insulin and Glucagon in the Pathogenesis of “Syndrome X”
36
36
36 36
EICOSANOIDS: (continued) bleeding, platelets need to coagulate, but you wouldn’t want ‘sticky blood’ all the time. Optimal health depends on a balance between the two types and many chronic disease states arise when the eicosanoids are constantly out of balance. A huge part of the pharmaceutical industry concerns itself with the production of anti-inflammatory compounds – both steroidal and non-steroidal (NSAIDs) medications. These drugs inhibit the synthesis of many of these compounds, such as prostaglandins, leukotrienes or thromboxanes in order to suppress symptoms. The problem is that it is very difficult, or impossible, to exquisitely control their balance pharmacologically. Aspirin, for example, will inhibit platelet aggregation, decrease pain, inflammation, and has anti-pyretic properties; however, it will also decrease production of the prostaglandins that protect the stomach from the acid it produces, hence making G.I. bleeds a common side-effect. The ultimatetherapeutic tool would be to channel the majority of eicosanoid synthesis so that ‘we spend most of our time’ under the influence of the beneficial series one eicosanoids, yet do not inhibit the body from producing the series two eicosanoids when necessary. In other words, we do not want to stimulate or inhibit these two types of compounds, like drugs do, but rather we want to modulate them, that is let the body remain in control. Neat trick, but how do we accomplish this?
Two Classes of EicosanoidsInsulin Dominant
Glucagon DominantLowers elevated blood sugar . . . . . . . . . . . . . . . . Raises low blood sugar
Shifts metabolism into storage mode . . . . . . . . Shifts metabolism into burning modeConverts glucose and protein to fat . . . . . . . . Converts protein and fat to glucose
Converts dietary fat to storage . . . . . . . . . . . Converts dietary fat to ketones and
sends them to the tissues for energy
Removes fat from blood and . . . . . . . . . . Releases fat from fat cells into the blood
Increases the body's production . . . . . . . . . . Decreases the body's production
Makes the kidneys retain excess fluid . . . . . . Makes the kidneys release excess fluid
Stimulates the growth of arterial . . . . . . . . . . . . . . Stimulates regression of arterial smooth muscle cells smooth muscle cells
Stimulates the use of glucose for energy . . . . . . Stimulates the use of fat for energy
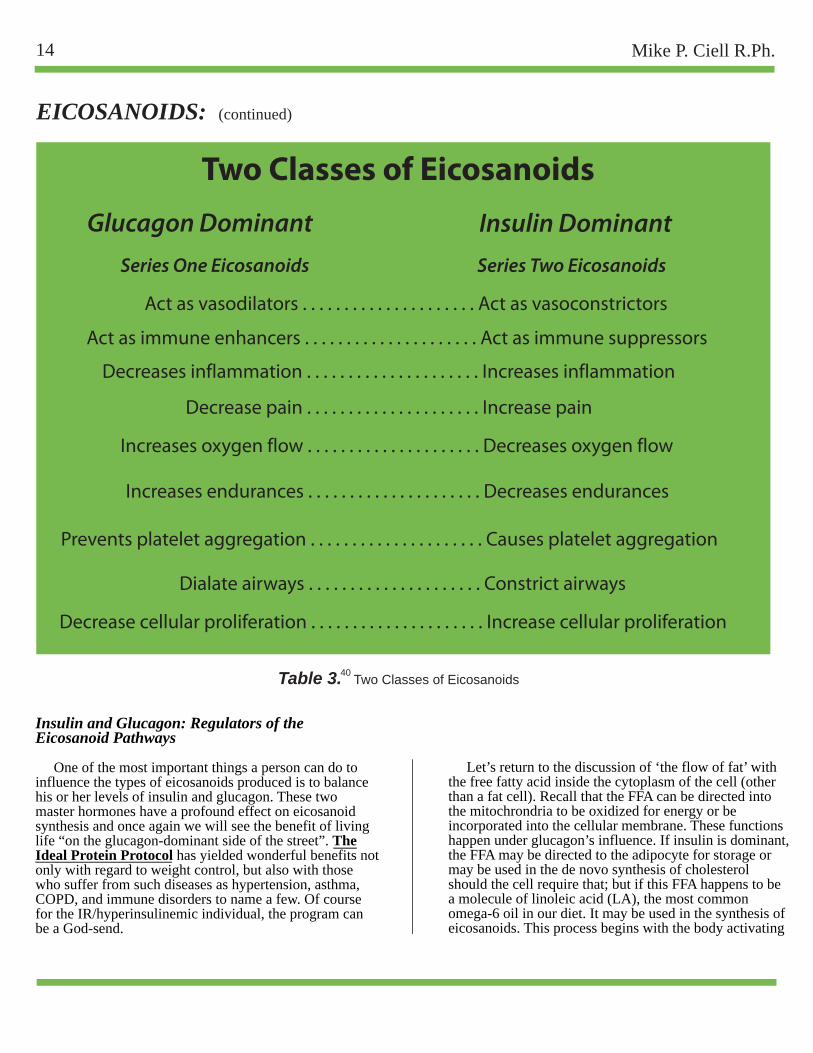
14 Mike P. Ciell R.Ph.
Methods
Figure 1
Figure 2
Figure 3
Type of foodCarbohydrate
Protein
Fat
Protein and Fat
High Protein and Low Carb
High Carb and Low Protein ++++++++++
++++
++++no change
+++++++ no change
++no change
no change
++++
2
c
CHOLESTEROL (continued)
4
5
3
3720
33
Clinician's Notes
38,39
35
13The Relationship Between Insulin and Glucagon in the Pathogenesis of “Syndrome X”
36
36
36 36
EICOSANOIDS: (continued)
Two Classes of EicosanoidsInsulin Dominant
Glucagon DominantLowers elevated blood sugar . . . . . . . . . . . . . . . . Raises low blood sugar
Shifts metabolism into storage mode . . . . . . . . Shifts metabolism into burning modeConverts glucose and protein to fat . . . . . . . . Converts protein and fat to glucose
Converts dietary fat to storage . . . . . . . . . . . Converts dietary fat to ketones and
sends them to the tissues for energy
Removes fat from blood and . . . . . . . . . . Releases fat from fat cells into the blood
Increases the body's production . . . . . . . . . . Decreases the body's production
Makes the kidneys retain excess fluid . . . . . . Makes the kidneys release excess fluid
Two Classes of Eicosanoids
Glucagon Dominant Series One Eicosanoids Series Two Eicosanoids
Act as vasodilators . . . . . . . . . . . . . . . . . . . . . Act as vasoconstrictors
Table 3. Two Classes of Eicosanoids40
Insulin Dominant
Increases endurances . . . . . . . . . . . . . . . . . . . . . Decreases endurances
Act as immune enhancers . . . . . . . . . . . . . . . . . . . . . Act as immune suppressors
Increases oxygen flow . . . . . . . . . . . . . . . . . . . . . Decreases oxygen flow
Prevents platelet aggregation . . . . . . . . . . . . . . . . . . . . . Causes platelet aggregation
Dialate airways . . . . . . . . . . . . . . . . . . . . . Constrict airways
Decrease pain . . . . . . . . . . . . . . . . . . . . . Increase pain
Decreases inflammation . . . . . . . . . . . . . . . . . . . . . Increases inflammation
Decrease cellular proliferation . . . . . . . . . . . . . . . . . . . . . Increase cellular proliferation
Insulin and Glucagon: Regulators of the Eicosanoid Pathways
One of the most important things a person can do to influence the types of eicosanoids produced is to balance his or her levels of insulin and glucagon. These two master hormones have a profound effect on eicosanoid synthesis and once again we will see the benefit of living life “on the glucagon-dominant side of the street”. The Ideal Protein Protocol has yielded wonderful benefits not only with regard to weight control, but also with those who suffer from such diseases as hypertension, asthma, COPD, and immune disorders to name a few. Of course for the IR/hyperinsulinemic individual, the program can be a God-send.
Let’s return to the discussion of ‘the flow of fat’ with the free fatty acid inside the cytoplasm of the cell (other than a fat cell). Recall that the FFA can be directed into the mitochrondria to be oxidized for energy or be incorporated into the cellular membrane. These functions happen under glucagon’s influence. If insulin is dominant, the FFA may be directed to the adipocyte for storage or may be used in the de novo synthesis of cholesterol should the cell require that; but if this FFA happens to be a molecule of linoleic acid (LA), the most common omega-6 oil in our diet. It may be used in the synthesis of eicosanoids. This process begins with the body activating
14 Mike P. Ciell R.Ph.
Methods
Figure 1
Figure 2
Figure 3
Type of foodCarbohydrate
Protein
Fat
Protein and Fat
High Protein and Low Carb
High Carb and Low Protein ++++++++++
++++
++++no change
+++++++ no change
++no change
no change
++++
2
c
CHOLESTEROL (continued)
4
5
3
3720
41
Clinician's Notes
38,39
35
15The Relationship Between Insulin and Glucagon in the Pathogenesis of “Syndrome X”
36
36
42
36
EICOSANOIDS: (continued)
Two Classes of EicosanoidsInsulin Dominant
Glucagon DominantLowers elevated blood sugar . . . . . . . . . . . . . . . . Raises low blood sugar
Shifts metabolism into storage mode . . . . . . . . Shifts metabolism into burning modeConverts glucose and protein to fat . . . . . . . . Converts protein and fat to glucose
Converts dietary fat to storage . . . . . . . . . . . Converts dietary fat to ketones and
sends them to the tissues for energy
Removes fat from blood and . . . . . . . . . . Releases fat from fat cells into the blood
Increases the body's production . . . . . . . . . . Decreases the body's production
Makes the kidneys retain excess fluid . . . . . . Makes the kidneys release excess fluid
Two Classes of Eicosanoids
Glucagon Dominant Series One Elcosanoids Series Two Elcosanoids
Act as vasodilators . . . . . . . . . . . . . . . . . . . . . Act as vasoconstrictors
Table 3. Two Classes of Eicosanoids40
Insulin Dominant
Increases endurances . . . . . . . . . . . . . . . . . . . . . Decreases endurances
Act as immune enhancers . . . . . . . . . . . . . . . . . . . . . Act as immune suppressors
Increases oxygen flow . . . . . . . . . . . . . . . . . . . . . Decreases oxygen flow
Prevents platelet aggregation . . . . . . . . . . . . . . . . . . . . . Causes platelet aggregation
Dialate airways . . . . . . . . . . . . . . . . . . . . . Constrict airways
Decrease pain . . . . . . . . . . . . . . . . . . . . . Increase pain
Decreases inflammation . . . . . . . . . . . . . . . . . . . . . Increases inflammation
Decrease cellular proliferation . . . . . . . . . . . . . . . . . . . . . Increase cellular proliferation
the enzyme delta 6 desaturase (D6D) which is the initiating step of eicosanoid production and, by the way, requires a lot of energy. Factors such as disease, aging, stress and a diet high in trans-fats (basically metabolic poisons) or a diet high in carbohydrates will hinder this first step. Conversely, a diet containing an adequate supply of protein will enhance the activity of this important first step and ensure a good flow of LA into the eicosanoid production line. The Ideal Protein Protocol does a marvelous job in this respect: low in carbohydrates, no trans-fats and high quality, easily absorbable protein.
• The molecule of linoleic acid (LA) now begins its biochemical transformation into an eicosanoid. There are a few preliminary steps (called elongation) which involve the attachment of additional carbon atoms to the original LA molecule to bring the total number of carbon atoms to twenty.
• At this juncture, another enzyme, delta 5 desaturase or D5D, may act on our ‘blossom-ecosanoid’. If D5D does in fact react with this fatty acid, it will soon be transformed to arachidonic aAcid (AA), and will be on the way to becoming one of the “undesirable series two eicosanoids”. Insulin, very strongly, forces this metabolic pathway!
• However if glucagon is present, this enzyme is suppressed, and the fatty acid will be directed to become a series one eicosanoid. Remember, we do not want to inhibit either of these biochemical pathways (Bextra® and Vioxx® are great examples of this-an idea that ‘looked good on paper but had disastrous clinical results), but we do want to influence which is the predominant pathway. In your practice, you will encounter patients who are, of course elderly, suffering from a chronic condition or who are excessively ‘insulin-dominant’. These factors will no doubt impede the entry of LA into the ‘eicosanoid production line’ and the full benefits of “The Protocol” will not be realized. There is a solution for such problems.
• If we add an omega-3 oil supplement to their diet, we can affect a neat biochemical “trick”. The enzyme D5D preferentially binds to the omega-3 oils rather than the omega-6 oils (like LA). So in these cases, where insulin is predominant and is directing this enzyme to attach to LA, some of the enzyme available binds to the omega-3 oils and less arachidonic acid (the precursor to the series two eicosanoids will be produced and more of the series one eicosanoids-‘the good guys’) will be made. Incidentally when D5D attaches to an
omega-3 oil, a subclass of eicosanoids (the series three eicosanoids) are formed. These are neither pro-or anti-inflammatory but rather modulate the degree to which the series one or series two eicosanoids express themselves. These are also very beneficial in terms of clinical outcomes.
In your practice, you may occasionally encounter a patient who, despite very good success with the Ideal Protein Protocol (good weight loss, improved blood lipids and glucose levels), may not appear to be doing as well as other patients in other respects. For instance, their blood pressure, although improved due to the weight loss and reduction in insulin levels may not as be as good as other patients on the same protocol. This small sub-class of patients may be extra sensitive to arachidonic acid. The Eades advise you to watch for these main symptoms often associated with high levels of arachidonic acid or a sensitivity to it:
• Chronic fatigue • Difficulty awakening or grogginess upon awakening • Brittle hair and/or thin, brittle nails • Minor rashes • Poor or restless sleep • Constipation • Dry, flaking skin
Eliminating dietary sources of AA may prove very beneficial to these individuals. AA is found in all meats, particularly red meats and organ meats. It is also found in egg yolks. Having these patients use only egg whites (or only one whole egg and remainder of the dish of just egg whites) will help reduce AA levels. Substituting wild game (if available) instead of grain-fed, commercially raised livestock and instructing them to trim off the fat will also help decrease dietary sources of AA. The fat of grain–fed beef will always contain more AA than free-range, grass-grazed animals, as the diet of grain will raise insulin levels in these animals contributing to a greater synthesis of AA in vivo. Using coconut oil or clarified butter in sautéing as opposed to seed or vegetable oils will also prove beneficial.
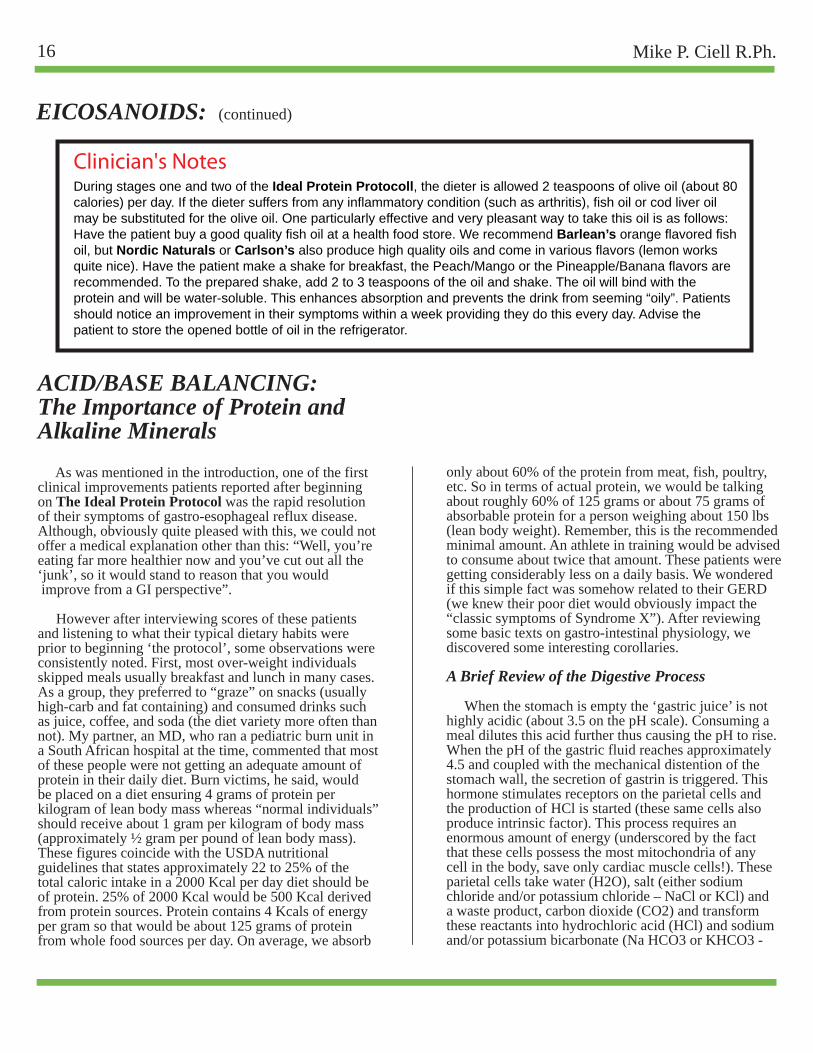
16 Mike P. Ciell R.Ph.
Methods
Type of foodCarbohydrate
Protein
Fat
Protein and Fat
High Protein and Low Carb
High Carb and Low Protein ++++++++++
2
c
CHOLESTEROL (continued)
4
5
3
Clinician's NotesDuring stages one and two of the Ideal Protein Protocoll, the dieter is allowed 2 teaspoons of olive oil (about 80 calories) per day. If the dieter suffers from any inflammatory condition (such as arthritis), fish oil or cod liver oil may be substituted for the olive oil. One particularly effective and very pleasant way to take this oil is as follows: Have the patient buy a good quality fish oil at a health food store. We recommend Barlean’s orange flavored fish oil, but Nordic Naturals or Carlson’s also produce high quality oils and come in various flavors (lemon works quite nice). Have the patient make a shake for breakfast, the Peach/Mango or the Pineapple/Banana flavors are recommended. To the prepared shake, add 2 to 3 teaspoons of the oil and shake. The oil will bind with the protein and will be water-soluble. This enhances absorption and prevents the drink from seeming “oily”. Patients should notice an improvement in their symptoms within a week providing they do this every day. Advise the patient to store the opened bottle of oil in the refrigerator.
38,39
15The Relationship Between Insulin and Glucagon in the Pathogenesis of “Syndrome X”
36
36
EICOSANOIDS: (continued)
ACID/BASE BALANCING: The Importance of Protein and Alkaline Minerals As was mentioned in the introduction, one of the first clinical improvements patients reported after beginning on The Ideal Protein Protocol was the rapid resolution of their symptoms of gastro-esophageal reflux disease. Although, obviously quite pleased with this, we could not offer a medical explanation other than this: “Well, you’re eating far more healthier now and you’ve cut out all the ‘junk’, so it would stand to reason that you would improve from a GI perspective”.
However after interviewing scores of these patients and listening to what their typical dietary habits were prior to beginning ‘the protocol’, some observations were consistently noted. First, most over-weight individuals skipped meals usually breakfast and lunch in many cases. As a group, they preferred to “graze” on snacks (usually high-carb and fat containing) and consumed drinks such as juice, coffee, and soda (the diet variety more often than not). My partner, an MD, who ran a pediatric burn unit in a South African hospital at the time, commented that most of these people were not getting an adequate amount of protein in their daily diet. Burn victims, he said, would be placed on a diet ensuring 4 grams of protein per kilogram of lean body mass whereas “normal individuals” should receive about 1 gram per kilogram of body mass (approximately ½ gram per pound of lean body mass). These figures coincide with the USDA nutritional guidelines that states approximately 22 to 25% of the total caloric intake in a 2000 Kcal per day diet should be of protein. 25% of 2000 Kcal would be 500 Kcal derived from protein sources. Protein contains 4 Kcals of energyper gram so that would be about 125 grams of protein from whole food sources per day. On average, we absorb
only about 60% of the protein from meat, fish, poultry, etc. So in terms of actual protein, we would be talking about roughly 60% of 125 grams or about 75 grams of absorbable protein for a person weighing about 150 lbs (lean body weight). Remember, this is the recommended minimal amount. An athlete in training would be advised to consume about twice that amount. These patients were getting considerably less on a daily basis. We wondered if this simple fact was somehow related to their GERD (we knew their poor diet would obviously impact the “classic symptoms of Syndrome X”). After reviewing some basic texts on gastro-intestinal physiology, we discovered some interesting corollaries.
A Brief Review of the Digestive Process
When the stomach is empty the ‘gastric juice’ is not highly acidic (about 3.5 on the pH scale). Consuming a meal dilutes this acid further thus causing the pH to rise. When the pH of the gastric fluid reaches approximately 4.5 and coupled with the mechanical distention of the stomach wall, the secretion of gastrin is triggered. This hormone stimulates receptors on the parietal cells and the production of HCl is started (these same cells also produce intrinsic factor). This process requires an enormous amount of energy (underscored by the fact that these cells possess the most mitochondria of any cell in the body, save only cardiac muscle cells!). These parietal cells take water (H2O), salt (either sodium chloride and/or potassium chloride – NaCl or KCl) and a waste product, carbon dioxide (CO2) and transform these reactants into hydrochloric acid (HCl) and sodium and/or potassium bicarbonate (Na HCO3 or KHCO3 -
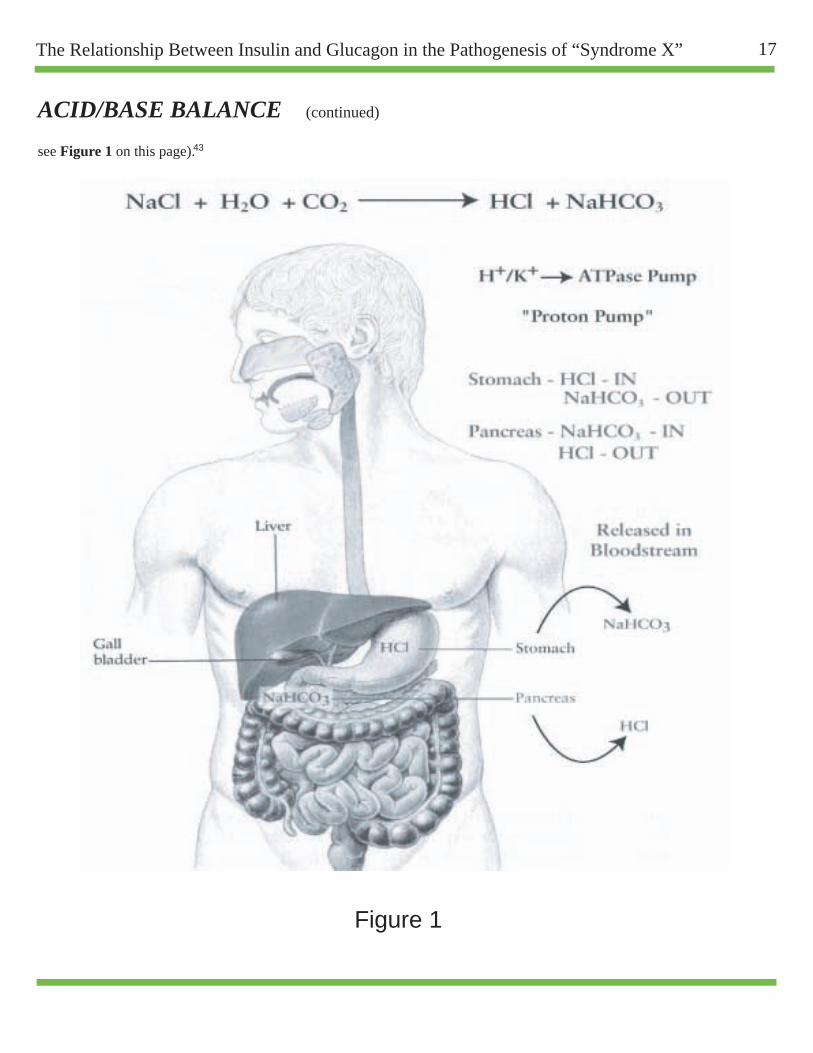
16 Mike P. Ciell R.Ph.
Figure 1
Figure 1
Figure 2
Figure 3
Type of foodCarbohydrate
Protein
Fat
Protein and Fat
High Protein and Low Carb
High Carb and Low Protein ++++++++++
++++
++++no change
+++++++ no change
++no change
no change
++++
Levine, S., et. al. "Surge in Childhood Obesity May Threaten a Generation." The St. Petersburg Times (as published in The Washington Post).(May 20, 2008): 1.
2
4
c
CHOLESTEROL (continued)
4
5
43
37
Metzger, B.E., et. al. "Hyperglycemia and Adverse Pregnancy Outcomes." N Engl J Med Vol. 358 No. 19 (May 8, 2008): 1191-2002.5
Rowan, J., A., et. al. "Metformin versus Insulin for the Treatment of Gestational Diabetes." N Engl J Med Vol. 358 No. 19 (May 8, 2008): 2003-20056
Gordan, S., "High Blood Sugar Tied to Pregnancy Complications." HealthDay News (May 2008): http://www.healthday.com7
20
41
Clinician's NotesDuring stages one and two of the Ideal Protein Protocoll, the dieter is allowed 2 teaspoons of olive oil (about 80 calories) per day. If the dieter suffers from any inflammatory condition (such as arthritis), fish oil or cod liver oil may be substituted for the olive oil. One particularly effective and very pleasant way to take this oil is as follows: Have the patient buy a good quality fish oil at a health food store. We recommend Barlean’s orange flavored fish oil, but Nordic Naturals or Carlson’s also produce high quality oils and come in various flavors (lemon works quite nice). Have the patient make a shake for breakfast, the Peach/Mango or the Pineapple/Banana flavors are recommended. To the prepared shake, add 2 to 3 teaspoons of the oil and shake. The oil will bind with the protein and will be water-soluble. This enhances absorption and prevents the drink from seeming “oily”. Patients should notice an improvement in their symptoms within a week providing they do this every day. Advise the patient to store the opened bottle of oil in the refrigerator.
38,39
35
17The Relationship Between Insulin and Glucagon in the Pathogenesis of “Syndrome X”
36
36
42
36
EICOSANOIDS: (continued)
Two Classes of EicosanoidsInsulin Dominant
Glucagon DominantLowers elevated blood sugar . . . . . . . . . . . . . . . . Raises low blood sugar
Shifts metabolism into storage mode . . . . . . . . Shifts metabolism into burning modeConverts glucose and protein to fat . . . . . . . . Converts protein and fat to glucose
Converts dietary fat to storage . . . . . . . . . . . Converts dietary fat to ketones and
sends them to the tissues for energy
Removes fat from blood and . . . . . . . . . . Releases fat from fat cells into the blood
Increases the body's production . . . . . . . . . . Decreases the body's production
Makes the kidneys retain excess fluid . . . . . . Makes the kidneys release excess fluid
Stimulates the growth of arterial . . . . . . . . . . . . . . Stimulates regression of arterial smooth muscle cells smooth muscle cells
Stimulates the use of glucose for energy . . . . . . Stimulates the use of fat for energy
Two Classes of Eicosanoids
Glucagon Dominant Series One Elcosanoids Series Two Elcosanoids
Act as vasodilators . . . . . . . . . . . . . . . . . . . . . Act as vasoconstrictors
Table 3. Two Classes of Eicosanoids40
Insulin Dominant
Increases endurances . . . . . . . . . . . . . . . . . . . . . Decreases endurances
Act as immune enhancers . . . . . . . . . . . . . . . . . . . . . Act as immune suppressors
Increases oxygen flow . . . . . . . . . . . . . . . . . . . . . Decreases oxygen flow
Prevents platelet aggregation . . . . . . . . . . . . . . . . . . . . . Causes platelet aggregation
Dialate airways . . . . . . . . . . . . . . . . . . . . . Constrict airways
Decrease pain . . . . . . . . . . . . . . . . . . . . . Increase pain
Decreases inflammation . . . . . . . . . . . . . . . . . . . . . Increases inflammation
Decrease cellular proliferation . . . . . . . . . . . . . . . . . . . . . Increase cellular proliferation
ACID/BASE BALANCE (continued) see Figure 1 on this page).
The “proton-pump” channels the acid into the cavity of the stomach and the bicarbonate is released into the mucus layer of the stomach (protecting it from the now very acidic conditions) and out to the blood stream. This is an extremely important physiological process and is called “The Alkaline Tide” in British medical texts. While this is occurring, the chief cells release pepsinogen which the strong acid environment converts to the active proteolytic enzyme pepsin. To summarize thus far, hydrochloric acid and sodium and/or potassium bicarbonate are produced (an acid and a base), the acid being pumped into the stomach, the bicarbonate into the blood stream and many calories of energy are expended.
At this point, the contents of the stomach are very acidic – below a pH of 3.0. Pepsin and the acid work together to unfold, or denature, any protein that was consumed during the meal. These two substances attack the amide linkages that join amino acids together in the protein macromolecule. As these bonds break (or are hydrolyzed) polypeptides are formed and a lot of the stomach’s acid is “consumed” in the process. Soon the lower pyloric sphincter opens and this acidic chyme begins to enter the duodenum. This triggers a number of physiological events. First, any glucose in the chyme stimulates the release of a group of very short-lived (half-life is about two minutes) but powerful substances called incretins. The two main ones are GIP (glucose-dependant insulinotropic peptide) and GLP-1 (glucagon-like peptide). Their effects are to increase insulin secretion and inhibit glucagon secretion, increase beta cell mass and insulin gene expression in the pancreas, and to inhibit acid secretion and gastric emptying in the stomach. In addition, GIP is thought to have effects on fatty acid metabolism through the stimulation of lipoprotein lipase activity in the adipocyte. The relatively short half-lives of these substances are due to their rapid degradation by the enzyme DPP-4 (dipeptidyl Peptidase-4). A new class of diabetic medications, DPP-4 inhibitors which includes sitagliptin (Januvia®), prolong the effects of these incretins thus increasing insulin production. These incretins are also thought to play a role in satiety. Whether or not these new DPP-4 inhibitors may be useful in helping obese, diabetic patients control their weight remains to be seen. However, increasing insulin levels and increasing lipoprotein lipase activity would seem counter-productive in terms of a benefit for weight loss.
18 Mike P. Ciell R.Ph.
Methods
Type of foodCarbohydrate
Protein
Fat
Protein and Fat
High Protein and Low Carb
High Carb and Low Protein ++++++++++
2
c
CHOLESTEROL (continued)
4
5
43
Clinician's Notes
38,39
17The Relationship Between Insulin and Glucagon in the Pathogenesis of “Syndrome X”
36
44
EICOSANOIDS: (continued)
ACID/BASE BALANCE (continued) The “proton-pump” channels the acid into the cavity of the stomach and the bicarbonate is released into the mucus layer of the stomach (protecting it from the now very acidic conditions) and out to the blood stream. This is an extremely important physiological process and is called “The Alkaline Tide” in British medical texts. While this is occurring, the chief cells release pepsinogen which the strong acid environment converts to the active proteolytic enzyme pepsin. To summarize thus far, hydrochloric acid and sodium and/or potassium bicarbonate are produced (an acid and a base), the acid being pumped into the stomach, the bicarbonate into the blood stream and many calories of energy are expended.
At this point, the contents of the stomach are very acidic – below a pH of 3.0. Pepsin and the acid work together to unfold, or denature, any protein that was consumed during the meal. These two substances attack the amide linkages that join amino acids together in the protein macromolecule. As these bonds break (or are hydrolyzed) polypeptides are formed and a lot of the stomach’s acid is “consumed” in the process. Soon the lower pyloric sphincter opens and this acidic chyme begins to enter the duodenum. This triggers a number of physiological events. First, any glucose in the chyme stimulates the release of a group of very short-lived (half-life is about two minutes) but powerful substances called incretins. The two main ones are GIP (glucose-dependant insulinotropic peptide) and GLP-1 (glucagon-like peptide). Their effects are to increase insulin secretion and inhibit glucagon secretion, increase beta cell mass and insulin gene expression in the pancreas, and to inhibit acid secretion and gastric emptying in the stomach. In addition, GIP is thought to have effects on fatty acid metabolism through the stimulation of lipoprotein lipase activity in the adipocyte. The relatively short half-lives of these substances are due to their rapid degradation by the enzyme DPP-4 (dipeptidyl Peptidase-4). A new class of diabetic medications, DPP-4 inhibitors which includes sitagliptin (Januvia®), prolong the effects of these incretins thus increasing insulin production. These incretins are also thought to play a role in satiety. Whether or not these new DPP-4 inhibitors may be useful in helping obese, diabetic patients control their weight remains to be seen. However, increasing insulin levels and increasing lipoprotein lipase activity would seem counter-productive in terms of a benefit for weight loss.
Secretin Inhibits Gastric Acid Production and Stimulates Bicarbonate Production
In addition to causing the release of the incretins, the entry of the chyme into the duodenum triggers the release of another powerful hormone called secretin. Secretin
signals the pancreas (and the liver to some degree) to begin the same reaction the parietal cells (“G” cells) of the stomach have been doing – the production of HCl and bicarbonate. This hormone also inhibits further production of gastric acid (it was previously thought that GIP was responsible for this inhibition, but now we know GIP only inhibits this in pharmacological amounts not physiological). In this process, bicarbonate (or pancreaticjuice) is delivered to the duodenum via the pancreatic duct along with the various pancreatic enzymes. The epithelial cells of the biliary ducts also produce bicarbonate in preparation for the release of bile. The pH of the intestine must be slightly alkaline for the pancreatic enzymes (the lipases, proteases and amylases) to be maximally effective. Therefore, the body must neutralize all of the acid ‘sent down’ by the stomach, but this presents a potential problem. The pancreas cannot produce bicarbonate without producing hydrochloric acid. The resultant acid is delivered to the blood stream and will have a very serious effect on the blood’s pH if the parietal cells did not deliver sufficient bicarbonate during the stomach’s phase of digestion. Balancing this system, again through what we eat and drink, is crucial for optimal health. Many consequences of poor ‘dietary acid/base balancing’ are all too common in the Syndrome X population.
So Why Does GERD Improve on The Ideal Protein Protocol?
Our clinical finding in which the symptoms of GERD significantly improve or totally resolve within 7 to 10 days of starting the protocol is not an isolated observation. A study published in 2006 reported the same finding within six days of initiating a diet containing 20 grams or less of carbohydrates per day. The authors, although impressed with the results, could offer no mechanism by which the improvements occur.
We believe that it may be the protein that is consumed with a meal that may be the key factor in the observed clinical improvements. When protein is acted upon by HCl and pepsin in the stomach, much of the acid is ‘consumed’ or neutralized. In contrast, a meal containing large amounts of carbohydrates and fat with very little protein would not significantly reduce the acid present. Perhaps these higher levels of acid over a period of time may exacerbate symptoms associated with GERD. The protein blends used in the Ideal Protein Protocol contain large amounts of protein isolates. These are pure proteins and would facilitate digestion in that pepsin and HCl may more easily react with them as opposed to whole protein such as meat. More complete digestion ensures more of the acid is consumed.
18 Mike P. Ciell R.Ph.
Methods
Type of foodCarbohydrate
Protein
Fat
Protein and Fat
High Protein and Low Carb
High Carb and Low Protein ++++++++++
2
c
CHOLESTEROL (continued)
4
5
43
Clinician's Notes
38,39
19The Relationship Between Insulin and Glucagon in the Pathogenesis of “Syndrome X”
36
36
EICOSANOIDS: (continued)
Insulin Dominant
ACID/BASE BALANCE (continued) The Importance of Dietary Protein in Acid/Base Balance
The physiological pH of the arterial blood must be maintained between 7.3 and 7.4. This narrow range is exquisitely controlled by many mechanisms and involves the lungs, the kidneys, the stomach and the pancreas. For example, the lungs through hyperventilation may expel more carbon dioxide which would exert an alkalizing effect on the blood. The kidneys may adjust the pH of the urine to assist in maintaining acid/base equilibrium. As a rule, these processes are largely autonomic, and we can do relatively little to effect their functioning. It is a different case with the stomach and pancreas. Here we can greatly influence the ability to buffer our blood through our choice of foods.
When a meal is consumed, the stomach is stimulated to produce hydrochloric acid (HCl) and sodium and/or potassium bicarbonate (NaHCO3 or KHCO3). These products are produced in a one to one ratio; that is for every one molecule of acid, there is one molecule of bicarbonate produced. To illustrate how proper acid/base balance should work, it is helpful to assign some fictitious values. Let us say the stomach produces 10 molecules of HCl. Then, it would also produce 10 molecules of bicarbonate which would be released in the blood stream. In this example, let’s assume our “patient” has eaten a meal which contains an adequate amount of protein and that 5 molecules of acid are ‘used up’ in the portion of the digestive process. Thus, as the stomach begins to empty into the duodenum, 5 molecules of “unused” acid will also enter. The pancreas must neutralize this acid and adjust the pH to be slightly alkaline. To accomplish this, it must produce at least 6 molecules of bicarbonate (5 to neutralize the acid and 1 to slightly alkalinize the environment). To produce 6 molecules of bicarbonate, it must also release 6 molecules of acid into the blood stream. Because the stomach introduced 10 molecules of bicarbonate into the blood, the addition of 6 molecules of acid here present no problem. Six molecules of the bicarbonate would neutralize the acid and we would be left with 4 molecules of bicarbonate in the blood --or-- a positive bicarbonate balance is maintained.
If the meal, on the other hand, contained less than an adequate amount of protein, gastric acid levels would remain much higher – possibly contributing to GERD and, of course, would contribute to a smaller bicarbonate balance in the blood.
The Effects of Drinking Soda
We are often asked if diet sodas are permitted on the Ideal Protein Protocol, Diet Coke® being, by far, the most popular brand inquired about. The patient reasons that if the soda doesn’t contain any sugar or calories it must be fine. The answer is it is not fine!
Soda drinks are very acidic and the “brown-colored” ones are the most acidic (root beer, Dr. Pepper®, Coca Cola® and Pepsi®). These drinks range from 3.2 to 2.5 on the pH scale and will have a very negative effect of acid/base balance.
Recall that the stimulus for the parietal cells’ production of HCl/bicarbonate is the raising of the gastric pH to approximately 4.5 (coupled with the mechanical distention of the stomach wall). If the patient has a “Diet Coke®” or two with his/her meal (pH 2.5), the production of HCl/bicarbonate will be severely compromised. Now here’s the problem, when all of the acid from the soda enters the duodenum, the pancreas must neutralize it with bicarbonate, releasing acid into the blood as a consequence. But if the patient made very little, if any, bicarbonate during the stomach’s phase of the digestive process, we will now have a large amount of “unopposed acid” entering the blood stream (a negative bicarbonate balance) and the pH of the blood will begin to fall requiring the body to resort to another means of correcting this imbalance.
It is easy to imagine the ‘metabolic havoc’ caused by a meal of “large fries and a big soda”. High glycemic carbohydrates cause an outpouring of insulin with trans-fats leading to the production of the series two eicosanoids and a large influx of acid, with hardly any protein. Eating like this on a regular basis is a prescription for chronic disease.
How Bicarbonate Buffers the Blood
Maintaining the proper concentration of bicarbonate in the blood is hugely important in acid/base homeostasis. The bicarbonate ion is a buffer, a substance that resists changes in pH both increases and decreases. In the course of normal metabolism, the cells of the body produce acidic wastes (which will be generically represented here by HCl). As these wastes enter the blood stream, they react with sodium/potassium bicarbonate (“the alkaline tide”) so that they exert no effect on the pH level of the blood. In these reactions, a water soluble
20 Mike P. Ciell R.Ph.
Methods
Type of foodCarbohydrate
Protein
Fat
Protein and Fat
High Protein and Low Carb
High Carb and Low Protein ++++++++++
2
c
CHOLESTEROL (continued)
4
5
45
Clinician's Notes
47
19The Relationship Between Insulin and Glucagon in the Pathogenesis of “Syndrome X”
46
36
EICOSANOIDS: (continued)
Insulin Dominant
ACID/BASE BALANCE (continued) salt (NaCl or KCl) is produced along with a weak acid – carbonic acid (H2CO3). Carbonic acid is relatively short-lived and one of two metabolic fates awaits it. First an enzyme, alpha carbonic anhydrase (along with catalytic amounts of zinc) may break down this molecule to water (H2O) and carbon dioxide (CO2) which is exhaled by the lungs. However, if the blood should become too alkaline, the carbonic acid reacts with the alkaline agent (represented here by OH-) forming water and regenerating the original bicarbonate buffer. This is a beautifully balanced system! These reactions can be written as the following chemical equations:
1. HCl + KHCO3 = KCl + H2CO3 (this carbonic acid may then react as follows)
2a. H2CO3 + a-carbonic anhydrase/ Zinc = H2O + CO2 (exhaled via the lungs)
OR
if the blood becomes too alkaline, this reaction occurs:
2b. KOH + H2CO3 = KHCO3 + H2O
(The alkalinity is reduced by producing water and the original bicarbonate is regenerated!)
Bicarbonate Levels Decline As We Age
Lynda Frassetto, MD (a nephrologist from the University of California, San Francisco) tracked the serum bicarbonate levels of over four thousand patients. She found that bicarbonate levels steadily declined, until by age 90 they were 18% of what they were at age 45.This is very interesting in that it is precisely in this age group (over 45) where certain chronic conditions begin to appear- osteoporosis for one. As the body’s bicarbonate levels decline, its buffering capacity for acidic wastes also declines. This would cause a slight decline in the pH of the blood. In a study published in February 2008, Arnett showed that osteoclastic activity is directly related to pH. He stated that “we discovered that bone resorption by cultured osteoclasts are stimulated directly by acid. The stimulatory is near-maximal at pH 7.0; whereas above pH 7.4 resorption is switched off. In bone organ cultures, H+-stimulated bone mineral release is almost entirely osteoclast-mediated with a negligible physiochemical component.” What this illustrates is profound: As the body struggles to maintain its physiological pH of 7.3 to 7.4, if there is an insufficient amount of bicarbonate to buffer acids, the body will use alkaline minerals from its bone stores to compensate. Arnett concludes that “Diets or drugs that shift acid–base balance in the alkaline direction may provide useful treatments for bone loss disorders.”
Maintaining Our Bicarbonate Levels I recall as a pharmacy student being told by a professor of therapeutics to ‘never tell an ulcer patient to drink milk or to take antacids for stomach pain, although they may give a temporary relief, acid rebound will occur and their symptoms will quickly worsen.’ This is a clinical illustration of our discussion about how the stomach produces acid. Here alkaline minerals, perhaps in the form of an antacid are consumed. The pH level of the gastric juice increases (the stomach becomes less acidic), and the patient experiences a relief from the burning sensation; however as the pH continues to rise (to about 4.5), gastrin is secreted and the stomach starts to produce HCl, and the burning returns – more severely. Remember as we produce acid, we also are putting bicarbonate in the blood stream and thereby maintaining our blood’s buffering capacity.
The Ideal Protein Protocol is a very alkaline program. Many of the foods are made from whey isolates and concentrates. Whey is a unique protein in that it is considered an “alkalizing food” as opposed to most proteins which are considered acidic. People attempting protein diets using whole food sources of protein must keep this in mind. Failure to maintain proper acid/base balance can lead to consequences such as gout or kidney stones (many people following “Atkins type” diets had these experiences). In the Ideal Protein Program, patients are required to take alkaline mineral supplements containing calcium, magnesium, and potassium. These minerals are balanced with the foods they are eating to ensure a proper amount of these minerals – never a hyper amount! The patients are also required to consume four cups of fresh vegetables per day, contributing additional alkalizing minerals and anti-oxidants. Ideal Protein participants are further encouraged to use sea salt, pink or gray in color instead of commercially bleached table salt on their foods, which provide a rich source of alkaline minerals, and they are educated on the perils of highly acidic soft drinks.
Finally, and perhaps most significant, is the fact that so many people suffering from GERD have been able to discontinue their proton-pump inhibitors. These drugs inhibit the Na+/K+ “pump” which effectively shuts down the stomach’s ability to produce acid and consequently bicarbonate. How long term use of these pharmaceuticals impact the overall physiology has not been studied; however, it has been an observation, both in our clinic and in the pharmacy, that many patients taking these medications are also taking a biphosphonate (such as Fosmax®, Actonel®, or Boniva®). If the body becomes too acidic, perhaps due too insufficient bicarbonate buffering, it must draw on the alkaline mineral reserves ofthe bones. Should we inhibit this process by drugs such
47
48
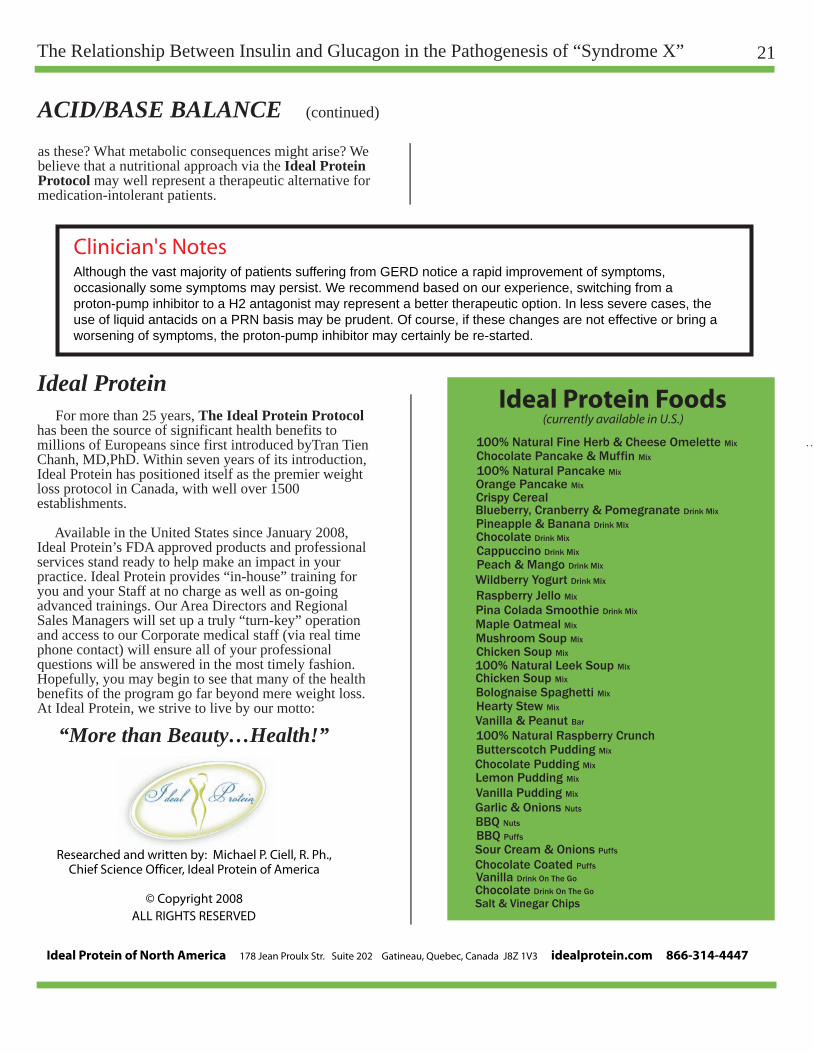
20 Mike P. Ciell R.Ph.
Methods
Figure 1
Figure 2
Figure 3
Type of foodCarbohydrate
Protein
Fat
Protein and Fat
High Protein and Low Carb
High Carb and Low Protein ++++++++++
++++
++++no change
+++++++ no change
++no change
no change
++++
2
c
CHOLESTEROL (continued)
4
5
45
3720
41
Clinician's NotesAlthough the vast majority of patients suffering from GERD notice a rapid improvement of symptoms, occasionally some symptoms may persist. We recommend based on our experience, switching from a proton-pump inhibitor to a H2 antagonist may represent a better therapeutic option. In less severe cases, the use of liquid antacids on a PRN basis may be prudent. Of course, if these changes are not effective or bring a worsening of symptoms, the proton-pump inhibitor may certainly be re-started.47
35
21The Relationship Between Insulin and Glucagon in the Pathogenesis of “Syndrome X”
46
36
42
36
EICOSANOIDS: (continued)
Ideal Protein Foods
Insulin Dominant
Glucagon DominantLowers elevated blood sugar . . . . . . . . . . . . . . . . Raises low blood sugar
(currently available in U.S.)
Converts glucose and protein to fat . . . . . . . . Converts protein and fat to glucose
Converts dietary fat to storage . . . . . . . . . . . Converts dietary fat to ketones and
sends them to the tissues for energy
Removes fat from blood and . . . . . . . . . . Releases fat from fat cells into the blood
Increases the body's production . . . . . . . . . . Decreases the body's production
Makes the kidneys retain excess fluid . . . . . . Makes the kidneys release excess fluid
Two Classes of Eicosanoids
Glucagon Dominant Series One Elcosanoids Series Two Elcosanoids
Act as vasodilators . . . . . . . . . . . . . . . . . . . . . Act as vasoconstrictors
Table 3. Two Classes of Eicosanoids40
Insulin Dominant
Increases endurances . . . . . . . . . . . . . . . . . . . . . Decreases endurances
Act as immune enhancers . . . . . . . . . . . . . . . . . . . . . Act as immune suppressors
Increases oxygen flow . . . . . . . . . . . . . . . . . . . . . Decreases oxygen flow
Prevents platelet aggregation . . . . . . . . . . . . . . . . . . . . . Causes platelet aggregation
Dialate airways . . . . . . . . . . . . . . . . . . . . . Constrict airways
Decrease pain . . . . . . . . . . . . . . . . . . . . . Increase pain
Decreases inflammation . . . . . . . . . . . . . . . . . . . . . Increases inflammation
Decrease cellular proliferation . . . . . . . . . . . . . . . . . . . . . Increase cellular proliferation
ACID/BASE BALANCE (continued) as these? What metabolic consequences might arise? We believe that a nutritional approach via the Ideal Protein Protocol may well represent a therapeutic alternative for medication-intolerant patients.
47
48
Ideal Protein For more than 25 years, The Ideal Protein Protocol has been the source of significant health benefits to millions of Europeans since first introduced byTran Tien Chanh, MD,PhD. Within seven years of its introduction,Ideal Protein has positioned itself as the premier weight loss protocol in Canada, with well over 1500establishments.
Available in the United States since January 2008, Ideal Protein’s FDA approved products and professional services stand ready to help make an impact in your practice. Ideal Protein provides “in-house” training for you and your Staff at no charge as well as on-going advanced trainings. Our Area Directors and Regional Sales Managers will set up a truly “turn-key” operation and access to our Corporate medical staff (via real time phone contact) will ensure all of your professional questions will be answered in the most timely fashion. Hopefully, you may begin to see that many of the health benefits of the program go far beyond mere weight loss. At Ideal Protein, we strive to live by our motto:
“More than Beauty…Health!”
Blueberry, Cranberry & Pomegranate Drink Mix . . . . . . . . . . . . . . . . . . . . . . . . . . . . . . . . . . . . . . . . . . . . . . . . . . . . . . . . . . . . . . . . . . . . . . . . . . . . . . . . . . . . . XPineapple & Banana Drink Mix . . . . . . . . . . . . . . . . . . . . . . . . . . . . . . . . . . . . . . . . . . . . . . . . . . . . . . . . . . . . . . . . . . . . . . . . . . . . . . . . . . . . . XChocolate Drink Mix . . . . . . . . . . . . . . . . . . . . . . . . . . . . . . . . . . . . . . . . . . . . . . . . . . . . . . . . . . . . . . . . . . . . . . . . . . . . . . . XCappuccino Drink Mix . . . . . . . . . . . . . . . . . . . . . . . . . . . . . . . . . . . . . . . . . . . . . . . . . . . . . . . . . . . . . . . . . . . . . . . . . . . . . XPeach & Mango Drink Mix . . . . . . . . . . . . . . . . . . . . . . . . . . . . . . . . . . . . . . . . . . . . . . . . . . . . . . . . . . . . . . . . . . . . . . . .XWildberry Yogurt Drink Mix . . . . . . . . . . . . . . . . . . . . . . . . . . . . . . . . . . . . . . . . . . . . . . . . . . . . . . . . . . . . . . . . . . . . . . X. . . . . . . . . . . . . . . . . . . X
Pina Colada Smoothie Drink Mix . . . . . . . . . . . . . . . . . . . . . . . . . . . . . . . . . . . . . . . . . . . . . . . . . . . . . . . . . . . . . . . X
Orange Pancake Mix . . . . . . . . . . . . . . . . . . . . . . . . . . . . . . . . . . . . . . . . . . . . . . . . . . . . . . . . . . . . . X . . . . . . . . . . . . X . . . . . . . . . . . . . . . . . .X100% Natural Pancake Mix . . . . . . . . . . . . . . . . . . . . . . . . . . . . . . . . . . . . . . . . . . . . . . . . . . . . X . . . . . . . . . . . . X . . . . . . . . . . . . . . . . . .XChocolate Pancake & Muffin Mix . . . . . . . . . . . . . . . . . . . . . . . . . . . . . . . . . . . . . . . . . . . . . X . . . . . . . . . . . . X . . . . . . . . . . . . . . . . . .X100% Natural Fine Herb & Cheese Omelette Mix . . . . . . . . . . . . . . . . . . . . . . . . . X . . . . . . . . . . . . X . . . . . . . . . . . . . . . . . .X
Crispy Cereal . . . . . . . . . . . . . . . . . . . . . . . . . . . . . . . . . . . . . . . . . . . . . . . . . . . . . . . . . . . . . . . . . . . . . . X . . . . . . . . . . . . X
Maple Oatmeal Mix . . . . . . . . . . . . . . . . . . . . . . . . . . . . . . . . . . . . . . . . . . . . . . . . . . . . . . . . . . . . . . . X . . . . . . . . . . . . XMushroom Soup MixChicken Soup Mix . . . . . . . . . . . . . . . . . . . . . . . . . . . . . . . . . . . . . . . . . . . . . . . . . . . . . . . . . . . . . . . . . .X100% Natural Leek Soup Mix . . . . . . . . . . . . . . . . . . . . . . . . . . . . . . . . . . . . . . . . . . . . . . . . . . X
Bolognaise Spaghetti Mix . . . . . . . . . . . . . . . . . . . . . . . . . . . . . . . . . . . . . . . . . . . . . . . . . . . . . . .XHearty Stew Mix . . . . . . . . . . . . . . . . . . . . . . . . . . . . . . . . . . . . . . . . . . . . . . . . . . . . . . . . . . . . . . . . . . .X
Raspberry Jello Mix . . . . . . . . . . . . . . . . . . . . . . . . . . . . . . . . . . . . . . . . . . . . . . . . . . . . . . . . . . . . . . . . . . . . . . . . . . . . . . . . . . . . . . . . . . . . . . . . . . . . . . . . . . . . . . . . . . . . . . . . . X
Butterscotch Pudding Mix . . . . . . . . . . . . . . . . . . . . . . . . . . . . . . . . . . . . . . . . . . . . . . . . . . . . . . . X . . . . . . . . . . . . XChocolate Pudding Mix . . . . . . . . . . . . . . . . . . . . . . . . . . . . . . . . . . . . . . . . . . . . . . . . . . . . . . . . . . X . . . . . . . . . . . . XLemon Pudding Mix . . . . . . . . . . . . . . . . . . . . . . . . . . . . . . . . . . . . . . . . . . . . . . . . . . . . . . . . . . . . . . . X . . . . . . . . . . . . XVanilla Pudding Mix . . . . . . . . . . . . . . . . . . . . . . . . . . . . . . . . . . . . . . . . . . . . . . . . . . . . . . . . . . . . . . . X . . . . . . . . . . . . X
100% Natural Raspberry Crunch
Garlic & Onions Nuts . . . . . . . . . . . . . . . . . . . . . . . . . . . . . . . . . . . . . . . . . . . . . . . . . . . . . . . . . . . . . .XBBQ Nuts . . . . . . . . . . . . . . . . . . . . . . . . . . . . . . . . . . . . . . . . . . . . . . . . . . . . . . . . . . . . . . . . . . . . . . . . . . . . XBBQ Puffs . . . . . . . . . . . . . . . . . . . . . . . . . . . . . . . . . . . . . . . . . . . . . . . . . . . . . . . . . . . . . . . . . . . . . . . . . . . .X
Vanilla & Peanut Bar . . . . . . . . . . . . . . . . . . . . . . . . . . . . . . . . . . . . . . . . . . . . . . . . . . . . . . . . . . . . .X . . . . . . . . . . . . X
Sour Cream & Onions Puffs . . . . . . . . . . . . . . . . . . . . . . . . . . . . . . . . . . . . . . . . . . . . . . . . . . . . . XChocolate Coated Puffs . . . . . . . . . . . . . . . . . . . . . . . . . . . . . . . . . . . . . . . . . . . . . . . . . . . . . . . . . . X . . . . . . . . . . . . XVanilla Drink On The Go . . . . . . . . . . . . . . . . . . . . . . . . . . . . . . . . . . . . . . . . . . . . . . . . . . . . . . . . . . . . . . . X . . . . . . . . . . . . XChocolate Drink On The Go . . . . . . . . . . . . . . . . . . . . . . . . . . . . . . . . . . . . . . . . . . . . . . . . . . . . . . . . . . X . . . . . . . . . . . . X
Chicken Soup Mix . . . . . . . . . . . . . . . . . . . . . . . . . . . . . . . . . . . . . . . . . . . . . . . . . . . . . . . . . . . . . . . . X
Salt & Vinegar Chips . . . . . . . . . . . . . . . . . . . . . . . . . . . . . . . X
Researched and written by: Michael P. Ciell, R. Ph.,Chief Science Officer, Ideal Protein of America
© Copyright 2008
Ideal Protein of North America 178 Jean Proulx Str. Suite 202 Gatineau, Quebec, Canada J8Z 1V3 idealprotein.com 866-314-4447
ALL RIGHTS RESERVED
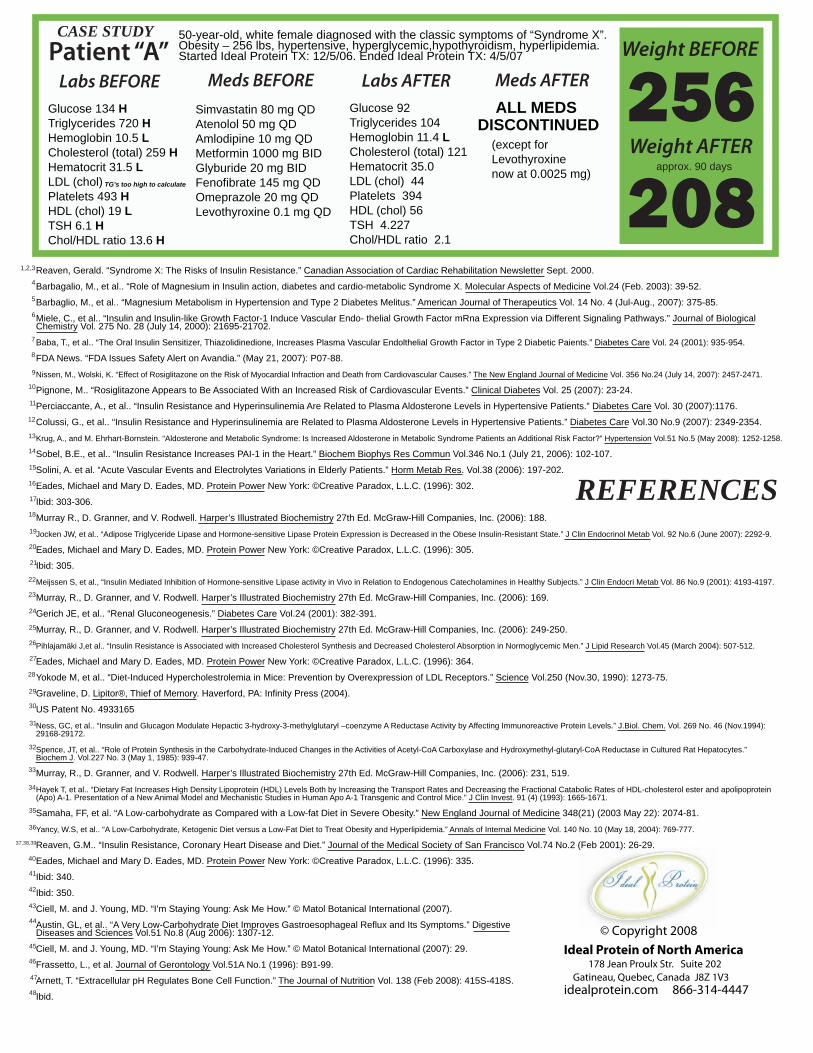
20
Methods
Carbohydrate
Protein
Fat
Protein and Fat
High Protein and Low Carb
2
4
c
CHOLESTEROL
4
5
45
5
6
7
47
1,2,3
36
EICOSANOIDS:
Insulin Dominant
47
48
© Copyright 2008 Ideal Protein of North America
178 Jean Proulx Str. Suite 202Gatineau, Quebec, Canada J8Z 1V3
idealprotein.com 866-314-4447
Patient “A”50-year-old, white female diagnosed with the classic symptoms of “Syndrome X”. Obesity – 256 lbs, hypertensive, hyperglycemic,hypothyroidism, hyperlipidemia. Started Ideal Protein TX: 12/5/06. Ended Ideal Protein TX: 4/5/07
Meds BEFORE
CASE STUDY
Labs BEFORE Meds AFTERLabs AFTERSimvastatin 80 mg QDAtenolol 50 mg QDAmlodipine 10 mg QDMetformin 1000 mg BIDGlyburide 20 mg BIDFenofibrate 145 mg QDOmeprazole 20 mg QDLevothyroxine 0.1 mg QD
Glucose 134 H Triglycerides 720 HHemoglobin 10.5 L Cholesterol (total) 259 HHematocrit 31.5 L LDL (chol) Platelets 493 H HDL (chol) 19 LTSH 6.1 H Chol/HDL ratio 13.6 H
TG’s too high to calculate
Glucose 92 Triglycerides 104Hemoglobin 11.4 L Cholesterol (total) 121Hematocrit 35.0 LDL (chol) 44 Platelets 394 HDL (chol) 56TSH 4.227 Chol/HDL ratio 2.1
ALL MEDS DISCONTINUED
(except for Levothyroxinenow at 0.0025 mg)
Weight BEFORE
Weight AFTERapprox. 90 days
256208
Reaven, Gerald. “Syndrome X: The Risks of Insulin Resistance.” Canadian Association of Cardiac Rehabilitation Newsletter Sept. 2000.
Barbagalio, M., et al.. “Role of Magnesium in Insulin action, diabetes and cardio-metabolic Syndrome X. Molecular Aspects of Medicine Vol.24 (Feb. 2003): 39-52.
Barbaglio, M., et al.. “Magnesium Metabolism in Hypertension and Type 2 Diabetes Melitus.” American Journal of Therapeutics Vol. 14 No. 4 (Jul-Aug., 2007): 375-85.
Miele, C., et al.. “Insulin and Insulin-like Growth Factor-1 Induce Vascular Endo- thelial Growth Factor mRna Expression via Different Signaling Pathways.” Journal of Biological Chemistry Vol. 275 No. 28 (July 14, 2000): 21695-21702.
Baba, T., et al.. “The Oral Insulin Sensitizer, Thiazolidinedione, Increases Plasma Vascular Endolthelial Growth Factor in Type 2 Diabetic Paients.” Diabetes Care Vol. 24 (2001): 935-954.
FDA News. “FDA Issues Safety Alert on Avandia.” (May 21, 2007): P07-88.
Nissen, M., Wolski, K. “Effect of Rosiglitazone on the Risk of Myocardial Infraction and Death from Cardiovascular Causes.” The New England Journal of Medicine Vol. 356 No.24 (July 14, 2007): 2457-2471.
Pignone, M.. “Rosiglitazone Appears to Be Associated With an Increased Risk of Cardiovascular Events.” Clinical Diabetes Vol. 25 (2007): 23-24.
Perciaccante, A., et al.. “Insulin Resistance and Hyperinsulinemia Are Related to Plasma Aldosterone Levels in Hypertensive Patients.” Diabetes Care Vol. 30 (2007):1176.
Colussi, G., et al.. “Insulin Resistance and Hyperinsulinemia are Related to Plasma Aldosterone Levels in Hypertensive Patients.” Diabetes Care Vol.30 No.9 (2007): 2349-2354.
Krug, A., and M. Ehrhart-Bornstein. “Aldosterone and Metabolic Syndrome: Is Increased Aldosterone in Metabolic Syndrome Patients an Additional Risk Factor?” Hypertension Vol.51 No.5 (May 2008): 1252-1258.
Sobel, B.E., et al.. “Insulin Resistance Increases PAI-1 in the Heart.” Biochem Biophys Res Commun Vol.346 No.1 (July 21, 2006): 102-107.
Solini, A. et al. “Acute Vascular Events and Electrolytes Variations in Elderly Patients.” Horm Metab Res. Vol.38 (2006): 197-202.
Eades, Michael and Mary D. Eades, MD. Protein Power New York: ©Creative Paradox, L.L.C. (1996): 302.
Ibid: 303-306.
Murray R., D. Granner, and V. Rodwell. Harper’s Illustrated Biochemistry 27th Ed. McGraw-Hill Companies, Inc. (2006): 188.
Jocken JW, et al.. “Adipose Triglyceride Lipase and Hormone-sensitive Lipase Protein Expression is Decreased in the Obese Insulin-Resistant State.” J Clin Endocrinol Metab Vol. 92 No.6 (June 2007): 2292-9.
Eades, Michael and Mary D. Eades, MD. Protein Power New York: ©Creative Paradox, L.L.C. (1996): 305.
Ibid: 305.
Meijssen S, et al., “Insulin Mediated Inhibition of Hormone-sensitive Lipase activity in Vivo in Relation to Endogenous Catecholamines in Healthy Subjects.” J Clin Endocri Metab Vol. 86 No.9 (2001): 4193-4197.
Murray, R., D. Granner, and V. Rodwell. Harper’s Illustrated Biochemistry 27th Ed. McGraw-Hill Companies, Inc. (2006): 169.
Gerich JE, et al.. “Renal Gluconeogenesis.” Diabetes Care Vol.24 (2001): 382-391.
Murray, R., D. Granner, and V. Rodwell. Harper’s Illustrated Biochemistry 27th Ed. McGraw-Hill Companies, Inc. (2006): 249-250.
Pihlajamäki J,et al.. “Insulin Resistance is Associated with Increased Cholesterol Synthesis and Decreased Cholesterol Absorption in Normoglycemic Men.” J Lipid Research Vol.45 (March 2004): 507-512.
Eades, Michael and Mary D. Eades, MD. Protein Power New York: ©Creative Paradox, L.L.C. (1996): 364.
Yokode M, et al.. “Diet-Induced Hypercholestrolemia in Mice: Prevention by Overexpression of LDL Receptors.” Science Vol.250 (Nov.30, 1990): 1273-75.
Graveline, D. Lipitor®, Thief of Memory. Haverford, PA: Infinity Press (2004).
US Patent No. 4933165
Ness, GC, et al.. “Insulin and Glucagon Modulate Hepactic 3-hydroxy-3-methylglutaryl –coenzyme A Reductase Activity by Affecting Immunoreactive Protein Levels.” J.Biol. Chem. Vol. 269 No. 46 (Nov.1994): 29168-29172.
Spence, JT, et al.. “Role of Protein Synthesis in the Carbohydrate-Induced Changes in the Activities of Acetyl-CoA Carboxylase and Hydroxymethyl-glutaryl-CoA Reductase in Cultured Rat Hepatocytes.” Biochem J. Vol.227 No. 3 (May 1, 1985): 939-47.
Murray, R., D. Granner, and V. Rodwell. Harper’s Illustrated Biochemistry 27th Ed. McGraw-Hill Companies, Inc. (2006): 231, 519.
Hayek T, et al.. “Dietary Fat Increases High Density Lipoprotein (HDL) Levels Both by Increasing the Transport Rates and Decreasing the Fractional Catabolic Rates of HDL-cholesterol ester and apolipoprotein (Apo) A-1. Presentation of a New Animal Model and Mechanistic Studies in Human Apo A-1 Transgenic and Control Mice.” J Clin Invest. 91 (4) (1993): 1665-1671.
Samaha, FF, et al. “A Low-carbohydrate as Compared with a Low-fat Diet in Severe Obesity.” New England Journal of Medicine 348(21) (2003 May 22): 2074-81.
Yancy, W.S, et al.. “A Low-Carbohydrate, Ketogenic Diet versus a Low-Fat Diet to Treat Obesity and Hyperlipidemia.” Annals of Internal Medicine Vol. 140 No. 10 (May 18, 2004): 769-777.
Reaven, G.M.. “Insulin Resistance, Coronary Heart Disease and Diet.” Journal of the Medical Society of San Francisco Vol.74 No.2 (Feb 2001): 26-29.
Eades, Michael and Mary D. Eades, MD. Protein Power New York: ©Creative Paradox, L.L.C. (1996): 335.
Ibid: 340.
Ibid: 350.
Ciell, M. and J. Young, MD. “I’m Staying Young: Ask Me How.” © Matol Botanical International (2007).
Austin, GL, et al.. “A Very Low-Carbohydrate Diet Improves Gastroesophageal Reflux and Its Symptoms.” Digestive Diseases and Sciences Vol.51 No.8 (Aug 2006): 1307-12.
Ciell, M. and J. Young, MD. “I’m Staying Young: Ask Me How.” © Matol Botanical International (2007): 29.
Frassetto, L., et al. Journal of Gerontology Vol.51A No.1 (1996): B91-99.
Arnett, T. “Extracellular pH Regulates Bone Cell Function.” The Journal of Nutrition Vol. 138 (Feb 2008): 415S-418S.
Ibid.
REFERENCES
4
5
6
7
8
9
10
13
11
11
14
12
16
19
20
15
18
17
29
21
28
2211
24
23
27
25
26
32
34
33
35
36
37,38,39
40
30
31
41
11
42
45
44
43
48
47
46