Embed Size (px)
Citation preview
Business Management Dynamics
Vol.5, No.9, Mar 2016, pp.01-14
©Society for Business and Management Dynamics
The Relationship between the List of Values and Consumer Decision Making Styles in the Context of Clothing Products
Kadri Gokhan YILMAZ1, Aybegum GUNGORDU2 and Tuba YUMUSAK3 Abstract The purpose of this study is to measure the relationship between list of values and consumers’ decision making styles. We drew on Sproles and Kendall (1986)’s CSI scale and Kahle, Liu and Watkins (1992)’s LOV scale. We carried out surveys on 375 undergraduate students. We used reliability analysis, exploratory factor analysis, confirmatory factor analysis, Pearson correlation analysis and simple linear regression analysis. In conclusion, we found that there is a significant and positive relationship between some values and some consumer decision making styles.
Key words: List of Values, Consumer Decision Making Styles, Consumer Style Inventory, CSI, LOV
Available online
www.bmdynamics.com ISSN: 2047-7031
INTRODUCTION
Schwartz and Bilsky (1987) state that values are concepts or beliefs, are about desirable end states or behaviors, transcend specific situations, guide selection or evaluation of behavior or events, and are ordered by relative importance. They affect the attitude and behavior of an individual (Odabasi & Baris, 2014). In many cases, values are universal (Solomon, 2015). Furthermore, values are more stable over time than attitudes because they are more central to an individual’s system (Rokeach, 1973). Scholars use three scales such as Rokeach Values System, Values and Lifestyles (VALS) and List of Values in Values Research (Odabasi & Baris, 2014). Values are both an indicator and a consequence of behavior (Unal & Ercis, 2006). Values affect consumer decision making styles which explain the attitude of the consumer towards purchasing decision (Unal & Ercis, 2006). Furthermore, decision making styles can be interpreted as basic buying decision making attitudes that consumers adhere to, even when they are applied to different goods, services or purchasing situations, in a few words they do not change with time (Walsh et al., 2001). Consumer decision making styles are orientations which are effective both emotionally and ideationally before, after and during the consumer buying process (Unal & Ercis, 2006). Moreover, these are rules which consist of cognitive and emotional characteristics that involve the consumer’s personality and they guide the consumer for making a selection (Unal & Ercis, 2006). The purpose of this study is to measure the relationship between list of values and consumers’ decision making styles. Therefore, we seek answers for questions such as: 1) Which personal values do people have in Turkey? 2) Which consumer decision making styles do people have in Turkey? 3) Is there a relationship between personal values and consumer decision making styles in Turkey? LITERATURE REVIEW List of Values (LOV)
List of values is a scale which is developed by Kahle (1983) for being directly applicable to marketing and consumer behavior (Odabasi & Baris, 2014). LOV is based on Maslow’s needs’ hierarchy (1954) and incorporates elements of social adaptation theory (Kahle, 1983). In the original scale (Kahle, 1983), there were 9 values (including the excitement value) but then Kahle, Liu and Watkins (1992) included 8 values
* Gazi University, Faculty of Business and Administrative Sciences 1 [email protected] 2 [email protected] 3 [email protected]
Business Management Dynamics
Vol.5, No.9, Mar 2016, pp.01-14
©Society for Business and Management Dynamics
in LOV. This final version of LOV consists of values such as warm relationship with others, sense of belonging, self-respect, being well respected, self-fulfillment, sense of accomplishment, security, and fun and enjoyment in life (Beatty et al., 1985). As for Kahle, Beatty and Homer (1986), these values can be differentiated as external values (sense of belonging, being well respected, and security) and internal values (warm relationship with others, sense of accomplishment, fun and enjoyment in life, self-respect, self-fulfillment, and excitement) according to the locus of control. Daghfous, Petrof and Pons (1999) states that these values can be gathered in three groups such as hedonic values (fun and enjoyment in life, warm relationship with others), empathy values (self-respect, being well respected, security, sense of belonging), self-fulfillment values (self-fulfillment, sense of accomplishment). Kahle, Beatty and Homer (1986) notes these values can be fulfilled through interpersonal relationships (warm relationship with others, sense of belonging), personal factors (self-respect, being well respected, self-fulfillment), apersonal things (sense of accomplishment, security, excitement, fun and enjoyment in life). The rationale behind using LOV is that this scale is a better methodology than VALS when predicting consumer behavior (Kahle, Beatty & Homer, 1986). For instance, the reason is that with the LOV, the exact phrase from the survey can be returned to the consumer in an ad (Kahle, 1985). This scale can be used either scoring each value or circling the most important value (Kahle, 1983). On the other hand, one can sort the values according to their significance level for consumers, also want from consumers to indicate the most important to values for them, use a 9 or 10 point Likert scale or one can use a combination of scoring methods (Bearden & Netemeyer, 1999). Madrigal and Kahle (1994) indicate that LOV can be used in market segmentation. Moreover, Herche (1994) obtained the MILOV scale by extending the LOV scale. MILOV includes the 9 values in the original LOV scale (Kahle, 1983) and has 44 items in total. In this study, Herche (1994) measures social values and social oriented life goal values. Huefner et al. (2002) extend the MILOV scale by adding the religiosity dimension. Unal and Ercis (2006) used LOV scale and consumer decision making styles in consumer segmentation and they state that they are first in using these two scales together. Consumer Decision Making Styles
Sproles and Kendall (1986) define consumer styles as a mental orientation characterizing a consumer’s approach to making consumers choices. There are three approaches which examine consumer decision making style (Unal & Ercis, 2006): 1. Psychographic/life style approach that examines the consumers in terms of psychological characteristics and lifestyle. 2. Consumer typology approach that discriminates consumers into general consumer types such as economic, uninterested, quality oriented etc. according to their shopping patterns. 3. Consumer characteristics approach which is also named as consumer decision making styles. In the classification of consumers, using consumer typologies does not reflect reality when considered hybrid consumers who have multiple decision making dimensions (Walsh et al., 2001). Therefore, using the CSI scale is more useful. These styles are a basis of market segmentation (Walsh et al., 2011). Marketers can segment heterogeneous consumer markets into homogenous segments according to demographic, behavioral, physiographic variables (Unal & Ercis, 2006). Consumer decision making styles can be used as a segmentation criteria before or after these variables which means multi stage segmentation (Walsh et al., 2001). Scholars drew from Sproles and Kendall (1986)’s scale while measuring consumer decision making styles. Sproles and Kendall (1986) mentions 8 characteristics such as (1) perfectionist, high quality conscious consumer, (2) brand conscious, price equals quality consumer, (3) novelty and fashion conscious consumer, (4) recreational and shopping conscious consumer, (5) price conscious “value for money consumer”, (6) impulsive, careless consumer, (7) confused by over choice consumer, (8) habitual, brand loyal consumer. “Perfectionist/High Quality Conscious” means the degree to which a consumer searches carefully and systematically for the best quality in products. “Brand Consciousness/Price Equals Quality” is explained by a consumer's orientation toward buying the more expensive, well-known national brands. “Novelty and Fashion Conscious” is defined by consumers who appear to like new and
Business Management Dynamics
Vol.5, No.9, Mar 2016, pp.01-14
©Society for Business and Management Dynamics
innovative products and gain excitement from seeking out new things. “Recreational and Shopping Conscious” is the extent to which a consumer finds shopping a pleasant activity and shops just for the fun of it. “Price Conscious/Value for the Money” is a consumer with a particularly high consciousness of sale prices and lower prices in general. “Impulsiveness/Careless” is one who tends to buy on the spur of the moment and to appear unconcerned about how much he or she spends (or getting “best buys”). “Confused by Overchoice” is a person perceiving too many brands and stores from which to choose and who likely experiences information overload in the market. “Habitual/Brand Loyal” is a characteristic indicating a consumer who repetitively chooses the same favorite brands and stores (Bearden & Netemeyer, 1999). However, these may differ as a consequence of countries’cultural identities. There have been studies on CSI in various countries such as USA (McDonald, 1994; Shim, 1996; Wesley, Lehew & Woodside, 2006), China (Hiu et al., 2001; Siu, et al., 2001), Germany (Walsh et al., 2001), South Africa (Potgieter, Wiese & Strasheim, 2013) and Turkey (Unal & Ercis, 2006; Yesilada & Kavas, 2008; Dursun, Alniacik, & Tumer Kabadayi, 2013; Ceylan, 2013). Decision making styles are important for marketers in terms of estimating consumer behavior, being applicable for market segmentation, being helpful for profiling consumer decision making characteristics (Potgieter, Wiese & Strasheim, 2013). Studies such as Unal and Ercis (2006) found a relationship between personal values and consumer decision making styles. Therefore, in the present study, we propose,
H1: Personal values have a significant and positive relationship between consumer decision making styles. METHODOLOGY In this study we used face to face survey method. We used Sproles and Kendall (1986)’s Consumer Style Inventory Scale (CSI) and Kahle, Liu and Watkins (1992)’s List of Values (LOV) scale. Both of the questionnaires were in English and translated into Turkish, then back translated into English as McGorry (2000) suggested. We pretested the questionnaires on 100 students before conducting the surveys. Then we applied the surveys on students and 375 of the surveys were found usable. Scales were measured on a 5 point Likert scale (1= strongly disagree, 5= strongly agree). First, we carried out a reliabiliy analysis by using the Cronbach’s Alpha Coefficient. Second, in an effort to see the definite factor constructs, we carried out exploratory factor analyses for LOV and CSI scales and after we used confirmatory factor analyses. Using CFA after an EFA can be seen in Dursun, Alniacik and Tumer Kabadayi (2013), Fan and Xiao (1998) and Walsh et al. (2001)’s studies. In EFA analysis, our extraction method is Principal Component Analysis and our rotation method is Varimax with Kaiser Normalization. As for confirmatory factor analyses, we applied first order confirmatory factor analyses for each one of them. Last, we carried out simple linear regressions to measure the effect of LOV on consumer decision making styles with regards to clothing products. Carrying out the surveys on students and exploring the subject only in the context of clothing products are the restrictions of the study. Simple random sampling method is used for the sample size selection. Our sample consists of 375 undergraduate (primarily Business Administration majors) students from a faculty of a state university in Turkey. FINDINGS
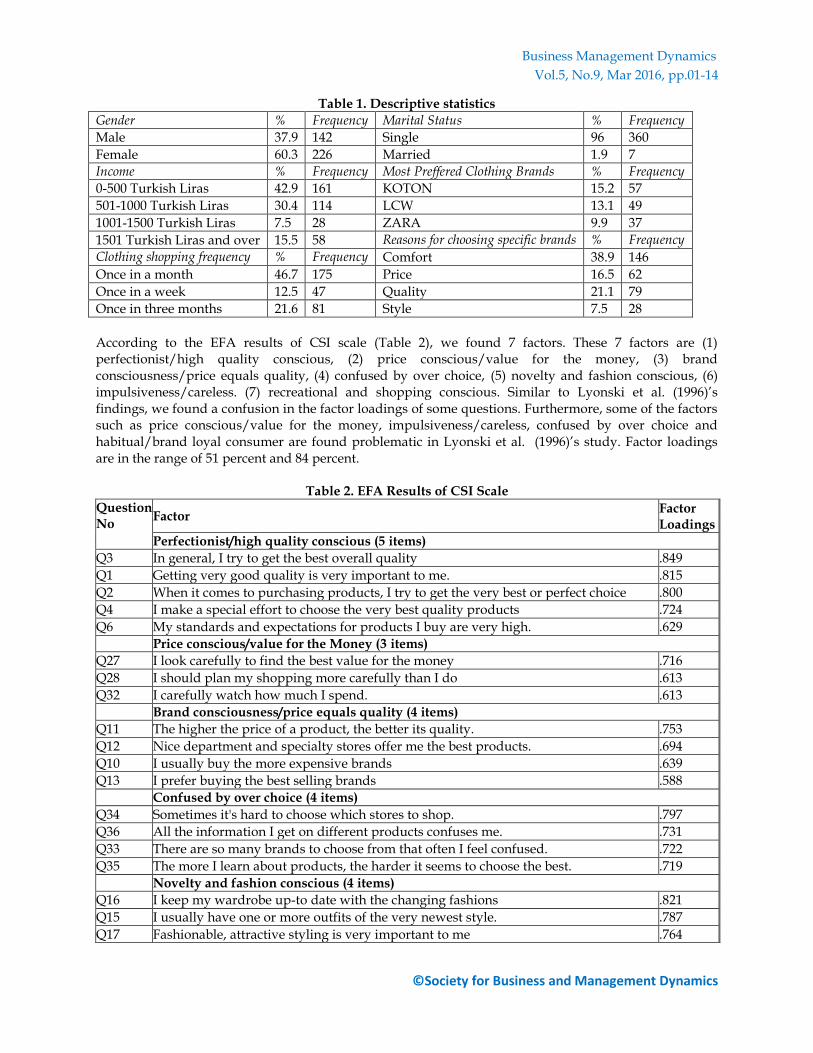
Reliability results of the pilot study with 100 students showed that the scales are extremely reliable (For the CSI scale, Cronbach Alpha Coefficient= 0,853; For the LOV scale, Cronbach Alpha Coefficient = 0,914). Hair et al. (1998) state that reliability coefficients above 0,60 are satisfactory for exploratory research; those above 0,70 are acceptable; and those above 0,80 are good. Descriptive statistics for our sample is shown in Table 1. We have to note that missing values in the dataset are replaced with mean values. All participants are between the age of 19 and 25. Furthermore, their average clothing expenditure for a month is 216 Turkish liras.
Business Management Dynamics
Vol.5, No.9, Mar 2016, pp.01-14
©Society for Business and Management Dynamics
Table 1. Descriptive statistics
Gender % Frequency Marital Status % Frequency
Male 37.9 142 Single 96 360
Female 60.3 226 Married 1.9 7
Income % Frequency Most Preffered Clothing Brands % Frequency
0-500 Turkish Liras 42.9 161 KOTON 15.2 57
501-1000 Turkish Liras 30.4 114 LCW 13.1 49
1001-1500 Turkish Liras 7.5 28 ZARA 9.9 37
1501 Turkish Liras and over 15.5 58 Reasons for choosing specific brands % Frequency
Clothing shopping frequency % Frequency Comfort 38.9 146
Once in a month 46.7 175 Price 16.5 62
Once in a week 12.5 47 Quality 21.1 79
Once in three months 21.6 81 Style 7.5 28
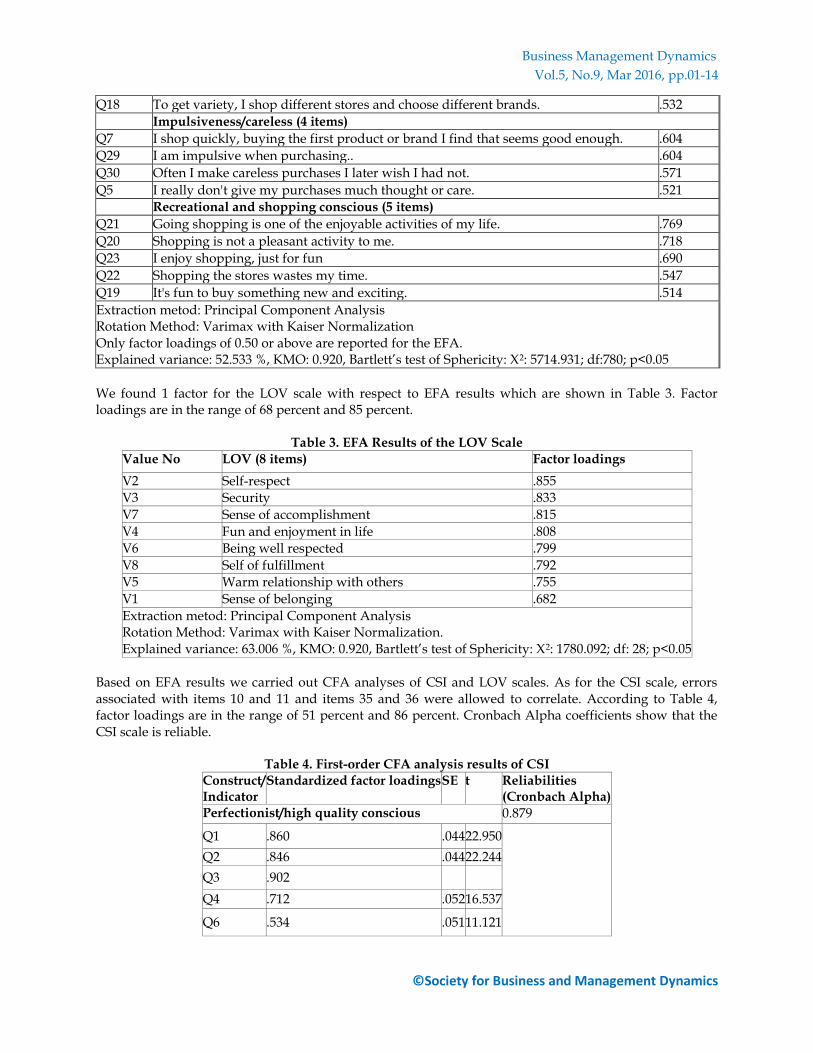
According to the EFA results of CSI scale (Table 2), we found 7 factors. These 7 factors are (1) perfectionist/high quality conscious, (2) price conscious/value for the money, (3) brand consciousness/price equals quality, (4) confused by over choice, (5) novelty and fashion conscious, (6) impulsiveness/careless. (7) recreational and shopping conscious. Similar to Lyonski et al. (1996)’s findings, we found a confusion in the factor loadings of some questions. Furthermore, some of the factors such as price conscious/value for the money, impulsiveness/careless, confused by over choice and habitual/brand loyal consumer are found problematic in Lyonski et al. (1996)’s study. Factor loadings are in the range of 51 percent and 84 percent.
Table 2. EFA Results of CSI Scale
Question No
Factor Factor Loadings
Perfectionist/high quality conscious (5 items)
Q3 In general, I try to get the best overall quality .849
Q1 Getting very good quality is very important to me. .815
Q2 When it comes to purchasing products, I try to get the very best or perfect choice .800
Q4 I make a special effort to choose the very best quality products .724
Q6 My standards and expectations for products I buy are very high. .629
Price conscious/value for the Money (3 items)
Q27 I look carefully to find the best value for the money .716
Q28 I should plan my shopping more carefully than I do .613
Q32 I carefully watch how much I spend. .613
Brand consciousness/price equals quality (4 items)
Q11 The higher the price of a product, the better its quality. .753
Q12 Nice department and specialty stores offer me the best products. .694
Q10 I usually buy the more expensive brands .639
Q13 I prefer buying the best selling brands .588
Confused by over choice (4 items)
Q34 Sometimes it's hard to choose which stores to shop. .797
Q36 All the information I get on different products confuses me. .731
Q33 There are so many brands to choose from that often I feel confused. .722
Q35 The more I learn about products, the harder it seems to choose the best. .719
Novelty and fashion conscious (4 items)
Q16 I keep my wardrobe up-to date with the changing fashions .821
Q15 I usually have one or more outfits of the very newest style. .787
Q17 Fashionable, attractive styling is very important to me .764
Business Management Dynamics
Vol.5, No.9, Mar 2016, pp.01-14
©Society for Business and Management Dynamics
Q18 To get variety, I shop different stores and choose different brands. .532
Impulsiveness/careless (4 items)
Q7 I shop quickly, buying the first product or brand I find that seems good enough. .604
Q29 I am impulsive when purchasing.. .604
Q30 Often I make careless purchases I later wish I had not. .571
Q5 I really don't give my purchases much thought or care. .521
Recreational and shopping conscious (5 items)
Q21 Going shopping is one of the enjoyable activities of my life. .769
Q20 Shopping is not a pleasant activity to me. .718
Q23 I enjoy shopping, just for fun .690
Q22 Shopping the stores wastes my time. .547
Q19 It's fun to buy something new and exciting. .514
Extraction metod: Principal Component Analysis Rotation Method: Varimax with Kaiser Normalization Only factor loadings of 0.50 or above are reported for the EFA. Explained variance: 52.533 %, KMO: 0.920, Bartlett’s test of Sphericity: X2: 5714.931; df:780; p<0.05
We found 1 factor for the LOV scale with respect to EFA results which are shown in Table 3. Factor loadings are in the range of 68 percent and 85 percent.
Table 3. EFA Results of the LOV Scale
Value No LOV (8 items) Factor loadings
V2 Self-respect .855
V3 Security .833
V7 Sense of accomplishment .815
V4 Fun and enjoyment in life .808
V6 Being well respected .799
V8 Self of fulfillment .792
V5 Warm relationship with others .755
V1 Sense of belonging .682
Extraction metod: Principal Component Analysis Rotation Method: Varimax with Kaiser Normalization. Explained variance: 63.006 %, KMO: 0.920, Bartlett’s test of Sphericity: X2: 1780.092; df: 28; p<0.05
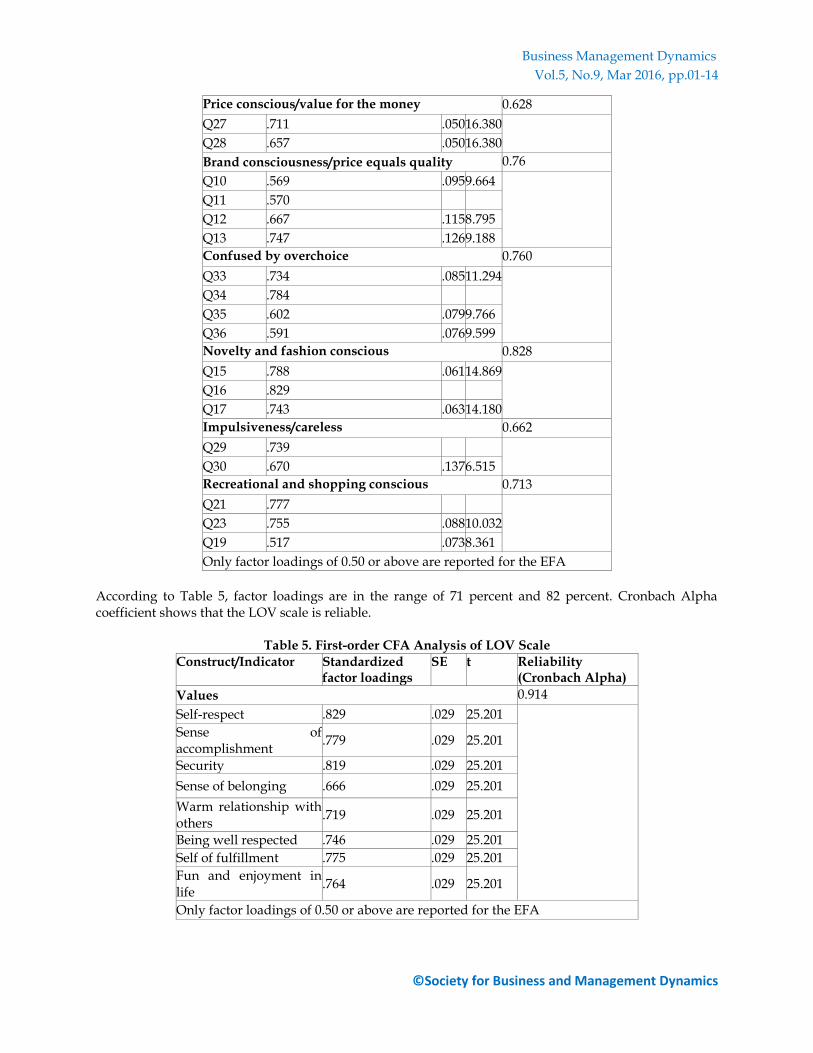
Based on EFA results we carried out CFA analyses of CSI and LOV scales. As for the CSI scale, errors associated with items 10 and 11 and items 35 and 36 were allowed to correlate. According to Table 4, factor loadings are in the range of 51 percent and 86 percent. Cronbach Alpha coefficients show that the CSI scale is reliable.
Table 4. First-order CFA analysis results of CSI Construct/ Indicator
Standardized factor loadings SE t Reliabilities (Cronbach Alpha)
Perfectionist/high quality conscious 0.879
Q1 .860 .044 22.950
Q2 .846 .044 22.244
Q3 .902
Q4 .712 .052 16.537
Q6 .534 .051 11.121
Business Management Dynamics
Vol.5, No.9, Mar 2016, pp.01-14
©Society for Business and Management Dynamics
Price conscious/value for the money 0.628
Q27 .711 .050 16.380
Q28 .657 .050 16.380
Brand consciousness/price equals quality 0.76
Q10 .569 .095 9.664
Q11 .570
Q12 .667 .115 8.795
Q13 .747 .126 9.188
Confused by overchoice 0.760
Q33 .734 .085 11.294
Q34 .784
Q35 .602 .079 9.766
Q36 .591 .076 9.599
Novelty and fashion conscious 0.828
Q15 .788 .061 14.869
Q16 .829
Q17 .743 .063 14.180
Impulsiveness/careless 0.662
Q29 .739
Q30 .670 .137 6.515
Recreational and shopping conscious 0.713
Q21 .777
Q23 .755 .088 10.032
Q19 .517 .073 8.361
Only factor loadings of 0.50 or above are reported for the EFA
According to Table 5, factor loadings are in the range of 71 percent and 82 percent. Cronbach Alpha coefficient shows that the LOV scale is reliable.
Table 5. First-order CFA Analysis of LOV Scale
Construct/Indicator Standardized factor loadings
SE t Reliability (Cronbach Alpha)
Values 0.914
Self-respect .829 .029 25.201
Sense of accomplishment
.779 .029 25.201
Security .819 .029 25.201
Sense of belonging .666 .029 25.201
Warm relationship with others
.719 .029 25.201
Being well respected .746 .029 25.201
Self of fulfillment .775 .029 25.201
Fun and enjoyment in life
.764 .029 25.201
Only factor loadings of 0.50 or above are reported for the EFA
Business Management Dynamics
Vol.5, No.9, Mar 2016, pp.01-14
©Society for Business and Management Dynamics
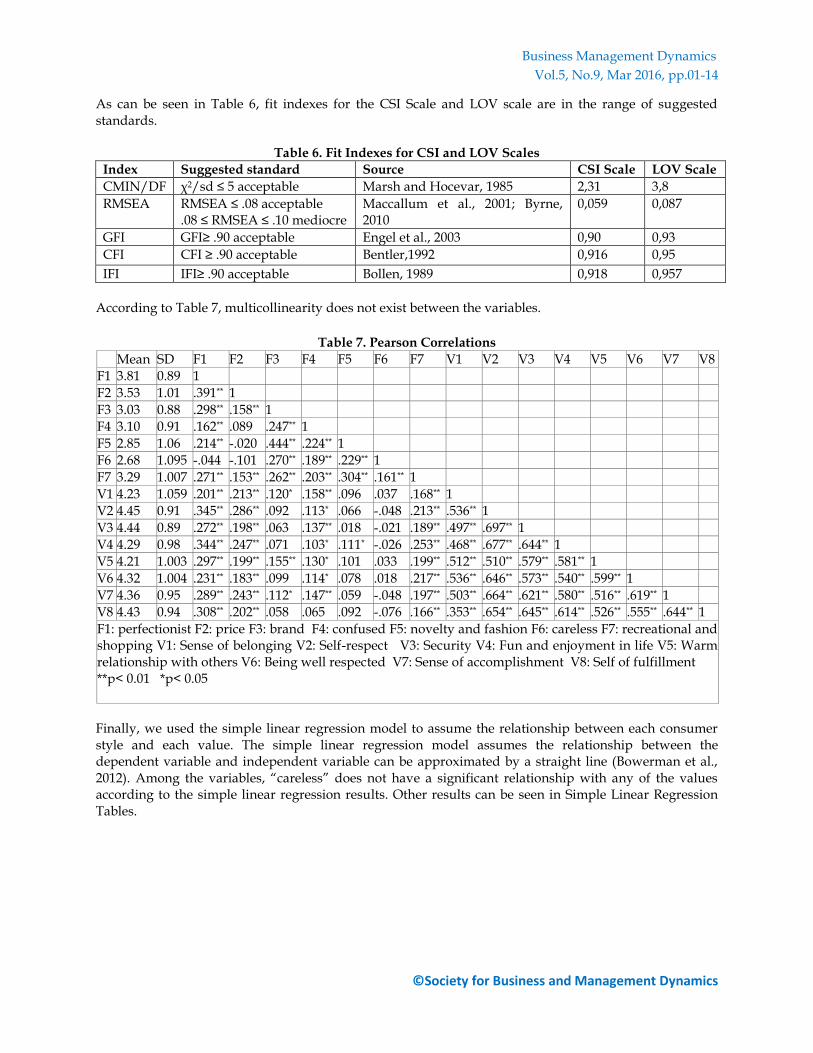
As can be seen in Table 6, fit indexes for the CSI Scale and LOV scale are in the range of suggested standards.
Table 6. Fit Indexes for CSI and LOV Scales
Index Suggested standard Source CSI Scale LOV Scale
CMIN/DF χ2/sd ≤ 5 acceptable Marsh and Hocevar, 1985 2,31 3,8
RMSEA RMSEA ≤ .08 acceptable .08 ≤ RMSEA ≤ .10 mediocre
Maccallum et al., 2001; Byrne, 2010
0,059 0,087
GFI GFI≥ .90 acceptable Engel et al., 2003 0,90 0,93
CFI CFI ≥ .90 acceptable Bentler,1992 0,916 0,95
IFI IFI≥ .90 acceptable Bollen, 1989 0,918 0,957
According to Table 7, multicollinearity does not exist between the variables.
Table 7. Pearson Correlations
Mean SD F1 F2 F3 F4 F5 F6 F7 V1 V2 V3 V4 V5 V6 V7 V8
F1 3.81 0.89 1
F2 3.53 1.01 .391** 1
F3 3.03 0.88 .298** .158** 1
F4 3.10 0.91 .162** .089 .247** 1
F5 2.85 1.06 .214** -.020 .444** .224** 1
F6 2.68 1.095 -.044 -.101 .270** .189** .229** 1
F7 3.29 1.007 .271** .153** .262** .203** .304** .161** 1
V1 4.23 1.059 .201** .213** .120* .158** .096 .037 .168** 1
V2 4.45 0.91 .345** .286** .092 .113* .066 -.048 .213** .536** 1
V3 4.44 0.89 .272** .198** .063 .137** .018 -.021 .189** .497** .697** 1
V4 4.29 0.98 .344** .247** .071 .103* .111* -.026 .253** .468** .677** .644** 1
V5 4.21 1.003 .297** .199** .155** .130* .101 .033 .199** .512** .510** .579** .581** 1
V6 4.32 1.004 .231** .183** .099 .114* .078 .018 .217** .536** .646** .573** .540** .599** 1
V7 4.36 0.95 .289** .243** .112* .147** .059 -.048 .197** .503** .664** .621** .580** .516** .619** 1
V8 4.43 0.94 .308** .202** .058 .065 .092 -.076 .166** .353** .654** .645** .614** .526** .555** .644** 1
F1: perfectionist F2: price F3: brand F4: confused F5: novelty and fashion F6: careless F7: recreational and shopping V1: Sense of belonging V2: Self-respect V3: Security V4: Fun and enjoyment in life V5: Warm relationship with others V6: Being well respected V7: Sense of accomplishment V8: Self of fulfillment **p< 0.01 *p< 0.05
Finally, we used the simple linear regression model to assume the relationship between each consumer style and each value. The simple linear regression model assumes the relationship between the dependent variable and independent variable can be approximated by a straight line (Bowerman et al., 2012). Among the variables, “careless” does not have a significant relationship with any of the values according to the simple linear regression results. Other results can be seen in Simple Linear Regression Tables.
Business Management Dynamics
Vol.5, No.9, Mar 2016, pp.01-14
©Society for Business and Management Dynamics
Table 8. The Simple Linear Regression Results I Unstandardized
Coefficients Standardized Coefficients
B
Std. Error
Beta t Sig.
R R2 F Regression Residual p
Constant 3.092 0.187 16.499 0.00 0.201 0.040 15.639 1 373 0.00
Sense of belonging
0.170 0.043 0.201 3.955 0.00
Constant 2.301 0.217 10.589 0.00 0.345 0.119 50.246 1 373 0.00
Self-respect 0.339 0.048 0.345 7.088 0.00
Constant 2.594 0.227 11.405 0.00 0.272 0.074 29.731 1 373 0.00
Security 0.273 0.050 0.272 5.453 0.00
Constant 2.469 0.195 12.682 0.00 0.344 0.118 1 373 0.00
Fun and enjoyment in life
0.312 0.044 0.344 7.069 0.00
Constant 2.691 0.192 14.045 0.00 0.297 0.088 36.118 1 373 0.00
Warm relationship with others
0.266 0.044 0.297 6.010 0.00
Constant 2.916 0.200 14.592 0.00 0.231 0.054 21.101 1 373 0.00
Being well respected
0.207 0.045 0.231 4.594 0,00
Constant 2.628 0.207 12.680 0,00 0.289 0.084 34.088 1 373 0.00
Sense of accomplishment
0.271 0.046 0.289 5.839 0,00
Constant 2.508 0.213 11.771 0,00 0.308 0.095 39.059 1 373 0.00
Self of fulfillment
0.294 0.047 0.308 6.250 0,00
Dependent variable: perfectionist
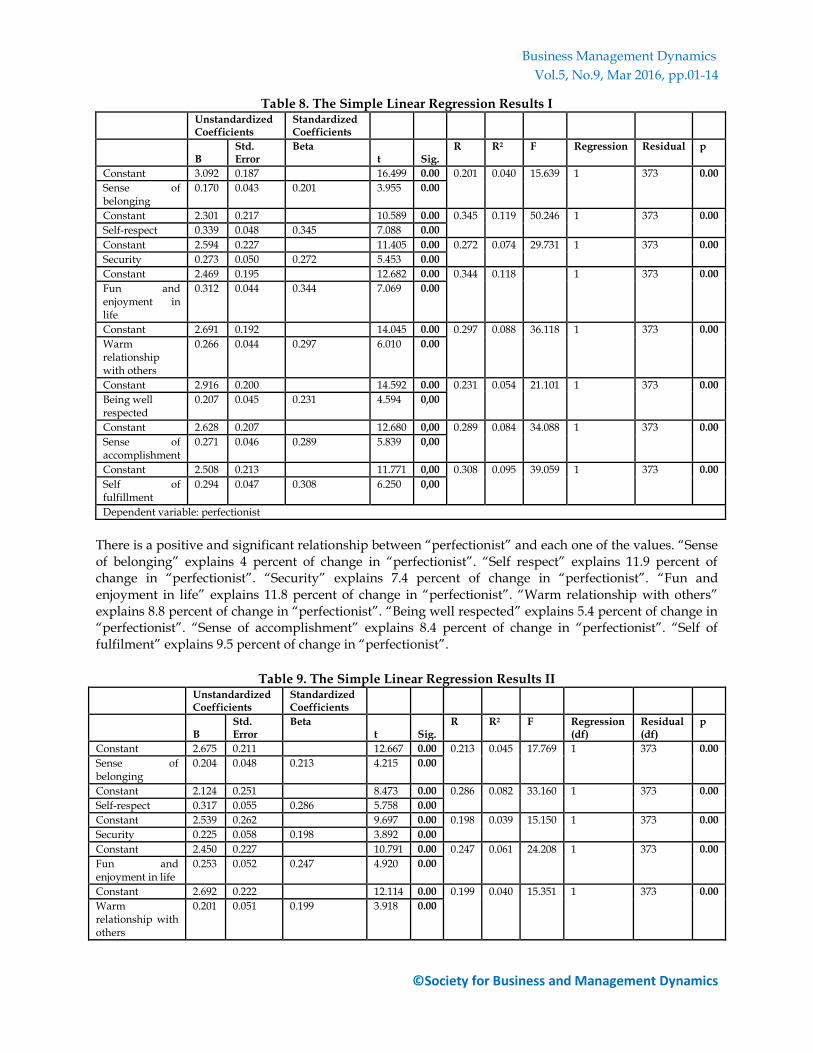
There is a positive and significant relationship between “perfectionist” and each one of the values. “Sense of belonging” explains 4 percent of change in “perfectionist”. “Self respect” explains 11.9 percent of change in “perfectionist”. “Security” explains 7.4 percent of change in “perfectionist”. “Fun and enjoyment in life” explains 11.8 percent of change in “perfectionist”. “Warm relationship with others” explains 8.8 percent of change in “perfectionist”. “Being well respected” explains 5.4 percent of change in “perfectionist”. “Sense of accomplishment” explains 8.4 percent of change in “perfectionist”. “Self of fulfilment” explains 9.5 percent of change in “perfectionist”.
Table 9. The Simple Linear Regression Results II Unstandardized
Coefficients Standardized Coefficients
B
Std. Error
Beta t Sig.
R R2 F Regression (df)
Residual (df)
p
Constant 2.675 0.211 12.667 0.00 0.213 0.045 17.769 1 373 0.00
Sense of belonging
0.204 0.048 0.213 4.215 0.00
Constant 2.124 0.251 8.473 0.00 0.286 0.082 33.160 1 373 0.00
Self-respect 0.317 0.055 0.286 5.758 0.00
Constant 2.539 0.262 9.697 0.00 0.198 0.039 15.150 1 373 0.00
Security 0.225 0.058 0.198 3.892 0.00
Constant 2.450 0.227 10.791 0.00 0.247 0.061 24.208 1 373 0.00
Fun and enjoyment in life
0.253 0.052 0.247 4.920 0.00
Constant 2.692 0.222 12.114 0.00 0.199 0.040 15.351 1 373 0.00
Warm relationship with others
0.201 0.051 0.199 3.918 0.00
Business Management Dynamics
Vol.5, No.9, Mar 2016, pp.01-14
©Society for Business and Management Dynamics
Constant 2.741 0.228 12.010 0.00 0.183 0.033 12.865 1 373 0.00
Being well respected
0.184 0.051 0.183 3.587 0.00
Constant 2.416 0.237 10.178 0.00 0.243 0.059 23.442 1 373 0.00
Sense of accomplishment
0.257 0.053 0.243 4.842 0.00
Constant 2.571 0.248 10.372 0.00 0.202 0.041 15.944 1 373 0.00
Self of fulfillment 0.218 0.055 0.202 3.993 0.00
Dependent variable: price conscious
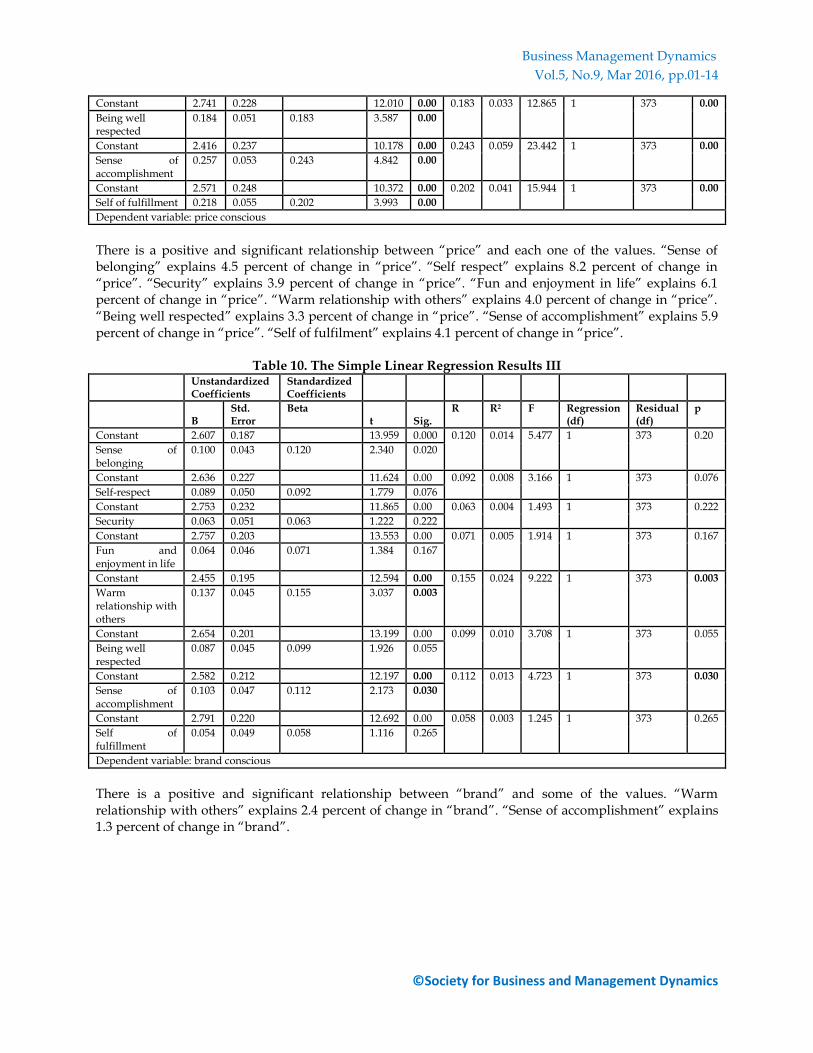
There is a positive and significant relationship between “price” and each one of the values. “Sense of belonging” explains 4.5 percent of change in “price”. “Self respect” explains 8.2 percent of change in “price”. “Security” explains 3.9 percent of change in “price”. “Fun and enjoyment in life” explains 6.1 percent of change in “price”. “Warm relationship with others” explains 4.0 percent of change in “price”. “Being well respected” explains 3.3 percent of change in “price”. “Sense of accomplishment” explains 5.9 percent of change in “price”. “Self of fulfilment” explains 4.1 percent of change in “price”.
Table 10. The Simple Linear Regression Results III Unstandardized
Coefficients Standardized Coefficients
B
Std. Error
Beta t Sig.
R R2 F Regression (df)
Residual (df)
p
Constant 2.607 0.187 13.959 0.000 0.120 0.014 5.477 1 373 0.20
Sense of belonging
0.100 0.043 0.120 2.340 0.020
Constant 2.636 0.227 11.624 0.00 0.092 0.008 3.166 1 373 0.076
Self-respect 0.089 0.050 0.092 1.779 0.076
Constant 2.753 0.232 11.865 0.00 0.063 0.004 1.493 1 373 0.222
Security 0.063 0.051 0.063 1.222 0.222
Constant 2.757 0.203 13.553 0.00 0.071 0.005 1.914 1 373 0.167
Fun and enjoyment in life
0.064 0.046 0.071 1.384 0.167
Constant 2.455 0.195 12.594 0.00 0.155 0.024 9.222 1 373 0.003
Warm relationship with others
0.137 0.045 0.155 3.037 0.003
Constant 2.654 0.201 13.199 0.00 0.099 0.010 3.708 1 373 0.055
Being well respected
0.087 0.045 0.099 1.926 0.055
Constant 2.582 0.212 12.197 0.00 0.112 0.013 4.723 1 373 0.030
Sense of accomplishment
0.103 0.047 0.112 2.173 0.030
Constant 2.791 0.220 12.692 0.00 0.058 0.003 1.245 1 373 0.265
Self of fulfillment
0.054 0.049 0.058 1.116 0.265
Dependent variable: brand conscious
There is a positive and significant relationship between “brand” and some of the values. “Warm relationship with others” explains 2.4 percent of change in “brand”. “Sense of accomplishment” explains 1.3 percent of change in “brand”.
Business Management Dynamics
Vol.5, No.9, Mar 2016, pp.01-14
©Society for Business and Management Dynamics
Table 11. The Simple Linear Regression Results IV Unstandardized
Coefficients Standardized Coefficients
B
Std. Error
Beta t Sig.
R R2 F Regression (df)
Residual (df)
p
Constant 2.531 0.193 13.098 0.00 0.158 0.025 9.535 1 373 0.002
Sense of belonging
0.137 0.044 0.158 3.088 0.002
Constant 2.604 0.235 11.066 0.00 0.113 0.013 4.812 1 373 0.029
Self-respect 0.114 0.052 0.113 2.194 0.029
Constant 2.482 0.240 10.362 0.00 0.137 0.019 7.142 1 373 0.008
Security 0.141 0.053 0.137 2.672 0.008
Constant 2.700 0.211 12.798 0.00 0.103 0.011 3.968 1 373 0.047
Fun and enjoyment in life
0.095 0.048 0.103 1.992 0.047
Constant 2.610 0.204 12.823 0.00 0.130 0.017 6.378 1 373 0.012
Warm relationship with others
0.119 0.047 0.130 2.526 0.012
Constant 2.658 0.209 12.732 0.00 0.114 0.013 4.927 1 373 0.027
Being well respected
0.104 0.047 0.114 2.220 0.027
Constant 2.495 0.219 11.387 0.00 0.147 0.022 8.238 1 373 0.004
Sense of accomplishment
0.141 0.049 0.147 2.870 0.004
Constant 2.828 0.229 12.369 0.00 0.065 0.004 1.590 1 373 0.208
Self of fulfillment
0.064 0.050 0.065 1.261 0.208
Dependent variable: confused by overchoice
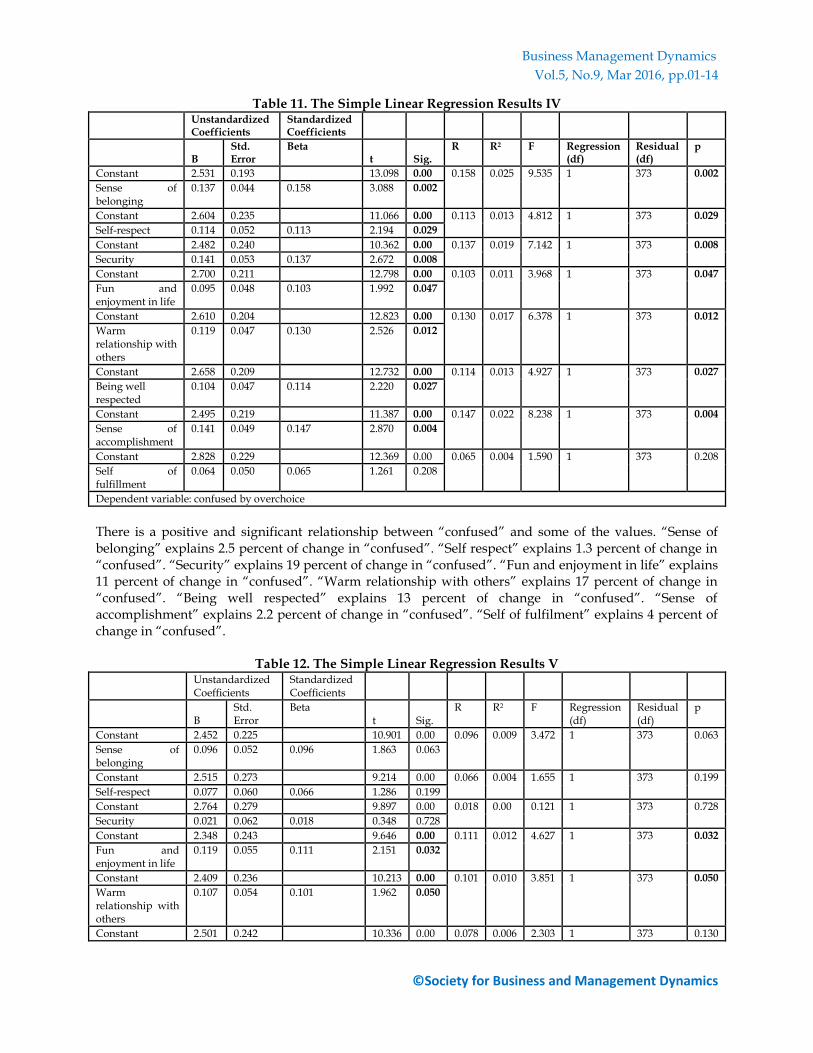
There is a positive and significant relationship between “confused” and some of the values. “Sense of belonging” explains 2.5 percent of change in “confused”. “Self respect” explains 1.3 percent of change in “confused”. “Security” explains 19 percent of change in “confused”. “Fun and enjoyment in life” explains 11 percent of change in “confused”. “Warm relationship with others” explains 17 percent of change in “confused”. “Being well respected” explains 13 percent of change in “confused”. “Sense of accomplishment” explains 2.2 percent of change in “confused”. “Self of fulfilment” explains 4 percent of change in “confused”.
Table 12. The Simple Linear Regression Results V Unstandardized
Coefficients Standardized Coefficients
B
Std. Error
Beta t Sig.
R R2 F Regression (df)
Residual (df)
p
Constant 2.452 0.225 10.901 0.00 0.096 0.009 3.472 1 373 0.063
Sense of belonging
0.096 0.052 0.096 1.863 0.063
Constant 2.515 0.273 9.214 0.00 0.066 0.004 1.655 1 373 0.199
Self-respect 0.077 0.060 0.066 1.286 0.199
Constant 2.764 0.279 9.897 0.00 0.018 0.00 0.121 1 373 0.728
Security 0.021 0.062 0.018 0.348 0.728
Constant 2.348 0.243 9.646 0.00 0.111 0.012 4.627 1 373 0.032
Fun and enjoyment in life
0.119 0.055 0.111 2.151 0.032
Constant 2.409 0.236 10.213 0.00 0.101 0.010 3.851 1 373 0.050
Warm relationship with others
0.107 0.054 0.101 1.962 0.050
Constant 2.501 0.242 10.336 0.00 0.078 0.006 2.303 1 373 0.130
Business Management Dynamics
Vol.5, No.9, Mar 2016, pp.01-14
©Society for Business and Management Dynamics
Being well respected
0.083 0.054 0.078 1.518 0.130
Constant 2.576 0.255 10.085 0.00 0.059 0.003 1.286 1 373 0.258
Sense of accomplishment
0.065 0.057 0.59 1.134 0.258
Constant 2.398 0.263 9.100 0.00 0.092 0.009 3.202 1 373 0.074
Self of fulfillment 0.104 0.058 0.092 1.789 0.074
Dependent variable: novelty and fashion conscious
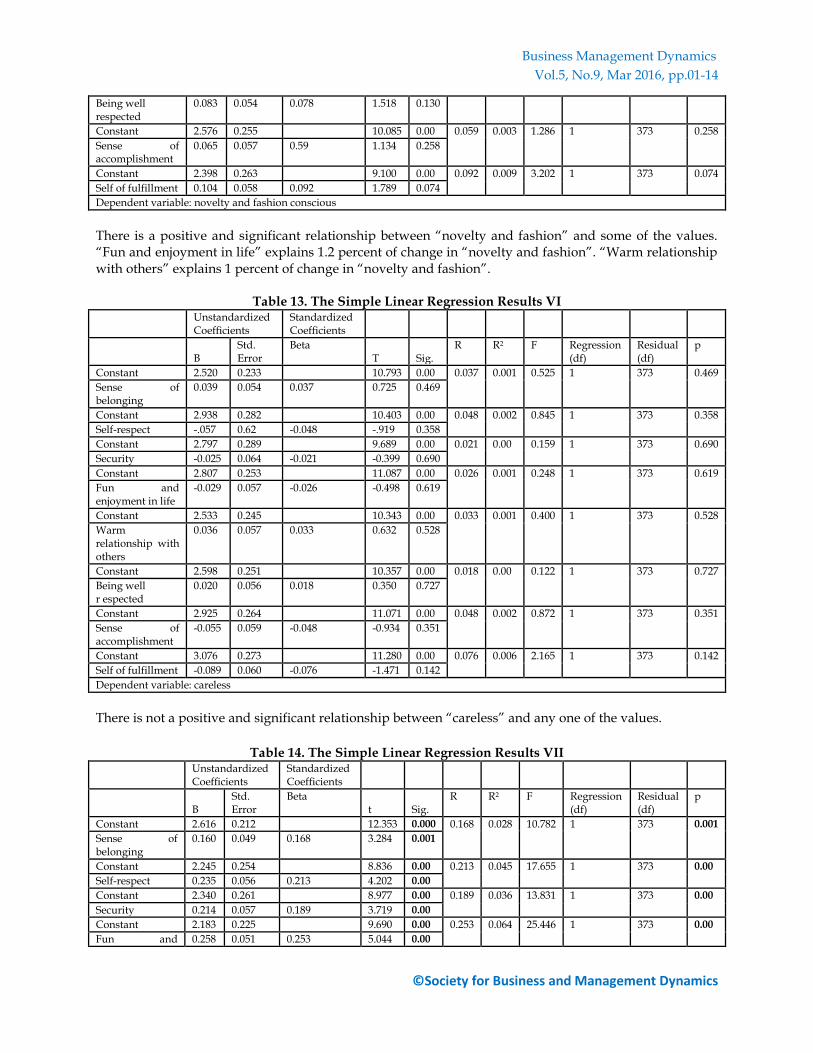
There is a positive and significant relationship between “novelty and fashion” and some of the values. “Fun and enjoyment in life” explains 1.2 percent of change in “novelty and fashion”. “Warm relationship with others” explains 1 percent of change in “novelty and fashion”.
Table 13. The Simple Linear Regression Results VI Unstandardized
Coefficients Standardized Coefficients
B
Std. Error
Beta T Sig.
R R2 F Regression (df)
Residual (df)
p
Constant 2.520 0.233 10.793 0.00 0.037 0.001 0.525 1 373 0.469
Sense of belonging
0.039 0.054 0.037 0.725 0.469
Constant 2.938 0.282 10.403 0.00 0.048 0.002 0.845 1 373 0.358
Self-respect -.057 0.62 -0.048 -.919 0.358
Constant 2.797 0.289 9.689 0.00 0.021 0.00 0.159 1 373 0.690
Security -0.025 0.064 -0.021 -0.399 0.690
Constant 2.807 0.253 11.087 0.00 0.026 0.001 0.248 1 373 0.619
Fun and enjoyment in life
-0.029 0.057 -0.026 -0.498 0.619
Constant 2.533 0.245 10.343 0.00 0.033 0.001 0.400 1 373 0.528
Warm relationship with others
0.036 0.057 0.033 0.632 0.528
Constant 2.598 0.251 10.357 0.00 0.018 0.00 0.122 1 373 0.727
Being well r espected
0.020 0.056 0.018 0.350 0.727
Constant 2.925 0.264 11.071 0.00 0.048 0.002 0.872 1 373 0.351
Sense of accomplishment
-0.055 0.059 -0.048 -0.934 0.351
Constant 3.076 0.273 11.280 0.00 0.076 0.006 2.165 1 373 0.142
Self of fulfillment -0.089 0.060 -0.076 -1.471 0.142
Dependent variable: careless
There is not a positive and significant relationship between “careless” and any one of the values.
Table 14. The Simple Linear Regression Results VII
Unstandardized Coefficients
Standardized Coefficients
B
Std. Error
Beta t Sig.
R R2 F Regression (df)
Residual (df)
p
Constant 2.616 0.212 12.353 0.000 0.168 0.028 10.782 1 373 0.001
Sense of belonging
0.160 0.049 0.168 3.284 0.001
Constant 2.245 0.254 8.836 0.00 0.213 0.045 17.655 1 373 0.00
Self-respect 0.235 0.056 0.213 4.202 0.00
Constant 2.340 0.261 8.977 0.00 0.189 0.036 13.831 1 373 0.00
Security 0.214 0.057 0.189 3.719 0.00
Constant 2.183 0.225 9.690 0.00 0.253 0.064 25.446 1 373 0.00
Fun and 0.258 0.051 0.253 5.044 0.00
Business Management Dynamics
Vol.5, No.9, Mar 2016, pp.01-14
©Society for Business and Management Dynamics
enjoyment in life
Constant 2.447 0.221 11.083 0.00 0.199 0.040 15.421 1 373 0.00
Warm relationship with others
0.200 0.051 0.199 3.927 0.00
Constant 2.351 0.225 10.435 0.00 0.217 0.047 18.362 1 373 0.00
Being well respected
0.217 0.051 0.217 4.285 0.00
Constant 2.387 0.238 10.010 0.00 0.197 0.039 15.059 1 373 0.00
Sense of accomplishment
0.207 0.053 0.197 3.881 0.00
Constant 2.502 0.248 10.086 0.00 0.166 0.028 10.575 1 373 0.001
Self of fulfillment
0.178 0.055 0.166 3.252 0.001
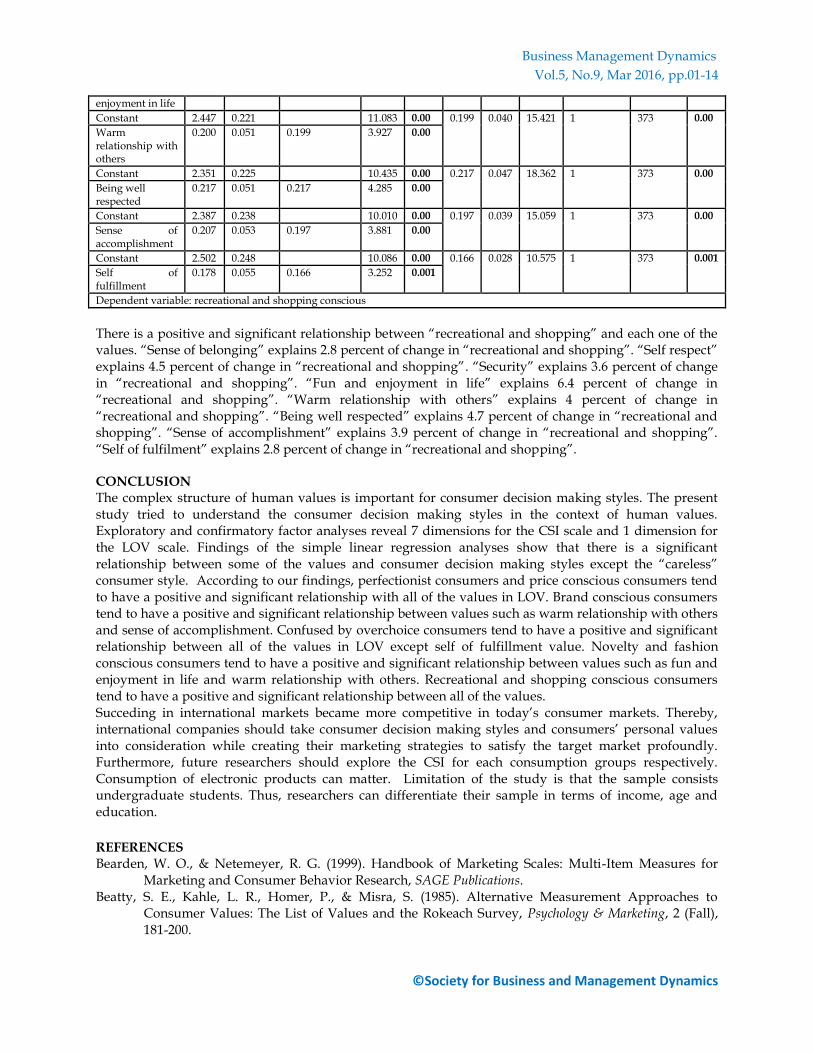
Dependent variable: recreational and shopping conscious
There is a positive and significant relationship between “recreational and shopping” and each one of the values. “Sense of belonging” explains 2.8 percent of change in “recreational and shopping”. “Self respect” explains 4.5 percent of change in “recreational and shopping”. “Security” explains 3.6 percent of change in “recreational and shopping”. “Fun and enjoyment in life” explains 6.4 percent of change in “recreational and shopping”. “Warm relationship with others” explains 4 percent of change in “recreational and shopping”. “Being well respected” explains 4.7 percent of change in “recreational and shopping”. “Sense of accomplishment” explains 3.9 percent of change in “recreational and shopping”. “Self of fulfilment” explains 2.8 percent of change in “recreational and shopping”. CONCLUSION The complex structure of human values is important for consumer decision making styles. The present study tried to understand the consumer decision making styles in the context of human values. Exploratory and confirmatory factor analyses reveal 7 dimensions for the CSI scale and 1 dimension for the LOV scale. Findings of the simple linear regression analyses show that there is a significant relationship between some of the values and consumer decision making styles except the “careless” consumer style. According to our findings, perfectionist consumers and price conscious consumers tend to have a positive and significant relationship with all of the values in LOV. Brand conscious consumers tend to have a positive and significant relationship between values such as warm relationship with others and sense of accomplishment. Confused by overchoice consumers tend to have a positive and significant relationship between all of the values in LOV except self of fulfillment value. Novelty and fashion conscious consumers tend to have a positive and significant relationship between values such as fun and enjoyment in life and warm relationship with others. Recreational and shopping conscious consumers tend to have a positive and significant relationship between all of the values. Succeding in international markets became more competitive in today’s consumer markets. Thereby, international companies should take consumer decision making styles and consumers’ personal values into consideration while creating their marketing strategies to satisfy the target market profoundly. Furthermore, future researchers should explore the CSI for each consumption groups respectively. Consumption of electronic products can matter. Limitation of the study is that the sample consists undergraduate students. Thus, researchers can differentiate their sample in terms of income, age and education.
REFERENCES Bearden, W. O., & Netemeyer, R. G. (1999). Handbook of Marketing Scales: Multi-Item Measures for
Marketing and Consumer Behavior Research, SAGE Publications. Beatty, S. E., Kahle, L. R., Homer, P., & Misra, S. (1985). Alternative Measurement Approaches to
Consumer Values: The List of Values and the Rokeach Survey, Psychology & Marketing, 2 (Fall), 181-200.
Business Management Dynamics
Vol.5, No.9, Mar 2016, pp.01-14
©Society for Business and Management Dynamics
Bentler, P. M. (1992). On the fit of models to covariances and methodology to the Bulletin, Psychological Bulletin, 112, 400-404. Bollen, K. A. (1989). A new incremental fit index for general structural equation models, Sociological
Methods and Research, 17, 303-316. Bowerman, B. L., O’Connell, R. T., Murphree, E. S., & Orris, J. B. (2012). Essentials of Business Statistics, 4th
edition, McGraw-Hill. Byrne, B. M. (2010). Structural Equation Modeling with AMOS Basic Concepts Application and Programming
(Second Edition), Routledge Taylor and Francis Group. Ceylan, H. H. (2013). Tüketici Tipleri Envanterinin Türk Kültürüne Uyarlanması (Adaptation of the
Consumer Styles Inventory to Turkish Culture), Çukurova Üniversitesi Sosyal Bilimler Enstitüsü Dergisi, Vol.22, No 2, 41-58.
Daghfous, N., Petrof, J. V., & Pons, F. (1999). Values and adoption of innovations: across-cultural study, Journal of Consumer Marketing, Vol 16, No 4, 314-331
Dursun, I., Alniacik, U., & Tümer Kabadayı, E. (2013). Tüketici Karar Verme Tarzları Ölçeği: Yapısı ve Boyutları (The Scale of Consumer Styles Inventory: Structure and Dimensions), Uluslararası Yönetim İktisat ve İşletme Dergisi, 9 (19), pp. 293-304.
Fan, J. X., & Xiao, J. (1998). Consumer decision making styles of young adult Chinese, The Journal of Consumer Affairs, 32 (2), 275-294.
Hair, JF., Anderson, Re., Tatham, Rl., & Black, Wc. (1998). Multivariate data analysis. 5th ed. Upper Saddle River, NJ. Prentice-Hall.
Herche, J. (1994). Measuring Social Values: A Multi Item Adaptation to the Lıst of Values (MILOV), Working Paper Report Number 94-101, Cambridge, MA: Marketing Science Institute.
Hiu, A.S.Y., Siu, N.Y.M., Wang, C.C.L., & Chang, L.M.K. (2001). An investigation of decision-making styles of consumers in China. The Journal of Consumer Affairs, 35(2), 326-325.
Huefner, J.C., Parry, B. L., Payne, C. R., Otto, S. D., Huff, S. C., Swenson, M. J., & Hunt, H. K. (2002). Consumer Retaliation: Confirmation and Extension, Journal of Consumer Satisfaction, Dissatisfaction and Complaining Behavior, pp.114-127.
Kahle, L., Liu, R., & Watkins, H. (1992). Psychographic Variation Across United States Geographic Regions, in Advances in Consumer Research book, eds. John F. Sherry and Brian Sternthal, Provo, UT: Association for Consumer Research, 18, 346-352.
Kahle, L. R. (1983), Social Values and Social Change: Adaptation to Life in America, NY: Praeger. Kahle, L. R. (1985). Social Values in the Eighties: A Special Issue, Psychology & Marketing, Vol.2, No.4,
pp.231-237 Kahle, L., Beatty, S. E., & Homer, P. (1986). Alternative Measurement Approaches to Consumer Values:
The List of Values (LOV) and Life Style (VALS), Journal of Consumer Research, 13, pp. 405-409. Lyonski, S., Durvasula, S., & Zotos, Y. (1996). Consumer decision making styles: a multi-country
investigation. European Journal of Marketing, 30 (12), 10-21. MacCallum, R. C., Widaman, K. F., Preacher, K. J., & Hong, S. (2001). Sample Size in Factor Analysis: The
Role of Model Error, Multivariate Behavioral Research, 36:4, 611-637. Madrigal, R., & Kahle, L. R. (1994). Predicting Vacation Activity Preferences on the Basis of Value-System
Segmentation, Journal of Travel Research, s.22-28. Marsh, H. W., & Hocevar, D. (1985). An application of confirmatory factor analyses to the study of self-
concept: First and higher order factor models and their invariance across groups, Psychological Bulletin, 97, 562-582.
Maslow, A. H. (1954), Motivation and Personality, New York, Harper. McDonald, W. J. (1994). Psychological associations with shopping: a moderator variable perspective.
Psychology & Marketing, 11 (6), 549-568. Mcgorry, S. Y. (2000). Measurement in a Cross-Cultural Environment: Survey translation issues.
Qualitative Market Research, 3 (2), 74-81. Odabasi, Y., Baris, G. (2014). Tüketici Davranışı (Consumer Behaviour), Mediacat Kitapları.
Business Management Dynamics
Vol.5, No.9, Mar 2016, pp.01-14
©Society for Business and Management Dynamics
Potgieter, D., Wiese, M., & Strasheim, A. (2013). Demographic differences in adult consumers’ decision making styles in Tshwane South Africa, Journal of Family Ecology and Consumer Sciences, 41, 11-27.
Rokeach, M. (1973). The Nature of Human Values, New York: Free Press. Schwartz, S. H., & W. Bilsky (1987). Toward a Universal Psychological Structure of Human
Values. Journal of Personality and Social Psychology, 53: 550-562. Shim, S. (1996). Adolescent consumer decision making styles: the consumer socialization perspective,
Psychology & Marketing, 13 (6), 547-569. Siu, N. Y. M., Wang, C.C., Chang, L.M.K., & Hui, A.S.Y. (2001). Adapting Consumer Style Inventory to
Chinese Consumers: A Confirmatory Factor Analyses Approach, Journal of International Consumer Marketing, 13 (2), 29-48.
Solomon, M. (2015). Consumer Behaviour: Buying, Having and Being, Prentice Hall. Sproles, G. B., & Kendall, E. L. (1986). A Methodology for Profiling Consumers' Decision-Making Styles,
The Journal of Consumer Affairs, pp. 267-279. Sproles, George B., & Kendall, E. L. (1987). A Short Test of Consumer Decision Making Styles, The Journal
of Consumer Affairs, Volume 5, pp.7-14 Unal, S., & Ercis, A. (2006). Pazarın Satın Alma Tarzlarına ve Kişisel Değerlere Göre Bölümlendirilmesi
(Segmenting the Market according to Consumer Decision Making Styles and Personal Values), Marmara Üniversitesi İİBF Dergisi, 21 (1), 359-382.
Walsh, G., Hennig-Thurau, T., Wayne-Mitchell, V., & Wiedman, K.P. (2001). Consumers’ decision making style as a basis for market segmentation. Journal of Targeting, Measurement and Analysis of Marketing 10:117- 131.
Wesley, S., Lehew, M., & Woodside, Ag. (2006). Consumer decision-making styles and mall shopping behaviour: building theory using exploratory data analysis and the comparative method. Journal of Business Research, 59 (2006): 535-548.
Yesilada, F., & Kavas, A. (2008). Understanding the female consumers’ decision making styles, İşletme Fakültesi Dergisi, 9 (2):167-185.