Embed Size (px)
Citation preview
The Role of Compensation Consultant
in Executive Pay Governance
Marizah Minhat*
October 23, 2008
Abstract
I examine the role of the pay consultant in influencing the Chief Executive Officer
(CEO) pay. Firstly, I find that the use of a pay consultant is common and large risky
firms tend to employ more than one pay consultant. Secondly, by isolating the effect
of leading pay consultants, I find that in the pursuit for the largest market shares, these
consultants have contributed to the unintended consequence of an upward ratcheting
of the overall level of CEO pay. This paper contributes to the executive pay literature
that has scarcely studied pay consultant despite its central role in the executive pay
governance.
JEL classification: G3
Keywords: CEO compensation; Corporate Governance; Pay Consultant
* The author is a PhD-Student at the Division of Accounting and Finance, University of Stirling, FK9 4LA Stirling, Scotland, United Kingdom. The author is grateful for comments from Ruth Bender, Rezaul Kabir and Chris Veld, and the participants at 2008 Multinational Finance Society (MFS) Conference in Orlando, Florida, and the 2007 European Financial Management Association (EFMA) doctoral seminar in Vienna. The financial support from the Overseas Research Students Awards Scheme (ORSAS) and PhD scholarship from the Division of Accounting and Finance, University of Stirling are gratefully acknowledged. All errors are the responsibility of the author. The author can be contacted at Tel: ++ 44 (0) 1786 467304; Fax: ++ 44 (0) 1786 467308; Email: [email protected].
The Role of Compensation Consultant
in Executive Pay Governance
Abstract
I examine the role of the pay consultant in influencing the Chief Executive Officer
(CEO) pay. Firstly, I find that the use of a pay consultant is common and large risky
firms tend to employ more than one pay consultant. Secondly, by isolating the effect
of leading pay consultants, I find that in the pursuit for the largest market shares, these
consultants have contributed to the unintended consequence of an upward ratcheting
of the overall level of CEO pay. This paper contributes to the executive pay literature
that has scarcely studied pay consultant despite its central role in the executive pay
governance.
JEL classification: G3
Keywords: CEO compensation; Corporate Governance; Pay Consultant
2
1. Introduction
With the separation of ownership and control that describes public listed firms, the
manager of a firm is assumed to be pursuing self-interest at the expense of the
shareholders. In this context, the agency theory predicts that a managerial pay
package can be designed to promote the manager-shareholder interest alignment
(Jensen and Murphy, 1990). In contrast, the managerial power theory views that the
managerial pay can be a source of the agency cost itself (Bebchuk and Fried, 2003;
Jensen, Murphy, and Wruck, 2004). The pay package is seen as a means for the
managerial extraction of private benefit at the expense of the shareholders.
If the executive pay is seen as a source of the agency cost itself, it needs to be
governed. Prior studies have examined the role of a number of governance
mechanisms in influencing the executive pay. These include the board of directors,
outside directors, remuneration committee, blockholders, institutional shareholders,
managerial ownership, CEO duality, and debtholders (i.e. through the effect of firm
leverage). With few exceptions (Conyon, Peck, and Sadler, 2006; Bender, 2008), the
role of pay consultant remains understudied worldwide (Bonet and Conyon, 2005).
How this governance mechanism influences the executive pay outcomes remains
largely unknown.
There are, at least, four reasons why examining the role of pay consultant is
important to increase our understanding on the state of executive pay. Firstly, the use
of a pay consultant is common to the executive pay setting. I find that more than
eighty per cent of the 700 firm-years observed employ pay consultant. Secondly, the
use of a pay consultant is central to the executive pay setting. Pay consultants are not
only regarded as pay data providers but also experts that legitimising the remuneration
3
committee’s decisions (Bender, 2008). Thirdly, there is a widespread belief that the
pay consultant is not totally independent from the influence of the firm executives
(Crystal, 1991; Bender, 2008; Bebchuk and Fried, 2005). Fourthly, competition
among the pay consultants is seen to have driven up pay rises for the firm executives:
“…the role of this army of pay consultants is coming under fire. They are
accused of fuelling boardroom pay rates to win business for themselves.
The Association of British Insurers, whose members speak for a fifth of
the stock market, claims that the advisers are soliciting business by hinting
to prospective clients that they could drive up pay rises for directors.”
The Mail on Sunday (Feb 6, 2005)
Interestingly, I find some evidence that the consultant’s market share is positively
related to the client firm’s CEO pay level. This relation is evident for the consultants
competing for the largest market share (i.e. New Bridge Street Consultants and
Towers Perrin). It implies that these consultants compete by advising towards higher
pay for their client’s CEO. This line of interpretation is reasonable from the
managerial power theory whereby the client firm’s CEO is perceived as having the
power to appoint the consultant. By advising towards higher pay for the CEO, the
consultant reduces the risk of losing its business with the client firm.
The remainder of this paper is structured as follows. Section 2 presents the extant
literature and the development of hypotheses. Section 3 and 4 are on the research
methods and findings respectively. Section 5 presents the conclusions.
2. Literature review and hypotheses
4
The design of the executive pay package is commonly placed under the responsibility
of the remuneration committee. Because the committee commonly lacks the expertise
and information about competitive pay, it often works with a pay consultant (Jensen et
al., 2004; Bender, 2008). The committee is indeed made responsible on the
appointment of consultant who advises on the executive pay (Combined Code, 2006).
On one hand, the reason for using pay consultant is for the manager-shareholder
interest alignment (Conyon et al., 2006). On the other hand, the pay consultant is seen
as being the hidden force behind the spiralling executive pay (Crystal, 1991; Bebchuk
and Fried, 2005). Empirical evidence on the role of pay consultant is sparse despite
the widespread use of this governance mechanism in the executive pay setting. Bonet
and Conyon (2005, p. 150) suggest that:
“…one potentially important avenue for research would be the role of the
compensation advisor to the compensation committee. Anecdotal
evidence suggests that such compensation consultants are used widely and
so investigating their influence may further help our understanding of
executive pay and corporate governance.”
2.1. Agency theory
Agency theory predicts that a managerial pay package will be designed in a way to
incentivise manager to increase shareholder wealth (Jensen and Meckling, 1976;
Jensen and Murphy, 1990). The pay package is seen as a tool, within the control of the
shareholders, to link the managerial pay with the firm performance (Bertrand and
5
Mullainathan, 2000). In this context, the pay consultant who advises on the executive
pay is deemed to act in the best interest of the shareholders. The demand for
compensation service arises because firm seeks to determine the optimal executive
pay. Ideally, the pay consultant is perceived as an independent and dependable source
of knowledge and skill in the executive pay design due to its prolonged market
experience and established reputation. It is thus reasonable to suggest that a
fundamental reason for using the pay consultant is to ensure the manager-shareholder
interest alignment (Conyon et al., 2006).
2.2. Managerial power theory
The managerial power theory suggests the absence of effective shareholders’ control
over the executive pay design. The shareholders are almost powerless to the extent
that the executive pay design is left under the significant influence of the executive
themselves. Executive pay thus becomes a source of the agency cost itself (Bebchuk
and Fried, 2003; Jensen et al., 2004). The use of the pay consultant is viewed as one
expression of the managerial self-interest that drives executive pay for the benefit of
the executive at the expense of the shareholders (Conyon et al., 2006).
CEOs can have a significant influence over the pay consultant’s advice on their
pay although they are not directly involved in the firing or hiring the pay consultant.
Crystal (1991) argues that the external directors that form the remuneration committee
normally have no economic ties with the firm. The committee thus lacks the incentive
to ensure the consultant it appointed advising towards a CEO pay package that is in
favour of the shareholders. If the client firm’s human resources department involves
6
in appointing the consultant, Bebchuk and Fried (2005) argue that, being a
subordinate to the CEO incentivises the department to favour the CEO.
Bebchuk and Fried (2005) also argue that the consultant also lacks the incentive to
favour the shareholders because the consulting fee is not linked to firm performance.
The consultant instead has understood that a pay recommendation that displeases the
CEO may risk the consultant’s future employment. This argument is consistent with
Warren Buffet’s remark in the 2004 letter to the shareholders of Berkshire Hathaway
Inc. that highlights both the human relations departments and the pay consultants “had
no trouble perceiving who buttered their bread”. Similarly, Crystal (1991) argues that
if the consultant recommendation does not cause the CEO to earn more money than
he was earning before the consultant appeared on the scene, the consultant risks losing
business with the client firm. Therefore, it can be envisaged that it is almost
impossible for the consultant to advise openly and critically on the CEO pay design in
order to remain in business. In this context, the use of pay consultant is viewed as
increasing the pay-related agency cost.
Pay consultant is indeed increasingly being accused of being the hidden force
behind the spiralling boardroom pay (e.g. Crystal, 1991)1. A US-based study by
Bizjak, Lemmon, and Naveen (2008) suggests that about sixty-five per cent of the
firms they examined employ pay consultant and set pay at or above the fiftieth
percentile of the peer group. Similarly, by using UK-based cross-sectional sample of
the year 2003, Conyon et al., (2006) find that firms using consultant pay CEO more
than firms without one. They argue that pay consultant is responsible for the
unintended consequence of an upward ratcheting of the overall level of executive pay.
1 A similar remark was reported in ‘Pay consultants: Hidden force behind salary boom’, The Guardian (August 1, 2003).
7
But they did not examine the marginal effect of leading consultants on the overall
level of executive pay.
2.3. Multiple consultant hypothesis
Whilst some firms use only one pay consultant, using more than one consultant is
common among firms (Bender, 2008). Although there is no requirement for the firms
to disclose the information on the pay consultant fees, some anecdotal evidence
suggests that these consultants do not come cheap. Consultants may charge about five
hundred pounds an hour for their services.2 If a consultant does not come cheap, then
it poses a question on why some firms use more than one consultant.
Based on a survey, Bender (2008) finds that different consultants are used to advise
the management team and the remuneration committee separately i.e. the consultants
giving their views on the same aspect of pay. This could be a means to overcome the
conflict of interest associated with consultants advising pay for the people who
appointed them. Alternatively, the employment of multiple consultants may benefit
the firm through the input supplied by the consultant specialising in different aspect of
pay (Bender, 2008). For example, it is reported in the Aggreko plc’s Annual Report
2005 that:
“…Towers Perrin provided remuneration with respect to basic salary,
bonus plans and executive long-term incentive plans. New Bridge
Consultants provided advice on the implementation and administration of
share plans. Mercer Human Resource Consulting provided advice on
2 ‘Get me an above-average pay consultant’, The Mail on Sunday (February 6, 2005)
8
retirement benefits in the UK and overseas and administers the UK
defined benefit pension scheme.”
However, the employment of multiple pay consultants may reflect the attempt to
shop around to find the highest rate of pay for the executives (Sunday Telegraph, Jan
4, 2004). This argument is consistent with the managerial power theory. Since CEO is
assumed to have great influence over the consultant’s appointment, a CEO may
increase her chance of getting the best rate of pay by employing multiple consultants.
The presence of more than one consultant serving the same firm increases the
competition among the consultants. Every consultant will act in favour of the CEO i.e.
will advise towards greater pay for the CEO in order to remain in business. In light of
the managerial power hypothesis, this paper intends to test the following hypothesis:
H1: Firm with multiple pay consultants will be associated with higher
CEO pay.
2.4. Competition hypothesis
Just like in any other business, the consultants are competing to maximise their
market shares. The effect of competition among the consultants has not been
examined by prior studies. For the first time, this paper examines this issue in light of
the managerial power theory.
The managerial power theory implies that a pay consultant has a strong incentive
to serve the interest of the client firm’s CEO in order to retain its consulting business
with the client firm. Having perceived the CEO as having a significant influence in
9
rehiring the consultant, it encourages the consultant to compete with the rest by
proposing a pay package that is in the best favour of the CEO. If the consultant
competes by way of advising towards higher pay for its client firm’s CEO, then
consultant with greater market share (i.e. the more successful consultant) tend to be
associated with higher client firm’s CEO pay. This argument leads to the hypothesis:
H2: After controlling for firm size, pay consultant with greater market
share will be associated with higher client firm’s CEO pay.
3. Data and variables
3.1. Sample
The sampling begins with a database on CEO pay for 181 non-financial FTSE350
firms3. Seven firms did not disclose whether or not they employ pay consultant and
are eliminated from the sample. The final sample is thus made up of 175 companies.
The non-disclosure of the name or number of pay consultant is found to be common
prior to 2002. Firms are required to disclose the name of entity that provides advice,
or service, that had materially assisted in the executive pay setting only beginning the
financial year ended on or after 31st December 2002 with the introduction of
Directors’ Remuneration Report Regulations (DRRR) 2002. 700 firm-years (175
public listed firms over 2003-2006 period) have complied with the requirement and
3 The database lists the most important public listed non-financial companies in the UK during an eight-year sample period of 1999-2006. The firms had to appear at least four times consecutively between 1999 and 2006 as FTSE350 Index constituents. The selection of four years is consistent with that in Yermack (1995). Consistent with many prior studies, financial related firms are eliminated from the sample. Due to data non-availability for, at least, one year during the eight-year period (resulting from mergers and acquisitions, new companies and non-disclosure) the sample is reduced to 181 firms.
10
thus have been considered in the final sample. Firms are classified according to the
Primary Standard Industrial Classification (SIC) Code that reflects the firms’ main
business activity. The codes are obtained from the Financial Analysis Made Easy
(FAME) database. Table I shows the characteristics of the sample firms.
(Insert Table I Here)
The regulation on the disclosure of directors’ pay such as salary, bonus, benefit,
stock option, restricted stock and pension, is also enforced beginning the financial
year ended on or after 31st December 2002 (DRRR, 2002). Following the approach of
many studies (Conyon, Core, and Guay, 2006; Ozkan, 2007), pay data are hand-
collected from the director remuneration report section of the firms’ annual reports.
Data on firm characteristics are obtained from the Datastream. Data on CEO
characteristics and governance variables are collected from the firms’ annual reports.
3.2. Variables
3.2.1. CEO pay. The pay components considered in this paper are: 1) salary; 2)
bonus; 3) benefit4; 4) defined benefit (DB) pension increment5 5) restricted stock
grant; and 6) stock option grant. The values of the first three components are available
in the firm’s annual reports. The actuarial present value of DB pension is also reported
in the annual reports. The pension increment is derived from the difference between
the pension value in year t and the pension value in year t-1. Stock grant is measured
at the face value of the equity and is discounted at 20% to reflect its performance-
4 This refers mainly to benefit such as car allowance and insurance premium paid on behalf of CEOs. 5 Data on other deferred compensation are not available.
11
contingent character (Conyon and Murphy, 2000; Stathopoulos, Espenlaub, and
Walker, 2004). As normally adopted in prior studies (e.g. Ozkan, 2007; Bizjak et al.,
2008), the Black-Scholes-Merton value of stock option which is given as the price of
a European call option on a dividend-paying stock, is employed (refer to Appendix A
for detailed information)6.
3.2.2. Pay consultant. To test the first hypothesis, the number of pay
consultant is used.7 To test the second hypothesis, the market share of each consultant
is estimated as the number of pay consulting contracts it has secured divided by the
total number of pay consulting contracts in the market. As part of robustness checks,
the estimated market share is also multiplied by the client firm’s sales in order to
account the contract size. The big six consultants are also identified by using dummy
variable in order to test their isolated effects on the CEO pay outcomes.
3.2.3. Firm performance. Market-based performance measures are widely used in
prior studies. Accounting-based measures such as earnings per share and return on
asset have gained greater attention in recent studies (Perry and Zenner, 2001; Brick,
Palmon and Wald, 2006; Bizjak et al., 2008). Our knowledge remains incomplete as
to which performance measure is placed as the most important in measuring corporate
director performance (Conyon and Sadler, 2001). For ease of comparisons, this paper
focuses on the most popular market-based performance measures, namely,
shareholder return (SHR) (Hall and Liebman, 1998; Core et al., 1999; Perry and
6 I acknowledge that the stock option values estimated by the Black-Scholes model assumes CEOs as fully diversified investors that may not be the case in reality (Veld, 2003). But, the International Financial Reporting Standard 2 has recognised the model as providing the fair values for stock option. 7 I also use a dummy variable that equals zero if a firm uses one pay consultant and one if a firm uses multiple consultants.
12
Zenner, 2001; Brick et al., 2006)8. Lagged performance measure is also considered,
not just to make the causality issue less contentious, but also because prior year good
performance is rewarded through the increase in future salaries and, bonus for last
year may be paid in the current year (Hermalin and Wallace, 2001; Perry and Zenner,
2001). The use of lagged measure demonstrates a clear causal from (past)
performance to (current) pay hence eliminate joint endogeneity problem between pay
and performance (Hermalin and Wallace, 2001). Lagged measure is also commonly
used (Jensen and Murphy, 1990; Hall and Liebman, 1998; Perry and Zenner, 2001;
Brick et al., 2006).
3.2.4. Other variables. Tosi, Werner, Katz and Gomez-Mejia (2000) suggest
that firm performance explains only five per cent of the pay variance. Besides, prior
studies have examined the role of board of directors (Core et al., 1999; Ozkan, 2007),
outside directors (Ozkan, 2007), remuneration committee (Conyon and Peck, 1998;
Bonet and Conyon, 2005), blockholders (Core et al., 1999; Ozkan, 2007), institutional
shareholders (Almazan et al., 2005; Ozkan, 2007), managerial ownership (Brick et al.,
2006; Ozkan, 2007), CEO duality (Conyon and Peck, 1998; Core et al., 1999; Brick et
al., 2006) and debtholders (through the effect of firm leverage) (Almazan et al., 2005;
Brick et al., 2006; Ortiz-Molina, 2007) in mitigating the agency cost associated with
executive pay. Apart from controlling for firm heterogeneity by employing fixed and
random effects estimations, the effects of a number of variables are also isolated.
Table II lists the variables and its definitions. Firm size is measured by the natural
logarithm of sales for the year. Sales are common measure for firm size (Brick et al.,
2006; Ozkan, 2007; Bizjak et al., 2008; Liu and Stark, 2008). Firm leverage is the
8 ROA (return on assets), calculated as the ratio of earnings before interest and taxes (EBIT) to total assets (Ozkan, 2007), is also used as part of robustness check.
13
ratio of book value of total debt to book value of total asset (Yermack, 1995; Almazan
et al., 2005; Brick et al., 2006). Firm risk is the stock return volatility (i.e. the standard
deviation of annualised monthly stock return over prior 120-month or throughout the
firm’s life). Standard deviation of return is employed in Core et al. (1999). The
governance variables are measured by the natural logarithm of total number of
directors on the board (Core et al., 1999), the number of non-executive directors
divided by the number of executive directors, the natural logarithm of total number of
remuneration committee members (Bonet and Conyon, 2005), the natural logarithm of
total number of outside blockholders (Core et al., 1999; Ozkan, 2007), the percentage
of total institutional ownership that is greater than three per cent (Almazan et al.,
2005; Ozkan, 2007), the percentage of the firm common stock owned by CEO (Brick
et al., 2006) and a dummy variable that equals one if the CEO is also the chair of the
Board and zero otherwise (Conyon and Peck, 1998; Core et al., 1999; Brick et al.,
2006). CEO characteristics are measured by the natural logarithm of the CEO age
(Garen, 1994; Conyon and Murphy, 2000) and the natural logarithm of the number of
years of the CEO has held the position of CEO at the firm (Perry and Zenner, 2001).
(Insert Table II Here)
4. Empirical tests and findings
4.1. Descriptive statistics
Table III reports the descriptive statistics for the sample of 700 firm-years (175 firms
during 2003-2006 periods). The mean (median) of CEO annual pay is about £1.9
14
million (£1.4 million). Current shareholder return, which is a market-based measure
of firm performance, has an average (median) of 14% (17%). Stock return volatility
has an average (median) of 33% (32%). Sales, which is a measure of firm size, have
an average (median) of £4.0 billion (£1.3 billion). The mean (median) for firm’s
leverage is 27% (26%). On average, a firm employs two pay consultants. For the sake
of brevity, the statistics for other governance variables are not described here.
(Insert Table III Here)
Figure 1 shows two pie charts describing the pay consultants used by the 700
firm-years. Chart 1 shows the frequency distribution of the consultants used by the
firm-years. More than 50% of the 700 firm-years I observed use multiple pay
consultants. This is comparable to 45% reported in Conyon et al. (2006). The number
of consultants employed varies from one to eight. 44.4% (i.e. 311) of the firm-years
use only one consultant. This implies that 55.6% (i.e. 389) of them use multiple
consultants i.e. 29.0%, 16.1%, 7.6% and 2.9% use two, three, four and more than four
consultants respectively. Our findings are not substantially different from that of
Conyon et al. (2006)9. 46.8% of their sample firms use one consultant.
(Insert Figure 1 Here)
It is found that 83 consulting firms were employed by the 700 firm-years
observed. Chart 2 shows the six leading pay consultants used by the firm-years in our
sample. These are the consultants with more than five per cent market share. The most
9 I did not test for statistical significance.
15
frequently used consultant is the New Bridge Street Consultants that captures about
17.9% of the total pay consulting contracts offered by the firm-years, followed closely
by its US rival, Towers Perrin (15.1%). The rest are Mercer (7.6% each), Monks
(6.9%), Watson Wyatt (6.4%) and Deloitte (6.4%).
The big six takes up about 60.3% of the total pay consulting businesses during
2003-2006 periods. Similar big six consultants are identified in Conyon et al. (2006)
and they capture about 67.2% of the total pay consulting contracts offered in 2003 by
their sample firms. The Herfindahl index, calculated as the sum of the market shares
squared, is 0.073. This is comparable to 0.093 reported in Conyon, et al. (2006). This
indicates high degree of competition facing the pay consulting business.10
4.2. Multivariate analysis
Pooled Ordinary Least Squares (OLS) regressions are employed to test the
hypotheses. Panel data regressions are also employed as part of robustness check to
account for the unobservable firm-specific effects (Baltagi, 2005). Pooled OLS may
produce biased estimates since the sample contains repeated observations per
individual firm in which the observations are not independent. Fixed effect or random
effect models consider the repetition and control for fixed or random individual firm
differences.
Pooled OLS regressions explain the variation both between firms and across time.
Fixed effect regressions explain the variation across time while controlling for the
unobservable or omitted time-invariant firm characteristics. The firm-specific
characteristics are captured in the firm-specific intercept. This model assumes
10 The Herfindahl index below 0.1 indicates an unconcentrated index reflecting the high degree of competition facing the pay consulting business.
16
different intercepts across firms or time periods.11 In random effects model, the
difference among firms (or time periods) is captured in the variance of the error term.
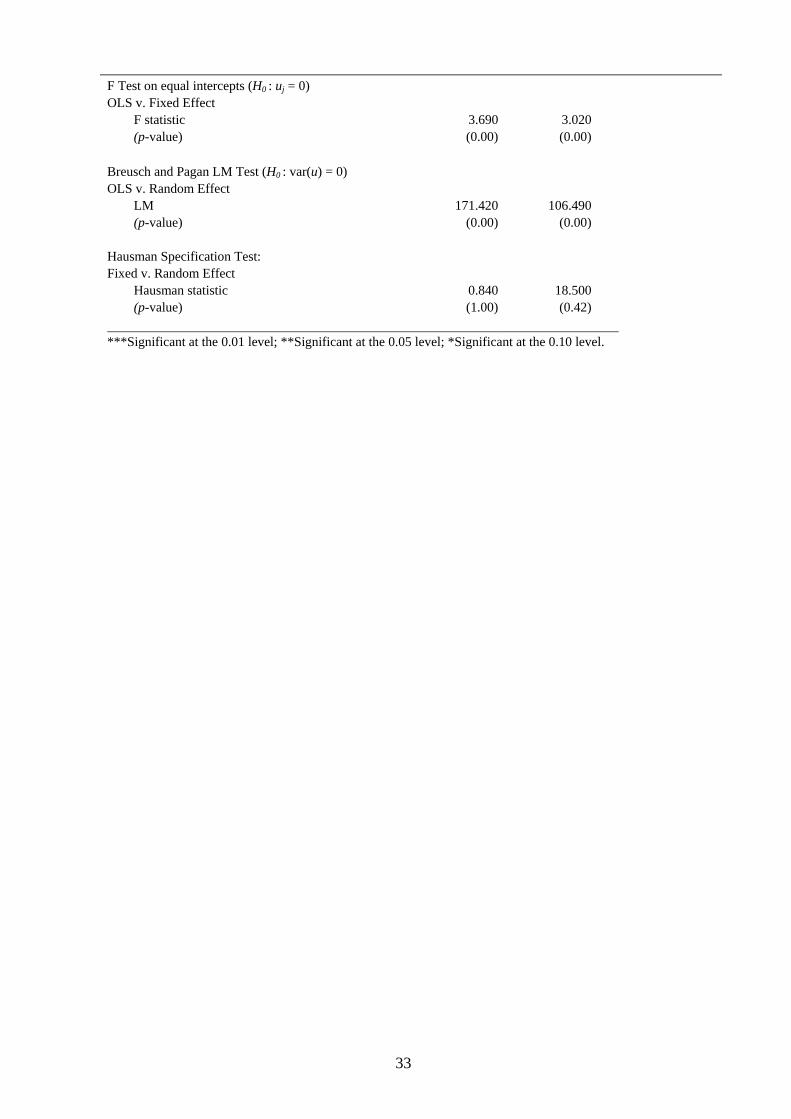
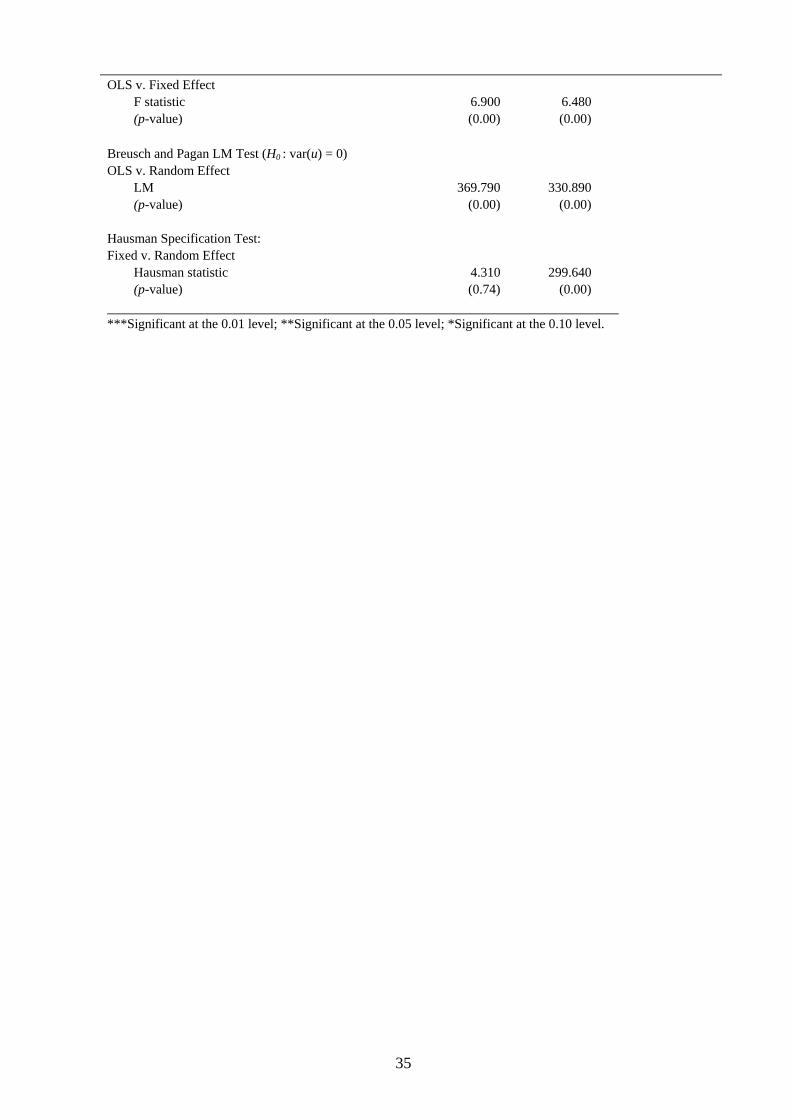
The F-test is used to test the fixed effects. The null-hypothesis is that equal
intercepts across firms. The Breusch and Pagan Lagrangian multiplier (LM) test is
used to test random effects (Breusch and Pagan, 1980). The null-hypothesis is that
variances of firms are zero. The Hausman Specification test is then used to compare
the fixed effect and random effect model. The null hypothesis is that the individual
effects are uncorrelated with the other regressors in the model (Hausman, 1978).
To test the first hypothesis, that is the effect of the use of multiple pay consultants
on the CEO pay level, the following OLS model is first employed:
(1)
( )( ) ( ) ( )
( ) ( ) ( )( ) ( ) ( )
( ) ( ) ( )( ) ( ) ( ) jtjjjtjtjt
jtjtjt
jtjtjt
jtjtjt
jtjtjt
jt
TenureLnAgeLnChairCEOOwnCEOOwnInstrsBlockholde
RemcoSizeLnsOutsideDirBoardSizeLnRiskLeverageSalesLn
SHRSHRPayConLnTotPayLn
εδλβββββββββ
ββββββα
++++++++++++
++++++= −
151413
121110
987
654
1321
___
Following many prior studies (Perry and Zenner, 2001; Brick et al., 2006;
Conyon, Core and Guay, 2006), the natural logarithm of pay is used to adjust for the
non-normality of pay distribution. is the total pay of CEO in firm j at time t,
made up of salary, bonus, benefit, DB pension increment, restricted stock grant and
stock option grant. is the number of pay consultants used by firm j at time
jtTotPay
jtPayCon
11 For example, if a particular firm required unique management skills, the firm-specific intercept in the fixed effect regression would capture the additional compensation needed to employ a CEO with such skills (Brick et al., 2006).
17
t12. jλ and jδ denote industry and time dummy respectively. jtε is an idiosyncratic
error term.
(Insert Table IV Here)
Table IV reports the regression results for pooled OLS (Column 1 and 2) and
random effects regressions (Column 3 and 4).13 Consistent with prior studies, CEO
pay is positively related to current shareholder return, firm sales, board size, and CEO
tenure (Perry and Zenner, 2001; Brick et al., 2006; Ozkan, 2007). However, the
positive association between CEO pay and number of pay consultant employed is not
statistically significant across four different specifications.14 Since there is no
evidence that CEO pay is affected by the number of pay consultant employed, it poses
a question why some firms do employ more than one pay consultant.
(Insert Table V Here)
( )( ) ( )( ) ( ) ( )( ) ( ) ( )
( ) ( ) ( )( ) ( ) ( ) jtjjjtjtjt
jtjtjt
jtjtjt
jtjtjt
jtjt
jt
TenureLnAgeLnChairCEOOwnCEOOwnInstrsBlockholde
RemcoSizeLnsOutsideDirBoardSizeLnRiskLeverageSalesLn
SHRSHRPayConLn
εδλβββββββββ
βββββα
++++++++++++
+++++= −
141312
11109
876
543
121
___
(2)
12 The use of a lagged and dummy variables produce similar results. In this case, a dummy variable equals one for firm with more than one pay consultant and zero otherwise. 13 The F-test rejects the null hypothesis that the unobservable firm-specific effects do not vary. The Breusch and Pagan Lagrangian multiplier (LM) test rejects the null hypothesis that variances of firms are zero. Both tests suggest that the pooled OLS regressions are biased. The Hausman Specification test is then conducted to compare the fixed effect and random effect model. The null-hypothesis is that the individual effects are uncorrelated with the other regressors in the model. The test cannot reject the null hypothesis, indicating the random effect regressions are appropriate. 14 There has been no change in the results when ROA (return on assets) is used as proxy for firm performance.
18
The above OLS model is employed to examine why some firms do employ more
than one pay consultant. As reported in Table V (Column 1, 2 and 3), both firm size
and risk are positively and significantly related to the number of pay consultants
employed by a firm. These results provide some evidence that large risky firms tend
to use more than one pay consultants. Consistent with Bender’s (2008) finding, large
firm can afford using multiple consultants to advise the management team and
remuneration committee separately, or to advise on a different aspect of pay. More
than one pay consultant may also be needed to design the executives’ pay in firms
facing complex operating and information environment. The pay design for the CEO
of large risky firms tends to be more complex due to greater use of equity-linked pay.
The pooled OLS model in Eq. (1) is also adopted to test the second hypothesis
about the effect of competition among the pay consultants on the CEO pay.
is replaced with that represents the market share of pay consultant used by
firm j at time t. Because there is a need to match a firm-year with a consultant, only
the firm-years with one consultant (i.e. 311 observations) are considered. The firm-
years with multiple consultants are excluded because it is almost impossible to
determine the consultant with the greatest influence over the firm-year’s CEO pay.
jtPayCon
jtConShare
Table VI reports the regression results for pooled OLS regressions. Consistent
with the second hypothesis, consultant with greater market share is associated with
higher client firm’s CEO pay. The managerial power theory implies that a pay
consultant has a strong incentive to serve the interest of its client firm’s CEO in order
to retain its consulting business with the client firm. The probability of losing business
with the client firm is greater for the pay consultant if it does not act in favour of the
19
CEO. It is thus sensible for the consultant advising towards higher pay for the client
firm’s CEO in order to maintain or increase its market share.
(Insert Table VI Here)
If the consultant competes by way of advising towards greater pay for the client
firm’s CEO, it is unsurprising to observe that successful consultant (i.e. consultants
with greater market share) tend to associate with greater pay for the client firm’s
CEO. It is thus reasonable to expect that New Bridge Street Consultants, Towers
Perrin, Mercer, Monks, Watson Wyatt and Deloitte have become the big six pay
consultants as a result of their advices towards relatively higher pay for their client
firms’ CEO. The empirical evidence provided here seems supporting this argument.
Consistent with prior studies, CEO pay is also found positively related to sales.
Positive and significant pay-sales coefficient is indeed a stylised fact in the directors’
pay literature (Core et al., 1999; Conyon and Murphy, 2000; Almazan et al., 2005;
Brick et al., 2006; Ozkan, 2007). Larger firms reward CEOs with higher pay because
of their demand for higher quality managerial talent (Core et al., 1999). Alternatively,
it can be argued that large firms which tend to reward their CEOs with higher pay
may choose to employ pay consultant with greater market share or reputation. This
argument is valid but after considering firm size (as reported in Table VII), the
marginal effect of the consultant’s market share remains statistically significant15.
CEO pay is also positively related to board size. This is consistent with the
argument that a larger board is less effective and more susceptible to the influence of
the CEO due to greater problems with coordination, communication and decision- 15 As mentioned earlier, sales are commonly adopted in recent studies to proxy for firm size (Brick et al., 2006; Ozkan, 2007; Bizjak et al., 2008; Liu and Stark, 2008). There has been no change in the results when total asset is used as proxy for firm size.
20
making (Core et al., 1999; Ozkan, 2007). Consistent with Ozkan’s (2007) finding, the
outside directors do not seem to perform a disciplinary function in monitoring (i.e.
lowering) CEO pay. CEO tenure is also positively related to CEO pay. CEO with
longer tenure is rewarded with higher pay probably for possessing greater human
capital (Perry and Zenner, 2001; Brick et al., 2006; Conyon et al., 2006).
4.3. Additional tests and robustness checks
(Insert Table VII Here)
A further analysis is performed in this section to isolate the effect of each of the big
six consultants on the client firm’s CEO pay. After considering firm size, the results
in Table VII suggest that the New Bridge Street and its US rival, Towers Perrin, have
significantly contributed to the upward ratcheting of the overall level of CEO pay. It
shows that they are competing closely for the largest market share by advising
towards higher pay for their client’s CEO. The results are consistent with a media
survey:
“…there is a clear link between companies with controversial
remuneration practices and their pay consultants…A recent survey found
that, together with its larger US rival Towers Perrin, New Bridge had
effectively cornered the market...” The Mail on Sunday (Feb 6, 2005)
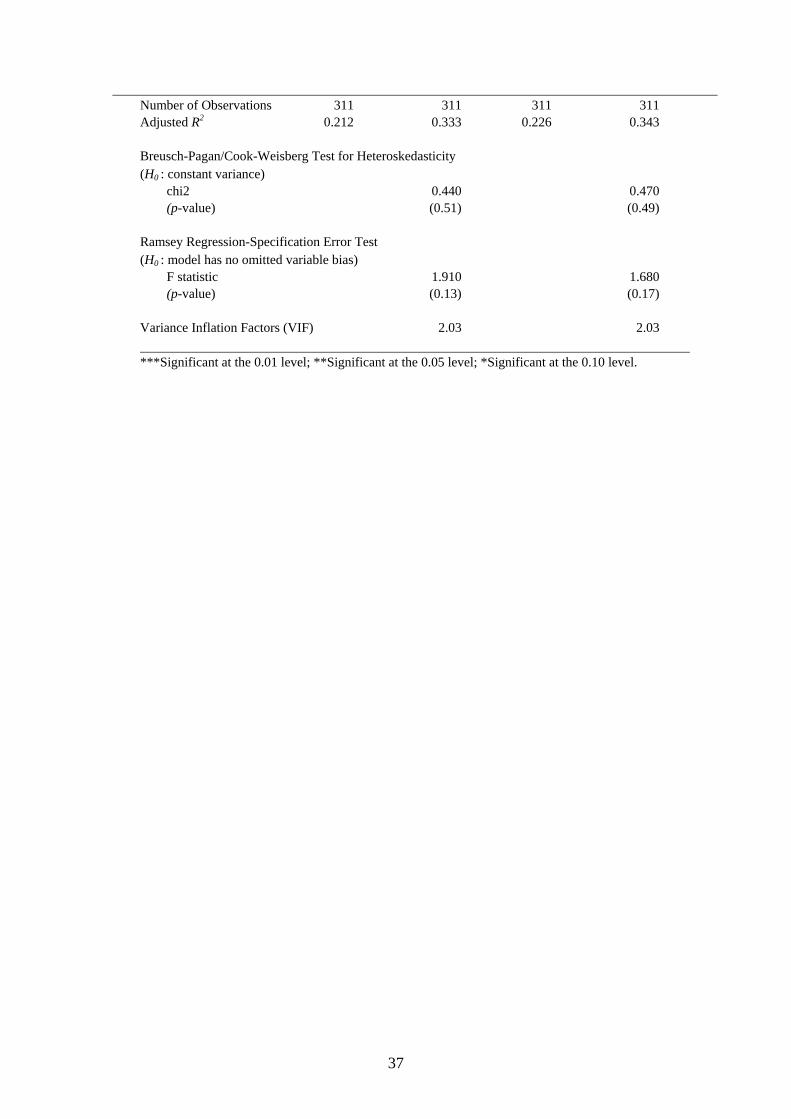
As part of the regression diagnostics, the Breusch-Pagan/Cook-Weisberg test is
used to test for heteroskedasticity. The null hypothesis of constant variance cannot be
21
rejected. The result of Ramsey regression-specification error test cannot reject the null
hypothesis that the regression model has no omitted variable bias. The variance
inflations factor (VIF) of each of the independent variables is much less than 1016
indicating the absence of serious multicollinearity problem.
5. Conclusions
Pay consultant is seen as central to the CEO pay governance, yet it is currently
understudied worldwide. The question on how this governance mechanism influences
CEO pay outcomes remains largely unanswered. Bender’s (2008) survey finds that
pay consultants are regarded as experts and pay data providers as well as legitimising
the remuneration committee’s decisions. But there is a widespread belief that the pay
consultant is not totally independent from the influence of the firm executives
(Crystal, 1991; Bender, 2008; Bebchuk and Fried, 2005). Using a one-year cross-
sectional data, Conyon et al., (2006) find that firms using consultant pay CEO more
than firms without one.
In response to the recent institutional concern, I re-examine the role of the pay
consultant in influencing the CEO pay outcomes by using a larger cross-sectional time
series dataset. About 55.6% of the 700 firm-years I observed use multiple consultants.
The number of pay consultants employed varies across firm-years from one to eight.
Bender’s (2008) survey indicates that firms use multiple consultants to advise the
management team and the remuneration committee separately. Multiple consultants is
also used for different consultant specialises in different aspect of pay. But the
16 If the VIF of a variable exceeds 10, which will happen if R
2 exceeds 0.90, that variable is said to be
highly collinear (Gujarati, 2003).
22
characters of firms that use multiple consultants remain unknown. By employing
pooled Ordinary Least Squares (OLS) and cross-sectional time series regressions, I
find that the use of multiple pay consultants is common among large risky firms.
Interestingly, I present some empirical evidence that the competition among pay
consultants has resulted in an upward ratcheting of the overall level of CEO pay. This
is evident for the consultants competing for the largest market share (i.e. New Bridge
Street Consultants and Towers Perrin). This is the first study that isolates the effect of
leading pay consultants on the client firm’s CEO pay. These consultants compete by
advising towards higher pay for their client firm’s CEO. This argument is reasonable
from the managerial power theory whereby the client firm’s CEO is perceived as
having the power to appoint the consultant. By advising towards higher pay for the
CEO, the consultant reduces the risk of losing its business with the client firm.
The findings of this paper pose some doubts that the use of pay consultant in the
executive pay setting is a step towards promoting the shareholders’ interest. There
seems a need to closely monitor the pay consultants themselves if the shareholders’
interest is to be continuously protected. Because pay consultants are central to the
executive pay setting, I reckon that it is important for future research to examine the
mechanisms that can be deployed to govern the pay consultants.
23
References
Almazan, A., Hartzell, J. C. and Starks, L. T. (2005), “Active institutional shareholders and
costs of monitoring: Evidence from executive compensation”, Financial Management, Vol. 34
No. 4, pp. 5-34.
Baltagi, B. H. (2005), Econometric Analysis of Panel Data, John Wiley & Sons, England.
Bebchuk, L. and Fried, J. (2003), “Executive compensation as an agency problem”, Journal of
Economic Perspectives, Vol. 17 No. 3, pp. 71-92.
Bebchuk, L. and Fried, J. (2005), Pay without performance: The unfulfilled promise of
executive compensation, Harvard University Press, England.
Bender, R. (2008), “Paying for advice: The role of remuneration consultant in the UK listed
companies, 2008 British Accounting Association (BAA) conference paper.
Bertrand, M. and Mullainathan, S. (2000), “Agents with and without principals”, The
American Economic Review, Vol. 90 No. 2, pp. 203-208.
Bizjak, J. M., Lemmon, M. L. and Naveen, L. (2008), “Does the use of peer groups contribute
to higher pay and less efficient compensation?”, Journal of Financial Economics,
forthcoming.
Bonet, R. and Conyon, M. J. (2005), “Compensation committees and executive
compensation: Evidence from publicly traded UK firms”, in Keasey, K., Thompson, S. and
Wright, M. (Ed.), Corporate Governance: Accountability, Enterprise and International
Comparisons, John Wiley & Sons, England, pp. 137-153.
Breusch, T. S., and A. R. Pagan, 1980, “The Lagrange Multiplier Test and its Applications to
Model Specification in Econometrics”, Review of Economic Studies Vol. 47, pp. 239-253.
Brick, I. E., Palmon, O. and Wald, J. K. (2006), “CEO compensation, director compensation
and firm performance: Evidence of cronyism?”, Journal of Corporate Finance, Vol. 12 No. 3,
pp. 403-423.
24
Buffett, W. (2004), letter to shareholders of Berkshire Hathaway, Inc., included in the Annual
Report to the Shareholders of Berkshire Hathaway Inc., February 2004, 8;
http://www.berkshirehathaway.com/letters/2003ltr.pdf
Combined Code, 1998, 2003, 2006, The Combined Code on Corporate Governance, Financial
Reporting Council, London.
Conyon, M. J. and Core, J. E. and Guay, W. R. (2006), “How high is US CEO pay? A
comparison with UK CEO pay”, SSRN working paper.
Conyon, M. J. and Murphy, K. J. (2000), “The prince and the pauper? CEO pay in the United
States and United Kingdom”, The Economic Journal Vol. 110 No. 467, pp. F640-F671.
Conyon M. J. and Peck, S. I. (1998), “Board control, remuneration committees and top
management compensation”, Academy Management Journal Vol. 41 No. 2, pp. 146-157.
Conyon, M. J., Peck, S. I. and Sadler, G. V. (2006), Compensation consultants and executive
pay, Wharton School working paper.
Conyon M. J. and Sadler, G. V. (2001), “Executive pay, tournaments and corporate
performance in UK firms”, International Journal of Management Reviews Vol. 3 No.2, pp.
141-168.
Core, J. E., Holthausen, R. W. and Larcker, D. F. (1999), “Corporate governance, chief
executive officer compensation and firm performance”, Journal of Financial Economics Vol.
51 No. 3, pp. 371-406.
Crystal, G. S. (1991), “Why CEO compensation is so high”, California Management Review
Vol. 34, pp. 9-29.
Directors’ Remuneration Report Regulations (2002), Statutory Instrument 2002, No. 1986,
HMSO, London.
Garen, J. E. (1994), “Executive compensation and principal-agent theory”, Journal of Political
Economy Vol. 102 No. 6, pp. 1175-1199.
Gujarati, D. N. (2003), Basic Econometrics, McGraw Hill, New York.
25
Hall, B. J. and Liebman, J. B. (1998), “Are CEOs really paid like bureaucrats?”, Quarterly
Journal of Economics Vol. 113 No. 3, pp. 653-691.
Hausman, J. A., 1978, “Specification Tests in Econometrics”, Econometrica Vol. 46, pp.
1251-1271.
Hermalin, B. E. and Wallace, N. E. (2001), “Firm performance and executive compensation
in the savings and loan industry”, Journal of Financial Economics Vol. 61 No. 1, pp. 139-170.
Jensen, M. C. and Meckling, W. H. (1976), “Theory of the firm: Managerial behaviour,
agency costs and ownership structure”, Journal of Financial Economics Vol. 3 No. 4, pp. 305-
360.
Jensen, M. C. and Murphy, K. J. (1990), “Performance pay and top management incentives”,
Journal of Political Economy Vol. 98 No. 2, pp. 225-64.
Jensen, M. C. and Murphy, K. J. and Wruck, E. G. (2004), “Remuneration: Where we’ve
been, how we got to here, what are the problems and how to fix them”, Harvard NOM
working paper; ECGI - Finance working paper.
Liu, L. S. and Stark, A. W. (2008), “Relative performance evaluation in board cash
compensation: UK empirical evidence”, British Accounting Review, forthcoming.
Newman, H. A. and Mozes, H. A. (1999), “Does the composition of the compensation
committee influence CEO compensation practices?”, Financial Management Vol. 28 No. 3,
pp. 41-53.
Ortiz-Molina, H. (2007), “Executive compensation and capital structure: The effects of
convertible debt and straight debt on CEO pay”, Journal of Accounting and Economics Vol.
43 No. 1, pp. 69-93.
Ozkan, N. (2007), “CEO compensation, performance and corporate governance: An empirical
investigation of UK Panel Data”, 2007 European Financial Management Association (EFMA)
conference paper.
26
Perry, T. and Zenner, M. (2001), “Pay for performance? Government regulation and the
structure of compensation contracts”, Journal of Financial Economics Vol. 62 No. 3, pp. 453-
488.
Stathopoulos, K., Espenlaub, S. and Walker, M. (2004), “UK executive compensation
practices: New economy versus old economy”, Journal of Management Accounting Research
Vol. 16 No. 1, pp. 57-92.
Tosi, H. L., Werner, S., Katz, J. P. and Gomez-Mejia, L. R. (2000), “How much does
performance matter? A meta-analysis of CEO pay studies”, Journal of Management Vol. 26
No. 2, pp. 301-340.
Veld, C. (2003), “Analysis of a practical formula for the valuation of employee stock
options”, Applied Economics Letters Vol. 10, pp. 205-208.
Yermack, D. (1995), “Do corporations award stock options effectively?”, Journal of Financial
Economics Vol. 39 No. 2-3, pp. 237-269.
27
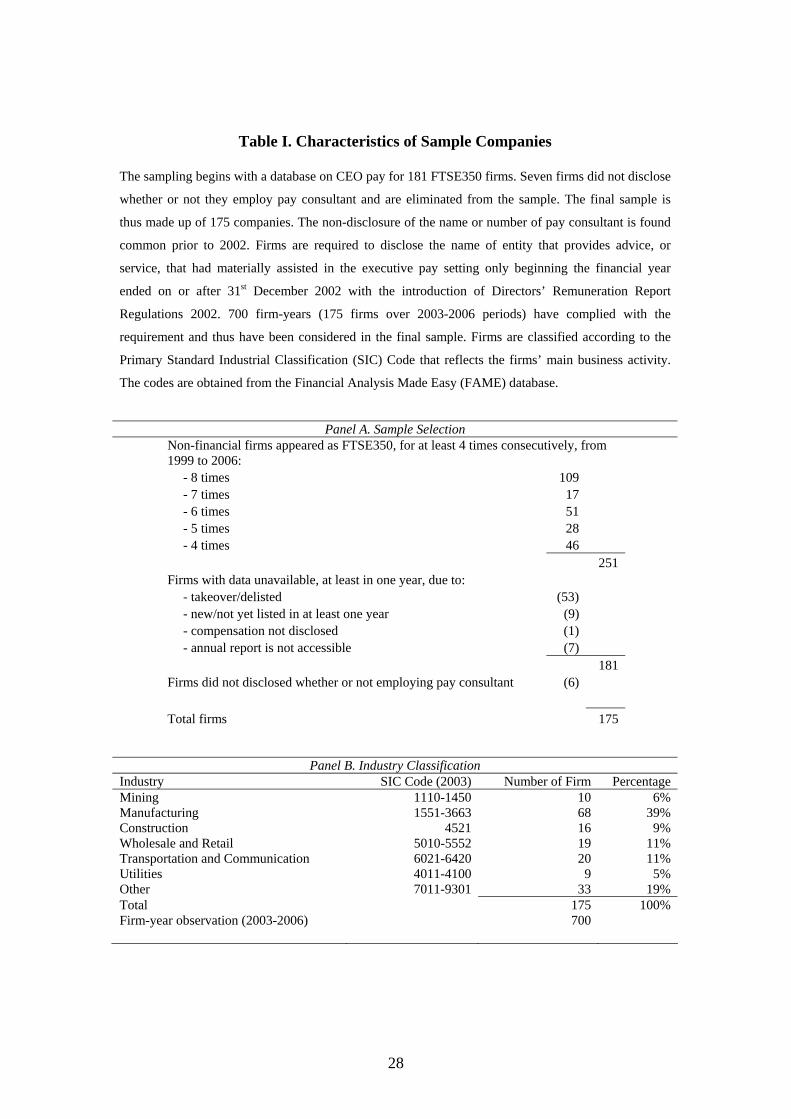
Table I. Characteristics of Sample Companies
The sampling begins with a database on CEO pay for 181 FTSE350 firms. Seven firms did not disclose
whether or not they employ pay consultant and are eliminated from the sample. The final sample is
thus made up of 175 companies. The non-disclosure of the name or number of pay consultant is found
common prior to 2002. Firms are required to disclose the name of entity that provides advice, or
service, that had materially assisted in the executive pay setting only beginning the financial year
ended on or after 31st December 2002 with the introduction of Directors’ Remuneration Report
Regulations 2002. 700 firm-years (175 firms over 2003-2006 periods) have complied with the
requirement and thus have been considered in the final sample. Firms are classified according to the
Primary Standard Industrial Classification (SIC) Code that reflects the firms’ main business activity.
The codes are obtained from the Financial Analysis Made Easy (FAME) database.
Panel A. Sample Selection Non-financial firms appeared as FTSE350, for at least 4 times consecutively, from 1999 to 2006: - 8 times 109 - 7 times 17 - 6 times 51 - 5 times 28 - 4 times 46 251 Firms with data unavailable, at least in one year, due to: - takeover/delisted (53) - new/not yet listed in at least one year (9) - compensation not disclosed (1) - annual report is not accessible (7) 181 Firms did not disclosed whether or not employing pay consultant (6) Total firms 175
Panel B. Industry Classification Industry SIC Code (2003) Number of Firm Percentage Mining 1110-1450 10 6% Manufacturing 1551-3663 68 39% Construction 4521 16 9% Wholesale and Retail 5010-5552 19 11% Transportation and Communication 6021-6420 20 11% Utilities 4011-4100 9 5% Other 7011-9301 33 19% Total 175 100% Firm-year observation (2003-2006) 700
28
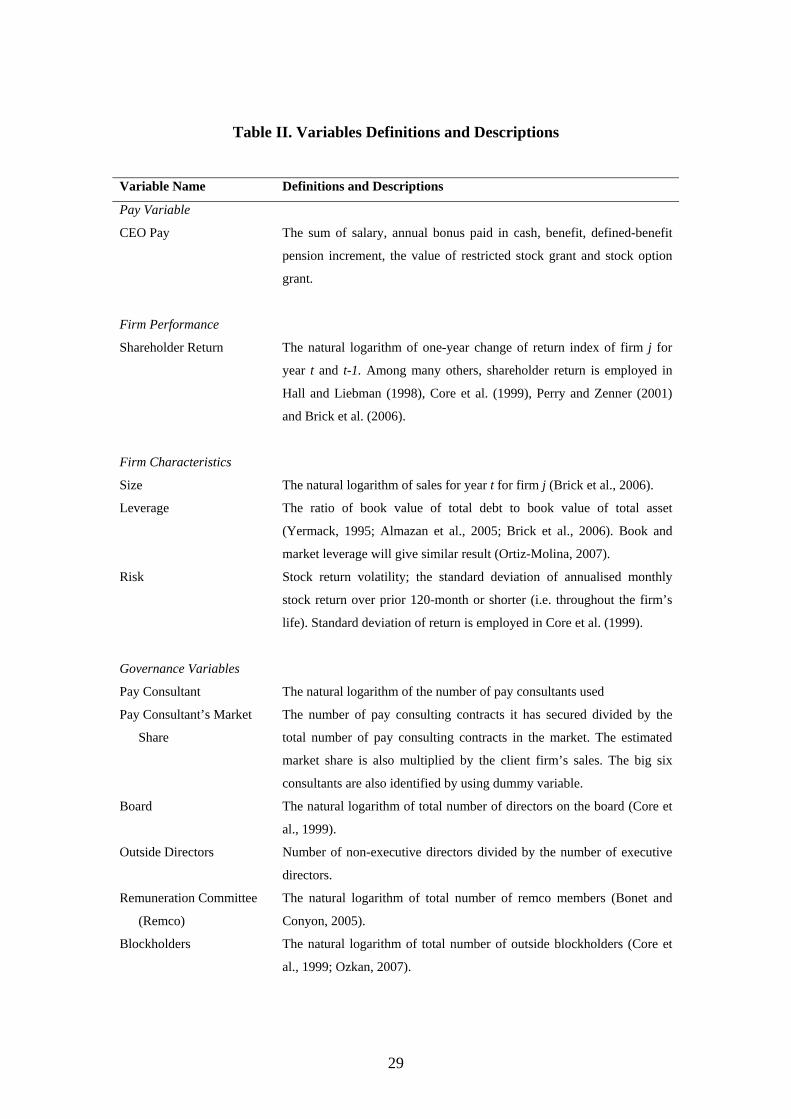
Table II. Variables Definitions and Descriptions
Variable Name Definitions and Descriptions
Pay Variable
CEO Pay The sum of salary, annual bonus paid in cash, benefit, defined-benefit
pension increment, the value of restricted stock grant and stock option
grant.
Firm Performance
Shareholder Return The natural logarithm of one-year change of return index of firm j for
year t and t-1. Among many others, shareholder return is employed in
Hall and Liebman (1998), Core et al. (1999), Perry and Zenner (2001)
and Brick et al. (2006).
Firm Characteristics
Size The natural logarithm of sales for year t for firm j (Brick et al., 2006).
Leverage The ratio of book value of total debt to book value of total asset
(Yermack, 1995; Almazan et al., 2005; Brick et al., 2006). Book and
market leverage will give similar result (Ortiz-Molina, 2007).
Risk Stock return volatility; the standard deviation of annualised monthly
stock return over prior 120-month or shorter (i.e. throughout the firm’s
life). Standard deviation of return is employed in Core et al. (1999).
Governance Variables
Pay Consultant The natural logarithm of the number of pay consultants used
Pay Consultant’s Market
Share
The number of pay consulting contracts it has secured divided by the
total number of pay consulting contracts in the market. The estimated
market share is also multiplied by the client firm’s sales. The big six
consultants are also identified by using dummy variable.
Board The natural logarithm of total number of directors on the board (Core et
al., 1999).
Outside Directors Number of non-executive directors divided by the number of executive
directors.
Remuneration Committee
(Remco)
The natural logarithm of total number of remco members (Bonet and
Conyon, 2005).
Blockholders The natural logarithm of total number of outside blockholders (Core et
al., 1999; Ozkan, 2007).
29
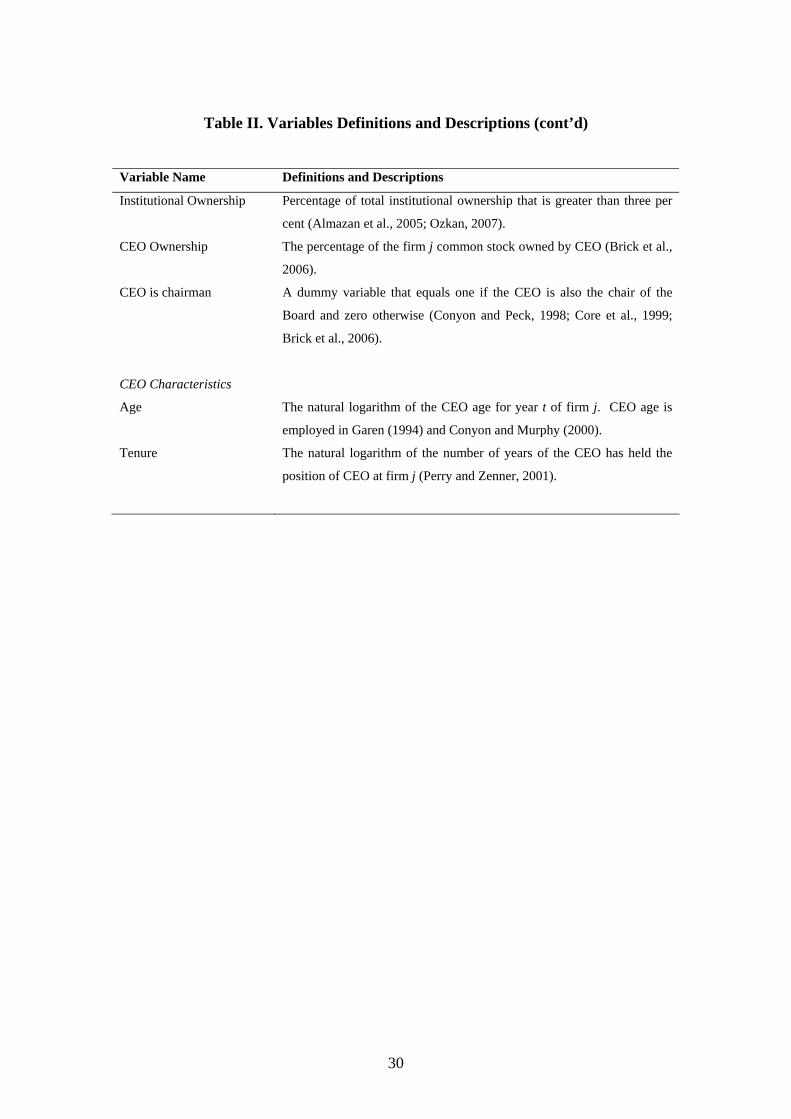
Table II. Variables Definitions and Descriptions (cont’d)
Variable Name Definitions and Descriptions
Institutional Ownership Percentage of total institutional ownership that is greater than three per
cent (Almazan et al., 2005; Ozkan, 2007).
CEO Ownership The percentage of the firm j common stock owned by CEO (Brick et al.,
2006).
CEO is chairman A dummy variable that equals one if the CEO is also the chair of the
Board and zero otherwise (Conyon and Peck, 1998; Core et al., 1999;
Brick et al., 2006).
CEO Characteristics
Age The natural logarithm of the CEO age for year t of firm j. CEO age is
employed in Garen (1994) and Conyon and Murphy (2000).
Tenure The natural logarithm of the number of years of the CEO has held the
position of CEO at firm j (Perry and Zenner, 2001).
30
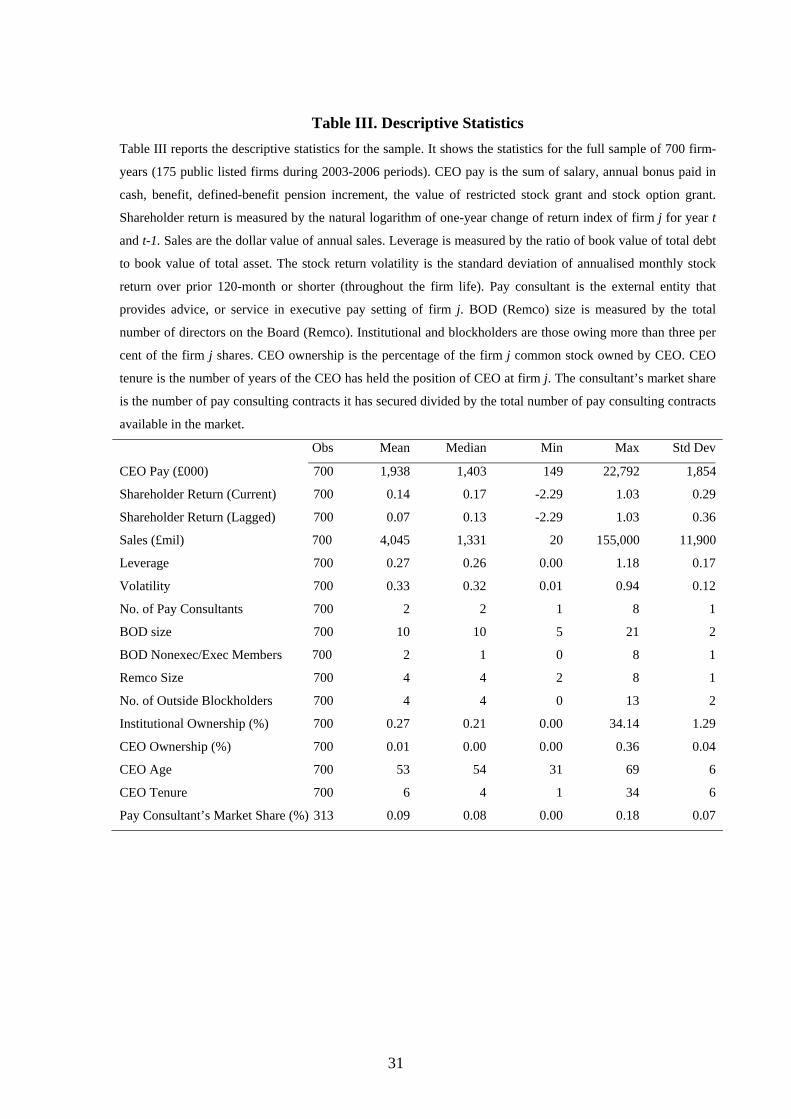
Table III. Descriptive Statistics
Table III reports the descriptive statistics for the sample. It shows the statistics for the full sample of 700 firm-
years (175 public listed firms during 2003-2006 periods). CEO pay is the sum of salary, annual bonus paid in
cash, benefit, defined-benefit pension increment, the value of restricted stock grant and stock option grant.
Shareholder return is measured by the natural logarithm of one-year change of return index of firm j for year t
and t-1. Sales are the dollar value of annual sales. Leverage is measured by the ratio of book value of total debt
to book value of total asset. The stock return volatility is the standard deviation of annualised monthly stock
return over prior 120-month or shorter (throughout the firm life). Pay consultant is the external entity that
provides advice, or service in executive pay setting of firm j. BOD (Remco) size is measured by the total
number of directors on the Board (Remco). Institutional and blockholders are those owing more than three per
cent of the firm j shares. CEO ownership is the percentage of the firm j common stock owned by CEO. CEO
tenure is the number of years of the CEO has held the position of CEO at firm j. The consultant’s market share
is the number of pay consulting contracts it has secured divided by the total number of pay consulting contracts
available in the market.
Obs Mean Median Min Max Std Dev
CEO Pay (£000) 700 1,938 1,403 149 22,792 1,854
Shareholder Return (Current) 700 0.14 0.17 -2.29 1.03 0.29
Shareholder Return (Lagged) 700 0.07 0.13 -2.29 1.03 0.36
Sales (£mil) 700 4,045 1,331 20 155,000 11,900
Leverage 700 0.27 0.26 0.00 1.18 0.17
Volatility 700 0.33 0.32 0.01 0.94 0.12
No. of Pay Consultants 700 2 2 1 8 1
BOD size 700 10 10 5 21 2
BOD Nonexec/Exec Members 700 2 1 0 8 1
Remco Size 700 4 4 2 8 1
No. of Outside Blockholders 700 4 4 0 13 2
Institutional Ownership (%) 700 0.27 0.21 0.00 34.14 1.29
CEO Ownership (%) 700 0.01 0.00 0.00 0.36 0.04
CEO Age 700 53 54 31 69 6
CEO Tenure 700 6 4 1 34 6
Pay Consultant’s Market Share (%) 313 0.09 0.08 0.00 0.18 0.07
31
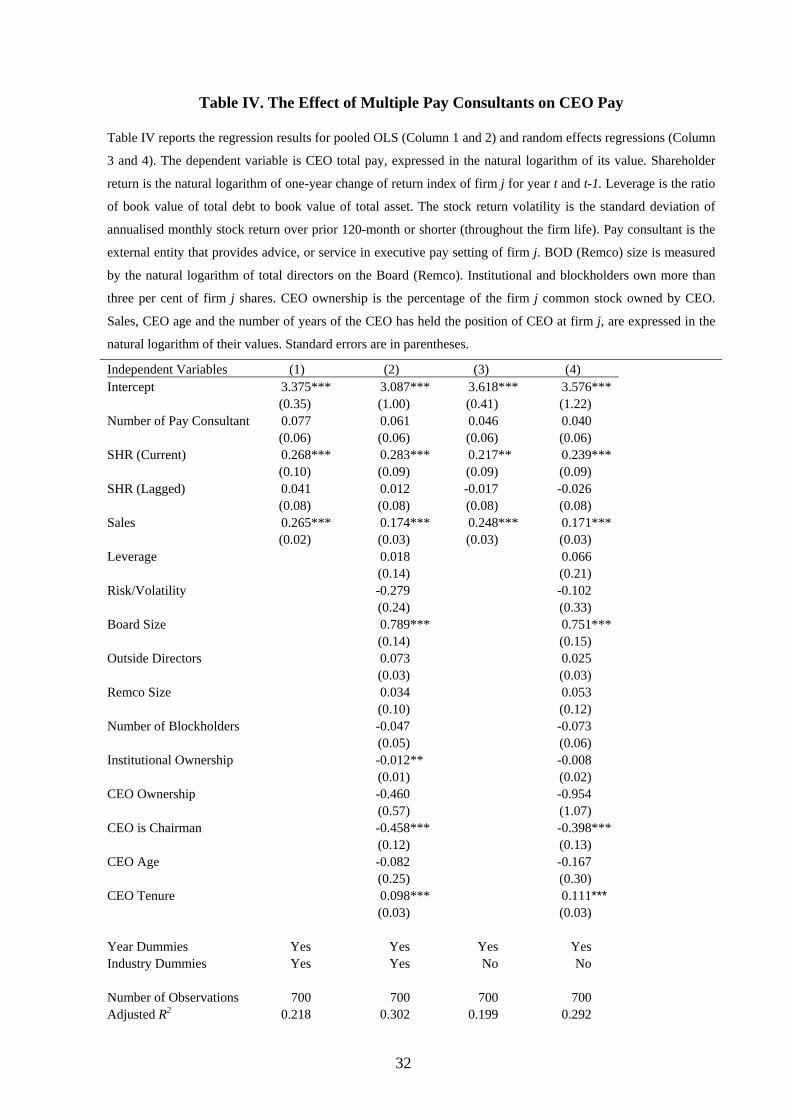
Table IV. The Effect of Multiple Pay Consultants on CEO Pay
Table IV reports the regression results for pooled OLS (Column 1 and 2) and random effects regressions (Column
3 and 4). The dependent variable is CEO total pay, expressed in the natural logarithm of its value. Shareholder
return is the natural logarithm of one-year change of return index of firm j for year t and t-1. Leverage is the ratio
of book value of total debt to book value of total asset. The stock return volatility is the standard deviation of
annualised monthly stock return over prior 120-month or shorter (throughout the firm life). Pay consultant is the
external entity that provides advice, or service in executive pay setting of firm j. BOD (Remco) size is measured
by the natural logarithm of total directors on the Board (Remco). Institutional and blockholders own more than
three per cent of firm j shares. CEO ownership is the percentage of the firm j common stock owned by CEO.
Sales, CEO age and the number of years of the CEO has held the position of CEO at firm j, are expressed in the
natural logarithm of their values. Standard errors are in parentheses.
Independ (1) ) (3) (Intercep 3.375*** .087** 18*** 6***
ent Variables (2 4) t 3 * 3.6 3.57
(0.35) (1.00) (0.41) (1.22) Number 7 0.061 0.046 0.040 (0.06) (0.06) (0.06) (0.06) SHR (Cu 0.268*** .283** 17** 239*** (0.10) (0.09) (0.09) (0.09) SHR (La 0.041 0.012 -0.017 -0.026 (0.08) (0.08) (0.08) (0.08) Sales 0.265*** .174** 48*** 1*** (0.02) (0.03) (0.03) (0.03) Leverage 0.018 0.066 (0.14) (0.21) Risk/Vo -0.279 -0.102 (0.24) (0.33) Board Si 0.789** 0.751*** (0.14) (0.15) Outside 0.073 0.025 (0.03) (0.03) Remco S 0.034 0.053 (0.10) (0.12) Number -0.047 -0.073 (0.05) (0.06) Institutio -0.012** -0.008 (0.01) (0.02) CEO Ow -0.460 -0.954 (0.57) (1.07) CEO is C -0.458** -0.398** (0.12) (0.13) CEO Ag -0.082 -0.167 (0.25) (0.30) CEO Te 0.098** 0.111*** (0.03) (0.03) Year Du Yes Yes Yes Yes Industry Yes Yes No
of Pay Consultant 0.07
rrent) 0 * 0.2 0.
gged)
0 * 0.2 0.17
latility
ze *
Directors
ize
of Blockholders
nal Ownership
nership
hairman * *
e
nure *
mmies Dummies No
Number 0 700 700 700 Adjusted 0.218 0.302 0.199 0.292
of Observations 70 R2
32
F Test o OLS v. F
F statisti 3.690 3.020 (p-value) (0.00) (0.00)
Breusch OLS v. R
LM 1.420 6.490 (p-value) (0.00) (0.00)
Hausma Fixed v.
Hausma 0.840 18.500 (p-value) (1.00) (0.42)
**Signi
n equal intercepts (H0 : uj = 0) ixed Effect
c
and Pagan LM Test (H0 : var(u) = 0) andom Effect
17 10
n Specification Test: Random Effect
n statistic
* ficant at the 0.01 level; **Significant at the 0.05 level; *Significant at the 0.10 level.
33
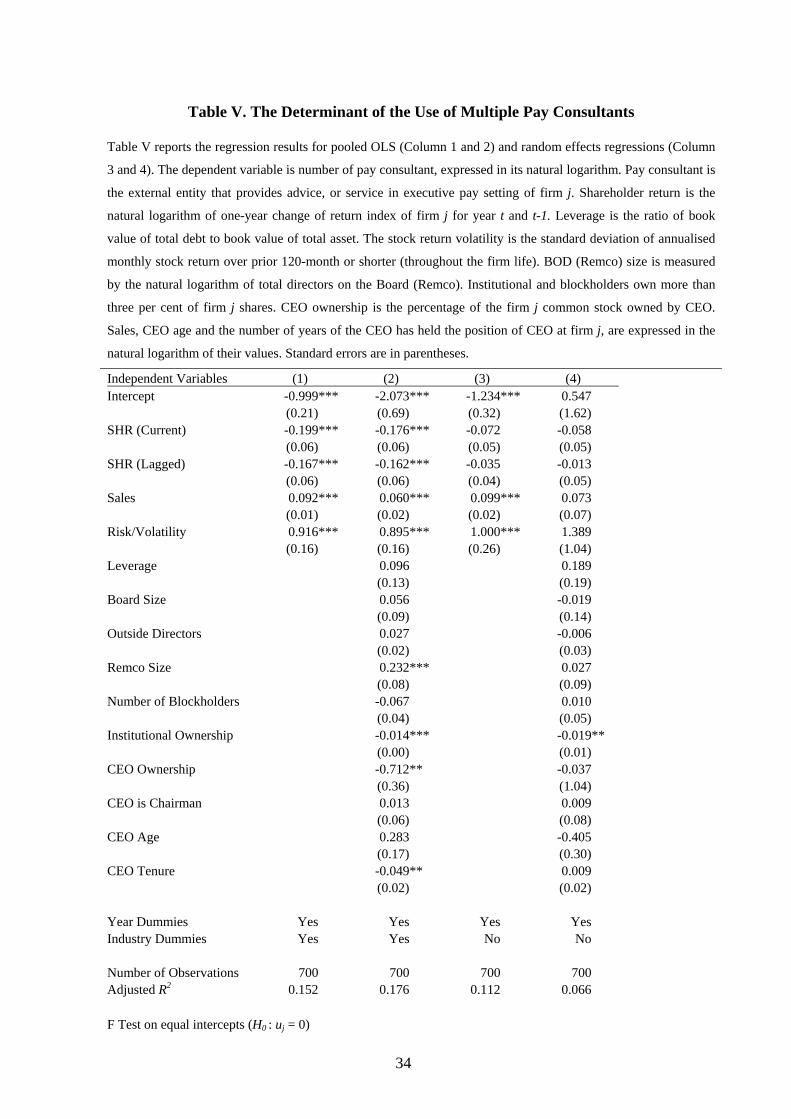
Table V. The Determinant of the Use of Multiple Pay Consultants
Table V reports the regression results for pooled OLS (Column 1 and 2) and random effects regressions (Column
3 and 4). The dependent variable is number of pay consultant, expressed in its natural logarithm. Pay consultant is
the external entity that provides advice, or service in executive pay setting of firm j. Shareholder return is the
natural logarithm of one-year change of return index of firm j for year t and t-1. Leverage is the ratio of book
value of total debt to book value of total asset. The stock return volatility is the standard deviation of annualised
monthly stock return over prior 120-month or shorter (throughout the firm life). BOD (Remco) size is measured
by the natural logarithm of total directors on the Board (Remco). Institutional and blockholders own more than
three per cent of firm j shares. CEO ownership is the percentage of the firm j common stock owned by CEO.
Sales, CEO age and the number of years of the CEO has held the position of CEO at firm j, are expressed in the
natural logarithm of their values. Standard errors are in parentheses.
Independ (1) (2) (3) (4Intercep -0.999 ** 73** 34** 7
ent Variables ) t * -2.0 * -1.2 * 0.54
(0.21) (0.69) (0.32) (1.62) SHR (Cu -0.199 ** 76** 72 -0.058 (0.06) (0.06) (0.05) (0.05) SHR (La -0.167 ** 62** 35 -0.013 (0.06) (0.06) (0.04) (0.05) Sales 0.092 ** 0*** 9** 3 (0.01) (0.02) (0.02) (0.07) Risk/Vo 0.916 ** 95*** 00** 89 (0.16) (0.16) (0.26) (1.04) Leverage 0.096 0.189 (0.13) (0.19) Board Si 0.056 -0.019 (0.09) (0.14) Outside 0.027 -0.006 (0.02) (0.03) Remco S 0.232*** 0.027 (0.08) (0.09) Number -0.067 0.010 (0.04) (0.05) Institutio -0.014*** -0.019** (0.00) (0.01) CEO Ow -0.712** -0.037 (0.36) (1.04) CEO is C 0.013 0.009 (0.06) (0.08) CEO Ag 0.283 -0.405 (0.17) (0.30) CEO Te -0.049** 0.009 (0.02) (0.02) Year Du Yes Yes Yes Yes Industry Yes Yes No No Number 700 700 700 700 Adjusted 0.152 0.176 0.112 0.066 F Test o
rrent) * -0.1 * -0.0
gged) * -0.1 * -0.0
* 0.06 0.09 * 0.07
latility * 0.8 1.0 * 1.3
ze
Directors
ize
of Blockholders
nal Ownership
nership
hairman
e
nure
mmies Dummies
of Observations R2
n equal intercepts (H0 : uj = 0)
34
OLS v. F F statisti 6.900 6.480 (p-value) (0.00) (0.00)
Breusch OLS v. R
LM 69.790 30.890 (p-value) (0.00) (0.00)
Hausma Fixed v.
Hausma 4.310 99.640 (p-value) (0.74) (0.00)
**Signi
ixed Effect c
and Pagan LM Test (H0 : var(u) = 0) andom Effect
3 3
n Specification Test: Random Effect
n statistic 2
* ficant at the 0.01 level; **Significant at the 0.05 level; *Significant at the 0.10 level.
35
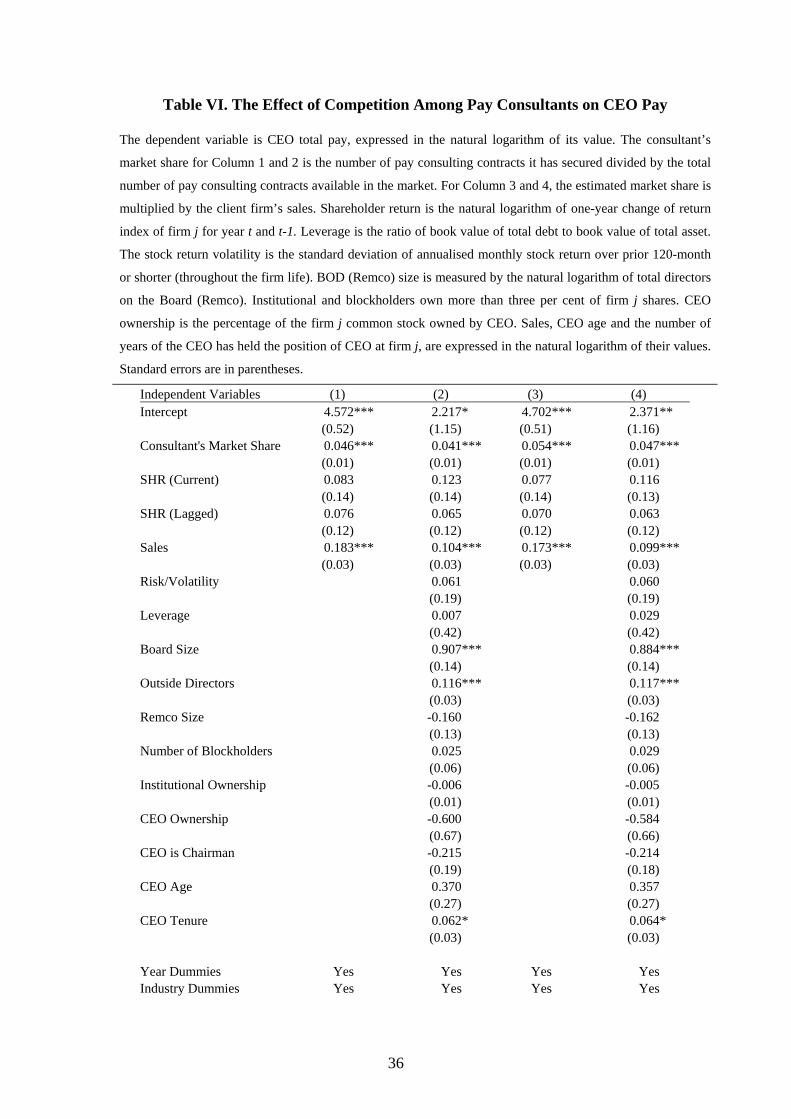
Table VI. The Effect of Competition Among Pay Consultants on CEO Pay
The dependent variable is CEO total pay, expressed in the natural logarithm of its value. The consultant’s
market share for Column 1 and 2 is the number of pay consulting contracts it has secured divided by the total
number of pay consulting contracts available in the market. For Column 3 and 4, the estimated market share is
multiplied by the client firm’s sales. Shareholder return is the natural logarithm of one-year change of return
index of firm j for year t and t-1. Leverage is the ratio of book value of total debt to book value of total asset.
The stock return volatility is the standard deviation of annualised monthly stock return over prior 120-month
or shorter (throughout the firm life). BOD (Remco) size is measured by the natural logarithm of total directors
on the Board (Remco). Institutional and blockholders own more than three per cent of firm j shares. CEO
ownership is the percentage of the firm j common stock owned by CEO. Sales, CEO age and the number of
years of the CEO has held the position of CEO at firm j, are expressed in the natural logarithm of their values.
Standard errors are in parentheses.
Independent Variables (1) (2) (3) (4) Intercept 4.572*** 2.217* 4.702*** 2.371** (0.52) (1.15) (0.51) (1.16) Consultant's Market Share 0.046*** 0.041*** 0.054*** 0.047*** (0.01) (0.01) (0.01) (0.01) SHR (Current) 0.083 0.123 0.077 0.116 (0.14) (0.14) (0.14) (0.13) SHR (Lagged) 0.076 0.065 0.070 0.063 (0.12) (0.12) (0.12) (0.12) Sales 0.183*** 0.104*** 0.173*** 0.099*** (0.03) (0.03) (0.03) (0.03) Risk/Volatility 0.061 0.060 (0.19) (0.19) Leverage 0.007 0.029 (0.42) (0.42) Board Size 0.907*** 0.884*** (0.14) (0.14) Outside Directors 0.116*** 0.117*** (0.03) (0.03) Remco Size -0.160 -0.162 (0.13) (0.13) Number of Blockholders 0.025 0.029 (0.06) (0.06) Institutional Ownership -0.006 -0.005 (0.01) (0.01) CEO Ownership -0.600 -0.584 (0.67) (0.66) CEO is Chairman -0.215 -0.214 (0.19) (0.18) CEO Age 0.370 0.357 (0.27) (0.27) CEO Tenure 0.062* 0.064* (0.03) (0.03) Year Dummies Yes Yes Yes Yes Industry Dummies Yes Yes Yes Yes
36
Number of Observations 311 311 311 311 Adjusted R2 0.212 0.333 0.226 0.343 Breusch-Pagan/Cook-Weisberg Test for Heteroskedasticity (H0 : constant variance)
chi2 0.440 0.470 (p-value) (0.51) (0.49)
Ramsey Regression-Specification Error Test (H0 : model has no omitted variable bias)
F statistic 1.910 1.680 (p-value) (0.13) (0.17)
Variance Inflation Factors (VIF) 2.03 2.03 ***Significant at the 0.01 level; **Significant at the 0.05 level; *Significant at the 0.10 level.
37
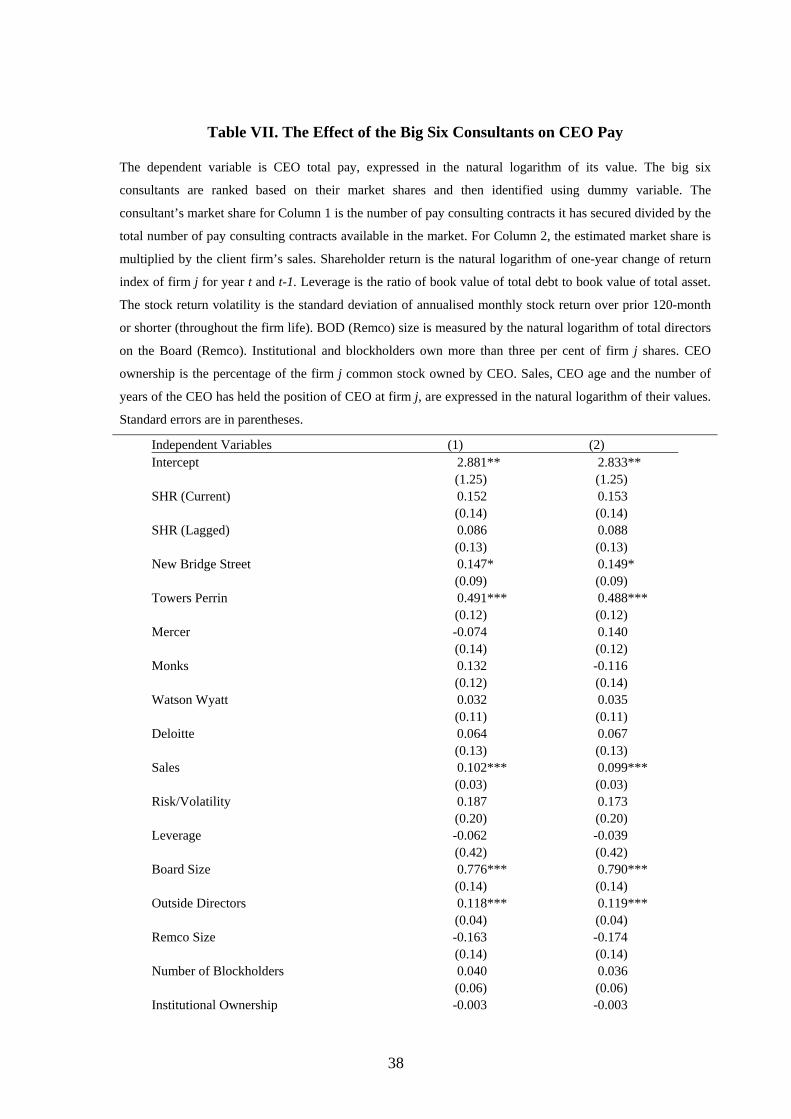
Table VII. The Effect of the Big Six Consultants on CEO Pay
The dependent variable is CEO total pay, expressed in the natural logarithm of its value. The big six
consultants are ranked based on their market shares and then identified using dummy variable. The
consultant’s market share for Column 1 is the number of pay consulting contracts it has secured divided by the
total number of pay consulting contracts available in the market. For Column 2, the estimated market share is
multiplied by the client firm’s sales. Shareholder return is the natural logarithm of one-year change of return
index of firm j for year t and t-1. Leverage is the ratio of book value of total debt to book value of total asset.
The stock return volatility is the standard deviation of annualised monthly stock return over prior 120-month
or shorter (throughout the firm life). BOD (Remco) size is measured by the natural logarithm of total directors
on the Board (Remco). Institutional and blockholders own more than three per cent of firm j shares. CEO
ownership is the percentage of the firm j common stock owned by CEO. Sales, CEO age and the number of
years of the CEO has held the position of CEO at firm j, are expressed in the natural logarithm of their values.
Standard errors are in parentheses.
Independent Variables (1) (2) Intercept 2.881** 2.833** (1.25) (1.25) SHR (Current) 0.152 0.153 (0.14) (0.14) SHR (Lagged) 0.086 0.088 (0.13) (0.13) New Bridge Street 0.147* 0.149* (0.09) (0.09) Towers Perrin 0.491*** 0.488*** (0.12) (0.12) Mercer -0.074 0.140 (0.14) (0.12) Monks 0.132 -0.116 (0.12) (0.14) Watson Wyatt 0.032 0.035 (0.11) (0.11) Deloitte 0.064 0.067 (0.13) (0.13) Sales 0.102*** 0.099*** (0.03) (0.03) Risk/Volatility 0.187 0.173 (0.20) (0.20) Leverage -0.062 -0.039 (0.42) (0.42) Board Size 0.776*** 0.790*** (0.14) (0.14) Outside Directors 0.118*** 0.119*** (0.04) (0.04) Remco Size -0.163 -0.174 (0.14) (0.14) Number of Blockholders 0.040 0.036 (0.06) (0.06) Institutional Ownership -0.003 -0.003
38

(0.01) (0.01) CEO Ownership -0.282 -(0.34) (0.68) (0.67) CEO is Chairman -0.276 -(0.27) (0.18) (0.18) CEO Age 0.167 (0.19) (0.30) (0.30) CEO Tenure 0.084** (0.08)** (0.04) (0.04) Year Dummies Yes Yes Industry Dummies Yes Yes Number of Observations 311 311 Adjusted R2 0.363 0.365 Breusch-Pagan/Cook-Weisberg Test for Heteroskedasticity (H0 : constant variance)
chi2 0.450 0.580 (p-value) (0.50) (0.45)
Ramsey Regression-Specification Error Test (H0 : model has no omitted variable bias)
F statistic 0.790 0.780 (p-value) (0.50) (0.51)
Variance Inflation Factors (VIF) 2.01 2.01 ***Significant at the 0.01 level; **Significant at the 0.05 level; *Significant at the 0.10 level.
39
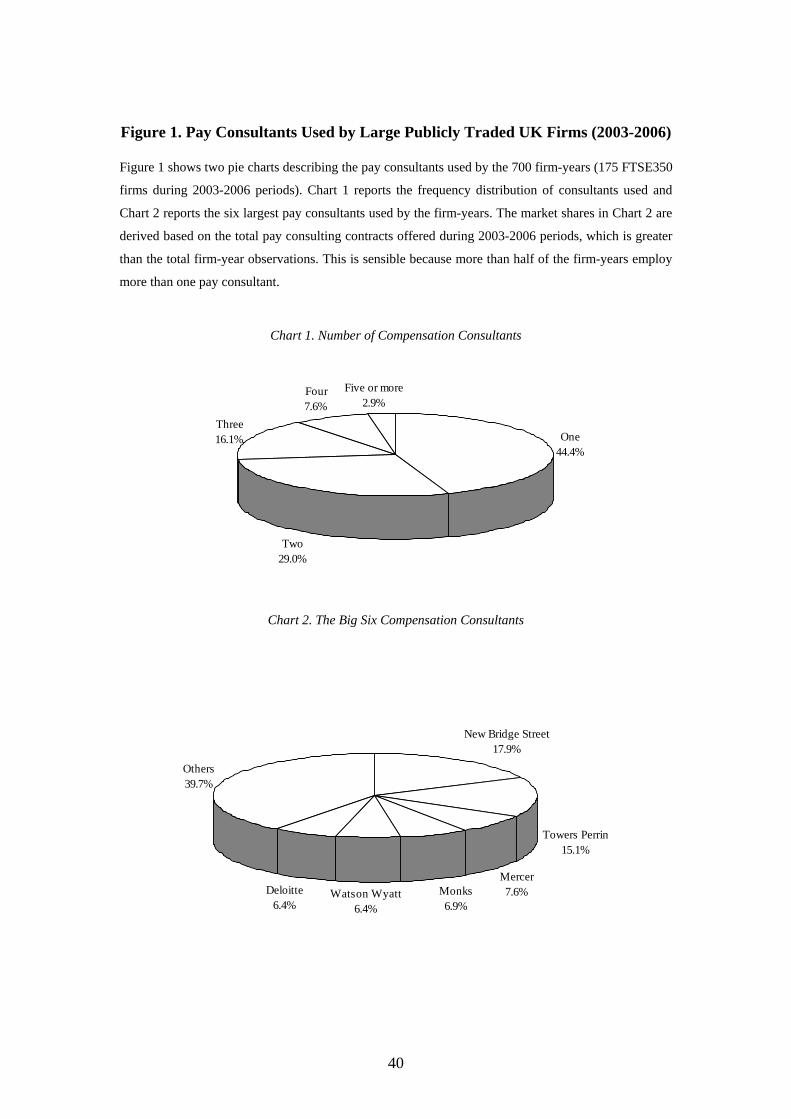
Figure 1. Pay Consultants Used by Large Publicly Traded UK Firms (2003-2006)
Figure 1 shows two pie charts describing the pay consultants used by the 700 firm-years (175 FTSE350
firms during 2003-2006 periods). Chart 1 reports the frequency distribution of consultants used and
Chart 2 reports the six largest pay consultants used by the firm-years. The market shares in Chart 2 are
derived based on the total pay consulting contracts offered during 2003-2006 periods, which is greater
than the total firm-year observations. This is sensible because more than half of the firm-years employ
more than one pay consultant.
Chart 1. Number of Compensation Consultants
One44.4%
Two29.0%
Three16.1%
Four7.6%
Five or more2.9%
Chart 2. The Big Six Compensation Consultants
Mercer7.6%Monks
6.9%Watson Wyatt
6.4%Deloitte
6.4%
Others39.7%
Towers Perrin15.1%
New Bridge Street17.9%
40
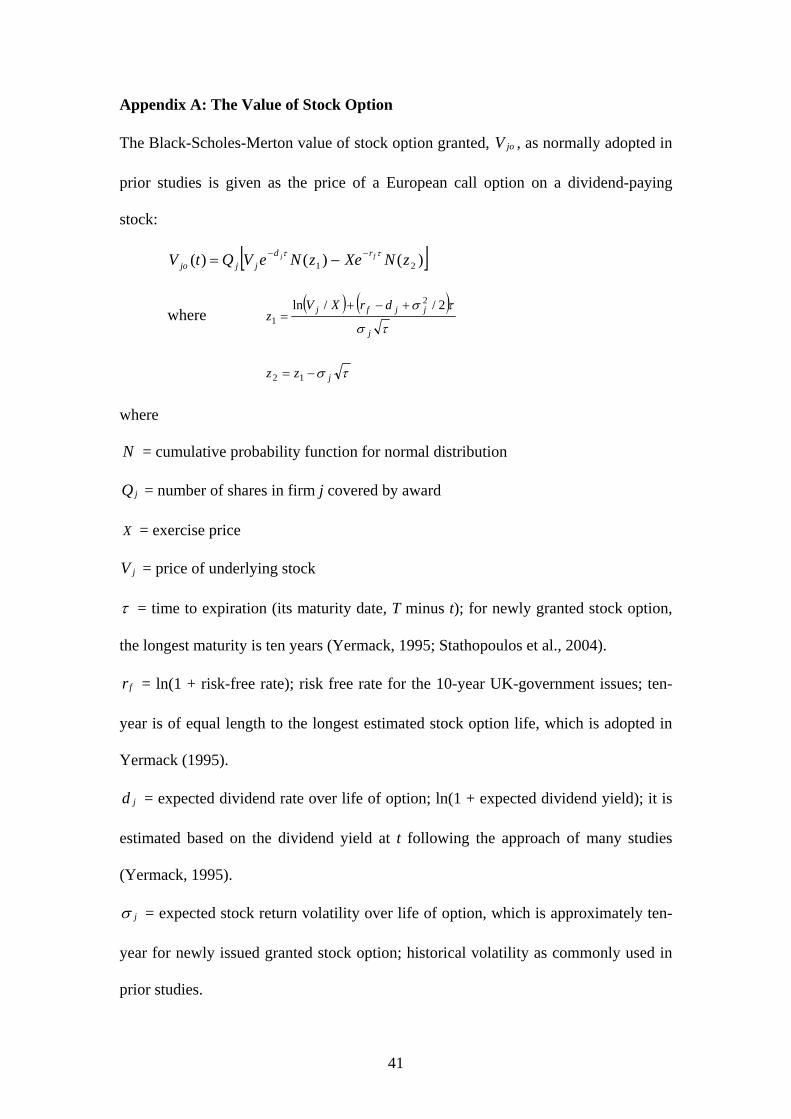
Appendix A: The Value of Stock Option
The Black-Scholes-Merton value of stock option granted, , as normally adopted in
prior studies is given as the price of a European call option on a dividend-paying
stock:
joV
[ ])()()( 21 zNXezNeVQtV fj rdjjjo
ττ −− −=
where ( ) ( )
τσ
τσ
j
jjfj drXVz
2//ln 2
1+−+
=
τσ jzz −= 12
where
N = cumulative probability function for normal distribution
jQ = number of shares in firm j covered by award
X = exercise price
jV = price of underlying stock
τ = time to expiration (its maturity date, T minus t); for newly granted stock option,
the longest maturity is ten years (Yermack, 1995; Stathopoulos et al., 2004).
fr = ln(1 + risk-free rate); risk free rate for the 10-year UK-government issues; ten-
year is of equal length to the longest estimated stock option life, which is adopted in
Yermack (1995).
jd = expected dividend rate over life of option; ln(1 + expected dividend yield); it is
estimated based on the dividend yield at t following the approach of many studies
(Yermack, 1995).
jσ = expected stock return volatility over life of option, which is approximately ten-
year for newly issued granted stock option; historical volatility as commonly used in
prior studies.
41