Embed Size (px)
Citation preview
UNIVERSITY OF OKLAHOMA
HONORS THESIS
Fall 2016
ACCT 3980-001
Dr. Wayne Thomas
The Role of Executive Compensation in Corporate Fraud
By Jenna Ling
3
Table of Contents
1. Introduction……………………………………………………………………………… 1
2. Background Research and Hypothesis……………………………………………………3
1. The Role of the CEO and CFO……………………………………………………………3
2. Fraud and Why It Occurs………………………………………………………………….5
3. Hypothesis………………………………………………………………………………...6
3. Procedure and Data………………………………………………………………………..6
1. Companies and Compensation Data………………………………………………………7
2. Allocating Compensation Data…………………………………………………………...10
4. Results and Findings……………………………………………………………………...11
5. Conclusion………………………………………………………………………………..14
1
1. Introduction
Accounting fraud as defined by US Legal, an online legal dictionary, is fraud “that is
committed by a company by maintaining false information about the sales and income in the
company books, with an intention to inflate the worth of a company’s assets or profits”
(“Accounting Fraud Law & Legal Definition,” n.d.). Within the 2014 fiscal year alone, the SEC
filed 755 actions against violators and obtained orders worth $4.16 billion in penalties (“SEC
announces enforcement results for FY 2015,” 2015). To ensure that companies maintain integrity
in the markets and that investors are protected, the SEC holds each company to very high
standards when reporting financial information. With so many individual entities available to
monitor and prevent fraud activity, the issue continues to persist in businesses across all
industries. While today technology makes it more difficult to track fraud, it is up to executives to
uphold the highest standards of integrity for their employees and company.
The practice of ethical behavior is an important indicator that determines the long-term
success of company performance. To ensure that this type of behavior can be maintained, the
board of directors is established to monitor the actions of senior management and executives
(Richards, Melancon, et al, 2008, p. 6). My study was conducted to understand the relationship
between executive compensation and corporate fraud. This is done by comparing the Chief
Executive Officer (CEO) and the Chief Financial Officer (CFO) compensation of both fraud
companies and their competitors (non-fraud companies) for the year that the fraud was
committed. The CEO and the CFO are the highest executives in a company below the chairman.
For reporting purposes, most companies report compensation information for both the CEO and
2
CFO in the annual proxy statements. The proxy statement information is examined to see if there
is a common trend between how compensation correlates with fraud.
The financial information gathered for each company takes into consideration the size and
the industry of the fraud company and its competitor non-fraud company for that year. After an
analysis of the information, results show that there is a trend with CEO compensation and fraud;
CEOs that committed fraud were also the ones receiving higher pay. However, I found little
difference in pay for CFOs of fraud companies and non-fraud companies. Thus, I conclude that
CFO compensation is not related to fraud.
The conclusions were made after breaking down compensation into cash salary, other
compensation, and total salary. After pulling all available data from company proxy statements,
the compensation information divided up into total dollars, average total dollars, and median
total dollars. This breakdown reduces the skewness of the total dollars when comparing
companies. To further expand on the compensation breakdown, the data were isolated to look at
cash salary per employee, other compensation per employee, and total salary per employee. The
total salary per employee, average total salary per employee, and median total salary per
employee were also applied when looking at the data. The salary breakdown per employee
allows the results to be seen from a different perspective. It is possible that executives are
compensated with more money if there are more employees that work under them.
Taking compensation with respect to employee size into consideration, results also show
that the compensation gap between fraud company CFOs and non-fraud company CFOs were
too small to say that CFOs were likely the ones that committed the fraud. The CEO
compensation showed different results with pay gaps between fraud CEOs and non-fraud CEOs
to be significantly larger. The margin of compensation differences is big enough to suggest that
3
CEO compensation may play a role in the likelihood of a company committing accounting fraud.
One possible explanation for CEOs committing fraud is because of performance based
compensation. Because CEOs get paid based on the performance of the company, it is likely that
CEOs are more inclined to inflate their numbers to make their company look better in order to be
compensated more.
The research done is motivated by the desire to understand what drives individuals to commit
fraud in a company. There are many factors to consider when trying to understand why fraud
was committed, but specifically, the scope of the research is limited to analyzing how pay gaps
between competing executives can show a trend of fraudulent behavior. Typically, incentives
strongly influence the behavior of executives, increasing the likelihood of engaging in fraudulent
activities (Haß et al., 2015). It is important to note that there are other factors not tested in this
research that could play a significant role in fraudulent behavior. This study is limited
exclusively to compensation in the years that fraudulent activity occurred.
The next section of the paper will discuss the role of Chief Executive Officer and the Chief
Financial Officer, and the various components that make up executive compensation. Section 3
provides information on the companies used in the research as well as how the research was
conducted. Section 4 highlights the results of the findings in detail, and Section 5 includes a
conclusion on the result findings and beliefs associated with those findings.
2. Background Research and Hypothesis
2.1 THE ROLE OF THE CEO AND CFO
The role of the Chief Executive Officer as laid out by Sterling-Resources is to maintain
responsibility in developing and executing the company’s long-term goals while creating
4
shareholder value (“Roles and Responsibilities Chief Executive Officer,” n.d.). This often
includes the responsibility of making important decisions and communicating between
management and the Board of Directors. In addition to communicating with key figures within
the company, the CEOs have a responsibility of communicating with shareholders and other
stakeholders. One form of communication that is often used to explain the health of a company is
an annual statement filed with the SEC. These annual statements contain fine details on the
breakdown of assets, liabilities, and shareholder equity used by investors to make investment
decisions. As mentioned by Sterling-Resources, one of the most important responsibilities of a
CEO is to “ensure that the Company maintains high standards,” in which everyone should
ideally act with integrity (“Roles and Responsibilities Chief Executive Officer,” n.d.). This
includes the practice of reporting accurate financial data and following the rules of appropriate
accounting.
The role of the Chief Financial Officer has historically revolved around creating and
analyzing a company’s financial statements. Today, the CFO is responsible for tasks that fall into
four roles: steward, operator, strategist, and catalyst (“Four faces of the CFO,” 2015). The
steward role requires the CFO to maintain the books correctly, uphold compliance with financial
regulation, and communicate important details to the Board of Directors and investors. As the
operator role, it is expected of the CFO to maintain organization of efficient financial operations.
In the strategist role, the CFO has a responsibility in helping executives create a plan to lead the
company down a successful path. Their financial knowledge is vital in the process of deciding
what is best for the future of a company. Lastly, as a catalyst role, the CFO has the power to
make important executive decisions that change the finance function of the company (“Four
faces of the CFO,” 2015).
5
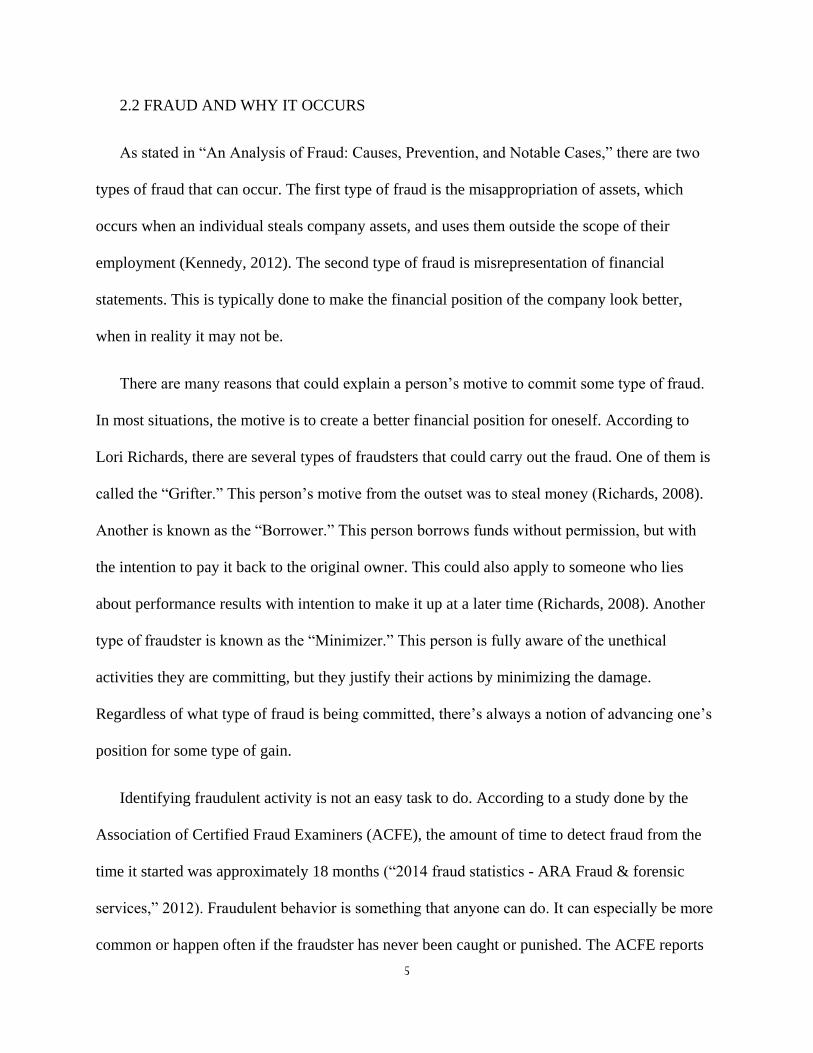
2.2 FRAUD AND WHY IT OCCURS
As stated in “An Analysis of Fraud: Causes, Prevention, and Notable Cases,” there are two
types of fraud that can occur. The first type of fraud is the misappropriation of assets, which
occurs when an individual steals company assets, and uses them outside the scope of their
employment (Kennedy, 2012). The second type of fraud is misrepresentation of financial
statements. This is typically done to make the financial position of the company look better,
when in reality it may not be.
There are many reasons that could explain a person’s motive to commit some type of fraud.
In most situations, the motive is to create a better financial position for oneself. According to
Lori Richards, there are several types of fraudsters that could carry out the fraud. One of them is
called the “Grifter.” This person’s motive from the outset was to steal money (Richards, 2008).
Another is known as the “Borrower.” This person borrows funds without permission, but with
the intention to pay it back to the original owner. This could also apply to someone who lies
about performance results with intention to make it up at a later time (Richards, 2008). Another
type of fraudster is known as the “Minimizer.” This person is fully aware of the unethical
activities they are committing, but they justify their actions by minimizing the damage.
Regardless of what type of fraud is being committed, there’s always a notion of advancing one’s
position for some type of gain.
Identifying fraudulent activity is not an easy task to do. According to a study done by the
Association of Certified Fraud Examiners (ACFE), the amount of time to detect fraud from the
time it started was approximately 18 months (“2014 fraud statistics - ARA Fraud & forensic
services,” 2012). Fraudulent behavior is something that anyone can do. It can especially be more
common or happen often if the fraudster has never been caught or punished. The ACFE reports
6
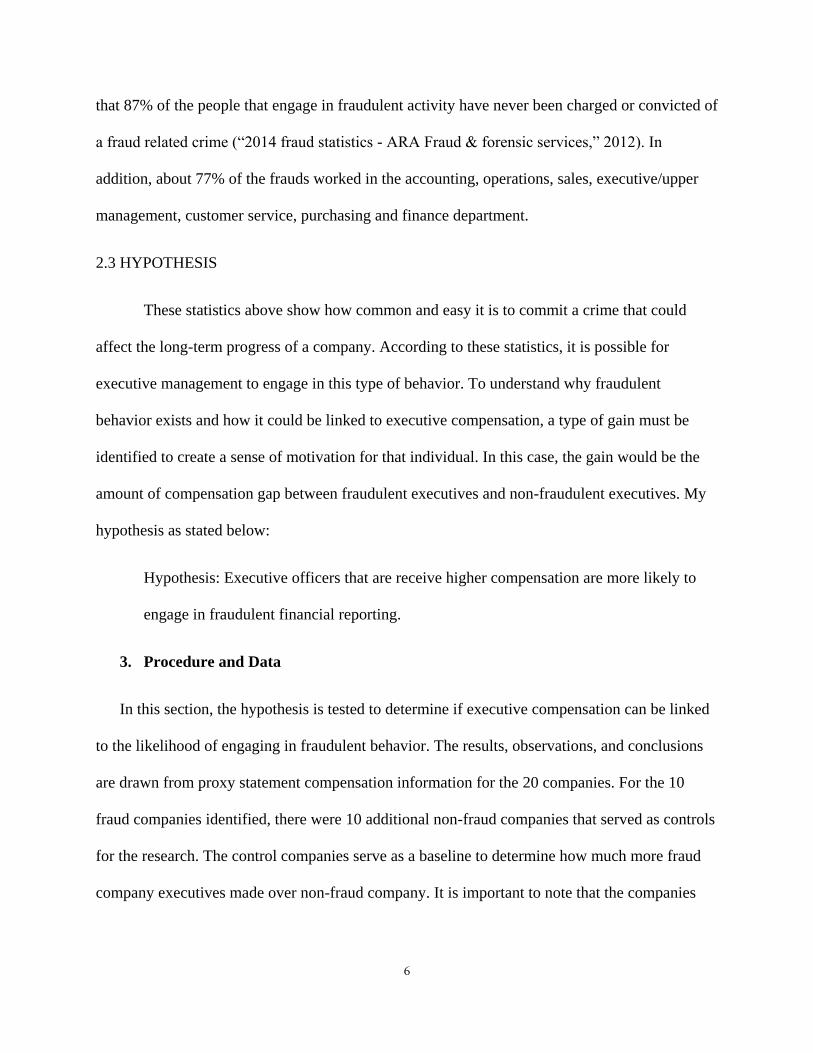
that 87% of the people that engage in fraudulent activity have never been charged or convicted of
a fraud related crime (“2014 fraud statistics - ARA Fraud & forensic services,” 2012). In
addition, about 77% of the frauds worked in the accounting, operations, sales, executive/upper
management, customer service, purchasing and finance department.
2.3 HYPOTHESIS
These statistics above show how common and easy it is to commit a crime that could
affect the long-term progress of a company. According to these statistics, it is possible for
executive management to engage in this type of behavior. To understand why fraudulent
behavior exists and how it could be linked to executive compensation, a type of gain must be
identified to create a sense of motivation for that individual. In this case, the gain would be the
amount of compensation gap between fraudulent executives and non-fraudulent executives. My
hypothesis as stated below:
Hypothesis: Executive officers that are receive higher compensation are more likely to
engage in fraudulent financial reporting.
3. Procedure and Data
In this section, the hypothesis is tested to determine if executive compensation can be linked
to the likelihood of engaging in fraudulent behavior. The results, observations, and conclusions
are drawn from proxy statement compensation information for the 20 companies. For the 10
fraud companies identified, there were 10 additional non-fraud companies that served as controls
for the research. The control companies serve as a baseline to determine how much more fraud
company executives made over non-fraud company. It is important to note that the companies
7
that did not commit fraud are only regarded as non-fraud companies for that year. Section 4
examines the results in detail.
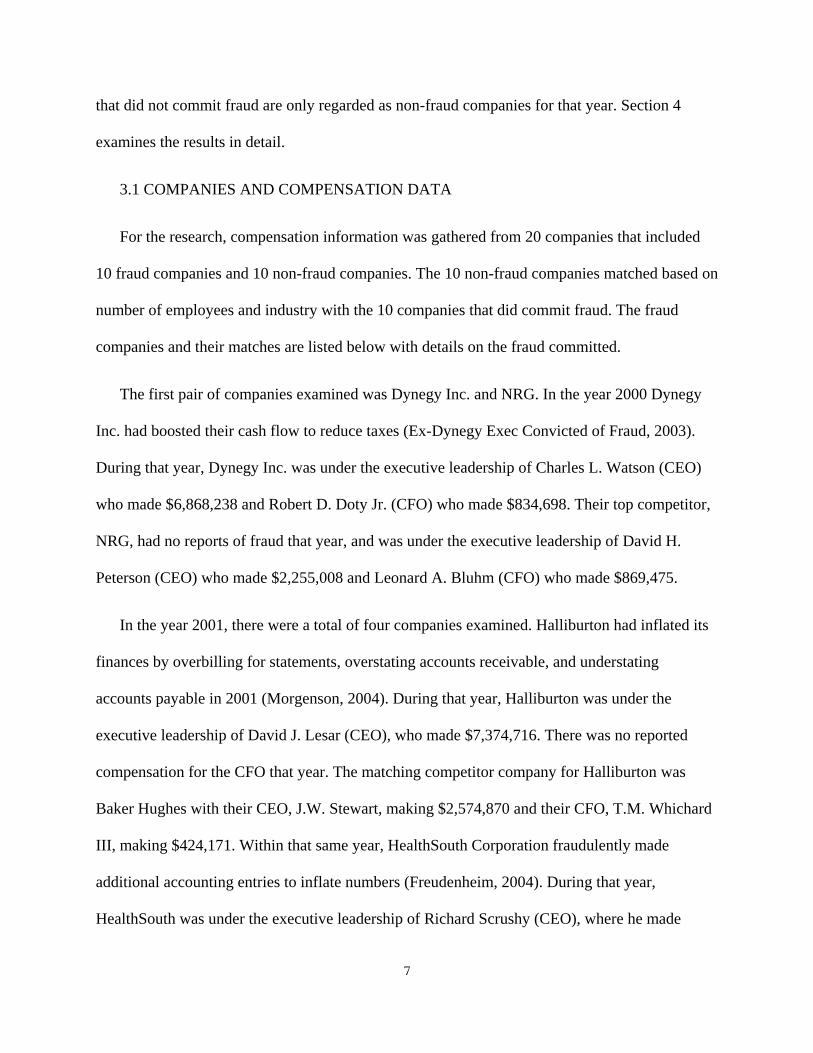
3.1 COMPANIES AND COMPENSATION DATA
For the research, compensation information was gathered from 20 companies that included
10 fraud companies and 10 non-fraud companies. The 10 non-fraud companies matched based on
number of employees and industry with the 10 companies that did commit fraud. The fraud
companies and their matches are listed below with details on the fraud committed.
The first pair of companies examined was Dynegy Inc. and NRG. In the year 2000 Dynegy
Inc. had boosted their cash flow to reduce taxes (Ex-Dynegy Exec Convicted of Fraud, 2003).
During that year, Dynegy Inc. was under the executive leadership of Charles L. Watson (CEO)
who made $6,868,238 and Robert D. Doty Jr. (CFO) who made $834,698. Their top competitor,
NRG, had no reports of fraud that year, and was under the executive leadership of David H.
Peterson (CEO) who made $2,255,008 and Leonard A. Bluhm (CFO) who made $869,475.
In the year 2001, there were a total of four companies examined. Halliburton had inflated its
finances by overbilling for statements, overstating accounts receivable, and understating
accounts payable in 2001 (Morgenson, 2004). During that year, Halliburton was under the
executive leadership of David J. Lesar (CEO), who made $7,374,716. There was no reported
compensation for the CFO that year. The matching competitor company for Halliburton was
Baker Hughes with their CEO, J.W. Stewart, making $2,574,870 and their CFO, T.M. Whichard
III, making $424,171. Within that same year, HealthSouth Corporation fraudulently made
additional accounting entries to inflate numbers (Freudenheim, 2004). During that year,
HealthSouth was under the executive leadership of Richard Scrushy (CEO), where he made
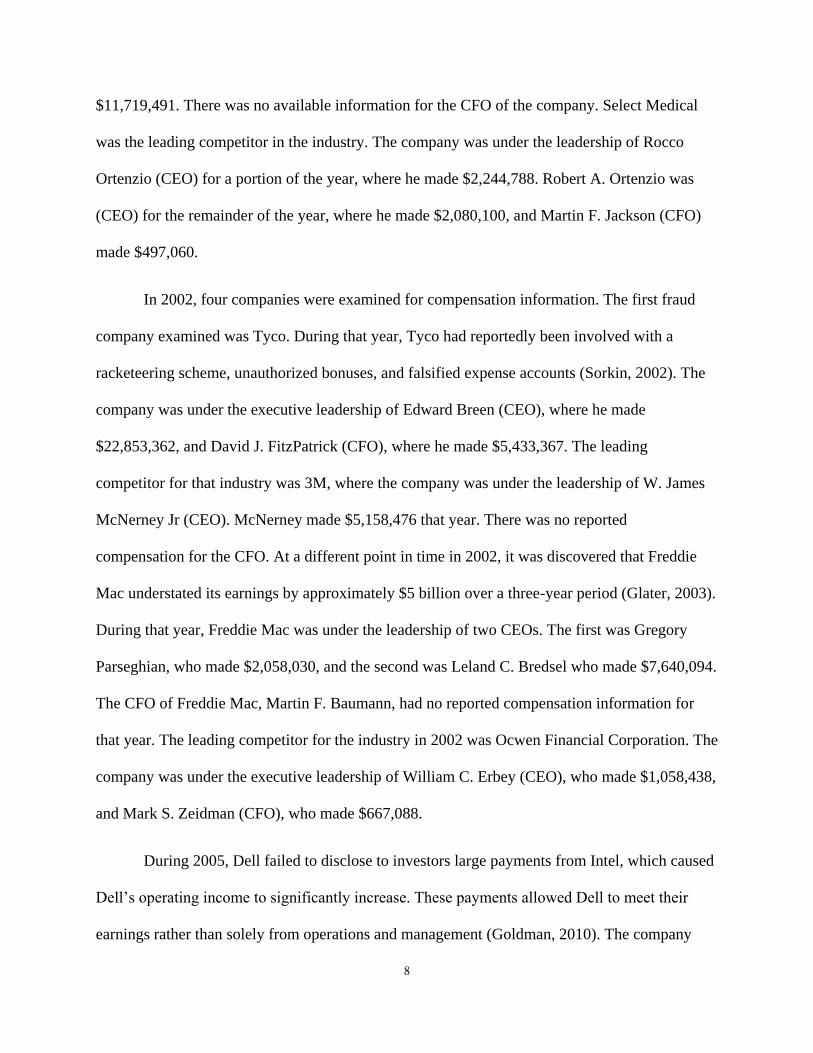
8
$11,719,491. There was no available information for the CFO of the company. Select Medical
was the leading competitor in the industry. The company was under the leadership of Rocco
Ortenzio (CEO) for a portion of the year, where he made $2,244,788. Robert A. Ortenzio was
(CEO) for the remainder of the year, where he made $2,080,100, and Martin F. Jackson (CFO)
made $497,060.
In 2002, four companies were examined for compensation information. The first fraud
company examined was Tyco. During that year, Tyco had reportedly been involved with a
racketeering scheme, unauthorized bonuses, and falsified expense accounts (Sorkin, 2002). The
company was under the executive leadership of Edward Breen (CEO), where he made
$22,853,362, and David J. FitzPatrick (CFO), where he made $5,433,367. The leading
competitor for that industry was 3M, where the company was under the leadership of W. James
McNerney Jr (CEO). McNerney made $5,158,476 that year. There was no reported
compensation for the CFO. At a different point in time in 2002, it was discovered that Freddie
Mac understated its earnings by approximately $5 billion over a three-year period (Glater, 2003).
During that year, Freddie Mac was under the leadership of two CEOs. The first was Gregory
Parseghian, who made $2,058,030, and the second was Leland C. Bredsel who made $7,640,094.
The CFO of Freddie Mac, Martin F. Baumann, had no reported compensation information for
that year. The leading competitor for the industry in 2002 was Ocwen Financial Corporation. The
company was under the executive leadership of William C. Erbey (CEO), who made $1,058,438,
and Mark S. Zeidman (CFO), who made $667,088.
During 2005, Dell failed to disclose to investors large payments from Intel, which caused
Dell’s operating income to significantly increase. These payments allowed Dell to meet their
earnings rather than solely from operations and management (Goldman, 2010). The company
9
was under the leadership of CEO, Kevin B. Rollins, who made $4,169,398, and CFO, James M.
Schneider, who made $1,665,266. Dell’s leading competitor during 2005, was Hewlett Packard
Company, with Mark V. Hurd (CEO) earning $24,394,835 for that year. The CFO, Robert P.
Wayman, made $7,201,238.
Two years later in 2007, Lehman Brothers fraudulently moved $50 billion of assets of
their books before the firm went bankrupt (Merced & Sorkin, 2010). At the time of the fraud, the
CEO of the firm was R.S. Fuld Jr., who made $34,382,036, and the CFO C.M. O’Meara made
$3,747,083. The competing firm in the industry in the year 2007 was Merrill Lynch. Merrill
Lynch had an executive leadership change during the year, thus resulting in two CEOs and two
CFOs. For the first CEO and CFO reported for the year, E. Stanley O’Neal (CEO) made
$24,722,355 and Jeffrey N. Edwards (CFO) made $2,363,017. After the leadership change,
Merrill Lynch was headed by John A. Thain (CEO), who made $17,307,610, and Nelson Chai,
who made $1,677,495. Both CEO and CFO compensation information were taken into
consideration when the analysis was performed.
In 2011, Monsanto Company failed to properly account for millions of dollars in rebates;
the company had recognized most of the amount as revenue, but failed to recognize costs
associated with the rebates during the same period (“Monsanto paying $80 Million penalty for
accounting violations”, 2016). During the time that the fraud was committed, the CEO, Hugh
Grant, earned $11,568,670 and the CFO, Pierre Courduroux made $1,636,712. The leading
competitor in 2011 was Archer Daniels Midland with P.A. Woertz (CEO) making $11,079,862
and R.G. Young (CFO) making $1,868,248. A year later in 2012, the Computer Sciences
Corporation (CSC) was charged by the SEC for accounting and disclosure fraud. In addition, one
of the executives allegedly inflated profits by adding items to CSC’s accounting models (“SEC
10
charges CSC and former executives with accounting fraud,” 2015). At the time, Michael Laphen was
the CEO of the company, and he earned approximately $20,859,081. The CFO of the company,
Michael J. Mancuso made $1,665,266 for that year. The non-fraud competing company for this
case was HP Inc. The CEO, Margaret C. Whitman made $2,481,751, while the CFO, Catherine
A. Lesjack made $6,703,452 for following year.
The last fraud company to be discussed is Tesco. In 2014, Tesco announced that the
company overstated its profits for the first half of the year by approximately $420 million (Jolly
& Bray, 2016). At the time, the company was under the executive leadership of two CEOs. The
first was Julio M. Quintana who made $3,025,924, and the second was Fernando R. Assing who
made $2,615,231. The CFO of the company, Christopher L. Boone made $1,107,354 during
2014. The leading competitor for Tesco during this year was ASDA, a Wal-Mart branch
company. The CEO, Michael T. Duke, made $5,643,677 and the CFO, Charles M. Holley Jr.,
made $8,199,391.
3.2 ALLOCATING COMPENSATION DATA
After gathering information on each of the 20 companies, the compensation data for each
individual executive was broken up into Cash Salary, Other Compensation, and Total. The
“Other Compensation” section covers finer details including stock options and awards. Since
each company offers different types of awards, everything that did not fall under the salary
category was grouped into other compensation. After breaking up the compensation information
into these three categories, three more categories were made after dividing by the number of
employees for each company. The additional categories now provided a perspective on how
much each executive made per employee. The categories were Cash Salary per Employee, Other
Compensation per Employee, and Total per Employee.
11
To expand on how much more fraud executives could have made over non-fraud executives,
additional calculations were made to get totals for all fraud executives and all non-fraud
executives. Six tables were created to first find total dollars, average total dollars, and median
total dollars for the cash salary, other compensation, and total of all 20 companies. For example,
for total dollars salary of the fraud CEOs each of the 10 fraud CEO salaries were added together
to get total dollars. The same was also done for CEOs of non-fraud companies and CFOs. A
similar process was used for average, but the average function in Excel was used to find the
average total dollars for fraud and non-fraud executives. For the median, the median function
was used in excel to get the median number of all the fraud and non-fraud executives. Six more
tables were created to find the per employee amounts for total dollars, average total dollars, and
median total dollars.
4. Results and Findings
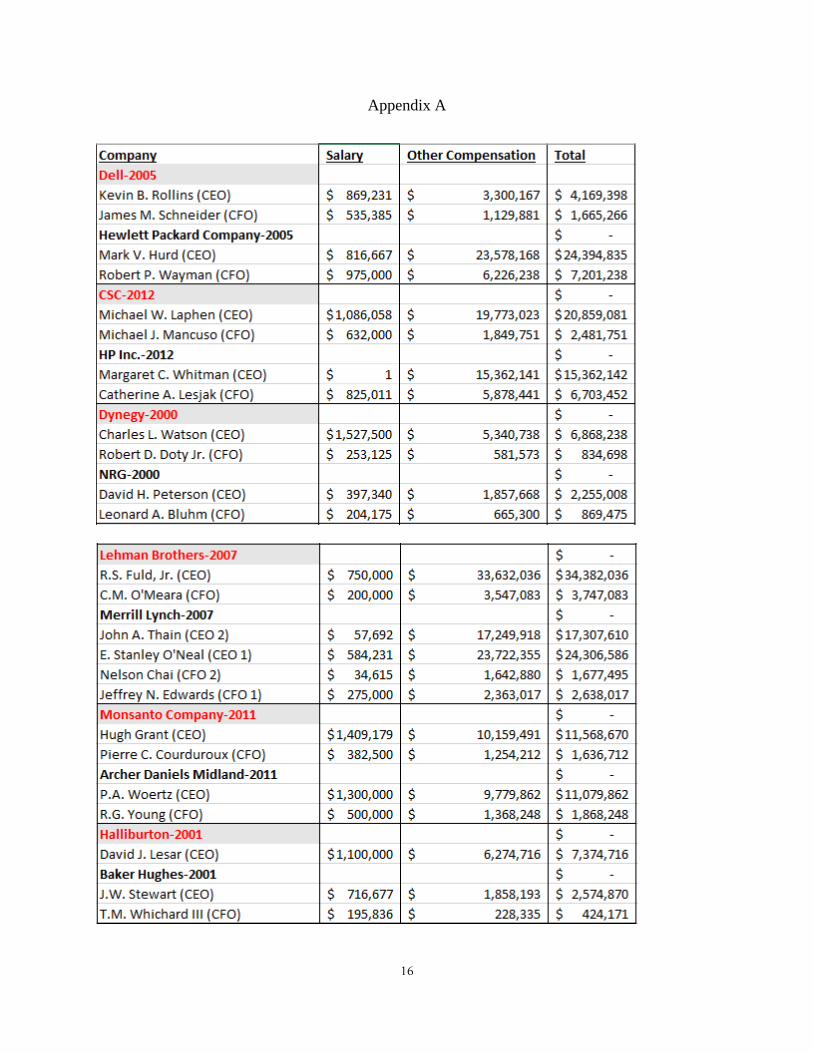
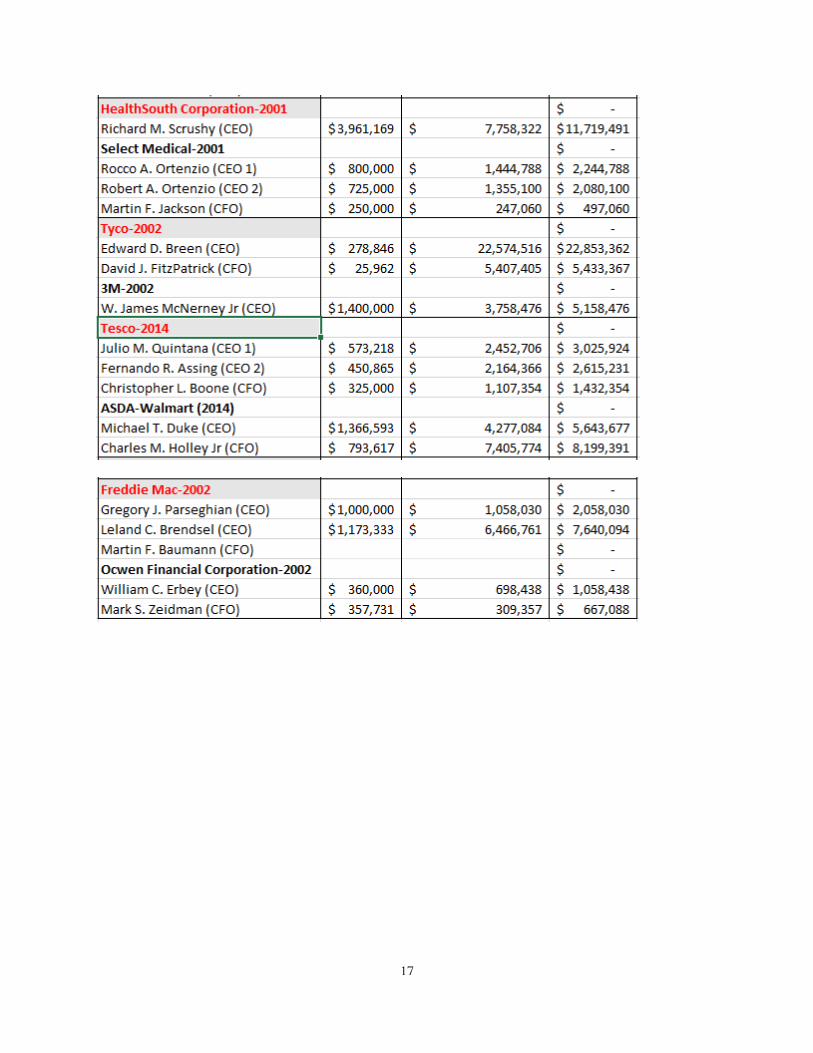
When looking strictly at the information pulled from the proxy statements in Appendix A, it
can be said that 8 out of 10 fraud CEOs had higher compensation totals than non-fraud CEOs.
The companies that had information for multiple CEOs were considered as individual totals
instead of the sum of all the CEO salaries. When looking at the CFO compensation totals, there
was only 1 fraud company that had higher compensation than non-fraud CFOs. It is important to
note that there were only 5 companies that had information for CFO compensation. When
comparing CFO compensation based on totals alone, it can be observed that the amount
compensated to fraud company CFOs and non-fraud company CFOs are very close.
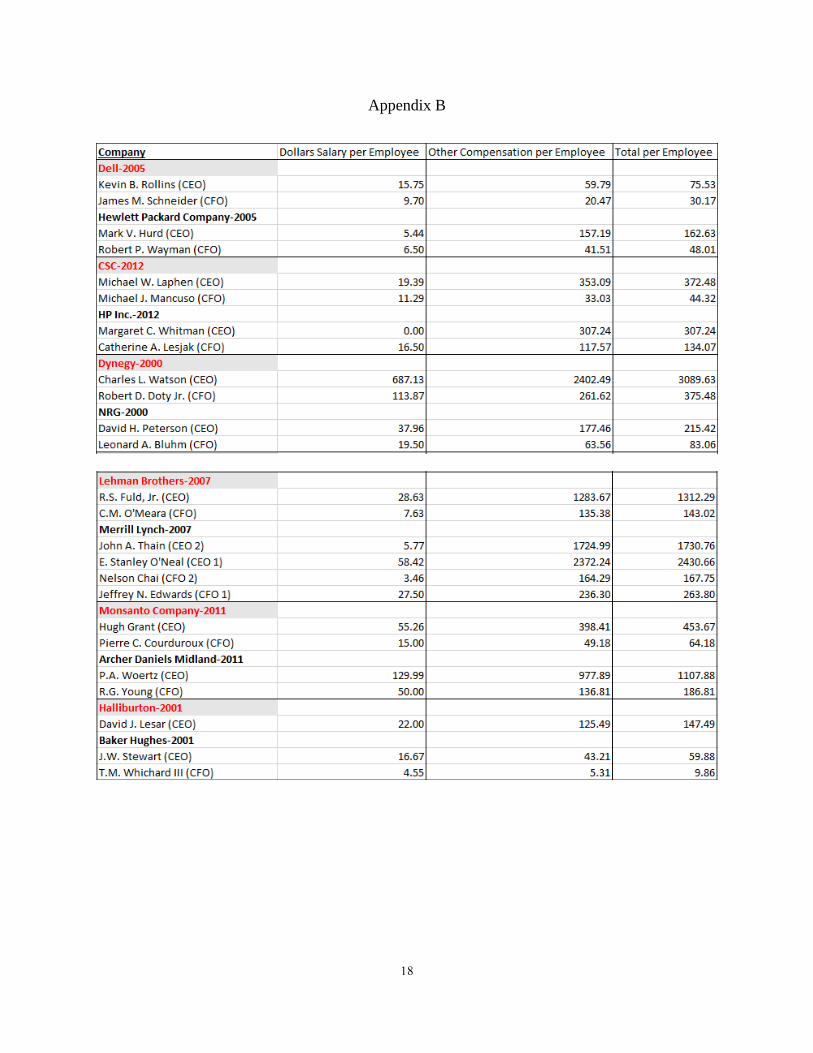
After analyzing data for compensation totals, the next step was to examine the per employee
data. Salary, other compensation, and total were divided by the number of employees that
worked at the specified company. The data shows that only 6 out of 10 fraud company CEOs had
12
larger per employee totals. While this statistic is quite dependent on the number of employees at
each company, the trend still shows that fraud CEOs tend to receive higher pay. When looking at
Dynegy and NRG alone, Charles Watson, CEO at Dynegy, made approximately $2,874.21 more
than David H. Peterson at NRG. This trend is seen across the five other fraud companies, where
CEOs received higher pay, but the pay gap was not necessarily as big as Dynegy and NRG’s.
After comparing individual fraud and non-fraud CEOs, it can be observed that from the
data alone most individual fraud CEOs made more than their competing CEOs. However, the
next thing to examine is how the sum of all executive compensation compares with one another.
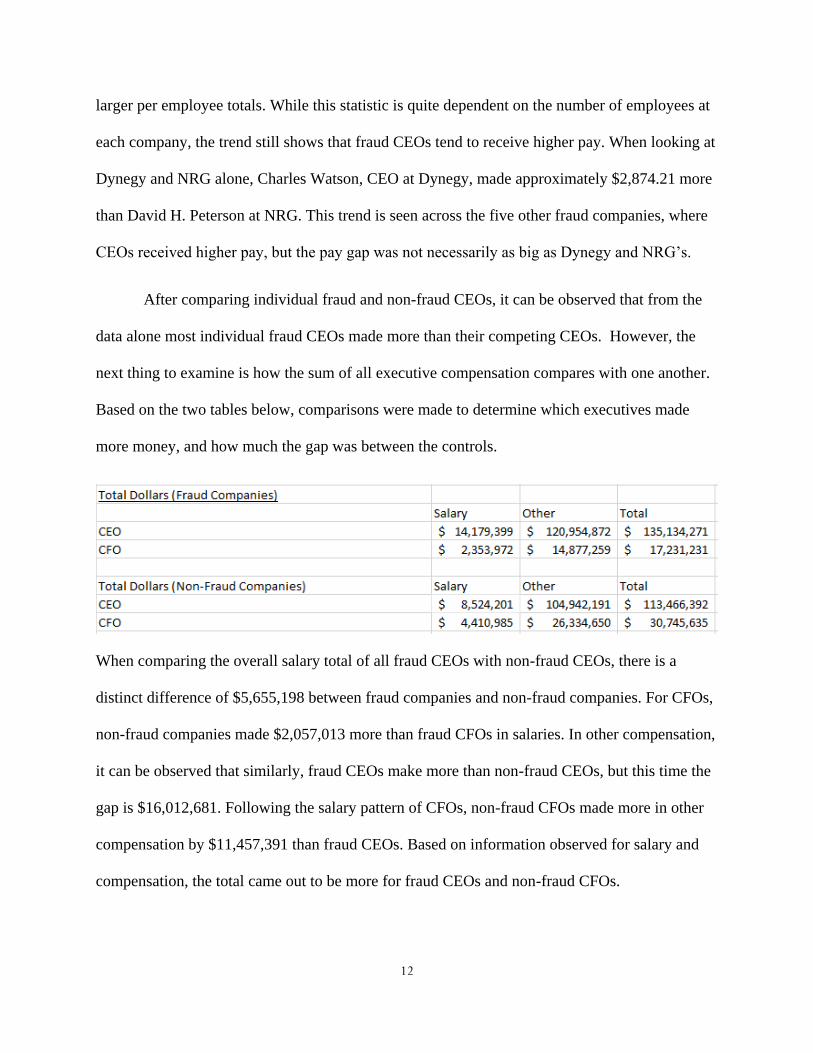
Based on the two tables below, comparisons were made to determine which executives made
more money, and how much the gap was between the controls.
When comparing the overall salary total of all fraud CEOs with non-fraud CEOs, there is a
distinct difference of $5,655,198 between fraud companies and non-fraud companies. For CFOs,
non-fraud companies made $2,057,013 more than fraud CFOs in salaries. In other compensation,
it can be observed that similarly, fraud CEOs make more than non-fraud CEOs, but this time the
gap is $16,012,681. Following the salary pattern of CFOs, non-fraud CFOs made more in other
compensation by $11,457,391 than fraud CEOs. Based on information observed for salary and
compensation, the total came out to be more for fraud CEOs and non-fraud CFOs.
13
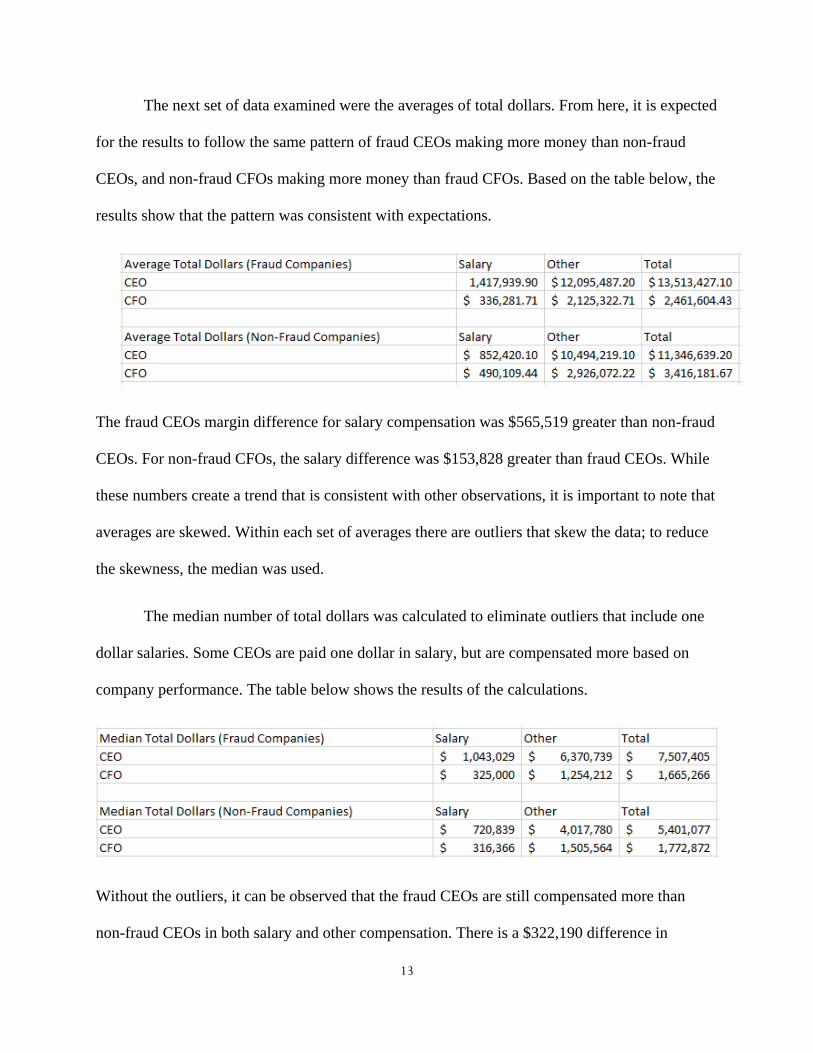
The next set of data examined were the averages of total dollars. From here, it is expected
for the results to follow the same pattern of fraud CEOs making more money than non-fraud
CEOs, and non-fraud CFOs making more money than fraud CFOs. Based on the table below, the
results show that the pattern was consistent with expectations.
The fraud CEOs margin difference for salary compensation was $565,519 greater than non-fraud
CEOs. For non-fraud CFOs, the salary difference was $153,828 greater than fraud CEOs. While
these numbers create a trend that is consistent with other observations, it is important to note that
averages are skewed. Within each set of averages there are outliers that skew the data; to reduce
the skewness, the median was used.
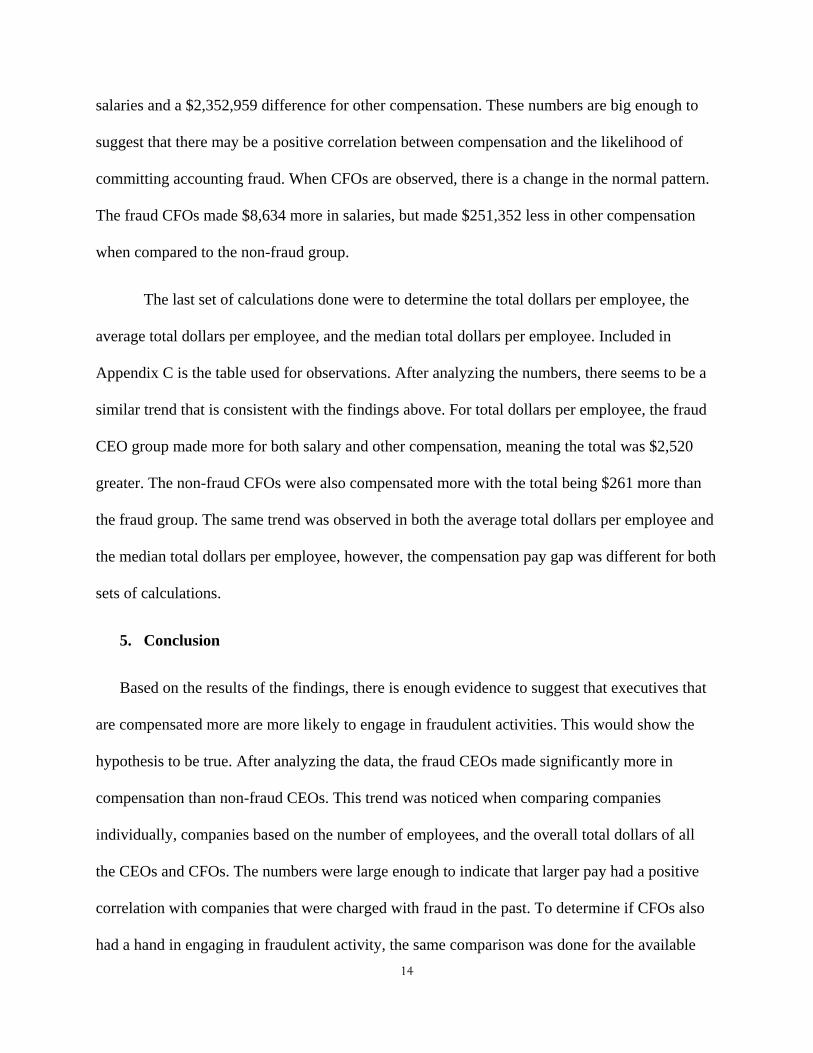
The median number of total dollars was calculated to eliminate outliers that include one
dollar salaries. Some CEOs are paid one dollar in salary, but are compensated more based on
company performance. The table below shows the results of the calculations.
Without the outliers, it can be observed that the fraud CEOs are still compensated more than
non-fraud CEOs in both salary and other compensation. There is a $322,190 difference in
14
salaries and a $2,352,959 difference for other compensation. These numbers are big enough to
suggest that there may be a positive correlation between compensation and the likelihood of
committing accounting fraud. When CFOs are observed, there is a change in the normal pattern.
The fraud CFOs made $8,634 more in salaries, but made $251,352 less in other compensation
when compared to the non-fraud group.
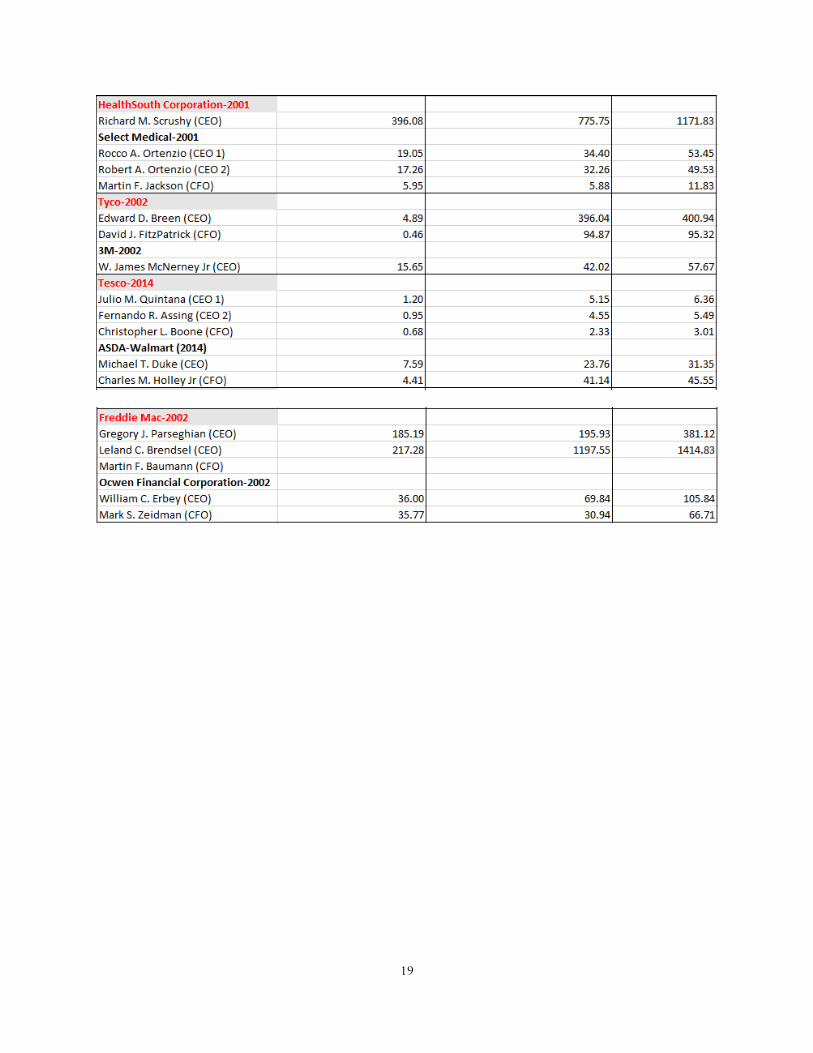
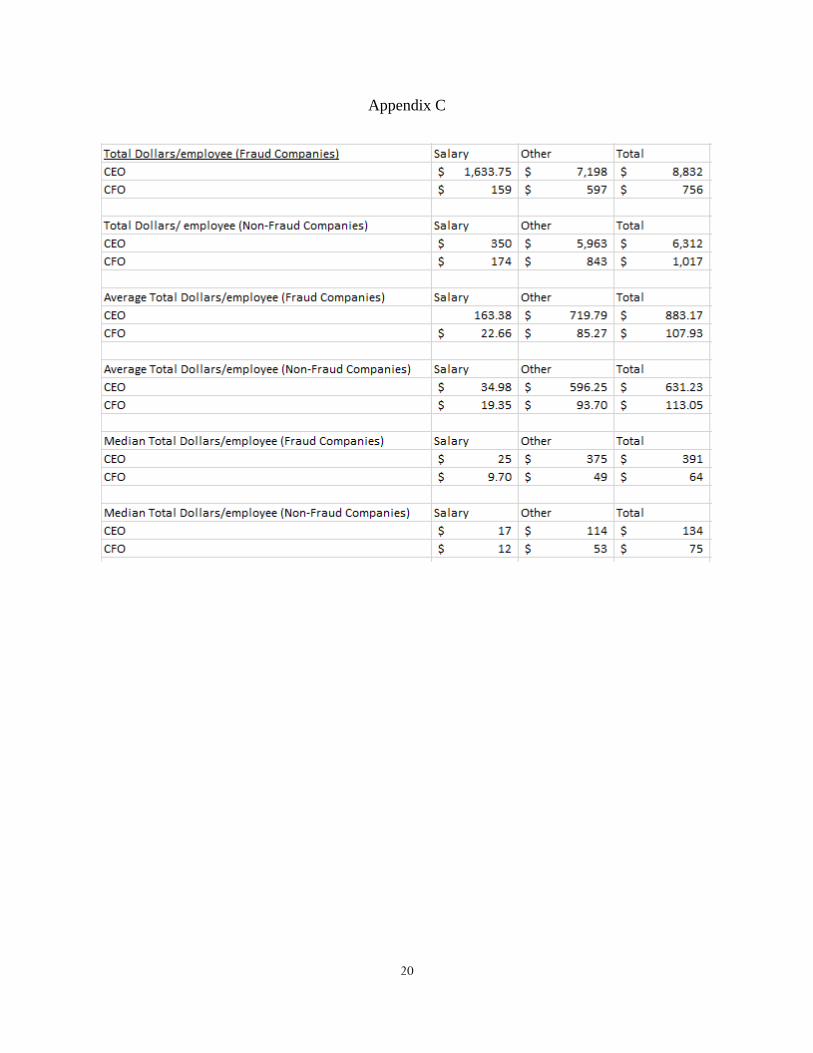
The last set of calculations done were to determine the total dollars per employee, the
average total dollars per employee, and the median total dollars per employee. Included in
Appendix C is the table used for observations. After analyzing the numbers, there seems to be a
similar trend that is consistent with the findings above. For total dollars per employee, the fraud
CEO group made more for both salary and other compensation, meaning the total was $2,520
greater. The non-fraud CFOs were also compensated more with the total being $261 more than
the fraud group. The same trend was observed in both the average total dollars per employee and
the median total dollars per employee, however, the compensation pay gap was different for both
sets of calculations.
5. Conclusion
Based on the results of the findings, there is enough evidence to suggest that executives that
are compensated more are more likely to engage in fraudulent activities. This would show the
hypothesis to be true. After analyzing the data, the fraud CEOs made significantly more in
compensation than non-fraud CEOs. This trend was noticed when comparing companies
individually, companies based on the number of employees, and the overall total dollars of all
the CEOs and CFOs. The numbers were large enough to indicate that larger pay had a positive
correlation with companies that were charged with fraud in the past. To determine if CFOs also
had a hand in engaging in fraudulent activity, the same comparison was done for the available
15
compensation information. Observations show that the differences in compensation for all salary,
other compensation, and total compensation calculations were too close to say that CFOs that
were paid more were likely to commit fraud. Based on this study, the Chief Executive Officers
had a more obvious motive to commit fraud because they were being paid more.
Companies today should pay closer attention to how executive compensation could impact
fraudulent behavior. It may a good idea to lower CEO compensation to reduce the likelihood of
executives to act on their own self interests. As stated in the background, the Chief Executive
Officer has a responsibility to act in the best interest of shareholders and stakeholders.
Fraudulently reporting annual statement information not only violates the ethical practice, but
also miscommunicates information to investors. This type of behavior can be a severe threat to
the success of the company in the long run. With that in mind, CEO compensation should be
awarded in a way that prevents fraudulent behavior from being a concern. As seen from the
observations made above, too much money can potentially be a bad thing.
16
Appendix A
17
18
Appendix B
19
20
Appendix C
21
References:
2014 fraud statistics - ARA Fraud & forensic services. (2012). Retrieved November 28, 2016, from Fraud
and Forensic Services, http://www.arastl.com/2012fraud-statistics/
Accounting Fraud Law & Legal Definition. (n.d.). Retrieved November 25, 2016, from
http://definitions.uslegal.com/a/accounting-fraud/
Ex-Dynegy exec convicted of fraud. (2003). Retrieved November 27, 2016, from http://www.nbcnews.com/id/3475285/ns/business-corporate_scandals/t/ex-dynegy-exec-
convicted-fraud/ Four faces of the CFO | Deloitte | CFO program. (2015, August 19). Retrieved November 28, 2016, from
Deloitte, https://www2.deloitte.com/us/en/pages/finance/articles/gx-cfo-role-responsibilities-
organization-steward-operator-catalyst-strategist.html
Freudenheim, M. (2004, January 20). HealthSouth Audit Finds as Much as $4.6 Billion in Fraud.
Retrieved November 27, 2016, from http://www.nytimes.com/2004/01/21/business/healthsouth-audit-finds-as-much-as-4.6-billion-in-
fraud.html
Glater, J. (2003). Freddie Mac Understated Its Earnings By $5 Billion. Retrieved November 27,
2016, from http://www.nytimes.com/2003/11/22/business/freddie-mac-understated-its-
earnings-by-5-billion.html
Goldman, D. (2016, July 23). Dell settles fraud charges for $100 million. Retrieved November
27, 2016, from http://money.cnn.com/2010/07/22/technology/dell_sec/
Haß, L. H., Müller, M. A., & Vergauwe, S. (2015, July 18). Tournament incentives and
corporate fraud. Journal of Corporate Finance, 34, 251-267.
doi:10.1016/j.jcorpfin.2015.07.008
Jolly, D., & Bray, C. (2016). 3 former Tesco executives charged with fraud over accounting scandal. New
York Times. Retrieved from http://www.nytimes.com/2016/09/10/business/international/tesco-
britain-fraud-accounting.html
Kennedy, Kristin A., "An Analysis of Fraud: Causes, Prevention, and Notable Cases" (2012).
Honors Theses. Paper 100.
Merced, M. J., & Sorkin, A. R. (2010, March 11). Report Details How Lehman Hid Its Woes.
Retrieved November 26, 2016, from
http://www.nytimes.com/2010/03/12/business/12lehman.html?pagewanted=all
Monsanto paying $80 Million penalty for accounting violations. (2016, February 9). Retrieved November
28, 2016, from U.S. Securities and Exchange Commission,
https://www.sec.gov/news/pressrelease/2016-25.html
22
Morgenson, G. (2004). Suit Accuses Halliburton Of Fraud In Accounting. Retrieved November
27, 2016, from http://www.nytimes.com/2004/08/06/business/suit-accuses-halliburton-of-fraud-
in-accounting.html
Richards, D. A., Melancon, B. C., & Ratley, J. D. (2008). Managing the Business Risk of Fraud:
A Practical Guide [Pamphlet]. The Institute of Internal Auditors.
Richards, L. (2008, September 09). SEC speech: “Why does fraud occur and what can deter or prevent
it?” (Lori Richards); Ft. Worth, Texas: September 9, 2008. Retrieved November 28, 2016, from
https://www.sec.gov/news/speech/2008/spch090908lar.htm Roles and responsibilities chief executive officer. Retrieved November 28, 2016, from
http://www.sterling-resources.com/docs/RolesAndRespCEO.pdf
SEC announces enforcement results for FY 2015. (2015, October 22). Retrieved December 6, 2016, from
U.S. Securities and Exchange Commission, https://www.sec.gov/news/pressrelease/2015-
245.html
SEC charges CSC and former executives with accounting fraud. (2015, June 5). Retrieved November 28,
2016, from U.S. Securities and Exchange Commission,
https://www.sec.gov/news/pressrelease/2015-111.html
Sorkin, A. R. (2002, September 12). 2 Top Tyco Executives Charged With $600 Million Fraud
Scheme. Retrieved November 27, 2016, from
http://www.nytimes.com/2002/09/13/business/2-top-tyco-executives-charged-with-600-
million-fraud-scheme.html