Embed Size (px)
Citation preview
ORI GIN AL PA PER
The size of savannah Africa: a lion’s (Panthera leo) view
Jason Riggio • Andrew Jacobson • Luke Dollar • Hans Bauer •
Matthew Becker • Amy Dickman • Paul Funston • Rosemary Groom •
Philipp Henschel • Hans de Iongh • Laly Lichtenfeld • Stuart Pimm
Received: 14 July 2012 / Accepted: 4 October 2012� The Author(s) 2012. This article is published with open access at Springerlink.com
Abstract We define African savannahs as being those areas that receive between 300 and
1,500 mm of rain annually. This broad definition encompasses a variety of habitats. Thus
defined, savannahs comprise 13.5 million km2 and encompass most of the present range of
Electronic supplementary material The online version of this article (doi:10.1007/s10531-012-0381-4)contains supplementary material, which is available to authorized users.
J. Riggio � A. Jacobson � L. Dollar � S. Pimm (&)Nicholas School of the Environment, Duke University, Durham, NC 27708, USAe-mail: [email protected]
J. Riggio � A. Jacobson � L. Dollar � S. PimmNational Geographic Society, Big Cats Initiative, Washington, DC, USA
L. DollarDepartment of Biology, Pfeiffer University, Misenheimer, NC 28109, USA
H. Bauer � A. DickmanWildlife Conservation Research Unit, University of Oxford, Recanati-Kaplan Centre,Tubney OX13 5QL, UK
M. BeckerZambian Carnivore Programme, PO Box 80, Mfuwe, Zambia
M. BeckerDepartment of Ecology, Montana State University, Bozeman, MT 59717, USA
P. FunstonDepartment of Nature Conservation, Tshwane University of Technology, Pretoria, South Africa
R. GroomDepartment of Zoology, University of Johannesburg, PO Box 524, Auckland Park 2006, South Africa
R. GroomAfrican Wildlife Conservation Fund, 10564 NW 57th St., Doral, FL 33178, USA
P. HenschelPanthera, 8 West 40th Street, 18th Floor, New York, NY 10018, USA
123
Biodivers ConservDOI 10.1007/s10531-012-0381-4
the African lion (Panthera leo). Dense human populations and extensive conversion of
land to human use preclude use by lions. Using high-resolution satellite imagery and
human population density data we define lion areas, places that likely have resident lion
populations. In 1960, 11.9 million km2 of these savannahs had fewer than 25 people per
km2. The comparable area shrank to 9.7 million km2 by 2000. Areas of savannah Africa
with few people have shrunk considerably in the last 50 years and human population
projections suggest they will likely shrink significantly in the next 40. The current extent of
free-ranging lion populations is 3.4 million km2 or about 25 % of savannah area. Habitats
across this area are fragmented; all available data indicate that between 32,000 and 35,000
free-ranging lions live in 67 lion areas. Although these numbers are similar to previous
estimates, they are geographically more comprehensive. There is abundant evidence of
widespread declines and local extinctions. Under the criteria we outline, ten lion areas
qualify as lion strongholds: four in East Africa and six in Southern Africa. Approximately
24,000 lions are in strongholds, with an additional 4,000 in potential ones. However, over
6,000 lions are in populations of doubtful long-term viability. Lion populations in West
and Central Africa are acutely threatened with many recent, local extinctions even in
nominally protected areas.
Keywords Lion � Panthera leo � Africa � Distribution � Savannah � Google Earth �Threatened species � Endangered species � Red List � Functional extinction � Top predator
Introduction
We define our domain of interest as being those areas of Africa that receive between 300
and 1,500 mm of rain annually. This broad and inevitably arbitrary definition encompasses
a wide variety of habitats including grasslands, wetlands, dry woodlands and mosaics of all
of these, but most of this area is deemed to be savannah. For our purposes we call all these
areas ‘‘savannahs’’ for simplicity, without wishing to comment on the complexities of what
determines the limits of this biome (Sankaran et al. 2005; Ratnam et al. 2011; Staver et al.
2011). Thus defined, we show below that savannahs comprise 13.5 million km2. (This
compares to Cahoon et al.’s (1992) estimate of *10 million km2.) As we define it, this
domain is most of Africa south of the Sahara, excluding the tropical moist forests of West
Africa, the Congo, patches of montane forests throughout East Africa, and drier areas in the
Southwest, such as the Namib.
As such, the IUCN Red List entry (henceforth Bauer et al. 2008) shows that savannah
Africa encompasses most of the present range of the African lion (Panthera leo leo). Lions
H. de IonghInstitute of Environmental Sciences, PO Box 9518, 2300 RA Leiden, The Netherlands
H. de IonghDepartment Biology, Evolutionary Ecology Group, University of Antwerp, Groenenborgerlaan 171,2020 Antwerpen, Belgium
L. LichtenfeldAfrican People & Wildlife Fund, PO Box 624, Bernardsville, NJ 07924, USA
L. LichtenfeldDepartment of Forestry and Environmental Studies, Yale University, New Haven, CT 06511, USA
Biodivers Conserv
123
once lived across Eurasia, but now only a remnant population of a different subspecies
(Panthera leo persica) survives in India. Recent research has demonstrated that the lion in
West and Central Africa is genetically different from the lion in East and Southern Africa
and more closely resembles Asiatic populations (Bertola et al. 2011). Nonetheless, we
consider just African populations and do so without distinction.
In Africa, lion populations once lived outside this strict savannah zone. For example,
until recently a lion population was present in forest-savannah mosaics in Gabon and the
Republic of Congo (‘‘Congo-Brazzaville’’) (Henschel 2009), and there are other remnant
populations in forests in Ethiopia (see supplemental materials) and other non-savannah
environments. However, the association between lions and savannahs is generally now
quite a close one. How much of the African savannah still supports lions—and is likely to
do so in the future—are the more difficult questions we address in this paper.
We evaluate the state of the African savannah with two objectives, namely estimating
the areas of savannah still suitable for lion populations and estimating the lion populations
themselves within these areas. If areas retain lions, the continent’s top predator, they are
likely to be reasonably intact ecosystems. By considering the size of savannah Africa from
the lion’s perspective, we can assess how much of it remains in large, relatively intact
areas, not yet heavily modified by human influence. Clearly, smaller areas will still support
less complete sets of species.
Our first objective of estimating this area is important for three reasons. (a) We provide
an assessment of an ecosystem rich in biodiversity—much as one might assess the current
extent of tropical moist forests, for example. (b) Discussions of how much land is set aside
for protection of specified ecosystems are particularly important as nations evaluate the
2010 targets under the Convention on Biological Diversity (Jenkins and Joppa 2009). As
we define them, African savannahs extend beyond protected areas into areas with low
human impact. The question is: how much do savannahs extend beyond the borders of
protected areas? The answer certainly includes areas with other land uses, including
hunting zones that comprise a significant share of the lion’s range in Africa. (c) Some
protected areas may be too small or their managers unable to stem the threats to them to
retain lions or other wide-ranging species (Henschel et al. 2010). At continental scales,
whether protected areas actually protect biodiversity is generally assessed by measures
such as the retention of forest cover (Joppa et al. 2008) or the management of anthropo-
genic fires (Adeney et al. 2009). Much of the savannah zone is a fire climax (Bond and van
Wilgen 1996). However, such methods do not permit direct evaluations of the protected
areas’ effectiveness in conserving biodiversity. For African savannahs, the presence of
large mammals, such as lions, permits such direct assessments in ways unavailable for
ecosystems with less conspicuous fauna sensitive to human impacts.
Our second objective of compiling estimates of all free-ranging lion populations
throughout Africa builds from three previous continent-wide population assessments:
Chardonnet (2002), Bauer and Van Der Merwe (2004), and the WCS and IUCN-organised
range-wide priority setting exercises held in 2005 and 2006 (IUCN 2006a, b). Those
reports rightly generated considerable efforts to improve population estimates across
Africa. However, a recent meeting of the African Lion Working Group in Etosha, Namibia,
suggested that these regional lion conservation strategies had a poor follow-up and needed
an urgent update (see Final Communique from the 2nd African Lion Working Group
meeting http://www.largecarnivoresafrica.com/wp-content/uploads/ALWG-Etosha-public-
statement.pdf). This need is particularly acute: there is evidence of rapidly declining
populations of many large mammals in West and Central Africa and in East Africa (Craigie
et al. 2010; Henschel et al. 2010), as well as some parts of Southern Africa. These trends
Biodivers Conserv
123
may quickly invalidate any estimates and may make some of the assumptions of the
regional lion conservation strategies redundant. Presenting what is known, and when, is
surely the best way to show such declines.
To these prior continent-wide assessments, we add data from over 40 mainly country-
specific reports and our own personal experiences. These expand on these previous
compilations and provide the current best estimates of numbers, or other clarifications, of
lion numbers and distribution.
Our two objectives address the need for an updated geographical framework onto which
we can map the numbers of lions and the areas they occupy. Countrywide estimates of lion
numbers fail to capture the size and degree of isolation and consequent population via-
bility. Nor do they show the trans-boundary distributions of many lion populations. Here
we present all known lion population data in a single map.
This map contains our best estimates of lion areas—places that, as best we can tell,
likely have resident lion populations. Human impacts delineate many of these areas. How
human impacts have changed—and will change—give clues needed to understand past lion
population trends and allows us to speculate about their future.
The regional lion conservation strategies of 2006 defined ‘‘lion conservation units’’
(LCUs). These are expert-defined regions intended to classify areas suitable for lions, an
idea already in use by the conservation community following Sanderson et al.’s (2002)
jaguar conservation units. LCUs are areas of known, occasional or possible lion range that
one could consider an ecological unit of importance for lion conservation (IUCN 2006a, b).
These LCUs arose from regional workshops held in 2005 and 2006 and maps included in
the regional strategy reports delineate them. However, recent lion field surveys in West and
Central Africa revealed that much of the information on lion distribution used for defining
these LCUs is either out of date or was not very accurate in the first place (Henschel et al.
2010). We still decided to use these LCUs, however, as a starting point and as an important
international reference for lion conservation.
We created lion areas by modifying LCUs with updated information and observed land
conversion or predictions of high human population density. We find broad agreement
between our lion areas and LCUs. There are important differences, however. Our lion areas
consider all places containing resident lion populations, not just those regions deemed
important for lion conservation. In addition, our explicit habitat modelling allows for
updated future assessments. It also permits us to understand where and how rapidly lion
populations have become isolated, a subject we will address elsewhere.
A final component in assessing the status of lions determines which populations are
‘‘lion strongholds,’’ by meeting the necessary requirements for long-term viability. The
concept of a lion stronghold is not new and recent calls for lion conservation action have
included the need to ‘‘…identify regional strongholds for the species that have the highest
probability of persistence in the long-term’’ (Treves et al. 2009). Defining ‘‘strongholds’’ is
not easy, as our ‘‘Discussion’’ section elaborates.
Methods
Rainfall
We obtained rainfall data from WorldClim (Global Climate Data http://www.worldclim.
org/) (Hijmans et al. 2005).
Biodivers Conserv
123
Lion population assessment
We compiled all of the most current available estimates of lion populations—see sup-
plementary materials. Three continent-wide assessments provide the core of these data
(Chardonnet 2002; Bauer and Van Der Merwe 2004; IUCN 2006a, b). Supplementing
these continent-wide reports, we added lion conservation strategies and action plans that
highlight the status of lions in specific countries. We searched the primary articles these
reports cite and newly published lion population surveys to obtain the most up-to-date data
on lion numbers and distribution. Most of these reports include expert opinions on lion
numbers or structured surveys, not formal counts. We also include individual personal
comments from the authors and colleagues on the numbers in supplementary materials.
Given how difficult it is to count lions this inevitably begs the question of how good are
these expert opinions, an issue we address in ‘‘Discussion’’ section.
Lion area mapping
We mapped the protected areas within savannah Africa using the 2010 World Database on
Protected Areas (IUCN and WDPA 2010). This database includes the six different IUCN
classifications of protected areas. These range from strict protection to multiple use and
extractive reserves that inter alia, permit hunting. While the delineations of national parks
are usually clear, the boundaries of areas with less protection, especially hunting areas are
not. In some countries, IUCN categories encompass some of these areas; in others, they do
not. Hunting areas can be very extensive: for instance, Tanzania gazettes more land for
hunting than for national parks. Moreover, some areas have no protection at all, but still
house lions. In short, the difficult issue is to what extent lions move beyond and between
the well-known protected areas.
To address this issue, the IUCN (2006a, b) delineated LCUs. They include national
parks, hunting zones and other forms of land use. To determine the current extent and
distribution of lion areas we further refined these LCUs using additional data that we will
describe in the sections to come: (1) user-identified land conversion, (2) human population
density, (3) lion distribution from country-specific reports, and (4) additional data from
recent lion population surveys. We utilised these four data layers to refine lion areas using
the following, rule-based hierarchical system (Rule #2 takes precedence over the infor-
mation in Rule #1, etc.):
1. Retain the boundaries of LCUs as originally mapped by IUCN (2006a, b), if additional
data are lacking to modify them.
2. Incorporate ‘‘permanent’’ lion distributions that more recent reports identify as such
and, when possible, remove areas listed as having ‘‘possible, temporary, or
occasional’’ lion populations.
3. Exclude areas with human population density greater than 25 people per km2. (We
justify this threshold in the Results.)
4. Exclude areas with user-identified land conversion above a defined-threshold, which
again we define.
5. Exclude areas where recent lion population surveys no longer detected resident lions.
Lion conservation units (LCUs). Lion conservation units are expert opinions typically
produced at meetings by freehand drawing of boundaries on maps. They can combine
considerable experience and profound ignorance, of course, and beg objectively defined
criteria. We used existing delineations (step 1). We occasionally made small modifications
Biodivers Conserv
123
to them by adding small, adjacent areas of low human impact. Since the creation of LCUs
in 2005/2006, a number of detailed countrywide reports have produced updated lion range
maps. We include these new data on lion distribution for the refined lion areas.
Lion strongholds. For a lion area to qualify as a stronghold, it must satisfy three
qualifications: (1) contain at least 500 individuals, (2) be within protected areas or des-
ignated hunting areas, and (3) the numbers of lions must be stable or increasing as assessed
by the IUCN Cat Specialist Group (IUCN 2006a, b). If a lion area has at least 250
individuals but does not satisfy either requirement (2) or (3), it is a potential stronghold.
We explore these criteria in the ‘‘Discussion’’ section.
Independent measures of land use conversion. To identify areas of high human impact,
we used the European Space Agency’s GlobCover Project (henceforth GlobCover) (ESA
and UCLouvain 2010), which has regularly updated land cover maps. Of the 22 land cover
classes in GlobCover, five relate to human land use conversion (post-flooding or irrigated
croplands, rain-fed croplands, mosaic cropland, mosaic vegetation, and artificial surfaces
and associated areas). These five classes were lumped into a single land conversion layer.
User-identified land conversion. We used Google Earth’s high-resolution global
imagery to evaluate potential lion areas and possible connections between protected areas.
For example, the area between Comoe National Park, in Ivory Coast (at 9.25�N and
3.75�W), and Mole National Park, in Ghana (at 9.5�N and 1.75�W), represents a poten-
tially important corridor for lion movement. GlobCover classifies the intervening areas as a
single, homogenous class—‘‘intact woodlands’’. To see that these areas are not—they are
heterogeneous—is an issue of scale. We follow the definition of ‘‘scale’’ as the distance
over which a measure is unchanged. This begs the question of how close must one inspect
an area to see that it is not unchanged—i.e. continuous—woodland, as suggested by the
GlobCover classification.
Google Earth provides an estimate of the altitude of the viewer examining its imagery.
At high altitude, the area does look continuous, but at approximately 40 km elevation, the
presence of extensive small fields cut into the dry woodland becomes apparent in this
region. At 10 km, these fields, typically a few hundred metres across are readily apparent,
so we surveyed extensive areas at this altitude. We hand-drew polygons around areas of
land conversion, (henceforth user-identified land conversion), though typically not of the
individual fields themselves.
We identified land conversion most easily if it was cropland, forest plantations, or urban
areas. More difficult was highlighting intensely grazed areas (more easily identified if they
were fenced-in), croplands in drier regions, and differentiating deforestation from wet
savannahs. We did not identify isolated land conversion smaller than approximately
0.5 km2. In some large areas blanketed by cropland or urbanisation, we did not differen-
tiate embedded natural areas smaller than a few square kilometres. Some areas had
extensive but lower density conversion. In these situations if the 0.01 9 0.01� grid
(*1 km2 at the equator, and drawn by Google Earth) was over 30 % converted, we
deemed it ‘‘converted’’. Despite these qualifications, we attempted to closely follow the
boundaries of conversion (e.g. within *100 m) where feasible. It was impractical to do
this for the entire continent, so we limited this assessment of land conversion to all of West
Africa, plus Cameroon and select locations in Central, East and Southern Africa.
To apply the user-identified land conversion layer to the creation of lion areas, we
converted the Google Earth products (Keyhole Markup Language, or KML files) to a raster
dataset in ArcGIS. Then, we ran the Boundary Clean tool to remove cells of data too small
to have an impact on lion distribution. We converted this raster to a polygon to smooth the
Biodivers Conserv
123
lion area borders. Both the original and cleaned versions of these layers are available as
KML files from the authors on request.
Human population density. We used the Gridded Population of the World version 3
dataset for the year 2000 from Columbia University’s Center for International Earth Sci-
ence Information Network (CIESIN) (CIESIN and CIAT 2005). These data are models of
human population data, not actual counts, and are the most-up-to-date data available to us.
We compared where this product predicted human populations greater than 5, 10, 25, and
50 people per km2 with our user-identified land conversion. The four areas that we chose
were in West, Central, East, and Southern Africa. Compared to user-identified conversions
there can be errors of omission (where the population data predict human impact, but
conversions are not obvious), errors of commission (where there is conversion, but the
population data suggest too few people), and areas where both measures agree. We
evaluated which human population density gave the best agreement.
Results
We estimate that there are 13.5 million km2 of sub-Saharan Africa within the rainfall
limits of 300 and 1,500 mm. The more difficult question is how much of this has human
action made unsuitable for lions and other wildlife. We expected to find the answer in
existing land cover products. As we shall now explain, these products are not sufficient for
our needs.
While GlobCover (ESA and UCLouvain 2010) maps croplands and urban areas,
mosaics of croplands and natural areas and a variety of other ecosystems, it incorrectly
evaluated the extent of land conversion and subsequent availability of lion habitat. For
example, an immense area, nearly 500 km from north to south and stretching over
4,000 km west to east across the entire map (and to areas further east of it), indicates no
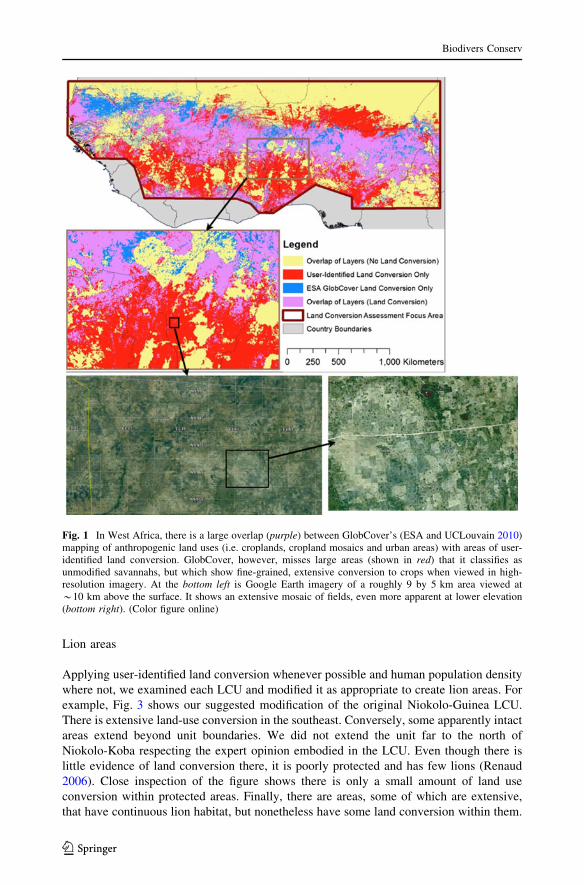
land use conversion (Fig. 1). Such an area would be of obvious conservation value if
intact; however our mapping, using Google Earth imagery at an elevation of *10 km,
shows that people have converted virtually the entire area to cropland (Fig. 1).
Calibration of land use conversion with human population density
Since GlobCover (ESA and UCLouvain 2010) is unsuitable for our purposes, we explored
whether models of human population provided a better correlation with land conversion.
The aim was to find an estimate of human population density that best matched extensive
land conversion. We used four focus areas distributed throughout the African lion’s range
to compare human population at various densities with a high-resolution satellite-based
land conversion layer (Supplemental materials, Fig. S1).
Figure 2 shows the proportion of overlap in areas between the user-identified land
conversion and people at varying densities across the four focus areas. We define overlap
as being when the layers indicate both conversion and the threshold for human population
density is met, and also where there is no conversion and the threshold is not met. For all
four areas, overlap peaks between 10 and 25 people per km2. (Details are in Supplemental
materials, Table S2). This permitted us to use human population density as a proxy for
land-use conversion for areas where we did not define the latter directly. When the user-
identified land conversion layer was not available, we used a density of 25 people per km2
to constrain LCUs, a threshold we consider further in the ‘‘Discussion’’ section.
Biodivers Conserv
123
Lion areas
Applying user-identified land conversion whenever possible and human population density
where not, we examined each LCU and modified it as appropriate to create lion areas. For
example, Fig. 3 shows our suggested modification of the original Niokolo-Guinea LCU.
There is extensive land-use conversion in the southeast. Conversely, some apparently intact
areas extend beyond unit boundaries. We did not extend the unit far to the north of
Niokolo-Koba respecting the expert opinion embodied in the LCU. Even though there is
little evidence of land conversion there, it is poorly protected and has few lions (Renaud
2006). Close inspection of the figure shows there is only a small amount of land use
conversion within protected areas. Finally, there are areas, some of which are extensive,
that have continuous lion habitat, but nonetheless have some land conversion within them.
Fig. 1 In West Africa, there is a large overlap (purple) between GlobCover’s (ESA and UCLouvain 2010)mapping of anthropogenic land uses (i.e. croplands, cropland mosaics and urban areas) with areas of user-identified land conversion. GlobCover, however, misses large areas (shown in red) that it classifies asunmodified savannahs, but which show fine-grained, extensive conversion to crops when viewed in high-resolution imagery. At the bottom left is Google Earth imagery of a roughly 9 by 5 km area viewed at*10 km above the surface. It shows an extensive mosaic of fields, even more apparent at lower elevation(bottom right). (Color figure online)
Biodivers Conserv
123

Fig. 2 This shows the proportional overlap between areas with user-identified land conversion and selecthuman population densities. Overlap of these datasets peak at between 10 and 25 people per km2. WAP anarea including and surrounding W, Arly, and Pendjari National Parks
Fig. 3 Map showing the new boundaries of the Niokolo-Guinea lion area after restriction of the Niokolo-Guinea LCU with user-identified land conversion. The original Niokolo-Guinea LCU (orange outline), user-identified land conversion (dark grey), protected areas (dark green), and lion areas (light green, outlined inpurple). (Color figure online)
Biodivers Conserv
123
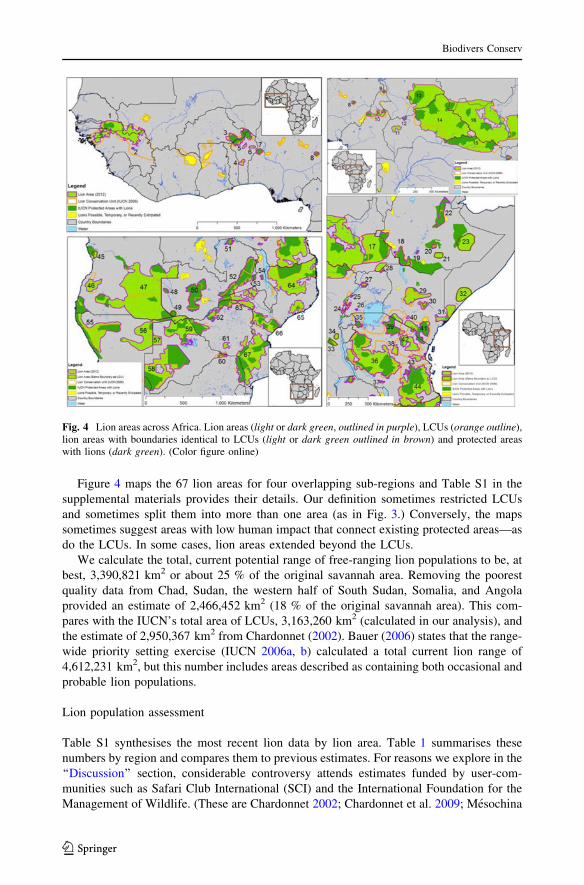
Figure 4 maps the 67 lion areas for four overlapping sub-regions and Table S1 in the
supplemental materials provides their details. Our definition sometimes restricted LCUs
and sometimes split them into more than one area (as in Fig. 3.) Conversely, the maps
sometimes suggest areas with low human impact that connect existing protected areas—as
do the LCUs. In some cases, lion areas extended beyond the LCUs.
We calculate the total, current potential range of free-ranging lion populations to be, at
best, 3,390,821 km2 or about 25 % of the original savannah area. Removing the poorest
quality data from Chad, Sudan, the western half of South Sudan, Somalia, and Angola
provided an estimate of 2,466,452 km2 (18 % of the original savannah area). This com-
pares with the IUCN’s total area of LCUs, 3,163,260 km2 (calculated in our analysis), and
the estimate of 2,950,367 km2 from Chardonnet (2002). Bauer (2006) states that the range-
wide priority setting exercise (IUCN 2006a, b) calculated a total current lion range of
4,612,231 km2, but this number includes areas described as containing both occasional and
probable lion populations.
Lion population assessment
Table S1 synthesises the most recent lion data by lion area. Table 1 summarises these
numbers by region and compares them to previous estimates. For reasons we explore in the
‘‘Discussion’’ section, considerable controversy attends estimates funded by user-com-
munities such as Safari Club International (SCI) and the International Foundation for the
Management of Wildlife. (These are Chardonnet 2002; Chardonnet et al. 2009; Mesochina
Fig. 4 Lion areas across Africa. Lion areas (light or dark green, outlined in purple), LCUs (orange outline),lion areas with boundaries identical to LCUs (light or dark green outlined in brown) and protected areaswith lions (dark green). (Color figure online)
Biodivers Conserv
123
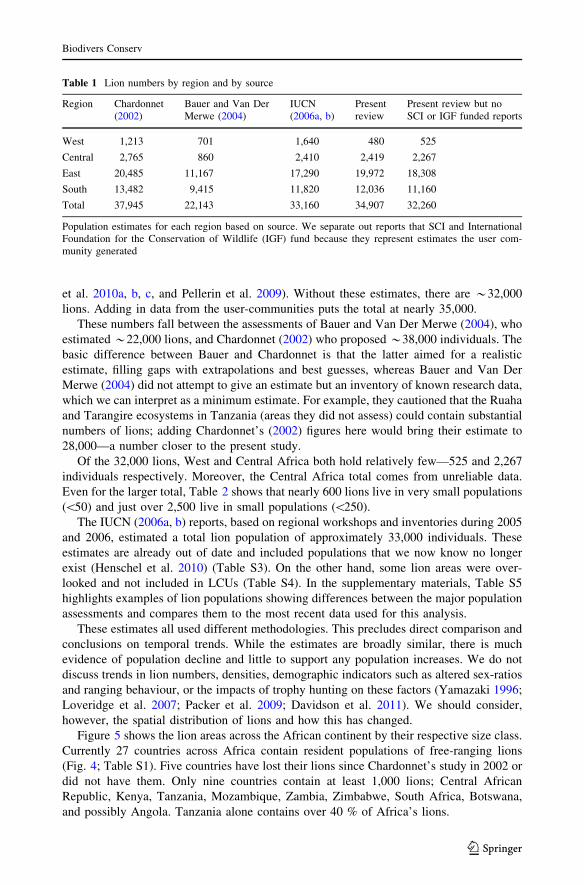
et al. 2010a, b, c, and Pellerin et al. 2009). Without these estimates, there are *32,000
lions. Adding in data from the user-communities puts the total at nearly 35,000.
These numbers fall between the assessments of Bauer and Van Der Merwe (2004), who
estimated *22,000 lions, and Chardonnet (2002) who proposed *38,000 individuals. The
basic difference between Bauer and Chardonnet is that the latter aimed for a realistic
estimate, filling gaps with extrapolations and best guesses, whereas Bauer and Van Der
Merwe (2004) did not attempt to give an estimate but an inventory of known research data,
which we can interpret as a minimum estimate. For example, they cautioned that the Ruaha
and Tarangire ecosystems in Tanzania (areas they did not assess) could contain substantial
numbers of lions; adding Chardonnet’s (2002) figures here would bring their estimate to
28,000—a number closer to the present study.
Of the 32,000 lions, West and Central Africa both hold relatively few—525 and 2,267
individuals respectively. Moreover, the Central Africa total comes from unreliable data.
Even for the larger total, Table 2 shows that nearly 600 lions live in very small populations
(\50) and just over 2,500 live in small populations (\250).
The IUCN (2006a, b) reports, based on regional workshops and inventories during 2005
and 2006, estimated a total lion population of approximately 33,000 individuals. These
estimates are already out of date and included populations that we now know no longer
exist (Henschel et al. 2010) (Table S3). On the other hand, some lion areas were over-
looked and not included in LCUs (Table S4). In the supplementary materials, Table S5
highlights examples of lion populations showing differences between the major population
assessments and compares them to the most recent data used for this analysis.
These estimates all used different methodologies. This precludes direct comparison and
conclusions on temporal trends. While the estimates are broadly similar, there is much
evidence of population decline and little to support any population increases. We do not
discuss trends in lion numbers, densities, demographic indicators such as altered sex-ratios
and ranging behaviour, or the impacts of trophy hunting on these factors (Yamazaki 1996;
Loveridge et al. 2007; Packer et al. 2009; Davidson et al. 2011). We should consider,
however, the spatial distribution of lions and how this has changed.
Figure 5 shows the lion areas across the African continent by their respective size class.
Currently 27 countries across Africa contain resident populations of free-ranging lions
(Fig. 4; Table S1). Five countries have lost their lions since Chardonnet’s study in 2002 or
did not have them. Only nine countries contain at least 1,000 lions; Central African
Republic, Kenya, Tanzania, Mozambique, Zambia, Zimbabwe, South Africa, Botswana,
and possibly Angola. Tanzania alone contains over 40 % of Africa’s lions.
Table 1 Lion numbers by region and by source
Region Chardonnet(2002)
Bauer and Van DerMerwe (2004)
IUCN(2006a, b)
Presentreview
Present review but noSCI or IGF funded reports
West 1,213 701 1,640 480 525
Central 2,765 860 2,410 2,419 2,267
East 20,485 11,167 17,290 19,972 18,308
South 13,482 9,415 11,820 12,036 11,160
Total 37,945 22,143 33,160 34,907 32,260
Population estimates for each region based on source. We separate out reports that SCI and InternationalFoundation for the Conservation of Wildlife (IGF) fund because they represent estimates the user com-munity generated
Biodivers Conserv
123
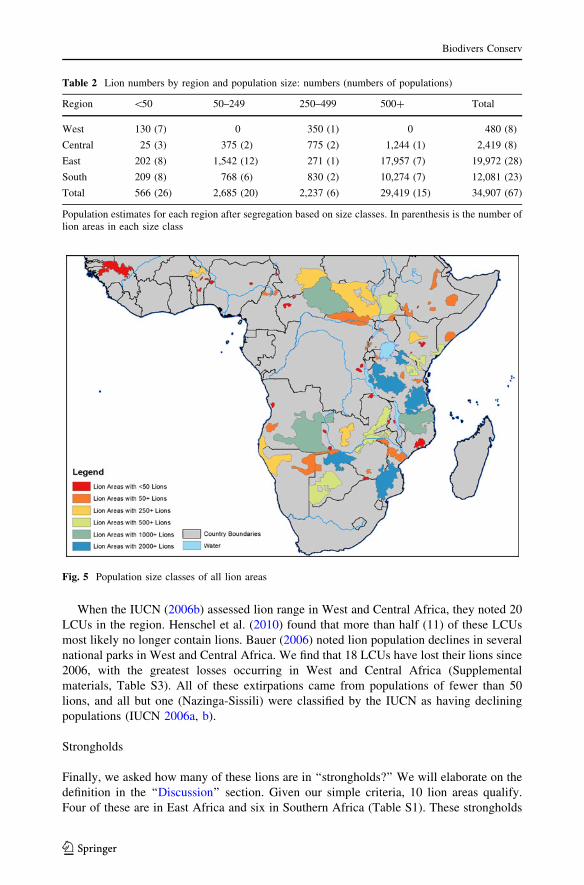
When the IUCN (2006b) assessed lion range in West and Central Africa, they noted 20
LCUs in the region. Henschel et al. (2010) found that more than half (11) of these LCUs
most likely no longer contain lions. Bauer (2006) noted lion population declines in several
national parks in West and Central Africa. We find that 18 LCUs have lost their lions since
2006, with the greatest losses occurring in West and Central Africa (Supplemental
materials, Table S3). All of these extirpations came from populations of fewer than 50
lions, and all but one (Nazinga-Sissili) were classified by the IUCN as having declining
populations (IUCN 2006a, b).
Strongholds
Finally, we asked how many of these lions are in ‘‘strongholds?’’ We will elaborate on the
definition in the ‘‘Discussion’’ section. Given our simple criteria, 10 lion areas qualify.
Four of these are in East Africa and six in Southern Africa (Table S1). These strongholds
Table 2 Lion numbers by region and population size: numbers (numbers of populations)
Region \50 50–249 250–499 500? Total
West 130 (7) 0 350 (1) 0 480 (8)
Central 25 (3) 375 (2) 775 (2) 1,244 (1) 2,419 (8)
East 202 (8) 1,542 (12) 271 (1) 17,957 (7) 19,972 (28)
South 209 (8) 768 (6) 830 (2) 10,274 (7) 12,081 (23)
Total 566 (26) 2,685 (20) 2,237 (6) 29,419 (15) 34,907 (67)
Population estimates for each region after segregation based on size classes. In parenthesis is the number oflion areas in each size class
Fig. 5 Population size classes of all lion areas
Biodivers Conserv
123
span eight countries, contain roughly 19,000 lions in protected areas alone (more than
50 % of the remaining lions in Africa), and over 24,000 lions in the entire lion areas as
delineated. No areas in West or Central Africa qualify.
Seven additional lion areas are potential lion strongholds, which contain nearly 4,400
lions (Table S1). These include two populations in West and Central Africa. The only
remaining regions with potentially large numbers of lions that could act as future lion
strongholds are Angola, Somalia, and the western half of South Sudan. The data on lion
populations in these regions are relatively poor, while political instability makes the
protection of wildlife in some areas difficult in the near future.
Discussion
The extent of savannah Africa
Global assessments of how much tropical moist forest remains are made routinely, and, in
the case of the Brazilian Amazon, monthly. Comparable assessments of tropical dry
woodlands and savannahs are few. Moreover, we show that broad-scale global land cover
assessments massively underestimate the amount of small-scale land use conversion.
We estimate the original size of savannah Africa to be 13.5 million km2. In 1960, using
the human population data sources described above, 11.9 million km2 had fewer than 25
people per km2. The comparable area shrank to 9.7 million km2 by 2000. Sub-Saharan
Africa increased its human population by nearly four-fold from 1960 (229 million) to 2010
(863 million) according to CIESEN (2005). The same source expects the population to
more than double by 2050 (1.753 billion). Simply, the extent of savannah Africa has surely
shrunk considerably in the last 50 years and will likely shrink considerably in the next 40.
In contrast to estimates of moist forest cover, for example, that come with few direct
data on the species those forests contain, there are extensive data on large mammals in
savannahs. These allow us to estimate what fraction of the remaining savannahs is suffi-
ciently intact to house lions, the ecosystem’s top predator. We estimate this area to be
*3.4 million km2 (Table S1)—only 25 % of the total savannah—highlighting the fact that
many low human density savannah areas are nonetheless too small and isolated to support
viable lion populations.
Of the roughly 13.5 million km2 of savannah Africa, IUCN classifies about 1.36 mil-
lion km2 (*10 %) as protected areas, excluding those regions gazetted for timber
extraction (IUCN and WDPA 2010). Roughly 1.08 million km2 of this area overlaps with
the lion areas. (In other words, substantial areas have protected status, but have lost their
lions.) Now, the IUCN categories of protected areas include several that allow extractive
use—and that includes hunting. Lindsey et al. (2006) estimate the total area of sub-Saharan
Africa devoted to hunting as at least 1.4 million km2, and of this, *250,000 km2 is in
Tanzania. What we cannot easily estimate is the various overlaps between areas with lions,
hunting areas, and the various classes of IUCN protected land on a country-by-country
basis. Some countries, such as Kenya, do not permit hunting.
To assess lions in Africa, a good map is essential
Total population estimates alone mean little in the absence of knowledge of where lions
are. Our maps suggest that lion populations survive in some 67 areas, of which only 15
Biodivers Conserv
123
hold at least 500 lions. While a small fraction of these areas appear to be large and
continuous on satellite imagery (e.g. the east of the Central African Republic, southeast
Chad, and west South Sudan sub-populations and the Selous and Niassa populations), there
are no surveys for several of those areas and their status is uncertain. The majority of sub-
populations are small and isolated. Some are so isolated that quibbling over our criteria for
land use change would make no difference: the animals that remain are a very long way
from individuals that might rescue the population demographically or genetically.
A good map is necessary, but it is not sufficient
An obvious caveat is that areas for which we detect little conversion of savannahs to
croplands may still suffer human impacts that make them unsuitable for lions. Over-
hunting for trophies, poaching—of lions and of their prey species—and conflict with
pastoralists may not have any visual signal to satellites. Even where there are low human
population densities and areas designated as national parks, there need not be lions within
them. The poor performance of even large protected areas in West Africa is striking. For
example: Henschel et al. (2010) surveyed Comoe, West Africa’s largest park, a World
Heritage Site that is roughly half the size of Kruger National Park in South Africa. Whilst
Kruger holds nearly 1,700 lions (Ferreira and Funston 2010), and much of Comoe looks to
be free of human disturbance from the high-resolution imagery that Google Earth provides,
Henschel et al. (2010) found no lions, few native mammals, and extensive evidence of
poaching and grazing by domestic livestock in Comoe. Size alone does not protect even the
largest parks if they suffer poor management (Bauer et al. 2003).
Satellite imagery does pick up recently burned savannahs, sometimes covering hundreds
of square kilometres. These could be natural or set by pastoralists to improve grazing.
Analyses of the conservation consequences of anthropogenic fires are available for moist
tropical forest against a backdrop of protected areas (see Adeney et al. 2009). We have not
yet analysed available global data as a means to assess pastoralists’ impacts on the sa-
vannahs and how protected areas modify those impacts.
Conversely, we cannot exclude the possibility that lions might still be able to move
through areas with land-use conversion, though much experience suggests that they suffer
high mortality when they do. For example, Woodroffe (2000) estimated a mean human
population density threshold at which lions went extinct of 26 people per km2. Many
mechanisms might underpin this threshold, but land-use conversion is the most plausible.
The match between her threshold and ours is striking.
Finally, even within suitable habitat, lion densities vary greatly (see Chardonnet 2002).
Densities of prey also vary widely when considering the variation in rainfall and soil type
across lion range (Coe et al. 1976; East 1984; van Orsdol et al. 1985; Hayward et al. 2007).
Lion population estimates
Our lion population estimate of 32,000 lions is higher than the population estimate by
Bauer and Van Der Merwe (2004), but lower than the estimate by Chardonnet (2002).
The differences between these estimates do not represent an increase in lion populations
in Africa, but are a direct result of different methods. There is evidence of strong declines
and even extirpation of lions in some range countries. Especially in West and Central
Africa, declines have been dramatic and conservation measures are urgent. While lions are
protected in some of the lion areas, in many they are not, and in others they are hunted.
While user-communities express the desire to manage lions sustainably, achieving that for
Biodivers Conserv
123
any long-lived species is problematic. Several studies raise concerns about the impact of
trophy hunting on lion densities and demographics (Yamazaki 1996; Loveridge et al. 2007;
Davidson et al. 2011, Becker et al. 2012.). As noted above, the area devoted to lion hunting
is large and Lindsey et al. (2006) emphasise the importance of hunting zones for protection
of lions and their habitat.
How credible are the lion estimates?
Lions have low densities, large ranges and low visibility and are intrinsically difficult to
count accurately. Few of the studies we report involve statistically justified surveys. The
data we report are mostly ‘‘expert opinions’’. They are controversial, yet we cannot simply
pretend they do not exist. We now address their strengths and weaknesses.
The process that produced estimates of lion numbers involved people with widely
different experiences and motivations. Some estimates were produced at meetings where
they were hardly questioned, politely assuming equal expertise to keep the process going
and reporting that they were ‘‘working figures.’’ The IUCN-sponsored workshops had
delegates that were both biologists and politicians. However dedicated and well intentioned
the participants, there is at least the potential for numbers to reflect wishful thinking or
national policies that put a positive spin on numbers to ensure continued funding support.
Countries across savannah Africa receive disproportionate funding for conservation from
the World Bank, for example (Hickey and Pimm 2011).
Bauer and Van Der Merwe’s report (2004) went through peer-review and the IUCN
reviews (IUCN 2006a, b) embraced broad-scale consultation with a wide variety of
sources. These two quality control mechanisms were used to a lesser extent by sources
producing national estimates from the sport hunting industry (Chardonnet 2002; Char-
donnet et al. 2009; Mesochina et al. 2010a, b, c; Pellerin et al. 2009).
Globally, assessments of natural resources by user-communities are consistently more
optimistic than independent estimates (Pimm 2001). Whether trophy hunters and the
reports they fund also consistently inflate lion numbers to ensure continued business should
be detached from any heated rhetoric and viewed simply as the legitimate scientific
question that it is.
Table S1 shows that various studies by Mesochina et al. (2010a, b, c), Chardonnet
(2002), Chardonnet et al. (2009) and Pellerin et al. (2009) constitute the majority of the
putative lions (*55 %). These studies all had similar methodologies for estimating lion
populations. They used estimates from scientific studies for areas that had them (e.g. call-in
stations, individual identification etc.). For areas without, they used questionnaires and
interviews to determine the frequency of lion presence within the past 5 years. They
developed an equation to estimate density based on the closest, well-established density
figure as the baseline and corrective factors to alter that density. Tailoring the equation for
each specific area based on a variety of factors, density estimates and hence overall
population numbers were generated for all areas with lion presence. We find this method
scientifically debatable but we do see value in presenting the speculative results of this
user-community along with the other data and provide an alternative estimate that includes
them.
Certainly, these methods could overestimate both lion range and numbers. Since these
reports affect over half of all lions, they greatly affect the global population estimate. This
concern precipitated the generation of a global population estimate with and without the
Biodivers Conserv
123
hunter-funded numbers (Table 1). With the user-community funded reports, the total
number of lions increases by about 8 %.
For specific examples, IUCN (2006a) estimated 5,500 lions in the Selous, 4,500 in the
Ruaha—Rungwa areas and 3,500 in the Serengeti and Mara. These total 13,500 lions. In
contrast, Mesochina et al. (2010b) estimated these numbers at 7,644, 3,779 and 3,465,
respectively, for a total of 14,888. These IUCN estimates are 8 % lower than those the
user-community funded.
In sum, the numbers are broadly similar and, given the substantial uncertainties in lion
counts, surely indistinguishable. Clearly, we need many other such independent compar-
isons if we are to draw more detailed conclusions. This applies a fortiori to Tanzania where
the numbers are highest and where there are many uncertainties.
Lion strongholds
The 67 lion areas contain some populations that are large, stable, and well-protected—and
so likely to persist in the foreseeable future. They also contain those that are so small,
isolated, and threatened that only immediate, energetic conservation measures can offer
any hope for their survival. And, of course, there are lion areas that are everywhere in
between. How one groups areas across this continuum is inevitably arbitrary. Our approach
is to use three classes: strongholds, potential strongholds, and the remainder. Broadly, these
correspond to areas where management appears to be working (but we should always be
vigilant), where immediate interventions might create a viable population, and where
present management clearly is not working.
Our threshold of 500 (see ‘‘Methods’’ section) comes from Bjorklund (2003) who
assessed the risk of inbreeding in lion populations due to habitat loss. He determined that,
‘‘…to sustain a large out-bred population of lions, a continuous population of at least 50
prides, but preferably 100 prides, with no limits to dispersal is required.’’ We took the
average lion pride as containing approximately five adults (Bauer et al. 2008). Of course,
the numbers of prides to avoid inbreeding is itself an arbitrary number, not a genuine
threshold. (Simply, the fewer males who contribute genes to the next generation, the more
inbred the population will be.) Moreover, the mean pride size is smaller in West and
Central Africa, so the W-Arly-Pendjari population might also sensibly qualify as a
stronghold. (We consider it a potential one.)
From the data derived in the lion population assessment, as well as the World Database
on Protected Areas (IUCN and WDPA 2010), we considered only those lions found within
existing protected areas including those with IUCN categorization that allow hunting, to
count towards the minimum viable population. The Tarangire lion area of Tanzania, has an
estimated 700? lions, but only *200 in protected areas with IUCN categories I–VI. The
rest are found in non-designated hunting areas that do not qualify towards stronghold
status.
Finally, only lion areas that are contained within LCUs having stable or increasing lion
population trends as per the IUCN (2006a, b) are lion strongholds. The single exception to
this rule is the Tsavo/Mkomazi lion area (Maasai Steppe LCU), which IUCN cites as
having decreasing numbers. However, while lion numbers are declining outside of pro-
tected areas, we believe that lions within the parks are usually well protected and in
sufficient numbers to meet the criteria. This criterion also has its uncertainties, for in some
parks—Kafue National Park in Zambia, for example—poaching of lion prey may be a
cause of concern for the lion’s long-term persistence. IUCN’s statement that the popula-
tions here are ‘‘stable’’ may be optimistic. Similarly, intense hunting outside protected
Biodivers Conserv
123
areas can also affect those populations within the reserves (Woodroffe and Ginsberg 1998).
These caveats accepted, the broad conclusions of our Table S1 remains: approximately
24,000 lions are in strongholds, about 4,000 in potential ones, but over 6,000 lions are in
populations that have a very high risk of local extinction.
Conservation implications
This is not the place to review management options for lions, the forces that threaten them,
or savannahs in general. We restrict our comments to issues that arise from the mapping
and assessments we have presented.
(1) Lion numbers have declined precipitously in the last century. Given that many now
live in small, isolated populations, this trend will continue. The situation in West
Africa is particularly dire, with no large population remaining and lions now absent
from many of the region’s national parks. Central Africa is different in that it has a
very large contiguous lion area centred in the Central Africa Republic. In view of
reported declines, it still does not qualify as a stronghold. Populations in these regions
are genetically distinct (Antunes et al. 2008; Bertola et al. 2011). Keeping these
populations from extinction will require conservation efforts well beyond the dismal
performance of the region’s other protected areas. (The World Conservation
Congress, 2012, issued a formal resolution Res 5.022, specifically supporting
mammal conservation initiatives in these regions, http://www.iucn.org/about/work/
programmes/global_policy/gpu_resources/gpu_res_recs/)
(2) Hunting areas are extensive, so the fate of lions depends on how well user-
communities manage them. The same principle applies to lions within protected
areas, with responsibility falling on protected area managers to secure these
populations. Finally, lions also occur well beyond protected areas, and how well one
manages lion-human conflict will determine persistence there. Yet, conflict outside
protected areas can affect lion persistence within (Woodroffe and Ginsberg 1998).
Good protection within a protected area is not sufficient if there is unrelenting killing
of lions outside it.
(3) Central Africa may have sizable lion and prey populations, but they are poorly
known, even by African standards.
(4) That said, independently verified census data, using statistically repeatable techniques
are the rare exception, not the rule, across even relatively well-studied East and
Southern Africa. The situation is particularly acute for Tanzania, which holds a large
fraction of the world’s lions.
(5) Repeated mapping of areas which have at least the potential for lions because of their
low human impacts may provide the only quantifiable measures of how savannah
Africa is shrinking from the lion’s viewpoint. This is necessary, but definitely not
sufficient. The lack of repeated, statistically credible lion counts, for well-defined
areas is a striking omission, one that must be rectified if we are to assess not only the
trends in lion numbers, but our success in reversing their declines.
Acknowledgments This project was supported by National Geographic Society’s Big Cats Initiative. Wewould like to thank those Interns who spent time digitizing parts of Africa: Corey Anco, Gina Angiolillo,Sam Baraso, Mike Barrett, Emily Buenger, Rachael Carnes, Megan Cattau, Jennifer Chin, Jessica Daniel,Jill Derwin, Kristana Erikson, Derek Fedak, Kristen Fedak, Colin Hutton, Emily Myron, Lisanne Petracca,Rachel Roberts, Stephanie Roe, Cooper Rosin, Victoria Shelus and Christopher Smith. We also acknowl-edge the support of Duke University’s Nicholas School of the Environment.
Biodivers Conserv
123
Open Access This article is distributed under the terms of the Creative Commons Attribution Licensewhich permits any use, distribution, and reproduction in any medium, provided the original author(s) and thesource are credited.
References
Adeney JM, Christensen NL, Pimm SL (2009) Reserves protect against deforestation fires in the Amazon.PLoS ONE. doi:10.1271/journal.pone.0005014
Antunes A, Troyer JL, Roelke ME, Pecon-Slattery J, Packer C et al (2008) The evolutionary dynamics of thelion Panthera leo revealed by host and viral population genomics. PLoS Genet 4. doi:10.1371/journal.pgen.1000251
Bauer H (2006) Synthesis of threats, distribution and status of the lion from the two lion conservationstrategies. In: Second Large Carnivore Workshop. CEDC, Maroua
Bauer H, Van Der Merwe S (2004) Inventory of free-ranging lions Panthera leo in Africa. Oryx 38:26–31Bauer H, De Iongh HH, Princee FPG, Ngantou D (2003) Research needs for lion conservation in West and
Central Africa. Comptes Rendus Biol 326:112–118Bauer H, Nowell K, Packer C (2008) Panthera leo. IUCN Red List of Threatened Species, version 2011.2
ed. http://www.iucnredlist.org/apps/redlist/details/15951/0. Accessed 12 Apr 2012Becker MS, Watson FGR, Droge E, Leigh K, Carlson RS, Carlson AA (2012). Estimating past and future
male loss in three Zambian lion populations. J Wild Manag. doi:10.1002/jwmg.446Bertola L, van Hooft W, Vrieling K, Uit de Weerd D, York D, de Iongh HH (2011) Genetic diversity,
evolutionary history and implications for conservation of the lion (Panthera leo) in West and CentralAfrica. J Biogeogr. doi:10.1111/j.1365-2699,2011.02500.x
Bjorklund M (2003) The risk of inbreeding due to habitat loss in the lion (Panthera leo). Conserv Genet4:515–523
Bond WJ, van Wilgen BW (1996) Fire and plants. Chapman and Hall, LondonCahoon DR Jr, Stocks BJ, Levine JS, Cofer WR III, O’Neill KP (1992) Seasonal distribution of African
savanna fires. Nature 359:812–815Chardonnet P (2002) Conservation of the African lion: contribution to a status survey. International
Foundation for the Conservation of Wildlife, FranceChardonnet P, Mesochina P, Bento C, Conjo D, Begg C et al (2009) Conservation status of the lion
(Panthera leo Linnaeus, 1758) in Mozambique. Maputo, MozambiqueCIESIN and CIAT (2005) Gridded Population of the World Version 3 (GPWv3): Population Density Grids.
Palisades, NY: Socioeconomic Data and Applications Center (SEDAC), Columbia University. http://sedac.ciesin.columbia.edu/gpw. Accessed 15 Feb 2011
Coe MJ, Cumming DH, Phillipson J (1976) Biomass and production of large African herbivores in relationto rainfall and primary production. Oecologia 22:341–354
Craigie ID, Baillie JEM, Balmford A, Carbone C, Collen B et al (2010) Large mammal population declinesin Africa’s protected areas. Biol Conserv 143:2221–2228
Davidson Z, Valeix M, Loveridge A, Madzikanda H, Macdonald D (2011) Socio-spatial behaviour of anAfrican lion population following perturbation by sport hunting. Biol Conserv 144(1):114–121
East R (1984) Rainfall, soil nutrient status and biomass of large African savanna mammals. Afr J Ecol22:245–270
ESA and UCLouvain (2010) The GlobCover 2009 Project. http://dup.esrin.esa.it/globcover/. Accessed 15Feb 2011
Ferreira SM, Funston PJ (2010) Estimating lion population variables: prey and disease effects in KrugerNational Park, South Africa. Wildl Res 37:194–206
Hayward MW, O’Brien J, Kerley GIH (2007) Carrying capacity of large African predators: predictions andtests. Biol Conserv 139:219–229
Henschel P (2009) The status and conservation of leopards and other large carnivores in the Congo Basin,and the potential role of reintroduction. In: Hayward MW, Somers M (eds) Reintroduction of top-orderpredators. Blackwell Publishing, Oxford, pp 206–237
Henschel P, Azani D, Burton C, Malanda G, Saidu Y et al (2010) Lion status updates from five rangecountries in West and Central Africa. Cat News 52:34–39
Hickey V, Pimm SL (2011) How the World Bank funds protected areas. Conserv Lett 4(4):269–277
Biodivers Conserv
123
Hijmans RJ, Cameron SE, Parra JL, Jones PG, Jarvis A (2005) Very high resolution interpolated climatesurfaces for global land areas. Int J Climatol 25:1965–1978
IUCN (2006a) Regional conservation strategy for the lion Panthera leo in Eastern and Southern Africa.IUCN SSC Cat Specialist Group, Yaounde
IUCN (2006b) Conservation strategy for the lion in West and Central Africa. IUCN SSC Cat SpecialistGroup, Yaounde
IUCN and WDPA (2010) The World Database on Protected Areas (WDPA). UNEP-WCMC. Cambridge.www.protectedplanet.net
Jenkins CN, Joppa L (2009) Expansion of the global terrestrial protected area system. Biol Conserv142:2166–2174
Joppa LN, Loarie SR, Pimm SL (2008) On the protection of ‘‘protected areas’’. Proc Natl Acad Sci USA105:6673–6678
Lindsey P, Alexander R, Frank L, Mathieson A, Romanach S (2006) Potential of trophy hunting to createincentives for wildlife conservation in Africa where alternative wildlife-based land uses may not beviable. Anim Conserv 9:283–298
Loveridge A, Searle A, Murindagomo F, Macdonald D (2007) The impact of sport-hunting on the popu-lation dynamics of an African lion population in a protected area. Biol Conserv 134:548–558
Mesochina P, Mamang-Kanga J, Chardonnet P, Mandjo Y, Yagueme M (2010a) Statut de conservation dulion (Panthera leo Linnaeus, 1758) en Republique Centrafricaine, Bangui
Mesochina P, Mbangwa O, Chardonnet P, Mosha R, Mtui B et al (2010b) Conservation status of the lion(Panthera leo Linnaeus, 1758) in Tanzania, Paris
Mesochina P, Sefu L, Sichali E, Chardonnet P, Ngalande J et al (2010c) Conservation status of the lion(Panthera leo Linnaeus, 1758) in Malawi, Paris
Packer C, Kosmala M, Cooley H, Brink H, Pintea L et al (2009) Sport hunting, predator control andconservation of large carnivores. PLoS ONE. doi:10.1371/journal.pone.000594
Pellerin M, Kidjo F, Tehou A, Sogbohossou EA, Ayegnon D et al (2009) Statut de conservation du lion(Panthera leo Linnaeus, 1758) au Benin, Cotonou
Pimm SL (2001) The world according to Pimm: a scientist audits the earth. McGraw-Hill Professional, NewYork
Ratnam J, Bond WJ, Fensham RJ, Hoffmann WA, Archibald S, Lehmann CER, Anderson MT, Higgins SI,Sankaran M (2011) When is a ‘forest’ a savanna, and why does it matter? Glob Ecol Biogeogr20:653–660
Renaud PC (2006) Aerial & terrestrial inventory of the wildlife and mounting pressures in the National Parkof Niokolo Koba. Niokolo Koba National Park, Senegal
Sanderson EW, Redford KH, Chetkiewicz CLB, Medellin RA, Rabinowitz AR et al (2002) Planning to savea species: the jaguar as a model. Conserv Biol 16:58–72
Sankaran M, Hanan NP, Scholes RJ, Ratnam J et al (2005) Determinants of woody cover in Africansavannas. Nature 438:846–849
Staver AC, Archibald S, Levin SA (2011) The global extent and determinants of savanna and forest asalternative biome states. Science 334:230–232
Treves A, Plumptre AJ, Hunter LTB, Ziwa J (2009) Identifying a potential lion Panthera leo stronghold inQueen Elizabeth National Park, Uganda, and Parc National des Virunga, Democratic Republic ofCongo. Oryx 43:60–66
van Orsdol KG, Hanby JP, Bygott JD (1985) Ecological correlates of lion social organisation (Panthera leo).J Zool 206:97–112
Woodroffe R (2000) Predators and people: using human densities to interpret declines of large carnivores.Anim Conserv 3:165–173
Woodroffe R, Ginsberg J (1998) Edge effects and the extinction of populations inside protected areas. Sci280:2126–2128
Yamazaki K (1996) Social variation of lions in a male-depopulated area in Zambia. J Wildl Manag60(3):490–497
Biodivers Conserv
123