Embed Size (px)
Citation preview

THE SOCIAL ACCEPTABILITY OF THE PHYSICAL INTERNET:
The unforeseen challenge?
Yan CIMONCIRRELT
Faculty of Business AdministrationUniversité Laval
3rd Int’l Physical Internet ConferenceJune 29th, 2016

HITTING A WALL?Source: NHTSA
TODAY
• The global context is evolving• About CSR• Methods• Beyond certification• Macro-level considerations• Micro-level considerations• Conclusion and implications
3
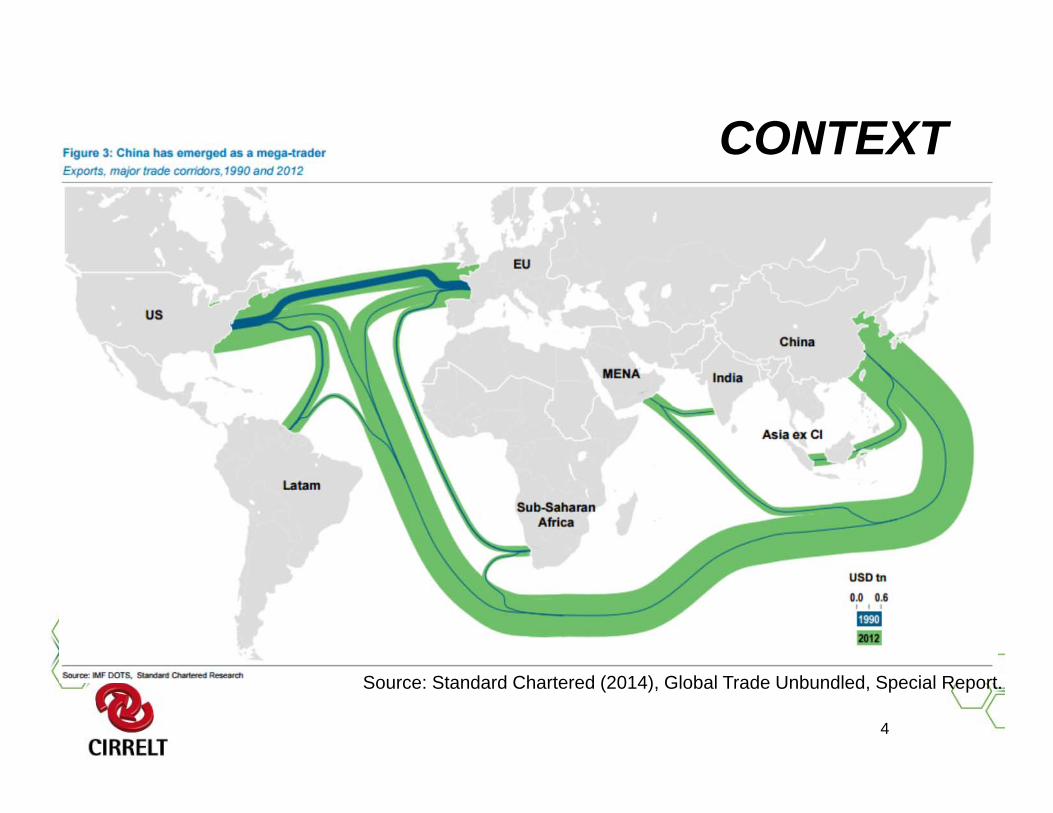
CONTEXT
4
Source: Standard Chartered (2014), Global Trade Unbundled, Special Report.
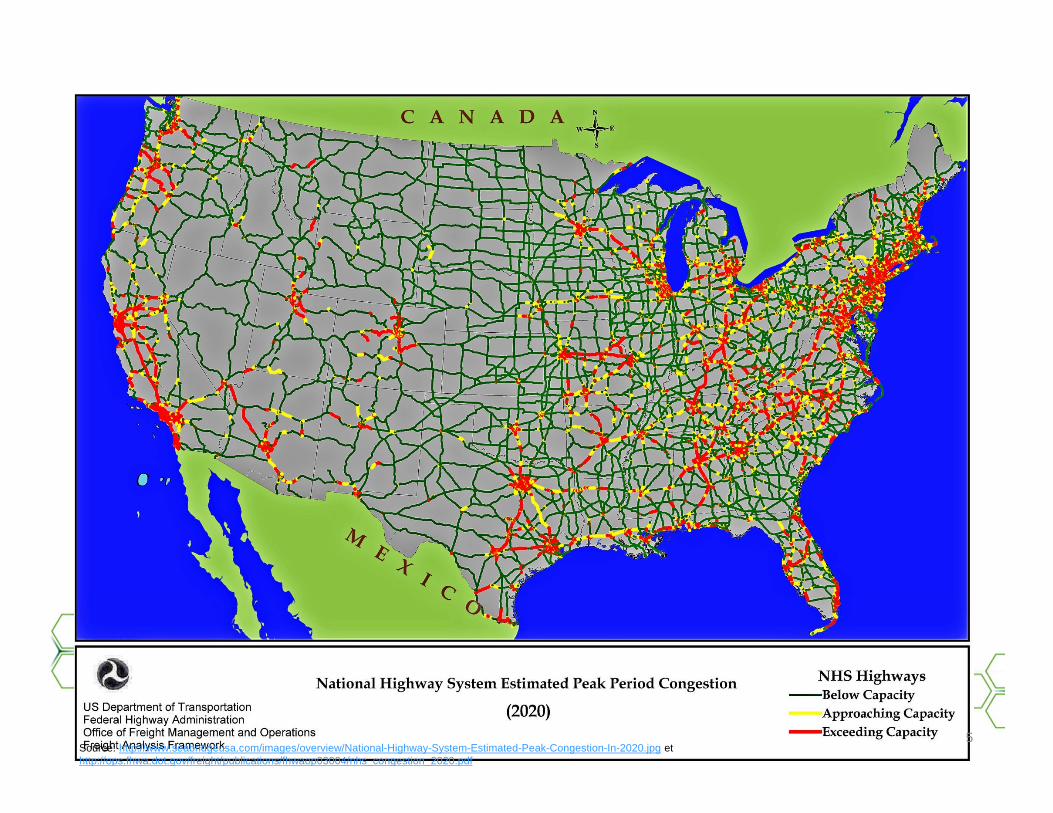
5Source: http://www.seabridgeusa.com/images/overview/National-Highway-System-Estimated-Peak-Congestion-In-2020.jpg et http://ops.fhwa.dot.gov/freight/publications/fhwaop03004/nhs_congestion_2020.pdf

CSR• Doing the right thing vs. doing things right
• A classical dilemma: o Ethical vs. legal
• Impacts ALL industries
• Differentiated reactions of the public:o Larger projects: NIMBYo Individual repercussions: Credit Card Contracts
• Certificationo Cost of doing business vs tool to add valueo A marketing fad? (e.g. fair trade/carbon offsets)
• NOTE: your company policies matter!!!
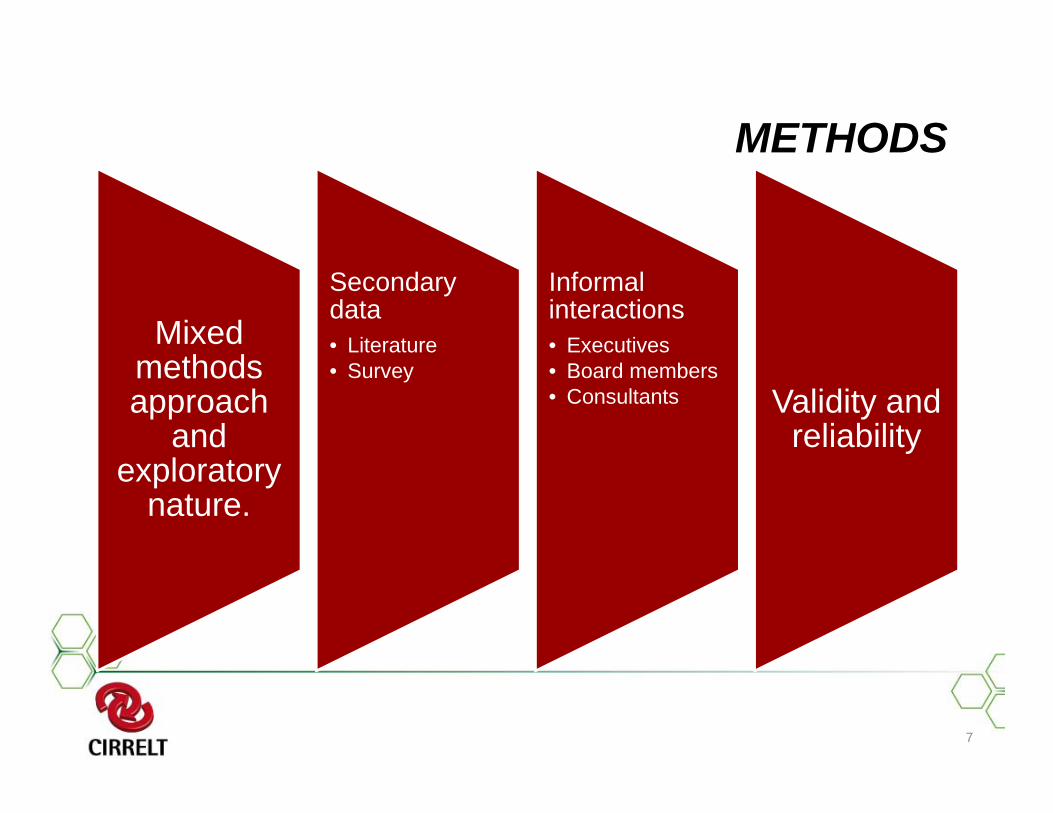
METHODS
Mixed methods approach
and exploratory
nature.
Secondary data • Literature• Survey
Informal interactions• Executives• Board members• Consultants Validity and
reliability
7
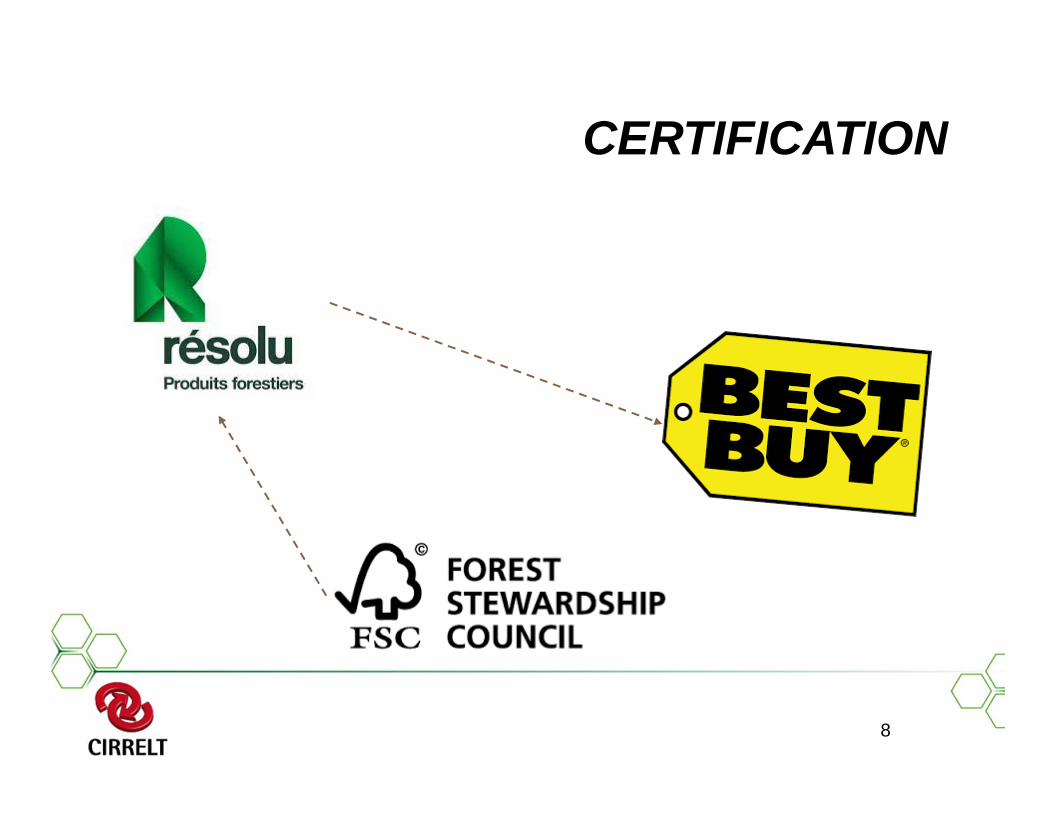
CERTIFICATION
8
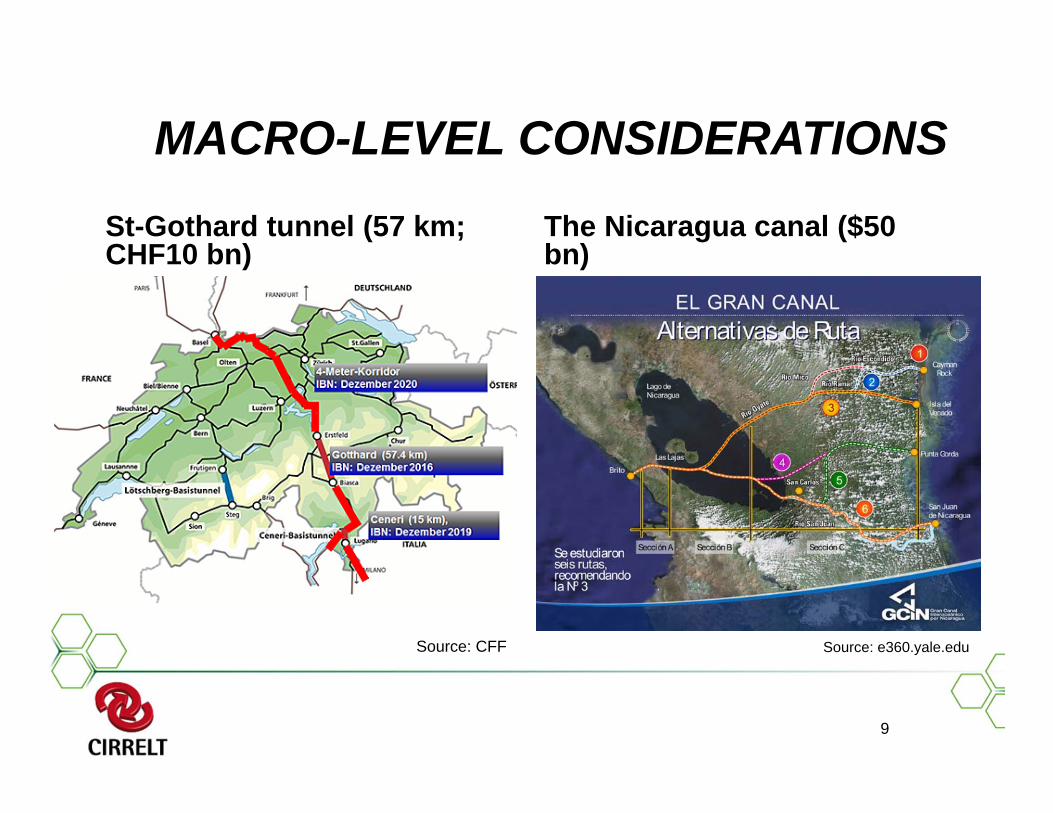
MACRO-LEVEL CONSIDERATIONSSt-Gothard tunnel (57 km; CHF10 bn)
The Nicaragua canal ($50 bn)
9
Source: e360.yale.eduSource: CFF

MICRO-LEVEL CONSIDERATIONS
1. The Defence Ethics Program (Canada):
2. The Mining Industry: Polaris Materials: http://www.polarmin.com/index.php
YC1

Slide 10
YC1 YAN CIMON, 6/20/2014
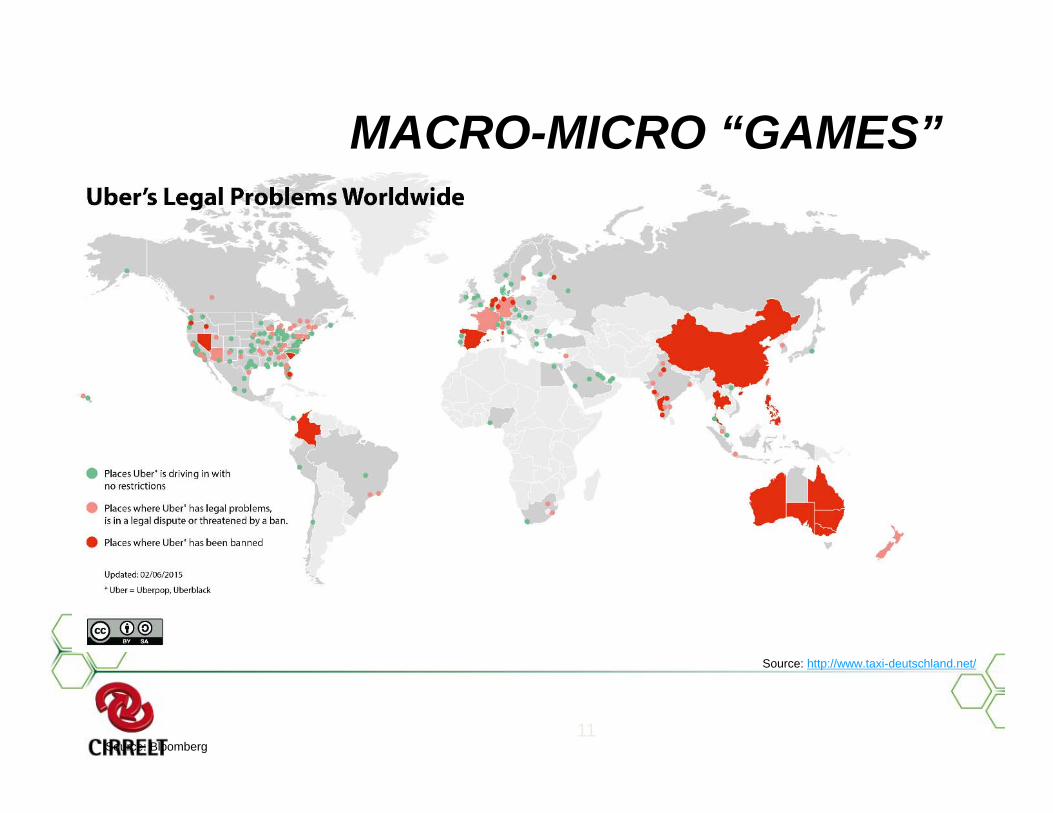
MACRO-MICRO “GAMES”
11
Source: http://www.taxi-deutschland.net/
Source: Bloomberg
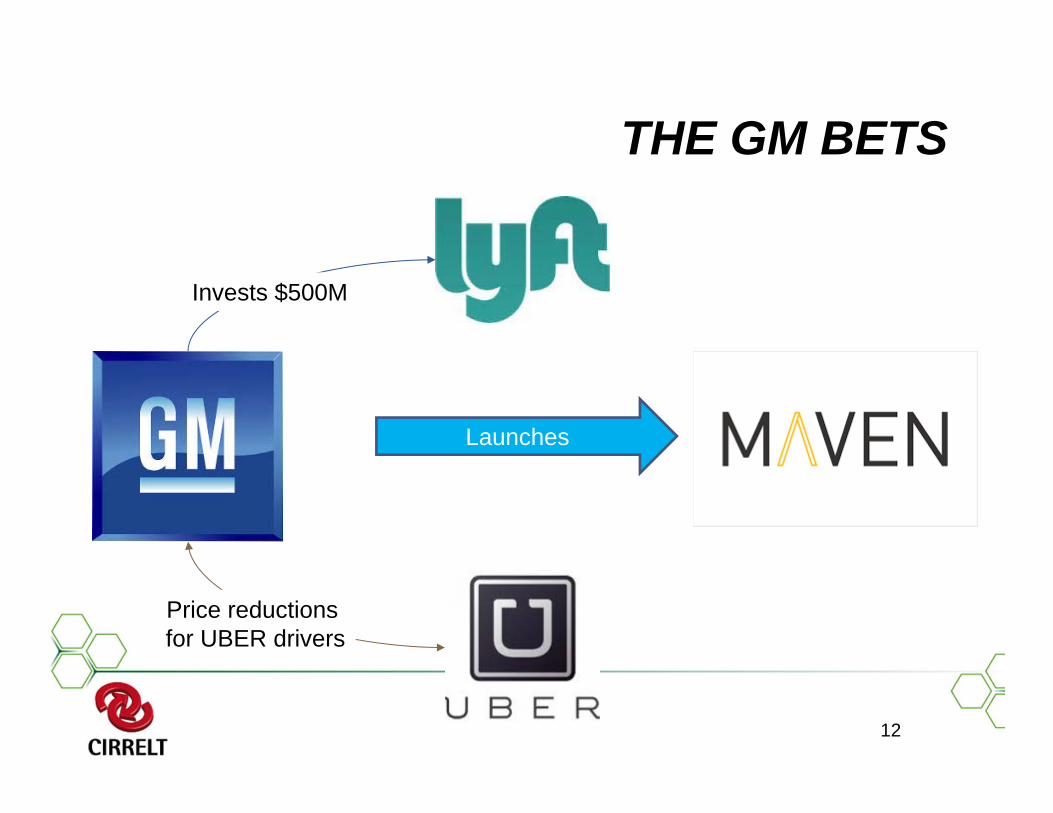
THE GM BETS
12
Invests $500M
Price reductionsfor UBER drivers
Launches
13
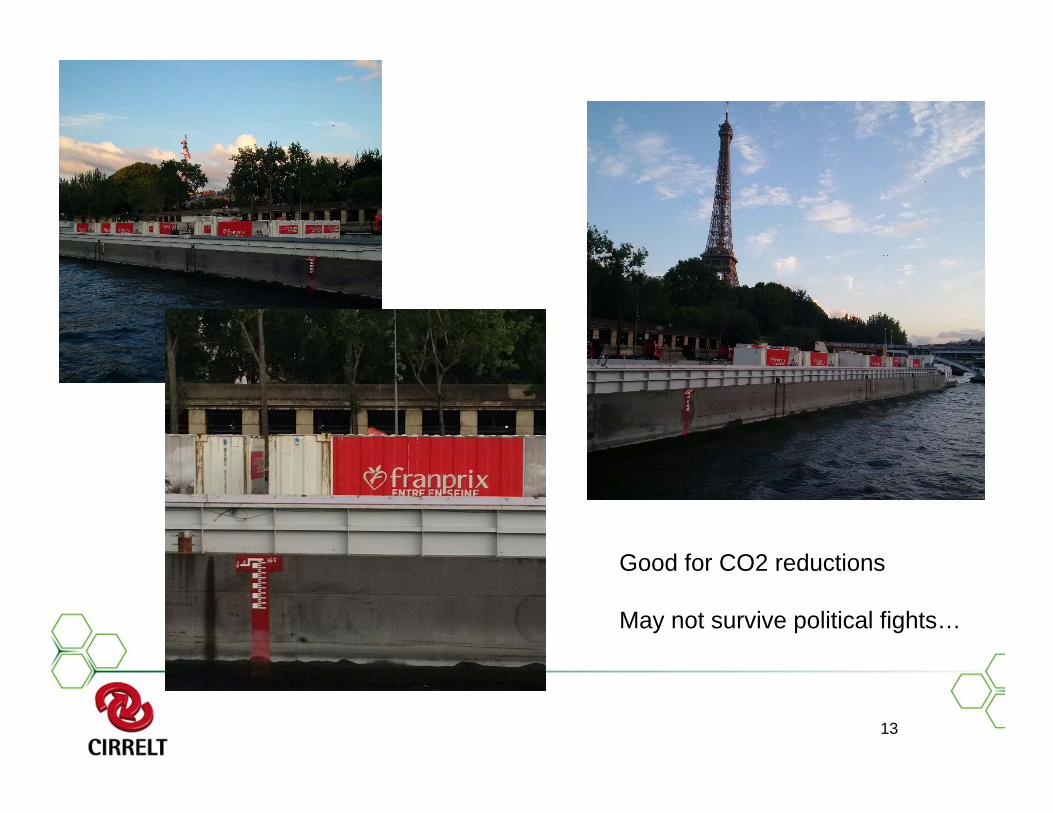
Good for CO2 reductions
May not survive political fights…
CONCLUSION
• Proposition 1: Certifications have an impact on the perception of CSR involvement o Signalling theory
• Proposition 2: Macro-level issues are better shaped in long-run discourse
• Proposition 3: Micro-level issues are better shaped through extensive fieldwork

IMPLICATIONS
Academics…• …will need to measure and
model the impact of CSR on the PI
Practitioners from the « real world »…• …will need new « science-
based tools » whenimplementing the PI
15Source: www.vkmaheshwari.com
Antecedents of the Physical Internet: A Cross‐Country Analysis of
Transportation Volume Change
Namchul Shin, Pace University, New York, USAHorst Treiblmaier, University of Applied Sciences Upper Austria
The 3rd International Physical Internet ConferenceAtlanta, GA
June 29‐July 1, 2016
Research Motivations
• The recent development of the Physical Internet (PI) enables transportation and logistics to be more efficient.
• The question arises whether it may have a varying impact on countries’ economic performance.
• Thus, it is crucial to understand the drivers of transportation volume in the first place.
• Limited previous research on the PI: simulations and case studies• Empirical research on relevant drivers and enablers is needed
• From the viewpoint of innovation diffusion• Research on the diffusion of transportation technologies
Research Objectives
• A country‐level analysis of the determinants of growth of transportation volume by employing data collected from 28 European countries for the 10 year period of 2004‐2013 from two data sources: (1) Eurostat and (2) World Bank.
• Focuses on two modes of transportation technologies: water transport and road transport.
• By examining factors influencing countries’ growth of transport volumes, we extend the general framework of the Physical Internet, explicitly taking factors into account which in most cases cannot be directly influenced by logistics decision makers.
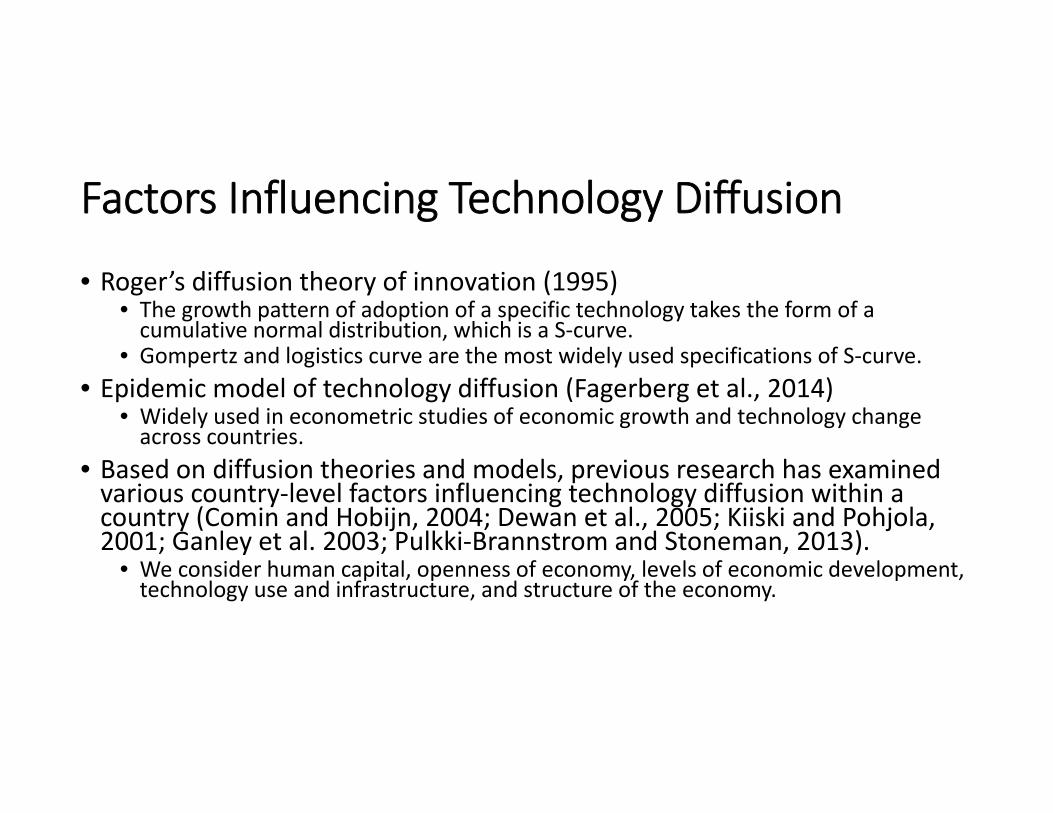
Factors Influencing Technology Diffusion
• Roger’s diffusion theory of innovation (1995)• The growth pattern of adoption of a specific technology takes the form of a cumulative normal distribution, which is a S‐curve.
• Gompertz and logistics curve are the most widely used specifications of S‐curve.• Epidemic model of technology diffusion (Fagerberg et al., 2014)
• Widely used in econometric studies of economic growth and technology change across countries.
• Based on diffusion theories and models, previous research has examined various country‐level factors influencing technology diffusion within a country (Comin and Hobijn, 2004; Dewan et al., 2005; Kiiski and Pohjola, 2001; Ganley et al. 2003; Pulkki‐Brannstrom and Stoneman, 2013).
• We consider human capital, openness of economy, levels of economic development, technology use and infrastructure, and structure of the economy.
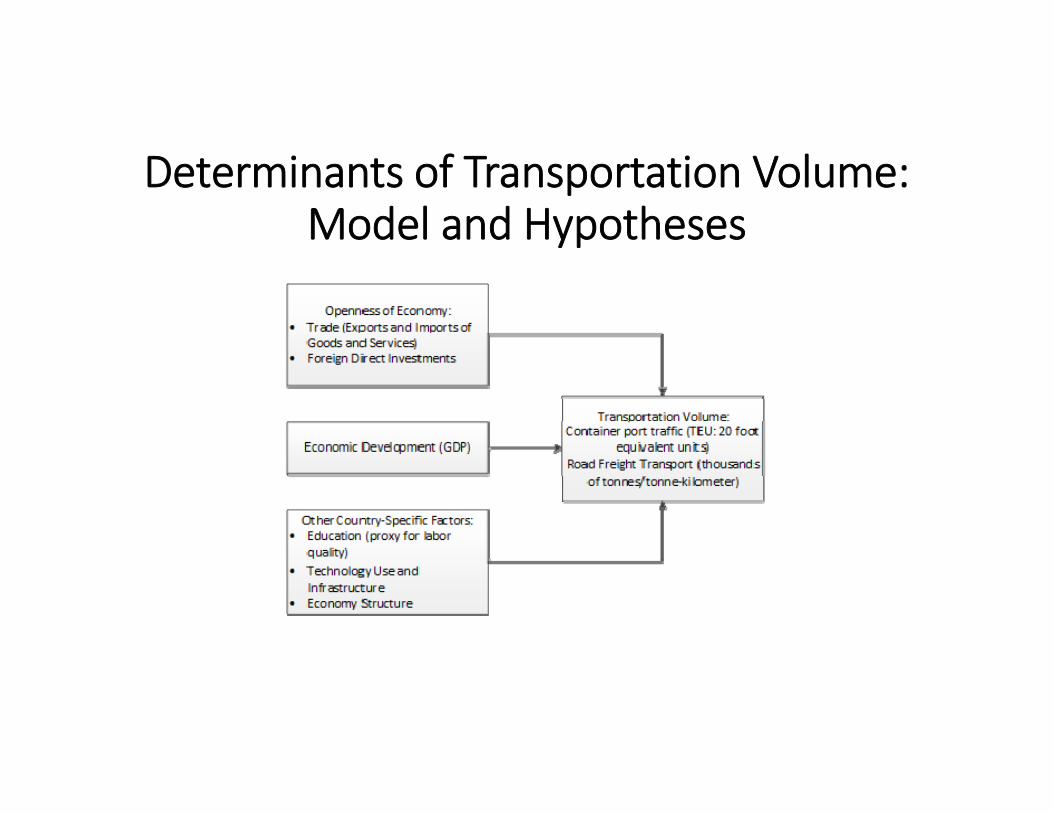
Determinants of Transportation Volume: Model and Hypotheses
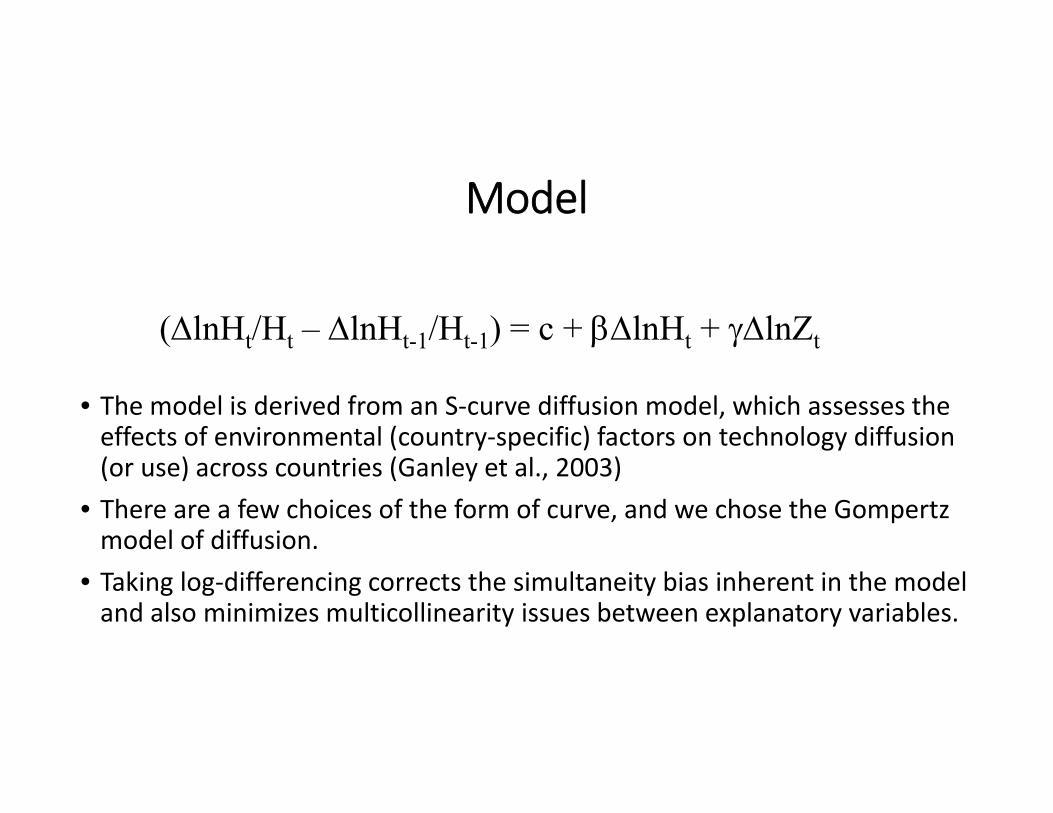
Model
(lnHt/Ht – lnHt-1/Ht-1) = c + lnHt + lnZt
• The model is derived from an S‐curve diffusion model, which assesses the effects of environmental (country‐specific) factors on technology diffusion (or use) across countries (Ganley et al., 2003)
• There are a few choices of the form of curve, and we chose the Gompertz model of diffusion.
• Taking log‐differencing corrects the simultaneity bias inherent in the model and also minimizes multicollinearity issues between explanatory variables.
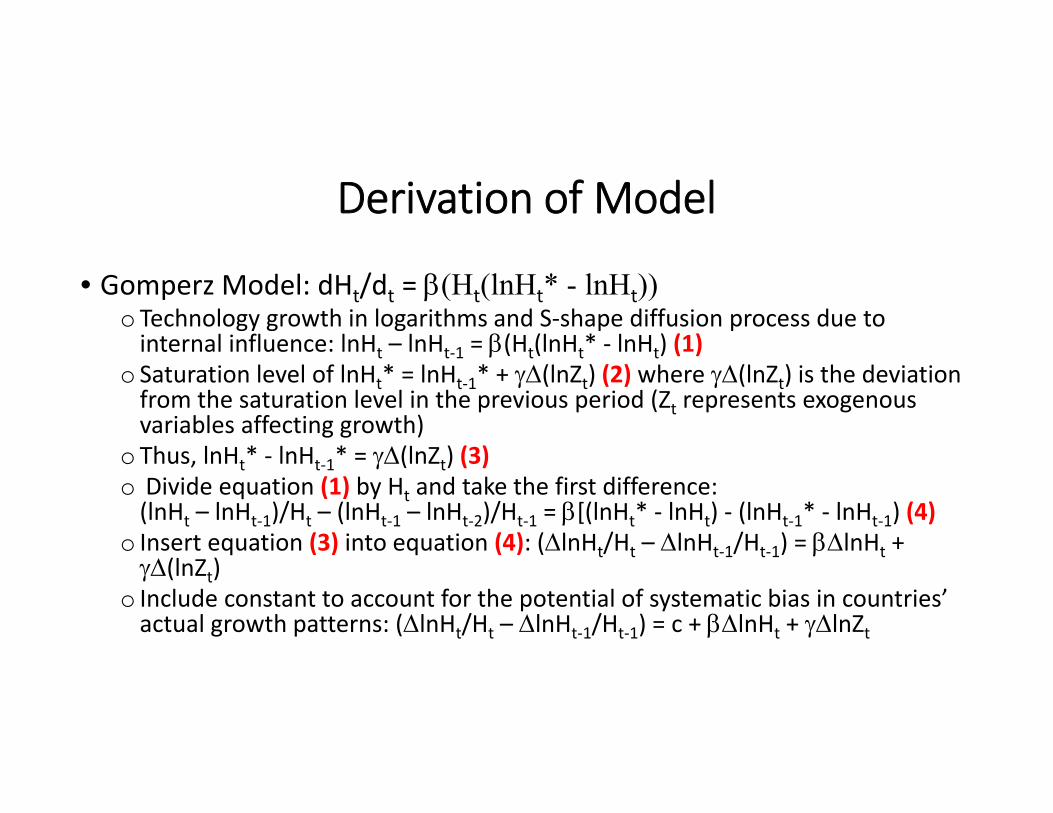
Derivation of Model
• Gomperz Model: dHt/dt = (Ht(lnHt* - lnHt))o Technology growth in logarithms and S‐shape diffusion process due to internal influence: lnHt – lnHt‐1 = (Ht(lnHt* ‐ lnHt) (1)
o Saturation level of lnHt* = lnHt‐1* + (lnZt) (2) where (lnZt) is the deviation from the saturation level in the previous period (Zt represents exogenous variables affecting growth)
o Thus, lnHt* ‐ lnHt‐1* = (lnZt) (3)o Divide equation (1) by Ht and take the first difference: (lnHt – lnHt‐1)/Ht – (lnHt‐1 – lnHt‐2)/Ht‐1 = [(lnHt* ‐ lnHt) ‐ (lnHt‐1* ‐ lnHt‐1) (4)
o Insert equation (3) into equation (4): (lnHt/Ht – lnHt‐1/Ht‐1) = lnHt + (lnZt)
o Include constant to account for the potential of systematic bias in countries’ actual growth patterns: (lnHt/Ht – lnHt‐1/Ht‐1) = c + lnHt + lnZt
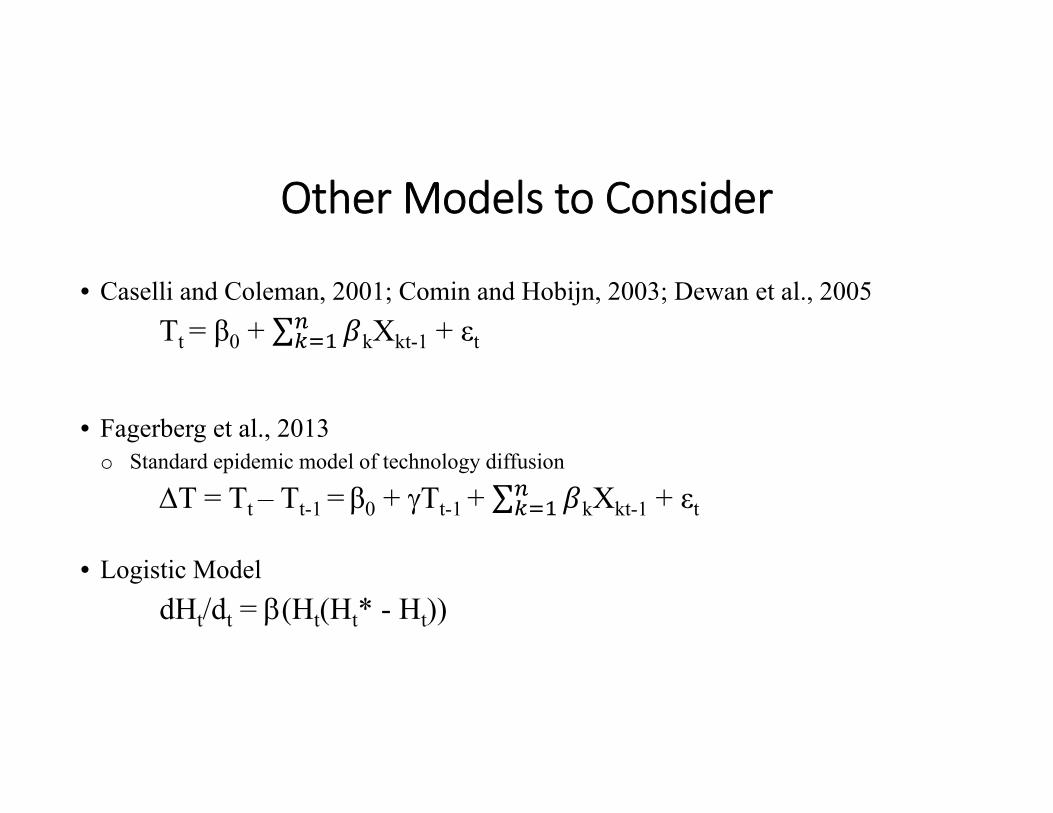
Other Models to Consider
• Caselli and Coleman, 2001; Comin and Hobijn, 2003; Dewan et al., 2005Tt = β0 + ∑ kXkt-1 + εt
• Fagerberg et al., 2013o Standard epidemic model of technology diffusion
T = Tt – Tt-1 = β0 + Tt-1 + ∑ kXkt-1 + εt
• Logistic ModeldHt/dt = (Ht(Ht* - Ht))
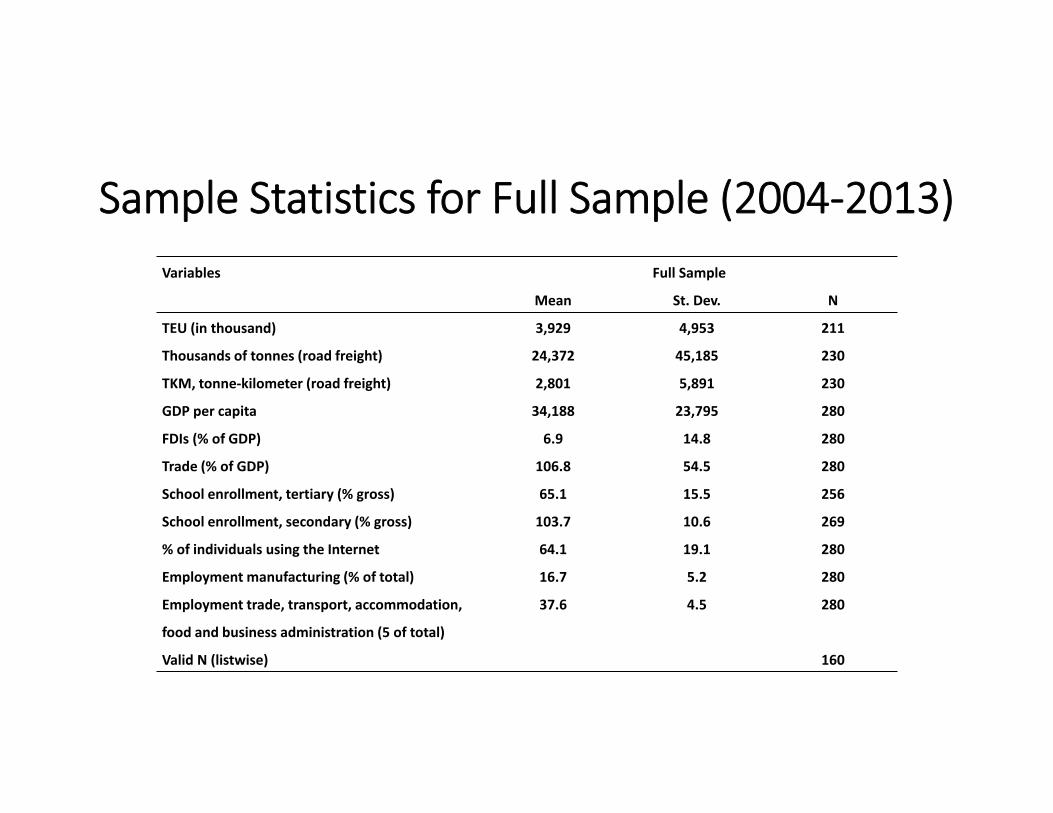
Sample Statistics for Full Sample (2004‐2013)Variables Full Sample
Mean St. Dev. N
TEU (in thousand)
Thousands of tonnes (road freight)
TKM, tonne‐kilometer (road freight)
GDP per capita
FDIs (% of GDP)
Trade (% of GDP)
School enrollment, tertiary (% gross)
School enrollment, secondary (% gross)
% of individuals using the Internet
Employment manufacturing (% of total)
Employment trade, transport, accommodation,
food and business administration (5 of total)
Valid N (listwise)
3,929
24,372
2,801
34,188
6.9
106.8
65.1
103.7
64.1
16.7
37.6
4,953
45,185
5,891
23,795
14.8
54.5
15.5
10.6
19.1
5.2
4.5
211
230
230
280
280
280
256
269
280
280
280
160
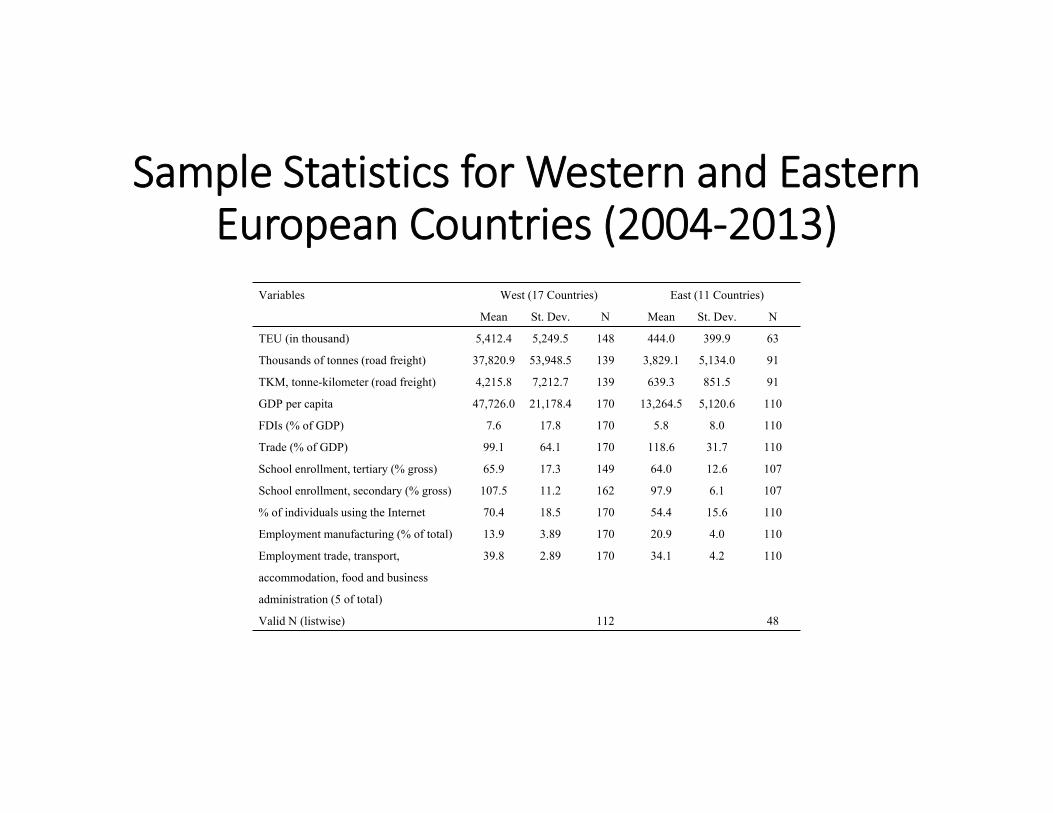
Sample Statistics for Western and Eastern European Countries (2004‐2013)
Variables West (17 Countries) East (11 Countries)
Mean St. Dev. N Mean St. Dev. N
TEU (in thousand)
Thousands of tonnes (road freight)
TKM, tonne-kilometer (road freight)
GDP per capita
FDIs (% of GDP)
Trade (% of GDP)
School enrollment, tertiary (% gross)
School enrollment, secondary (% gross)
% of individuals using the Internet
Employment manufacturing (% of total)
Employment trade, transport,
accommodation, food and business
administration (5 of total)
Valid N (listwise)
5,412.4
37,820.9
4,215.8
47,726.0
7.6
99.1
65.9
107.5
70.4
13.9
39.8
5,249.5
53,948.5
7,212.7
21,178.4
17.8
64.1
17.3
11.2
18.5
3.89
2.89
148
139
139
170
170
170
149
162
170
170
170
112
444.0
3,829.1
639.3
13,264.5
5.8
118.6
64.0
97.9
54.4
20.9
34.1
399.9
5,134.0
851.5
5,120.6
8.0
31.7
12.6
6.1
15.6
4.0
4.2
63
91
91
110
110
110
107
107
110
110
110
48
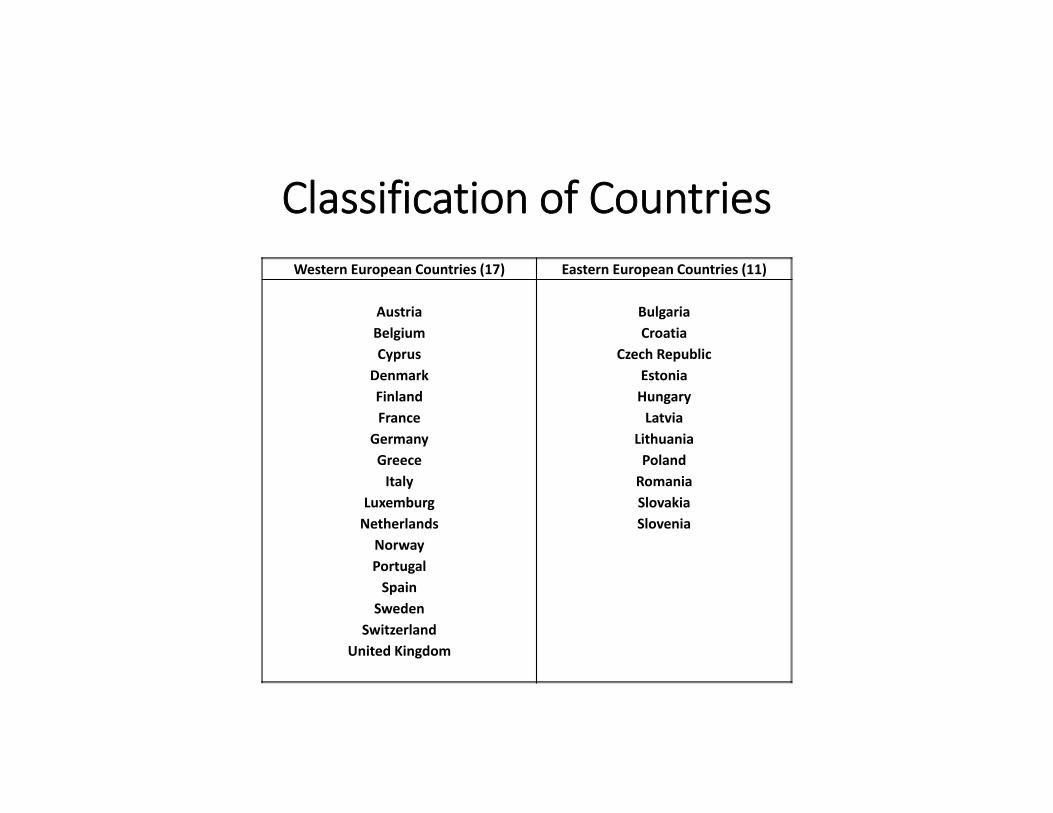
Classification of CountriesWestern European Countries (17) Eastern European Countries (11)
AustriaBelgiumCyprusDenmarkFinlandFrance
GermanyGreeceItaly
LuxemburgNetherlandsNorwayPortugalSpainSweden
SwitzerlandUnited Kingdom
BulgariaCroatia
Czech RepublicEstoniaHungaryLatvia
LithuaniaPolandRomaniaSlovakiaSlovenia
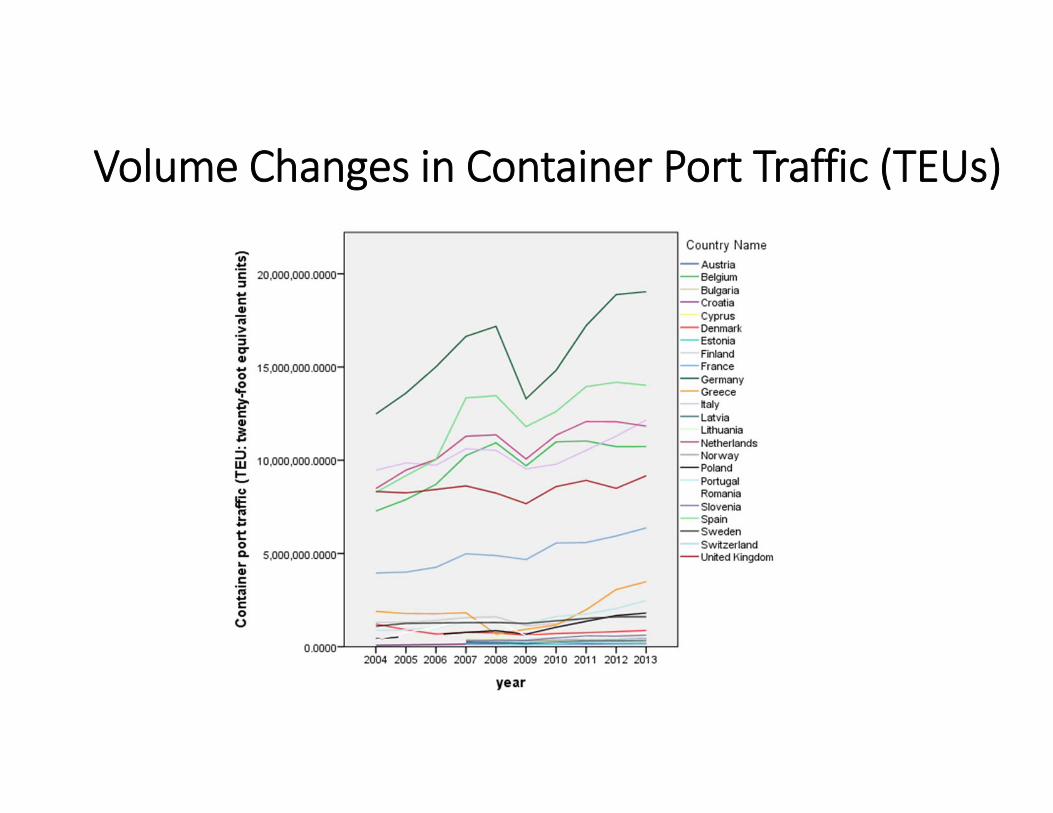
Volume Changes in Container Port Traffic (TEUs)

Volume Changes in Container Port Traffic (TEUs)
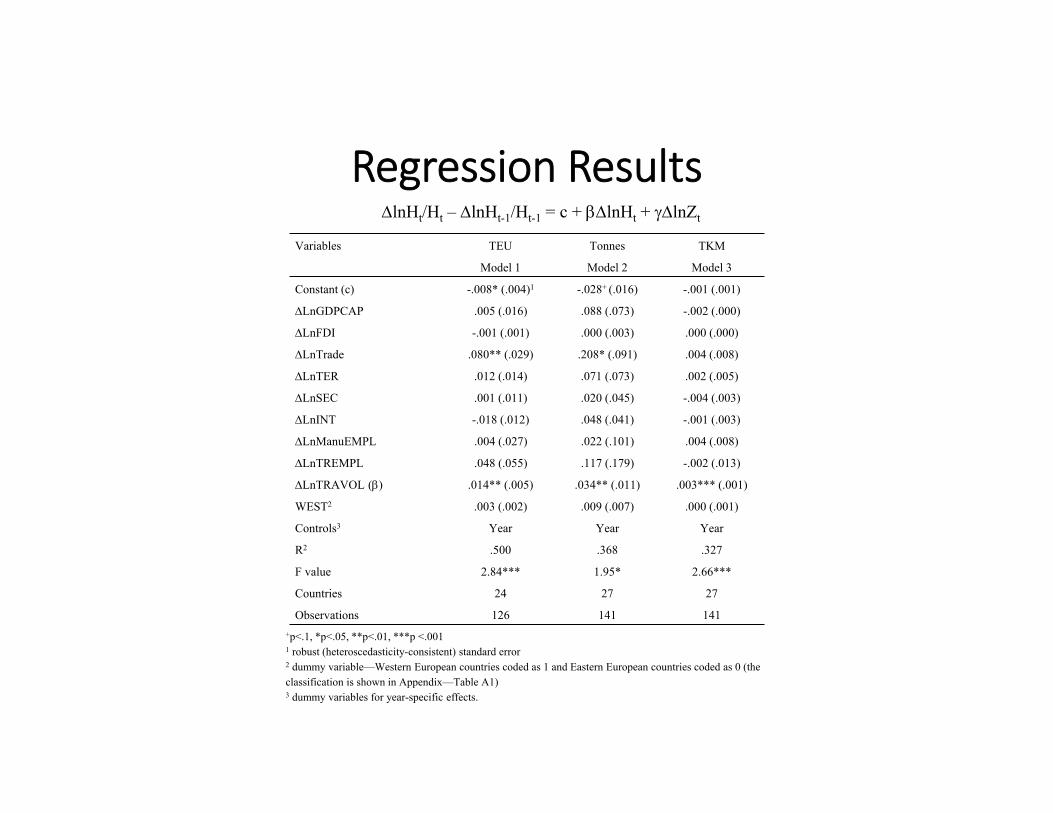
Regression Results
+p<.1, *p<.05, **p<.01, ***p <.0011 robust (heteroscedasticity-consistent) standard error2 dummy variable—Western European countries coded as 1 and Eastern European countries coded as 0 (the classification is shown in Appendix—Table A1)3 dummy variables for year-specific effects.
lnHt/Ht – lnHt-1/Ht-1 = c + lnHt + lnZt
Variables TEU
Model 1
Tonnes
Model 2
TKM
Model 3
Constant (c) -.008* (.004)1 -.028+ (.016) -.001 (.001)
LnGDPCAP .005 (.016) .088 (.073) -.002 (.000)
LnFDI -.001 (.001) .000 (.003) .000 (.000)
LnTrade .080** (.029) .208* (.091) .004 (.008)
LnTER .012 (.014) .071 (.073) .002 (.005)
LnSEC .001 (.011) .020 (.045) -.004 (.003)
LnINT -.018 (.012) .048 (.041) -.001 (.003)
LnManuEMPL .004 (.027) .022 (.101) .004 (.008)
LnTREMPL .048 (.055) .117 (.179) -.002 (.013)
LnTRAVOL () .014** (.005) .034** (.011) .003*** (.001)
WEST2 .003 (.002) .009 (.007) .000 (.001)
Controls3
R2
Year
.500
Year
.368
Year
.327
F value 2.84*** 1.95* 2.66***
Countries 24 27 27
Observations 126 141 141
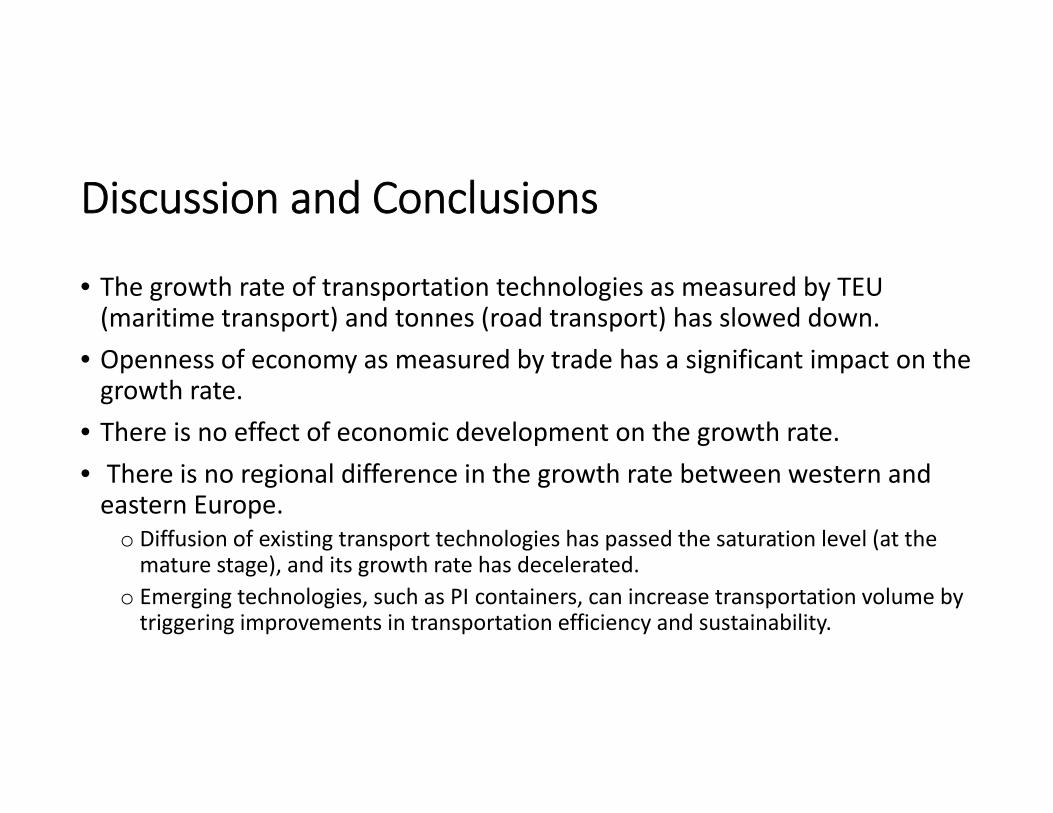
Discussion and Conclusions
• The growth rate of transportation technologies as measured by TEU (maritime transport) and tonnes (road transport) has slowed down.
• Openness of economy as measured by trade has a significant impact on the growth rate.
• There is no effect of economic development on the growth rate.• There is no regional difference in the growth rate between western and eastern Europe.
o Diffusion of existing transport technologies has passed the saturation level (at the mature stage), and its growth rate has decelerated.
o Emerging technologies, such as PI containers, can increase transportation volume by triggering improvements in transportation efficiency and sustainability.
Discussion and Conclusions
• Dawn of the Physical Internet• Several European companies are currently experimenting with the use of the PI, but these trials are in an early stage.
• A critical mass of users is essential for its diffusion• Recognition of it value (benefits/costs) and government subsidies and incentives
Contributions
• We highlight the close relationship between country‐specific factors and the growth of transport volume, as measured by the flow of containers in standard TEUs and road freight transported in thousands of tonnes and TKM, both of which are antecedents of the PI.
• This research extends the general framework of the Physical Internet by explicitly taking country factors into account which in most cases cannot be directly influenced by logistics decision makers.
o While the Physical Internet constitutes a powerful paradigm for a change toward a more sustainable and efficient way of doing logistics (Montreuil, 2011), only a handful of simulations and case studies exist (Ballot et al., 2014).
• This research integrates a macroeconomic perspective into the overall Physical Internet framework.

Questions?