Embed Size (px)
Citation preview
Behav Ecol Sociobiol (1985) 17:123 134 Behavioral Ecology and Sociobiology �9 Springer-Verlag 1985
The social organization of the common vampire bat H. Mating system, genetic structure, and relatedness
Gerald S. Wilkinson* Department of Biology, C-016, University of California at San Diego, La Jolla, California 92093, USA
Received April 27, 1984 / Accepted October 20, 1984
Summary. Variability at seven polymorphic allo- zyme loci and observations of dispersal and mating provide evidence for nonrandom genetic structure among adult female groups of the highly social bat, Desmodus rotundus. The average degree of re- latedness, estimated by allelic correlations at each locus, within three and six groups of females is 0.018 (SE=0.013) and 0.032 (SE--0.023), respec- tively. Even though these estimates do not differ significantly from zero, a multivariate analysis of variance of individual allele frequencies reveals that three of six pairwise comparisons of groups reach significance. This genetic heterogeneity with- in a population does not lead to increased genetic subdivision between populations. Mean classifica- tory ability of the discriminant functions drops from 84% for assignment to group to 56% for assignment to population. This pattern of genetic variability is due to recruitment of female offspring into their natal groups and forced male dispersal. Occasional movements of unrelated females be- tween groups lead to the formation of multiple matrilines within groups. Although males fight vi- ciously for access to the top of preferred female roosting sites and top males mate preferentially with females in that roost, mean maximum pater- nity for top males is only 46%. Consequently, male mating success is sufficiently random to maintain gametic equilibria among all pairs of loci. Given an infant mortality of 54%, mean male tenure of 17 months, and a birth interval of 10 months, fe- males are unlikely to be related through common male ancestors. In one group, the average degree of relatedness, derived from matrilineal pedigrees, is 0.11 (SD = 0.17). Computer simulations of the growth of a group of female D. routundus show that the low level of relatedness within groups is expected even if the proportion of unrelated fe-
* Present address: Institute for Behavioral Genetics, Campus Box 447, University of Colorado, Boulder, Colorado 80309, USA
males allowed into a group decreases. This pattern holds for any animal which recruits one sex into its social group and has relatively high juvenile mortality followed by low adult mortality.
Introduction
A number of theoretical studies (Hamilton 1964; Boorman and Levitt 1980; Wade 1980; Brown et al. 1982; Eshel and Cavalli-Sforza (1982) have shown that some form of genetic subdivision, ei- ther physically or socially defined, is necessary for an altruistic trait to increase in frequency. This is true whether the proposed evolutionary process is reciprocity, nepotism, or group selection. In other words, individuals predisposed to altruism must preferentially interact with other altruists for the trait to spread and also for it to persist at equilibrium (Boyd and Richardson 1980). Genetic information has now been collected from enough social animals to examine the relationship between genetic subdivision and atruistic behavior.
Recent reports on several social insects estimate that within colonies ,of some ants (Craig and Cro- zier 1979; Pamilo 1981, 1982, 1983; Pamilo and Varvio-Aho 1979; Pearson 1982; Ward 1983) and wasps (Metcalf and Whitt 1977; Lester and Se- lander 1981) average relatedness is often relatively high (r > 0.25). Pamilo (1982, 1983) has shown that high levels of intranest relatedness in Formica ants contribute to genetic differentiation between colo- nies. Studies on yellow-bellied marmots (Schwartz and Armitage 1980) and rhesus macaques (Olivier et al. 1981) describe genetic differentiation of simi- lar magnitude, 0.1>Fst>0.05 (Wright 1978), to that observed by Pamilo (1983), even though aver- age relatedness within these social mammal groups is generally much lower than among haplo-diploid social insects. Furthermore, despite evidence for communal nursing in two highly polygynous mam-
124
mals, black-tailed prairie dogs (Hoogland 1983) and greater spear-nosed bats (personal observa- tion), female groups from these two species show contrastingly different genetic structures. Prairie dog groups contain close relatives and exhibit marked genetic differentiation, Fst=0.23 (Chesser 1983), while the bat groups are composed of unre- lated females (McCracken and Bradbury 1977, 1981) with random genetic structure, Fst=0.01 (McCracken, personal communication). Thus, any necessary relationship between population subdivi- sion and the expression of altruism is not yet obvi- ous.
Rather than attempt to infer the mechanism of social evolution (i.e. reciprocity, kin selection, or group selection) from genetic structure, in this paper I quantify and explain genetic variability in a social mammal, the common vampire bat (Des- modus rotundus), for which there is independent evidence for reciprocity (Wilkinson 1984). In the first paper (Wilkinson 1985). I documented that groups of adult female vampire bats can be defined on the basis of sharing a common set of roosts. Some females within these groups form long-last- ing associations and donate blood to roostmates by regurgitation. This behavior is not restricted to mothers feeding offspring, as sharing blood from a single wound site appears to be, but also occurs among both related and unrelated bats within the female group (Wilkinson 1984). The question I address here is whether or not genetic heterogeneity occurs in this species, as a cause or result, of its social behavior.
To examine genetic structure among female groups, I compute F~t and test for allelic hetero- geneity with the G statistic (Sokal and Rohlf 1981) using electrophoretically detectable variation at seven blood enzymes. Differences between pairs of groups and populations are measured with multi- variate analyses of variance. The cause of detect- able structure in terms of average relatedness of individuals within a group is determined in two ways. First, I use the method of Pamilo (1984) and Stanton (1960) to estimate the allelic correla- tion (an estimate of the average symmetrical degree of relatedness) within all groups at each locus. Sec- ond, I use path analysis (Wright 1968) to estimate the average degree of relatedness in one group for which I was able to ascertain common maternal ancestors and exclude the possibility of common paternal ancestors with the aid of the allozyme markers.
Observations of dispersal and mating in the field and assessment of gametic disequilibria are used to identify any other cause for genetic hetero-
geneity. To determine what effect immigration of unrelated animals has on the average degree of relatedness within a group, I describe the results of simulations in which I model the growth of a group of adult female bats using observed mortali- ty and natality while systematically varying the im- migration rate.
Methods
Study sites. Blood samples were taken from D. rotundus at four sites in Costa Rica, La Pacifica (85~ ', 10~ Santa Rosa (85~ ', 10~ Palo Verde (85~ ', 10~ ") and La Selva (84~ ', 10~ Samples were collected at La Pacifica from May 1980 until November 1980 and from May 1981 until Janu- ary 1982. My assistants and I obtained samples at this site by netting bats around or in 14 hollow tree roosts (Wilkinson 1985). At Palo Verde and Santa Rosa we captured bats with mist or hand nets while they were entering, leaving, or roosting in a cave. We visited Palo Verde once in June, July, and De- cember 1981 and January 1982 and netted at Santa Rosa about once every 2 months during 1980-81. Samples were obtained from bats at La Selva only once in November 1981. La Selva in the Atlantic lowlands is separated from the other three sites by a volcanic mountain chain. The climate and vegetation at all four sites have been summarized by Frankie et al. (1974) and Janzen (1983).
Marking, sampling and laboratory techniques. After marking and measuring each bat (cf. Wilkinson 1985 for techniques), we collected 0.05 to 0.1 ml of blood into heparinized capillary tubes by piercing the propatagial vein with a lancet. We bled bats as young as two weeks of age (about 10 g) without mortali- ty. Blood samples were placed immediately on crushed ice. The cellular fraction was separated from plasma within 6 h by cen- trifugation at 5,000 rpm for 5 rain at ambient temperature. The red blood cells were washed twice in 2 ml of 0.85% chilled saline solution, each time followed by centrifugation at 5,000 rpm for 1 min. The pellet was diluted 1 : 1 with deionized water before being stored in liquid nitrogen. Samples were sub- jected to horizontal starch gel electrophoresis (Selander et al. 1971) within at least 4 months after collection. Enzyme stain recipes came from Harris and Hopkinson (1978).
I identified seven polymorphic enzyme systems: adenosine deaminase (ADA, EC 3.5.4.4), diaphorase (DIA, EC 1.6.2.2), isocitrate dehydrogenase (ICD, 1.1.1.42), mannose phosphate isomerase (MPI, EC 5.3.1.8), two leucyl-alanine peptidases (PEP/and PEP2, EC 3.4.11), and an esterase (EST, EC 3.1.1.1) from the hemolysate. The buffer systems used for each system were continuous tris-citrate II (pH = 6.9) for DIA, MPI, PEPI, and IDH, tris-borate (pH=8.0) for EST and ADA, and phos- phate citrate (pH = 5.9) for PEP2 (Harris and Hopkinson 1978). An alpha-naphthyl proprionate stain was used for EST. All forty-eight individuals which we scored at less than 6 months of age and then rescored one or more years later had consistent genotypes at all seven loci which supports the assumption that the variation was genetic rather than developmental.
Five systems, ADA, MPI, DIA, PEP1 and ICD, were scored during the 1980 study period. At the end of 1980, PEP2 and EST were added. Consequently, some individuals which could not be recaptured were not scored at these two loci. In addition, early in 1980 a few samples were accidentally thawed and refrozen before electrophoresis. This affected the activity of the PEP1 and ICD systems and prevented scoring of some other individuals. The frequencies of each allele at
125
Table 1. Allele frequencies and sample sizes for the four popula- tions, La Pacifica (LP), La Selva (LS), Palo Verde (PV) and Santa Rosa (SR)
Locus Popula- Allele Sample tion size
1 2 3 4
ADA LP 0.019 0.870 0.1ll - 184 LS 0.111 0.852 0.037 - 27 PV 0.054 0.744 0.202 - 84 SR 0.018 0.916 0.066 - 310
DIA LP 0.921 0.079 - - 184 LS 0.981 0.019 - - 27 PV 0.976 0.024 - - 84 SR 0.940 0.056 0.003 - 310
MPI LP 0.848 0.092 0.060 - 184 LS 0.768 0.107 0.125 - 27 PV 0.833 0.119 0.048 - 84 SR 0.802 0.137 0.061 - 310
PEPI LP 0.234 0.766 - - 177 LS 0.241 0.759 - - 27 PV 0.327 0,673 - - 84 SR 0.304 0,696 - - 276
PEP2 LP 0.053 0.752 0.195 - 151 LS 0.019 0.648 0.333 - 27 PV 0.072 0.777 0.151 - 83 SR 0.050 0.751 0.199 - 259
ICD LP 0.071 0.929 - - 183 LS - 1.000 - - 27 PV 0.078 0.916 0.006 - 83 SR 0.108 0.891 0.002 - 306
EST LP 0.047 0.403 0.206 0.372 161 LS - 0.463 0.222 0.315 27 PV 0.119 0.548 0.089 0.244 84 SR 0.029 0.416 0.285 0.270 256
each population are given with sample sizes in Table 1. No genotype frequency from any population at any locus differed significantly from Hardy Weinberg equilibrium predictions.
Genetic variation analyses. I used a multi-locus genetic distance measure to assign individuals to their appropriate groups or populations because multi-locus measures provide more infor- mation about genotypic differences between groups than single- locus measures (Hedrick 1975; Smouse et al. 1982; Chakra- borty 1982). To measure genetic distances, I characterized indi- vidual i's genotype at all loci as a vector, U~, where every distin- guishable allele in the population is associated with a position in this vector (Smouse et al. 1982). Each element of U i can be designated 1, 0.5, or 0 depending on whether the individual is homozygous, heterozygous, or lacks the allele, respectively, at that position; therefore, the elements represent allele frequen- cies for an individual. The distance between two individuals in this genetic hyperspace is then
l
dij = ((U~ - U ) ' ( U~ - V ) ) ~.
For a single locus d u = 2(1-30 2 where S is the genetic similarity as proposed by Rogers (1972).
Because the sum of the allele frequencies at each locus equals one, the frequency of one allele at each locus is redun- dant. Consequently, one allele was arbitrarily omitted from each locus before conducting the multivariate analysis of vari-
once (MANOVA). Allele frequencies were entered stepwise into the discriminant function in the order in which they maximized the overall F ratio (Nie et al. 1975). They were entered or re- moved if the F ratio changed by 0.3 or more. This analysis assumes that the distribution of the outcome variable is multi- variate normal. Even though individual allele frequencies are discrete variables, Smouse et al. (1982) have shown that the probability estimates obtained by assuming multivariate nor- mality provide good approximations when there are many inde- pendent genetic scores, as there are here.
Three single-locus statistics - r, Fs~ , and G - are calculated from the allele and genotype frequencies within the female groups. Allelic correlations, r, (Stanton 1960; Pamilo and Cro- zier 1982; Pamilo 1984) provide estimates of relatedness at each locus, and standardized genetic variances, Fst, (Nei 1977; Pa- milo 1984) measure genetic structure. The standard error for these two statistics is obtained by jackknifing their z-transfor- mations (Sokal and Rohlf 1981). G statistics (Sokal and Rohlf 1981) were calculated to test for allelic heterogeneity. These three statistics are calculated for the three La Pacifica adult female groups - UP, MD, and DN - which were almost com- pletely sampled during 1981 (n=11 of 11, 10 of 11, and 9 of 11, respectively) and for the La Pacifica groups plus three par- tially sampled groups (n=8, 7, and 7) captured in solution depressions in the ceiling of the Polo Verde cave in December 1981.
Dispersal and maternity determination. We followed the dispers- al patterns of individuals which we banded as well as several which were banded in earlier studies (Fleming et al. 1972; Turner 1975) at the La Pacifica site by checking trees for marked bats a total of 1355 times between September 1978 and Feburary 1983. We attached miniature radio transmitters to 55 bats at that site and monitored their movements at night from remote receiving stations and on the ground with the aid of a night vision device (cf. Wilkinson 1985).
Maternity was determined by observing nursing or parturi- tion. In over 400 h of observations we never saw any adult female nurse more than one infant; therefore, I assumed that nursing between a female and a marked juvenile or infant bat indicated maternity. In many cases I could use the age of the young bat, estimated from published growth curves (Schmidt 1978), to verify maternity because the date of birth for individ- ual females was known from observations. As expected, all offspring genotypes were consistent with Mendelian inheritance from their putative mothers' genotypes. Using these data I de- termined a complete matrilineal pedigree for group UP and partial pedigrees for the other two groups. To complete the UP pedigree I had to determine common ancestry for four females banded in 1978 (el. Fig. 3). Two of the four did not share any alleles at one locus and consequently could not have been mothers and daughters or full sisters. One of these was banded in 1973 (Turner, personal communication) and showed other signs, such as loss of fur, to indicate that she was older than the other three. After assuming that at least one of the three females was the offspring of this bat (see section on dis- persal in Results below), I constructed all 22 possible remaining pathways between the four bats. I then used the mode of the resulting 22 estimates for matrilineal relatedness between all pairs of bats as the most likely estimate for relatedness between pairs. Effects on relatedness due to inbreeding or unequal pater- nity are discussed below.
Paternity exclusion analyses. Estimation of relatedness through pedigrees requires some estimation of paternity as well as ma- ternity. Since many females visited several roost trees which contained one or more males, I could not, a priori, pick a single putative father for each offspring and then perform con-
126
ventional exclusion analyses (e.g. McCracken and Bradbury 1977; Sassaman 1978; Hankin and Sherman 1981; Foltz and Hoogland 1981). Instead, I considered all males within the home range of the female group in which a mother resided at the approximate time of mating as potential mates. The time from mating to parturition is 7 months for this species (Schmidt 1974).
I calculated two measures of paternity, maximum paternity and probability of donating the correct gamete, for 42 offspring at La Pacifica. Maximum paternity is the number of offspring whose genotypes are consistent with each putative father di- vided by the total number of offspring which could have been fathered in that group during that year. The probability that a given male contributed the requisite gamete is calculated by assuming that at each locus a male whose genotype is consistent with that of the offspring has either a probability of one or one-half of donating the correct gamete depending on whether he is homozygous or heterozygous for the allele. Since gametic disequilibria analyses described below provided little evidence for association, these are independent probabilities; therefore, their product was taken across loci. Mean and standard devia- tion of this product are reported for each male parent-offspring pair. Although this joint probability does not give a direct esti- mate of paternity, it does provide a relative estimate within a group of putative fathers.
Gametic disequilibria analyses. I performed gametic disequili- bria analyses on three data sets. In the first I used matched mother-offspring pairs to determine if any pair of loci did not assort independently, thereby testing if linkage, pleiotropy, or prenatal section caused any disequilibria. The second data set consisted of adult bats resident at La Pacifica in 1981. Disequi- libria not found in the first data set but uncovered in this one indicate postnatal selection. Finally, I looked for evidence of nonrandom mating from associations between alleles at pairs of loci by using the juvenile animals genotyped at the La Paci- fica population during 1981. Any gametic disequilibria found in a cohort of offspring which was not detected in the other analyses imply past cases of nonrandom mating. This method for detecting nonrandom mating is more sensitive than testing for deviations from Hardy-Weinberg equilibrium because only one generation of random mating will return a population to Hardy-Weinberg equilibrium. In contrast, gametic disequilibria of unlinked pairs of loci caused, for example, by a generation of extreme polygamy, are only halved each subsequent genera- tion; in linked loci they disappear at a rate determined by re- combination (Falconer 1981).
The rationale behind the test for disequilibria using the mother-offspring data is as follows. If maternal alleles assort independently into gametes, then the probability of finding a gamete in any offspring should be proportional to the frequency at which that gamete occurs in the maternal population. For each maternal gametic combination at each pair of loci, there- fore, I calculated the number of types of gametes expected to be donated. I obtained this quantity by dividing the number of offspring which had mothers of a given genotype by the number of types of gametes which that genotype could have produced. I then used these data to calculate goodness of fit Z 2 statistics (Sokal and Rohlf 1981). For example, a mother heterozygous at one locus and homozygous at the other locus could contribute two types of gametes to its offspring. If there were eight offspring from mothers with such a genotype, then four offspring containing one type of gamete and four offspring containing the other type would be expected. I assumed that maternal double heterozygotes had an equal probability of con- tributing each of the four types of gametes. To increase sample size I combined mother-offspring identified at La Pacifica
(48 pairs) to those from Santa Rosa (9 pairs) and Palo Verde (9 pairs).
To estimate disequilibria in the other two data sets, I esti- mated gametic frequencies from population frequencies (De Groot and Li 1960; Spiess 1977) and then used the overall test for complete independence among the allelie distributions at all loci (Weir and Cockerham 1978). This analysis was con- fined to adult and young bats resident at La Pacifica in 1981 because virtually every eligible bat there was marked during this period. Together with fairly large sample sizes (62, 37), this should reduce the likelihood of any association being the result of sampling error.
Results
Genetic structure within and between populations
No genotype frequencies for any of the six groups at any locus deviated significantly from Hardy Weinberg expectation. Examination of the single- locus genetic structure statistics for these groups in Table 2 reveals that the inclusion of the three Palo Verde groups increases the genetic hetero- geneity at two loci, ADA and EST, which leads to a small increase in both Fst and ~. But, since the standard error of Pst also increases, P~t is signif- icantly greater than zero only for the three La Paci- fica groups considered alone. For either data set,
within groups is not significantly greater than zero.
To determine which groups contributed to the few significant differences in allele frequences indi-
Table 2, Genetic structure and relatedness for adult female groups at La Pacifica and Palo Verde in 1981. Negative esti- mates for r are truncated to zero
Population Locus G df F r
LP A D A 8.97 4 0.054 0 DIA 3.43 2 0.037 0 MPI 5.86 4 0.039 0 PEP1 3.08 2 0.053 0 PEP2 10.36 * 4 0.072 0.003 ICD 2.48 2 0.029 0.09:[ EST 8.21 6 0.058 0.029
Mean 0.049" 0.018 SE 0.006 0.013
LP + PV ADA 28.20 * 10 0.154 0.025 DIA 6.07 5 0.039 0 MPI 13.50 10 0.049 0.010 PEP1 4.63 5 0.044 0 PEP2 16.71 10 0.074 0.024 ICD 6.41 5 0.045 0 EST 34.96** 15 0.122 0.166
Mean 0.075 0.032 SE 0.017 0.023
* 0.01 < P < 0 . 0 5 ; ** P<0.001
(/3
z
t_l
c~ 9
A GBSUP UP + GROUP MO x GROUP DN
X . . . . . . ~ X
, / + / " /
'X " +\ /
\ \ /
\ / \
\ / \ /
-4 -2 0 2 4 OlSCRIMINANT AXIS 2
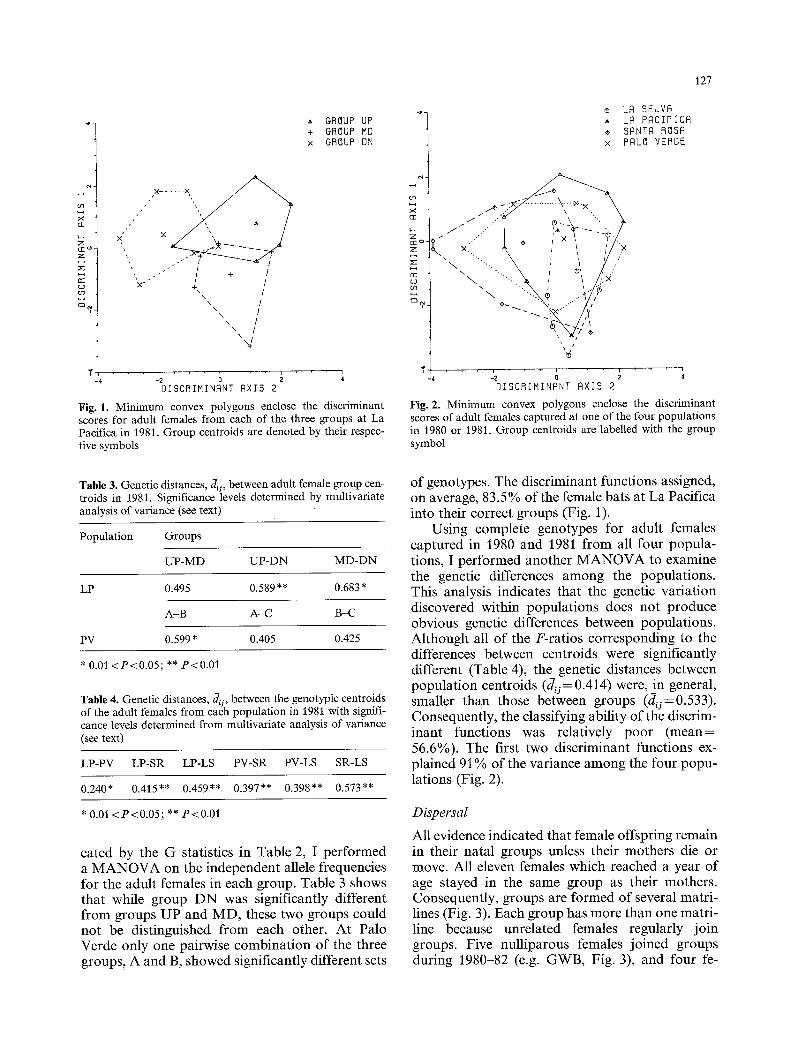
Fig. 1. Minimum convex polygons enclose the discriminant scores for adult females from each of the three groups at La Pacifica in 1981. Group centroids are denoted by their respec- tive symbols
Table 3. Genetic distances, d u, between adult female group cen- troids in 1981. Significance levels determined by multivariate analysis of variance (see text)
Population Groups
U P - M D U P - D N M D - D N
LP 0.495 0.589"* 0.683"
A-B A - C B-C
PV 0.599 * 0.405 0.425
* 0.01 < P < 0 . 0 5 ; ** P<0 .01
Table 4. Genetic distances, d u, between the genotypic centroids of the adult females from each populat ion in 1981 with signifi- cance levels determined from multivariate analysis of variance (see text)
LP-PV LP-SR LP-LS PV-SR PV-LS SR-LS
0.240* 0.415"* 0.459** 0.397** 0.398** 0.573**
* 0.01 < P < 0 . 0 5 ; ** P<0 .01
cated by the G statistics in Table 2, I performed a MANOVA on the independent allele frequencies for the adult females in each group. Table 3 shows that while group DN was significantly different from groups UP and MD, these two groups could not be distinguished from each other. At Palo Verde only one pairwise combination of the three groups, A and B, showed significantly different sets
127
e LR SELVA A LA P A C I F I C A
SRNTR ROSA x PRLO VEBOE
~r / / / / . " " ~ X (2:
L x:" H \ "'-. t f"" n-
t 'g
-4 -2 Q OISCBIMINANT AXIS 2
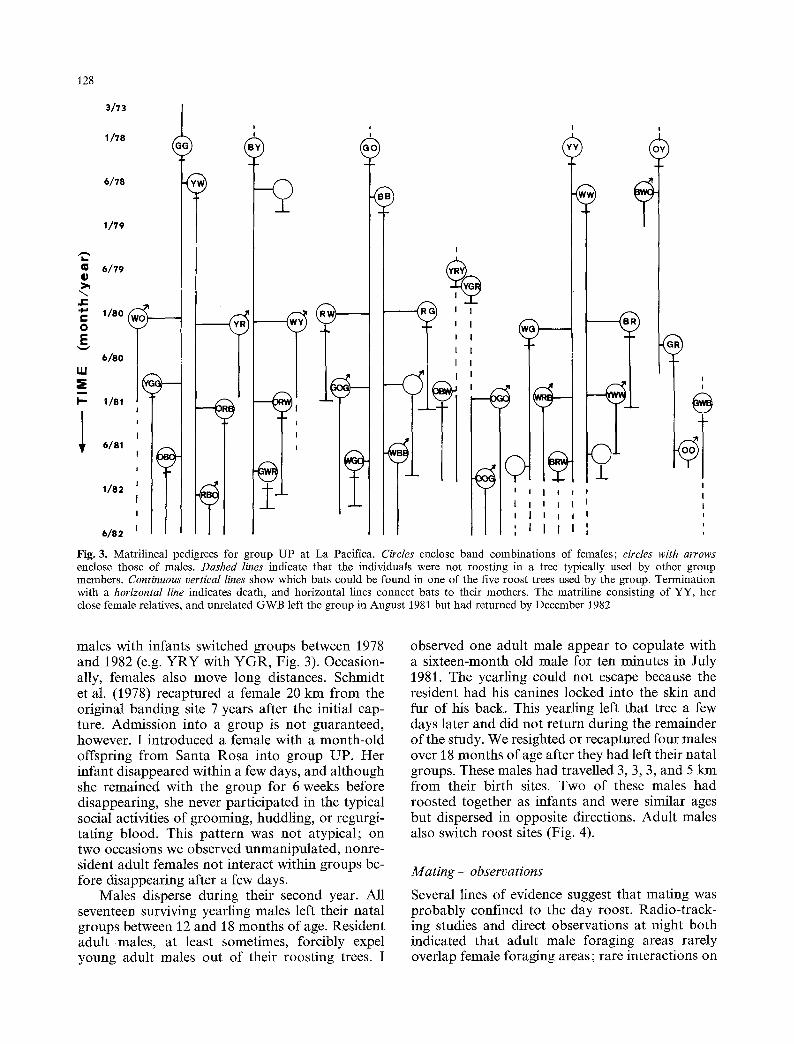
Fig. 2. Minimum convex polygons enclose the discriminant scores of adult females captured at one of the four populations in 1980 or 1981. Group centroids are labelled with the group symbol
of genotypes. The discriminant functions assigned, on average, 83.5% of the female bats at La Pacifica into their correct groups (Fig. 1).
Using complete genotypes for adult females captured in 1980 and 1981 from all four popula- tions, I performed another MANOVA to examine the genetic differences among the populations. This analysis indicates that the genetic variation discovered within populations does not produce obvious genetic differences between populations. Although all of the F-ratios corresponding to the differences between centroids were significantly different (Table 4), the genetic distances between population centroids (du= 0.414) were, in general, smaller than those between groups (du=0.533). Consequently, the classifying ability of the discrim- inant functions was relatively poor (mean= 56.6%). The first two discriminant functions ex- plained 91% of the variance among the four popu- lations (Fig. 2).
Dispersal
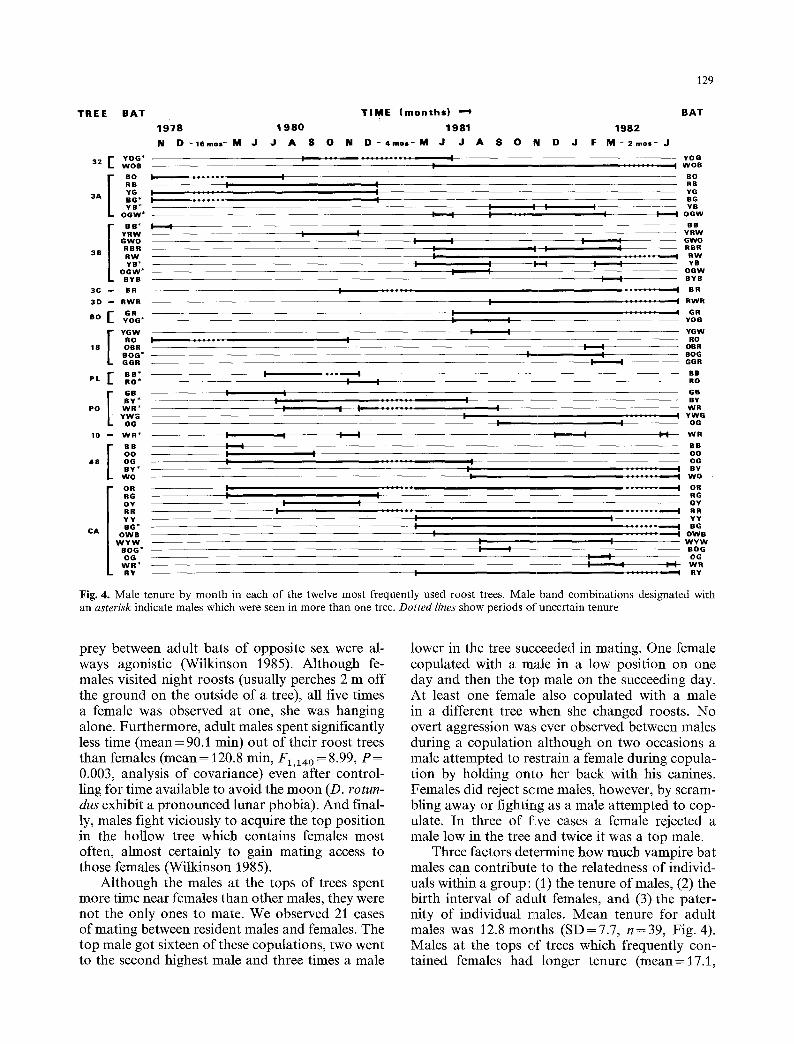
All evidence indicated that female offspring remain in their natal groups unless their mothers die or move. All eleven females which reached a year of age stayed in the same group as their mothers. Consequently, groups are formed of several matri- lines (Fig. 3). Each group has more than one matri- line because unrelated females regularly join groups. Five nulliparous females joined groups during 1980-82 (e.g. GWB, Fig. 3), and four fe-
128
3/73
1/78
6/t8
1/79
�9 ~ 1 / 8 o
g 6 / 8 O
W
1 / 8 1 ,
6/81
6/82
I
I I
-
i ,)
3 I
.)
@
Fig. 3. Matrilineal pedigrees for group UP at La Pacifica. Circles enclose band combinations of females; circles with arrows enclose those of males. Dashed lines indicate that the individuals were not roosting in a tree typically used by other group members. Continuous vertical lines show which bats could be found in one of the five roost trees used by the group. Termination with a horizontal line indicates death, and horizontal lines connect bats to their mothers. The matriline consisting of YY, her close female relatives, and unrelated GWB left the group in August 1981 but had returned by December 1982
males with infants switched groups between 1978 and 1982 (e.g. Y R Y with YGR, Fig. 3). Occasion- ally, females also move long distances. Schmidt et al. (1978) recaptured a female 20 km from the original banding site 7 years after the initial cap- ture. Admission into a group is not guaranteed, however. I introduced a female with a month-old offspring from Santa Rosa into group UP. Her infant disappeared within a few days, and although she remained with the group for 6 weeks before disappearing, she never participated in the typical social activities of grooming, huddling, or regurgi- tating blood. This pattern was not atypical; on two occasions we observed unmanipulated, nonre- sident adult females not interact within groups be- fore disappearing after a few days.
Males disperse during their second year. All seventeen surviving yearling males left their natal groups between 12 and 18 months of age. Resident adult males, at least sometimes, forcibly expel young adult males out of their roosting trees. I
observed one adult male appear to copulate with a sixteen-month old male for ten minutes in July 1981. The yearling could not escape because the resident had his canines locked into the skin and fur of his back. This yearling left that tree a few days later and did not return during the remainder of the study. We resighted or recaptured four males over 18 months of age after they had left their natal groups. These males had travelled 3, 3, 3, and 5 km from their birth sites. Two of these males had roosted together as infants and were similar ages but dispersed in opposite directions. Adult males also switch roost sites (Fig. 4).
M a t i n g - o b s e r v a t i o n s
Several lines of evidence suggest that mating was probably confined to the day roost. Radio-track- ing studies and direct observations at night both indicated that adult male foraging areas rarely overlap female foraging areas; rare interactions on
129
T R E E B A T
3 2 ~" Y O G * W O B [0o RB YG
3 A B G * Y B *
O G W *
B B * Y R W G W O R B R
3 B R W Y B *
O G W * B Y B
3 C - - B R
3 D - R W R
B O i" GR Y O G *
I YGW RO :
1 8 O B R B O G * G G R
P L E BB* [~ BY* P O W R ~
Y W G O G
10 - - W R *
O O 4 8 O G
B Y * W O [o. RG OY RR Yu
C A O ~ / ~
| W Y W . o
W R * - L .v
1 9 7 8 1 9 8 0
N D -16mos- M J J A
I '"
I , , * , . . . "
I I
S O
i . : :
T I M E ( m o n t h s ) " ~
1 9 8 1
D - 4 mos- M J J
: : : : : : : = : : :
I
I
I
F I
A S O NI D J
B A T
1 9 8 2
F M - 2 m o s - J
Y O G �9 . . . . . , ,' I W O B
- - B O RB YG BG
I I I I Y B I I O O W
B B I I
I
I
j J , . , . , ,
!
F~ D
!
I
I
I
I I
I
I
I I
I I
I
I
I I
I I
I
!
I
I I !
I I
I - ~ I I
I
Y R W I - - G W O I R B R
. . . . . ~ �9 �9 R W I Y B
- - O G W I B Y B
�9 ~ : : : : = ' B R
. . : : : : : ~.. R W R
: : , : : : : ' G R - - Y O G
Y G W
I
I
I I
I I
I
I
RO - - OBR
- - BOG - - GGR
B B RO
G B BY
W R : Y W G
OG
~ . W R
B B O O
~ J J l i i l
OG I B Y " W O
" O R R G O Y
I R R Y Y
I B G I O W B
W Y W B O G OG
~ WR I : : : : : : , | RY
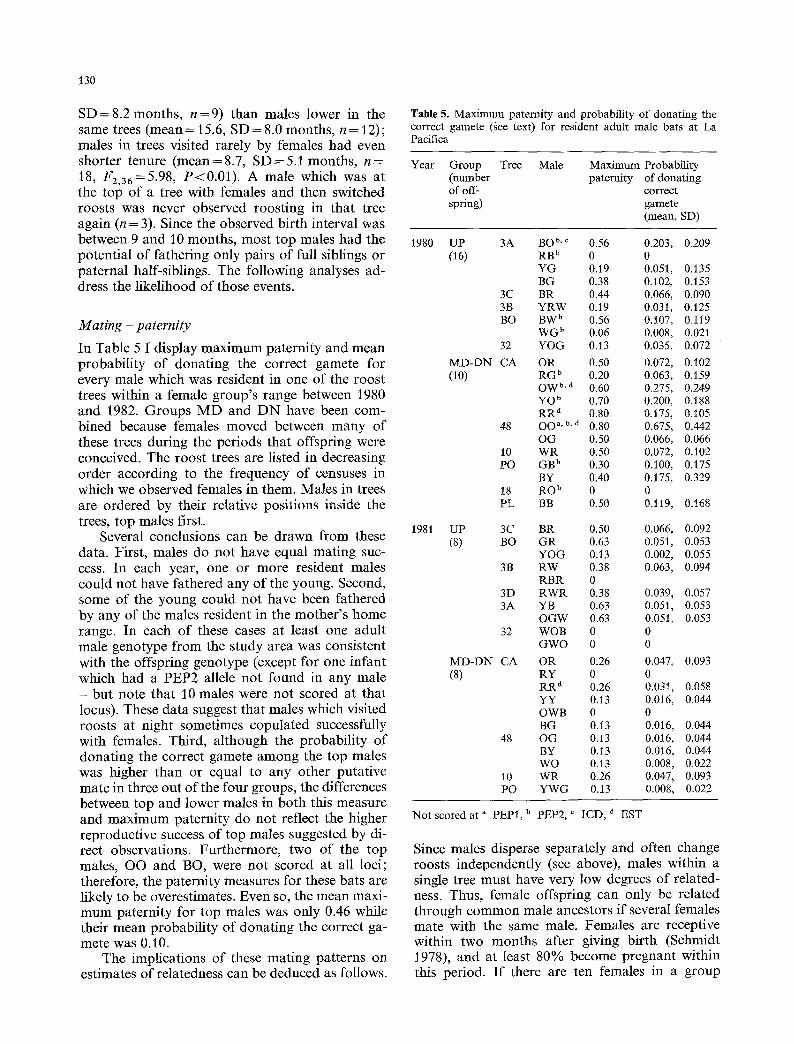
Fig. 4. Male tenure by month in each of the twelve most frequently used roost trees. Male band combinations designated with an asterisk indicate males which were seen in more than one tree. Dotted lines show periods of uncertain tenure
prey between adult bats of opposite sex were al- ways agonistic (Wilkinson 1985). Although fe- males visited night roosts (usually perches 2 m off the ground on the outside of a tree), all five times a female was observed at one, she was hanging alone. Furthermore, adult males spent significantly less time (mean = 90.1 min) out of their roost trees than females (mean = 120.8 min, F1.140 = 8.99, P = 0.003, analysis of covariance) even after control- ling for time available to avoid the moon (D. rotun- dus exhibit a pronounced lunar phobia). And final- ly, males fight viciously to acquire the top position in the hollow tree which contains females most often, almost certainly to gain mating access to those females (Wilkinson J985).
Although the males at the tops of trees spent more time near females than other males, they were not the only ones to mate. We observed 21 cases of mating between resident males and females. The top male got sixteen of these copulations, two went to the second highest male and three times a male
lower in the tree succeeded in mating. One female copulated with a male in a low position on one day and then the top male on the succeeding day. At least one female also copulated with a male in a different tree when she changed roosts. No overt aggression was ever observed between males during a copulation although on two occasions a male attempted to restrain a female during copula- tion by holding onto her back with his canines. Females did reject some males, however, by scram- bling away or fighting as a male attempted to cop- ulate. In three of five cases a female rejected a male low in the tree and twice it was a top male.
Three factors determine how much vampire bat males can contribute to the relatedness of individ- uals within a group: (1) the tenure of males, (2) the birth interval of adult females, and (3) the pater- nity of individual males. Mean tenure for adult males was 12.8 months (SD=7.7 , n=39, Fig. 4). Males at the tops of trees which frequently con- tained females had longer tenure (mean=17.1,
130
S D = 8.2 months, n = 9 ) than males lower in the same trees (mean= 15.6, SD = 8.0 months, n = 12); males in trees visited rarely by females had even shorter tenure (mean=8.7, SD=5.1 months, n = 18, F 2 , 3 6 = 5 . 9 8 , P<0.01) . A male which was at the top of a tree with females and then switched roosts was never observed roosting in that tree again (n = 3). Since the observed birth interval was between 9 and 10 months, most top males had the potential of fathering only pairs of full siblings or paternal half-siblings. The following analyses ad- dress the likelihood of those events.
M a t i n g - p a t e r n i t y
In Table 5 1 display maximum paternity and mean probability of donating the correct gamete for every male which was resident in one of the roost trees within a female group's range between 1980 and 1982. Groups M D and D N have been com- bined because females moved between many of these trees during the periods that offspring were conceived. The roost trees are listed in decreasing order according to the frequency of censuses in which we observed females in them. Males in trees are ordered by their relative positions inside the trees, top males first.
Several conclusions can be drawn from these data. First, males do not have equal mating suc- cess. In each year, one or more resident males could not have fathered any of the young. Second, some of the young could not have been fathered by any of the males resident in the mother's home range. In each of these cases at least one adult male genotype from the study area was consistent with the offspring genotype (except for one infant which had a PEP2 allele not found in any male - but note that 10 males were not scored at that locus). These data suggest that males which visited roosts at night sometimes copulated successfully with females. Third, although the probability of donating the correct gamete among the top males was higher than or equal to any other putative mate in three out of the four groups, the differences between top and lower males in both this measure and maximum paternity do not reflect the higher reproductive success of top males suggested by di- rect observations. Furthermore, two of the top males, OO and BO, were not scored at all loci; therefore, the paternity measures for these bats are likely to be overestimates. Even so, the mean maxi- mum paternity for top males was only 0.46 while their mean probability of donating the correct ga- mete was 0.10.
The implications of these mating patterns on estimates of relatedness can be deduced as follows.
Table 5. Maximum paternity and probability of donating the correct gamete (gee text) for resident adult male bats at La Pacifica
Year Group Tree Male Maximum Probability (number paternity of donating of off- correct spring) gamete
(mean, SD)
1980
1981
UP 3A BOb'c 0.56 0.203, 0.209 (16) RB b 0 0
YG 0.19 0.051, 0.135 BG 0.38 0.102, 0.153
3C BR 0.44 0.066, 0.090 3B YRW 0.19 0.031, 0.125 BO BW b 0.56 0.107, 0.119
WG b 0.06 0.008, 0.021 32 YOG 0.13 0.035, 0.072
M D - D N CA OR 0.50 0.072, 0.102 (10) RG b 0.20 0.063, 0.159
OW b,a 0.60 0.275, 0.249 Y O b 0.70 0.200, 0.188 RR a 0.80 0.175, 0.I05
48 OO a,b.d 0.80 0.675, 0.442 OG 0.50 0.066, 0.066
10 WR 0.50 0.072, 0.102 PO GB b 0.30 0.100, 0.175
BY 0.40 0.175, 0.329 18 RO b 0 0 PL BB 0.50 0.119, 0.168
UP 3C BR 0.50 0.066, 0.092 (8) BO GR 0.63 0.051, 0.053
YOG 0.13 0.002, 0.055 3B RW 0.38 0.063, 0.094
RBR 0 3D R W R 0.38 0.039, 0.057 3A YB 0.63 0.051, 0.053
OGW 0.63 0.051, 0.053 32 WOB 0 0
GWO 0 0
M D - D N CA OR 0.26 0.047, 0.093 (8) RY 0 0
RR d 0.26 0.031, 0.058 YY 0.13 0.016, 0.044 OWB 0 0 BG 0.13 0.016, 0.044
48 OG 0.13 0.016, 0.044 BY 0.13 0.016, 0.044 WO 0.13 0.008, 0.022
10 WR 0.26 0.047, 0.093 PO YWG 0.13 0.008, 0.022
Not scored at a PEP1, b PEP2, ~ ICD, a EST
Since males disperse separately and often change roosts independently (see above), males within a single tree must have very low degrees of related- ness. Thus, female offspring can only be related through common male ancestors if several females mate with the same male. Females are receptive within two months after giving birth (Schmidt 1978), and at least 80% become pregnant within this period. If there are ten females in a group
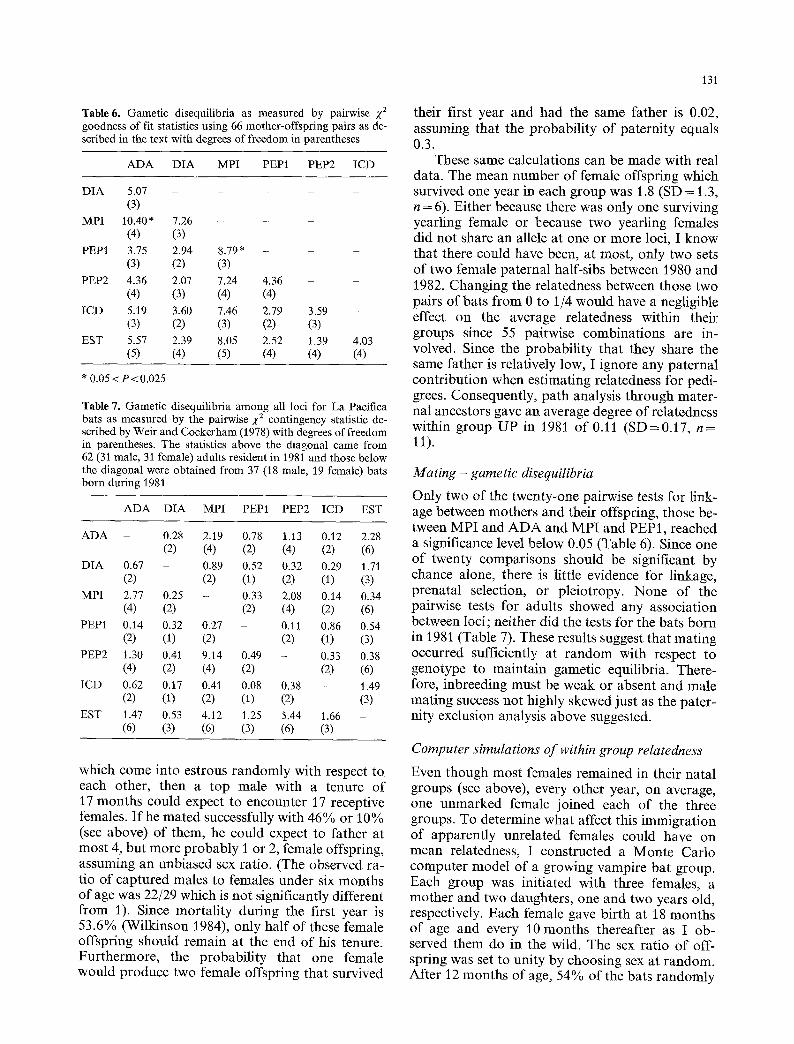
Table 6. Gamet ic disequilibria as measured by pairwise •2 goodness of fit statistics using 66 mother-offspring pairs as de- scribed in the text with degrees of f reedom in parentheses
A D A D I A MPI PEP1 PEP2 I C D
D I A 5.07 . . . . . (3)
MPI 10.40 * 7.26 - - - (4) (3)
PEP1 3.75 2.94 8.79 * . . . . (3) (2) (3)
PEP2 4.36 2.07 7.24 4.36 - - (4) (3) (4) (4)
I C D 5.19 3.60 7.46 2.79 3.59 - (3) (2) (3) (2) (3)
EST 5.57 2.39 8.05 2.52 1.39 4.03 (5) (4) (5) (4) (4) (4)
* 0.05 < P < 0 . 0 2 5
Table 7. Gamet ic disequilibria among all loci for La Pacifica bats as measured by the pairwise 2,2 contingency statistic de- scribed by Weir and Cockerham (1978) with degrees of freedom in parentheses. The statistics above the diagonal came from 62 (31 male, 31 female) adults resident in 1981 and those below the diagonal were obtained f rom 37 (18 male, 19 female) bats born during 1981
A D A D I A MPI PEP1 PEP2 ICD EST
A D A - 0.28 2.19 0.78 1.13 0.12 2.28 (2) (4) (2) (4) (2) (6)
D I A 0.67 - 0.89 0.52 0.32 0.29 1.71 (2) (2) (1) (2) (1) (3)
MPI 2.77 0.25 - 0.33 2.08 0.14 0.34 (4) (2) (2) (4) (2) (6)
PEP1 0.14 0.32 0.27 - 0.11 0.86 0.54 (2) (1) (2) (2) (1) (3)
PEP2 1.30 0.41 9.14 0.49 - 0.33 0.38 (4) (2) (4) (2) (2) (6)
ICD 0.62 0.17 0.41 0.08 0.38 - 1.49 (2) (1) (2) (1) (2) (3)
EST 1.47 0.53 4.12 1.25 5.44 1.66 - (6) (3) (6) (3) (6) (3)
which come into estrous randomly with respect to each other, then a top male with a tenure of 17 months could expect to encounter 17 receptive females. If he mated successfully with 46% or 10% (see above) of them, he could expect to father at most 4, but more probably 1 or 2, female offspring, assuming an unbiased sex ratio. (The observed ra- tio of captured males to females under six months of age was 22/29 which is not significantly different from 1). Since mortality during the first year is 53.6% (Wilkinson 1984), only half of these female offspring should remain at the end of his tenure. Furthermore, the probability that one female would produce two female offspring that survived
131
their first year and had the same father is 0.02, assuming that the probability- of paternity equals 0.3.
These same calculations can be made with real data. The mean number of female offspring which survived one year in each group was 1.8 (SD = 1.3, n = 6). Either because there was only one surviving yearling female or because two yearling females did not share an allele at one or more loci, I know that there could have been, at most, only two sets of two female paternal half-sibs between 1980 and 1982. Changing the relatedness between those two pairs of bats from 0 to 1,/4 would have a negligible effect on the average relatedness within their groups since 55 pairwise combinations are in- volved. Since the probability that they share the same father is relatively low, I ignore any paternal contribution when estimating relatedness for pedi- grees. Consequently, path analysis through mater- nal ancestors gave an average degree of relatedness within group UP in 1981 of 0.11 (SD=0.17, n = 11).
Mating - gametic disequilibria
Only two of the twenty-one pairwise tests for link- age between mothers and their offspring, those be- tween MPI and ADA and MPI and PEP1, reached a significance level below 0.05 (Table 6). Since one of twenty comparisons should be significant by chance alone, there is little evidence for linkage, prenatal selection, or pleiotropy. None of the pairwise tests for adults Showed any association between loci; neither did the tests for the bats born in 1981 (Table 7). These results suggest that mating occurred sufficiently at random with respect to genotype to maintain gametic equilibria. There- fore, inbreeding must be weak or absent and male mating success not highly skewed just as the pater- nity exclusion analysis above suggested.
Computer simulations of within group relatedness
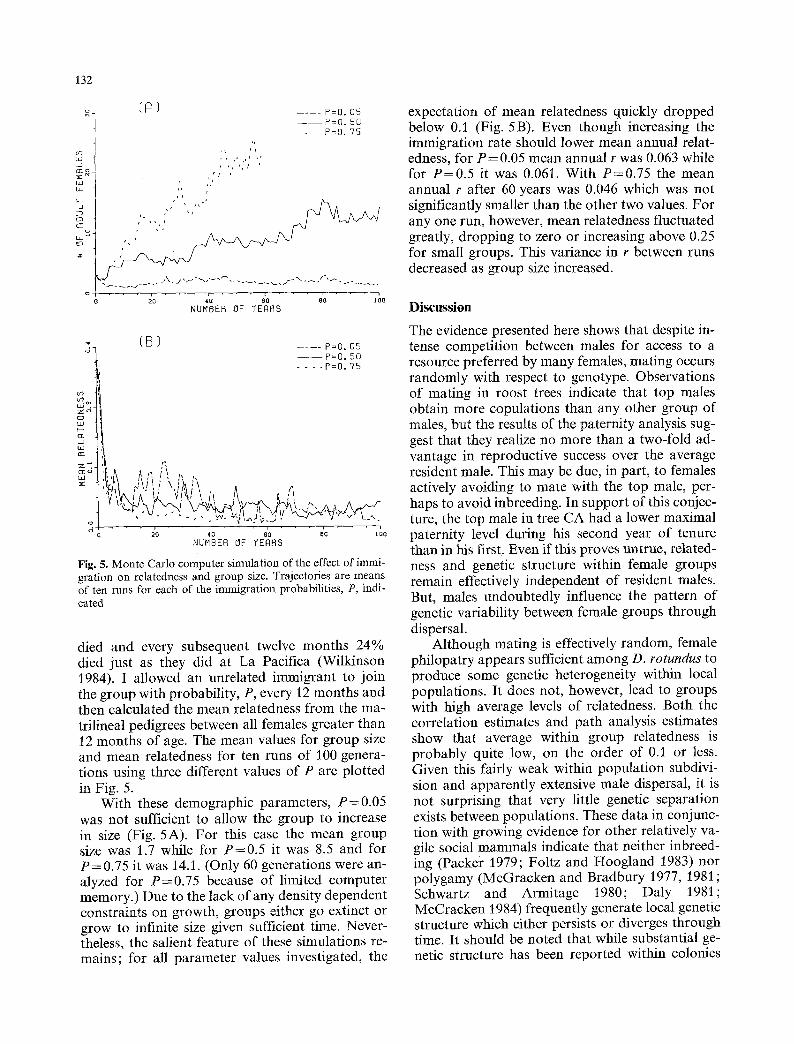
Even though most females remained in their natal groups (see above), every other year, on average, one unmarked female joined each of the three groups. To determine what affect this immigration of apparently unrelated females could have on mean relatedness, I constructed a Monte Carlo computer model of a growing vampire bat group. Each group was initiated with three females, a mother and two daughters, one and two years old, respectively. Each female gave birth at 18 months of age and every 10 months thereafter as I ob- served them do in the wild. The sex ratio of off- spring was set to unity by choosing sex at random. After 12 months of age, 54% of the bats randomly
132
(R) . . . . e=o. os l --P=o. so . . . . P = O . 75
09 ', ,
F -
0
, . �9 & . , , & , , , & 20 40
NUMBER OF YEARS
J LLI OC:
~o
o
(B) . . . . P=O. 05 - - P = O , 50 . . . . P=O. 75
q
,'.r411 F l ! i \ , i & i x ^ ,q
i
20 48 60 80 100 NUNBER ~3F "(ERRS
Fig. 5. Monte Carlo computer simulation of the effect of immi- gration on relatedness and group size. Trajectories are means of ten runs for each of the immigration probabilities, P, indi- cated
died and every subsequent twelve months 24% died just as they did at La Pacifica (Wilkinson 1984). I allowed an unrelated immigrant to join the group with probability, P, every 12 months and then calculated the mean relatedness from the ma- trilineal pedigrees between all females greater than 12 months of age. The mean values for group size and mean relatedness for ten runs of 100 genera- tions using three different values of P are plotted in Fig. 5.
With these demographic parameters, P=0 .05 was not sufficient to allow the group to increase in size (Fig. 5A). For this case the mean group size was 1.7 while for P = 0 . 5 it was 8.5 and for P = 0.75 it was 14.1. (Only 60 generations were an- alyzed for P=0 .75 because of limited computer memory.) Due to the lack of any density dependent constraints on growth, groups either go extinct or grow to infinite size given sufficient time. Never- theless, the salient feature of these simulations re- mains; for all parameter values investigated, the
expectation of mean relatedness quickly dropped below 0.1 (Fig. 5 B). Even though increasing the immigration rate should lower mean annual relat- edness, for P = 0.05 mean annual r was 0.063 while for P = 0 . 5 it was 0.061. With P=0.75 the mean annual r after 60 years was 0.046 which was not significantly smaller than the other two values. For any one run, however, mean relatedness fluctuated greatly, dropping to zero or increasing above 0.25 for small groups. This variance in r between runs decreased as group size increased.
Discussion
The evidence presented here shows that despite in- tense competition between males for access to a resource preferred by many females, mating occurs randomly with respect to genotype. Observations of mating in roost trees indicate that top males obtain more copulations than any other group of males, but the results of the paternity analysis sug- gest that they realize no more than a two-fold ad- vantage in reproductive success over the average resident male. This may be due, in part, to females actively avoiding to mate with the top male, per- haps to avoid inbreeding. In support of this conjec- ture, the top male in tree CA had a lower maximal paternity level during his second year of tenure than in his first. Even if this proves untrue, related- ness and genetic structure within female groups remain effectively independent of resident males. But, males undoubtedly influence the pattern of genetic variability between female groups through dispersal.
Although mating is effectively random, female philopatry appears sufficient among D. rotundus to produce some genetic heterogeneity within local populations. It does not, however, lead to groups with high average levels of relatedness. Both the correlation estimates and path analysis estimates show that average within group relatedness is probably quite low, on the order of 0.1 or less. Given this fairly weak within population subdivi- sion and apparently extensive male dispersal, it is not surprising that very little genetic separation exists between populations. These data in conjunc- tion with growing evidence for other relatively va- gile social mammals indicate that neither inbreed- ing (Packer 1979; Foltz and Hoogland 1983) nor polygamy (McGracken and Bradbury 1977, 1981; Schwartz and Armitage 1980; Daly 1981; McCracken 1984) frequently generate local genetic structure which either persists or diverges through time. It should be noted that while substantial ge- netic structure has been reported within colonies
133
of black-tailed prairie dogs (Chesser 1983), very little nonrandom structure has been reported among colonies (Chesser 1983; Foltz and Hoog- land 1983) Thus, in contrast to the proposal made by Bush et al. (1977), sociality appears much less effective at promoting genetic differentiation than restricted dispersal ability, such as is apparent for some subterranean mammals (cf. Patton and Feder 1981).
The low estimates of mean relatedness in groups of adult female vampire bats are corrobo- rated by the simulations which showed that the expected mean relatedness within a group with typ- ical immigration rates was very low, f = 0.06, even when groups were started with three highly related animals. Surprisingly, this low value of f did not increase as immigration was restricted, primarily due to the increased probability of group extinc- tion. Small litter size, high infant mortality, and low adult mortality contribute to this low average degree of relatedness. These results have implica- tions for the study of other vertebrates with long lifespans and overlapping generations. Clearly, just because some offspring do not emigrate out of a group, one cannot conclude that average degree of relatedness in a group is necessarily high without assiduously documenting pedigrees.
The results described here shed some light on the potential evolutionary mechanisms which must be operating in this species to explain food sharing (Wilkinson 1984). Interdemic group selection (see Wade 1978 for review) appears to be an improba- ble explanation for the occurrence of this behavior because it requires isolated groups with high ex- tinction rates. Neither is true of vampire bat popu- lations. Intrademic group selection (sensu Wilson 1980), on the other hand, only requires a greater than random variance in allele frequency between groups (Charlesworth 1979). This may have oc- curred through female philopatry or assortative dispersaI in the past. One cannot test such an evo- lutionary process directly, but one can test a pre- diction of the model; that is, expression of altruism should depend only on group membership. In con- trast, nepotism predicts that individuals should aid the most closely related individuals. Thus, group selection should be distinguishable from nepotism depending on whether aid is donated at random within a group or along kin lines. The evidence reviewed in Wilkinson (1984) shows that food is not distributed randomly within the group, but in- stead, it is dispensed either to close kin or to bats with high expectation of future encounter, as ex- pected for reciprocity. Intrademic selection can, therefore, also be discounted.
Even though vampire bats do not feed group members at random, a proponent of intrademic selection might claim that I did not define the so- cial groups as the bats recognize them. However, in all models of group selection, groups are defined as that set of individuals among which interactions occur. I have shown (Wilkinson 1985) that al- though not every bat in each group formed associ- ations with every other bat, all members of each group formed some associations. Therefore, it was not possible to define exclusive groups on the basis of associations; I had to use roost tree occupation. These data point to a potentially serious omission in most models of the evolution of social behavior, including those of kin selection. To facilitate ana- lytical solution, social structure and dispensation of altruism have been kept symmetrical. Rarely should we expect to find such symmetry in nature. Before more quantitative tests of the theories for the evolution and maintainance of social behavior can be made, variation in relatedness as well as frequency of interaction must be explicitly incorpo- rated into these models.
Acknowledgements.. The field work could not have been con- ducted without the help of T. Lamp, R. Weiss, and M. Jones. W. and L. Hagenauer, the Servicio de Parque Nacionales de Costa Riea, and the Organization for Tropical Studies gra- ciously permitted us to work on their land. I thank especially P. Leon and the staff at the Centro de Investigaciones en Biolo- gia de Cellular y Molecular of the Universidad de Costa Rica for laboratory space, supplies, and assistance. The manuscript benefitted from suggestions made by J. Bradbury, T. Case, M. Taper, D. Woodruff, and an anonymous reviewer. This re- search was supported by grant DEB-8001165 to J. Bradbury from the National Science Foundation and by training grant GM-0724008 to the Department of Biology, UCSD, from the National Institute of Health.
References
Boorman SA, Levitt PR (1980) The genetics of altruism. Aca- demic Press, New York
Boyd R, Richardson PJ (1980) Effect of phenotypic variation on kin selection. Proc Natl Acad Sci USA 77 : 7506-7509
Brown JS, Sanderson MJ, Michod RE (1982) Evolution of so- cial behavior by reciprocation. J Theor Biol 99:319-339
Bush GL, Case SM, Wilson AC, Patton JL (1977) Rapid specia- lion and chromosomal evolution in mammals. Proc Natl Acad Sci USA 74: 3942-3946
Chakraborty R (1982) Allocation versus variation: the issue of genetic differences between human racial groups. Am Nat 120: 403-404
Charlesworth B (1979) A note on the evolution of altruism in structured demes. Am Nat/11:1010-1014
Chesser RK (1983) Genetic variability within and among popu- lations of the bIack-tailed prairie dog. Evolution 37:320-331
Craig R, Crozier RH (1979) Relatedness in the polygynous ant Mymecia pilosula. Evolution 31 : 335-341
134
Daly JC (1981) Effects of social organization and environmen- tal diversity on determining the genetic structure of a popu- lation of the wild rabbit, Oryctolagus cuniculus. Evolution 35: 689-706
De Groot MH, Li CC (1960) Simplified method of estimating the MNS gene frequencies. Ann Hum Genet 24:109-115
Eshel I, Cavalli-Sforza LL (1982) Assortment of encounters and evolution of cooperativeness. Proc Natl Acad Sci USA 79:1331-1335
Falconer DS (1981) Introduction to quantitative genetics. Longman, New York
Fleming TH, Hooper ET, Wilson DE (1972) Three central american bat communities: structure, reproductive cycles, and movement patterns. Ecology 53 : 555-569
Foltz DW, Hoogland JL (1981) Analysis of the mating system in the black-tailed prairie dog (Cynomys ludovicianus) by likelihood of paternity. J Mammal 62:706-712
Foltz DW, Hoogland JL (1983) Genetic evidence of outbreed- ing in the black-tailed prairie dog (Cynomys ludovicianus). Evolution 37:273-281
Frankie GW, Baker HG, Opler PA (1974) Comparative pheno- logical studies of trees in tropical wet and dry forests in the lowlands of Costa Rica. J Ecol 62:881-919
Hamilton WD (1964) The genetical evolution of social behav- ior. J Theor Biol 7:1-52
Hankin J, Sherman P (1981) Multiple paternity in Belding's ground squirrel litters. Science 212:351-353
Harris H, Hopkinson DA (1978) Handbook of enzyme electro- phoresis in human genetics. American Elsevier, New York
Hedrick PW (1975) Genetic similarity and distance: comments and comparisons. Evolution 29 : 362--366
Hoogland JL (1983) Black-tailed prairie dog coteries are co- operatively breeding units. Am Nat 121:275-280
Janzen DH (1983) Costa rican natural history. University of Chicago Press, Chicago, Ill
Lester LJ, Selander RK (1981) Genetic relatedness and the so- cial organization of Polistes colonies. Am Nat 117:147-166
McCracken GF (1984) Social dispersion and genetic variation in two species of emballonurid bats. Z Tierpsychol 66:55-69
McCracken GF, Bradbury JW (1977) Paternity and genetic heterogeneity in the polygynous bat, Phyllostomus hastatus. Science 198:303-306
McCracken GF, Bradbury JW (1981) Social organization and kinship in the polygynous bat, Phyllostomus hastatus. Behav Ecol Sociobiol 8:11-34
Metcalf RA, Whitt GS (1977) Intra-nest relatedness in the so- cial wasp Polistes metrieus. Behav Ecol Sociobiol 2:339-351
Nei M (1977) F-statistics and analysis of gene diversity in subdi- vided populations. Am Hum Genet 41:225-233
Nie NH, Hull CH, Jenkins JG, Steinbrenner K, Bent DH (1975) Statistical package for the social sciences, 2nd edn. McGraw Hill, New York
Olivier T J, Ober C, Buettner-Janusch J, Sade DS (1981) Genetic differentiation among matrilines in social groups of rhesus monkeys. Behav Ecol Sociobiol 8:279-285
Packer C (1979) Inter-troop transfer and inbreeding avoidance in Papio anubis. Anita Behav 27:1-36
Pamilo P (1981) Genetic organization of Formica sanguinea populations. Behav Ecol Sociobiol 9:45-50
Pamilo P (1982) Genetic population structure in polygynous Formica ants. Heredity 48 : 95-106
Pamilo P (1983) Genetic differentiation within subdivided pop- ulations of Formica ants. Evolution 37:1010-1022
Pamilo P (1984) Genotypic correlation and regression in social
groups: multiple alleles, multiple loci and subdivided popu- lations. Genetics 107:307-320
Pamilo P, Crozier RH (1982) Measuring genetic relatedness in natural populations: methodology. Theor Popul Biol 21:171-193
Pamilo P, Varvio-Aho S (1979) Genetic structure of nests in the ant Formica sanguinea. Behav Ecol Sociobiol 6:91-98
Patton JL, Feder JH (1981) Microspatial genetic heterogeneity in pocket gophers: nonrandom breeding and drift. Evolu- tion 35:912-920
Pearson B (1982) Relatedness of normal queens (macrogynes) in nests of the polygynous ant Myrmecia rubra Latreille. Evolution 36:107-112
Rogers JS (1972) Measures of genetic similarity and genetic distance. Studies in genetics VII. Univ Texas Publ 7213 : 145--153
Sassaman C (1978) Mating systems in porcellionid isopods: multiple paternity and sperm mixing in Porcellio scaber Latr Heredity 41 : 385-397
Sehmidt U (1974) Die Tragezeit der Vampirfledermause (Des- modus rotundus). Z Saugetierkd 39:129-132
Schmidt U (1978) Vampiflederrnause. Ziemsen, Wittenburg Schmidt U, Schmidt C, Lopez-Forment W, Crespo RF (1978)
Banding experiment on vampire bats (Desmodus rotundus) in Mexico. Z Saugetierkd 43 : 70--75
Schwartz OA, Armitage KB (1980) Genetic variation in social mammals: the marmot model. Science 207: 665-667
Selander RK, Smith MH, Yang SV, Johnson WE, Gentry JB (1971) Biochemical polymorphism and systematics in the genus Peromyscus. I. Variation in the old field mouse. Stud- ies in genetics VI. Univ Texas PuN 7103:49-90
Smouse PE, Spielman RS, Park MH (1982) Multiple-locus allo- cation of individuals to groups as a function of the genetic variation within and differences among human populations. Am Nat 119:445~463
Sokal RR, Rohlf FJ (1981) Biometry. Freeman, San Fransisco, Calif
Spiess EB (1977) Genes in populations. Wiley, New York Stanton RG (1960) Genetic correlations with multiple alleles.
Biometrics 16: 235-244 Turner DC (1975) The vampire bat. Johns Hopkins University
Press, Baltimore, Md Wade MJ (1978) A critical review of the models of group selec-
tion. Q Rev Biol 53:101-114 Wade MJ (1980) Kin selection: its components. Science
210: 665-667 Ward PS (1983) Genetic relatedness and colony organization
in a species complex of ponerine ants. I. Phenotypic and genotypic composition of colonies. Behav Ecol Sociobiol 12:285-299
Weir BS, Cockerham CC (1978) Testing hypotheses about link- age disequilibrium with multiple alleles. Genetics 88 : 633-842
Wilkinson GS (1984) Reciprocal food sharing in vampire bats. Nature 308:181-184
Wilkinson GS (1985) The social organization of the common vampire bat. I. Pattern and cause of association. Behav Ecol Sociobiol 17:111-121
Wilson DS (1980) The natural selection of populations and communities. Cummings, Menlo Park, Calif
Wright S (1968) Evolution and the genetics of populations, vol 1. University of Chicago Press, Chicago, Ill
Wright S (1978) Evolution and the genetics of populations, vol 4. University of Chicago Press, Chicago, Ill