Embed Size (px)
Citation preview
Q3
20
15
SEG Capital Advisors, L.L.C.
12220 El Camino Real
Suite 320
San Diego, CA 92130
(858) 509-2800
The Software Industry
Financial Report
SOFTWARE EQUITY GROUP | Q3 2015 SOFTWARE INDUSTRY FINANCIAL REPORTCopyright © SEG Capital Advisors, LLC, All Rights Reserved 2
About Software Equity Group
Leaders in Software M&A 5
Extensive Global Reach 6
Leading Market Position
Software Industry Macroeconomics
U.S and Global GDP 8
U.S. GDP and Unemployment 9
Global IT Spending 10
Stock Market Performance 11
Public Software Financial and Valuation Performance
The SEG Software Index 13
The SEG Software Index: Financial Performance 14-16
The SEG Software Index: Public Market Multiples 17-18
The SEG Software Index by Product Category 19
The SEG Software Index by Product Category: Financial Performance 20
The SEG Software Index by Product Category: Public Market Multiples 21
Public SaaS Company Financial and Valuation Performance
The SEG SaaS Index 23
The SEG SaaS Index: Financial Performance 24-26
The SEG SaaS Index: Public Market Multiples 27-29
The SEG SaaS Index by Product Category: Financial Performance 30
The SEG SaaS Index by Product Category: Public Market Multiples 31
Public Internet Company Financial and Valuation Performance
The SEG Internet Index 33
The SEG Internet Index: Financial Performance 34-36
The SEG Internet Index: Public Market Multiples 37-38
The SEG Internet Index by Product Category 39
The SEG Internet Index by Product Category: Financial Performance 40
The SEG Internet Index by Product Category: Public Market Multiples 41
SOFTWARE INDUSTRY FINANCIAL REPORT CONTENTS
SOFTWARE EQUITY GROUP | Q3 2015 SOFTWARE INDUSTRY FINANCIAL REPORTCopyright © SEG Capital Advisors, LLC, All Rights Reserved 3
SOFTWARE INDUSTRY FINANCIAL REPORT CONTENTS
Software Industry M&A Market Update
Software/SaaS M&A Deal Volume and Spending 43
Software M&A Exit Multiples 44
Software M&A by Ownership Structure and Size 45
Software M&A by Vertical and Horizontal Markets 46
Software M&A Deal Volume by Product Category 47
Software M&A Exit Multiples by Product Category 48
SaaS M&A Deal Volume and Exit Multiples 49
SaaS M&A by Product Category 50
SaaS M&A 3Q15 Transactions 51-54
Internet M&A: Deal Volume and Exit Multiples 55
Internet M&A: By Product Category 56
Appendix
SEG Software Index Key Metrics 58-61
SEG Software Index Key Metrics by Product Category 62-63
SEG SaaS Index Key Metrics 64-65
SEG SaaS Index Key Metrics by Product Category 66
SEG Internet Index Key Metrics 67-69
SEG Internet Index Key Metrics by Product Category 70
3Q15 Select Public Sellers 71
3Q15 Mega Deals 72
3Q15 Most Active Buyers 73
About Software Equity Group 74
SOFTWARE EQUITY GROUP | Q3 2015 SOFTWARE INDUSTRY FINANCIAL REPORTCopyright © SEG Capital Advisors, LLC, All Rights Reserved
ABOUT SOFTWARE EQUITY GROUP
SOFTWARE EQUITY GROUP | Q3 2015 SOFTWARE INDUSTRY FINANCIAL REPORTCopyright © SEG Capital Advisors, LLC, All Rights Reserved 5
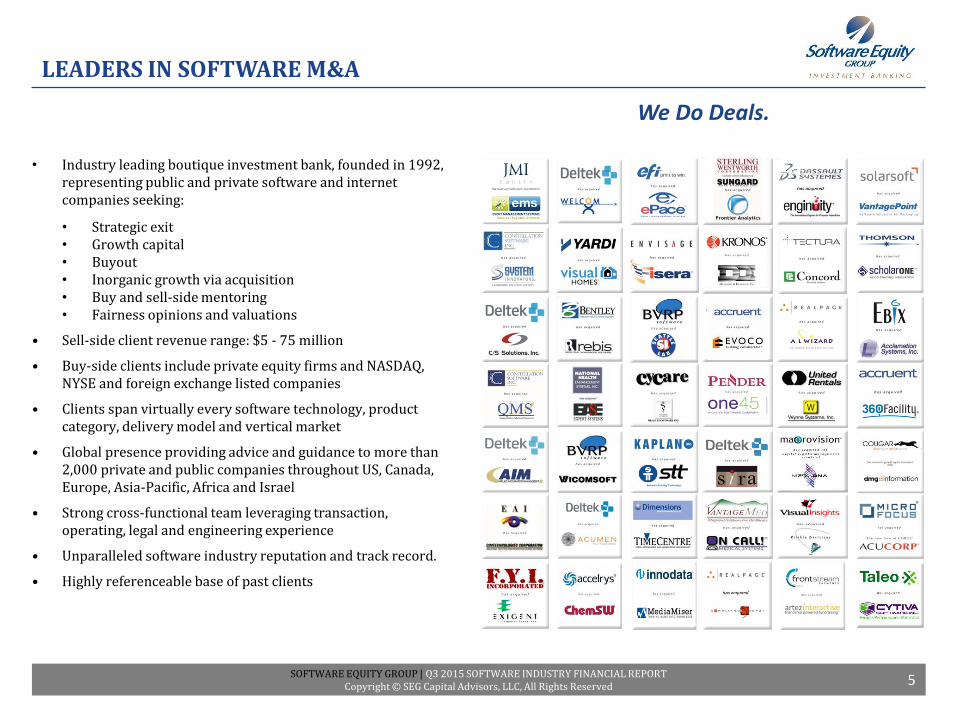
• Industry leading boutique investment bank, founded in 1992, representing public and private software and internet companies seeking:
• Strategic exit• Growth capital• Buyout • Inorganic growth via acquisition• Buy and sell-side mentoring• Fairness opinions and valuations
• Sell-side client revenue range: $5 - 75 million
• Buy-side clients include private equity firms and NASDAQ, NYSE and foreign exchange listed companies
• Clients span virtually every software technology, product category, delivery model and vertical market
• Global presence providing advice and guidance to more than 2,000 private and public companies throughout US, Canada, Europe, Asia-Pacific, Africa and Israel
• Strong cross-functional team leveraging transaction, operating, legal and engineering experience
• Unparalleled software industry reputation and track record.
• Highly referenceable base of past clients
We Do Deals.
LEADERS IN SOFTWARE M&A
SOFTWARE EQUITY GROUP | Q3 2015 SOFTWARE INDUSTRY FINANCIAL REPORTCopyright © SEG Capital Advisors, LLC, All Rights Reserved 6
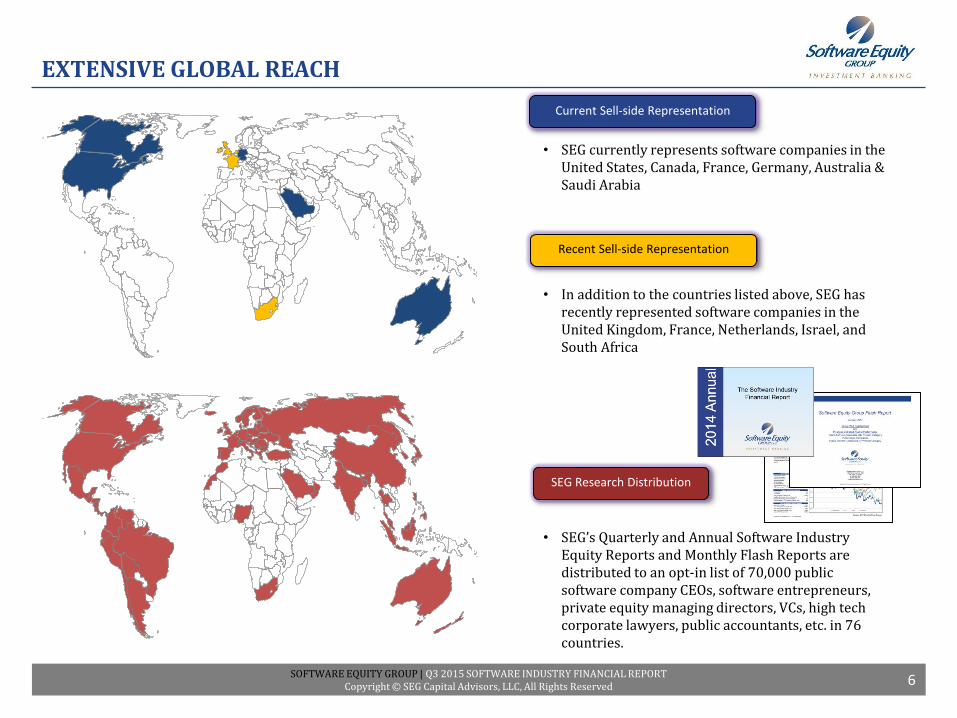
SEG Research Distribution
Current Sell-side Representation
Recent Sell-side Representation
• SEG currently represents software companies in the United States, Canada, France, Germany, Australia & Saudi Arabia
• In addition to the countries listed above, SEG has recently represented software companies in the United Kingdom, France, Netherlands, Israel, and South Africa
• SEG’s Quarterly and Annual Software Industry Equity Reports and Monthly Flash Reports are distributed to an opt-in list of 70,000 public software company CEOs, software entrepreneurs, private equity managing directors, VCs, high tech corporate lawyers, public accountants, etc. in 76 countries.
EXTENSIVE GLOBAL REACH
SOFTWARE EQUITY GROUP | Q3 2015 SOFTWARE INDUSTRY FINANCIAL REPORTCopyright © SEG Capital Advisors, LLC, All Rights Reserved
SOFTWARE INDUSTRY MACROECONOMICS
SOFTWARE EQUITY GROUP | Q3 2015 SOFTWARE INDUSTRY FINANCIAL REPORTCopyright © SEG Capital Advisors, LLC, All Rights Reserved 8
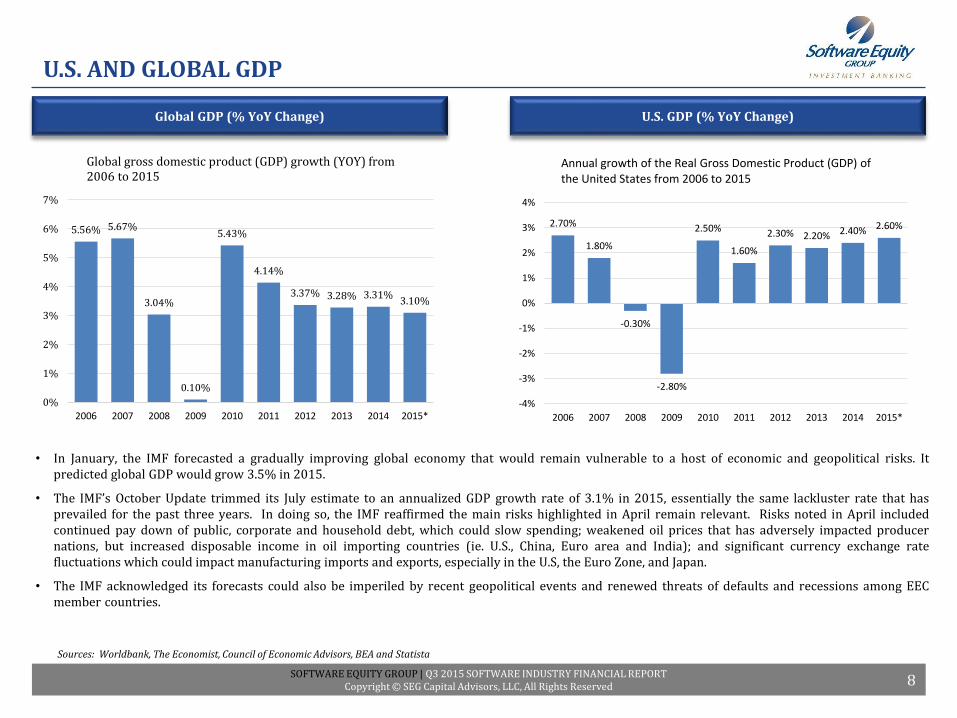
U.S. AND GLOBAL GDP
U.S. GDP (% YoY Change)Global GDP (% YoY Change)
Sources: Worldbank, The Economist, Council of Economic Advisors, BEA and Statista
• In January, the IMF forecasted a gradually improving global economy that would remain vulnerable to a host of economic and geopolitical risks. Itpredicted global GDP would grow 3.5% in 2015.
• The IMF’s October Update trimmed its July estimate to an annualized GDP growth rate of 3.1% in 2015, essentially the same lackluster rate that hasprevailed for the past three years. In doing so, the IMF reaffirmed the main risks highlighted in April remain relevant. Risks noted in April includedcontinued pay down of public, corporate and household debt, which could slow spending; weakened oil prices that has adversely impacted producernations, but increased disposable income in oil importing countries (ie. U.S., China, Euro area and India); and significant currency exchange ratefluctuations which could impact manufacturing imports and exports, especially in the U.S, the Euro Zone, and Japan.
• The IMF acknowledged its forecasts could also be imperiled by recent geopolitical events and renewed threats of defaults and recessions among EECmember countries.
5.56% 5.67%
3.04%
0.10%
5.43%
4.14%
3.37% 3.28% 3.31%3.10%
0%
1%
2%
3%
4%
5%
6%
7%
2006 2007 2008 2009 2010 2011 2012 2013 2014 2015*
Global gross domestic product (GDP) growth (YOY) from 2006 to 2015
2.70%
1.80%
-0.30%
-2.80%
2.50%
1.60%
2.30% 2.20% 2.40% 2.60%
-4%
-3%
-2%
-1%
0%
1%
2%
3%
4%
2006 2007 2008 2009 2010 2011 2012 2013 2014 2015*
Annual growth of the Real Gross Domestic Product (GDP) of the United States from 2006 to 2015
SOFTWARE EQUITY GROUP | Q3 2015 SOFTWARE INDUSTRY FINANCIAL REPORTCopyright © SEG Capital Advisors, LLC, All Rights Reserved 9
U.S. GDP AND UNEMPLOYMENT
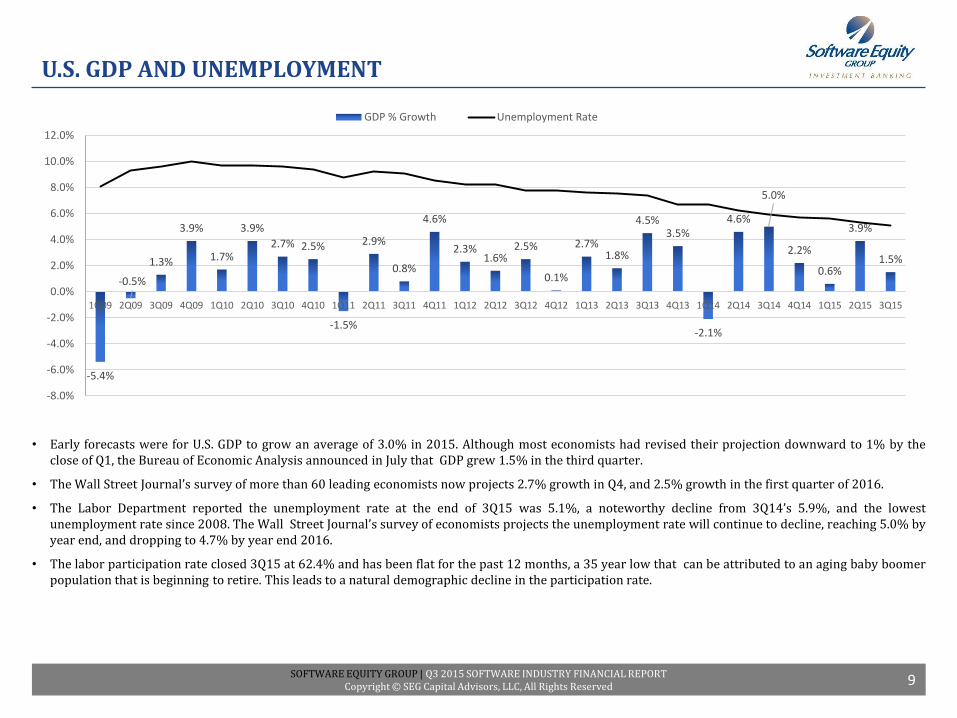
• Early forecasts were for U.S. GDP to grow an average of 3.0% in 2015. Although most economists had revised their projection downward to 1% by theclose of Q1, the Bureau of Economic Analysis announced in July that GDP grew 1.5% in the third quarter.
• The Wall Street Journal’s survey of more than 60 leading economists now projects 2.7% growth in Q4, and 2.5% growth in the first quarter of 2016.
• The Labor Department reported the unemployment rate at the end of 3Q15 was 5.1%, a noteworthy decline from 3Q14’s 5.9%, and the lowestunemployment rate since 2008. The Wall Street Journal’s survey of economists projects the unemployment rate will continue to decline, reaching 5.0% byyear end, and dropping to 4.7% by year end 2016.
• The labor participation rate closed 3Q15 at 62.4% and has been flat for the past 12 months, a 35 year low that can be attributed to an aging baby boomerpopulation that is beginning to retire. This leads to a natural demographic decline in the participation rate.
-5.4%
-0.5%
1.3%
3.9%
1.7%
3.9%
2.7% 2.5%
-1.5%
2.9%
0.8%
4.6%
2.3%1.6%
2.5%
0.1%
2.7%1.8%
4.5%3.5%
-2.1%
4.6%
5.0%
2.2%
0.6%
3.9%
1.5%
-8.0%
-6.0%
-4.0%
-2.0%
0.0%
2.0%
4.0%
6.0%
8.0%
10.0%
12.0%
1Q09 2Q09 3Q09 4Q09 1Q10 2Q10 3Q10 4Q10 1Q11 2Q11 3Q11 4Q11 1Q12 2Q12 3Q12 4Q12 1Q13 2Q13 3Q13 4Q13 1Q14 2Q14 3Q14 4Q14 1Q15 2Q15 3Q15
GDP % Growth Unemployment Rate
SOFTWARE EQUITY GROUP | Q3 2015 SOFTWARE INDUSTRY FINANCIAL REPORTCopyright © SEG Capital Advisors, LLC, All Rights Reserved 10
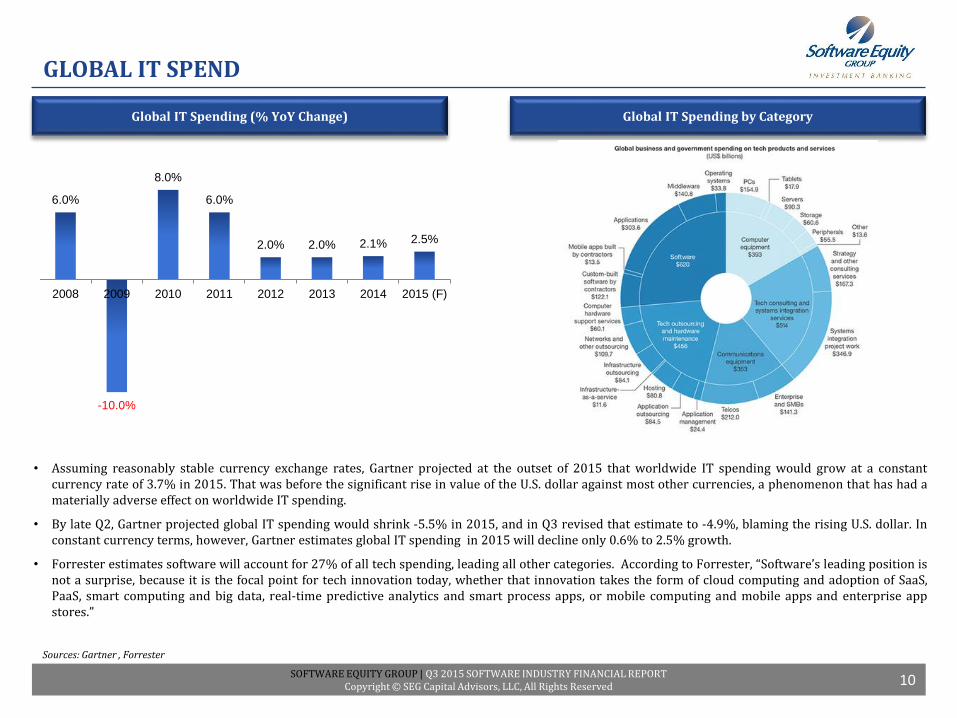
GLOBAL IT SPEND
Sources: Gartner , Forrester
• Assuming reasonably stable currency exchange rates, Gartner projected at the outset of 2015 that worldwide IT spending would grow at a constantcurrency rate of 3.7% in 2015. That was before the significant rise in value of the U.S. dollar against most other currencies, a phenomenon that has had amaterially adverse effect on worldwide IT spending.
• By late Q2, Gartner projected global IT spending would shrink -5.5% in 2015, and in Q3 revised that estimate to -4.9%, blaming the rising U.S. dollar. Inconstant currency terms, however, Gartner estimates global IT spending in 2015 will decline only 0.6% to 2.5% growth.
• Forrester estimates software will account for 27% of all tech spending, leading all other categories. According to Forrester, “Software’s leading position isnot a surprise, because it is the focal point for tech innovation today, whether that innovation takes the form of cloud computing and adoption of SaaS,PaaS, smart computing and big data, real-time predictive analytics and smart process apps, or mobile computing and mobile apps and enterprise appstores.”
Global IT Spending by CategoryGlobal IT Spending (% YoY Change)
6.0%
-10.0%
8.0%
6.0%
2.0% 2.0% 2.1% 2.5%
2008 2009 2010 2011 2012 2013 2014 2015 (F)
SOFTWARE EQUITY GROUP | Q3 2015 SOFTWARE INDUSTRY FINANCIAL REPORTCopyright © SEG Capital Advisors, LLC, All Rights Reserved 11
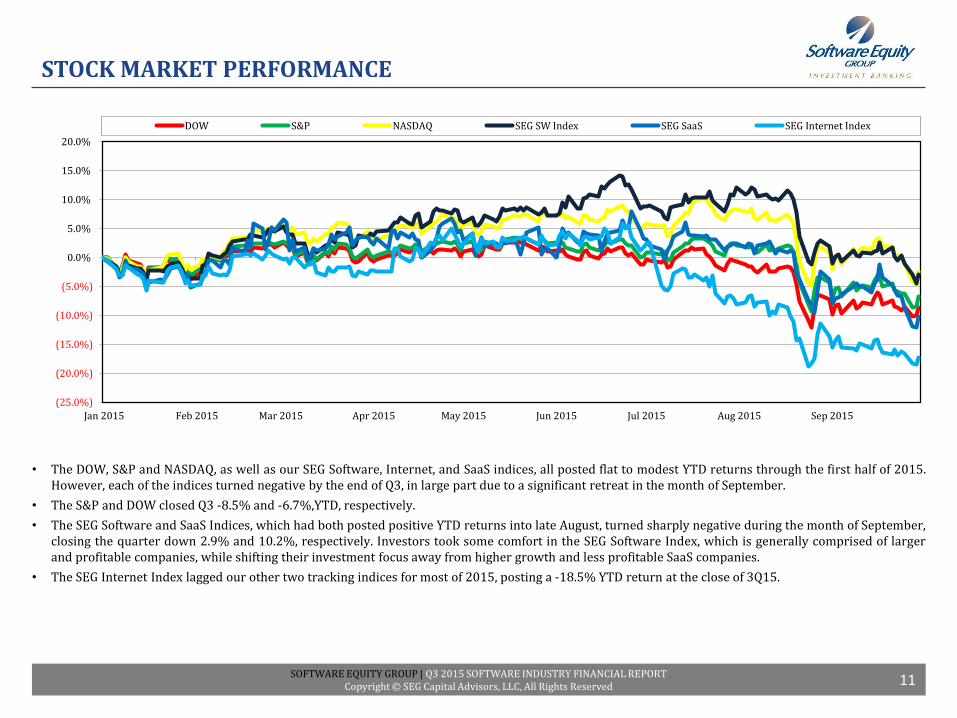
STOCK MARKET PERFORMANCE
• The DOW, S&P and NASDAQ, as well as our SEG Software, Internet, and SaaS indices, all posted flat to modest YTD returns through the first half of 2015.However, each of the indices turned negative by the end of Q3, in large part due to a significant retreat in the month of September.
• The S&P and DOW closed Q3 -8.5% and -6.7%,YTD, respectively.
• The SEG Software and SaaS Indices, which had both posted positive YTD returns into late August, turned sharply negative during the month of September,closing the quarter down 2.9% and 10.2%, respectively. Investors took some comfort in the SEG Software Index, which is generally comprised of largerand profitable companies, while shifting their investment focus away from higher growth and less profitable SaaS companies.
• The SEG Internet Index lagged our other two tracking indices for most of 2015, posting a -18.5% YTD return at the close of 3Q15.
(25.0%)
(20.0%)
(15.0%)
(10.0%)
(5.0%)
0.0%
5.0%
10.0%
15.0%
20.0%
Jan 2015 Feb 2015 Mar 2015 Apr 2015 May 2015 Jun 2015 Jul 2015 Aug 2015 Sep 2015
DOW S&P NASDAQ SEG SW Index SEG SaaS SEG Internet Index
SOFTWARE EQUITY GROUP | Q3 2015 SOFTWARE INDUSTRY FINANCIAL REPORTCopyright © SEG Capital Advisors, LLC, All Rights Reserved
THE SEG SOFTWARE INDUSTRY FINANCIAL REPORT
PUBLIC SOFTWARE COMPANY FINANCIAL PERFORMANCE AND MARKET MULTIPLE TRENDS
SOFTWARE EQUITY GROUP | Q3 2015 SOFTWARE INDUSTRY FINANCIAL REPORTCopyright © SEG Capital Advisors, LLC, All Rights Reserved 13
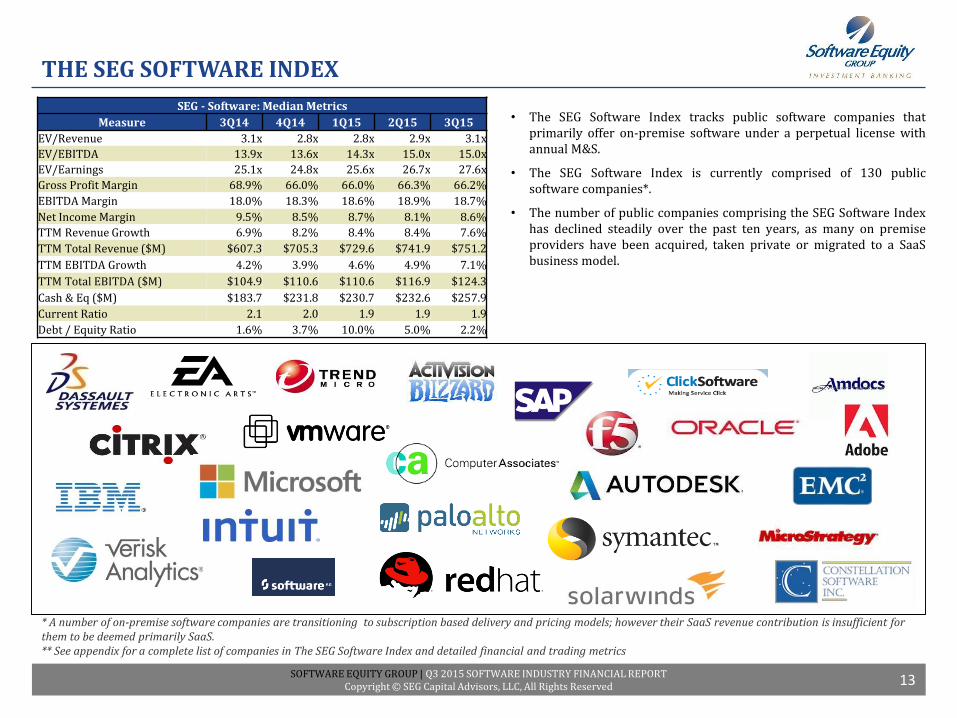
THE SEG SOFTWARE INDEX
• The SEG Software Index tracks public software companies thatprimarily offer on-premise software under a perpetual license withannual M&S.
• The SEG Software Index is currently comprised of 130 publicsoftware companies*.
• The number of public companies comprising the SEG Software Indexhas declined steadily over the past ten years, as many on premiseproviders have been acquired, taken private or migrated to a SaaSbusiness model.
* A number of on-premise software companies are transitioning to subscription based delivery and pricing models; however their SaaS revenue contribution is insufficient for them to be deemed primarily SaaS. ** See appendix for a complete list of companies in The SEG Software Index and detailed financial and trading metrics
SEG - Software: Median Metrics
Measure 3Q14 4Q14 1Q15 2Q15 3Q15
EV/Revenue 3.1x 2.8x 2.8x 2.9x 3.1x
EV/EBITDA 13.9x 13.6x 14.3x 15.0x 15.0x
EV/Earnings 25.1x 24.8x 25.6x 26.7x 27.6x
Gross Profit Margin 68.9% 66.0% 66.0% 66.3% 66.2%
EBITDA Margin 18.0% 18.3% 18.6% 18.9% 18.7%
Net Income Margin 9.5% 8.5% 8.7% 8.1% 8.6%
TTM Revenue Growth 6.9% 8.2% 8.4% 8.4% 7.6%
TTM Total Revenue ($M) $607.3 $705.3 $729.6 $741.9 $751.2
TTM EBITDA Growth 4.2% 3.9% 4.6% 4.9% 7.1%
TTM Total EBITDA ($M) $104.9 $110.6 $110.6 $116.9 $124.3
Cash & Eq ($M) $183.7 $231.8 $230.7 $232.6 $257.9
Current Ratio 2.1 2.0 1.9 1.9 1.9
Debt / Equity Ratio 1.6% 3.7% 10.0% 5.0% 2.2%
SOFTWARE EQUITY GROUP | Q3 2015 SOFTWARE INDUSTRY FINANCIAL REPORTCopyright © SEG Capital Advisors, LLC, All Rights Reserved
THE SEG SOFTWARE INDEX: FINANCIAL PERFORMANCE
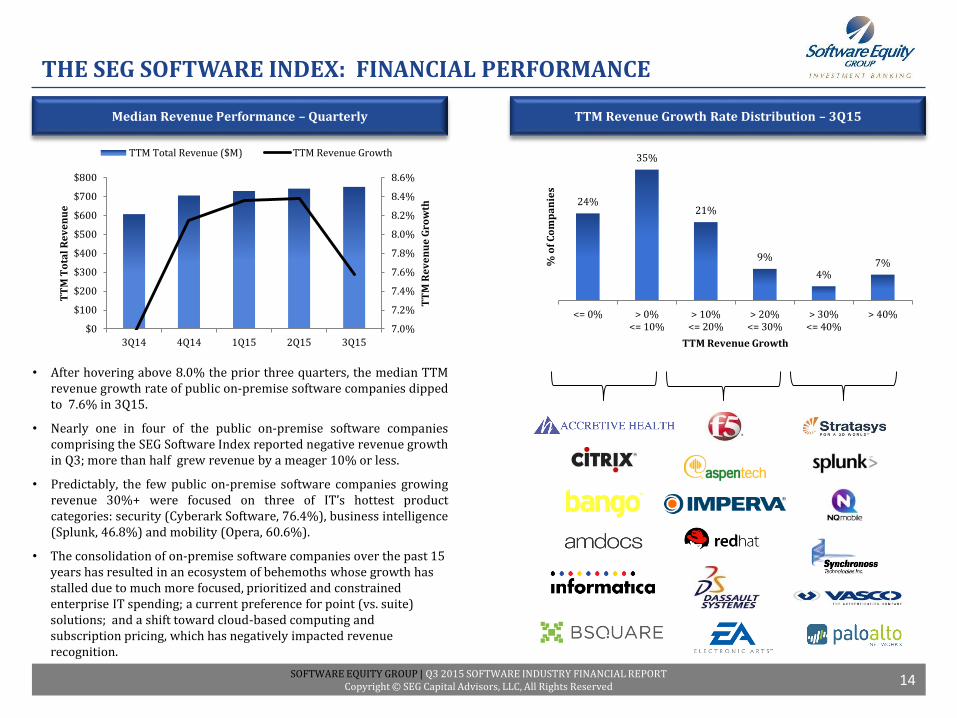
• After hovering above 8.0% the prior three quarters, the median TTMrevenue growth rate of public on-premise software companies dippedto 7.6% in 3Q15.
• Nearly one in four of the public on-premise software companiescomprising the SEG Software Index reported negative revenue growthin Q3; more than half grew revenue by a meager 10% or less.
• Predictably, the few public on-premise software companies growingrevenue 30%+ were focused on three of IT’s hottest productcategories: security (Cyberark Software, 76.4%), business intelligence(Splunk, 46.8%) and mobility (Opera, 60.6%).
• The consolidation of on-premise software companies over the past 15 years has resulted in an ecosystem of behemoths whose growth has stalled due to much more focused, prioritized and constrained enterprise IT spending; a current preference for point (vs. suite) solutions; and a shift toward cloud-based computing and subscription pricing, which has negatively impacted revenue recognition.
TTM Revenue Growth Rate Distribution – 3Q15Median Revenue Performance – Quarterly
14
7.0%
7.2%
7.4%
7.6%
7.8%
8.0%
8.2%
8.4%
8.6%
$0
$100
$200
$300
$400
$500
$600
$700
$800
3Q14 4Q14 1Q15 2Q15 3Q15
TT
M R
ev
en
ue
Gro
wth
TT
M T
ota
l R
ev
en
ue
TTM Total Revenue ($M) TTM Revenue Growth
24%
35%
21%
9%
4%7%
<= 0% > 0%<= 10%
> 10%<= 20%
> 20%<= 30%
> 30%<= 40%
> 40%
% o
f C
om
pa
nie
s
TTM Revenue Growth
SOFTWARE EQUITY GROUP | Q3 2015 SOFTWARE INDUSTRY FINANCIAL REPORTCopyright © SEG Capital Advisors, LLC, All Rights Reserved
THE SEG SOFTWARE INDEX: FINANCIAL PERFORMANCE
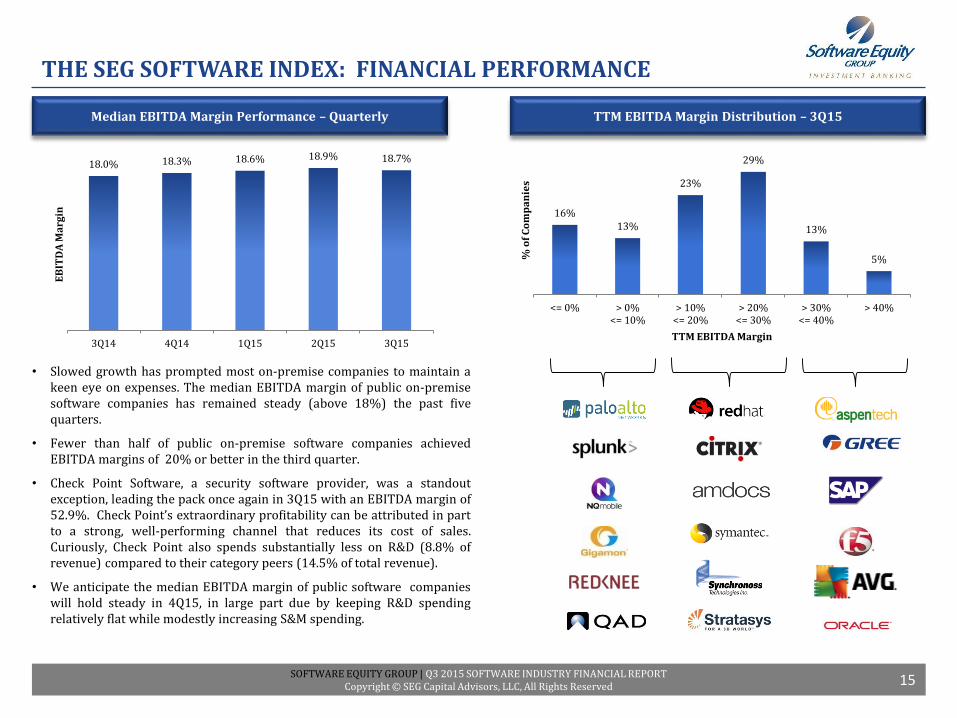
• Slowed growth has prompted most on-premise companies to maintain akeen eye on expenses. The median EBITDA margin of public on-premisesoftware companies has remained steady (above 18%) the past fivequarters.
• Fewer than half of public on-premise software companies achievedEBITDA margins of 20% or better in the third quarter.
• Check Point Software, a security software provider, was a standoutexception, leading the pack once again in 3Q15 with an EBITDA margin of52.9%. Check Point’s extraordinary profitability can be attributed in partto a strong, well-performing channel that reduces its cost of sales.Curiously, Check Point also spends substantially less on R&D (8.8% ofrevenue) compared to their category peers (14.5% of total revenue).
• We anticipate the median EBITDA margin of public software companieswill hold steady in 4Q15, in large part due by keeping R&D spendingrelatively flat while modestly increasing S&M spending.
TTM EBITDA Margin Distribution – 3Q15Median EBITDA Margin Performance – Quarterly
15
16%13%
23%
29%
13%
5%
<= 0% > 0%<= 10%
> 10%<= 20%
> 20%<= 30%
> 30%<= 40%
> 40%
% o
f C
om
pa
nie
s
TTM EBITDA Margin
18.0% 18.3% 18.6% 18.9% 18.7%
3Q14 4Q14 1Q15 2Q15 3Q15
EB
ITD
A M
arg
in
SOFTWARE EQUITY GROUP | Q3 2015 SOFTWARE INDUSTRY FINANCIAL REPORTCopyright © SEG Capital Advisors, LLC, All Rights Reserved
THE SEG SOFTWARE INDEX: FINANCIAL PERFORMANCE
Median Margin PerformanceMedian Operating Ratios
16
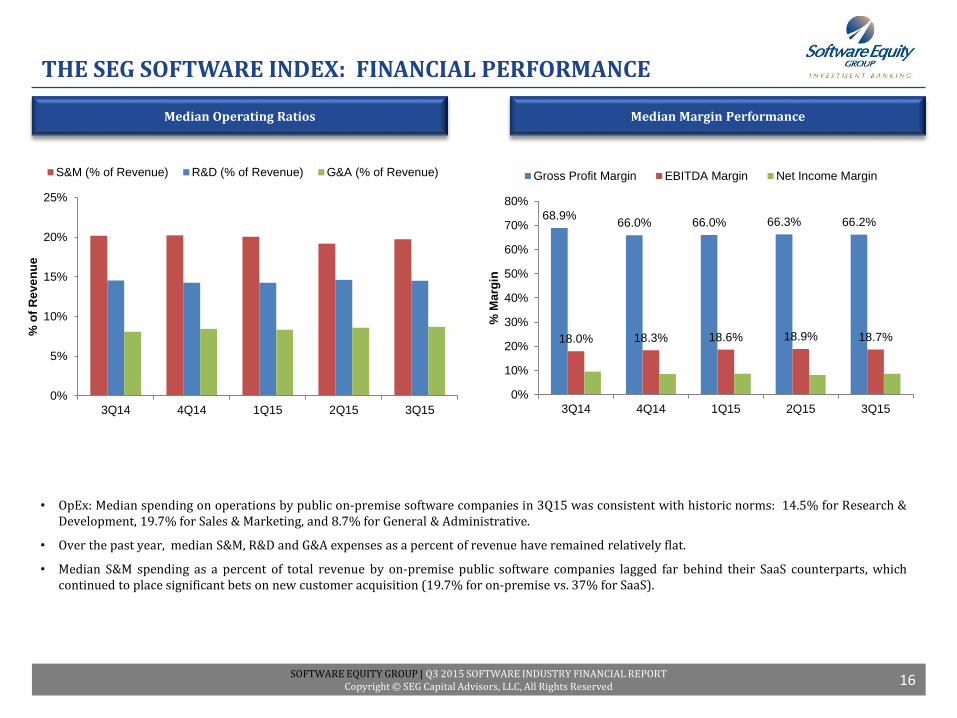
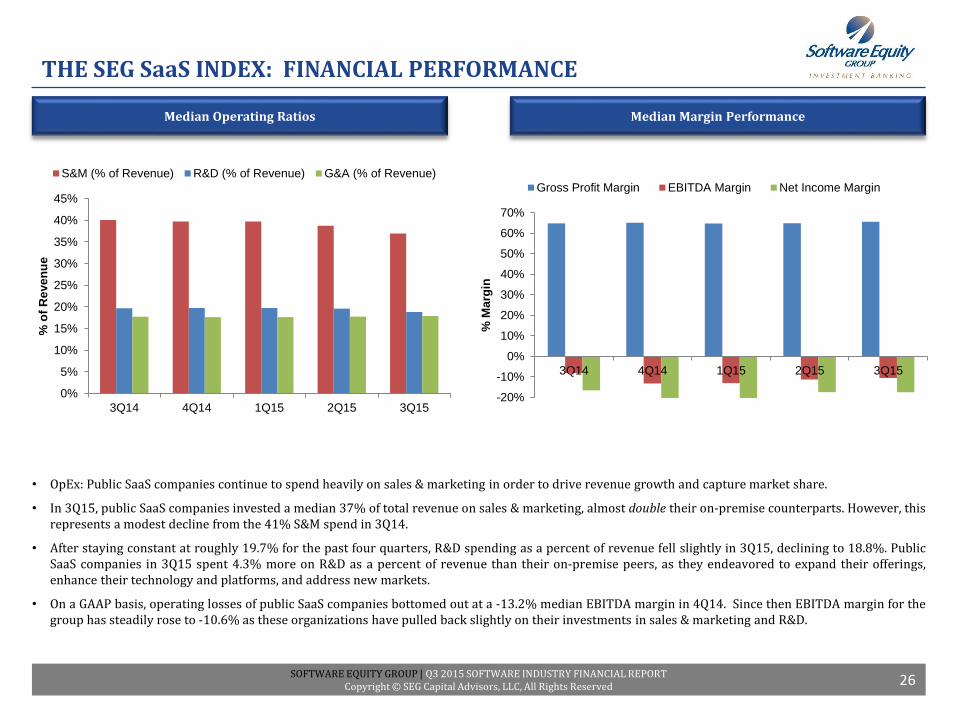
• OpEx: Median spending on operations by public on-premise software companies in 3Q15 was consistent with historic norms: 14.5% for Research &Development, 19.7% for Sales & Marketing, and 8.7% for General & Administrative.
• Over the past year, median S&M, R&D and G&A expenses as a percent of revenue have remained relatively flat.
• Median S&M spending as a percent of total revenue by on-premise public software companies lagged far behind their SaaS counterparts, whichcontinued to place significant bets on new customer acquisition (19.7% for on-premise vs. 37% for SaaS).
0%
5%
10%
15%
20%
25%
3Q14 4Q14 1Q15 2Q15 3Q15
% o
f R
eve
nu
e
S&M (% of Revenue) R&D (% of Revenue) G&A (% of Revenue)
68.9%66.0% 66.0% 66.3% 66.2%
18.0% 18.3% 18.6% 18.9% 18.7%
0%
10%
20%
30%
40%
50%
60%
70%
80%
3Q14 4Q14 1Q15 2Q15 3Q15
% M
arg
in
Gross Profit Margin EBITDA Margin Net Income Margin
SOFTWARE EQUITY GROUP | Q3 2015 SOFTWARE INDUSTRY FINANCIAL REPORTCopyright © SEG Capital Advisors, LLC, All Rights Reserved
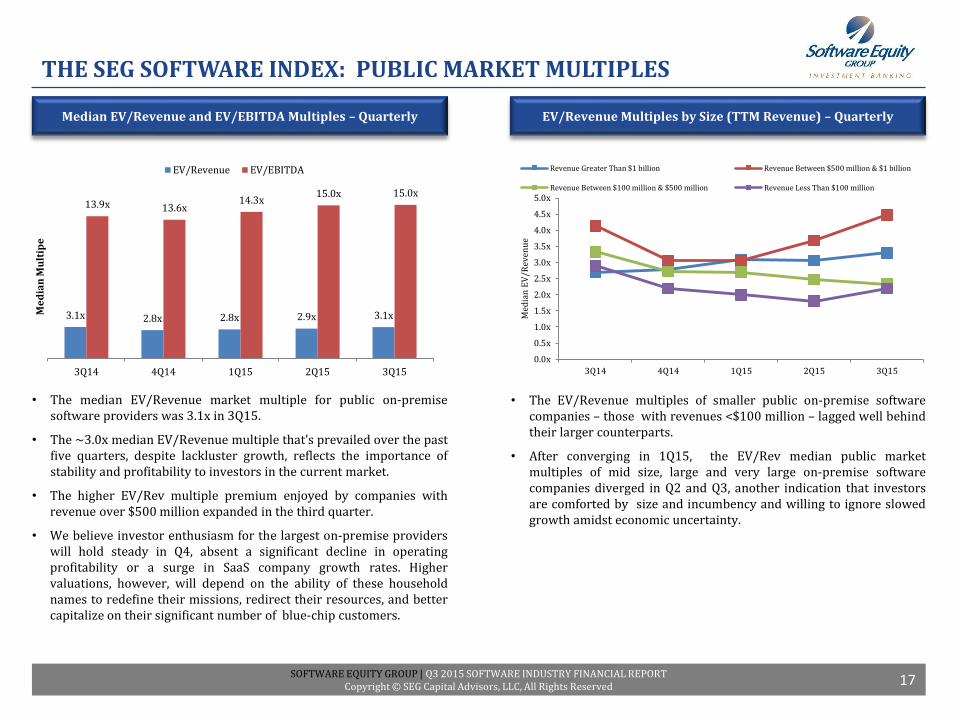
• The EV/Revenue multiples of smaller public on-premise softwarecompanies – those with revenues <$100 million – lagged well behindtheir larger counterparts.
• After converging in 1Q15, the EV/Rev median public marketmultiples of mid size, large and very large on-premise softwarecompanies diverged in Q2 and Q3, another indication that investorsare comforted by size and incumbency and willing to ignore slowedgrowth amidst economic uncertainty.
THE SEG SOFTWARE INDEX: PUBLIC MARKET MULTIPLES
• The median EV/Revenue market multiple for public on-premisesoftware providers was 3.1x in 3Q15.
• The ~3.0x median EV/Revenue multiple that’s prevailed over the pastfive quarters, despite lackluster growth, reflects the importance ofstability and profitability to investors in the current market.
• The higher EV/Rev multiple premium enjoyed by companies withrevenue over $500 million expanded in the third quarter.
• We believe investor enthusiasm for the largest on-premise providerswill hold steady in Q4, absent a significant decline in operatingprofitability or a surge in SaaS company growth rates. Highervaluations, however, will depend on the ability of these householdnames to redefine their missions, redirect their resources, and bettercapitalize on their significant number of blue-chip customers.
EV/Revenue Multiples by Size (TTM Revenue) – QuarterlyMedian EV/Revenue and EV/EBITDA Multiples – Quarterly
17
3.1x 2.8x 2.8x 2.9x 3.1x
13.9x 13.6x14.3x
15.0x 15.0x
3Q14 4Q14 1Q15 2Q15 3Q15
Me
dia
n M
ult
ipe
EV/Revenue EV/EBITDA
0.0x
0.5x
1.0x
1.5x
2.0x
2.5x
3.0x
3.5x
4.0x
4.5x
5.0x
3Q14 4Q14 1Q15 2Q15 3Q15
Med
ian
EV
/Rev
enu
e
Revenue Greater Than $1 billion Revenue Between $500 million & $1 billion
Revenue Between $100 million & $500 million Revenue Less Than $100 million
SOFTWARE EQUITY GROUP | Q3 2015 SOFTWARE INDUSTRY FINANCIAL REPORTCopyright © SEG Capital Advisors, LLC, All Rights Reserved
THE SEG SOFTWARE INDEX: PUBLIC MARKET MULTIPLES
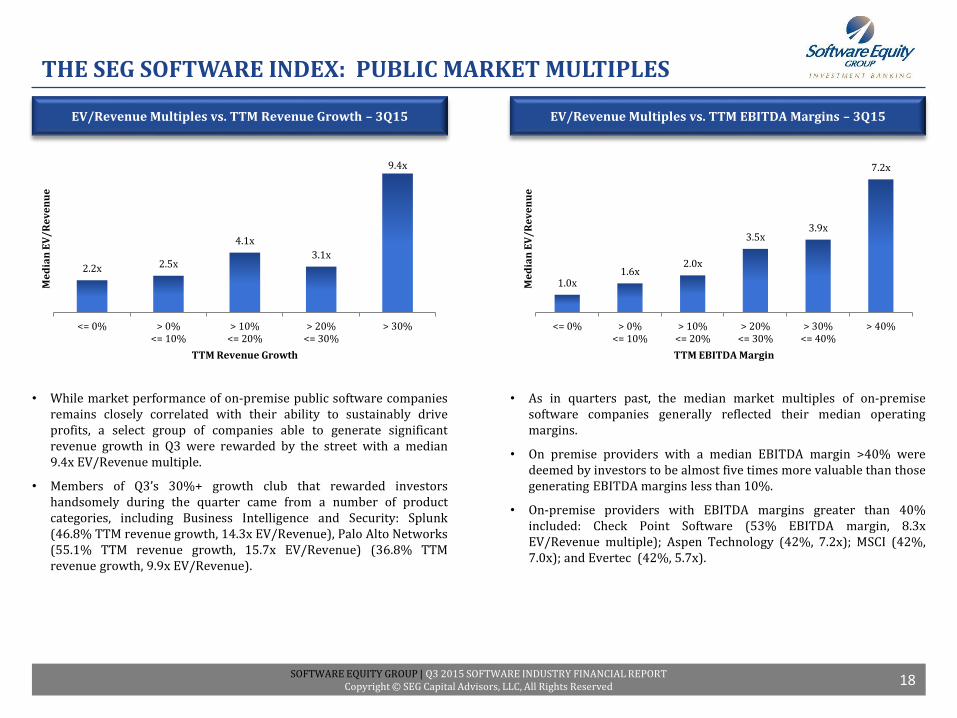
• While market performance of on-premise public software companiesremains closely correlated with their ability to sustainably driveprofits, a select group of companies able to generate significantrevenue growth in Q3 were rewarded by the street with a median9.4x EV/Revenue multiple.
• Members of Q3’s 30%+ growth club that rewarded investorshandsomely during the quarter came from a number of productcategories, including Business Intelligence and Security: Splunk(46.8% TTM revenue growth, 14.3x EV/Revenue), Palo Alto Networks(55.1% TTM revenue growth, 15.7x EV/Revenue) (36.8% TTMrevenue growth, 9.9x EV/Revenue).
• As in quarters past, the median market multiples of on-premisesoftware companies generally reflected their median operatingmargins.
• On premise providers with a median EBITDA margin >40% weredeemed by investors to be almost five times more valuable than thosegenerating EBITDA margins less than 10%.
• On-premise providers with EBITDA margins greater than 40%included: Check Point Software (53% EBITDA margin, 8.3xEV/Revenue multiple); Aspen Technology (42%, 7.2x); MSCI (42%,7.0x); and Evertec (42%, 5.7x).
EV/Revenue Multiples vs. TTM EBITDA Margins – 3Q15EV/Revenue Multiples vs. TTM Revenue Growth – 3Q15
18
1.0x1.6x
2.0x
3.5x3.9x
7.2x
<= 0% > 0%<= 10%
> 10%<= 20%
> 20%<= 30%
> 30%<= 40%
> 40%
Me
dia
n E
V/
Re
ve
nu
e
TTM EBITDA Margin
2.2x 2.5x
4.1x
3.1x
9.4x
<= 0% > 0%<= 10%
> 10%<= 20%
> 20%<= 30%
> 30%
Me
dia
n E
V/
Re
ve
nu
e
TTM Revenue Growth
SOFTWARE EQUITY GROUP | Q3 2015 SOFTWARE INDUSTRY FINANCIAL REPORTCopyright © SEG Capital Advisors, LLC, All Rights Reserved 19
THE SOFTWARE INDEX BY PRODUCT CATEGORY
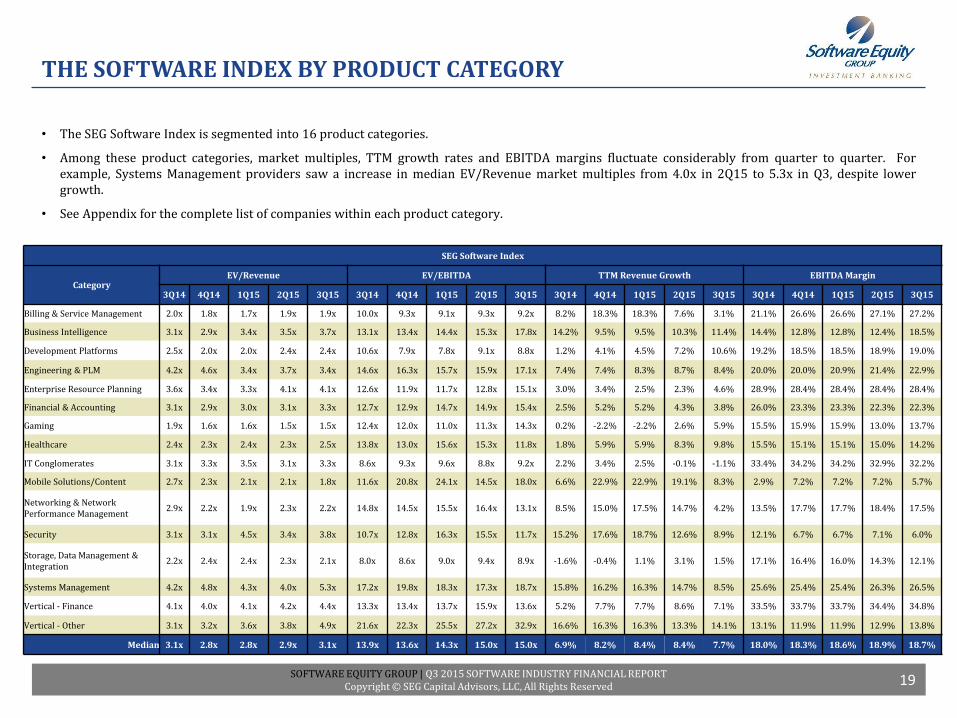
• The SEG Software Index is segmented into 16 product categories.
• Among these product categories, market multiples, TTM growth rates and EBITDA margins fluctuate considerably from quarter to quarter. Forexample, Systems Management providers saw a increase in median EV/Revenue market multiples from 4.0x in 2Q15 to 5.3x in Q3, despite lowergrowth.
• See Appendix for the complete list of companies within each product category.
SEG Software Index
CategoryEV/Revenue EV/EBITDA TTM Revenue Growth EBITDA Margin
3Q14 4Q14 1Q15 2Q15 3Q15 3Q14 4Q14 1Q15 2Q15 3Q15 3Q14 4Q14 1Q15 2Q15 3Q15 3Q14 4Q14 1Q15 2Q15 3Q15
Billing & Service Management 2.0x 1.8x 1.7x 1.9x 1.9x 10.0x 9.3x 9.1x 9.3x 9.2x 8.2% 18.3% 18.3% 7.6% 3.1% 21.1% 26.6% 26.6% 27.1% 27.2%
Business Intelligence 3.1x 2.9x 3.4x 3.5x 3.7x 13.1x 13.4x 14.4x 15.3x 17.8x 14.2% 9.5% 9.5% 10.3% 11.4% 14.4% 12.8% 12.8% 12.4% 18.5%
Development Platforms 2.5x 2.0x 2.0x 2.4x 2.4x 10.6x 7.9x 7.8x 9.1x 8.8x 1.2% 4.1% 4.5% 7.2% 10.6% 19.2% 18.5% 18.5% 18.9% 19.0%
Engineering & PLM 4.2x 4.6x 3.4x 3.7x 3.4x 14.6x 16.3x 15.7x 15.9x 17.1x 7.4% 7.4% 8.3% 8.7% 8.4% 20.0% 20.0% 20.9% 21.4% 22.9%
Enterprise Resource Planning 3.6x 3.4x 3.3x 4.1x 4.1x 12.6x 11.9x 11.7x 12.8x 15.1x 3.0% 3.4% 2.5% 2.3% 4.6% 28.9% 28.4% 28.4% 28.4% 28.4%
Financial & Accounting 3.1x 2.9x 3.0x 3.1x 3.3x 12.7x 12.9x 14.7x 14.9x 15.4x 2.5% 5.2% 5.2% 4.3% 3.8% 26.0% 23.3% 23.3% 22.3% 22.3%
Gaming 1.9x 1.6x 1.6x 1.5x 1.5x 12.4x 12.0x 11.0x 11.3x 14.3x 0.2% -2.2% -2.2% 2.6% 5.9% 15.5% 15.9% 15.9% 13.0% 13.7%
Healthcare 2.4x 2.3x 2.4x 2.3x 2.5x 13.8x 13.0x 15.6x 15.3x 11.8x 1.8% 5.9% 5.9% 8.3% 9.8% 15.5% 15.1% 15.1% 15.0% 14.2%
IT Conglomerates 3.1x 3.3x 3.5x 3.1x 3.3x 8.6x 9.3x 9.6x 8.8x 9.2x 2.2% 3.4% 2.5% -0.1% -1.1% 33.4% 34.2% 34.2% 32.9% 32.2%
Mobile Solutions/Content 2.7x 2.3x 2.1x 2.1x 1.8x 11.6x 20.8x 24.1x 14.5x 18.0x 6.6% 22.9% 22.9% 19.1% 8.3% 2.9% 7.2% 7.2% 7.2% 5.7%
Networking & Network Performance Management
2.9x 2.2x 1.9x 2.3x 2.2x 14.8x 14.5x 15.5x 16.4x 13.1x 8.5% 15.0% 17.5% 14.7% 4.2% 13.5% 17.7% 17.7% 18.4% 17.5%
Security 3.1x 3.1x 4.5x 3.4x 3.8x 10.7x 12.8x 16.3x 15.5x 11.7x 15.2% 17.6% 18.7% 12.6% 8.9% 12.1% 6.7% 6.7% 7.1% 6.0%
Storage, Data Management & Integration
2.2x 2.4x 2.4x 2.3x 2.1x 8.0x 8.6x 9.0x 9.4x 8.9x -1.6% -0.4% 1.1% 3.1% 1.5% 17.1% 16.4% 16.0% 14.3% 12.1%
Systems Management 4.2x 4.8x 4.3x 4.0x 5.3x 17.2x 19.8x 18.3x 17.3x 18.7x 15.8% 16.2% 16.3% 14.7% 8.5% 25.6% 25.4% 25.4% 26.3% 26.5%
Vertical - Finance 4.1x 4.0x 4.1x 4.2x 4.4x 13.3x 13.4x 13.7x 15.9x 13.6x 5.2% 7.7% 7.7% 8.6% 7.1% 33.5% 33.7% 33.7% 34.4% 34.8%
Vertical - Other 3.1x 3.2x 3.6x 3.8x 4.9x 21.6x 22.3x 25.5x 27.2x 32.9x 16.6% 16.3% 16.3% 13.3% 14.1% 13.1% 11.9% 11.9% 12.9% 13.8%
Median 3.1x 2.8x 2.8x 2.9x 3.1x 13.9x 13.6x 14.3x 15.0x 15.0x 6.9% 8.2% 8.4% 8.4% 7.7% 18.0% 18.3% 18.6% 18.9% 18.7%
SOFTWARE EQUITY GROUP | Q3 2015 SOFTWARE INDUSTRY FINANCIAL REPORTCopyright © SEG Capital Advisors, LLC, All Rights Reserved 20
THE SEG SOFTWARE INDEX BY PRODUCT CATEGORY:FINANCIAL PERFORMANCE
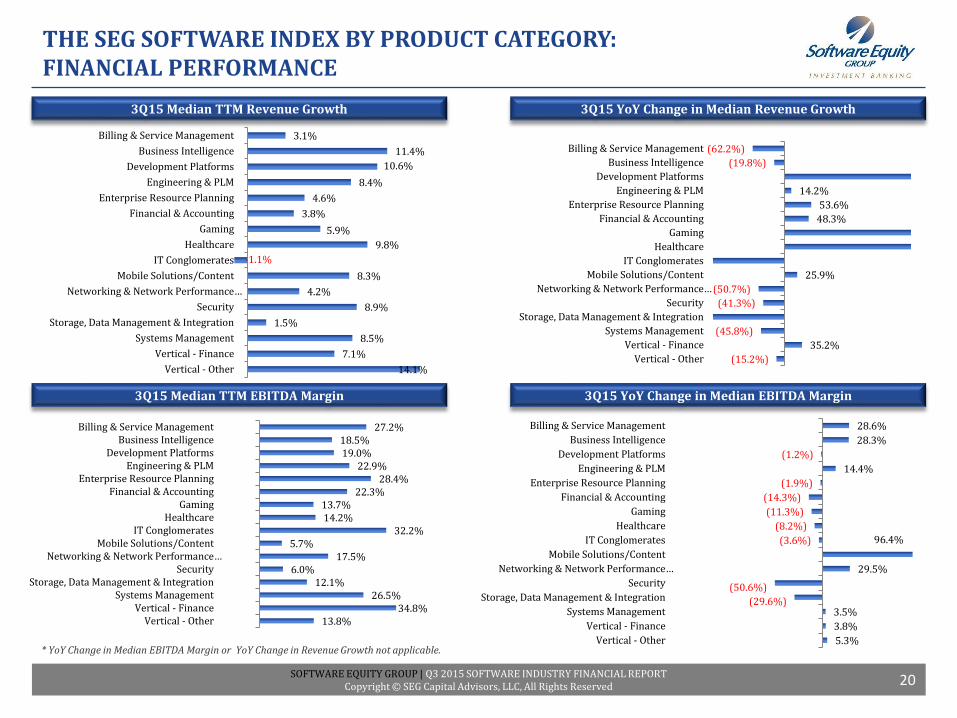
3Q15 YoY Change in Median Revenue Growth3Q15 Median TTM Revenue Growth
3Q15 YoY Change in Median EBITDA Margin3Q15 Median TTM EBITDA Margin
* YoY Change in Median EBITDA Margin or YoY Change in Revenue Growth not applicable.
3.1%
11.4%
10.6%
8.4%
4.6%
3.8%
5.9%
9.8%
-1.1%
8.3%
4.2%
8.9%
1.5%
8.5%
7.1%
14.1%
Billing & Service Management
Business Intelligence
Development Platforms
Engineering & PLM
Enterprise Resource Planning
Financial & Accounting
Gaming
Healthcare
IT Conglomerates
Mobile Solutions/Content
Networking & Network Performance…
Security
Storage, Data Management & Integration
Systems Management
Vertical - Finance
Vertical - Other
27.2%18.5%19.0%
22.9%28.4%
22.3%13.7%14.2%
32.2%5.7%
17.5%6.0%
12.1%26.5%
34.8%13.8%
Billing & Service ManagementBusiness Intelligence
Development PlatformsEngineering & PLM
Enterprise Resource PlanningFinancial & Accounting
GamingHealthcare
IT ConglomeratesMobile Solutions/Content
Networking & Network Performance…Security
Storage, Data Management & IntegrationSystems Management
Vertical - FinanceVertical - Other
(62.2%)
(19.8%)
14.2%
53.6%
48.3%
25.9%
(50.7%)
(41.3%)
(45.8%)
35.2%
(15.2%)
Billing & Service Management
Business Intelligence
Development Platforms
Engineering & PLM
Enterprise Resource Planning
Financial & Accounting
Gaming
Healthcare
IT Conglomerates
Mobile Solutions/Content
Networking & Network Performance…
Security
Storage, Data Management & Integration
Systems Management
Vertical - Finance
Vertical - Other
28.6%
28.3%
(1.2%)
14.4%
(1.9%)
(14.3%)
(11.3%)
(8.2%)
(3.6%) 96.4%
29.5%
(50.6%)
(29.6%)3.5%
3.8%
5.3%
Billing & Service Management
Business Intelligence
Development Platforms
Engineering & PLM
Enterprise Resource Planning
Financial & Accounting
Gaming
Healthcare
IT Conglomerates
Mobile Solutions/Content
Networking & Network Performance…
Security
Storage, Data Management & Integration
Systems Management
Vertical - Finance
Vertical - Other
SOFTWARE EQUITY GROUP | Q3 2015 SOFTWARE INDUSTRY FINANCIAL REPORTCopyright © SEG Capital Advisors, LLC, All Rights Reserved 21
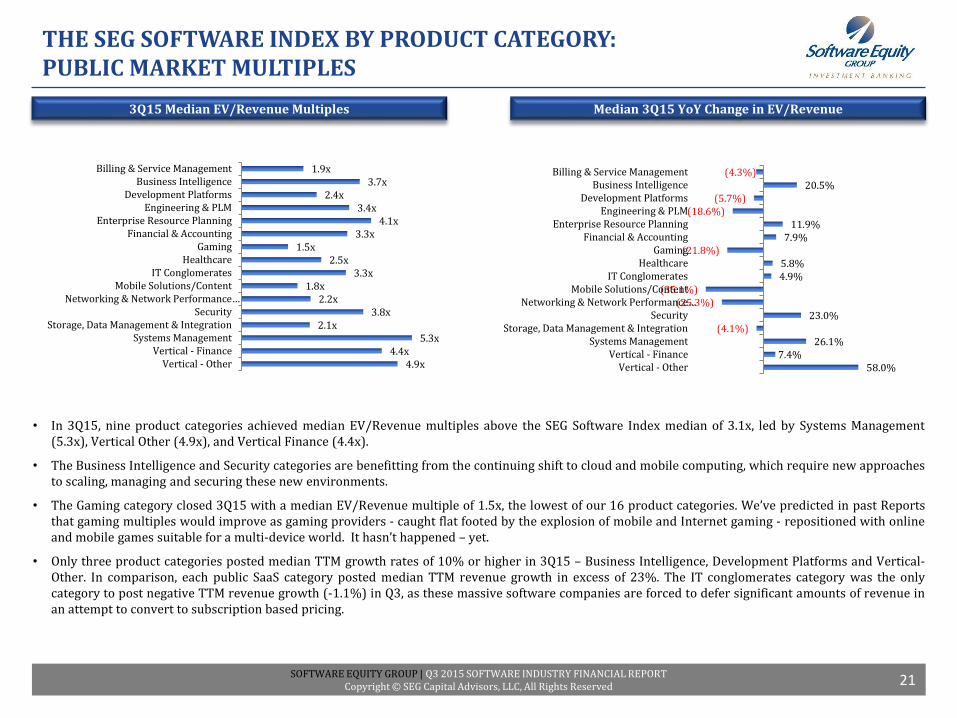
• In 3Q15, nine product categories achieved median EV/Revenue multiples above the SEG Software Index median of 3.1x, led by Systems Management(5.3x), Vertical Other (4.9x), and Vertical Finance (4.4x).
• The Business Intelligence and Security categories are benefitting from the continuing shift to cloud and mobile computing, which require new approachesto scaling, managing and securing these new environments.
• The Gaming category closed 3Q15 with a median EV/Revenue multiple of 1.5x, the lowest of our 16 product categories. We’ve predicted in past Reportsthat gaming multiples would improve as gaming providers - caught flat footed by the explosion of mobile and Internet gaming - repositioned with onlineand mobile games suitable for a multi-device world. It hasn’t happened – yet.
• Only three product categories posted median TTM growth rates of 10% or higher in 3Q15 – Business Intelligence, Development Platforms and Vertical-Other. In comparison, each public SaaS category posted median TTM revenue growth in excess of 23%. The IT conglomerates category was the onlycategory to post negative TTM revenue growth (-1.1%) in Q3, as these massive software companies are forced to defer significant amounts of revenue inan attempt to convert to subscription based pricing.
THE SEG SOFTWARE INDEX BY PRODUCT CATEGORY:PUBLIC MARKET MULTIPLES
Median 3Q15 YoY Change in EV/Revenue3Q15 Median EV/Revenue Multiples
1.9x3.7x
2.4x3.4x
4.1x3.3x
1.5x2.5x
3.3x1.8x
2.2x3.8x
2.1x5.3x
4.4x4.9x
Billing & Service ManagementBusiness Intelligence
Development PlatformsEngineering & PLM
Enterprise Resource PlanningFinancial & Accounting
GamingHealthcare
IT ConglomeratesMobile Solutions/Content
Networking & Network Performance…Security
Storage, Data Management & IntegrationSystems Management
Vertical - FinanceVertical - Other
(4.3%)20.5%
(5.7%)(18.6%)
11.9% 7.9%
(21.8%)5.8% 4.9%
(35.1%)(25.3%)
23.0% (4.1%)
26.1% 7.4%
58.0%
Billing & Service ManagementBusiness Intelligence
Development PlatformsEngineering & PLM
Enterprise Resource PlanningFinancial & Accounting
GamingHealthcare
IT ConglomeratesMobile Solutions/Content
Networking & Network Performance…Security
Storage, Data Management & IntegrationSystems Management
Vertical - FinanceVertical - Other
SOFTWARE EQUITY GROUP | Q3 2015 SOFTWARE INDUSTRY FINANCIAL REPORTCopyright © SEG Capital Advisors, LLC, All Rights Reserved
THE SEG SaaS INDEX
PUBLIC SaaS COMPANY FINANCIAL PERFORMANCE AND MARKET MULTIPLE TRENDS
SOFTWARE EQUITY GROUP | Q3 2015 SOFTWARE INDUSTRY FINANCIAL REPORTCopyright © SEG Capital Advisors, LLC, All Rights Reserved
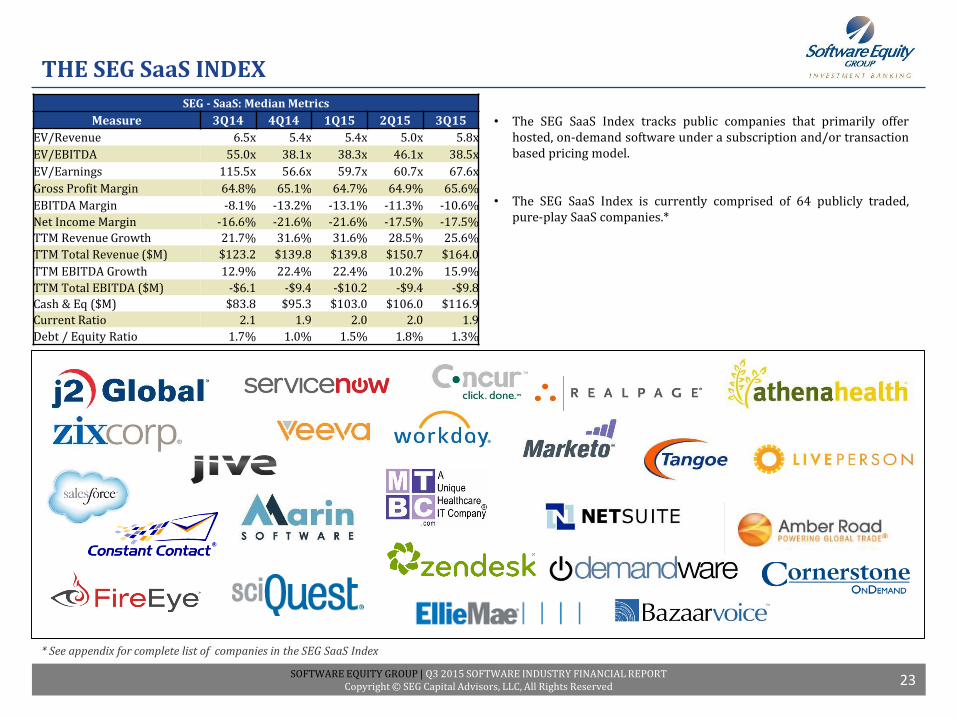
THE SEG SaaS INDEX
• The SEG SaaS Index tracks public companies that primarily offerhosted, on-demand software under a subscription and/or transactionbased pricing model.
• The SEG SaaS Index is currently comprised of 64 publicly traded,pure-play SaaS companies.*
* See appendix for complete list of companies in the SEG SaaS Index
23
SEG - SaaS: Median Metrics
Measure 3Q14 4Q14 1Q15 2Q15 3Q15
EV/Revenue 6.5x 5.4x 5.4x 5.0x 5.8x
EV/EBITDA 55.0x 38.1x 38.3x 46.1x 38.5x
EV/Earnings 115.5x 56.6x 59.7x 60.7x 67.6x
Gross Profit Margin 64.8% 65.1% 64.7% 64.9% 65.6%
EBITDA Margin -8.1% -13.2% -13.1% -11.3% -10.6%
Net Income Margin -16.6% -21.6% -21.6% -17.5% -17.5%
TTM Revenue Growth 21.7% 31.6% 31.6% 28.5% 25.6%
TTM Total Revenue ($M) $123.2 $139.8 $139.8 $150.7 $164.0
TTM EBITDA Growth 12.9% 22.4% 22.4% 10.2% 15.9%
TTM Total EBITDA ($M) -$6.1 -$9.4 -$10.2 -$9.4 -$9.8
Cash & Eq ($M) $83.8 $95.3 $103.0 $106.0 $116.9
Current Ratio 2.1 1.9 2.0 2.0 1.9
Debt / Equity Ratio 1.7% 1.0% 1.5% 1.8% 1.3%
SOFTWARE EQUITY GROUP | Q3 2015 SOFTWARE INDUSTRY FINANCIAL REPORTCopyright © SEG Capital Advisors, LLC, All Rights Reserved
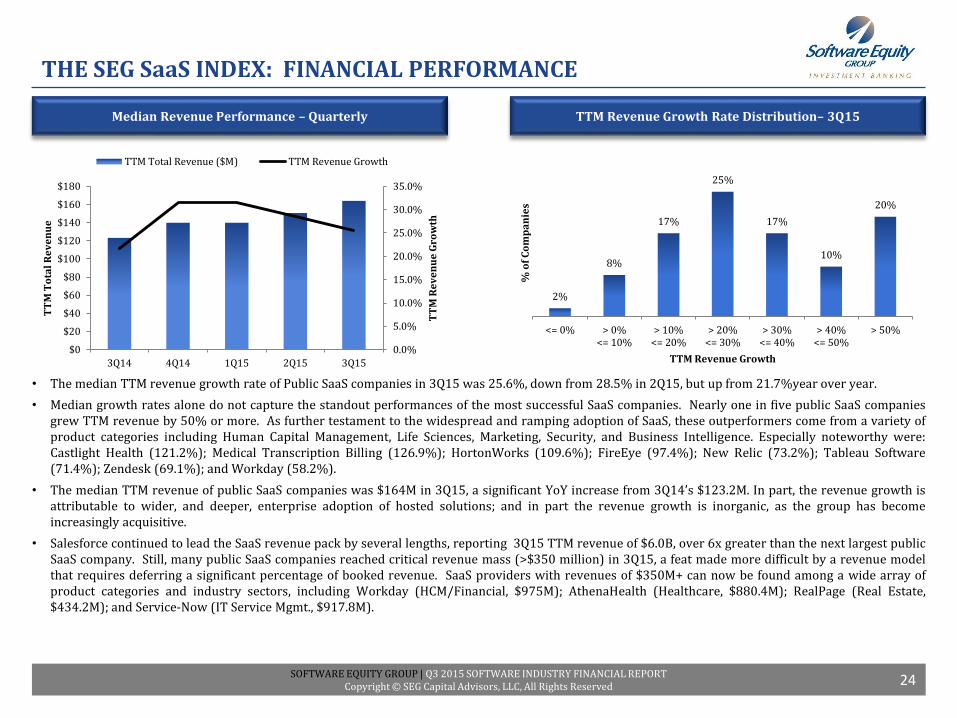
THE SEG SaaS INDEX: FINANCIAL PERFORMANCE
• The median TTM revenue growth rate of Public SaaS companies in 3Q15 was 25.6%, down from 28.5% in 2Q15, but up from 21.7%year over year.
• Median growth rates alone do not capture the standout performances of the most successful SaaS companies. Nearly one in five public SaaS companiesgrew TTM revenue by 50% or more. As further testament to the widespread and ramping adoption of SaaS, these outperformers come from a variety ofproduct categories including Human Capital Management, Life Sciences, Marketing, Security, and Business Intelligence. Especially noteworthy were:Castlight Health (121.2%); Medical Transcription Billing (126.9%); HortonWorks (109.6%); FireEye (97.4%); New Relic (73.2%); Tableau Software(71.4%); Zendesk (69.1%); and Workday (58.2%).
• The median TTM revenue of public SaaS companies was $164M in 3Q15, a significant YoY increase from 3Q14’s $123.2M. In part, the revenue growth isattributable to wider, and deeper, enterprise adoption of hosted solutions; and in part the revenue growth is inorganic, as the group has becomeincreasingly acquisitive.
• Salesforce continued to lead the SaaS revenue pack by several lengths, reporting 3Q15 TTM revenue of $6.0B, over 6x greater than the next largest publicSaaS company. Still, many public SaaS companies reached critical revenue mass (>$350 million) in 3Q15, a feat made more difficult by a revenue modelthat requires deferring a significant percentage of booked revenue. SaaS providers with revenues of $350M+ can now be found among a wide array ofproduct categories and industry sectors, including Workday (HCM/Financial, $975M); AthenaHealth (Healthcare, $880.4M); RealPage (Real Estate,$434.2M); and Service-Now (IT Service Mgmt., $917.8M).
TTM Revenue Growth Rate Distribution– 3Q15Median Revenue Performance – Quarterly
24
0.0%
5.0%
10.0%
15.0%
20.0%
25.0%
30.0%
35.0%
$0
$20
$40
$60
$80
$100
$120
$140
$160
$180
3Q14 4Q14 1Q15 2Q15 3Q15
TT
M R
ev
en
ue
Gro
wth
TT
M T
ota
l R
ev
en
ue
TTM Total Revenue ($M) TTM Revenue Growth
2%
8%
17%
25%
17%
10%
20%
<= 0% > 0%<= 10%
> 10%<= 20%
> 20%<= 30%
> 30%<= 40%
> 40%<= 50%
> 50%
% o
f C
om
pa
nie
s
TTM Revenue Growth
SOFTWARE EQUITY GROUP | Q3 2015 SOFTWARE INDUSTRY FINANCIAL REPORTCopyright © SEG Capital Advisors, LLC, All Rights Reserved
THE SEG SaaS INDEX: FINANCIAL PERFORMANCE
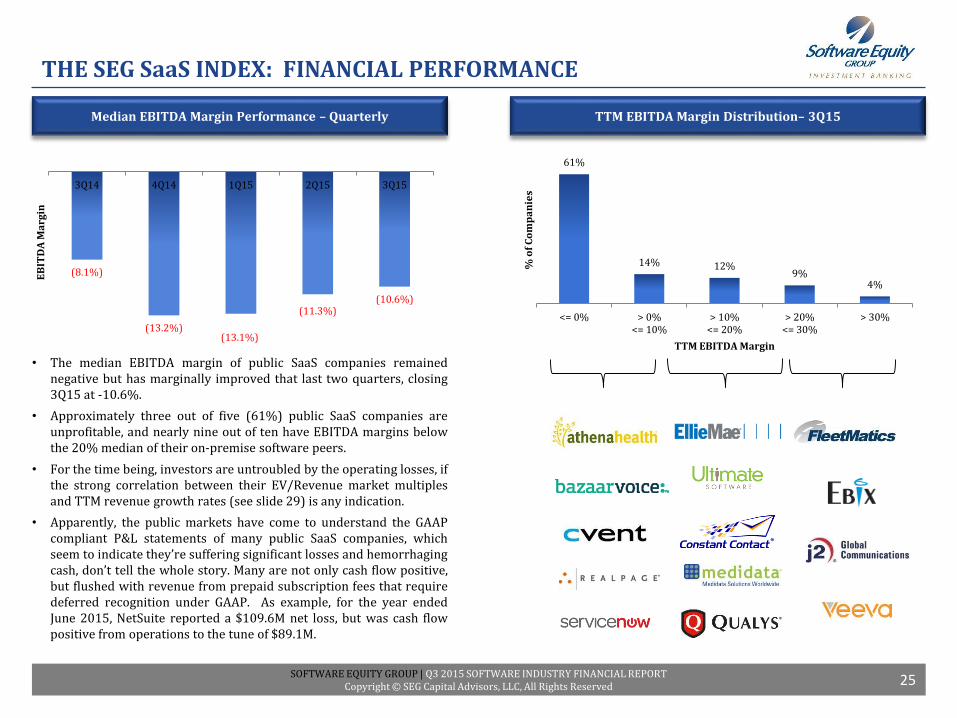
• The median EBITDA margin of public SaaS companies remainednegative but has marginally improved that last two quarters, closing3Q15 at -10.6%.
• Approximately three out of five (61%) public SaaS companies areunprofitable, and nearly nine out of ten have EBITDA margins belowthe 20% median of their on-premise software peers.
• For the time being, investors are untroubled by the operating losses, ifthe strong correlation between their EV/Revenue market multiplesand TTM revenue growth rates (see slide 29) is any indication.
• Apparently, the public markets have come to understand the GAAPcompliant P&L statements of many public SaaS companies, whichseem to indicate they’re suffering significant losses and hemorrhagingcash, don’t tell the whole story. Many are not only cash flow positive,but flushed with revenue from prepaid subscription fees that requiredeferred recognition under GAAP. As example, for the year endedJune 2015, NetSuite reported a $109.6M net loss, but was cash flowpositive from operations to the tune of $89.1M.
TTM EBITDA Margin Distribution– 3Q15Median EBITDA Margin Performance – Quarterly
25
(8.1%)
(13.2%)(13.1%)
(11.3%)(10.6%)
3Q14 4Q14 1Q15 2Q15 3Q15
EB
ITD
A M
arg
in
61%
14% 12%9%
4%
<= 0% > 0%<= 10%
> 10%<= 20%
> 20%<= 30%
> 30%
% o
f C
om
pa
nie
s
TTM EBITDA Margin
SOFTWARE EQUITY GROUP | Q3 2015 SOFTWARE INDUSTRY FINANCIAL REPORTCopyright © SEG Capital Advisors, LLC, All Rights Reserved
THE SEG SaaS INDEX: FINANCIAL PERFORMANCE
Median Margin PerformanceMedian Operating Ratios
26
• OpEx: Public SaaS companies continue to spend heavily on sales & marketing in order to drive revenue growth and capture market share.
• In 3Q15, public SaaS companies invested a median 37% of total revenue on sales & marketing, almost double their on-premise counterparts. However, thisrepresents a modest decline from the 41% S&M spend in 3Q14.
• After staying constant at roughly 19.7% for the past four quarters, R&D spending as a percent of revenue fell slightly in 3Q15, declining to 18.8%. PublicSaaS companies in 3Q15 spent 4.3% more on R&D as a percent of revenue than their on-premise peers, as they endeavored to expand their offerings,enhance their technology and platforms, and address new markets.
• On a GAAP basis, operating losses of public SaaS companies bottomed out at a -13.2% median EBITDA margin in 4Q14. Since then EBITDA margin for thegroup has steadily rose to -10.6% as these organizations have pulled back slightly on their investments in sales & marketing and R&D.
-20%
-10%
0%
10%
20%
30%
40%
50%
60%
70%
3Q14 4Q14 1Q15 2Q15 3Q15
% M
arg
in
Gross Profit Margin EBITDA Margin Net Income Margin
0%
5%
10%
15%
20%
25%
30%
35%
40%
45%
3Q14 4Q14 1Q15 2Q15 3Q15
% o
f R
eve
nu
e
S&M (% of Revenue) R&D (% of Revenue) G&A (% of Revenue)
SOFTWARE EQUITY GROUP | Q3 2015 SOFTWARE INDUSTRY FINANCIAL REPORTCopyright © SEG Capital Advisors, LLC, All Rights Reserved
THE SEG SaaS INDEX: PUBLIC MARKET MULTIPLES
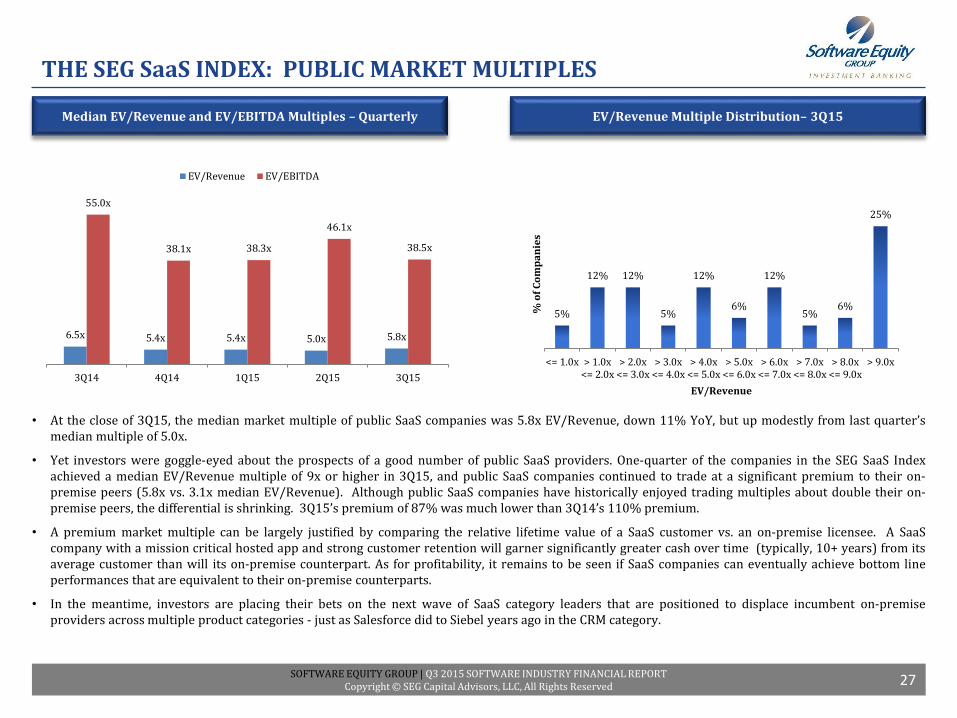
• At the close of 3Q15, the median market multiple of public SaaS companies was 5.8x EV/Revenue, down 11% YoY, but up modestly from last quarter’smedian multiple of 5.0x.
• Yet investors were goggle-eyed about the prospects of a good number of public SaaS providers. One-quarter of the companies in the SEG SaaS Indexachieved a median EV/Revenue multiple of 9x or higher in 3Q15, and public SaaS companies continued to trade at a significant premium to their on-premise peers (5.8x vs. 3.1x median EV/Revenue). Although public SaaS companies have historically enjoyed trading multiples about double their on-premise peers, the differential is shrinking. 3Q15’s premium of 87% was much lower than 3Q14’s 110% premium.
• A premium market multiple can be largely justified by comparing the relative lifetime value of a SaaS customer vs. an on-premise licensee. A SaaScompany with a mission critical hosted app and strong customer retention will garner significantly greater cash over time (typically, 10+ years) from itsaverage customer than will its on-premise counterpart. As for profitability, it remains to be seen if SaaS companies can eventually achieve bottom lineperformances that are equivalent to their on-premise counterparts.
• In the meantime, investors are placing their bets on the next wave of SaaS category leaders that are positioned to displace incumbent on-premiseproviders across multiple product categories - just as Salesforce did to Siebel years ago in the CRM category.
EV/Revenue Multiple Distribution– 3Q15Median EV/Revenue and EV/EBITDA Multiples – Quarterly
27
6.5x 5.4x 5.4x 5.0x 5.8x
55.0x
38.1x 38.3x
46.1x
38.5x
3Q14 4Q14 1Q15 2Q15 3Q15
EV/Revenue EV/EBITDA
5%
12% 12%
5%
12%
6%
12%
5%6%
25%
<= 1.0x > 1.0x<= 2.0x
> 2.0x<= 3.0x
> 3.0x<= 4.0x
> 4.0x<= 5.0x
> 5.0x<= 6.0x
> 6.0x<= 7.0x
> 7.0x<= 8.0x
> 8.0x<= 9.0x
> 9.0x
% o
f C
om
pa
nie
s
EV/Revenue
SOFTWARE EQUITY GROUP | Q3 2015 SOFTWARE INDUSTRY FINANCIAL REPORTCopyright © SEG Capital Advisors, LLC, All Rights Reserved
THE SEG SaaS INDEX: PUBLIC MARKET MULTIPLES
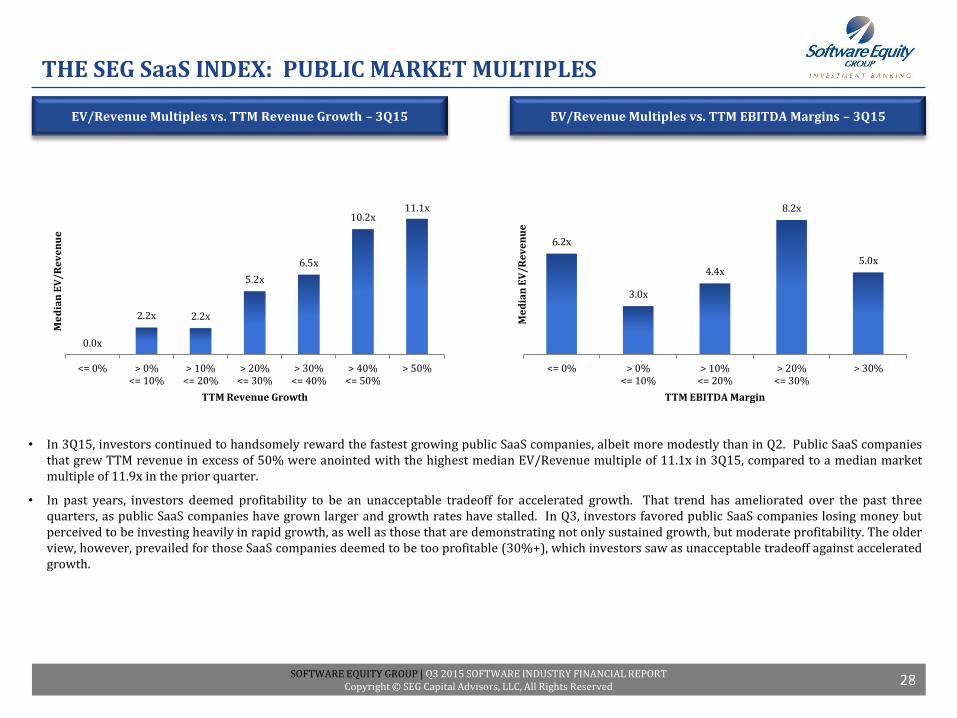
• In 3Q15, investors continued to handsomely reward the fastest growing public SaaS companies, albeit more modestly than in Q2. Public SaaS companiesthat grew TTM revenue in excess of 50% were anointed with the highest median EV/Revenue multiple of 11.1x in 3Q15, compared to a median marketmultiple of 11.9x in the prior quarter.
• In past years, investors deemed profitability to be an unacceptable tradeoff for accelerated growth. That trend has ameliorated over the past threequarters, as public SaaS companies have grown larger and growth rates have stalled. In Q3, investors favored public SaaS companies losing money butperceived to be investing heavily in rapid growth, as well as those that are demonstrating not only sustained growth, but moderate profitability. The olderview, however, prevailed for those SaaS companies deemed to be too profitable (30%+), which investors saw as unacceptable tradeoff against acceleratedgrowth.
EV/Revenue Multiples vs. TTM EBITDA Margins – 3Q15EV/Revenue Multiples vs. TTM Revenue Growth – 3Q15
28
0.0x
2.2x 2.2x
5.2x
6.5x
10.2x11.1x
<= 0% > 0%<= 10%
> 10%<= 20%
> 20%<= 30%
> 30%<= 40%
> 40%<= 50%
> 50%
Me
dia
n E
V/
Re
ve
nu
e
TTM Revenue Growth
6.2x
3.0x
4.4x
8.2x
5.0x
<= 0% > 0%<= 10%
> 10%<= 20%
> 20%<= 30%
> 30%
Me
dia
n E
V/
Re
ve
nu
e
TTM EBITDA Margin
SOFTWARE EQUITY GROUP | Q3 2015 SOFTWARE INDUSTRY FINANCIAL REPORTCopyright © SEG Capital Advisors, LLC, All Rights Reserved
THE SEG SaaS INDEX: PUBLIC MARKET MULTIPLES
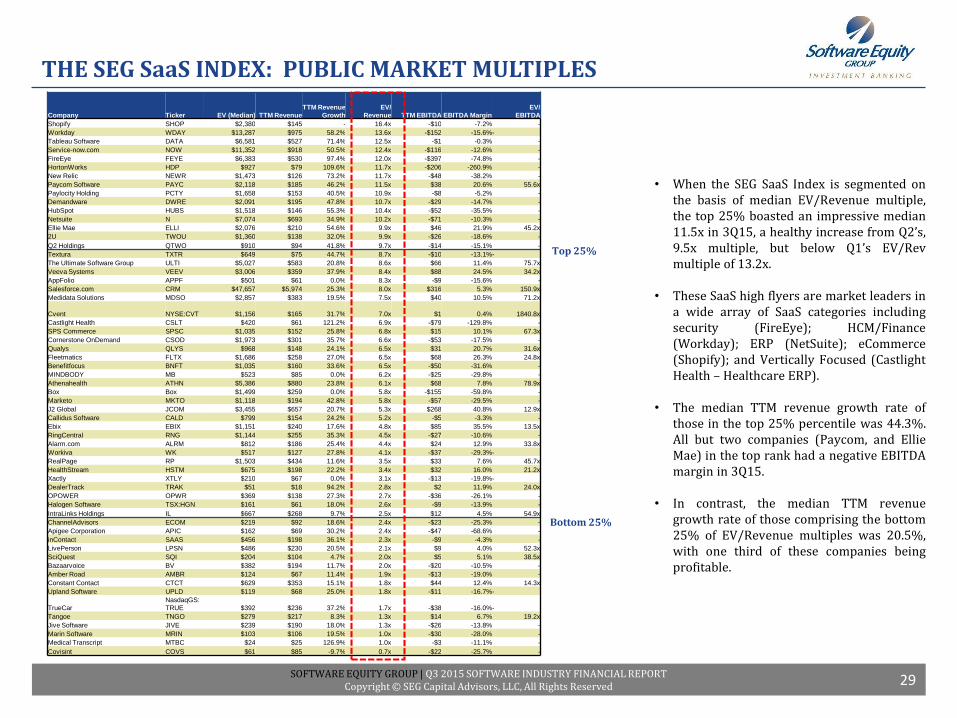
Top 25%
Bottom 25%
• When the SEG SaaS Index is segmented onthe basis of median EV/Revenue multiple,the top 25% boasted an impressive median11.5x in 3Q15, a healthy increase from Q2’s,9.5x multiple, but below Q1’s EV/Revmultiple of 13.2x.
• These SaaS high flyers are market leaders ina wide array of SaaS categories includingsecurity (FireEye); HCM/Finance(Workday); ERP (NetSuite); eCommerce(Shopify); and Vertically Focused (CastlightHealth – Healthcare ERP).
• The median TTM revenue growth rate ofthose in the top 25% percentile was 44.3%.All but two companies (Paycom, and EllieMae) in the top rank had a negative EBITDAmargin in 3Q15.
• In contrast, the median TTM revenuegrowth rate of those comprising the bottom25% of EV/Revenue multiples was 20.5%,with one third of these companies beingprofitable.
29
Company Ticker EV (Median) TTM Revenue
TTM Revenue
Growth
EV/
Revenue TTM EBITDA EBITDA Margin
EV/
EBITDA
Shopify SHOP $2,380 $145 - 16.4x -$10 -7.2% -
Workday WDAY $13,287 $975 58.2% 13.6x -$152 -15.6%-
Tableau Software DATA $6,581 $527 71.4% 12.5x -$1 -0.3% -
Service-now.com NOW $11,352 $918 50.5% 12.4x -$116 -12.6% -
FireEye FEYE $6,383 $530 97.4% 12.0x -$397 -74.8% -
HortonWorks HDP $927 $79 109.6% 11.7x -$206 -260.9% -
New Relic NEWR $1,473 $126 73.2% 11.7x -$48 -38.2% -
Paycom Software PAYC $2,118 $185 46.2% 11.5x $38 20.6% 55.6x
Paylocity Holding PCTY $1,658 $153 40.5% 10.9x -$8 -5.2% -
Demandware DWRE $2,091 $195 47.8% 10.7x -$29 -14.7% -
HubSpot HUBS $1,518 $146 55.3% 10.4x -$52 -35.5% -
Netsuite N $7,074 $693 34.9% 10.2x -$71 -10.3% -
Ellie Mae ELLI $2,076 $210 54.6% 9.9x $46 21.9% 45.2x
2U TWOU $1,360 $138 32.0% 9.9x -$26 -18.6% -
Q2 Holdings QTWO $910 $94 41.8% 9.7x -$14 -15.1% -
Textura TXTR $649 $75 44.7% 8.7x -$10 -13.1%-
The Ultimate Software Group ULTI $5,027 $583 20.8% 8.6x $66 11.4% 75.7x
Veeva Systems VEEV $3,006 $359 37.9% 8.4x $88 24.5% 34.2x
AppFolio APPF $501 $61 0.0% 8.3x -$9 -15.6% -
Salesforce.com CRM $47,657 $5,974 25.3% 8.0x $316 5.3% 150.9x
Medidata Solutions MDSO $2,857 $383 19.5% 7.5x $40 10.5% 71.2x
Cvent NYSE:CVT $1,156 $165 31.7% 7.0x $1 0.4% 1840.8x
Castlight Health CSLT $420 $61 121.2% 6.9x -$79 -129.8% -
SPS Commerce SPSC $1,035 $152 25.8% 6.8x $15 10.1% 67.3x
Cornerstone OnDemand CSOD $1,973 $301 35.7% 6.6x -$53 -17.5% -
Qualys QLYS $968 $148 24.1% 6.5x $31 20.7% 31.6x
Fleetmatics FLTX $1,686 $258 27.0% 6.5x $68 26.3% 24.8x
Benefitfocus BNFT $1,035 $160 33.6% 6.5x -$50 -31.6% -
MINDBODY MB $523 $85 0.0% 6.2x -$25 -29.8% -
Athenahealth ATHN $5,386 $880 23.8% 6.1x $68 7.8% 78.9x
Box Box $1,499 $259 0.0% 5.8x -$155 -59.8% -
Marketo MKTO $1,118 $194 42.8% 5.8x -$57 -29.5% -
J2 Global JCOM $3,455 $657 20.7% 5.3x $268 40.8% 12.9x
Callidus Software CALD $799 $154 24.2% 5.2x -$5 -3.3% -
Ebix EBIX $1,151 $240 17.6% 4.8x $85 35.5% 13.5x
RingCentral RNG $1,144 $255 35.3% 4.5x -$27 -10.6% -
Alarm.com ALRM $812 $186 25.4% 4.4x $24 12.9% 33.8x
Workiva WK $517 $127 27.8% 4.1x -$37 -29.3%-
RealPage RP $1,503 $434 11.6% 3.5x $33 7.6% 45.7x
HealthStream HSTM $675 $198 22.2% 3.4x $32 16.0% 21.2x
Xactly XTLY $210 $67 0.0% 3.1x -$13 -19.8%-
DealerTrack TRAK $51 $18 94.2% 2.8x $2 11.9% 24.0x
OPOWER OPWR $369 $138 27.3% 2.7x -$36 -26.1% -
Halogen Software TSX:HGN $161 $61 18.0% 2.6x -$9 -13.9% -
IntraLinks Holdings IL $667 $268 9.7% 2.5x $12 4.5% 54.9x
ChannelAdvisors ECOM $219 $92 18.6% 2.4x -$23 -25.3% -
Apigee Corporation APIC $162 $69 30.2% 2.4x -$47 -68.6% -
inContact SAAS $456 $198 36.1% 2.3x -$9 -4.3% -
LivePerson LPSN $486 $230 20.5% 2.1x $9 4.0% 52.3x
SciQuest SQI $204 $104 4.7% 2.0x $5 5.1% 38.5x
Bazaarvoice BV $382 $194 11.7% 2.0x -$20 -10.5% -
Amber Road AMBR $124 $67 11.4% 1.9x -$13 -19.0% -
Constant Contact CTCT $629 $353 15.1% 1.8x $44 12.4% 14.3x
Upland Software UPLD $119 $68 25.0% 1.8x -$11 -16.7%-
TrueCar
NasdaqGS:
TRUE $392 $236 37.2% 1.7x -$38 -16.0%-
Tangoe TNGO $279 $217 8.3% 1.3x $14 6.7% 19.2x
Jive Software JIVE $239 $190 18.0% 1.3x -$26 -13.8% -
Marin Software MRIN $103 $106 19.5% 1.0x -$30 -28.0% -
Medical Transcript MTBC $24 $25 126.9% 1.0x -$3 -11.1% -
Covisint COVS $61 $85 -9.7% 0.7x -$22 -25.7% -
SOFTWARE EQUITY GROUP | Q3 2015 SOFTWARE INDUSTRY FINANCIAL REPORTCopyright © SEG Capital Advisors, LLC, All Rights Reserved
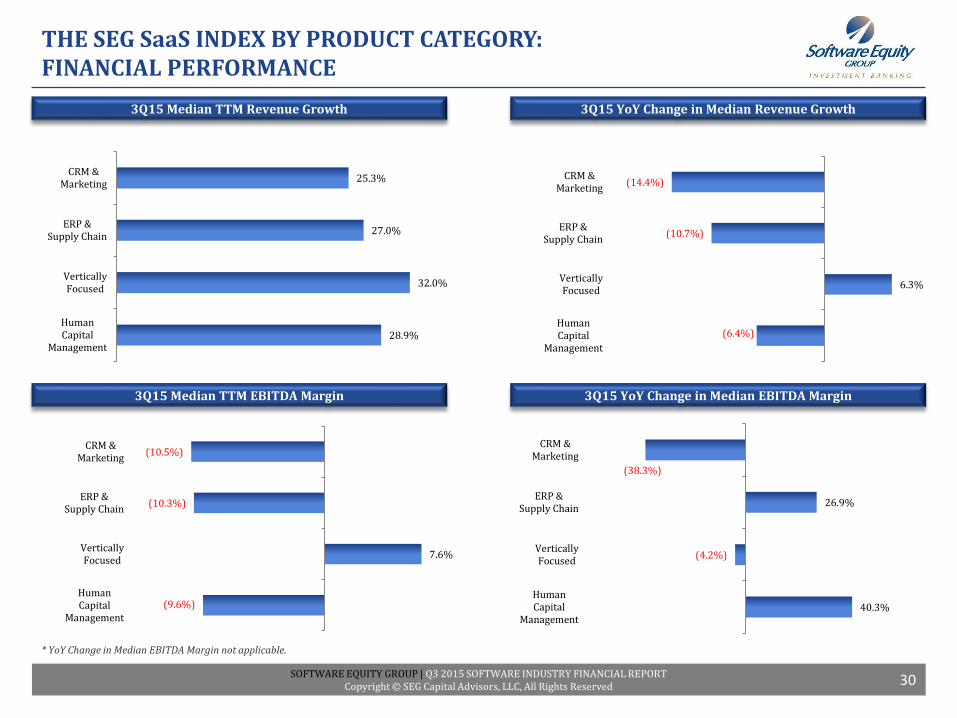
THE SEG SaaS INDEX BY PRODUCT CATEGORY:FINANCIAL PERFORMANCE
3Q15 YoY Change in Median Revenue Growth3Q15 Median TTM Revenue Growth
3Q15 YoY Change in Median EBITDA Margin3Q15 Median TTM EBITDA Margin
30
* YoY Change in Median EBITDA Margin not applicable.
25.3%
27.0%
32.0%
28.9%
CRM &Marketing
ERP &Supply Chain
VerticallyFocused
HumanCapital
Management
(14.4%)
(10.7%)
6.3%
(6.4%)
CRM &Marketing
ERP &Supply Chain
VerticallyFocused
HumanCapital
Management
(10.5%)
(10.3%)
7.6%
(9.6%)
CRM &Marketing
ERP &Supply Chain
VerticallyFocused
HumanCapital
Management
(38.3%)
26.9%
(4.2%)
40.3%
CRM &Marketing
ERP &Supply Chain
VerticallyFocused
HumanCapital
Management
SOFTWARE EQUITY GROUP | Q3 2015 SOFTWARE INDUSTRY FINANCIAL REPORTCopyright © SEG Capital Advisors, LLC, All Rights Reserved
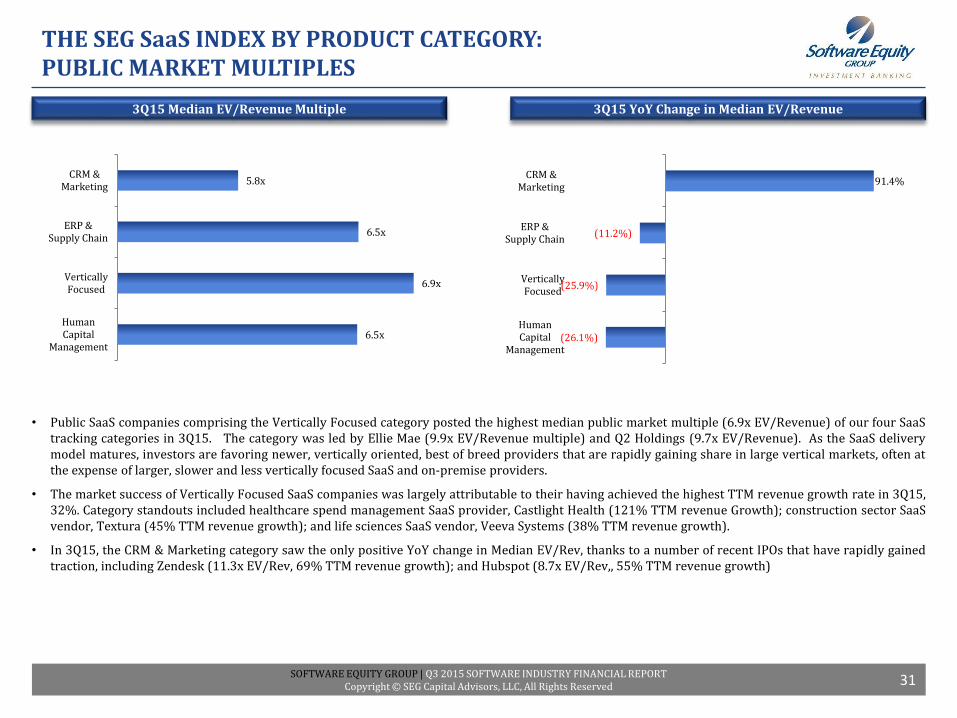
THE SEG SaaS INDEX BY PRODUCT CATEGORY: PUBLIC MARKET MULTIPLES
• Public SaaS companies comprising the Vertically Focused category posted the highest median public market multiple (6.9x EV/Revenue) of our four SaaStracking categories in 3Q15. The category was led by Ellie Mae (9.9x EV/Revenue multiple) and Q2 Holdings (9.7x EV/Revenue). As the SaaS deliverymodel matures, investors are favoring newer, vertically oriented, best of breed providers that are rapidly gaining share in large vertical markets, often atthe expense of larger, slower and less vertically focused SaaS and on-premise providers.
• The market success of Vertically Focused SaaS companies was largely attributable to their having achieved the highest TTM revenue growth rate in 3Q15,32%. Category standouts included healthcare spend management SaaS provider, Castlight Health (121% TTM revenue Growth); construction sector SaaSvendor, Textura (45% TTM revenue growth); and life sciences SaaS vendor, Veeva Systems (38% TTM revenue growth).
• In 3Q15, the CRM & Marketing category saw the only positive YoY change in Median EV/Rev, thanks to a number of recent IPOs that have rapidly gainedtraction, including Zendesk (11.3x EV/Rev, 69% TTM revenue growth); and Hubspot (8.7x EV/Rev,, 55% TTM revenue growth)
3Q15 YoY Change in Median EV/Revenue3Q15 Median EV/Revenue Multiple
31
5.8x
6.5x
6.9x
6.5x
CRM &Marketing
ERP &Supply Chain
VerticallyFocused
HumanCapital
Management
91.4%
(11.2%)
(25.9%)
(26.1%)
CRM &Marketing
ERP &Supply Chain
VerticallyFocused
HumanCapital
Management
SOFTWARE EQUITY GROUP | Q3 2015 SOFTWARE INDUSTRY FINANCIAL REPORTCopyright © SEG Capital Advisors, LLC, All Rights Reserved
THE SEG INTERNET INDEX
PUBLIC INTERNET COMPANY FINANCIAL PERFORMANCE AND MARKET MULTIPLE TRENDS
SOFTWARE EQUITY GROUP | Q3 2015 SOFTWARE INDUSTRY FINANCIAL REPORTCopyright © SEG Capital Advisors, LLC, All Rights Reserved
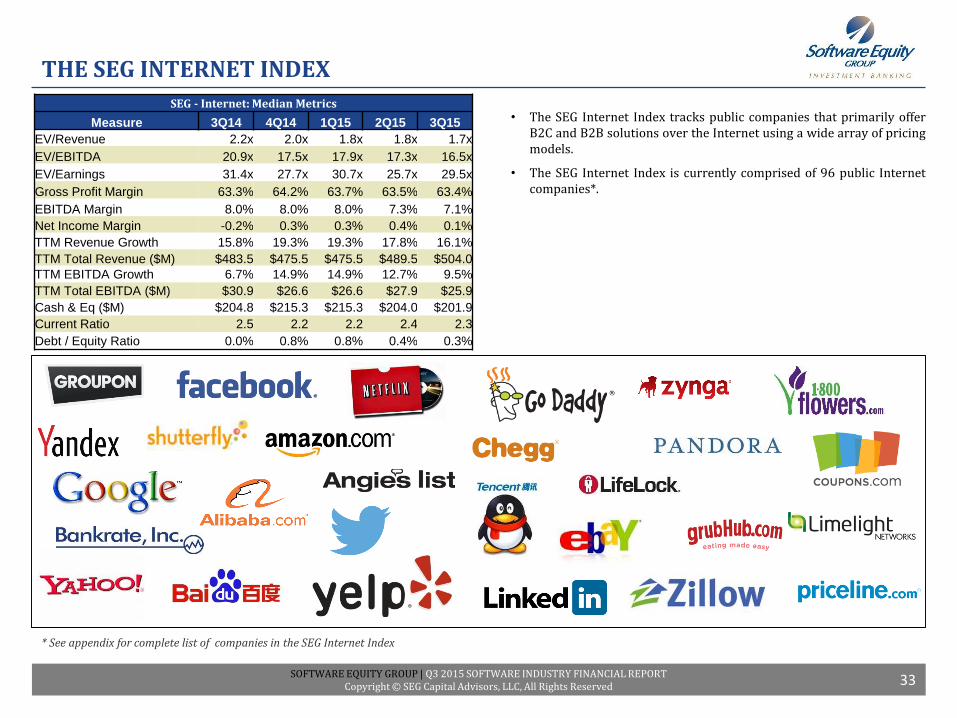
THE SEG INTERNET INDEX
• The SEG Internet Index tracks public companies that primarily offerB2C and B2B solutions over the Internet using a wide array of pricingmodels.
• The SEG Internet Index is currently comprised of 96 public Internetcompanies*.
* See appendix for complete list of companies in the SEG Internet Index
33
SEG - Internet: Median Metrics
Measure 3Q14 4Q14 1Q15 2Q15 3Q15
EV/Revenue 2.2x 2.0x 1.8x 1.8x 1.7x
EV/EBITDA 20.9x 17.5x 17.9x 17.3x 16.5x
EV/Earnings 31.4x 27.7x 30.7x 25.7x 29.5x
Gross Profit Margin 63.3% 64.2% 63.7% 63.5% 63.4%
EBITDA Margin 8.0% 8.0% 8.0% 7.3% 7.1%
Net Income Margin -0.2% 0.3% 0.3% 0.4% 0.1%
TTM Revenue Growth 15.8% 19.3% 19.3% 17.8% 16.1%
TTM Total Revenue ($M) $483.5 $475.5 $475.5 $489.5 $504.0
TTM EBITDA Growth 6.7% 14.9% 14.9% 12.7% 9.5%
TTM Total EBITDA ($M) $30.9 $26.6 $26.6 $27.9 $25.9
Cash & Eq ($M) $204.8 $215.3 $215.3 $204.0 $201.9
Current Ratio 2.5 2.2 2.2 2.4 2.3
Debt / Equity Ratio 0.0% 0.8% 0.8% 0.4% 0.3%
SOFTWARE EQUITY GROUP | Q3 2015 SOFTWARE INDUSTRY FINANCIAL REPORTCopyright © SEG Capital Advisors, LLC, All Rights Reserved
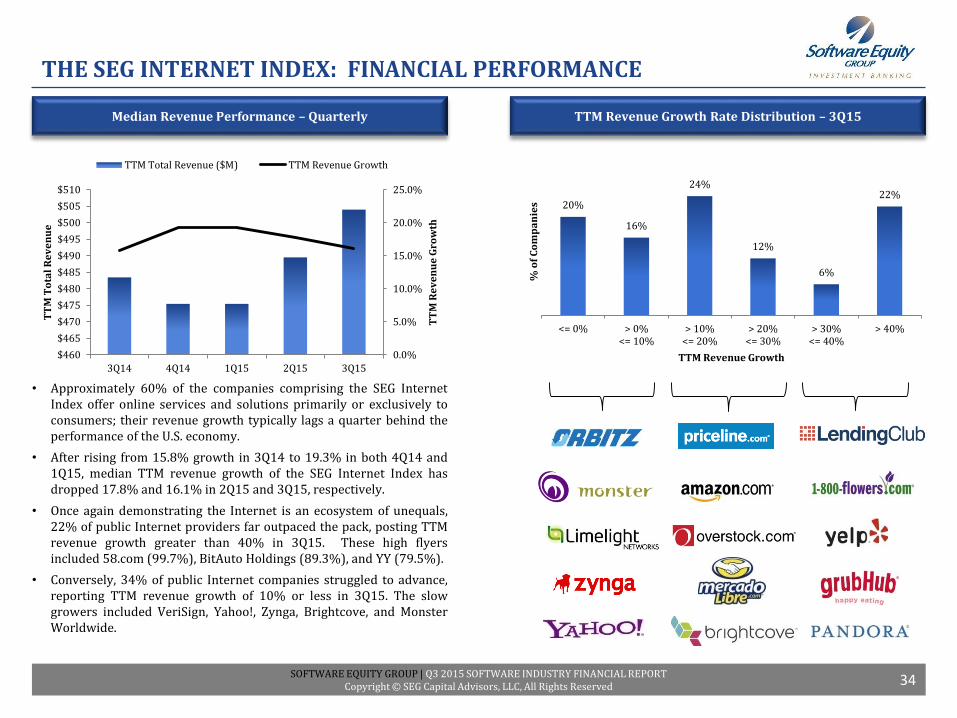
THE SEG INTERNET INDEX: FINANCIAL PERFORMANCE
• Approximately 60% of the companies comprising the SEG InternetIndex offer online services and solutions primarily or exclusively toconsumers; their revenue growth typically lags a quarter behind theperformance of the U.S. economy.
• After rising from 15.8% growth in 3Q14 to 19.3% in both 4Q14 and1Q15, median TTM revenue growth of the SEG Internet Index hasdropped 17.8% and 16.1% in 2Q15 and 3Q15, respectively.
• Once again demonstrating the Internet is an ecosystem of unequals,22% of public Internet providers far outpaced the pack, posting TTMrevenue growth greater than 40% in 3Q15. These high flyersincluded 58.com (99.7%), BitAuto Holdings (89.3%), and YY (79.5%).
• Conversely, 34% of public Internet companies struggled to advance,reporting TTM revenue growth of 10% or less in 3Q15. The slowgrowers included VeriSign, Yahoo!, Zynga, Brightcove, and MonsterWorldwide.
TTM Revenue Growth Rate Distribution – 3Q15Median Revenue Performance – Quarterly
34
0.0%
5.0%
10.0%
15.0%
20.0%
25.0%
$460
$465
$470
$475
$480
$485
$490
$495
$500
$505
$510
3Q14 4Q14 1Q15 2Q15 3Q15
TT
M R
ev
en
ue
Gro
wth
TT
M T
ota
l R
ev
en
ue
TTM Total Revenue ($M) TTM Revenue Growth
20%
16%
24%
12%
6%
22%
<= 0% > 0%<= 10%
> 10%<= 20%
> 20%<= 30%
> 30%<= 40%
> 40%
% o
f C
om
pa
nie
s
TTM Revenue Growth
SOFTWARE EQUITY GROUP | Q3 2015 SOFTWARE INDUSTRY FINANCIAL REPORTCopyright © SEG Capital Advisors, LLC, All Rights Reserved
THE SEG INTERNET INDEX: FINANCIAL PERFORMANCE
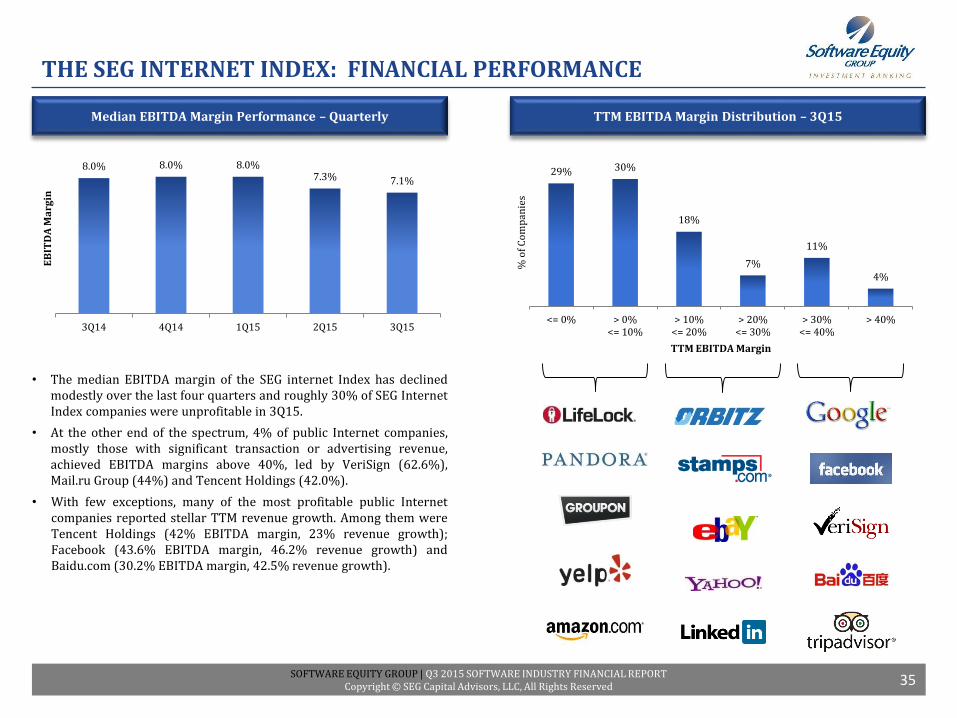
• The median EBITDA margin of the SEG internet Index has declinedmodestly over the last four quarters and roughly 30% of SEG InternetIndex companies were unprofitable in 3Q15.
• At the other end of the spectrum, 4% of public Internet companies,mostly those with significant transaction or advertising revenue,achieved EBITDA margins above 40%, led by VeriSign (62.6%),Mail.ru Group (44%) and Tencent Holdings (42.0%).
• With few exceptions, many of the most profitable public Internetcompanies reported stellar TTM revenue growth. Among them wereTencent Holdings (42% EBITDA margin, 23% revenue growth);Facebook (43.6% EBITDA margin, 46.2% revenue growth) andBaidu.com (30.2% EBITDA margin, 42.5% revenue growth).
TTM EBITDA Margin Distribution – 3Q15Median EBITDA Margin Performance – Quarterly
35
29% 30%
18%
7%
11%
4%
<= 0% > 0%<= 10%
> 10%<= 20%
> 20%<= 30%
> 30%<= 40%
> 40%
% o
f C
om
pan
ies
TTM EBITDA Margin
8.0% 8.0% 8.0%7.3% 7.1%
3Q14 4Q14 1Q15 2Q15 3Q15
EB
ITD
A M
arg
in
SOFTWARE EQUITY GROUP | Q3 2015 SOFTWARE INDUSTRY FINANCIAL REPORTCopyright © SEG Capital Advisors, LLC, All Rights Reserved
THE SEG INTERNET INDEX: FINANCIAL PERFORMANCE
Median Margin PerformanceMedian Operating Ratios
36
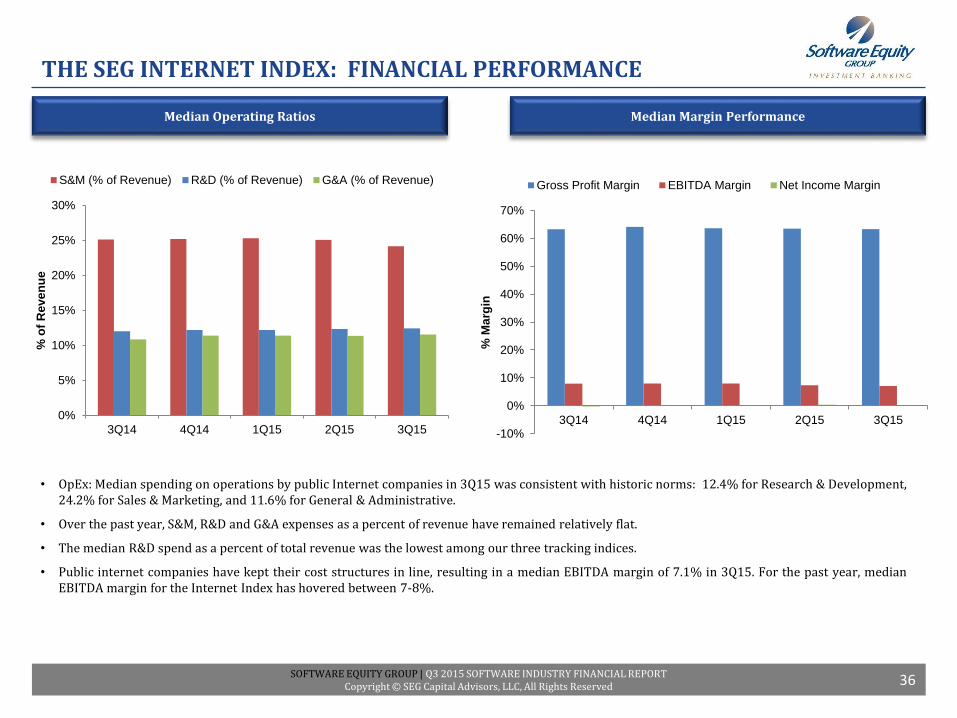
• OpEx: Median spending on operations by public Internet companies in 3Q15 was consistent with historic norms: 12.4% for Research & Development,24.2% for Sales & Marketing, and 11.6% for General & Administrative.
• Over the past year, S&M, R&D and G&A expenses as a percent of revenue have remained relatively flat.
• The median R&D spend as a percent of total revenue was the lowest among our three tracking indices.
• Public internet companies have kept their cost structures in line, resulting in a median EBITDA margin of 7.1% in 3Q15. For the past year, medianEBITDA margin for the Internet Index has hovered between 7-8%.
-10%
0%
10%
20%
30%
40%
50%
60%
70%
3Q14 4Q14 1Q15 2Q15 3Q15
% M
arg
in
Gross Profit Margin EBITDA Margin Net Income Margin
0%
5%
10%
15%
20%
25%
30%
3Q14 4Q14 1Q15 2Q15 3Q15
% o
f R
eve
nu
e
S&M (% of Revenue) R&D (% of Revenue) G&A (% of Revenue)
SOFTWARE EQUITY GROUP | Q3 2015 SOFTWARE INDUSTRY FINANCIAL REPORTCopyright © SEG Capital Advisors, LLC, All Rights Reserved
THE SEG INTERNET INDEX: PUBLIC MARKET MULTIPLES
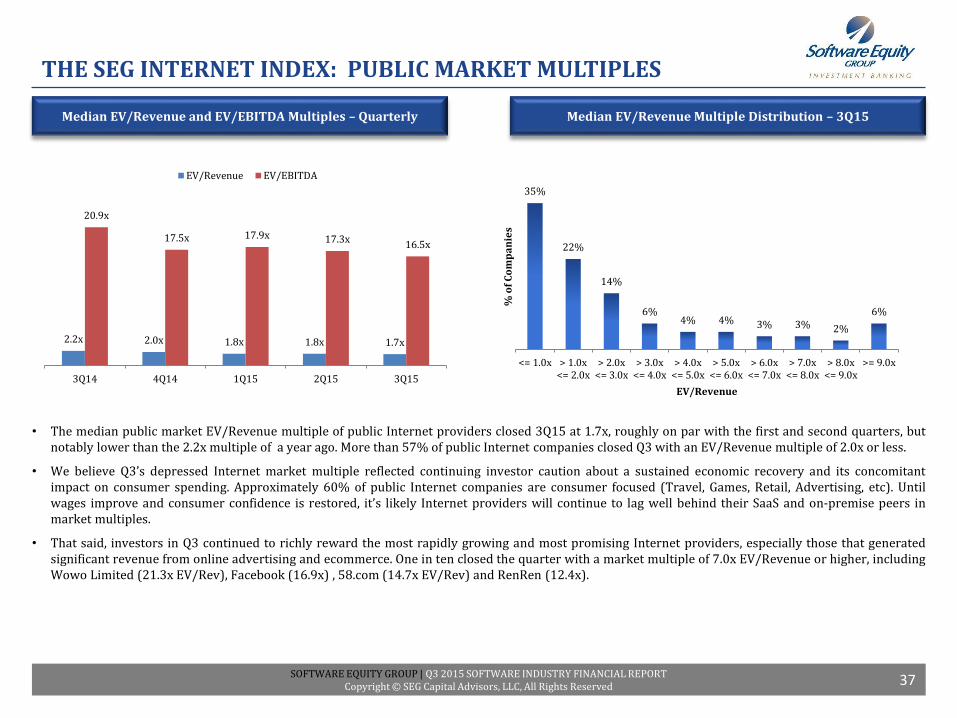
• The median public market EV/Revenue multiple of public Internet providers closed 3Q15 at 1.7x, roughly on par with the first and second quarters, butnotably lower than the 2.2x multiple of a year ago. More than 57% of public Internet companies closed Q3 with an EV/Revenue multiple of 2.0x or less.
• We believe Q3’s depressed Internet market multiple reflected continuing investor caution about a sustained economic recovery and its concomitantimpact on consumer spending. Approximately 60% of public Internet companies are consumer focused (Travel, Games, Retail, Advertising, etc). Untilwages improve and consumer confidence is restored, it’s likely Internet providers will continue to lag well behind their SaaS and on-premise peers inmarket multiples.
• That said, investors in Q3 continued to richly reward the most rapidly growing and most promising Internet providers, especially those that generatedsignificant revenue from online advertising and ecommerce. One in ten closed the quarter with a market multiple of 7.0x EV/Revenue or higher, includingWowo Limited (21.3x EV/Rev), Facebook (16.9x) , 58.com (14.7x EV/Rev) and RenRen (12.4x).
Median EV/Revenue Multiple Distribution – 3Q15Median EV/Revenue and EV/EBITDA Multiples – Quarterly
37
2.2x 2.0x 1.8x 1.8x 1.7x
20.9x
17.5x 17.9x 17.3x16.5x
3Q14 4Q14 1Q15 2Q15 3Q15
EV/Revenue EV/EBITDA
35%
22%
14%
6%4% 4% 3% 3% 2%
6%
<= 1.0x > 1.0x<= 2.0x
> 2.0x<= 3.0x
> 3.0x<= 4.0x
> 4.0x<= 5.0x
> 5.0x<= 6.0x
> 6.0x<= 7.0x
> 7.0x<= 8.0x
> 8.0x<= 9.0x
>= 9.0x
% o
f C
om
pa
nie
s
EV/Revenue

SOFTWARE EQUITY GROUP | Q3 2015 SOFTWARE INDUSTRY FINANCIAL REPORTCopyright © SEG Capital Advisors, LLC, All Rights Reserved
THE SEG INTERNET INDEX: PUBLIC MARKET MULTIPLES
• Here, too, investors favored growth. Public Internet companies with TTM revenue growth of 30% or higher had a median EV/Revenue multiple of 6.0x inQ3, compared to less than 2.0x for their slower growing (<20%) peers. The outperformers included LinkedIn (38.7%, 9.2x EV/Revenue); Twitter (70.3%,8.6x EV/Revenue); 58.com (99.7%, 14.7x EV/Revenue); and Facebook (46.2%, 16.9x EV/Revenue).
• Investors in public Internet companies kept a keen eye on margins, and rewarded more profitable performers with significantly higher public marketmultiples. Public Internet companies with EBITDA margins above 40% posted a median EV/Revenue multiple of 6.8x in 3Q15, approximately 300%higher than the overall Index median. By comparison, public SaaS companies with EBITDA margins above 30% (not enough companies with 40%+)posted a median EV/Revenue multiple of 5.0x in Q3, 16% below the SaaS median market multiple.
• When valuing Internet vs. SaaS stocks, investors have clearly taken into consideration the likely longevity of the customer relationship and associatedrecurring revenue, and the nature and extent of switching costs. By those measures, the likely lifetime value of a SaaS customer appears to greatlyoutweigh the perceived value of an online consumer.
EV/Revenue Multiples vs. TTM EBITDA Margins – 3Q15EV/Revenue Multiples vs. TTM Revenue Growth – 3Q15
38
1.2x1.7x 1.7x
4.9x
3.5x
6.8x
<= 0% > 0%<= 10%
> 10%<= 20%
> 20%<= 30%
> 30%<= 40%
> 40%
Me
dia
n E
V/
Re
ve
nu
e
TTM EBITDA Margin
1.2x1.8x 1.8x
3.1x
6.0x
<= 0% > 0%<= 10%
> 10%<= 20%
> 20%<= 30%
> 30%
Me
dia
n E
V/
Re
ve
nu
e
TTM Revenue Growth
SOFTWARE EQUITY GROUP | Q3 2015 SOFTWARE INDUSTRY FINANCIAL REPORTCopyright © SEG Capital Advisors, LLC, All Rights Reserved
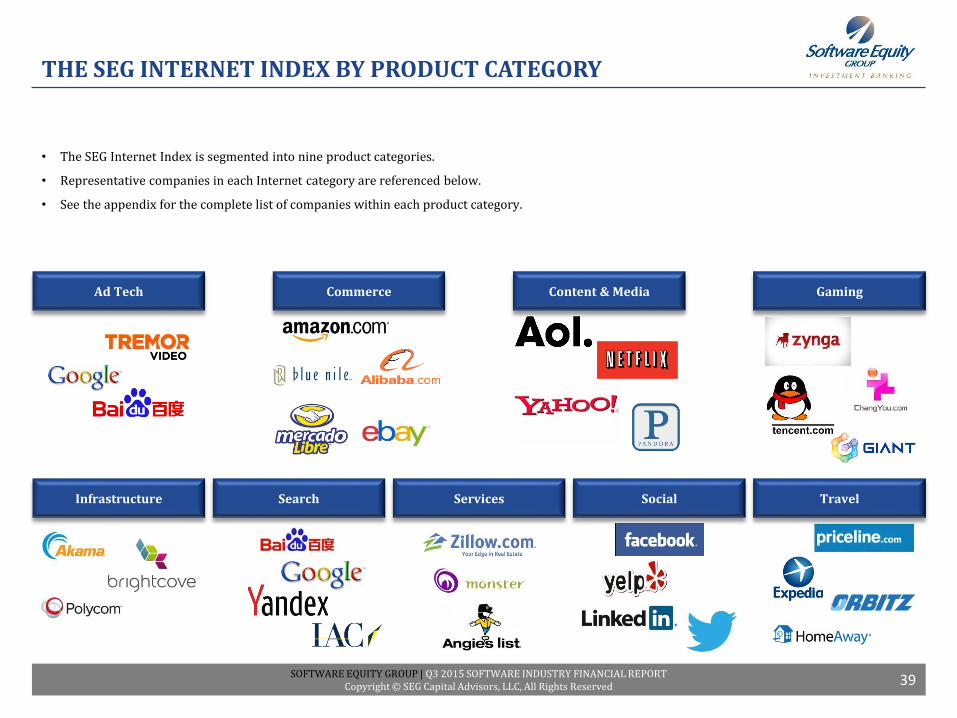
Ad Tech Commerce Content & Media Gaming
Infrastructure Services Social Travel
• The SEG Internet Index is segmented into nine product categories.
• Representative companies in each Internet category are referenced below.
• See the appendix for the complete list of companies within each product category.
THE SEG INTERNET INDEX BY PRODUCT CATEGORY
39
Search
SOFTWARE EQUITY GROUP | Q3 2015 SOFTWARE INDUSTRY FINANCIAL REPORTCopyright © SEG Capital Advisors, LLC, All Rights Reserved
THE SEG INTERNET INDEX BY PRODUCT CATEGORY:FINANCIAL PERFORMANCE
3Q15 Median YoY Change in Revenue Growth3Q15 Median TTM Revenue Growth
3Q15 Median YoY Change in EBITDA Margin3Q15 Median TTM EBITDA Margin
40
20.1%
16.2%
8.8%
16.8%
4.2%
14.9%
19.1%
46.2%
16.3%
Ad Tech
Commerce
Content & Media
Gaming
Infrastructure
Search
Services
Social
Travel
(24.7%)
0.4%
(28.7%)
73.8% (59.9%)
(39.6%)
(25.8%)
(27.4%)
(34.2%)
Ad Tech
Commerce
Content & Media
Gaming
Infrastructure
Search
Services
Social
Travel
1.8%
6.2%
8.9%
36.2%
5.7%
30.4%
8.0%
8.5%
11.3%
Ad Tech
Commerce
Content & Media
Gaming
Infrastructure
Search
Services
Social
Travel
(23.1%)
14.7%
(36.7%)
56.1%
52.6%
(15.4%)
6.8%
(20.4%)
(30.4%)
Ad Tech
Commerce
Content & Media
Gaming
Infrastructure
Search
Services
Social
Travel
SOFTWARE EQUITY GROUP | Q3 2015 SOFTWARE INDUSTRY FINANCIAL REPORTCopyright © SEG Capital Advisors, LLC, All Rights Reserved
THE SEG INTERNET INDEX BY PRODUCT CATEGORY:PUBLIC MARKET MULTIPLES
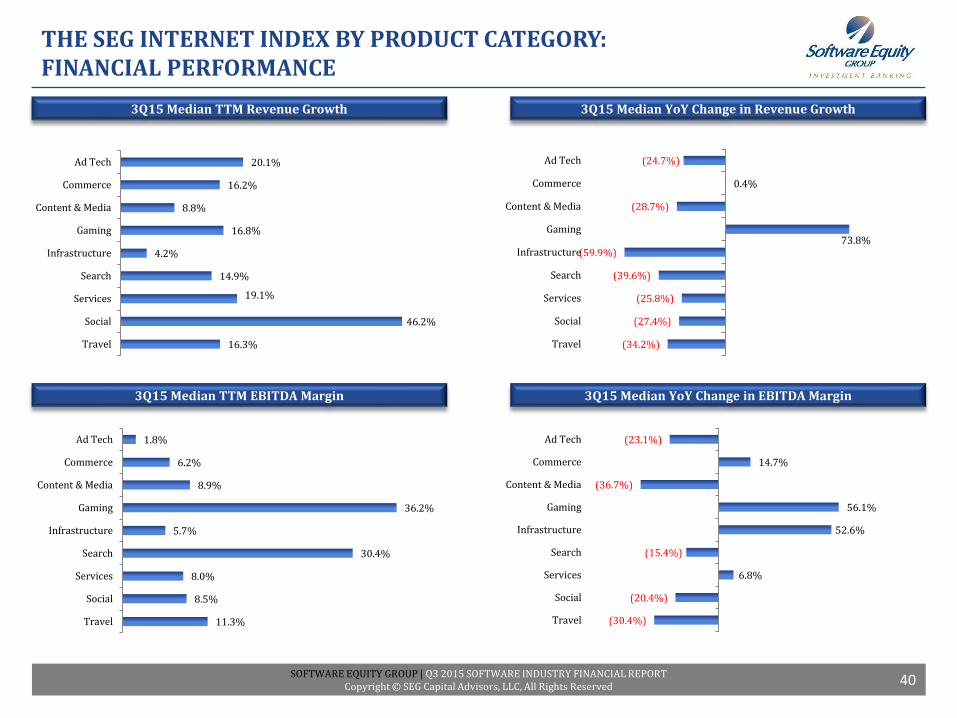
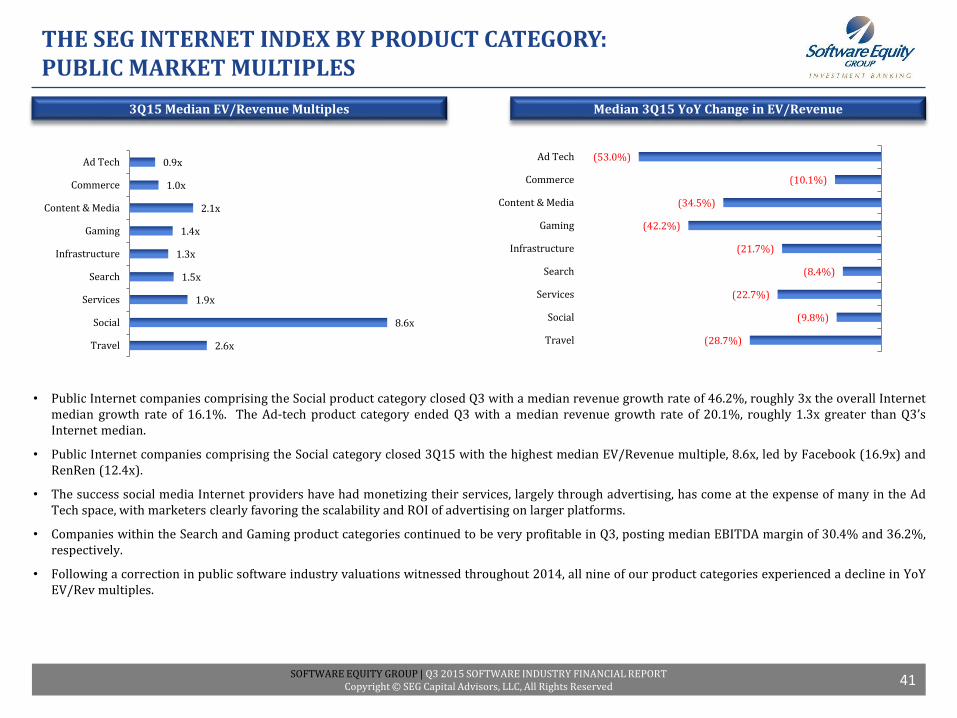
• Public Internet companies comprising the Social product category closed Q3 with a median revenue growth rate of 46.2%, roughly 3x the overall Internetmedian growth rate of 16.1%. The Ad-tech product category ended Q3 with a median revenue growth rate of 20.1%, roughly 1.3x greater than Q3’sInternet median.
• Public Internet companies comprising the Social category closed 3Q15 with the highest median EV/Revenue multiple, 8.6x, led by Facebook (16.9x) andRenRen (12.4x).
• The success social media Internet providers have had monetizing their services, largely through advertising, has come at the expense of many in the AdTech space, with marketers clearly favoring the scalability and ROI of advertising on larger platforms.
• Companies within the Search and Gaming product categories continued to be very profitable in Q3, posting median EBITDA margin of 30.4% and 36.2%,respectively.
• Following a correction in public software industry valuations witnessed throughout 2014, all nine of our product categories experienced a decline in YoYEV/Rev multiples.
Median 3Q15 YoY Change in EV/Revenue3Q15 Median EV/Revenue Multiples
41
0.9x
1.0x
2.1x
1.4x
1.3x
1.5x
1.9x
8.6x
2.6x
Ad Tech
Commerce
Content & Media
Gaming
Infrastructure
Search
Services
Social
Travel
(53.0%)
(10.1%)
(34.5%)
(42.2%)
(21.7%)
(8.4%)
(22.7%)
(9.8%)
(28.7%)
Ad Tech
Commerce
Content & Media
Gaming
Infrastructure
Search
Services
Social
Travel
SOFTWARE EQUITY GROUP | Q3 2015 SOFTWARE INDUSTRY FINANCIAL REPORTCopyright © SEG Capital Advisors, LLC, All Rights Reserved
SOFTWARE INDUSTRY M&A MARKET UPDATE
SOFTWARE EQUITY GROUP | Q3 2015 SOFTWARE INDUSTRY FINANCIAL REPORTCopyright © SEG Capital Advisors, LLC, All Rights Reserved
Average On-Premise Software Deal SizeU.S. Software Mergers & Acquisitions Activity
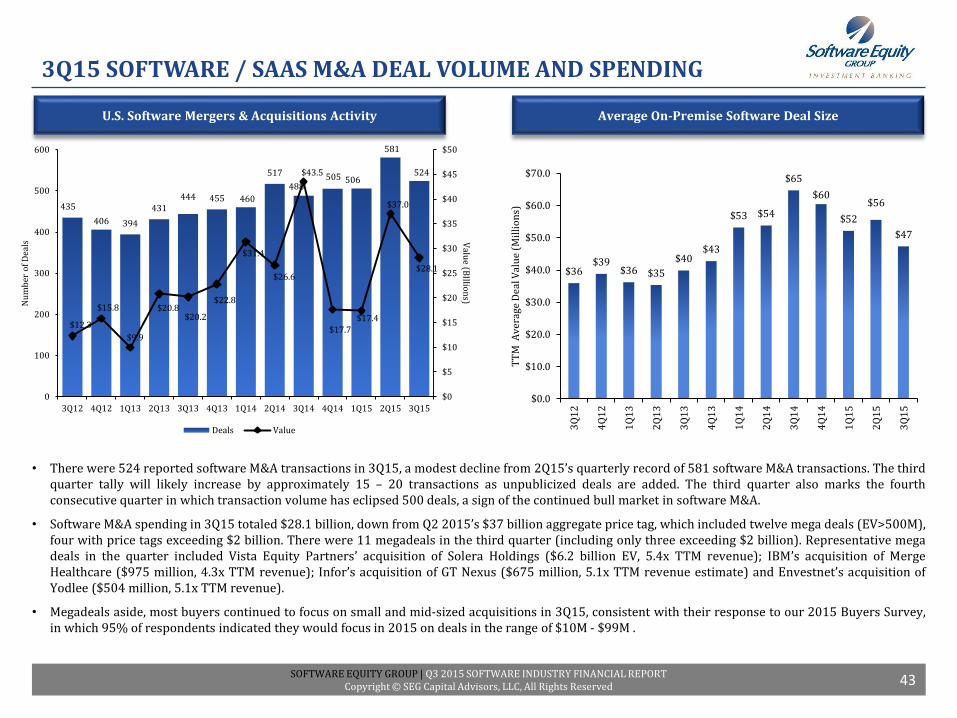
• There were 524 reported software M&A transactions in 3Q15, a modest decline from 2Q15’s quarterly record of 581 software M&A transactions. The thirdquarter tally will likely increase by approximately 15 – 20 transactions as unpublicized deals are added. The third quarter also marks the fourthconsecutive quarter in which transaction volume has eclipsed 500 deals, a sign of the continued bull market in software M&A.
• Software M&A spending in 3Q15 totaled $28.1 billion, down from Q2 2015’s $37 billion aggregate price tag, which included twelve mega deals (EV>500M),four with price tags exceeding $2 billion. There were 11 megadeals in the third quarter (including only three exceeding $2 billion). Representative megadeals in the quarter included Vista Equity Partners’ acquisition of Solera Holdings ($6.2 billion EV, 5.4x TTM revenue); IBM’s acquisition of MergeHealthcare ($975 million, 4.3x TTM revenue); Infor’s acquisition of GT Nexus ($675 million, 5.1x TTM revenue estimate) and Envestnet’s acquisition ofYodlee ($504 million, 5.1x TTM revenue).
• Megadeals aside, most buyers continued to focus on small and mid-sized acquisitions in 3Q15, consistent with their response to our 2015 Buyers Survey,in which 95% of respondents indicated they would focus in 2015 on deals in the range of $10M - $99M .
3Q15 SOFTWARE / SAAS M&A DEAL VOLUME AND SPENDING
43
435
406 394
431444 455 460
517
488505 506
581
524
$12.3
$15.8
$9.9
$20.8$20.2
$22.8
$31.4
$26.6
$43.5
$17.7$17.4
$37.0
$28.1
$0
$5
$10
$15
$20
$25
$30
$35
$40
$45
$50
0
100
200
300
400
500
600
3Q12 4Q12 1Q13 2Q13 3Q13 4Q13 1Q14 2Q14 3Q14 4Q14 1Q15 2Q15 3Q15
Valu
e (BIllio
ns)
Nu
mb
er o
f D
eals
Deals Value
$36$39
$36 $35
$40$43
$53 $54
$65
$60
$52
$56
$47
$0.0
$10.0
$20.0
$30.0
$40.0
$50.0
$60.0
$70.0
3Q
12
4Q
12
1Q
13
2Q
13
3Q
13
4Q
13
1Q
14
2Q
14
3Q
14
4Q
14
1Q
15
2Q
15
3Q
15
TT
M A
ver
age
Dea
l Val
ue
(Mil
lio
ns)
SOFTWARE EQUITY GROUP | Q3 2015 SOFTWARE INDUSTRY FINANCIAL REPORTCopyright © SEG Capital Advisors, LLC, All Rights Reserved
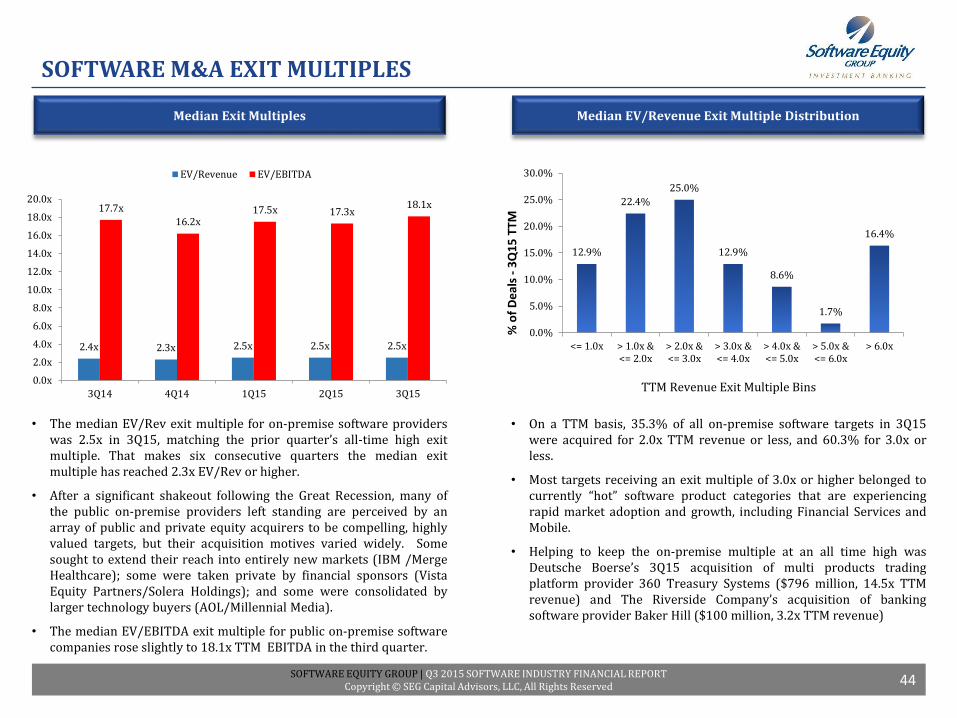
• The median EV/Rev exit multiple for on-premise software providerswas 2.5x in 3Q15, matching the prior quarter’s all-time high exitmultiple. That makes six consecutive quarters the median exitmultiple has reached 2.3x EV/Rev or higher.
• After a significant shakeout following the Great Recession, many ofthe public on-premise providers left standing are perceived by anarray of public and private equity acquirers to be compelling, highlyvalued targets, but their acquisition motives varied widely. Somesought to extend their reach into entirely new markets (IBM /MergeHealthcare); some were taken private by financial sponsors (VistaEquity Partners/Solera Holdings); and some were consolidated bylarger technology buyers (AOL/Millennial Media).
• The median EV/EBITDA exit multiple for public on-premise softwarecompanies rose slightly to 18.1x TTM EBITDA in the third quarter.
SOFTWARE M&A EXIT MULTIPLES
• On a TTM basis, 35.3% of all on-premise software targets in 3Q15were acquired for 2.0x TTM revenue or less, and 60.3% for 3.0x orless.
• Most targets receiving an exit multiple of 3.0x or higher belonged tocurrently “hot” software product categories that are experiencingrapid market adoption and growth, including Financial Services andMobile.
• Helping to keep the on-premise multiple at an all time high wasDeutsche Boerse’s 3Q15 acquisition of multi products tradingplatform provider 360 Treasury Systems ($796 million, 14.5x TTMrevenue) and The Riverside Company’s acquisition of bankingsoftware provider Baker Hill ($100 million, 3.2x TTM revenue)
Median EV/Revenue Exit Multiple DistributionMedian Exit Multiples
44
2.4x 2.3x 2.5x 2.5x 2.5x
17.7x
16.2x17.5x 17.3x
18.1x
0.0x
2.0x
4.0x
6.0x
8.0x
10.0x
12.0x
14.0x
16.0x
18.0x
20.0x
3Q14 4Q14 1Q15 2Q15 3Q15
EV/Revenue EV/EBITDA
12.9%
22.4%
25.0%
12.9%
8.6%
1.7%
16.4%
0.0%
5.0%
10.0%
15.0%
20.0%
25.0%
30.0%
<= 1.0x > 1.0x &<= 2.0x
> 2.0x &<= 3.0x
> 3.0x &<= 4.0x
> 4.0x &<= 5.0x
> 5.0x &<= 6.0x
> 6.0x
TTM Revenue Exit Multiple Bins
% o
f D
eal
s-
3Q
15
TTM
SOFTWARE EQUITY GROUP | Q3 2015 SOFTWARE INDUSTRY FINANCIAL REPORTCopyright © SEG Capital Advisors, LLC, All Rights Reserved
Large Vs. Smaller BuyerPublic vs. Private Target
SOFTWARE M&A: BY OWNERSHIP STRUCTURE AND SIZE
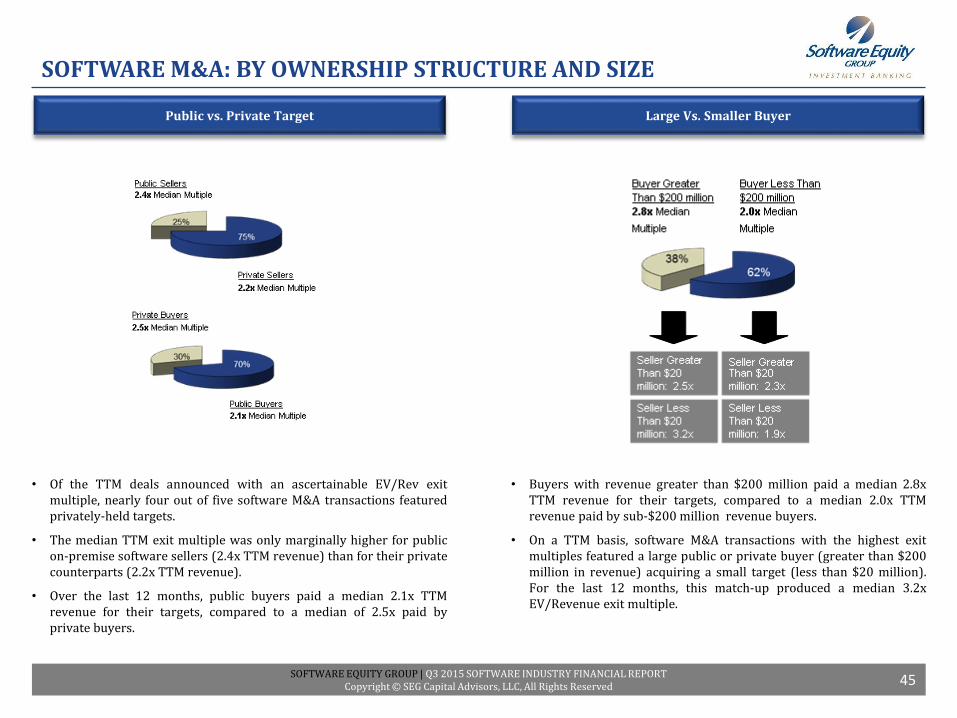
• Of the TTM deals announced with an ascertainable EV/Rev exitmultiple, nearly four out of five software M&A transactions featuredprivately-held targets.
• The median TTM exit multiple was only marginally higher for publicon-premise software sellers (2.4x TTM revenue) than for their privatecounterparts (2.2x TTM revenue).
• Over the last 12 months, public buyers paid a median 2.1x TTMrevenue for their targets, compared to a median of 2.5x paid byprivate buyers.
• Buyers with revenue greater than $200 million paid a median 2.8xTTM revenue for their targets, compared to a median 2.0x TTMrevenue paid by sub-$200 million revenue buyers.
• On a TTM basis, software M&A transactions with the highest exitmultiples featured a large public or private buyer (greater than $200million in revenue) acquiring a small target (less than $20 million).For the last 12 months, this match-up produced a median 3.2xEV/Revenue exit multiple.
45
SOFTWARE EQUITY GROUP | Q3 2015 SOFTWARE INDUSTRY FINANCIAL REPORTCopyright © SEG Capital Advisors, LLC, All Rights Reserved
SOFTWARE M&A: BY VERTICAL AND HORIZONTAL MARKETS
Horizontal & Vertical M&A Median EV/Revenue Exit MultiplesHorizontal & Vertical M&A Volume
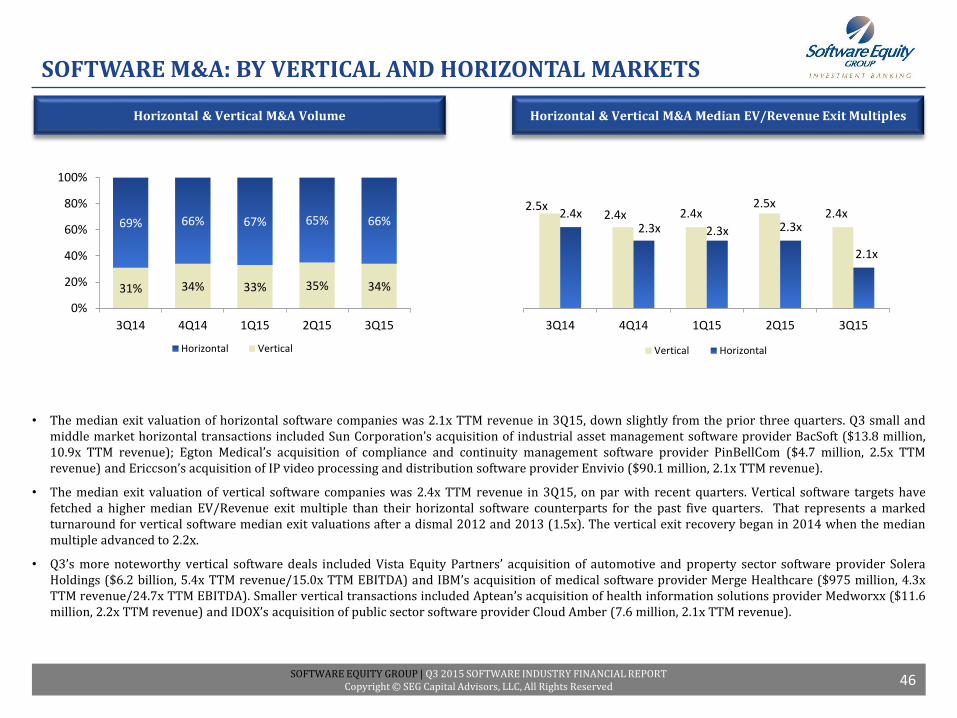
• The median exit valuation of horizontal software companies was 2.1x TTM revenue in 3Q15, down slightly from the prior three quarters. Q3 small andmiddle market horizontal transactions included Sun Corporation’s acquisition of industrial asset management software provider BacSoft ($13.8 million,10.9x TTM revenue); Egton Medical’s acquisition of compliance and continuity management software provider PinBellCom ($4.7 million, 2.5x TTMrevenue) and Ericcson’s acquisition of IP video processing and distribution software provider Envivio ($90.1 million, 2.1x TTM revenue).
• The median exit valuation of vertical software companies was 2.4x TTM revenue in 3Q15, on par with recent quarters. Vertical software targets havefetched a higher median EV/Revenue exit multiple than their horizontal software counterparts for the past five quarters. That represents a markedturnaround for vertical software median exit valuations after a dismal 2012 and 2013 (1.5x). The vertical exit recovery began in 2014 when the medianmultiple advanced to 2.2x.
• Q3’s more noteworthy vertical software deals included Vista Equity Partners’ acquisition of automotive and property sector software provider SoleraHoldings ($6.2 billion, 5.4x TTM revenue/15.0x TTM EBITDA) and IBM’s acquisition of medical software provider Merge Healthcare ($975 million, 4.3xTTM revenue/24.7x TTM EBITDA). Smaller vertical transactions included Aptean’s acquisition of health information solutions provider Medworxx ($11.6million, 2.2x TTM revenue) and IDOX’s acquisition of public sector software provider Cloud Amber (7.6 million, 2.1x TTM revenue).
46
31% 34% 33% 35% 34%
69% 66% 67% 65% 66%
0%
20%
40%
60%
80%
100%
3Q14 4Q14 1Q15 2Q15 3Q15
Horizontal Vertical
2.5x2.4x 2.4x
2.5x2.4x2.4x
2.3x 2.3x 2.3x
2.1x
3Q14 4Q14 1Q15 2Q15 3Q15
Vertical Horizontal
SOFTWARE EQUITY GROUP | Q3 2015 SOFTWARE INDUSTRY FINANCIAL REPORTCopyright © SEG Capital Advisors, LLC, All Rights Reserved
SOFTWARE M&A ACTIVITY BY PRODUCT CATEGORY
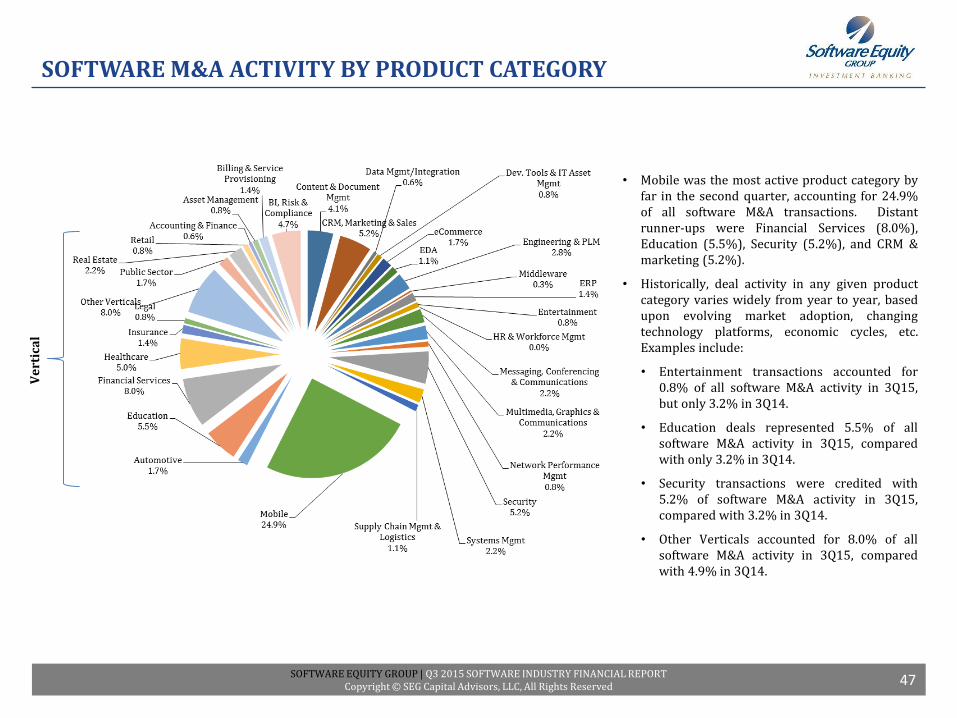
• Mobile was the most active product category byfar in the second quarter, accounting for 24.9%of all software M&A transactions. Distantrunner-ups were Financial Services (8.0%),Education (5.5%), Security (5.2%), and CRM &marketing (5.2%).
• Historically, deal activity in any given productcategory varies widely from year to year, basedupon evolving market adoption, changingtechnology platforms, economic cycles, etc.Examples include:
• Entertainment transactions accounted for0.8% of all software M&A activity in 3Q15,but only 3.2% in 3Q14.
• Education deals represented 5.5% of allsoftware M&A activity in 3Q15, comparedwith only 3.2% in 3Q14.
• Security transactions were credited with5.2% of software M&A activity in 3Q15,compared with 3.2% in 3Q14.
• Other Verticals accounted for 8.0% of allsoftware M&A activity in 3Q15, comparedwith 4.9% in 3Q14.
47
Ve
rtic
al
SOFTWARE EQUITY GROUP | Q3 2015 SOFTWARE INDUSTRY FINANCIAL REPORTCopyright © SEG Capital Advisors, LLC, All Rights Reserved
SOFTWARE M&A EXIT VALUATIONS BY PRODUCT CATEGORY
Median EV/Revenue Exit Multiples by Software Product Category
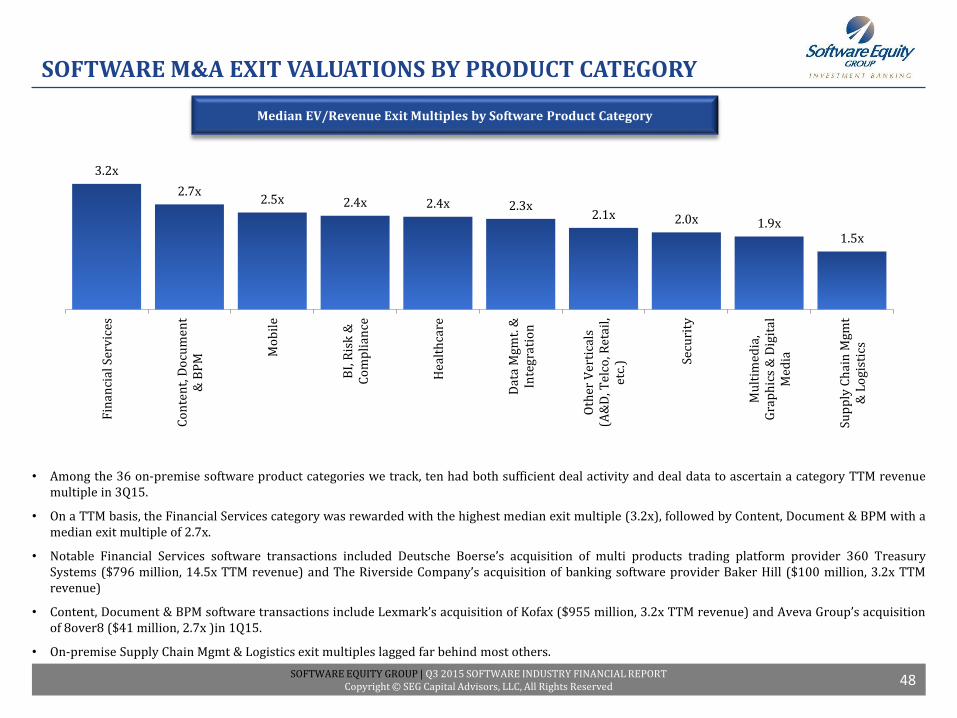
• Among the 36 on-premise software product categories we track, ten had both sufficient deal activity and deal data to ascertain a category TTM revenuemultiple in 3Q15.
• On a TTM basis, the Financial Services category was rewarded with the highest median exit multiple (3.2x), followed by Content, Document & BPM with amedian exit multiple of 2.7x.
• Notable Financial Services software transactions included Deutsche Boerse’s acquisition of multi products trading platform provider 360 TreasurySystems ($796 million, 14.5x TTM revenue) and The Riverside Company’s acquisition of banking software provider Baker Hill ($100 million, 3.2x TTMrevenue)
• Content, Document & BPM software transactions include Lexmark’s acquisition of Kofax ($955 million, 3.2x TTM revenue) and Aveva Group’s acquisitionof 8over8 ($41 million, 2.7x )in 1Q15.
• On-premise Supply Chain Mgmt & Logistics exit multiples lagged far behind most others.
48
3.2x
2.7x2.5x 2.4x 2.4x 2.3x
2.1x 2.0x 1.9x1.5x
Fin
anci
al S
erv
ices
Co
nte
nt,
Do
cum
ent
& B
PM
Mo
bil
e
BI,
Ris
k &
Co
mp
lian
ce
Hea
lth
care
Dat
a M
gmt.
&In
teg
rati
on
Oth
er V
erti
cals
(A&
D, T
elco
, Ret
ail,
etc.
) Secu
rity
Mu
ltim
edia
,G
rap
hic
s &
Dig
ital
Med
ia
Sup
ply
Ch
ain
Mgm
t&
Lo
gist
ics
SOFTWARE EQUITY GROUP | Q3 2015 SOFTWARE INDUSTRY FINANCIAL REPORTCopyright © SEG Capital Advisors, LLC, All Rights Reserved
Median SaaS EV/Revenue Exit MultiplesSaaS M&A Volume
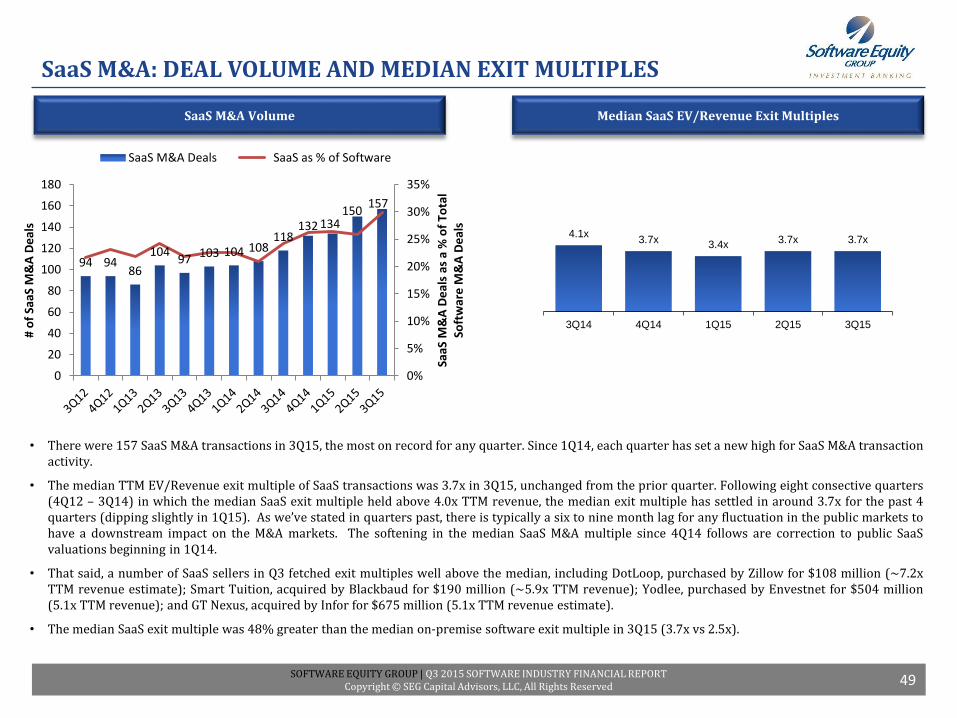
• There were 157 SaaS M&A transactions in 3Q15, the most on record for any quarter. Since 1Q14, each quarter has set a new high for SaaS M&A transactionactivity.
• The median TTM EV/Revenue exit multiple of SaaS transactions was 3.7x in 3Q15, unchanged from the prior quarter. Following eight consective quarters(4Q12 – 3Q14) in which the median SaaS exit multiple held above 4.0x TTM revenue, the median exit multiple has settled in around 3.7x for the past 4quarters (dipping slightly in 1Q15). As we’ve stated in quarters past, there is typically a six to nine month lag for any fluctuation in the public markets tohave a downstream impact on the M&A markets. The softening in the median SaaS M&A multiple since 4Q14 follows are correction to public SaaSvaluations beginning in 1Q14.
• That said, a number of SaaS sellers in Q3 fetched exit multiples well above the median, including DotLoop, purchased by Zillow for $108 million (~7.2xTTM revenue estimate); Smart Tuition, acquired by Blackbaud for $190 million (~5.9x TTM revenue); Yodlee, purchased by Envestnet for $504 million(5.1x TTM revenue); and GT Nexus, acquired by Infor for $675 million (5.1x TTM revenue estimate).
• The median SaaS exit multiple was 48% greater than the median on-premise software exit multiple in 3Q15 (3.7x vs 2.5x).
SaaS M&A: DEAL VOLUME AND MEDIAN EXIT MULTIPLES
49
94 9486
10497 103 104 108
118132 134
150157
0%
5%
10%
15%
20%
25%
30%
35%
0
20
40
60
80
100
120
140
160
180
SaaS
M&
A D
eal
s as
a %
of
Tota
l So
ftw
are
M&
A D
eal
s
# o
f Sa
aS M
&A
De
als
SaaS M&A Deals SaaS as % of Software
4.1x3.7x 3.4x 3.7x 3.7x
3Q14 4Q14 1Q15 2Q15 3Q15
SOFTWARE EQUITY GROUP | Q3 2015 SOFTWARE INDUSTRY FINANCIAL REPORTCopyright © SEG Capital Advisors, LLC, All Rights Reserved
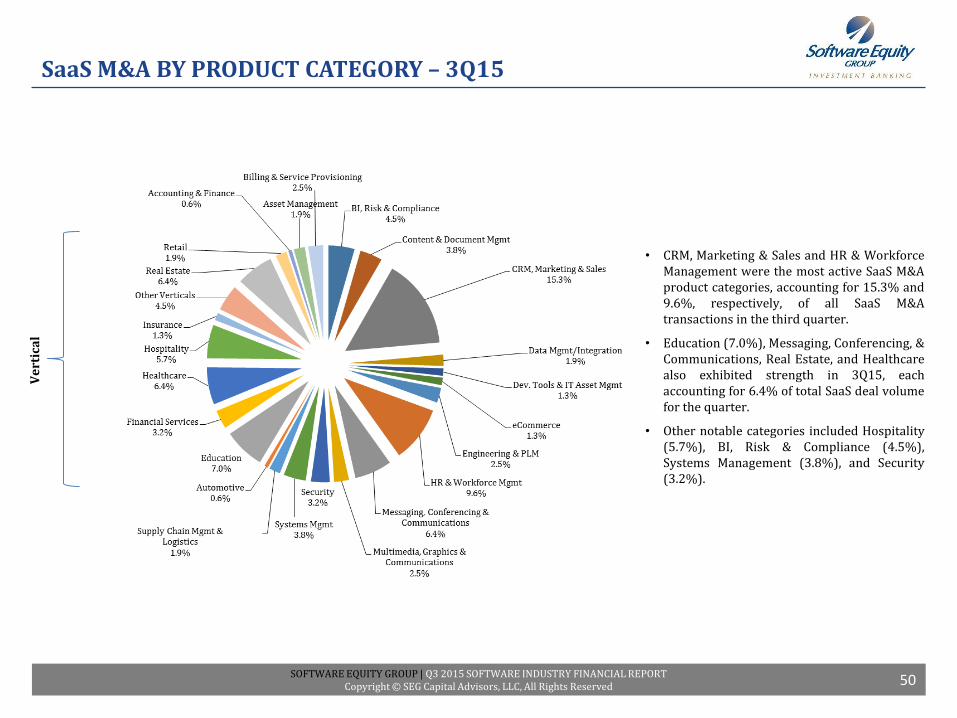
• CRM, Marketing & Sales and HR & WorkforceManagement were the most active SaaS M&Aproduct categories, accounting for 15.3% and9.6%, respectively, of all SaaS M&Atransactions in the third quarter.
• Education (7.0%), Messaging, Conferencing, &Communications, Real Estate, and Healthcarealso exhibited strength in 3Q15, eachaccounting for 6.4% of total SaaS deal volumefor the quarter.
• Other notable categories included Hospitality(5.7%), BI, Risk & Compliance (4.5%),Systems Management (3.8%), and Security(3.2%).
SaaS M&A BY PRODUCT CATEGORY – 3Q15
50
Ve
rtic
al
SOFTWARE EQUITY GROUP | Q3 2015 SOFTWARE INDUSTRY FINANCIAL REPORTCopyright © SEG Capital Advisors, LLC, All Rights Reserved
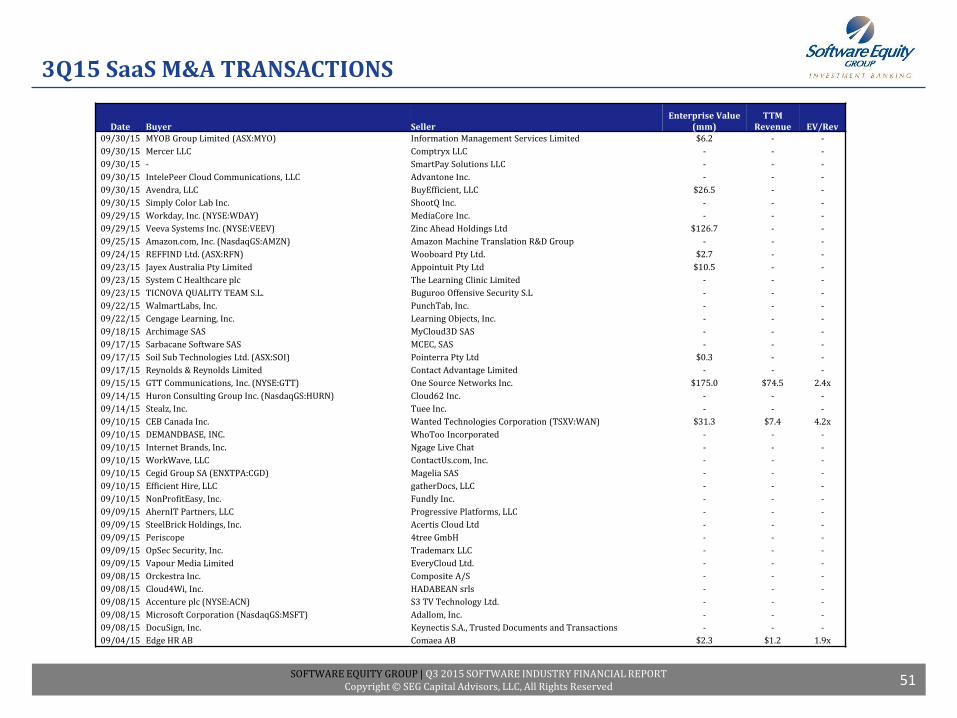
3Q15 SaaS M&A TRANSACTIONS
51
Date Buyer SellerEnterprise Value
(mm)TTM
Revenue EV/Rev
09/30/15 MYOB Group Limited (ASX:MYO) Information Management Services Limited $6.2 - -
09/30/15 Mercer LLC Comptryx LLC - - -
09/30/15 - SmartPay Solutions LLC - - -
09/30/15 IntelePeer Cloud Communications, LLC Advantone Inc. - - -
09/30/15 Avendra, LLC BuyEfficient, LLC $26.5 - -
09/30/15 Simply Color Lab Inc. ShootQ Inc. - - -
09/29/15 Workday, Inc. (NYSE:WDAY) MediaCore Inc. - - -
09/29/15 Veeva Systems Inc. (NYSE:VEEV) Zinc Ahead Holdings Ltd $126.7 - -
09/25/15 Amazon.com, Inc. (NasdaqGS:AMZN) Amazon Machine Translation R&D Group - - -
09/24/15 REFFIND Ltd. (ASX:RFN) Wooboard Pty Ltd. $2.7 - -
09/23/15 Jayex Australia Pty Limited Appointuit Pty Ltd $10.5 - -
09/23/15 System C Healthcare plc The Learning Clinic Limited - - -
09/23/15 TICNOVA QUALITY TEAM S.L. Buguroo Offensive Security S.L - - -
09/22/15 WalmartLabs, Inc. PunchTab, Inc. - - -
09/22/15 Cengage Learning, Inc. Learning Objects, Inc. - - -
09/18/15 Archimage SAS MyCloud3D SAS - - -
09/17/15 Sarbacane Software SAS MCEC, SAS - - -
09/17/15 Soil Sub Technologies Ltd. (ASX:SOI) Pointerra Pty Ltd $0.3 - -
09/17/15 Reynolds & Reynolds Limited Contact Advantage Limited - - -
09/15/15 GTT Communications, Inc. (NYSE:GTT) One Source Networks Inc. $175.0 $74.5 2.4x
09/14/15 Huron Consulting Group Inc. (NasdaqGS:HURN) Cloud62 Inc. - - -
09/14/15 Stealz, Inc. Tuee Inc. - - -
09/10/15 CEB Canada Inc. Wanted Technologies Corporation (TSXV:WAN) $31.3 $7.4 4.2x
09/10/15 DEMANDBASE, INC. WhoToo Incorporated - - -
09/10/15 Internet Brands, Inc. Ngage Live Chat - - -
09/10/15 WorkWave, LLC ContactUs.com, Inc. - - -
09/10/15 Cegid Group SA (ENXTPA:CGD) Magelia SAS - - -
09/10/15 Efficient Hire, LLC gatherDocs, LLC - - -
09/10/15 NonProfitEasy, Inc. Fundly Inc. - - -
09/09/15 AhernIT Partners, LLC Progressive Platforms, LLC - - -
09/09/15 SteelBrick Holdings, Inc. Acertis Cloud Ltd - - -
09/09/15 Periscope 4tree GmbH - - -
09/09/15 OpSec Security, Inc. Trademarx LLC - - -
09/09/15 Vapour Media Limited EveryCloud Ltd. - - -
09/08/15 Orckestra Inc. Composite A/S - - -
09/08/15 Cloud4Wi, Inc. HADABEAN srls - - -
09/08/15 Accenture plc (NYSE:ACN) S3 TV Technology Ltd. - - -
09/08/15 Microsoft Corporation (NasdaqGS:MSFT) Adallom, Inc. - - -
09/08/15 DocuSign, Inc. Keynectis S.A., Trusted Documents and Transactions - - -
09/04/15 Edge HR AB Comaea AB $2.3 $1.2 1.9x
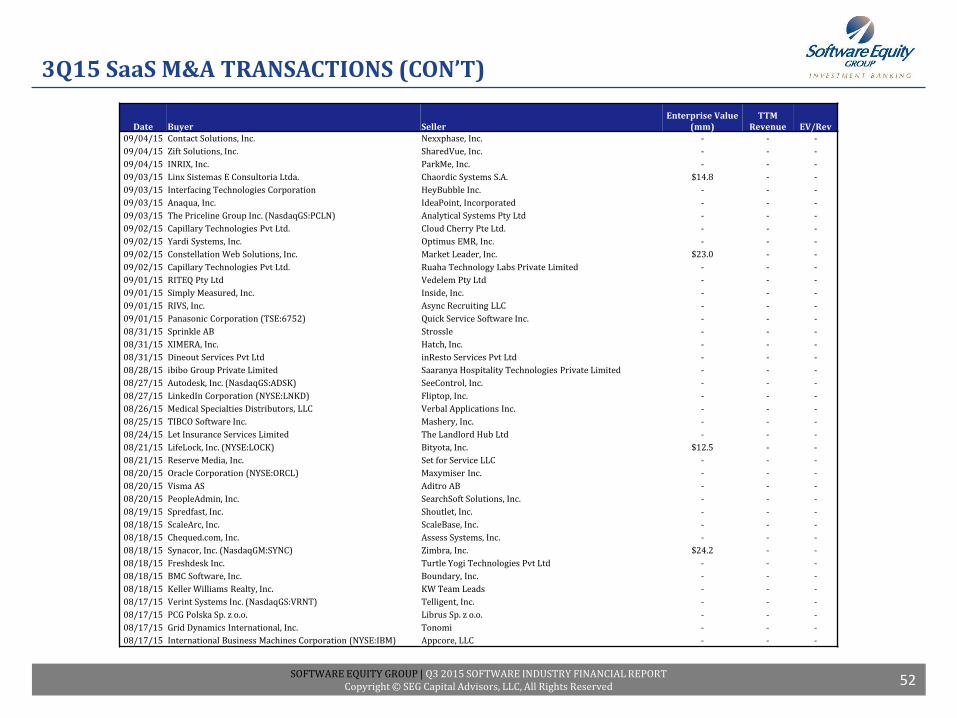
SOFTWARE EQUITY GROUP | Q3 2015 SOFTWARE INDUSTRY FINANCIAL REPORTCopyright © SEG Capital Advisors, LLC, All Rights Reserved
3Q15 SaaS M&A TRANSACTIONS (CON’T)
52
Date Buyer SellerEnterprise Value
(mm)TTM
Revenue EV/Rev
09/04/15 Contact Solutions, Inc. Nexxphase, Inc. - - -
09/04/15 Zift Solutions, Inc. SharedVue, Inc. - - -
09/04/15 INRIX, Inc. ParkMe, Inc. - - -
09/03/15 Linx Sistemas E Consultoria Ltda. Chaordic Systems S.A. $14.8 - -
09/03/15 Interfacing Technologies Corporation HeyBubble Inc. - - -
09/03/15 Anaqua, Inc. IdeaPoint, Incorporated - - -
09/03/15 The Priceline Group Inc. (NasdaqGS:PCLN) Analytical Systems Pty Ltd - - -
09/02/15 Capillary Technologies Pvt Ltd. Cloud Cherry Pte Ltd. - - -
09/02/15 Yardi Systems, Inc. Optimus EMR, Inc. - - -
09/02/15 Constellation Web Solutions, Inc. Market Leader, Inc. $23.0 - -
09/02/15 Capillary Technologies Pvt Ltd. Ruaha Technology Labs Private Limited - - -
09/01/15 RITEQ Pty Ltd Vedelem Pty Ltd - - -
09/01/15 Simply Measured, Inc. Inside, Inc. - - -
09/01/15 RIVS, Inc. Async Recruiting LLC - - -
09/01/15 Panasonic Corporation (TSE:6752) Quick Service Software Inc. - - -
08/31/15 Sprinkle AB Strossle - - -
08/31/15 XIMERA, Inc. Hatch, Inc. - - -
08/31/15 Dineout Services Pvt Ltd inResto Services Pvt Ltd - - -
08/28/15 ibibo Group Private Limited Saaranya Hospitality Technologies Private Limited - - -
08/27/15 Autodesk, Inc. (NasdaqGS:ADSK) SeeControl, Inc. - - -
08/27/15 LinkedIn Corporation (NYSE:LNKD) Fliptop, Inc. - - -
08/26/15 Medical Specialties Distributors, LLC Verbal Applications Inc. - - -
08/25/15 TIBCO Software Inc. Mashery, Inc. - - -
08/24/15 Let Insurance Services Limited The Landlord Hub Ltd - - -
08/21/15 LifeLock, Inc. (NYSE:LOCK) Bityota, Inc. $12.5 - -
08/21/15 Reserve Media, Inc. Set for Service LLC - - -
08/20/15 Oracle Corporation (NYSE:ORCL) Maxymiser Inc. - - -
08/20/15 Visma AS Aditro AB - - -
08/20/15 PeopleAdmin, Inc. SearchSoft Solutions, Inc. - - -
08/19/15 Spredfast, Inc. Shoutlet, Inc. - - -
08/18/15 ScaleArc, Inc. ScaleBase, Inc. - - -
08/18/15 Chequed.com, Inc. Assess Systems, Inc. - - -
08/18/15 Synacor, Inc. (NasdaqGM:SYNC) Zimbra, Inc. $24.2 - -
08/18/15 Freshdesk Inc. Turtle Yogi Technologies Pvt Ltd - - -
08/18/15 BMC Software, Inc. Boundary, Inc. - - -
08/18/15 Keller Williams Realty, Inc. KW Team Leads - - -
08/17/15 Verint Systems Inc. (NasdaqGS:VRNT) Telligent, Inc. - - -
08/17/15 PCG Polska Sp. z o.o. Librus Sp. z o.o. - - -
08/17/15 Grid Dynamics International, Inc. Tonomi - - -
08/17/15 International Business Machines Corporation (NYSE:IBM) Appcore, LLC - - -
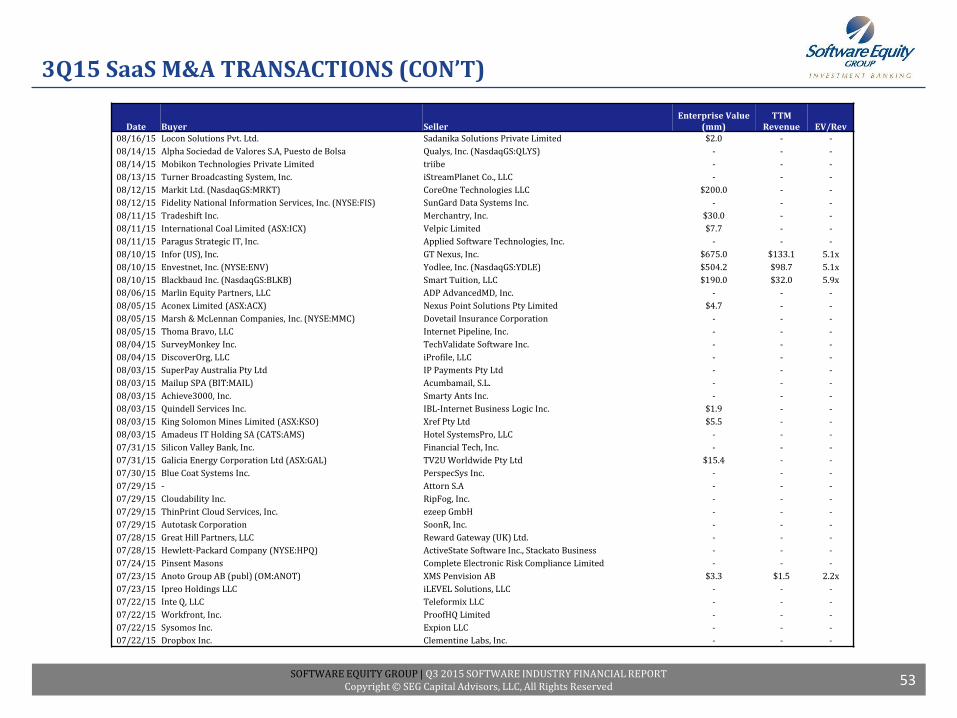
SOFTWARE EQUITY GROUP | Q3 2015 SOFTWARE INDUSTRY FINANCIAL REPORTCopyright © SEG Capital Advisors, LLC, All Rights Reserved
3Q15 SaaS M&A TRANSACTIONS (CON’T)
53
Date Buyer SellerEnterprise Value
(mm)TTM
Revenue EV/Rev
08/16/15 Locon Solutions Pvt. Ltd. Sadanika Solutions Private Limited $2.0 - -
08/14/15 Alpha Sociedad de Valores S.A, Puesto de Bolsa Qualys, Inc. (NasdaqGS:QLYS) - - -
08/14/15 Mobikon Technologies Private Limited triibe - - -
08/13/15 Turner Broadcasting System, Inc. iStreamPlanet Co., LLC - - -
08/12/15 Markit Ltd. (NasdaqGS:MRKT) CoreOne Technologies LLC $200.0 - -
08/12/15 Fidelity National Information Services, Inc. (NYSE:FIS) SunGard Data Systems Inc. - - -
08/11/15 Tradeshift Inc. Merchantry, Inc. $30.0 - -
08/11/15 International Coal Limited (ASX:ICX) Velpic Limited $7.7 - -
08/11/15 Paragus Strategic IT, Inc. Applied Software Technologies, Inc. - - -
08/10/15 Infor (US), Inc. GT Nexus, Inc. $675.0 $133.1 5.1x
08/10/15 Envestnet, Inc. (NYSE:ENV) Yodlee, Inc. (NasdaqGS:YDLE) $504.2 $98.7 5.1x
08/10/15 Blackbaud Inc. (NasdaqGS:BLKB) Smart Tuition, LLC $190.0 $32.0 5.9x
08/06/15 Marlin Equity Partners, LLC ADP AdvancedMD, Inc. - - -
08/05/15 Aconex Limited (ASX:ACX) Nexus Point Solutions Pty Limited $4.7 - -
08/05/15 Marsh & McLennan Companies, Inc. (NYSE:MMC) Dovetail Insurance Corporation - - -
08/05/15 Thoma Bravo, LLC Internet Pipeline, Inc. - - -
08/04/15 SurveyMonkey Inc. TechValidate Software Inc. - - -
08/04/15 DiscoverOrg, LLC iProfile, LLC - - -
08/03/15 SuperPay Australia Pty Ltd IP Payments Pty Ltd - - -
08/03/15 Mailup SPA (BIT:MAIL) Acumbamail, S.L. - - -
08/03/15 Achieve3000, Inc. Smarty Ants Inc. - - -
08/03/15 Quindell Services Inc. IBL-Internet Business Logic Inc. $1.9 - -
08/03/15 King Solomon Mines Limited (ASX:KSO) Xref Pty Ltd $5.5 - -
08/03/15 Amadeus IT Holding SA (CATS:AMS) Hotel SystemsPro, LLC - - -
07/31/15 Silicon Valley Bank, Inc. Financial Tech, Inc. - - -
07/31/15 Galicia Energy Corporation Ltd (ASX:GAL) TV2U Worldwide Pty Ltd $15.4 - -
07/30/15 Blue Coat Systems Inc. PerspecSys Inc. - - -
07/29/15 - Attorn S.A - - -
07/29/15 Cloudability Inc. RipFog, Inc. - - -
07/29/15 ThinPrint Cloud Services, Inc. ezeep GmbH - - -
07/29/15 Autotask Corporation SoonR, Inc. - - -
07/28/15 Great Hill Partners, LLC Reward Gateway (UK) Ltd. - - -
07/28/15 Hewlett-Packard Company (NYSE:HPQ) ActiveState Software Inc., Stackato Business - - -
07/24/15 Pinsent Masons Complete Electronic Risk Compliance Limited - - -
07/23/15 Anoto Group AB (publ) (OM:ANOT) XMS Penvision AB $3.3 $1.5 2.2x
07/23/15 Ipreo Holdings LLC iLEVEL Solutions, LLC - - -
07/22/15 Inte Q, LLC Teleformix LLC - - -
07/22/15 Workfront, Inc. ProofHQ Limited - - -
07/22/15 Sysomos Inc. Expion LLC - - -
07/22/15 Dropbox Inc. Clementine Labs, Inc. - - -
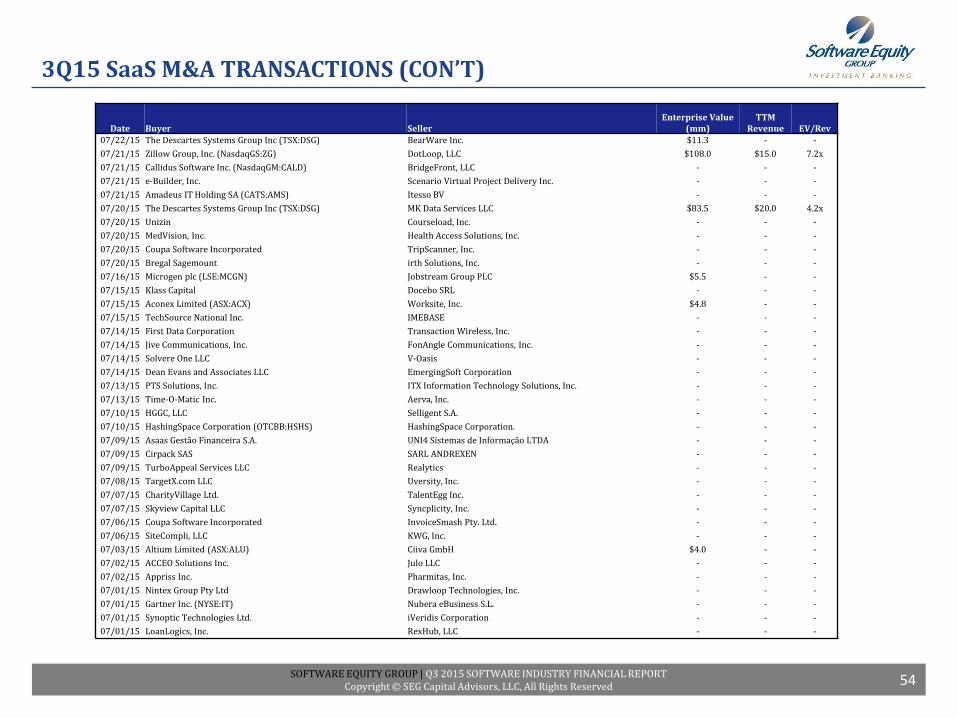
SOFTWARE EQUITY GROUP | Q3 2015 SOFTWARE INDUSTRY FINANCIAL REPORTCopyright © SEG Capital Advisors, LLC, All Rights Reserved
3Q15 SaaS M&A TRANSACTIONS (CON’T)
54
Date Buyer SellerEnterprise Value
(mm)TTM
Revenue EV/Rev
07/22/15 The Descartes Systems Group Inc (TSX:DSG) BearWare Inc. $11.3 - -
07/21/15 Zillow Group, Inc. (NasdaqGS:ZG) DotLoop, LLC $108.0 $15.0 7.2x
07/21/15 Callidus Software Inc. (NasdaqGM:CALD) BridgeFront, LLC - - -
07/21/15 e-Builder, Inc. Scenario Virtual Project Delivery Inc. - - -
07/21/15 Amadeus IT Holding SA (CATS:AMS) Itesso BV - - -
07/20/15 The Descartes Systems Group Inc (TSX:DSG) MK Data Services LLC $83.5 $20.0 4.2x
07/20/15 Unizin Courseload, Inc. - - -
07/20/15 MedVision, Inc. Health Access Solutions, Inc. - - -
07/20/15 Coupa Software Incorporated TripScanner, Inc. - - -
07/20/15 Bregal Sagemount irth Solutions, Inc. - - -
07/16/15 Microgen plc (LSE:MCGN) Jobstream Group PLC $5.5 - -
07/15/15 Klass Capital Docebo SRL - - -
07/15/15 Aconex Limited (ASX:ACX) Worksite, Inc. $4.8 - -
07/15/15 TechSource National Inc. IMEBASE - - -
07/14/15 First Data Corporation Transaction Wireless, Inc. - - -
07/14/15 Jive Communications, Inc. FonAngle Communications, Inc. - - -
07/14/15 Solvere One LLC V-Oasis - - -
07/14/15 Dean Evans and Associates LLC EmergingSoft Corporation - - -
07/13/15 PTS Solutions, Inc. ITX Information Technology Solutions, Inc. - - -
07/13/15 Time-O-Matic Inc. Aerva, Inc. - - -
07/10/15 HGGC, LLC Selligent S.A. - - -
07/10/15 HashingSpace Corporation (OTCBB:HSHS) HashingSpace Corporation. - - -
07/09/15 Asaas Gestão Financeira S.A. UNI4 Sistemas de Informação LTDA - - -
07/09/15 Cirpack SAS SARL ANDREXEN - - -
07/09/15 TurboAppeal Services LLC Realytics - - -
07/08/15 TargetX.com LLC Uversity, Inc. - - -
07/07/15 CharityVillage Ltd. TalentEgg Inc. - - -
07/07/15 Skyview Capital LLC Syncplicity, Inc. - - -
07/06/15 Coupa Software Incorporated InvoiceSmash Pty. Ltd. - - -
07/06/15 SiteCompli, LLC KWG, Inc. - - -
07/03/15 Altium Limited (ASX:ALU) Ciiva GmbH $4.0 - -
07/02/15 ACCEO Solutions Inc. Julo LLC - - -
07/02/15 Appriss Inc. Pharmitas, Inc. - - -
07/01/15 Nintex Group Pty Ltd Drawloop Technologies, Inc. - - -
07/01/15 Gartner Inc. (NYSE:IT) Nubera eBusiness S.L. - - -
07/01/15 Synoptic Technologies Ltd. iVeridis Corporation - - -
07/01/15 LoanLogics, Inc. RexHub, LLC - - -
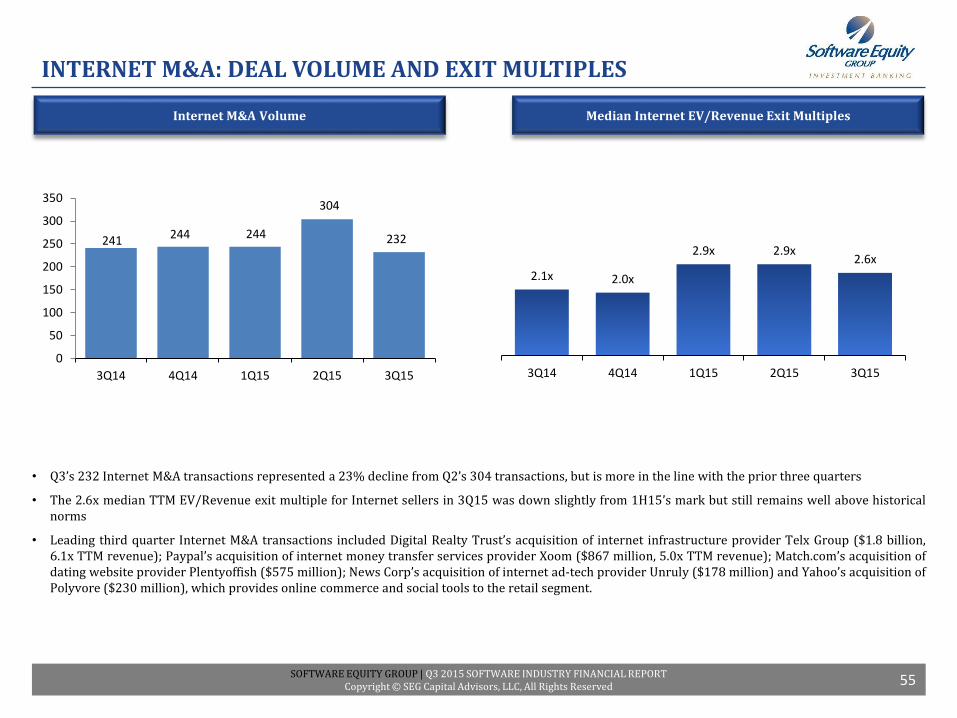
SOFTWARE EQUITY GROUP | Q3 2015 SOFTWARE INDUSTRY FINANCIAL REPORTCopyright © SEG Capital Advisors, LLC, All Rights Reserved
Internet M&A Volume
INTERNET M&A: DEAL VOLUME AND EXIT MULTIPLES
Median Internet EV/Revenue Exit Multiples
• Q3’s 232 Internet M&A transactions represented a 23% decline from Q2’s 304 transactions, but is more in the line with the prior three quarters
• The 2.6x median TTM EV/Revenue exit multiple for Internet sellers in 3Q15 was down slightly from 1H15’s mark but still remains well above historicalnorms
• Leading third quarter Internet M&A transactions included Digital Realty Trust’s acquisition of internet infrastructure provider Telx Group ($1.8 billion,6.1x TTM revenue); Paypal’s acquisition of internet money transfer services provider Xoom ($867 million, 5.0x TTM revenue); Match.com’s acquisition ofdating website provider Plentyoffish ($575 million); News Corp’s acquisition of internet ad-tech provider Unruly ($178 million) and Yahoo’s acquisition ofPolyvore ($230 million), which provides online commerce and social tools to the retail segment.
55
241 244 244
304
232
0
50
100
150
200
250
300
350
3Q14 4Q14 1Q15 2Q15 3Q15
2.1x 2.0x
2.9x 2.9x2.6x
3Q14 4Q14 1Q15 2Q15 3Q15
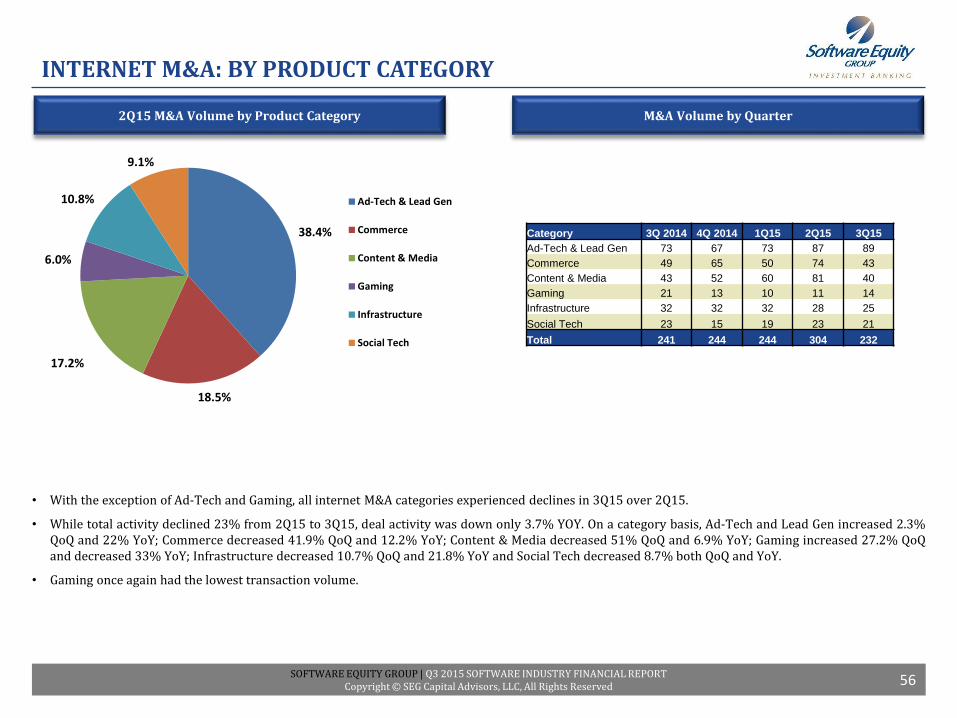
SOFTWARE EQUITY GROUP | Q3 2015 SOFTWARE INDUSTRY FINANCIAL REPORTCopyright © SEG Capital Advisors, LLC, All Rights Reserved
INTERNET M&A: BY PRODUCT CATEGORY
2Q15 M&A Volume by Product Category M&A Volume by Quarter
• With the exception of Ad-Tech and Gaming, all internet M&A categories experienced declines in 3Q15 over 2Q15.
• While total activity declined 23% from 2Q15 to 3Q15, deal activity was down only 3.7% YOY. On a category basis, Ad-Tech and Lead Gen increased 2.3%QoQ and 22% YoY; Commerce decreased 41.9% QoQ and 12.2% YoY; Content & Media decreased 51% QoQ and 6.9% YoY; Gaming increased 27.2% QoQand decreased 33% YoY; Infrastructure decreased 10.7% QoQ and 21.8% YoY and Social Tech decreased 8.7% both QoQ and YoY.
• Gaming once again had the lowest transaction volume.
56
38.4%
18.5%
17.2%
6.0%
10.8%
9.1%
Ad-Tech & Lead Gen
Commerce
Content & Media
Gaming
Infrastructure
Social Tech
Category 3Q 2014 4Q 2014 1Q15 2Q15 3Q15
Ad-Tech & Lead Gen 73 67 73 87 89
Commerce 49 65 50 74 43
Content & Media 43 52 60 81 40
Gaming 21 13 10 11 14
Infrastructure 32 32 32 28 25
Social Tech 23 15 19 23 21
Total 241 244 244 304 232
SOFTWARE EQUITY GROUP | Q3 2015 SOFTWARE INDUSTRY FINANCIAL REPORTCopyright © SEG Capital Advisors, LLC, All Rights Reserved
APPENDIX
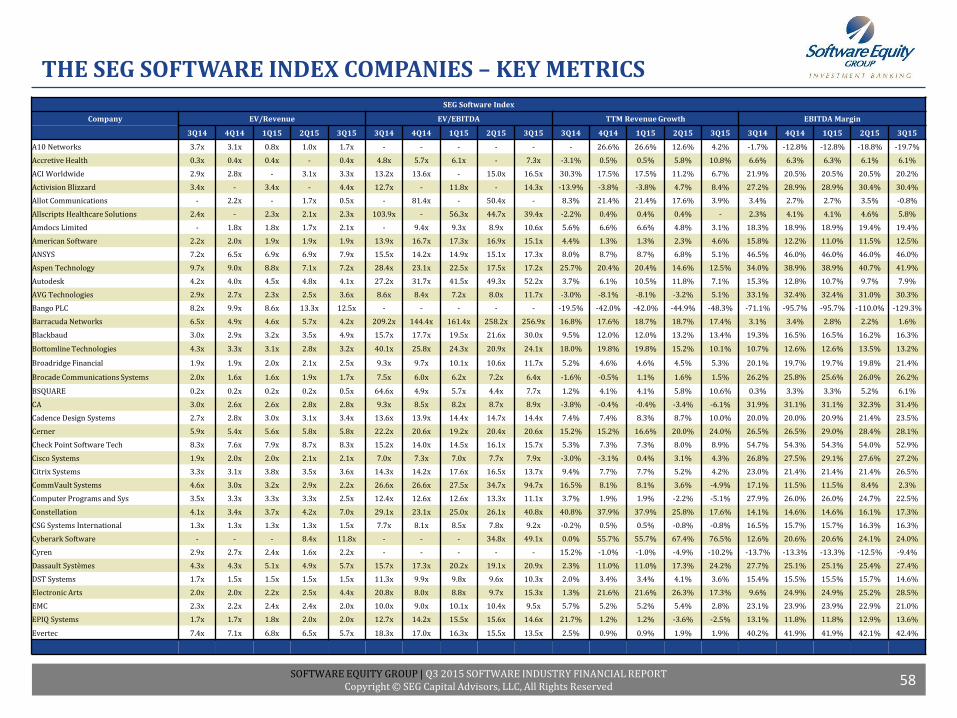
SOFTWARE EQUITY GROUP | Q3 2015 SOFTWARE INDUSTRY FINANCIAL REPORTCopyright © SEG Capital Advisors, LLC, All Rights Reserved
THE SEG SOFTWARE INDEX COMPANIES – KEY METRICS
58
SEG Software Index
Company EV/Revenue EV/EBITDA TTM Revenue Growth EBITDA Margin
3Q14 4Q14 1Q15 2Q15 3Q15 3Q14 4Q14 1Q15 2Q15 3Q15 3Q14 4Q14 1Q15 2Q15 3Q15 3Q14 4Q14 1Q15 2Q15 3Q15
A10 Networks 3.7x 3.1x 0.8x 1.0x 1.7x - - - - - - 26.6% 26.6% 12.6% 4.2% -1.7% -12.8% -12.8% -18.8% -19.7%
Accretive Health 0.3x 0.4x 0.4x - 0.4x 4.8x 5.7x 6.1x - 7.3x -3.1% 0.5% 0.5% 5.8% 10.8% 6.6% 6.3% 6.3% 6.1% 6.1%
ACI Worldwide 2.9x 2.8x - 3.1x 3.3x 13.2x 13.6x - 15.0x 16.5x 30.3% 17.5% 17.5% 11.2% 6.7% 21.9% 20.5% 20.5% 20.5% 20.2%
Activision Blizzard 3.4x - 3.4x - 4.4x 12.7x - 11.8x - 14.3x -13.9% -3.8% -3.8% 4.7% 8.4% 27.2% 28.9% 28.9% 30.4% 30.4%
Allot Communications - 2.2x - 1.7x 0.5x - 81.4x - 50.4x - 8.3% 21.4% 21.4% 17.6% 3.9% 3.4% 2.7% 2.7% 3.5% -0.8%
Allscripts Healthcare Solutions 2.4x - 2.3x 2.1x 2.3x 103.9x - 56.3x 44.7x 39.4x -2.2% 0.4% 0.4% 0.4% - 2.3% 4.1% 4.1% 4.6% 5.8%
Amdocs Limited - 1.8x 1.8x 1.7x 2.1x - 9.4x 9.3x 8.9x 10.6x 5.6% 6.6% 6.6% 4.8% 3.1% 18.3% 18.9% 18.9% 19.4% 19.4%
American Software 2.2x 2.0x 1.9x 1.9x 1.9x 13.9x 16.7x 17.3x 16.9x 15.1x 4.4% 1.3% 1.3% 2.3% 4.6% 15.8% 12.2% 11.0% 11.5% 12.5%
ANSYS 7.2x 6.5x 6.9x 6.9x 7.9x 15.5x 14.2x 14.9x 15.1x 17.3x 8.0% 8.7% 8.7% 6.8% 5.1% 46.5% 46.0% 46.0% 46.0% 46.0%
Aspen Technology 9.7x 9.0x 8.8x 7.1x 7.2x 28.4x 23.1x 22.5x 17.5x 17.2x 25.7% 20.4% 20.4% 14.6% 12.5% 34.0% 38.9% 38.9% 40.7% 41.9%
Autodesk 4.2x 4.0x 4.5x 4.8x 4.1x 27.2x 31.7x 41.5x 49.3x 52.2x 3.7% 6.1% 10.5% 11.8% 7.1% 15.3% 12.8% 10.7% 9.7% 7.9%
AVG Technologies 2.9x 2.7x 2.3x 2.5x 3.6x 8.6x 8.4x 7.2x 8.0x 11.7x -3.0% -8.1% -8.1% -3.2% 5.1% 33.1% 32.4% 32.4% 31.0% 30.3%
Bango PLC 8.2x 9.9x 8.6x 13.3x 12.5x - - - - - -19.5% -42.0% -42.0% -44.9% -48.3% -71.1% -95.7% -95.7% -110.0% -129.3%
Barracuda Networks 6.5x 4.9x 4.6x 5.7x 4.2x 209.2x 144.4x 161.4x 258.2x 256.9x 16.8% 17.6% 18.7% 18.7% 17.4% 3.1% 3.4% 2.8% 2.2% 1.6%
Blackbaud 3.0x 2.9x 3.2x 3.5x 4.9x 15.7x 17.7x 19.5x 21.6x 30.0x 9.5% 12.0% 12.0% 13.2% 13.4% 19.3% 16.5% 16.5% 16.2% 16.3%
Bottomline Technologies 4.3x 3.3x 3.1x 2.8x 3.2x 40.1x 25.8x 24.3x 20.9x 24.1x 18.0% 19.8% 19.8% 15.2% 10.1% 10.7% 12.6% 12.6% 13.5% 13.2%
Broadridge Financial 1.9x 1.9x 2.0x 2.1x 2.5x 9.3x 9.7x 10.1x 10.6x 11.7x 5.2% 4.6% 4.6% 4.5% 5.3% 20.1% 19.7% 19.7% 19.8% 21.4%
Brocade Communications Systems 2.0x 1.6x 1.6x 1.9x 1.7x 7.5x 6.0x 6.2x 7.2x 6.4x -1.6% -0.5% 1.1% 1.6% 1.5% 26.2% 25.8% 25.6% 26.0% 26.2%
BSQUARE 0.2x 0.2x 0.2x 0.2x 0.5x 64.6x 4.9x 5.7x 4.4x 7.7x 1.2% 4.1% 4.1% 5.8% 10.6% 0.3% 3.3% 3.3% 5.2% 6.1%
CA 3.0x 2.6x 2.6x 2.8x 2.8x 9.3x 8.5x 8.2x 8.7x 8.9x -3.8% -0.4% -0.4% -3.4% -6.1% 31.9% 31.1% 31.1% 32.3% 31.4%
Cadence Design Systems 2.7x 2.8x 3.0x 3.1x 3.4x 13.6x 13.9x 14.4x 14.7x 14.4x 7.4% 7.4% 8.3% 8.7% 10.0% 20.0% 20.0% 20.9% 21.4% 23.5%
Cerner 5.9x 5.4x 5.6x 5.8x 5.8x 22.2x 20.6x 19.2x 20.4x 20.6x 15.2% 15.2% 16.6% 20.0% 24.0% 26.5% 26.5% 29.0% 28.4% 28.1%
Check Point Software Tech 8.3x 7.6x 7.9x 8.7x 8.3x 15.2x 14.0x 14.5x 16.1x 15.7x 5.3% 7.3% 7.3% 8.0% 8.9% 54.7% 54.3% 54.3% 54.0% 52.9%
Cisco Systems 1.9x 2.0x 2.0x 2.1x 2.1x 7.0x 7.3x 7.0x 7.7x 7.9x -3.0% -3.1% 0.4% 3.1% 4.3% 26.8% 27.5% 29.1% 27.6% 27.2%
Citrix Systems 3.3x 3.1x 3.8x 3.5x 3.6x 14.3x 14.2x 17.6x 16.5x 13.7x 9.4% 7.7% 7.7% 5.2% 4.2% 23.0% 21.4% 21.4% 21.4% 26.5%
CommVault Systems 4.6x 3.0x 3.2x 2.9x 2.2x 26.6x 26.6x 27.5x 34.7x 94.7x 16.5% 8.1% 8.1% 3.6% -4.9% 17.1% 11.5% 11.5% 8.4% 2.3%
Computer Programs and Sys 3.5x 3.3x 3.3x 3.3x 2.5x 12.4x 12.6x 12.6x 13.3x 11.1x 3.7% 1.9% 1.9% -2.2% -5.1% 27.9% 26.0% 26.0% 24.7% 22.5%
Constellation 4.1x 3.4x 3.7x 4.2x 7.0x 29.1x 23.1x 25.0x 26.1x 40.8x 40.8% 37.9% 37.9% 25.8% 17.6% 14.1% 14.6% 14.6% 16.1% 17.3%
CSG Systems International 1.3x 1.3x 1.3x 1.3x 1.5x 7.7x 8.1x 8.5x 7.8x 9.2x -0.2% 0.5% 0.5% -0.8% -0.8% 16.5% 15.7% 15.7% 16.3% 16.3%
Cyberark Software - - - 8.4x 11.8x - - - 34.8x 49.1x 0.0% 55.7% 55.7% 67.4% 76.5% 12.6% 20.6% 20.6% 24.1% 24.0%
Cyren 2.9x 2.7x 2.4x 1.6x 2.2x - - - - - 15.2% -1.0% -1.0% -4.9% -10.2% -13.7% -13.3% -13.3% -12.5% -9.4%
Dassault Systèmes 4.3x 4.3x 5.1x 4.9x 5.7x 15.7x 17.3x 20.2x 19.1x 20.9x 2.3% 11.0% 11.0% 17.3% 24.2% 27.7% 25.1% 25.1% 25.4% 27.4%
DST Systems 1.7x 1.5x 1.5x 1.5x 1.5x 11.3x 9.9x 9.8x 9.6x 10.3x 2.0% 3.4% 3.4% 4.1% 3.6% 15.4% 15.5% 15.5% 15.7% 14.6%
Electronic Arts 2.0x 2.0x 2.2x 2.5x 4.4x 20.8x 8.0x 8.8x 9.7x 15.3x 1.3% 21.6% 21.6% 26.3% 17.3% 9.6% 24.9% 24.9% 25.2% 28.5%
EMC 2.3x 2.2x 2.4x 2.4x 2.0x 10.0x 9.0x 10.1x 10.4x 9.5x 5.7% 5.2% 5.2% 5.4% 2.8% 23.1% 23.9% 23.9% 22.9% 21.0%
EPIQ Systems 1.7x 1.7x 1.8x 2.0x 2.0x 12.7x 14.2x 15.5x 15.6x 14.6x 21.7% 1.2% 1.2% -3.6% -2.5% 13.1% 11.8% 11.8% 12.9% 13.6%
Evertec 7.4x 7.1x 6.8x 6.5x 5.7x 18.3x 17.0x 16.3x 15.5x 13.5x 2.5% 0.9% 0.9% 1.9% 1.9% 40.2% 41.9% 41.9% 42.1% 42.4%
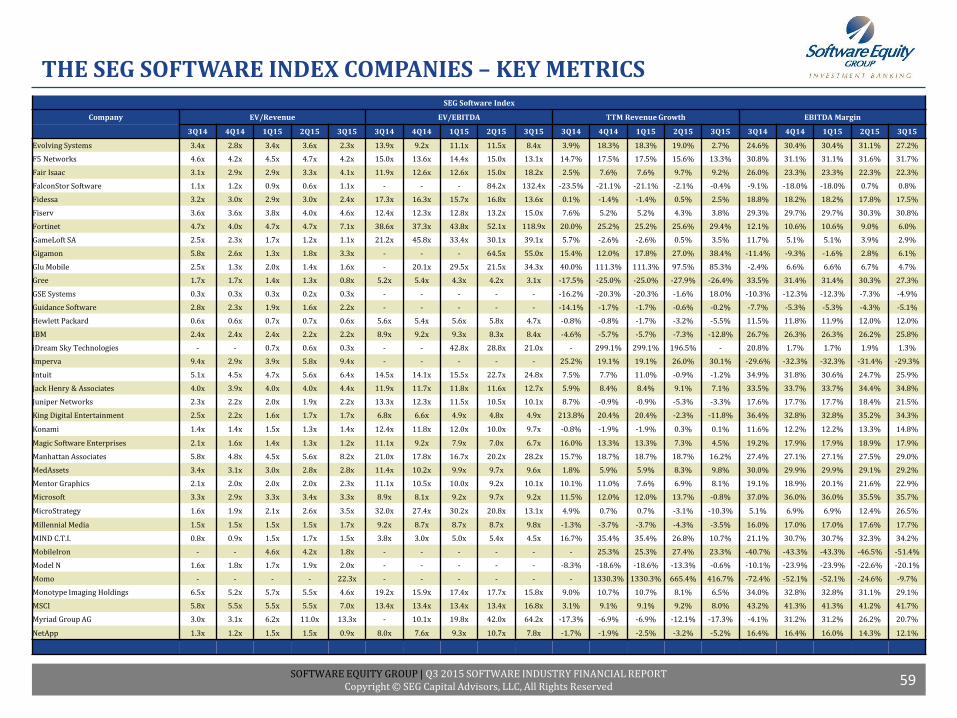
SOFTWARE EQUITY GROUP | Q3 2015 SOFTWARE INDUSTRY FINANCIAL REPORTCopyright © SEG Capital Advisors, LLC, All Rights Reserved
THE SEG SOFTWARE INDEX COMPANIES – KEY METRICS
59
SEG Software Index
Company EV/Revenue EV/EBITDA TTM Revenue Growth EBITDA Margin
3Q14 4Q14 1Q15 2Q15 3Q15 3Q14 4Q14 1Q15 2Q15 3Q15 3Q14 4Q14 1Q15 2Q15 3Q15 3Q14 4Q14 1Q15 2Q15 3Q15
Evolving Systems 3.4x 2.8x 3.4x 3.6x 2.3x 13.9x 9.2x 11.1x 11.5x 8.4x 3.9% 18.3% 18.3% 19.0% 2.7% 24.6% 30.4% 30.4% 31.1% 27.2%
F5 Networks 4.6x 4.2x 4.5x 4.7x 4.2x 15.0x 13.6x 14.4x 15.0x 13.1x 14.7% 17.5% 17.5% 15.6% 13.3% 30.8% 31.1% 31.1% 31.6% 31.7%
Fair Isaac 3.1x 2.9x 2.9x 3.3x 4.1x 11.9x 12.6x 12.6x 15.0x 18.2x 2.5% 7.6% 7.6% 9.7% 9.2% 26.0% 23.3% 23.3% 22.3% 22.3%
FalconStor Software 1.1x 1.2x 0.9x 0.6x 1.1x - - - 84.2x 132.4x -23.5% -21.1% -21.1% -2.1% -0.4% -9.1% -18.0% -18.0% 0.7% 0.8%
Fidessa 3.2x 3.0x 2.9x 3.0x 2.4x 17.3x 16.3x 15.7x 16.8x 13.6x 0.1% -1.4% -1.4% 0.5% 2.5% 18.8% 18.2% 18.2% 17.8% 17.5%
Fiserv 3.6x 3.6x 3.8x 4.0x 4.6x 12.4x 12.3x 12.8x 13.2x 15.0x 7.6% 5.2% 5.2% 4.3% 3.8% 29.3% 29.7% 29.7% 30.3% 30.8%
Fortinet 4.7x 4.0x 4.7x 4.7x 7.1x 38.6x 37.3x 43.8x 52.1x 118.9x 20.0% 25.2% 25.2% 25.6% 29.4% 12.1% 10.6% 10.6% 9.0% 6.0%
GameLoft SA 2.5x 2.3x 1.7x 1.2x 1.1x 21.2x 45.8x 33.4x 30.1x 39.1x 5.7% -2.6% -2.6% 0.5% 3.5% 11.7% 5.1% 5.1% 3.9% 2.9%
Gigamon 5.8x 2.6x 1.3x 1.8x 3.3x - - - 64.5x 55.0x 15.4% 12.0% 17.8% 27.0% 38.4% -11.4% -9.3% -1.6% 2.8% 6.1%
Glu Mobile 2.5x 1.3x 2.0x 1.4x 1.6x - 20.1x 29.5x 21.5x 34.3x 40.0% 111.3% 111.3% 97.5% 85.3% -2.4% 6.6% 6.6% 6.7% 4.7%
Gree 1.7x 1.7x 1.4x 1.3x 0.8x 5.2x 5.4x 4.3x 4.2x 3.1x -17.5% -25.0% -25.0% -27.9% -26.4% 33.5% 31.4% 31.4% 30.3% 27.3%
GSE Systems 0.3x 0.3x 0.3x 0.2x 0.3x - - - - - -16.2% -20.3% -20.3% -1.6% 18.0% -10.3% -12.3% -12.3% -7.3% -4.9%
Guidance Software 2.8x 2.3x 1.9x 1.6x 2.2x - - - - - -14.1% -1.7% -1.7% -0.6% -0.2% -7.7% -5.3% -5.3% -4.3% -5.1%
Hewlett Packard 0.6x 0.6x 0.7x 0.7x 0.6x 5.6x 5.4x 5.6x 5.8x 4.7x -0.8% -0.8% -1.7% -3.2% -5.5% 11.5% 11.8% 11.9% 12.0% 12.0%
IBM 2.4x 2.4x 2.4x 2.2x 2.2x 8.9x 9.2x 9.3x 8.3x 8.4x -4.6% -5.7% -5.7% -7.3% -12.8% 26.7% 26.3% 26.3% 26.2% 25.8%
iDream Sky Technologies - - 0.7x 0.6x 0.3x - - 42.8x 28.8x 21.0x - 299.1% 299.1% 196.5% - 20.8% 1.7% 1.7% 1.9% 1.3%
Imperva 9.4x 2.9x 3.9x 5.8x 9.4x - - - - - 25.2% 19.1% 19.1% 26.0% 30.1% -29.6% -32.3% -32.3% -31.4% -29.3%
Intuit 5.1x 4.5x 4.7x 5.6x 6.4x 14.5x 14.1x 15.5x 22.7x 24.8x 7.5% 7.7% 11.0% -0.9% -1.2% 34.9% 31.8% 30.6% 24.7% 25.9%
Jack Henry & Associates 4.0x 3.9x 4.0x 4.0x 4.4x 11.9x 11.7x 11.8x 11.6x 12.7x 5.9% 8.4% 8.4% 9.1% 7.1% 33.5% 33.7% 33.7% 34.4% 34.8%
Juniper Networks 2.3x 2.2x 2.0x 1.9x 2.2x 13.3x 12.3x 11.5x 10.5x 10.1x 8.7% -0.9% -0.9% -5.3% -3.3% 17.6% 17.7% 17.7% 18.4% 21.5%
King Digital Entertainment 2.5x 2.2x 1.6x 1.7x 1.7x 6.8x 6.6x 4.9x 4.8x 4.9x 213.8% 20.4% 20.4% -2.3% -11.8% 36.4% 32.8% 32.8% 35.2% 34.3%
Konami 1.4x 1.4x 1.5x 1.3x 1.4x 12.4x 11.8x 12.0x 10.0x 9.7x -0.8% -1.9% -1.9% 0.3% 0.1% 11.6% 12.2% 12.2% 13.3% 14.8%
Magic Software Enterprises 2.1x 1.6x 1.4x 1.3x 1.2x 11.1x 9.2x 7.9x 7.0x 6.7x 16.0% 13.3% 13.3% 7.3% 4.5% 19.2% 17.9% 17.9% 18.9% 17.9%
Manhattan Associates 5.8x 4.8x 4.5x 5.6x 8.2x 21.0x 17.8x 16.7x 20.2x 28.2x 15.7% 18.7% 18.7% 18.7% 16.2% 27.4% 27.1% 27.1% 27.5% 29.0%
MedAssets 3.4x 3.1x 3.0x 2.8x 2.8x 11.4x 10.2x 9.9x 9.7x 9.6x 1.8% 5.9% 5.9% 8.3% 9.8% 30.0% 29.9% 29.9% 29.1% 29.2%
Mentor Graphics 2.1x 2.0x 2.0x 2.0x 2.3x 11.1x 10.5x 10.0x 9.2x 10.1x 10.1% 11.0% 7.6% 6.9% 8.1% 19.1% 18.9% 20.1% 21.6% 22.9%
Microsoft 3.3x 2.9x 3.3x 3.4x 3.3x 8.9x 8.1x 9.2x 9.7x 9.2x 11.5% 12.0% 12.0% 13.7% -0.8% 37.0% 36.0% 36.0% 35.5% 35.7%
MicroStrategy 1.6x 1.9x 2.1x 2.6x 3.5x 32.0x 27.4x 30.2x 20.8x 13.1x 4.9% 0.7% 0.7% -3.1% -10.3% 5.1% 6.9% 6.9% 12.4% 26.5%
Millennial Media 1.5x 1.5x 1.5x 1.5x 1.7x 9.2x 8.7x 8.7x 8.7x 9.8x -1.3% -3.7% -3.7% -4.3% -3.5% 16.0% 17.0% 17.0% 17.6% 17.7%
MIND C.T.I. 0.8x 0.9x 1.5x 1.7x 1.5x 3.8x 3.0x 5.0x 5.4x 4.5x 16.7% 35.4% 35.4% 26.8% 10.7% 21.1% 30.7% 30.7% 32.3% 34.2%
MobileIron - - 4.6x 4.2x 1.8x - - - - - - 25.3% 25.3% 27.4% 23.3% -40.7% -43.3% -43.3% -46.5% -51.4%
Model N 1.6x 1.8x 1.7x 1.9x 2.0x - - - - - -8.3% -18.6% -18.6% -13.3% -0.6% -10.1% -23.9% -23.9% -22.6% -20.1%
Momo - - - - 22.3x - - - - - - 1330.3% 1330.3% 665.4% 416.7% -72.4% -52.1% -52.1% -24.6% -9.7%
Monotype Imaging Holdings 6.5x 5.2x 5.7x 5.5x 4.6x 19.2x 15.9x 17.4x 17.7x 15.8x 9.0% 10.7% 10.7% 8.1% 6.5% 34.0% 32.8% 32.8% 31.1% 29.1%
MSCI 5.8x 5.5x 5.5x 5.5x 7.0x 13.4x 13.4x 13.4x 13.4x 16.8x 3.1% 9.1% 9.1% 9.2% 8.0% 43.2% 41.3% 41.3% 41.2% 41.7%
Myriad Group AG 3.0x 3.1x 6.2x 11.0x 13.3x - 10.1x 19.8x 42.0x 64.2x -17.3% -6.9% -6.9% -12.1% -17.3% -4.1% 31.2% 31.2% 26.2% 20.7%
NetApp 1.3x 1.2x 1.5x 1.5x 0.9x 8.0x 7.6x 9.3x 10.7x 7.8x -1.7% -1.9% -2.5% -3.2% -5.2% 16.4% 16.4% 16.0% 14.3% 12.1%
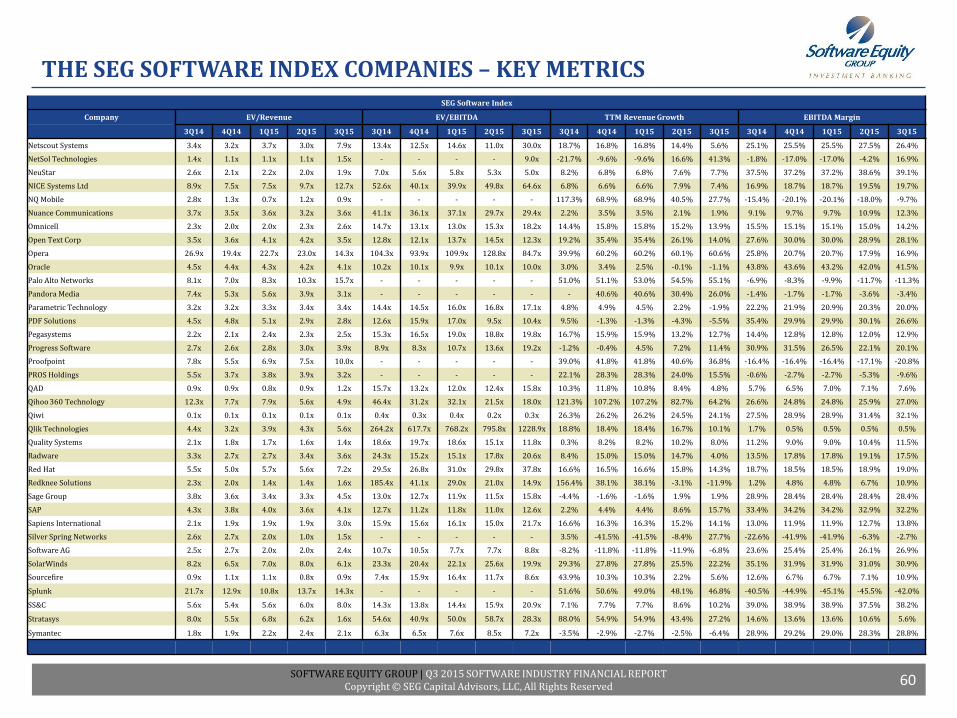
SOFTWARE EQUITY GROUP | Q3 2015 SOFTWARE INDUSTRY FINANCIAL REPORTCopyright © SEG Capital Advisors, LLC, All Rights Reserved
THE SEG SOFTWARE INDEX COMPANIES – KEY METRICS
60
SEG Software Index
Company EV/Revenue EV/EBITDA TTM Revenue Growth EBITDA Margin
3Q14 4Q14 1Q15 2Q15 3Q15 3Q14 4Q14 1Q15 2Q15 3Q15 3Q14 4Q14 1Q15 2Q15 3Q15 3Q14 4Q14 1Q15 2Q15 3Q15
Netscout Systems 3.4x 3.2x 3.7x 3.0x 7.9x 13.4x 12.5x 14.6x 11.0x 30.0x 18.7% 16.8% 16.8% 14.4% 5.6% 25.1% 25.5% 25.5% 27.5% 26.4%
NetSol Technologies 1.4x 1.1x 1.1x 1.1x 1.5x - - - - 9.0x -21.7% -9.6% -9.6% 16.6% 41.3% -1.8% -17.0% -17.0% -4.2% 16.9%
NeuStar 2.6x 2.1x 2.2x 2.0x 1.9x 7.0x 5.6x 5.8x 5.3x 5.0x 8.2% 6.8% 6.8% 7.6% 7.7% 37.5% 37.2% 37.2% 38.6% 39.1%
NICE Systems Ltd 8.9x 7.5x 7.5x 9.7x 12.7x 52.6x 40.1x 39.9x 49.8x 64.6x 6.8% 6.6% 6.6% 7.9% 7.4% 16.9% 18.7% 18.7% 19.5% 19.7%
NQ Mobile 2.8x 1.3x 0.7x 1.2x 0.9x - - - - - 117.3% 68.9% 68.9% 40.5% 27.7% -15.4% -20.1% -20.1% -18.0% -9.7%
Nuance Communications 3.7x 3.5x 3.6x 3.2x 3.6x 41.1x 36.1x 37.1x 29.7x 29.4x 2.2% 3.5% 3.5% 2.1% 1.9% 9.1% 9.7% 9.7% 10.9% 12.3%
Omnicell 2.3x 2.0x 2.0x 2.3x 2.6x 14.7x 13.1x 13.0x 15.3x 18.2x 14.4% 15.8% 15.8% 15.2% 13.9% 15.5% 15.1% 15.1% 15.0% 14.2%
Open Text Corp 3.5x 3.6x 4.1x 4.2x 3.5x 12.8x 12.1x 13.7x 14.5x 12.3x 19.2% 35.4% 35.4% 26.1% 14.0% 27.6% 30.0% 30.0% 28.9% 28.1%
Opera 26.9x 19.4x 22.7x 23.0x 14.3x 104.3x 93.9x 109.9x 128.8x 84.7x 39.9% 60.2% 60.2% 60.1% 60.6% 25.8% 20.7% 20.7% 17.9% 16.9%
Oracle 4.5x 4.4x 4.3x 4.2x 4.1x 10.2x 10.1x 9.9x 10.1x 10.0x 3.0% 3.4% 2.5% -0.1% -1.1% 43.8% 43.6% 43.2% 42.0% 41.5%
Palo Alto Networks 8.1x 7.0x 8.3x 10.3x 15.7x - - - - - 51.0% 51.1% 53.0% 54.5% 55.1% -6.9% -8.3% -9.9% -11.7% -11.3%
Pandora Media 7.4x 5.3x 5.6x 3.9x 3.1x - - - - - - 40.6% 40.6% 30.4% 26.0% -1.4% -1.7% -1.7% -3.6% -3.4%
Parametric Technology 3.2x 3.2x 3.3x 3.4x 3.4x 14.4x 14.5x 16.0x 16.8x 17.1x 4.8% 4.9% 4.5% 2.2% -1.9% 22.2% 21.9% 20.9% 20.3% 20.0%
PDF Solutions 4.5x 4.8x 5.1x 2.9x 2.8x 12.6x 15.9x 17.0x 9.5x 10.4x 9.5% -1.3% -1.3% -4.3% -5.5% 35.4% 29.9% 29.9% 30.1% 26.6%
Pegasystems 2.2x 2.1x 2.4x 2.3x 2.5x 15.3x 16.5x 19.0x 18.8x 19.8x 16.7% 15.9% 15.9% 13.2% 12.7% 14.4% 12.8% 12.8% 12.0% 12.9%
Progress Software 2.7x 2.6x 2.8x 3.0x 3.9x 8.9x 8.3x 10.7x 13.6x 19.2x -1.2% -0.4% 4.5% 7.2% 11.4% 30.9% 31.5% 26.5% 22.1% 20.1%
Proofpoint 7.8x 5.5x 6.9x 7.5x 10.0x - - - - - 39.0% 41.8% 41.8% 40.6% 36.8% -16.4% -16.4% -16.4% -17.1% -20.8%
PROS Holdings 5.5x 3.7x 3.8x 3.9x 3.2x - - - - - 22.1% 28.3% 28.3% 24.0% 15.5% -0.6% -2.7% -2.7% -5.3% -9.6%
QAD 0.9x 0.9x 0.8x 0.9x 1.2x 15.7x 13.2x 12.0x 12.4x 15.8x 10.3% 11.8% 10.8% 8.4% 4.8% 5.7% 6.5% 7.0% 7.1% 7.6%
Qihoo 360 Technology 12.3x 7.7x 7.9x 5.6x 4.9x 46.4x 31.2x 32.1x 21.5x 18.0x 121.3% 107.2% 107.2% 82.7% 64.2% 26.6% 24.8% 24.8% 25.9% 27.0%
Qiwi 0.1x 0.1x 0.1x 0.1x 0.1x 0.4x 0.3x 0.4x 0.2x 0.3x 26.3% 26.2% 26.2% 24.5% 24.1% 27.5% 28.9% 28.9% 31.4% 32.1%
Qlik Technologies 4.4x 3.2x 3.9x 4.3x 5.6x 264.2x 617.7x 768.2x 795.8x 1228.9x 18.8% 18.4% 18.4% 16.7% 10.1% 1.7% 0.5% 0.5% 0.5% 0.5%
Quality Systems 2.1x 1.8x 1.7x 1.6x 1.4x 18.6x 19.7x 18.6x 15.1x 11.8x 0.3% 8.2% 8.2% 10.2% 8.0% 11.2% 9.0% 9.0% 10.4% 11.5%
Radware 3.3x 2.7x 2.7x 3.4x 3.6x 24.3x 15.2x 15.1x 17.8x 20.6x 8.4% 15.0% 15.0% 14.7% 4.0% 13.5% 17.8% 17.8% 19.1% 17.5%
Red Hat 5.5x 5.0x 5.7x 5.6x 7.2x 29.5x 26.8x 31.0x 29.8x 37.8x 16.6% 16.5% 16.6% 15.8% 14.3% 18.7% 18.5% 18.5% 18.9% 19.0%
Redknee Solutions 2.3x 2.0x 1.4x 1.4x 1.6x 185.4x 41.1x 29.0x 21.0x 14.9x 156.4% 38.1% 38.1% -3.1% -11.9% 1.2% 4.8% 4.8% 6.7% 10.9%
Sage Group 3.8x 3.6x 3.4x 3.3x 4.5x 13.0x 12.7x 11.9x 11.5x 15.8x -4.4% -1.6% -1.6% 1.9% 1.9% 28.9% 28.4% 28.4% 28.4% 28.4%
SAP 4.3x 3.8x 4.0x 3.6x 4.1x 12.7x 11.2x 11.8x 11.0x 12.6x 2.2% 4.4% 4.4% 8.6% 15.7% 33.4% 34.2% 34.2% 32.9% 32.2%
Sapiens International 2.1x 1.9x 1.9x 1.9x 3.0x 15.9x 15.6x 16.1x 15.0x 21.7x 16.6% 16.3% 16.3% 15.2% 14.1% 13.0% 11.9% 11.9% 12.7% 13.8%
Silver Spring Networks 2.6x 2.7x 2.0x 1.0x 1.5x - - - - - 3.5% -41.5% -41.5% -8.4% 27.7% -22.6% -41.9% -41.9% -6.3% -2.7%
Software AG 2.5x 2.7x 2.0x 2.0x 2.4x 10.7x 10.5x 7.7x 7.7x 8.8x -8.2% -11.8% -11.8% -11.9% -6.8% 23.6% 25.4% 25.4% 26.1% 26.9%
SolarWinds 8.2x 6.5x 7.0x 8.0x 6.1x 23.3x 20.4x 22.1x 25.6x 19.9x 29.3% 27.8% 27.8% 25.5% 22.2% 35.1% 31.9% 31.9% 31.0% 30.9%
Sourcefire 0.9x 1.1x 1.1x 0.8x 0.9x 7.4x 15.9x 16.4x 11.7x 8.6x 43.9% 10.3% 10.3% 2.2% 5.6% 12.6% 6.7% 6.7% 7.1% 10.9%
Splunk 21.7x 12.9x 10.8x 13.7x 14.3x - - - - - 51.6% 50.6% 49.0% 48.1% 46.8% -40.5% -44.9% -45.1% -45.5% -42.0%
SS&C 5.6x 5.4x 5.6x 6.0x 8.0x 14.3x 13.8x 14.4x 15.9x 20.9x 7.1% 7.7% 7.7% 8.6% 10.2% 39.0% 38.9% 38.9% 37.5% 38.2%
Stratasys 8.0x 5.5x 6.8x 6.2x 1.6x 54.6x 40.9x 50.0x 58.7x 28.3x 88.0% 54.9% 54.9% 43.4% 27.2% 14.6% 13.6% 13.6% 10.6% 5.6%
Symantec 1.8x 1.9x 2.2x 2.4x 2.1x 6.3x 6.5x 7.6x 8.5x 7.2x -3.5% -2.9% -2.7% -2.5% -6.4% 28.9% 29.2% 29.0% 28.3% 28.8%
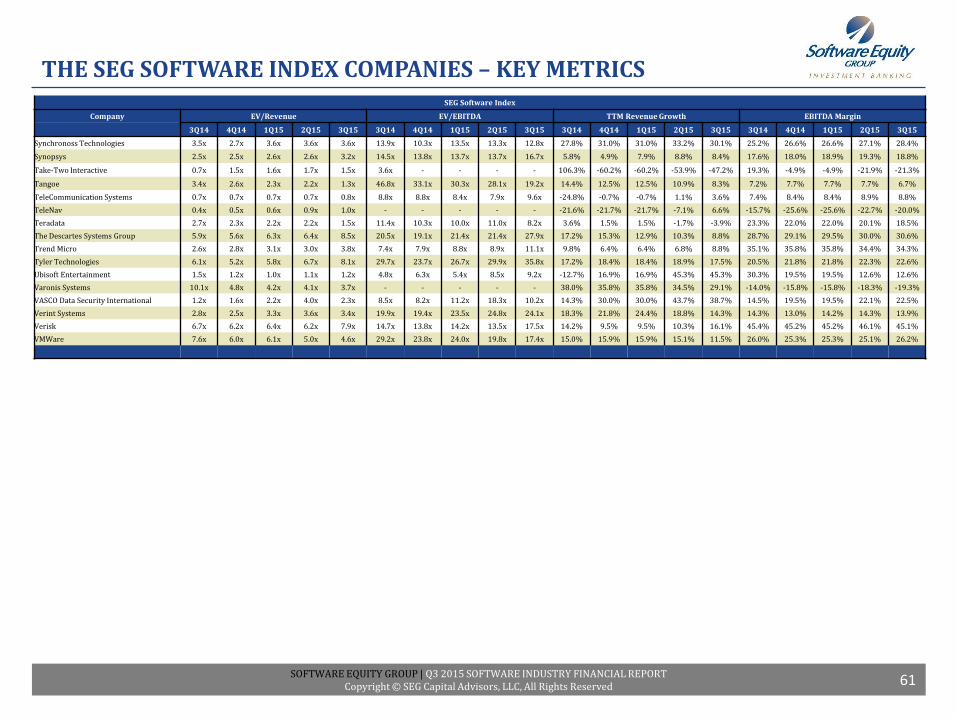
SOFTWARE EQUITY GROUP | Q3 2015 SOFTWARE INDUSTRY FINANCIAL REPORTCopyright © SEG Capital Advisors, LLC, All Rights Reserved
THE SEG SOFTWARE INDEX COMPANIES – KEY METRICS
61
SEG Software Index
Company EV/Revenue EV/EBITDA TTM Revenue Growth EBITDA Margin
3Q14 4Q14 1Q15 2Q15 3Q15 3Q14 4Q14 1Q15 2Q15 3Q15 3Q14 4Q14 1Q15 2Q15 3Q15 3Q14 4Q14 1Q15 2Q15 3Q15
Synchronoss Technologies 3.5x 2.7x 3.6x 3.6x 3.6x 13.9x 10.3x 13.5x 13.3x 12.8x 27.8% 31.0% 31.0% 33.2% 30.1% 25.2% 26.6% 26.6% 27.1% 28.4%
Synopsys 2.5x 2.5x 2.6x 2.6x 3.2x 14.5x 13.8x 13.7x 13.7x 16.7x 5.8% 4.9% 7.9% 8.8% 8.4% 17.6% 18.0% 18.9% 19.3% 18.8%
Take-Two Interactive 0.7x 1.5x 1.6x 1.7x 1.5x 3.6x - - - - 106.3% -60.2% -60.2% -53.9% -47.2% 19.3% -4.9% -4.9% -21.9% -21.3%
Tangoe 3.4x 2.6x 2.3x 2.2x 1.3x 46.8x 33.1x 30.3x 28.1x 19.2x 14.4% 12.5% 12.5% 10.9% 8.3% 7.2% 7.7% 7.7% 7.7% 6.7%
TeleCommunication Systems 0.7x 0.7x 0.7x 0.7x 0.8x 8.8x 8.8x 8.4x 7.9x 9.6x -24.8% -0.7% -0.7% 1.1% 3.6% 7.4% 8.4% 8.4% 8.9% 8.8%
TeleNav 0.4x 0.5x 0.6x 0.9x 1.0x - - - - - -21.6% -21.7% -21.7% -7.1% 6.6% -15.7% -25.6% -25.6% -22.7% -20.0%
Teradata 2.7x 2.3x 2.2x 2.2x 1.5x 11.4x 10.3x 10.0x 11.0x 8.2x 3.6% 1.5% 1.5% -1.7% -3.9% 23.3% 22.0% 22.0% 20.1% 18.5%
The Descartes Systems Group 5.9x 5.6x 6.3x 6.4x 8.5x 20.5x 19.1x 21.4x 21.4x 27.9x 17.2% 15.3% 12.9% 10.3% 8.8% 28.7% 29.1% 29.5% 30.0% 30.6%
Trend Micro 2.6x 2.8x 3.1x 3.0x 3.8x 7.4x 7.9x 8.8x 8.9x 11.1x 9.8% 6.4% 6.4% 6.8% 8.8% 35.1% 35.8% 35.8% 34.4% 34.3%
Tyler Technologies 6.1x 5.2x 5.8x 6.7x 8.1x 29.7x 23.7x 26.7x 29.9x 35.8x 17.2% 18.4% 18.4% 18.9% 17.5% 20.5% 21.8% 21.8% 22.3% 22.6%
Ubisoft Entertainment 1.5x 1.2x 1.0x 1.1x 1.2x 4.8x 6.3x 5.4x 8.5x 9.2x -12.7% 16.9% 16.9% 45.3% 45.3% 30.3% 19.5% 19.5% 12.6% 12.6%
Varonis Systems 10.1x 4.8x 4.2x 4.1x 3.7x - - - - - 38.0% 35.8% 35.8% 34.5% 29.1% -14.0% -15.8% -15.8% -18.3% -19.3%
VASCO Data Security International 1.2x 1.6x 2.2x 4.0x 2.3x 8.5x 8.2x 11.2x 18.3x 10.2x 14.3% 30.0% 30.0% 43.7% 38.7% 14.5% 19.5% 19.5% 22.1% 22.5%
Verint Systems 2.8x 2.5x 3.3x 3.6x 3.4x 19.9x 19.4x 23.5x 24.8x 24.1x 18.3% 21.8% 24.4% 18.8% 14.3% 14.3% 13.0% 14.2% 14.3% 13.9%
Verisk 6.7x 6.2x 6.4x 6.2x 7.9x 14.7x 13.8x 14.2x 13.5x 17.5x 14.2% 9.5% 9.5% 10.3% 16.1% 45.4% 45.2% 45.2% 46.1% 45.1%
VMWare 7.6x 6.0x 6.1x 5.0x 4.6x 29.2x 23.8x 24.0x 19.8x 17.4x 15.0% 15.9% 15.9% 15.1% 11.5% 26.0% 25.3% 25.3% 25.1% 26.2%
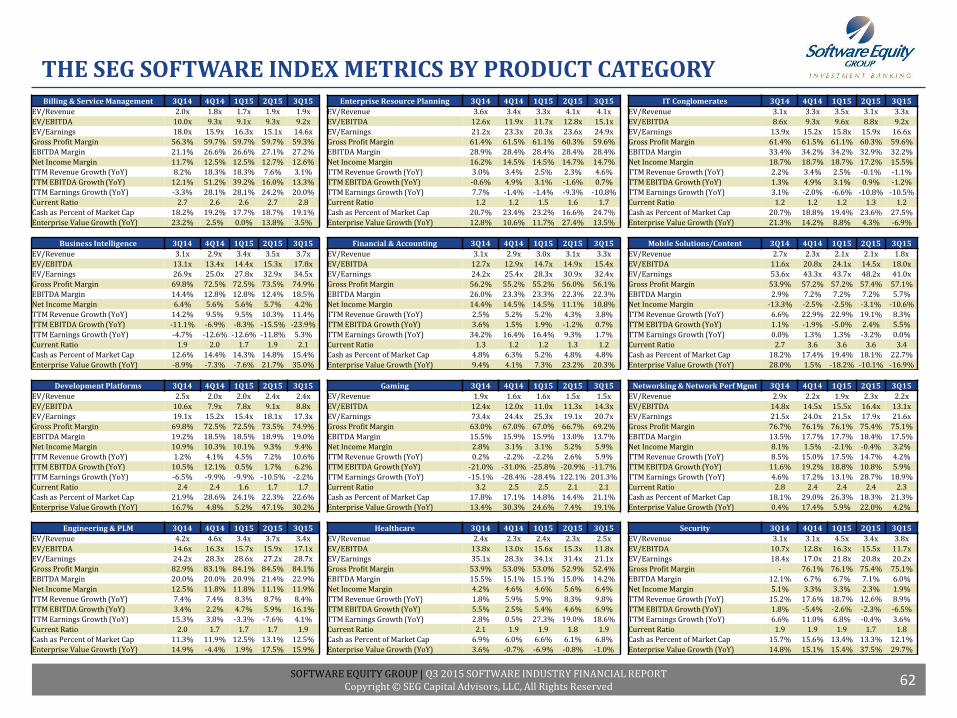
SOFTWARE EQUITY GROUP | Q3 2015 SOFTWARE INDUSTRY FINANCIAL REPORTCopyright © SEG Capital Advisors, LLC, All Rights Reserved
THE SEG SOFTWARE INDEX METRICS BY PRODUCT CATEGORY
62
Billing & Service Management 3Q14 4Q14 1Q15 2Q15 3Q15
EV/Revenue 2.0x 1.8x 1.7x 1.9x 1.9x
EV/EBITDA 10.0x 9.3x 9.1x 9.3x 9.2x
EV/Earnings 18.0x 15.9x 16.3x 15.1x 14.6x
Gross Profit Margin 56.3% 59.7% 59.7% 59.7% 59.3%
EBITDA Margin 21.1% 26.6% 26.6% 27.1% 27.2%
Net Income Margin 11.7% 12.5% 12.5% 12.7% 12.6%
TTM Revenue Growth (YoY) 8.2% 18.3% 18.3% 7.6% 3.1%
TTM EBITDA Growth (YoY) 12.1% 51.2% 39.2% 16.0% 13.3%
TTM Earnings Growth (YoY) -3.3% 28.1% 28.1% 24.2% 20.0%
Current Ratio 2.7 2.6 2.6 2.7 2.8
Cash as Percent of Market Cap 18.2% 19.2% 17.7% 18.7% 19.1%
Enterprise Value Growth (YoY) 23.2% 2.5% 0.0% 13.8% 3.5%
Business Intelligence 3Q14 4Q14 1Q15 2Q15 3Q15
EV/Revenue 3.1x 2.9x 3.4x 3.5x 3.7x
EV/EBITDA 13.1x 13.4x 14.4x 15.3x 17.8x
EV/Earnings 26.9x 25.0x 27.8x 32.9x 34.5x
Gross Profit Margin 69.8% 72.5% 72.5% 73.5% 74.9%
EBITDA Margin 14.4% 12.8% 12.8% 12.4% 18.5%
Net Income Margin 6.4% 5.6% 5.6% 5.7% 4.2%
TTM Revenue Growth (YoY) 14.2% 9.5% 9.5% 10.3% 11.4%
TTM EBITDA Growth (YoY) -11.1% -6.9% -8.3% -15.5% -23.9%
TTM Earnings Growth (YoY) -4.7% -12.6% -12.6% -11.8% 5.3%
Current Ratio 1.9 2.0 1.7 1.9 2.1
Cash as Percent of Market Cap 12.6% 14.4% 14.3% 14.8% 15.4%
Enterprise Value Growth (YoY) -8.9% -7.3% -7.6% 21.7% 35.0%
Development Platforms 3Q14 4Q14 1Q15 2Q15 3Q15
EV/Revenue 2.5x 2.0x 2.0x 2.4x 2.4x
EV/EBITDA 10.6x 7.9x 7.8x 9.1x 8.8x
EV/Earnings 19.1x 15.2x 15.4x 18.1x 17.3x
Gross Profit Margin 69.8% 72.5% 72.5% 73.5% 74.9%
EBITDA Margin 19.2% 18.5% 18.5% 18.9% 19.0%
Net Income Margin 10.9% 10.3% 10.1% 9.3% 9.4%
TTM Revenue Growth (YoY) 1.2% 4.1% 4.5% 7.2% 10.6%
TTM EBITDA Growth (YoY) 10.5% 12.1% 0.5% 1.7% 6.2%
TTM Earnings Growth (YoY) -6.5% -9.9% -9.9% -10.5% -2.2%
Current Ratio 2.4 2.4 1.6 1.7 1.7
Cash as Percent of Market Cap 21.9% 28.6% 24.1% 22.3% 22.6%
Enterprise Value Growth (YoY) 16.7% 4.8% 5.2% 47.1% 30.2%
Engineering & PLM 3Q14 4Q14 1Q15 2Q15 3Q15
EV/Revenue 4.2x 4.6x 3.4x 3.7x 3.4x
EV/EBITDA 14.6x 16.3x 15.7x 15.9x 17.1x
EV/Earnings 24.2x 28.3x 28.6x 27.2x 28.7x
Gross Profit Margin 82.9% 83.1% 84.1% 84.5% 84.1%
EBITDA Margin 20.0% 20.0% 20.9% 21.4% 22.9%
Net Income Margin 12.5% 11.8% 11.8% 11.1% 11.9%
TTM Revenue Growth (YoY) 7.4% 7.4% 8.3% 8.7% 8.4%
TTM EBITDA Growth (YoY) 3.4% 2.2% 4.7% 5.9% 16.1%
TTM Earnings Growth (YoY) 15.3% 3.8% -3.3% -7.6% 4.1%
Current Ratio 2.0 1.7 1.7 1.7 1.9
Cash as Percent of Market Cap 11.3% 11.9% 12.5% 13.1% 12.5%
Enterprise Value Growth (YoY) 14.9% -4.4% 1.9% 17.5% 15.9%
Enterprise Resource Planning 3Q14 4Q14 1Q15 2Q15 3Q15
EV/Revenue 3.6x 3.4x 3.3x 4.1x 4.1x
EV/EBITDA 12.6x 11.9x 11.7x 12.8x 15.1x
EV/Earnings 21.2x 23.3x 20.3x 23.6x 24.9x
Gross Profit Margin 61.4% 61.5% 61.1% 60.3% 59.6%
EBITDA Margin 28.9% 28.4% 28.4% 28.4% 28.4%
Net Income Margin 16.2% 14.5% 14.5% 14.7% 14.7%
TTM Revenue Growth (YoY) 3.0% 3.4% 2.5% 2.3% 4.6%
TTM EBITDA Growth (YoY) -0.6% 4.9% 3.1% -1.6% 0.7%
TTM Earnings Growth (YoY) 7.7% -1.4% -1.4% -9.3% -10.8%
Current Ratio 1.2 1.2 1.5 1.6 1.7
Cash as Percent of Market Cap 20.7% 23.4% 23.2% 16.6% 24.7%
Enterprise Value Growth (YoY) 12.8% 10.6% 11.7% 27.4% 13.5%
Financial & Accounting 3Q14 4Q14 1Q15 2Q15 3Q15
EV/Revenue 3.1x 2.9x 3.0x 3.1x 3.3x
EV/EBITDA 12.7x 12.9x 14.7x 14.9x 15.4x
EV/Earnings 24.2x 25.4x 28.3x 30.9x 32.4x
Gross Profit Margin 56.2% 55.2% 55.2% 56.0% 56.1%
EBITDA Margin 26.0% 23.3% 23.3% 22.3% 22.3%
Net Income Margin 14.4% 14.5% 14.5% 11.1% 10.8%
TTM Revenue Growth (YoY) 2.5% 5.2% 5.2% 4.3% 3.8%
TTM EBITDA Growth (YoY) 3.6% 1.5% 1.9% -1.2% 0.7%
TTM Earnings Growth (YoY) 34.2% 16.4% 16.4% 9.3% 1.7%
Current Ratio 1.3 1.2 1.2 1.3 1.2
Cash as Percent of Market Cap 4.8% 6.3% 5.2% 4.8% 4.8%
Enterprise Value Growth (YoY) 9.4% 4.1% 7.3% 23.2% 20.3%
Gaming 3Q14 4Q14 1Q15 2Q15 3Q15
EV/Revenue 1.9x 1.6x 1.6x 1.5x 1.5x
EV/EBITDA 12.4x 12.0x 11.0x 11.3x 14.3x
EV/Earnings 73.4x 24.4x 25.3x 19.1x 20.7x
Gross Profit Margin 63.0% 67.0% 67.0% 66.7% 69.2%
EBITDA Margin 15.5% 15.9% 15.9% 13.0% 13.7%
Net Income Margin 2.8% 3.1% 3.1% 5.2% 5.9%
TTM Revenue Growth (YoY) 0.2% -2.2% -2.2% 2.6% 5.9%
TTM EBITDA Growth (YoY) -21.0% -31.0% -25.8% -20.9% -11.7%
TTM Earnings Growth (YoY) -15.1% -28.4% -28.4% 122.1% 201.3%
Current Ratio 3.2 2.5 2.5 2.1 2.1
Cash as Percent of Market Cap 17.8% 17.1% 14.8% 14.4% 21.1%
Enterprise Value Growth (YoY) 13.4% 30.3% 24.6% 7.4% 19.1%
Healthcare 3Q14 4Q14 1Q15 2Q15 3Q15
EV/Revenue 2.4x 2.3x 2.4x 2.3x 2.5x
EV/EBITDA 13.8x 13.0x 15.6x 15.3x 11.8x
EV/Earnings 35.1x 28.3x 34.1x 31.4x 21.1x
Gross Profit Margin 53.9% 53.0% 53.0% 52.9% 52.4%
EBITDA Margin 15.5% 15.1% 15.1% 15.0% 14.2%
Net Income Margin 4.2% 4.6% 4.6% 5.6% 6.4%
TTM Revenue Growth (YoY) 1.8% 5.9% 5.9% 8.3% 9.8%
TTM EBITDA Growth (YoY) 5.5% 2.5% 5.4% 4.6% 6.9%
TTM Earnings Growth (YoY) 2.8% 0.5% 27.3% 19.0% 18.6%
Current Ratio 2.1 1.9 1.9 1.8 1.9
Cash as Percent of Market Cap 6.9% 6.0% 6.6% 6.1% 6.8%
Enterprise Value Growth (YoY) 3.6% -0.7% -6.9% -0.8% -1.0%
IT Conglomerates 3Q14 4Q14 1Q15 2Q15 3Q15
EV/Revenue 3.1x 3.3x 3.5x 3.1x 3.3x
EV/EBITDA 8.6x 9.3x 9.6x 8.8x 9.2x
EV/Earnings 13.9x 15.2x 15.8x 15.9x 16.6x
Gross Profit Margin 61.4% 61.5% 61.1% 60.3% 59.6%
EBITDA Margin 33.4% 34.2% 34.2% 32.9% 32.2%
Net Income Margin 18.7% 18.7% 18.7% 17.2% 15.5%
TTM Revenue Growth (YoY) 2.2% 3.4% 2.5% -0.1% -1.1%
TTM EBITDA Growth (YoY) 1.3% 4.9% 3.1% 0.9% -1.2%
TTM Earnings Growth (YoY) 3.1% -2.0% -6.6% -10.8% -10.5%
Current Ratio 1.2 1.2 1.2 1.3 1.2
Cash as Percent of Market Cap 20.7% 18.8% 19.4% 23.6% 27.5%
Enterprise Value Growth (YoY) 21.3% 14.2% 8.8% 4.3% -6.9%
Mobile Solutions/Content 3Q14 4Q14 1Q15 2Q15 3Q15
EV/Revenue 2.7x 2.3x 2.1x 2.1x 1.8x
EV/EBITDA 11.6x 20.8x 24.1x 14.5x 18.0x
EV/Earnings 53.6x 43.3x 43.7x 48.2x 41.0x
Gross Profit Margin 53.9% 57.2% 57.2% 57.4% 57.1%
EBITDA Margin 2.9% 7.2% 7.2% 7.2% 5.7%
Net Income Margin -13.3% -2.5% -2.5% -3.1% -10.6%
TTM Revenue Growth (YoY) 6.6% 22.9% 22.9% 19.1% 8.3%
TTM EBITDA Growth (YoY) 1.1% -1.9% -5.0% 2.4% 5.5%
TTM Earnings Growth (YoY) 0.0% 1.3% 1.3% -3.2% 0.0%
Current Ratio 2.7 3.6 3.6 3.6 3.4
Cash as Percent of Market Cap 18.2% 17.4% 19.4% 18.1% 22.7%
Enterprise Value Growth (YoY) 28.0% 1.5% -18.2% -10.1% -16.9%
Networking & Network Perf Mgmt 3Q14 4Q14 1Q15 2Q15 3Q15
EV/Revenue 2.9x 2.2x 1.9x 2.3x 2.2x
EV/EBITDA 14.8x 14.5x 15.5x 16.4x 13.1x
EV/Earnings 21.5x 24.0x 21.5x 17.9x 21.6x
Gross Profit Margin 76.7% 76.1% 76.1% 75.4% 75.1%
EBITDA Margin 13.5% 17.7% 17.7% 18.4% 17.5%
Net Income Margin 8.1% 1.5% -2.1% -0.4% 3.2%
TTM Revenue Growth (YoY) 8.5% 15.0% 17.5% 14.7% 4.2%
TTM EBITDA Growth (YoY) 11.6% 19.2% 18.8% 10.8% 5.9%
TTM Earnings Growth (YoY) 4.6% 17.2% 13.1% 28.7% 18.9%
Current Ratio 2.8 2.4 2.4 2.4 2.3
Cash as Percent of Market Cap 18.1% 29.0% 26.3% 18.3% 21.3%
Enterprise Value Growth (YoY) 0.4% 17.4% 5.9% 22.0% 4.2%
Security 3Q14 4Q14 1Q15 2Q15 3Q15
EV/Revenue 3.1x 3.1x 4.5x 3.4x 3.8x
EV/EBITDA 10.7x 12.8x 16.3x 15.5x 11.7x
EV/Earnings 18.4x 17.0x 21.8x 20.8x 20.2x
Gross Profit Margin - 76.1% 76.1% 75.4% 75.1%
EBITDA Margin 12.1% 6.7% 6.7% 7.1% 6.0%
Net Income Margin 5.1% 3.3% 3.3% 2.3% 1.9%
TTM Revenue Growth (YoY) 15.2% 17.6% 18.7% 12.6% 8.9%
TTM EBITDA Growth (YoY) 1.8% -5.4% -2.6% -2.3% -6.5%
TTM Earnings Growth (YoY) 6.6% 11.0% 6.8% -0.4% 3.6%
Current Ratio 1.9 1.9 1.9 1.7 1.8
Cash as Percent of Market Cap 15.7% 15.6% 13.4% 13.3% 12.1%
Enterprise Value Growth (YoY) 14.8% 15.1% 15.4% 37.5% 29.7%
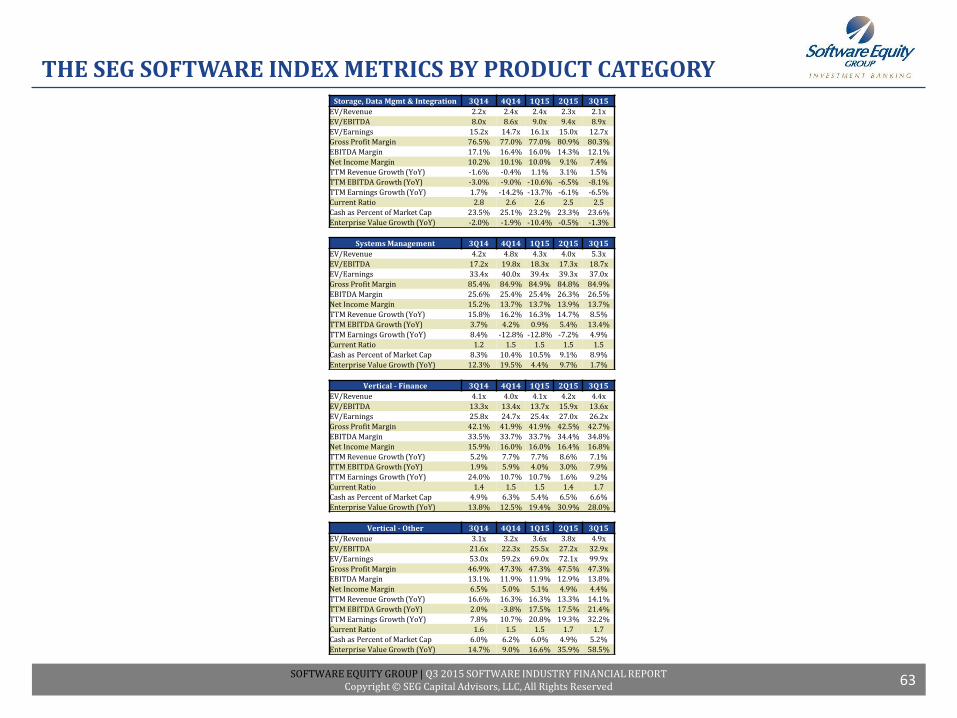
SOFTWARE EQUITY GROUP | Q3 2015 SOFTWARE INDUSTRY FINANCIAL REPORTCopyright © SEG Capital Advisors, LLC, All Rights Reserved
THE SEG SOFTWARE INDEX METRICS BY PRODUCT CATEGORY
63
Storage, Data Mgmt & Integration 3Q14 4Q14 1Q15 2Q15 3Q15
EV/Revenue 2.2x 2.4x 2.4x 2.3x 2.1x
EV/EBITDA 8.0x 8.6x 9.0x 9.4x 8.9x
EV/Earnings 15.2x 14.7x 16.1x 15.0x 12.7x
Gross Profit Margin 76.5% 77.0% 77.0% 80.9% 80.3%
EBITDA Margin 17.1% 16.4% 16.0% 14.3% 12.1%
Net Income Margin 10.2% 10.1% 10.0% 9.1% 7.4%
TTM Revenue Growth (YoY) -1.6% -0.4% 1.1% 3.1% 1.5%
TTM EBITDA Growth (YoY) -3.0% -9.0% -10.6% -6.5% -8.1%
TTM Earnings Growth (YoY) 1.7% -14.2% -13.7% -6.1% -6.5%
Current Ratio 2.8 2.6 2.6 2.5 2.5
Cash as Percent of Market Cap 23.5% 25.1% 23.2% 23.3% 23.6%
Enterprise Value Growth (YoY) -2.0% -1.9% -10.4% -0.5% -1.3%
Systems Management 3Q14 4Q14 1Q15 2Q15 3Q15
EV/Revenue 4.2x 4.8x 4.3x 4.0x 5.3x
EV/EBITDA 17.2x 19.8x 18.3x 17.3x 18.7x
EV/Earnings 33.4x 40.0x 39.4x 39.3x 37.0x
Gross Profit Margin 85.4% 84.9% 84.9% 84.8% 84.9%
EBITDA Margin 25.6% 25.4% 25.4% 26.3% 26.5%
Net Income Margin 15.2% 13.7% 13.7% 13.9% 13.7%
TTM Revenue Growth (YoY) 15.8% 16.2% 16.3% 14.7% 8.5%
TTM EBITDA Growth (YoY) 3.7% 4.2% 0.9% 5.4% 13.4%
TTM Earnings Growth (YoY) 8.4% -12.8% -12.8% -7.2% 4.9%
Current Ratio 1.2 1.5 1.5 1.5 1.5
Cash as Percent of Market Cap 8.3% 10.4% 10.5% 9.1% 8.9%
Enterprise Value Growth (YoY) 12.3% 19.5% 4.4% 9.7% 1.7%
Vertical - Finance 3Q14 4Q14 1Q15 2Q15 3Q15
EV/Revenue 4.1x 4.0x 4.1x 4.2x 4.4x
EV/EBITDA 13.3x 13.4x 13.7x 15.9x 13.6x
EV/Earnings 25.8x 24.7x 25.4x 27.0x 26.2x
Gross Profit Margin 42.1% 41.9% 41.9% 42.5% 42.7%
EBITDA Margin 33.5% 33.7% 33.7% 34.4% 34.8%
Net Income Margin 15.9% 16.0% 16.0% 16.4% 16.8%
TTM Revenue Growth (YoY) 5.2% 7.7% 7.7% 8.6% 7.1%
TTM EBITDA Growth (YoY) 1.9% 5.9% 4.0% 3.0% 7.9%
TTM Earnings Growth (YoY) 24.0% 10.7% 10.7% 1.6% 9.2%
Current Ratio 1.4 1.5 1.5 1.4 1.7
Cash as Percent of Market Cap 4.9% 6.3% 5.4% 6.5% 6.6%
Enterprise Value Growth (YoY) 13.8% 12.5% 19.4% 30.9% 28.0%
Vertical - Other 3Q14 4Q14 1Q15 2Q15 3Q15
EV/Revenue 3.1x 3.2x 3.6x 3.8x 4.9x
EV/EBITDA 21.6x 22.3x 25.5x 27.2x 32.9x
EV/Earnings 53.0x 59.2x 69.0x 72.1x 99.9x
Gross Profit Margin 46.9% 47.3% 47.3% 47.5% 47.3%
EBITDA Margin 13.1% 11.9% 11.9% 12.9% 13.8%
Net Income Margin 6.5% 5.0% 5.1% 4.9% 4.4%
TTM Revenue Growth (YoY) 16.6% 16.3% 16.3% 13.3% 14.1%
TTM EBITDA Growth (YoY) 2.0% -3.8% 17.5% 17.5% 21.4%
TTM Earnings Growth (YoY) 7.8% 10.7% 20.8% 19.3% 32.2%
Current Ratio 1.6 1.5 1.5 1.7 1.7
Cash as Percent of Market Cap 6.0% 6.2% 6.0% 4.9% 5.2%
Enterprise Value Growth (YoY) 14.7% 9.0% 16.6% 35.9% 58.5%
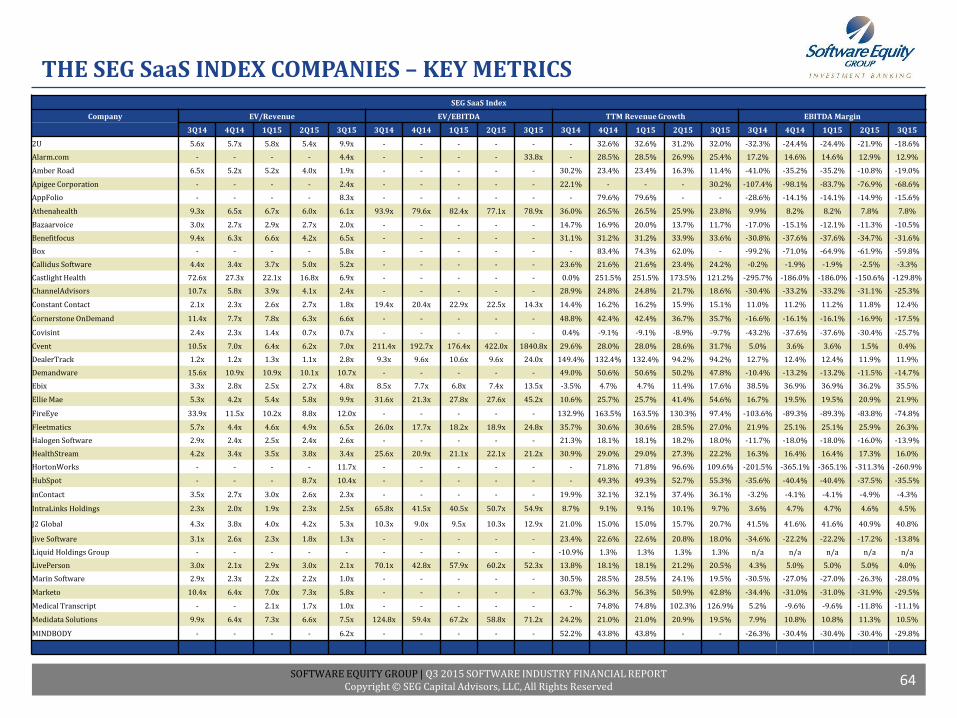
SOFTWARE EQUITY GROUP | Q3 2015 SOFTWARE INDUSTRY FINANCIAL REPORTCopyright © SEG Capital Advisors, LLC, All Rights Reserved
THE SEG SaaS INDEX COMPANIES – KEY METRICS
64
SEG SaaS Index
Company EV/Revenue EV/EBITDA TTM Revenue Growth EBITDA Margin
3Q14 4Q14 1Q15 2Q15 3Q15 3Q14 4Q14 1Q15 2Q15 3Q15 3Q14 4Q14 1Q15 2Q15 3Q15 3Q14 4Q14 1Q15 2Q15 3Q15
2U 5.6x 5.7x 5.8x 5.4x 9.9x - - - - - - 32.6% 32.6% 31.2% 32.0% -32.3% -24.4% -24.4% -21.9% -18.6%
Alarm.com - - - - 4.4x - - - - 33.8x - 28.5% 28.5% 26.9% 25.4% 17.2% 14.6% 14.6% 12.9% 12.9%
Amber Road 6.5x 5.2x 5.2x 4.0x 1.9x - - - - - 30.2% 23.4% 23.4% 16.3% 11.4% -41.0% -35.2% -35.2% -10.8% -19.0%
Apigee Corporation - - - - 2.4x - - - - - 22.1% - - - 30.2% -107.4% -98.1% -83.7% -76.9% -68.6%
AppFolio - - - - 8.3x - - - - - - 79.6% 79.6% - - -28.6% -14.1% -14.1% -14.9% -15.6%
Athenahealth 9.3x 6.5x 6.7x 6.0x 6.1x 93.9x 79.6x 82.4x 77.1x 78.9x 36.0% 26.5% 26.5% 25.9% 23.8% 9.9% 8.2% 8.2% 7.8% 7.8%
Bazaarvoice 3.0x 2.7x 2.9x 2.7x 2.0x - - - - - 14.7% 16.9% 20.0% 13.7% 11.7% -17.0% -15.1% -12.1% -11.3% -10.5%
Benefitfocus 9.4x 6.3x 6.6x 4.2x 6.5x - - - - - 31.1% 31.2% 31.2% 33.9% 33.6% -30.8% -37.6% -37.6% -34.7% -31.6%
Box - - - - 5.8x - - - - - - 83.4% 74.3% 62.0% - -99.2% -71.0% -64.9% -61.9% -59.8%
Callidus Software 4.4x 3.4x 3.7x 5.0x 5.2x - - - - - 23.6% 21.6% 21.6% 23.4% 24.2% -0.2% -1.9% -1.9% -2.5% -3.3%
Castlight Health 72.6x 27.3x 22.1x 16.8x 6.9x - - - - - 0.0% 251.5% 251.5% 173.5% 121.2% -295.7% -186.0% -186.0% -150.6% -129.8%
ChannelAdvisors 10.7x 5.8x 3.9x 4.1x 2.4x - - - - - 28.9% 24.8% 24.8% 21.7% 18.6% -30.4% -33.2% -33.2% -31.1% -25.3%
Constant Contact 2.1x 2.3x 2.6x 2.7x 1.8x 19.4x 20.4x 22.9x 22.5x 14.3x 14.4% 16.2% 16.2% 15.9% 15.1% 11.0% 11.2% 11.2% 11.8% 12.4%
Cornerstone OnDemand 11.4x 7.7x 7.8x 6.3x 6.6x - - - - - 48.8% 42.4% 42.4% 36.7% 35.7% -16.6% -16.1% -16.1% -16.9% -17.5%
Covisint 2.4x 2.3x 1.4x 0.7x 0.7x - - - - - 0.4% -9.1% -9.1% -8.9% -9.7% -43.2% -37.6% -37.6% -30.4% -25.7%
Cvent 10.5x 7.0x 6.4x 6.2x 7.0x 211.4x 192.7x 176.4x 422.0x 1840.8x 29.6% 28.0% 28.0% 28.6% 31.7% 5.0% 3.6% 3.6% 1.5% 0.4%
DealerTrack 1.2x 1.2x 1.3x 1.1x 2.8x 9.3x 9.6x 10.6x 9.6x 24.0x 149.4% 132.4% 132.4% 94.2% 94.2% 12.7% 12.4% 12.4% 11.9% 11.9%
Demandware 15.6x 10.9x 10.9x 10.1x 10.7x - - - - - 49.0% 50.6% 50.6% 50.2% 47.8% -10.4% -13.2% -13.2% -11.5% -14.7%
Ebix 3.3x 2.8x 2.5x 2.7x 4.8x 8.5x 7.7x 6.8x 7.4x 13.5x -3.5% 4.7% 4.7% 11.4% 17.6% 38.5% 36.9% 36.9% 36.2% 35.5%
Ellie Mae 5.3x 4.2x 5.4x 5.8x 9.9x 31.6x 21.3x 27.8x 27.6x 45.2x 10.6% 25.7% 25.7% 41.4% 54.6% 16.7% 19.5% 19.5% 20.9% 21.9%
FireEye 33.9x 11.5x 10.2x 8.8x 12.0x - - - - - 132.9% 163.5% 163.5% 130.3% 97.4% -103.6% -89.3% -89.3% -83.8% -74.8%
Fleetmatics 5.7x 4.4x 4.6x 4.9x 6.5x 26.0x 17.7x 18.2x 18.9x 24.8x 35.7% 30.6% 30.6% 28.5% 27.0% 21.9% 25.1% 25.1% 25.9% 26.3%
Halogen Software 2.9x 2.4x 2.5x 2.4x 2.6x - - - - - 21.3% 18.1% 18.1% 18.2% 18.0% -11.7% -18.0% -18.0% -16.0% -13.9%
HealthStream 4.2x 3.4x 3.5x 3.8x 3.4x 25.6x 20.9x 21.1x 22.1x 21.2x 30.9% 29.0% 29.0% 27.3% 22.2% 16.3% 16.4% 16.4% 17.3% 16.0%
HortonWorks - - - - 11.7x - - - - - - 71.8% 71.8% 96.6% 109.6% -201.5% -365.1% -365.1% -311.3% -260.9%
HubSpot - - - 8.7x 10.4x - - - - - - 49.3% 49.3% 52.7% 55.3% -35.6% -40.4% -40.4% -37.5% -35.5%
inContact 3.5x 2.7x 3.0x 2.6x 2.3x - - - - - 19.9% 32.1% 32.1% 37.4% 36.1% -3.2% -4.1% -4.1% -4.9% -4.3%
IntraLinks Holdings 2.3x 2.0x 1.9x 2.3x 2.5x 65.8x 41.5x 40.5x 50.7x 54.9x 8.7% 9.1% 9.1% 10.1% 9.7% 3.6% 4.7% 4.7% 4.6% 4.5%
J2 Global 4.3x 3.8x 4.0x 4.2x 5.3x 10.3x 9.0x 9.5x 10.3x 12.9x 21.0% 15.0% 15.0% 15.7% 20.7% 41.5% 41.6% 41.6% 40.9% 40.8%
Jive Software 3.1x 2.6x 2.3x 1.8x 1.3x - - - - - 23.4% 22.6% 22.6% 20.8% 18.0% -34.6% -22.2% -22.2% -17.2% -13.8%
Liquid Holdings Group - - - - - - - - - - -10.9% 1.3% 1.3% 1.3% 1.3% n/a n/a n/a n/a n/a
LivePerson 3.0x 2.1x 2.9x 3.0x 2.1x 70.1x 42.8x 57.9x 60.2x 52.3x 13.8% 18.1% 18.1% 21.2% 20.5% 4.3% 5.0% 5.0% 5.0% 4.0%
Marin Software 2.9x 2.3x 2.2x 2.2x 1.0x - - - - - 30.5% 28.5% 28.5% 24.1% 19.5% -30.5% -27.0% -27.0% -26.3% -28.0%
Marketo 10.4x 6.4x 7.0x 7.3x 5.8x - - - - - 63.7% 56.3% 56.3% 50.9% 42.8% -34.4% -31.0% -31.0% -31.9% -29.5%
Medical Transcript - - 2.1x 1.7x 1.0x - - - - - - 74.8% 74.8% 102.3% 126.9% 5.2% -9.6% -9.6% -11.8% -11.1%
Medidata Solutions 9.9x 6.4x 7.3x 6.6x 7.5x 124.8x 59.4x 67.2x 58.8x 71.2x 24.2% 21.0% 21.0% 20.9% 19.5% 7.9% 10.8% 10.8% 11.3% 10.5%
MINDBODY - - - - 6.2x - - - - - 52.2% 43.8% 43.8% - - -26.3% -30.4% -30.4% -30.4% -29.8%
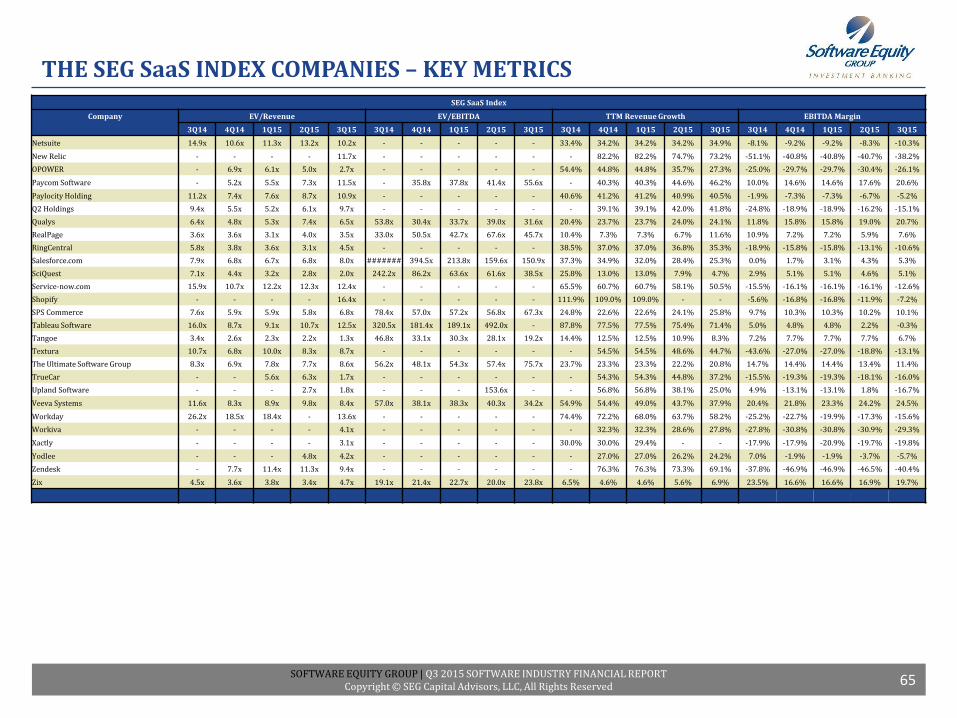
SOFTWARE EQUITY GROUP | Q3 2015 SOFTWARE INDUSTRY FINANCIAL REPORTCopyright © SEG Capital Advisors, LLC, All Rights Reserved
THE SEG SaaS INDEX COMPANIES – KEY METRICS
65
SEG SaaS Index
Company EV/Revenue EV/EBITDA TTM Revenue Growth EBITDA Margin
3Q14 4Q14 1Q15 2Q15 3Q15 3Q14 4Q14 1Q15 2Q15 3Q15 3Q14 4Q14 1Q15 2Q15 3Q15 3Q14 4Q14 1Q15 2Q15 3Q15
Netsuite 14.9x 10.6x 11.3x 13.2x 10.2x - - - - - 33.4% 34.2% 34.2% 34.2% 34.9% -8.1% -9.2% -9.2% -8.3% -10.3%
New Relic - - - - 11.7x - - - - - - 82.2% 82.2% 74.7% 73.2% -51.1% -40.8% -40.8% -40.7% -38.2%
OPOWER - 6.9x 6.1x 5.0x 2.7x - - - - - 54.4% 44.8% 44.8% 35.7% 27.3% -25.0% -29.7% -29.7% -30.4% -26.1%
Paycom Software - 5.2x 5.5x 7.3x 11.5x - 35.8x 37.8x 41.4x 55.6x - 40.3% 40.3% 44.6% 46.2% 10.0% 14.6% 14.6% 17.6% 20.6%
Paylocity Holding 11.2x 7.4x 7.6x 8.7x 10.9x - - - - - 40.6% 41.2% 41.2% 40.9% 40.5% -1.9% -7.3% -7.3% -6.7% -5.2%
Q2 Holdings 9.4x 5.5x 5.2x 6.1x 9.7x - - - - - - 39.1% 39.1% 42.0% 41.8% -24.8% -18.9% -18.9% -16.2% -15.1%
Qualys 6.4x 4.8x 5.3x 7.4x 6.5x 53.8x 30.4x 33.7x 39.0x 31.6x 20.4% 23.7% 23.7% 24.0% 24.1% 11.8% 15.8% 15.8% 19.0% 20.7%
RealPage 3.6x 3.6x 3.1x 4.0x 3.5x 33.0x 50.5x 42.7x 67.6x 45.7x 10.4% 7.3% 7.3% 6.7% 11.6% 10.9% 7.2% 7.2% 5.9% 7.6%
RingCentral 5.8x 3.8x 3.6x 3.1x 4.5x - - - - - 38.5% 37.0% 37.0% 36.8% 35.3% -18.9% -15.8% -15.8% -13.1% -10.6%
Salesforce.com 7.9x 6.8x 6.7x 6.8x 8.0x ####### 394.5x 213.8x 159.6x 150.9x 37.3% 34.9% 32.0% 28.4% 25.3% 0.0% 1.7% 3.1% 4.3% 5.3%
SciQuest 7.1x 4.4x 3.2x 2.8x 2.0x 242.2x 86.2x 63.6x 61.6x 38.5x 25.8% 13.0% 13.0% 7.9% 4.7% 2.9% 5.1% 5.1% 4.6% 5.1%
Service-now.com 15.9x 10.7x 12.2x 12.3x 12.4x - - - - - 65.5% 60.7% 60.7% 58.1% 50.5% -15.5% -16.1% -16.1% -16.1% -12.6%
Shopify - - - - 16.4x - - - - - 111.9% 109.0% 109.0% - - -5.6% -16.8% -16.8% -11.9% -7.2%
SPS Commerce 7.6x 5.9x 5.9x 5.8x 6.8x 78.4x 57.0x 57.2x 56.8x 67.3x 24.8% 22.6% 22.6% 24.1% 25.8% 9.7% 10.3% 10.3% 10.2% 10.1%
Tableau Software 16.0x 8.7x 9.1x 10.7x 12.5x 320.5x 181.4x 189.1x 492.0x - 87.8% 77.5% 77.5% 75.4% 71.4% 5.0% 4.8% 4.8% 2.2% -0.3%
Tangoe 3.4x 2.6x 2.3x 2.2x 1.3x 46.8x 33.1x 30.3x 28.1x 19.2x 14.4% 12.5% 12.5% 10.9% 8.3% 7.2% 7.7% 7.7% 7.7% 6.7%
Textura 10.7x 6.8x 10.0x 8.3x 8.7x - - - - - - 54.5% 54.5% 48.6% 44.7% -43.6% -27.0% -27.0% -18.8% -13.1%
The Ultimate Software Group 8.3x 6.9x 7.8x 7.7x 8.6x 56.2x 48.1x 54.3x 57.4x 75.7x 23.7% 23.3% 23.3% 22.2% 20.8% 14.7% 14.4% 14.4% 13.4% 11.4%
TrueCar - - 5.6x 6.3x 1.7x - - - - - - 54.3% 54.3% 44.8% 37.2% -15.5% -19.3% -19.3% -18.1% -16.0%
Upland Software - - - 2.7x 1.8x - - - 153.6x - - 56.8% 56.8% 38.1% 25.0% 4.9% -13.1% -13.1% 1.8% -16.7%
Veeva Systems 11.6x 8.3x 8.9x 9.8x 8.4x 57.0x 38.1x 38.3x 40.3x 34.2x 54.9% 54.4% 49.0% 43.7% 37.9% 20.4% 21.8% 23.3% 24.2% 24.5%
Workday 26.2x 18.5x 18.4x - 13.6x - - - - - 74.4% 72.2% 68.0% 63.7% 58.2% -25.2% -22.7% -19.9% -17.3% -15.6%
Workiva - - - - 4.1x - - - - - - 32.3% 32.3% 28.6% 27.8% -27.8% -30.8% -30.8% -30.9% -29.3%
Xactly - - - - 3.1x - - - - - 30.0% 30.0% 29.4% - - -17.9% -17.9% -20.9% -19.7% -19.8%
Yodlee - - - 4.8x 4.2x - - - - - - 27.0% 27.0% 26.2% 24.2% 7.0% -1.9% -1.9% -3.7% -5.7%
Zendesk - 7.7x 11.4x 11.3x 9.4x - - - - - - 76.3% 76.3% 73.3% 69.1% -37.8% -46.9% -46.9% -46.5% -40.4%
Zix 4.5x 3.6x 3.8x 3.4x 4.7x 19.1x 21.4x 22.7x 20.0x 23.8x 6.5% 4.6% 4.6% 5.6% 6.9% 23.5% 16.6% 16.6% 16.9% 19.7%
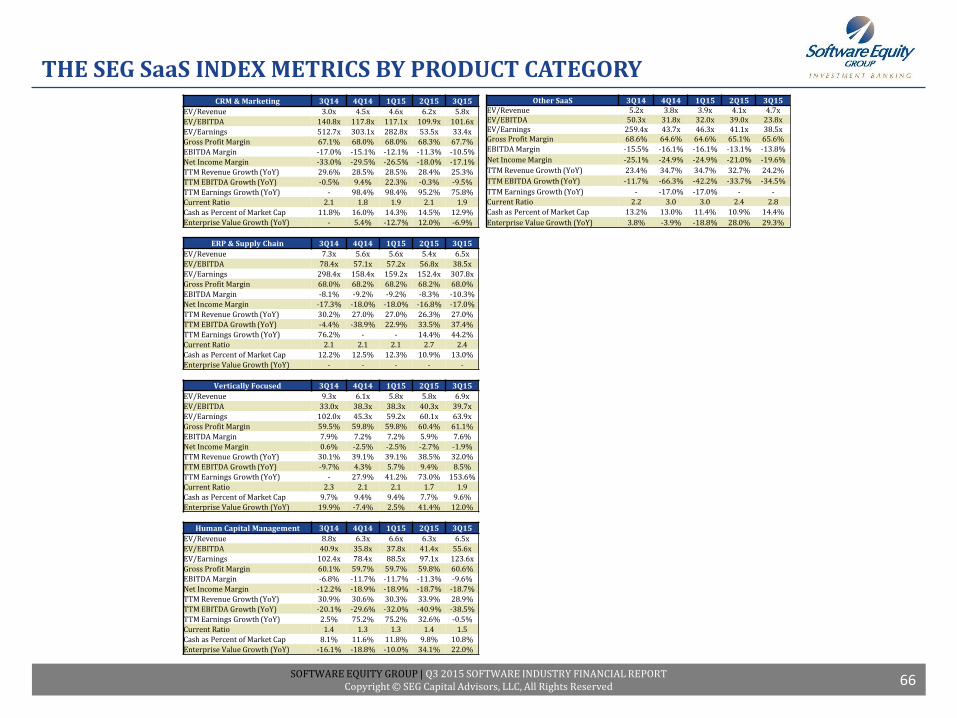
SOFTWARE EQUITY GROUP | Q3 2015 SOFTWARE INDUSTRY FINANCIAL REPORTCopyright © SEG Capital Advisors, LLC, All Rights Reserved
THE SEG SaaS INDEX METRICS BY PRODUCT CATEGORY
66
CRM & Marketing 3Q14 4Q14 1Q15 2Q15 3Q15
EV/Revenue 3.0x 4.5x 4.6x 6.2x 5.8x
EV/EBITDA 140.8x 117.8x 117.1x 109.9x 101.6x
EV/Earnings 512.7x 303.1x 282.8x 53.5x 33.4x
Gross Profit Margin 67.1% 68.0% 68.0% 68.3% 67.7%
EBITDA Margin -17.0% -15.1% -12.1% -11.3% -10.5%
Net Income Margin -33.0% -29.5% -26.5% -18.0% -17.1%
TTM Revenue Growth (YoY) 29.6% 28.5% 28.5% 28.4% 25.3%
TTM EBITDA Growth (YoY) -0.5% 9.4% 22.3% -0.3% -9.5%
TTM Earnings Growth (YoY) - 98.4% 98.4% 95.2% 75.8%
Current Ratio 2.1 1.8 1.9 2.1 1.9
Cash as Percent of Market Cap 11.8% 16.0% 14.3% 14.5% 12.9%
Enterprise Value Growth (YoY) - 5.4% -12.7% 12.0% -6.9%
ERP & Supply Chain 3Q14 4Q14 1Q15 2Q15 3Q15
EV/Revenue 7.3x 5.6x 5.6x 5.4x 6.5x
EV/EBITDA 78.4x 57.1x 57.2x 56.8x 38.5x
EV/Earnings 298.4x 158.4x 159.2x 152.4x 307.8x
Gross Profit Margin 68.0% 68.2% 68.2% 68.2% 68.0%
EBITDA Margin -8.1% -9.2% -9.2% -8.3% -10.3%
Net Income Margin -17.3% -18.0% -18.0% -16.8% -17.0%
TTM Revenue Growth (YoY) 30.2% 27.0% 27.0% 26.3% 27.0%
TTM EBITDA Growth (YoY) -4.4% -38.9% 22.9% 33.5% 37.4%
TTM Earnings Growth (YoY) 76.2% - - 14.4% 44.2%
Current Ratio 2.1 2.1 2.1 2.7 2.4
Cash as Percent of Market Cap 12.2% 12.5% 12.3% 10.9% 13.0%
Enterprise Value Growth (YoY) - - - - -
Vertically Focused 3Q14 4Q14 1Q15 2Q15 3Q15
EV/Revenue 9.3x 6.1x 5.8x 5.8x 6.9x
EV/EBITDA 33.0x 38.3x 38.3x 40.3x 39.7x
EV/Earnings 102.0x 45.3x 59.2x 60.1x 63.9x
Gross Profit Margin 59.5% 59.8% 59.8% 60.4% 61.1%
EBITDA Margin 7.9% 7.2% 7.2% 5.9% 7.6%
Net Income Margin 0.6% -2.5% -2.5% -2.7% -1.9%
TTM Revenue Growth (YoY) 30.1% 39.1% 39.1% 38.5% 32.0%
TTM EBITDA Growth (YoY) -9.7% 4.3% 5.7% 9.4% 8.5%
TTM Earnings Growth (YoY) - 27.9% 41.2% 73.0% 153.6%
Current Ratio 2.3 2.1 2.1 1.7 1.9
Cash as Percent of Market Cap 9.7% 9.4% 9.4% 7.7% 9.6%
Enterprise Value Growth (YoY) 19.9% -7.4% 2.5% 41.4% 12.0%
Human Capital Management 3Q14 4Q14 1Q15 2Q15 3Q15
EV/Revenue 8.8x 6.3x 6.6x 6.3x 6.5x
EV/EBITDA 40.9x 35.8x 37.8x 41.4x 55.6x
EV/Earnings 102.4x 78.4x 88.5x 97.1x 123.6x
Gross Profit Margin 60.1% 59.7% 59.7% 59.8% 60.6%
EBITDA Margin -6.8% -11.7% -11.7% -11.3% -9.6%
Net Income Margin -12.2% -18.9% -18.9% -18.7% -18.7%
TTM Revenue Growth (YoY) 30.9% 30.6% 30.3% 33.9% 28.9%
TTM EBITDA Growth (YoY) -20.1% -29.6% -32.0% -40.9% -38.5%
TTM Earnings Growth (YoY) 2.5% 75.2% 75.2% 32.6% -0.5%
Current Ratio 1.4 1.3 1.3 1.4 1.5
Cash as Percent of Market Cap 8.1% 11.6% 11.8% 9.8% 10.8%
Enterprise Value Growth (YoY) -16.1% -18.8% -10.0% 34.1% 22.0%
Other SaaS 3Q14 4Q14 1Q15 2Q15 3Q15EV/Revenue 5.2x 3.8x 3.9x 4.1x 4.7xEV/EBITDA 50.3x 31.8x 32.0x 39.0x 23.8xEV/Earnings 259.4x 43.7x 46.3x 41.1x 38.5xGross Profit Margin 68.6% 64.6% 64.6% 65.1% 65.6%
EBITDA Margin -15.5% -16.1% -16.1% -13.1% -13.8%
Net Income Margin -25.1% -24.9% -24.9% -21.0% -19.6%
TTM Revenue Growth (YoY) 23.4% 34.7% 34.7% 32.7% 24.2%
TTM EBITDA Growth (YoY) -11.7% -66.3% -42.2% -33.7% -34.5%
TTM Earnings Growth (YoY) - -17.0% -17.0% - -
Current Ratio 2.2 3.0 3.0 2.4 2.8
Cash as Percent of Market Cap 13.2% 13.0% 11.4% 10.9% 14.4%
Enterprise Value Growth (YoY) 3.8% -3.9% -18.8% 28.0% 29.3%
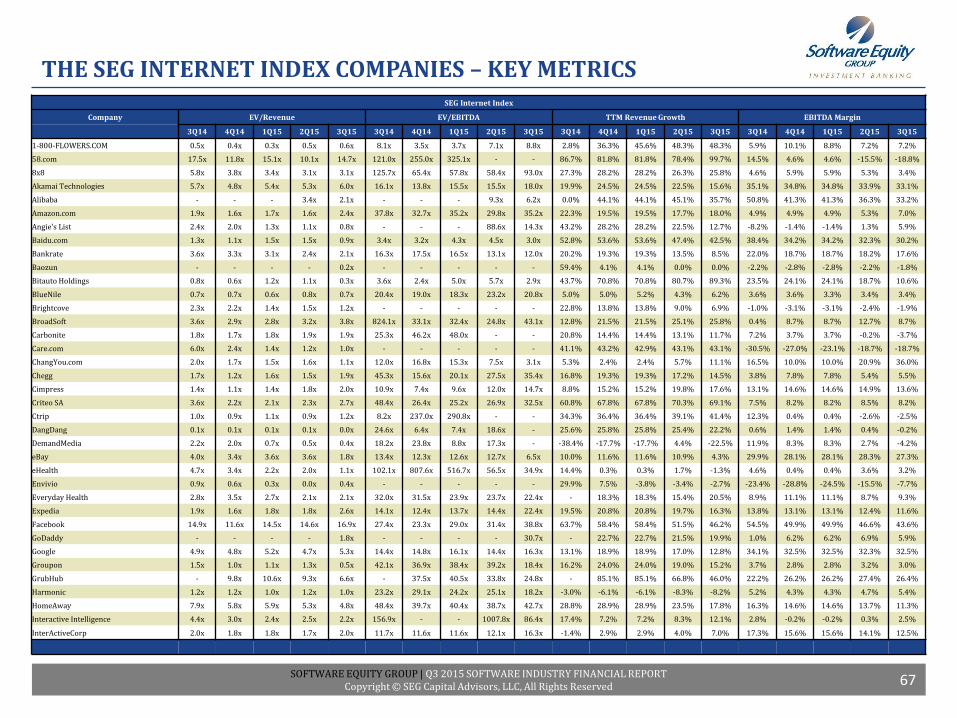
SOFTWARE EQUITY GROUP | Q3 2015 SOFTWARE INDUSTRY FINANCIAL REPORTCopyright © SEG Capital Advisors, LLC, All Rights Reserved
THE SEG INTERNET INDEX COMPANIES – KEY METRICS
67
SEG Internet Index
Company EV/Revenue EV/EBITDA TTM Revenue Growth EBITDA Margin
3Q14 4Q14 1Q15 2Q15 3Q15 3Q14 4Q14 1Q15 2Q15 3Q15 3Q14 4Q14 1Q15 2Q15 3Q15 3Q14 4Q14 1Q15 2Q15 3Q15
1-800-FLOWERS.COM 0.5x 0.4x 0.3x 0.5x 0.6x 8.1x 3.5x 3.7x 7.1x 8.8x 2.8% 36.3% 45.6% 48.3% 48.3% 5.9% 10.1% 8.8% 7.2% 7.2%
58.com 17.5x 11.8x 15.1x 10.1x 14.7x 121.0x 255.0x 325.1x - - 86.7% 81.8% 81.8% 78.4% 99.7% 14.5% 4.6% 4.6% -15.5% -18.8%
8x8 5.8x 3.8x 3.4x 3.1x 3.1x 125.7x 65.4x 57.8x 58.4x 93.0x 27.3% 28.2% 28.2% 26.3% 25.8% 4.6% 5.9% 5.9% 5.3% 3.4%
Akamai Technologies 5.7x 4.8x 5.4x 5.3x 6.0x 16.1x 13.8x 15.5x 15.5x 18.0x 19.9% 24.5% 24.5% 22.5% 15.6% 35.1% 34.8% 34.8% 33.9% 33.1%
Alibaba - - - 3.4x 2.1x - - - 9.3x 6.2x 0.0% 44.1% 44.1% 45.1% 35.7% 50.8% 41.3% 41.3% 36.3% 33.2%
Amazon.com 1.9x 1.6x 1.7x 1.6x 2.4x 37.8x 32.7x 35.2x 29.8x 35.2x 22.3% 19.5% 19.5% 17.7% 18.0% 4.9% 4.9% 4.9% 5.3% 7.0%
Angie's List 2.4x 2.0x 1.3x 1.1x 0.8x - - - 88.6x 14.3x 43.2% 28.2% 28.2% 22.5% 12.7% -8.2% -1.4% -1.4% 1.3% 5.9%
Baidu.com 1.3x 1.1x 1.5x 1.5x 0.9x 3.4x 3.2x 4.3x 4.5x 3.0x 52.8% 53.6% 53.6% 47.4% 42.5% 38.4% 34.2% 34.2% 32.3% 30.2%
Bankrate 3.6x 3.3x 3.1x 2.4x 2.1x 16.3x 17.5x 16.5x 13.1x 12.0x 20.2% 19.3% 19.3% 13.5% 8.5% 22.0% 18.7% 18.7% 18.2% 17.6%
Baozun - - - - 0.2x - - - - - 59.4% 4.1% 4.1% 0.0% 0.0% -2.2% -2.8% -2.8% -2.2% -1.8%
Bitauto Holdings 0.8x 0.6x 1.2x 1.1x 0.3x 3.6x 2.4x 5.0x 5.7x 2.9x 43.7% 70.8% 70.8% 80.7% 89.3% 23.5% 24.1% 24.1% 18.7% 10.6%
BlueNile 0.7x 0.7x 0.6x 0.8x 0.7x 20.4x 19.0x 18.3x 23.2x 20.8x 5.0% 5.0% 5.2% 4.3% 6.2% 3.6% 3.6% 3.3% 3.4% 3.4%
Brightcove 2.3x 2.2x 1.4x 1.5x 1.2x - - - - - 22.8% 13.8% 13.8% 9.0% 6.9% -1.0% -3.1% -3.1% -2.4% -1.9%
BroadSoft 3.6x 2.9x 2.8x 3.2x 3.8x 824.1x 33.1x 32.4x 24.8x 43.1x 12.8% 21.5% 21.5% 25.1% 25.8% 0.4% 8.7% 8.7% 12.7% 8.7%
Carbonite 1.8x 1.7x 1.8x 1.9x 1.9x 25.3x 46.2x 48.0x - - 20.8% 14.4% 14.4% 13.1% 11.7% 7.2% 3.7% 3.7% -0.2% -3.7%
Care.com 6.0x 2.4x 1.4x 1.2x 1.0x - - - - - 41.1% 43.2% 42.9% 43.1% 43.1% -30.5% -27.0% -23.1% -18.7% -18.7%
ChangYou.com 2.0x 1.7x 1.5x 1.6x 1.1x 12.0x 16.8x 15.3x 7.5x 3.1x 5.3% 2.4% 2.4% 5.7% 11.1% 16.5% 10.0% 10.0% 20.9% 36.0%
Chegg 1.7x 1.2x 1.6x 1.5x 1.9x 45.3x 15.6x 20.1x 27.5x 35.4x 16.8% 19.3% 19.3% 17.2% 14.5% 3.8% 7.8% 7.8% 5.4% 5.5%
Cimpress 1.4x 1.1x 1.4x 1.8x 2.0x 10.9x 7.4x 9.6x 12.0x 14.7x 8.8% 15.2% 15.2% 19.8% 17.6% 13.1% 14.6% 14.6% 14.9% 13.6%
Criteo SA 3.6x 2.2x 2.1x 2.3x 2.7x 48.4x 26.4x 25.2x 26.9x 32.5x 60.8% 67.8% 67.8% 70.3% 69.1% 7.5% 8.2% 8.2% 8.5% 8.2%
Ctrip 1.0x 0.9x 1.1x 0.9x 1.2x 8.2x 237.0x 290.8x - - 34.3% 36.4% 36.4% 39.1% 41.4% 12.3% 0.4% 0.4% -2.6% -2.5%
DangDang 0.1x 0.1x 0.1x 0.1x 0.0x 24.6x 6.4x 7.4x 18.6x - 25.6% 25.8% 25.8% 25.4% 22.2% 0.6% 1.4% 1.4% 0.4% -0.2%
DemandMedia 2.2x 2.0x 0.7x 0.5x 0.4x 18.2x 23.8x 8.8x 17.3x - -38.4% -17.7% -17.7% 4.4% -22.5% 11.9% 8.3% 8.3% 2.7% -4.2%
eBay 4.0x 3.4x 3.6x 3.6x 1.8x 13.4x 12.3x 12.6x 12.7x 6.5x 10.0% 11.6% 11.6% 10.9% 4.3% 29.9% 28.1% 28.1% 28.3% 27.3%
eHealth 4.7x 3.4x 2.2x 2.0x 1.1x 102.1x 807.6x 516.7x 56.5x 34.9x 14.4% 0.3% 0.3% 1.7% -1.3% 4.6% 0.4% 0.4% 3.6% 3.2%
Envivio 0.9x 0.6x 0.3x 0.0x 0.4x - - - - - 29.9% 7.5% -3.8% -3.4% -2.7% -23.4% -28.8% -24.5% -15.5% -7.7%
Everyday Health 2.8x 3.5x 2.7x 2.1x 2.1x 32.0x 31.5x 23.9x 23.7x 22.4x - 18.3% 18.3% 15.4% 20.5% 8.9% 11.1% 11.1% 8.7% 9.3%
Expedia 1.9x 1.6x 1.8x 1.8x 2.6x 14.1x 12.4x 13.7x 14.4x 22.4x 19.5% 20.8% 20.8% 19.7% 16.3% 13.8% 13.1% 13.1% 12.4% 11.6%
Facebook 14.9x 11.6x 14.5x 14.6x 16.9x 27.4x 23.3x 29.0x 31.4x 38.8x 63.7% 58.4% 58.4% 51.5% 46.2% 54.5% 49.9% 49.9% 46.6% 43.6%
GoDaddy - - - - 1.8x - - - - 30.7x - 22.7% 22.7% 21.5% 19.9% 1.0% 6.2% 6.2% 6.9% 5.9%
Google 4.9x 4.8x 5.2x 4.7x 5.3x 14.4x 14.8x 16.1x 14.4x 16.3x 13.1% 18.9% 18.9% 17.0% 12.8% 34.1% 32.5% 32.5% 32.3% 32.5%
Groupon 1.5x 1.0x 1.1x 1.3x 0.5x 42.1x 36.9x 38.4x 39.2x 18.4x 16.2% 24.0% 24.0% 19.0% 15.2% 3.7% 2.8% 2.8% 3.2% 3.0%
GrubHub - 9.8x 10.6x 9.3x 6.6x - 37.5x 40.5x 33.8x 24.8x - 85.1% 85.1% 66.8% 46.0% 22.2% 26.2% 26.2% 27.4% 26.4%
Harmonic 1.2x 1.2x 1.0x 1.2x 1.0x 23.2x 29.1x 24.2x 25.1x 18.2x -3.0% -6.1% -6.1% -8.3% -8.2% 5.2% 4.3% 4.3% 4.7% 5.4%
HomeAway 7.9x 5.8x 5.9x 5.3x 4.8x 48.4x 39.7x 40.4x 38.7x 42.7x 28.8% 28.9% 28.9% 23.5% 17.8% 16.3% 14.6% 14.6% 13.7% 11.3%
Interactive Intelligence 4.4x 3.0x 2.4x 2.5x 2.2x 156.9x - - 1007.8x 86.4x 17.4% 7.2% 7.2% 8.3% 12.1% 2.8% -0.2% -0.2% 0.3% 2.5%
InterActiveCorp 2.0x 1.8x 1.8x 1.7x 2.0x 11.7x 11.6x 11.6x 12.1x 16.3x -1.4% 2.9% 2.9% 4.0% 7.0% 17.3% 15.6% 15.6% 14.1% 12.5%
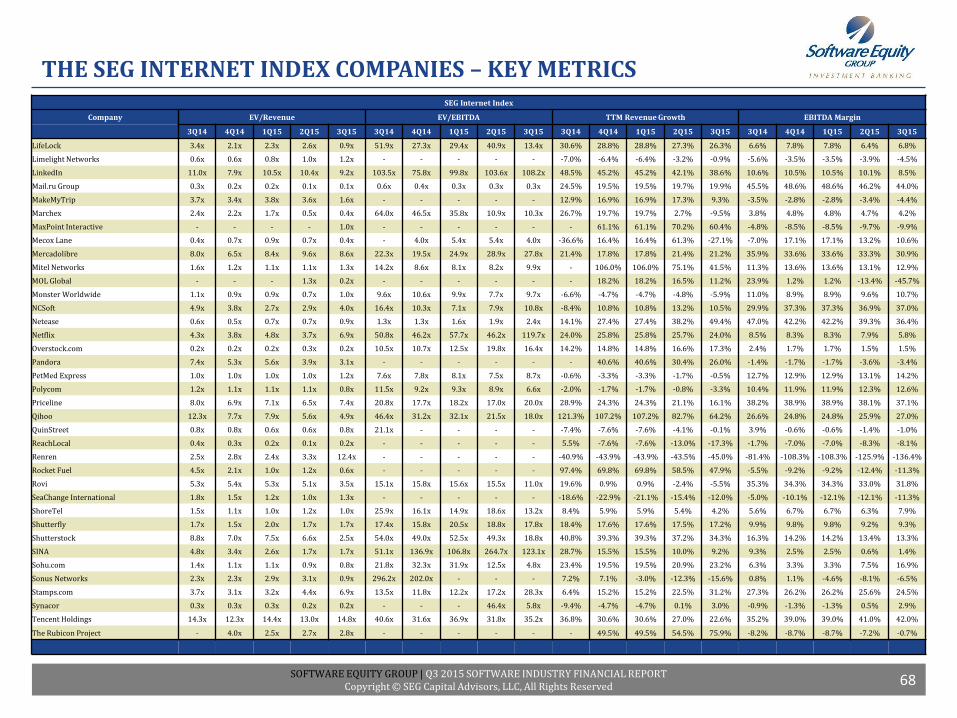
SOFTWARE EQUITY GROUP | Q3 2015 SOFTWARE INDUSTRY FINANCIAL REPORTCopyright © SEG Capital Advisors, LLC, All Rights Reserved
THE SEG INTERNET INDEX COMPANIES – KEY METRICS
68
SEG Internet Index
Company EV/Revenue EV/EBITDA TTM Revenue Growth EBITDA Margin
3Q14 4Q14 1Q15 2Q15 3Q15 3Q14 4Q14 1Q15 2Q15 3Q15 3Q14 4Q14 1Q15 2Q15 3Q15 3Q14 4Q14 1Q15 2Q15 3Q15
LifeLock 3.4x 2.1x 2.3x 2.6x 0.9x 51.9x 27.3x 29.4x 40.9x 13.4x 30.6% 28.8% 28.8% 27.3% 26.3% 6.6% 7.8% 7.8% 6.4% 6.8%
Limelight Networks 0.6x 0.6x 0.8x 1.0x 1.2x - - - - - -7.0% -6.4% -6.4% -3.2% -0.9% -5.6% -3.5% -3.5% -3.9% -4.5%
LinkedIn 11.0x 7.9x 10.5x 10.4x 9.2x 103.5x 75.8x 99.8x 103.6x 108.2x 48.5% 45.2% 45.2% 42.1% 38.6% 10.6% 10.5% 10.5% 10.1% 8.5%
Mail.ru Group 0.3x 0.2x 0.2x 0.1x 0.1x 0.6x 0.4x 0.3x 0.3x 0.3x 24.5% 19.5% 19.5% 19.7% 19.9% 45.5% 48.6% 48.6% 46.2% 44.0%
MakeMyTrip 3.7x 3.4x 3.8x 3.6x 1.6x - - - - - 12.9% 16.9% 16.9% 17.3% 9.3% -3.5% -2.8% -2.8% -3.4% -4.4%
Marchex 2.4x 2.2x 1.7x 0.5x 0.4x 64.0x 46.5x 35.8x 10.9x 10.3x 26.7% 19.7% 19.7% 2.7% -9.5% 3.8% 4.8% 4.8% 4.7% 4.2%
MaxPoint Interactive - - - - 1.0x - - - - - - 61.1% 61.1% 70.2% 60.4% -4.8% -8.5% -8.5% -9.7% -9.9%
Mecox Lane 0.4x 0.7x 0.9x 0.7x 0.4x - 4.0x 5.4x 5.4x 4.0x -36.6% 16.4% 16.4% 61.3% -27.1% -7.0% 17.1% 17.1% 13.2% 10.6%
Mercadolibre 8.0x 6.5x 8.4x 9.6x 8.6x 22.3x 19.5x 24.9x 28.9x 27.8x 21.4% 17.8% 17.8% 21.4% 21.2% 35.9% 33.6% 33.6% 33.3% 30.9%
Mitel Networks 1.6x 1.2x 1.1x 1.1x 1.3x 14.2x 8.6x 8.1x 8.2x 9.9x - 106.0% 106.0% 75.1% 41.5% 11.3% 13.6% 13.6% 13.1% 12.9%
MOL Global - - - 1.3x 0.2x - - - - - - 18.2% 18.2% 16.5% 11.2% 23.9% 1.2% 1.2% -13.4% -45.7%
Monster Worldwide 1.1x 0.9x 0.9x 0.7x 1.0x 9.6x 10.6x 9.9x 7.7x 9.7x -6.6% -4.7% -4.7% -4.8% -5.9% 11.0% 8.9% 8.9% 9.6% 10.7%
NCSoft 4.9x 3.8x 2.7x 2.9x 4.0x 16.4x 10.3x 7.1x 7.9x 10.8x -8.4% 10.8% 10.8% 13.2% 10.5% 29.9% 37.3% 37.3% 36.9% 37.0%
Netease 0.6x 0.5x 0.7x 0.7x 0.9x 1.3x 1.3x 1.6x 1.9x 2.4x 14.1% 27.4% 27.4% 38.2% 49.4% 47.0% 42.2% 42.2% 39.3% 36.4%
Netflix 4.3x 3.8x 4.8x 3.7x 6.9x 50.8x 46.2x 57.7x 46.2x 119.7x 24.0% 25.8% 25.8% 25.7% 24.0% 8.5% 8.3% 8.3% 7.9% 5.8%
Overstock.com 0.2x 0.2x 0.2x 0.3x 0.2x 10.5x 10.7x 12.5x 19.8x 16.4x 14.2% 14.8% 14.8% 16.6% 17.3% 2.4% 1.7% 1.7% 1.5% 1.5%
Pandora 7.4x 5.3x 5.6x 3.9x 3.1x - - - - - - 40.6% 40.6% 30.4% 26.0% -1.4% -1.7% -1.7% -3.6% -3.4%
PetMed Express 1.0x 1.0x 1.0x 1.0x 1.2x 7.6x 7.8x 8.1x 7.5x 8.7x -0.6% -3.3% -3.3% -1.7% -0.5% 12.7% 12.9% 12.9% 13.1% 14.2%
Polycom 1.2x 1.1x 1.1x 1.1x 0.8x 11.5x 9.2x 9.3x 8.9x 6.6x -2.0% -1.7% -1.7% -0.8% -3.3% 10.4% 11.9% 11.9% 12.3% 12.6%
Priceline 8.0x 6.9x 7.1x 6.5x 7.4x 20.8x 17.7x 18.2x 17.0x 20.0x 28.9% 24.3% 24.3% 21.1% 16.1% 38.2% 38.9% 38.9% 38.1% 37.1%
Qihoo 12.3x 7.7x 7.9x 5.6x 4.9x 46.4x 31.2x 32.1x 21.5x 18.0x 121.3% 107.2% 107.2% 82.7% 64.2% 26.6% 24.8% 24.8% 25.9% 27.0%
QuinStreet 0.8x 0.8x 0.6x 0.6x 0.8x 21.1x - - - - -7.4% -7.6% -7.6% -4.1% -0.1% 3.9% -0.6% -0.6% -1.4% -1.0%
ReachLocal 0.4x 0.3x 0.2x 0.1x 0.2x - - - - - 5.5% -7.6% -7.6% -13.0% -17.3% -1.7% -7.0% -7.0% -8.3% -8.1%
Renren 2.5x 2.8x 2.4x 3.3x 12.4x - - - - - -40.9% -43.9% -43.9% -43.5% -45.0% -81.4% -108.3% -108.3% -125.9% -136.4%
Rocket Fuel 4.5x 2.1x 1.0x 1.2x 0.6x - - - - - 97.4% 69.8% 69.8% 58.5% 47.9% -5.5% -9.2% -9.2% -12.4% -11.3%
Rovi 5.3x 5.4x 5.3x 5.1x 3.5x 15.1x 15.8x 15.6x 15.5x 11.0x 19.6% 0.9% 0.9% -2.4% -5.5% 35.3% 34.3% 34.3% 33.0% 31.8%
SeaChange International 1.8x 1.5x 1.2x 1.0x 1.3x - - - - - -18.6% -22.9% -21.1% -15.4% -12.0% -5.0% -10.1% -12.1% -12.1% -11.3%
ShoreTel 1.5x 1.1x 1.0x 1.2x 1.0x 25.9x 16.1x 14.9x 18.6x 13.2x 8.4% 5.9% 5.9% 5.4% 4.2% 5.6% 6.7% 6.7% 6.3% 7.9%
Shutterfly 1.7x 1.5x 2.0x 1.7x 1.7x 17.4x 15.8x 20.5x 18.8x 17.8x 18.4% 17.6% 17.6% 17.5% 17.2% 9.9% 9.8% 9.8% 9.2% 9.3%
Shutterstock 8.8x 7.0x 7.5x 6.6x 2.5x 54.0x 49.0x 52.5x 49.3x 18.8x 40.8% 39.3% 39.3% 37.2% 34.3% 16.3% 14.2% 14.2% 13.4% 13.3%
SINA 4.8x 3.4x 2.6x 1.7x 1.7x 51.1x 136.9x 106.8x 264.7x 123.1x 28.7% 15.5% 15.5% 10.0% 9.2% 9.3% 2.5% 2.5% 0.6% 1.4%
Sohu.com 1.4x 1.1x 1.1x 0.9x 0.8x 21.8x 32.3x 31.9x 12.5x 4.8x 23.4% 19.5% 19.5% 20.9% 23.2% 6.3% 3.3% 3.3% 7.5% 16.9%
Sonus Networks 2.3x 2.3x 2.9x 3.1x 0.9x 296.2x 202.0x - - - 7.2% 7.1% -3.0% -12.3% -15.6% 0.8% 1.1% -4.6% -8.1% -6.5%
Stamps.com 3.7x 3.1x 3.2x 4.4x 6.9x 13.5x 11.8x 12.2x 17.2x 28.3x 6.4% 15.2% 15.2% 22.5% 31.2% 27.3% 26.2% 26.2% 25.6% 24.5%
Synacor 0.3x 0.3x 0.3x 0.2x 0.2x - - - 46.4x 5.8x -9.4% -4.7% -4.7% 0.1% 3.0% -0.9% -1.3% -1.3% 0.5% 2.9%
Tencent Holdings 14.3x 12.3x 14.4x 13.0x 14.8x 40.6x 31.6x 36.9x 31.8x 35.2x 36.8% 30.6% 30.6% 27.0% 22.6% 35.2% 39.0% 39.0% 41.0% 42.0%
The Rubicon Project - 4.0x 2.5x 2.7x 2.8x - - - - - - 49.5% 49.5% 54.5% 75.9% -8.2% -8.7% -8.7% -7.2% -0.7%
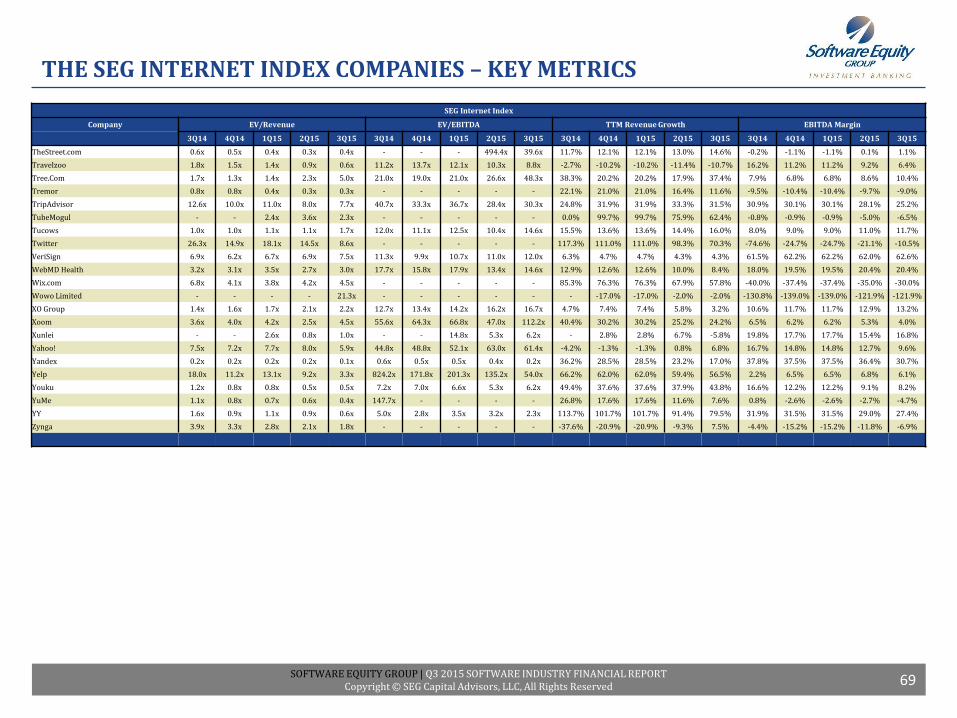
SOFTWARE EQUITY GROUP | Q3 2015 SOFTWARE INDUSTRY FINANCIAL REPORTCopyright © SEG Capital Advisors, LLC, All Rights Reserved
THE SEG INTERNET INDEX COMPANIES – KEY METRICS
69
SEG Internet Index
Company EV/Revenue EV/EBITDA TTM Revenue Growth EBITDA Margin
3Q14 4Q14 1Q15 2Q15 3Q15 3Q14 4Q14 1Q15 2Q15 3Q15 3Q14 4Q14 1Q15 2Q15 3Q15 3Q14 4Q14 1Q15 2Q15 3Q15
TheStreet.com 0.6x 0.5x 0.4x 0.3x 0.4x - - - 494.4x 39.6x 11.7% 12.1% 12.1% 13.0% 14.6% -0.2% -1.1% -1.1% 0.1% 1.1%
Travelzoo 1.8x 1.5x 1.4x 0.9x 0.6x 11.2x 13.7x 12.1x 10.3x 8.8x -2.7% -10.2% -10.2% -11.4% -10.7% 16.2% 11.2% 11.2% 9.2% 6.4%
Tree.Com 1.7x 1.3x 1.4x 2.3x 5.0x 21.0x 19.0x 21.0x 26.6x 48.3x 38.3% 20.2% 20.2% 17.9% 37.4% 7.9% 6.8% 6.8% 8.6% 10.4%
Tremor 0.8x 0.8x 0.4x 0.3x 0.3x - - - - - 22.1% 21.0% 21.0% 16.4% 11.6% -9.5% -10.4% -10.4% -9.7% -9.0%
TripAdvisor 12.6x 10.0x 11.0x 8.0x 7.7x 40.7x 33.3x 36.7x 28.4x 30.3x 24.8% 31.9% 31.9% 33.3% 31.5% 30.9% 30.1% 30.1% 28.1% 25.2%
TubeMogul - - 2.4x 3.6x 2.3x - - - - - 0.0% 99.7% 99.7% 75.9% 62.4% -0.8% -0.9% -0.9% -5.0% -6.5%
Tucows 1.0x 1.0x 1.1x 1.1x 1.7x 12.0x 11.1x 12.5x 10.4x 14.6x 15.5% 13.6% 13.6% 14.4% 16.0% 8.0% 9.0% 9.0% 11.0% 11.7%
Twitter 26.3x 14.9x 18.1x 14.5x 8.6x - - - - - 117.3% 111.0% 111.0% 98.3% 70.3% -74.6% -24.7% -24.7% -21.1% -10.5%
VeriSign 6.9x 6.2x 6.7x 6.9x 7.5x 11.3x 9.9x 10.7x 11.0x 12.0x 6.3% 4.7% 4.7% 4.3% 4.3% 61.5% 62.2% 62.2% 62.0% 62.6%
WebMD Health 3.2x 3.1x 3.5x 2.7x 3.0x 17.7x 15.8x 17.9x 13.4x 14.6x 12.9% 12.6% 12.6% 10.0% 8.4% 18.0% 19.5% 19.5% 20.4% 20.4%
Wix.com 6.8x 4.1x 3.8x 4.2x 4.5x - - - - - 85.3% 76.3% 76.3% 67.9% 57.8% -40.0% -37.4% -37.4% -35.0% -30.0%
Wowo Limited - - - - 21.3x - - - - - - -17.0% -17.0% -2.0% -2.0% -130.8% -139.0% -139.0% -121.9% -121.9%
XO Group 1.4x 1.6x 1.7x 2.1x 2.2x 12.7x 13.4x 14.2x 16.2x 16.7x 4.7% 7.4% 7.4% 5.8% 3.2% 10.6% 11.7% 11.7% 12.9% 13.2%
Xoom 3.6x 4.0x 4.2x 2.5x 4.5x 55.6x 64.3x 66.8x 47.0x 112.2x 40.4% 30.2% 30.2% 25.2% 24.2% 6.5% 6.2% 6.2% 5.3% 4.0%
Xunlei - - 2.6x 0.8x 1.0x - - 14.8x 5.3x 6.2x - 2.8% 2.8% 6.7% -5.8% 19.8% 17.7% 17.7% 15.4% 16.8%
Yahoo! 7.5x 7.2x 7.7x 8.0x 5.9x 44.8x 48.8x 52.1x 63.0x 61.4x -4.2% -1.3% -1.3% 0.8% 6.8% 16.7% 14.8% 14.8% 12.7% 9.6%
Yandex 0.2x 0.2x 0.2x 0.2x 0.1x 0.6x 0.5x 0.5x 0.4x 0.2x 36.2% 28.5% 28.5% 23.2% 17.0% 37.8% 37.5% 37.5% 36.4% 30.7%
Yelp 18.0x 11.2x 13.1x 9.2x 3.3x 824.2x 171.8x 201.3x 135.2x 54.0x 66.2% 62.0% 62.0% 59.4% 56.5% 2.2% 6.5% 6.5% 6.8% 6.1%
Youku 1.2x 0.8x 0.8x 0.5x 0.5x 7.2x 7.0x 6.6x 5.3x 6.2x 49.4% 37.6% 37.6% 37.9% 43.8% 16.6% 12.2% 12.2% 9.1% 8.2%
YuMe 1.1x 0.8x 0.7x 0.6x 0.4x 147.7x - - - - 26.8% 17.6% 17.6% 11.6% 7.6% 0.8% -2.6% -2.6% -2.7% -4.7%
YY 1.6x 0.9x 1.1x 0.9x 0.6x 5.0x 2.8x 3.5x 3.2x 2.3x 113.7% 101.7% 101.7% 91.4% 79.5% 31.9% 31.5% 31.5% 29.0% 27.4%
Zynga 3.9x 3.3x 2.8x 2.1x 1.8x - - - - - -37.6% -20.9% -20.9% -9.3% 7.5% -4.4% -15.2% -15.2% -11.8% -6.9%
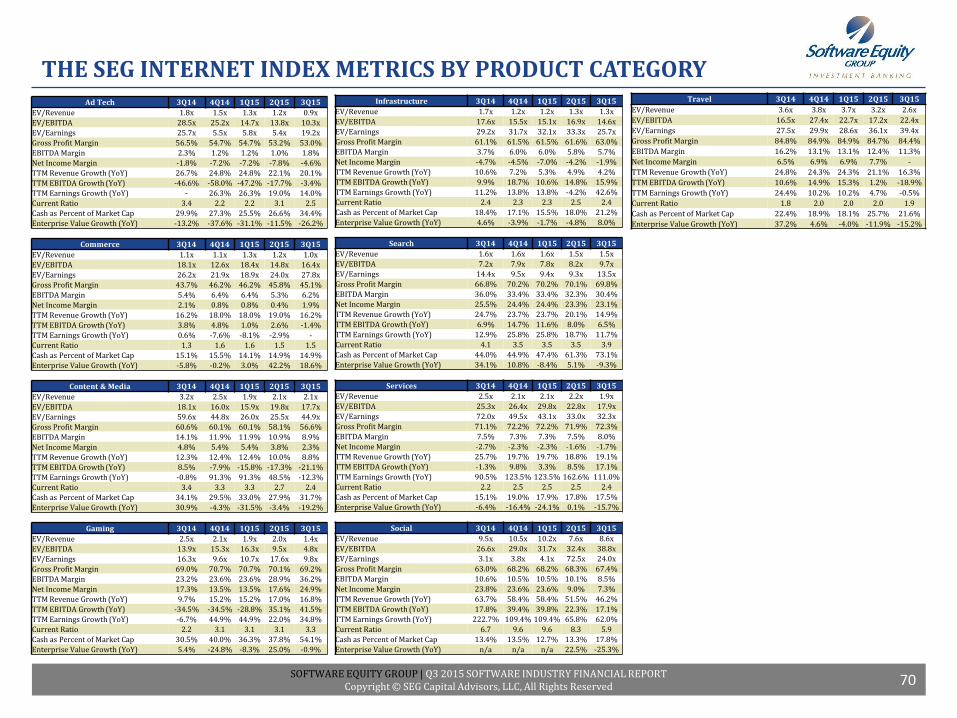
SOFTWARE EQUITY GROUP | Q3 2015 SOFTWARE INDUSTRY FINANCIAL REPORTCopyright © SEG Capital Advisors, LLC, All Rights Reserved
THE SEG INTERNET INDEX METRICS BY PRODUCT CATEGORY
70
Ad Tech 3Q14 4Q14 1Q15 2Q15 3Q15
EV/Revenue 1.8x 1.5x 1.3x 1.2x 0.9x
EV/EBITDA 28.5x 25.2x 14.7x 13.8x 10.3x
EV/Earnings 25.7x 5.5x 5.8x 5.4x 19.2x
Gross Profit Margin 56.5% 54.7% 54.7% 53.2% 53.0%
EBITDA Margin 2.3% 1.2% 1.2% 1.0% 1.8%
Net Income Margin -1.8% -7.2% -7.2% -7.8% -4.6%
TTM Revenue Growth (YoY) 26.7% 24.8% 24.8% 22.1% 20.1%
TTM EBITDA Growth (YoY) -46.6% -58.0% -47.2% -17.7% -3.4%
TTM Earnings Growth (YoY) - 26.3% 26.3% 19.0% 14.0%
Current Ratio 3.4 2.2 2.2 3.1 2.5
Cash as Percent of Market Cap 29.9% 27.3% 25.5% 26.6% 34.4%
Enterprise Value Growth (YoY) -13.2% -37.6% -31.1% -11.5% -26.2%
Commerce 3Q14 4Q14 1Q15 2Q15 3Q15
EV/Revenue 1.1x 1.1x 1.3x 1.2x 1.0x
EV/EBITDA 18.1x 12.6x 18.4x 14.8x 16.4x
EV/Earnings 26.2x 21.9x 18.9x 24.0x 27.8x
Gross Profit Margin 43.7% 46.2% 46.2% 45.8% 45.1%
EBITDA Margin 5.4% 6.4% 6.4% 5.3% 6.2%
Net Income Margin 2.1% 0.8% 0.8% 0.4% 1.9%
TTM Revenue Growth (YoY) 16.2% 18.0% 18.0% 19.0% 16.2%
TTM EBITDA Growth (YoY) 3.8% 4.8% 1.0% 2.6% -1.4%
TTM Earnings Growth (YoY) 0.6% -7.6% -8.1% -2.9% -
Current Ratio 1.3 1.6 1.6 1.5 1.5
Cash as Percent of Market Cap 15.1% 15.5% 14.1% 14.9% 14.9%
Enterprise Value Growth (YoY) -5.8% -0.2% 3.0% 42.2% 18.6%
Content & Media 3Q14 4Q14 1Q15 2Q15 3Q15
EV/Revenue 3.2x 2.5x 1.9x 2.1x 2.1x
EV/EBITDA 18.1x 16.0x 15.9x 19.8x 17.7x
EV/Earnings 59.6x 44.8x 26.0x 25.5x 44.9x
Gross Profit Margin 60.6% 60.1% 60.1% 58.1% 56.6%
EBITDA Margin 14.1% 11.9% 11.9% 10.9% 8.9%
Net Income Margin 4.8% 5.4% 5.4% 3.8% 2.3%
TTM Revenue Growth (YoY) 12.3% 12.4% 12.4% 10.0% 8.8%
TTM EBITDA Growth (YoY) 8.5% -7.9% -15.8% -17.3% -21.1%
TTM Earnings Growth (YoY) -0.8% 91.3% 91.3% 48.5% -12.3%
Current Ratio 3.4 3.3 3.3 2.7 2.4
Cash as Percent of Market Cap 34.1% 29.5% 33.0% 27.9% 31.7%
Enterprise Value Growth (YoY) 30.9% -4.3% -31.5% -3.4% -19.2%
Gaming 3Q14 4Q14 1Q15 2Q15 3Q15
EV/Revenue 2.5x 2.1x 1.9x 2.0x 1.4x
EV/EBITDA 13.9x 15.3x 16.3x 9.5x 4.8x
EV/Earnings 16.3x 9.6x 10.7x 17.6x 9.8x
Gross Profit Margin 69.0% 70.7% 70.7% 70.1% 69.2%
EBITDA Margin 23.2% 23.6% 23.6% 28.9% 36.2%
Net Income Margin 17.3% 13.5% 13.5% 17.6% 24.9%
TTM Revenue Growth (YoY) 9.7% 15.2% 15.2% 17.0% 16.8%
TTM EBITDA Growth (YoY) -34.5% -34.5% -28.8% 35.1% 41.5%
TTM Earnings Growth (YoY) -6.7% 44.9% 44.9% 22.0% 34.8%
Current Ratio 2.2 3.1 3.1 3.1 3.3
Cash as Percent of Market Cap 30.5% 40.0% 36.3% 37.8% 54.1%
Enterprise Value Growth (YoY) 5.4% -24.8% -8.3% 25.0% -0.9%
Infrastructure 3Q14 4Q14 1Q15 2Q15 3Q15
EV/Revenue 1.7x 1.2x 1.2x 1.3x 1.3x
EV/EBITDA 17.6x 15.5x 15.1x 16.9x 14.6x
EV/Earnings 29.2x 31.7x 32.1x 33.3x 25.7x
Gross Profit Margin 61.1% 61.5% 61.5% 61.6% 63.0%
EBITDA Margin 3.7% 6.0% 6.0% 5.8% 5.7%
Net Income Margin -4.7% -4.5% -7.0% -4.2% -1.9%
TTM Revenue Growth (YoY) 10.6% 7.2% 5.3% 4.9% 4.2%
TTM EBITDA Growth (YoY) 9.9% 18.7% 10.6% 14.8% 15.9%
TTM Earnings Growth (YoY) 11.2% 13.8% 13.8% -4.2% 42.6%
Current Ratio 2.4 2.3 2.3 2.5 2.4
Cash as Percent of Market Cap 18.4% 17.1% 15.5% 18.0% 21.2%
Enterprise Value Growth (YoY) 4.6% -3.9% -1.7% -4.8% 8.0%
Search 3Q14 4Q14 1Q15 2Q15 3Q15
EV/Revenue 1.6x 1.6x 1.6x 1.5x 1.5x
EV/EBITDA 7.2x 7.9x 7.8x 8.2x 9.7x
EV/Earnings 14.4x 9.5x 9.4x 9.3x 13.5x
Gross Profit Margin 66.8% 70.2% 70.2% 70.1% 69.8%
EBITDA Margin 36.0% 33.4% 33.4% 32.3% 30.4%
Net Income Margin 25.5% 24.4% 24.4% 23.3% 23.1%
TTM Revenue Growth (YoY) 24.7% 23.7% 23.7% 20.1% 14.9%
TTM EBITDA Growth (YoY) 6.9% 14.7% 11.6% 8.0% 6.5%
TTM Earnings Growth (YoY) 12.9% 25.8% 25.8% 18.7% 11.7%
Current Ratio 4.1 3.5 3.5 3.5 3.9
Cash as Percent of Market Cap 44.0% 44.9% 47.4% 61.3% 73.1%
Enterprise Value Growth (YoY) 34.1% 10.8% -8.4% 5.1% -9.3%
Services 3Q14 4Q14 1Q15 2Q15 3Q15
EV/Revenue 2.5x 2.1x 2.1x 2.2x 1.9x
EV/EBITDA 25.3x 26.4x 29.8x 22.8x 17.9x
EV/Earnings 72.0x 49.5x 43.1x 33.0x 32.3x
Gross Profit Margin 71.1% 72.2% 72.2% 71.9% 72.3%
EBITDA Margin 7.5% 7.3% 7.3% 7.5% 8.0%
Net Income Margin -2.7% -2.3% -2.3% -1.6% -1.7%
TTM Revenue Growth (YoY) 25.7% 19.7% 19.7% 18.8% 19.1%
TTM EBITDA Growth (YoY) -1.3% 9.8% 3.3% 8.5% 17.1%
TTM Earnings Growth (YoY) 90.5% 123.5% 123.5% 162.6% 111.0%
Current Ratio 2.2 2.5 2.5 2.5 2.4
Cash as Percent of Market Cap 15.1% 19.0% 17.9% 17.8% 17.5%
Enterprise Value Growth (YoY) -6.4% -16.4% -24.1% 0.1% -15.7%
Social 3Q14 4Q14 1Q15 2Q15 3Q15
EV/Revenue 9.5x 10.5x 10.2x 7.6x 8.6x
EV/EBITDA 26.6x 29.0x 31.7x 32.4x 38.8x
EV/Earnings 3.1x 3.8x 4.1x 72.5x 24.0x
Gross Profit Margin 63.0% 68.2% 68.2% 68.3% 67.4%
EBITDA Margin 10.6% 10.5% 10.5% 10.1% 8.5%
Net Income Margin 23.8% 23.6% 23.6% 9.0% 7.3%
TTM Revenue Growth (YoY) 63.7% 58.4% 58.4% 51.5% 46.2%
TTM EBITDA Growth (YoY) 17.8% 39.4% 39.8% 22.3% 17.1%
TTM Earnings Growth (YoY) 222.7% 109.4% 109.4% 65.8% 62.0%
Current Ratio 6.7 9.6 9.6 8.3 5.9
Cash as Percent of Market Cap 13.4% 13.5% 12.7% 13.3% 17.8%
Enterprise Value Growth (YoY) n/a n/a n/a 22.5% -25.3%
Travel 3Q14 4Q14 1Q15 2Q15 3Q15
EV/Revenue 3.6x 3.8x 3.7x 3.2x 2.6x
EV/EBITDA 16.5x 27.4x 22.7x 17.2x 22.4x
EV/Earnings 27.5x 29.9x 28.6x 36.1x 39.4x
Gross Profit Margin 84.8% 84.9% 84.9% 84.7% 84.4%
EBITDA Margin 16.2% 13.1% 13.1% 12.4% 11.3%
Net Income Margin 6.5% 6.9% 6.9% 7.7% -
TTM Revenue Growth (YoY) 24.8% 24.3% 24.3% 21.1% 16.3%
TTM EBITDA Growth (YoY) 10.6% 14.9% 15.3% 1.2% -18.9%
TTM Earnings Growth (YoY) 24.4% 10.2% 10.2% 4.7% -0.5%
Current Ratio 1.8 2.0 2.0 2.0 1.9
Cash as Percent of Market Cap 22.4% 18.9% 18.1% 25.7% 21.6%
Enterprise Value Growth (YoY) 37.2% 4.6% -4.0% -11.9% -15.2%
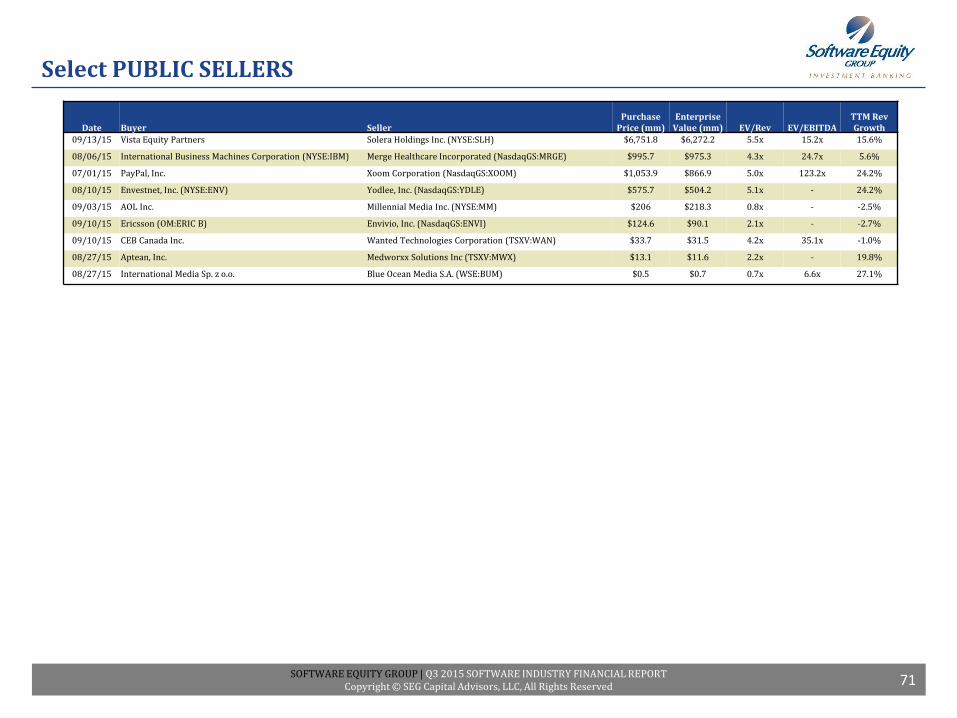
SOFTWARE EQUITY GROUP | Q3 2015 SOFTWARE INDUSTRY FINANCIAL REPORTCopyright © SEG Capital Advisors, LLC, All Rights Reserved
Select PUBLIC SELLERS
71
Date Buyer SellerPurchase
Price (mm)Enterprise
Value (mm) EV/Rev EV/EBITDATTM Rev Growth
09/13/15 Vista Equity Partners Solera Holdings Inc. (NYSE:SLH) $6,751.8 $6,272.2 5.5x 15.2x 15.6%
08/06/15 International Business Machines Corporation (NYSE:IBM) Merge Healthcare Incorporated (NasdaqGS:MRGE) $995.7 $975.3 4.3x 24.7x 5.6%
07/01/15 PayPal, Inc. Xoom Corporation (NasdaqGS:XOOM) $1,053.9 $866.9 5.0x 123.2x 24.2%
08/10/15 Envestnet, Inc. (NYSE:ENV) Yodlee, Inc. (NasdaqGS:YDLE) $575.7 $504.2 5.1x - 24.2%
09/03/15 AOL Inc. Millennial Media Inc. (NYSE:MM) $206 $218.3 0.8x - -2.5%
09/10/15 Ericsson (OM:ERIC B) Envivio, Inc. (NasdaqGS:ENVI) $124.6 $90.1 2.1x - -2.7%
09/10/15 CEB Canada Inc. Wanted Technologies Corporation (TSXV:WAN) $33.7 $31.5 4.2x 35.1x -1.0%
08/27/15 Aptean, Inc. Medworxx Solutions Inc (TSXV:MWX) $13.1 $11.6 2.2x - 19.8%
08/27/15 International Media Sp. z o.o. Blue Ocean Media S.A. (WSE:BUM) $0.5 $0.7 0.7x 6.6x 27.1%
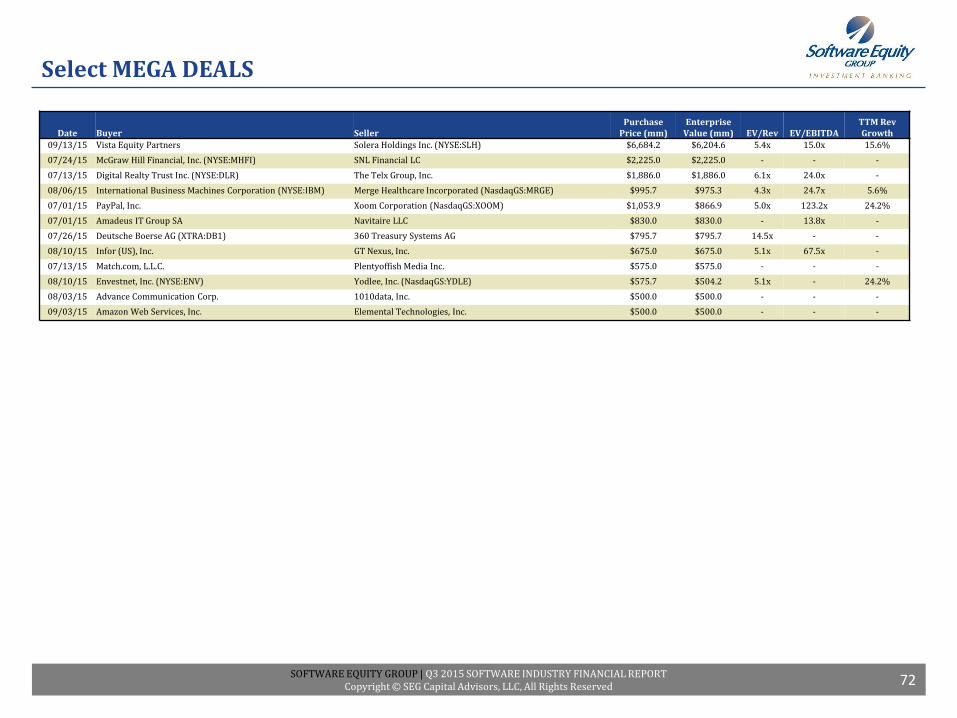
SOFTWARE EQUITY GROUP | Q3 2015 SOFTWARE INDUSTRY FINANCIAL REPORTCopyright © SEG Capital Advisors, LLC, All Rights Reserved
Select MEGA DEALS
72
Date Buyer SellerPurchase
Price (mm)Enterprise
Value (mm) EV/Rev EV/EBITDATTM Rev Growth
09/13/15 Vista Equity Partners Solera Holdings Inc. (NYSE:SLH) $6,684.2 $6,204.6 5.4x 15.0x 15.6%
07/24/15 McGraw Hill Financial, Inc. (NYSE:MHFI) SNL Financial LC $2,225.0 $2,225.0 - - -
07/13/15 Digital Realty Trust Inc. (NYSE:DLR) The Telx Group, Inc. $1,886.0 $1,886.0 6.1x 24.0x -
08/06/15 International Business Machines Corporation (NYSE:IBM) Merge Healthcare Incorporated (NasdaqGS:MRGE) $995.7 $975.3 4.3x 24.7x 5.6%
07/01/15 PayPal, Inc. Xoom Corporation (NasdaqGS:XOOM) $1,053.9 $866.9 5.0x 123.2x 24.2%
07/01/15 Amadeus IT Group SA Navitaire LLC $830.0 $830.0 - 13.8x -
07/26/15 Deutsche Boerse AG (XTRA:DB1) 360 Treasury Systems AG $795.7 $795.7 14.5x - -
08/10/15 Infor (US), Inc. GT Nexus, Inc. $675.0 $675.0 5.1x 67.5x -
07/13/15 Match.com, L.L.C. Plentyoffish Media Inc. $575.0 $575.0 - - -
08/10/15 Envestnet, Inc. (NYSE:ENV) Yodlee, Inc. (NasdaqGS:YDLE) $575.7 $504.2 5.1x - 24.2%
08/03/15 Advance Communication Corp. 1010data, Inc. $500.0 $500.0 - - -
09/03/15 Amazon Web Services, Inc. Elemental Technologies, Inc. $500.0 $500.0 - - -
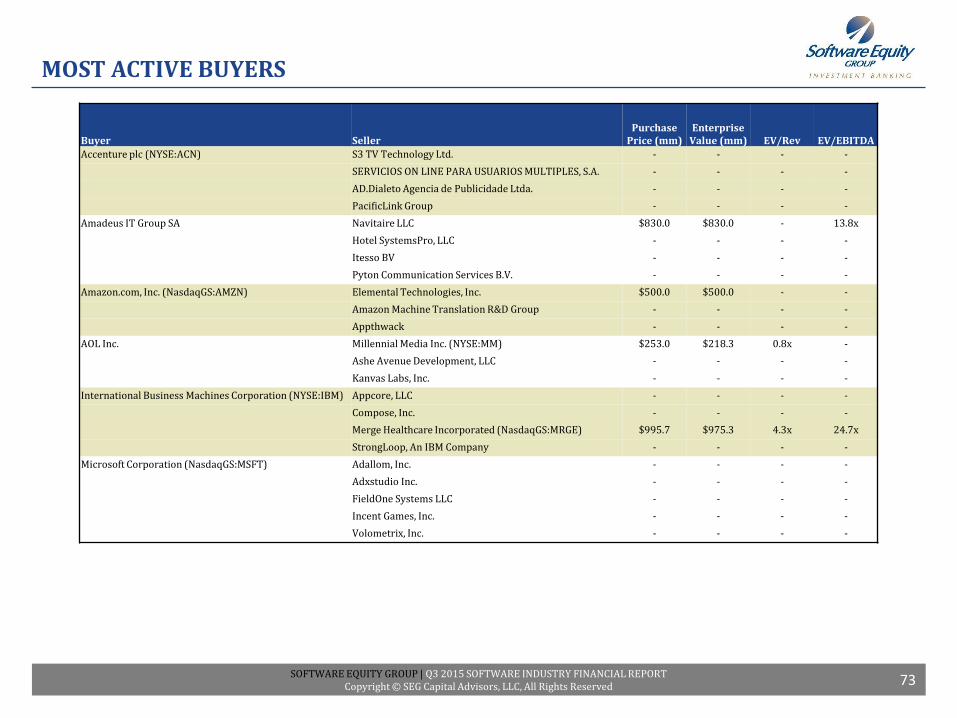
SOFTWARE EQUITY GROUP | Q3 2015 SOFTWARE INDUSTRY FINANCIAL REPORTCopyright © SEG Capital Advisors, LLC, All Rights Reserved
MOST ACTIVE BUYERS
73
Buyer SellerPurchase
Price (mm)Enterprise
Value (mm) EV/Rev EV/EBITDA
Accenture plc (NYSE:ACN) S3 TV Technology Ltd. - - - -
SERVICIOS ON LINE PARA USUARIOS MULTIPLES, S.A. - - - -
AD.Dialeto Agencia de Publicidade Ltda. - - - -
PacificLink Group - - - -
Amadeus IT Group SA Navitaire LLC $830.0 $830.0 - 13.8x
Hotel SystemsPro, LLC - - - -
Itesso BV - - - -
Pyton Communication Services B.V. - - - -
Amazon.com, Inc. (NasdaqGS:AMZN) Elemental Technologies, Inc. $500.0 $500.0 - -
Amazon Machine Translation R&D Group - - - -
Appthwack - - - -
AOL Inc. Millennial Media Inc. (NYSE:MM) $253.0 $218.3 0.8x -
Ashe Avenue Development, LLC - - - -
Kanvas Labs, Inc. - - - -
International Business Machines Corporation (NYSE:IBM) Appcore, LLC - - - -
Compose, Inc. - - - -
Merge Healthcare Incorporated (NasdaqGS:MRGE) $995.7 $975.3 4.3x 24.7x
StrongLoop, An IBM Company - - - -
Microsoft Corporation (NasdaqGS:MSFT) Adallom, Inc. - - - -
Adxstudio Inc. - - - -
FieldOne Systems LLC - - - -
Incent Games, Inc. - - - -
Volometrix, Inc. - - - -
SOFTWARE EQUITY GROUP | Q3 2015 SOFTWARE INDUSTRY FINANCIAL REPORTCopyright © SEG Capital Advisors, LLC, All Rights Reserved
Software Equity Group is an investment bank and M&A advisory serving the software and technology sectors. Founded in 1992, our firm has guided and advised companies on five continents, including privately-held software and technology companies in the United States, Canada, Europe, Asia Pacific, Africa and Israel. We have represented public companies listed on the NASDAQ, NYSE, American, Toronto, London and Euronext exchanges. Software Equity Group also advises several of the world's leading private equity firms. We are ranked among the top ten investment banks worldwide for application software mergers and acquisitions.
Our value proposition is unique and compelling. We are skilled and accomplished investment bankers with extraordinary software, internet and technology domain expertise. Our industry knowledge and experience span virtually every software product category, technology, market and delivery model, including Software-as-a-Service (Saas), software on-demand and perpetual license. We have profound understanding of software company finances, operations and valuation. We monitor and analyze every publicly disclosed software M&A transaction, as well as the market, economy and technology trends that impact these deals. We're formidable negotiators and savvy dealmakers who facilitate strategic combinations that enhance shareholder value.
Perhaps most important are the relationships we've built and the industry reputation we enjoy. Software Equity Group is known and respected by publicly traded and privately owned software and technology companies worldwide, and we speak with them often. Our Quarterly and Annual Software Industry Equity Reports are read and relied upon by more than thousands of industry executives, entrepreneurs and equity investors in sixty-one countries, and we have been quoted widely in such leading publications as The Wall Street Journal, Barrons, Information Week, The Daily Deal, The Street.com, U.S. News & World Report, Reuters, Mergers & Acquisitions, USA Today, Arizona Republic, Detroit Free Press, Entrepreneur Magazine, Softletter, Software Success, Software CEO Online and Software Business Magazine.
To keep your finger on the pulse of the software equity markets, subscribe to our Annual and Quarterly Research Reports.
Software Equity Group is an investment bank and M&A advisory serving the software and technology sectors. For a confidential consultation without obligation, please contact Kris Beible, Vice President (858) 509-2800, [email protected] .
CONTACT INFORMATION:
SEG Capital Advisors, L.L.C.12220 El Camino Real, Suite 320San Diego, CA 92130www.softwareequity.comp: (858) 509-2800
The information contained in this Report is obtained from sources we believe to be reliable, but no representation or guarantee is made about the accuracy or completeness of such information, or the opinions expressed herein. Nothing in this Report is intended to be a recommendation of a specific security or company or intended to constitute an offer to buy or sell, or the solicitation of an offer to buy or sell, any security. SEG Capital Advisors LLC may have an interest in one or more of the securities or companies discussed herein. Financial data provided by Capital IQ.
This Report may not be reproduced in whole or in part without the expressed prior written authorization of SEG Capital Advisors, L.L.C.Software Equity Group registers each Report with the U.S. Copyright Office and vigorously enforces its intellectual property rights.
ABOUT SOFTWARE EQUITY GROUP
74