Embed Size (px)
Citation preview
The Solow productivity paradox: what docomputers do to productivity?
J A C K E. T R I P L E T T Brookings Institution
“You can see the computer age everywhere but in the productivity statistics.” Robert Solow, New York Review of Books, July 12, 1987
Solow’s aphorism, now more than ten years old, is often quoted. Is there aparadox? And if so, what can be said about it? This paper reviews and assessesthe most common ‘explanations’ for the paradox. It contains separate sectionsevaluating each of the following positions:
(1) You don’t see computers ‘everywhere,’ in a meaningful economic sense.Computers and information processing equipment are a relatively small share ofGDP and of the capital stock.(2) You only think you see computers everywhere. Government hedonic priceindexes for computers fall ‘too fast,’ according to this position, and thereforemeasured real computer output growth is also ‘too fast.’(3) You may not see computers everywhere, but in the industrial sectors whereyou most see them, output is poorly measured. Examples are finance andinsurance, which are heavy users of information technology and where even theconcept of output is poorly specified.(4) Whether or not you see computers everywhere, some of what they do is notcounted in economic statistics. Examples are consumption on the job,convenience, better user-interface, and so forth.(5) You don’t see computers in the productivity statistics yet, but wait a bit andyou will. This is the analogy with the diffusion of electricity; the idea that theproductivity implications of a new technology are only visible with a long lag.(6) You see computers everywhere but in the productivity statistics becausecomputers are not as productive as you think. Here, there are many anecdotes,such as failed computer system design projects, but there are also assertionsfrom computer science that computer and software design has taken a wrong turn.(7) There is no paradox: some economists are counting innovations and newproducts on an arithmetic scale when they should count on a logarithmic scale.
Canadian Journal of Economics Revue canadienne d’Economique, Vol. 32, No. 2April / avril 1999. Printed in Canada Imprimé au Canada
0008-4085 / 99 / 309-334 $1.50 Canadian Economics Association©
310 Jack E. Triplett
1. Background
On its face, the computer productivity paradox concerns the question: Why isn’tU.S. output growing faster as we invest more in computers? But Solow’saphorism gains its resonance from a different, though related, question: Will thegrowing investment in computers and information technology reverse thepost-1973 productivity slowdown? From 1948 to 1973, multi-factor productivityincreased 1.9 percent per year in the U.S., and labour productivity grew at therate of 2.9 percent; after 1973, these productivity growth rates were 0.2 percentand 1.1 percent. Similar slowdowns have been observed in most of the1
industrialized economies of the OECD.Another part of the context is the mechanism for diffusion of technical change.
The view held by many economists is that productivity improvements are carriedinto the workplace through investment in new machinery. On this view, anytechnical change we are now experiencing must be embodied in the economy’sinvestment in information technology, because that is the kind of machineryinvestment that is growing. Investment in information processing equipmentaccounted for about 34 percent of producer durable equipment investment in1997, which is more than the share of industrial machinery (22 percent). 2
There is substantial debate on this ‘new machinery’ view. It must obviouslybe true at some level that new technology implies new machines. But it is notobvious that new machines are the entire engine for improving productivity. Infact, if one correctly accounts for the enhanced productiveness of new machines(by making a quality adjustment to the data on capital inputs) then improvedmachinery will not, by itself, raise multi-factor productivity, though it shouldincrease ordinary labour productivity.
The computer-productivity paradox also resonates because we have become,as it is often said (but not often quantified), an information economy. It is oftensaid that quality change is a much larger proportion of final output today than itwas in the past, and that quality change, more customized products, and thegrowth of services--as business inputs, as elements of consumer demand, and ascontributors to U.S. exports--all mean that information is a much more importantcontributor to the production process than it used to be. If it is true that the useof information as a productive input is growing, or that information has becomea more productive input, then this heightened role for information heightens aswell the importance of information technology in a modern economy.
Thus, the context in which the Solow productivity paradox is interestingrevolves around a number of unresolved economic issues and questions. Thereis the post-1973 productivity slowdown, a puzzle that has so far resisted allattempts at solution. There is the supposed recent shift from a goods economyto a services economy (actually, this is not all that recent; even in 1940, morethan half of U.S. employment was outside the traditional goods-producingsectors ). There is the shift to an ‘information economy’ from whatever3
Solow productivity paradox 311
characterized the economy before (surely not absence of information, but perhapsinformation was less abundant because it was more costly). None of theseeconomic shifts is very well understood. Understanding them is important for awide range of economic policy issues, ranging from the role of education andtraining in the economy, to the role of investment (and therefore of incentives forand taxation on investment), to the determinants of economic growth, toforecasting the future trends of income distribution, and so forth. For each of theissues, it is thought that computers and the contribution of information technologyare key. For example, Kreuger (1993) found that workers who use computershave higher earnings than workers who do not, suggesting that the adverse shiftsin income and earnings distributions in the United States in recent years areconnected with the growth of computers. Again, there is debate on this view:computers are sometimes substituted for human capital, reducing the demand forskill in jobs.
One should note a strong view against coupling the Solow paradox with someof these other issues. Griliches (1997), for example, has stated:
“But then we’re still stuck with the problem about the productivity slowdown, orparadox, which is a problem, but not a computer problem. Is the slowdown real ornot? Or is it all a measurement issue? And more important, is it permanent, or is ittransitory? Here the paradox is really not so much in terms of computers, but interms of what is happening to science, what is happening to inventiveness, what ishappening to other activities.”
This paper reviews seven positions on the computer productivity paradox.
2. You don’t see computers ‘everywhere,’ in a meaningful economic sense
In this view, what matters is the share of computers in the capital stock and in theinput of capital services. These shares are small. An input with a very smallshare cannot make a large contribution to economic growth, and so we should notexpect to see a major impact on growth from investment in computers. (In theremainder of this paper, I use the terms ‘computers’ and ‘computer equipment’ --computers plus peripheral equipment -- interchangeably; ‘information processingequipment’ is a broader category that contains computer equipment as one of itscomponents--see note 3.)
The most comprehensive explorations are Oliner and Sichel (1994) andJorgenson and Stiroh (1995). Both papers evaluate the growth accountingequation:
d Y = s d K + s d K + s d L + d ð (1)t c t c nc t nc L t t
where d Y = dY/dt denotes the rate of growth of output; d K , d K and d L aret t c t nc t
rates of growth of the inputs K which is computer capital (property, computerc
capital services), K which is non-computer capital (services), and L which isnc
labour; s which is the share of input I; and d ð is the growth of multifactori t

312 Jack E. Triplett
productivity. This equation says that the rate of growth of output (d Y) equals thet
share-weighted growth in inputs (for example, s d K is the rate of growth ofc t c
computer capital, weighted by the share of computer capital in total cost), plusthe rate of growth of multifactor productivity.
Jorgenson and Stiroh (1995) estimate the share of capital services providedby computer equipment capital using the capital accounting frameworkdeveloped by Jorgenson (1980, 1989); Oliner and Sichel (1994) use computerequipment’s income share. As table 1 shows, the results of both papers arecompatible. Computer equipment made a relatively small contribution toeconomic growth, even during the period of the 1980’s when computertechnology became so widely diffused throughout the economy. In the growthaccounting framework of equation (1), even rapid rates of input growth—and thegrowth of computing equipment has been rapid indeed—make relatively smallcontributions to growth when the share of this equipment is small. As table 2shows, computer equipment still accounts for only around 2 percent or less of thephysical capital stock , and under 2 percent of capital services.4
TABLE 1Contributions of computers, information equipment and softwareto economic growth
Oliner and Sichel Jorgenson and Stiroh (1994) (1994)a d
1970-79 1980-92 1979-85 1985-90 1990-96Output growth rateaverage annual rate 3.42 2.27 2.35 3.09 2.36
Contributions of computing equipment 0.09 0.21 0.15 0.14 0.12
Information processing equipment 0.25 0.35 n.a. n.a. n.a.b b
Computing hardware, software and labour, combined (1987-93) n.a. 0.40 n.a. n.a. n.a.c
Oliner and Sichel (1994), Table 3, page 285, unless otherwise noted.a
Oliner and Sichel (1994), Table 10, page 305.b
Oliner and Sichel (1994), Table 9, page 303: note that the time period differs from thec
other two lines. Jorgenson and Stiroh (1994): Updated tables supplied by the authors.d
Oliner and Sichel also enlarge the definition of computers to encompass allof information processing equipment (their table 10, page 305) and alsocomputing software and computer-using labour (their table 9, page 303). Theresult remains unchanged. On any of these three definitions--computer equipment,information processing equipment, or the combination of computing hardware,
Solow productivity paradox 313
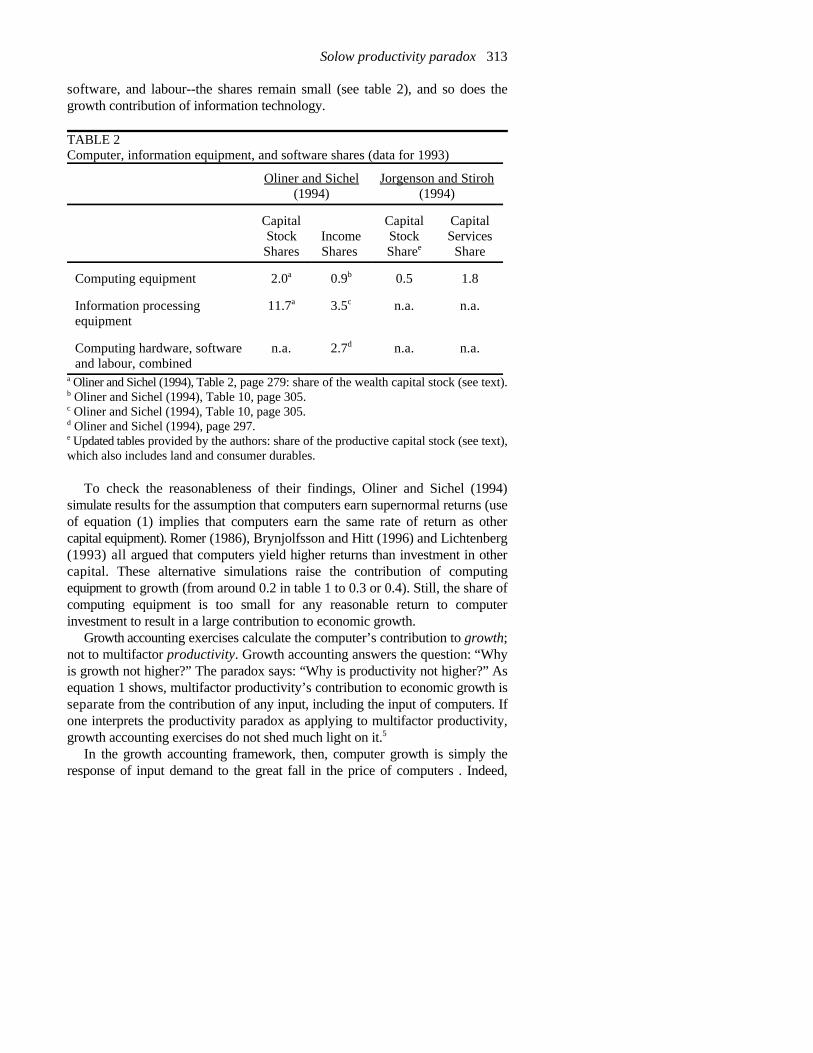
software, and labour--the shares remain small (see table 2), and so does thegrowth contribution of information technology.
TABLE 2Computer, information equipment, and software shares (data for 1993)
Oliner and Sichel Jorgenson and Stiroh(1994) (1994)
Capital Capital CapitalStock Income Stock ServicesShares Shares Share Sharee
Computing equipment 2.0 0.9 0.5 1.8a b
Information processing 11.7 3.5 n.a. n.a.equipment
a c
Computing hardware, software n.a. 2.7 n.a. n.a.and labour, combined
d
Oliner and Sichel (1994), Table 2, page 279: share of the wealth capital stock (see text).a
Oliner and Sichel (1994), Table 10, page 305.b
Oliner and Sichel (1994), Table 10, page 305.c
Oliner and Sichel (1994), page 297.d
Updated tables provided by the authors: share of the productive capital stock (see text),e
which also includes land and consumer durables.
To check the reasonableness of their findings, Oliner and Sichel (1994)simulate results for the assumption that computers earn supernormal returns (useof equation (1) implies that computers earn the same rate of return as othercapital equipment). Romer (1986), Brynjolfsson and Hitt (1996) and Lichtenberg(1993) all argued that computers yield higher returns than investment in othercapital. These alternative simulations raise the contribution of computingequipment to growth (from around 0.2 in table 1 to 0.3 or 0.4). Still, the share ofcomputing equipment is too small for any reasonable return to computerinvestment to result in a large contribution to economic growth.
Growth accounting exercises calculate the computer’s contribution to growth;not to multifactor productivity. Growth accounting answers the question: “Whyis growth not higher?” The paradox says: “Why is productivity not higher?” Asequation 1 shows, multifactor productivity’s contribution to economic growth isseparate from the contribution of any input, including the input of computers. Ifone interprets the productivity paradox as applying to multifactor productivity,growth accounting exercises do not shed much light on it.5
In the growth accounting framework, then, computer growth is simply theresponse of input demand to the great fall in the price of computers . Indeed,
314 Jack E. Triplett
Jorgenson, in conference presentations, has emphasized this exact point, as hasStiroh (1998). The enormous price decline in computing power has led to itssubstitution, in a standard production analysis framework, against all other inputs,including other kinds of investment. From this perspective, the economic impactof the computer is not a productivity story at all.
One reservation about this input substitution view arises because computeroutput (and therefore computer capital input) is estimated by deflation, usinghedonic computer price indexes. Price and quantity are not independentlyestimated. Some have argued that the computer price declines are overstated (seethe next section); if price declines are overstated, the growth of computer inputsis also overstated, and there is less substitution than the data suggest.
A second reservation arises because many economists seem to think that theamount of innovation they see in the economy—the number and pervasivenessof new products, embodying new methods of production, and new technologicalfeats—are more than one could reasonably expect just from input substitution.On this view, there must also be a mismeasurement story, and therefore a missingproductivity story, regardless of the validity of the input substitution story. Thisview is discussed in section 8, below.
A third reservation is that aggregate labour productivity is also low; not justmultifactor productivity. If computers just substituted against other inputs, thenlabour productivity should grow (because of increased capital per worker), eventhough multifactor productivity does not. Stiroh (1998) shows just that at theindustry level: more intensive computer usage raises industry labour productivitythrough input substitution, but it does not raise industry multifactor productivity.At the aggregate level, the share of computers is too small to make a majorimpact on either output growth or labour productivity.
Flamm (1997) has in effect (though not explicitly) reinterpreted the Solowproductivity paradox as a semiconductor paradox: You see the semiconductorage everywhere (and not just in the computer industry). Price indexes forsemiconductors have dropped even more rapidly than computer prices (see thediscussion in section 3), and semiconductors go into other kinds of machinery(antilock brakes and ‘intelligent’ suspension systems on automobiles, forexample). Flamm calculates the consumer surplus from declining semiconductorprices at around 8 percent of annual GDP growth, which cumulates to a hugenumber over the 50-year history of semiconductors. For the analysis of theproductivity paradox, Flamm’s results do not permit distinguishing the part of thedemand for semiconductors that arises because of input substitution (thesubstitution of computers and other semiconductor-using equipment againstinputs that do not use semiconductors), and the part of semiconductor demandthat arises because they improve the productivity of using industries (if indeedthey do affect productivity). However, Flamm estimates the output growthelasticity of demand for semiconductors at roughly eight times their priceelasticity of demand, and his percentage point estimate of semiconductor
Solow productivity paradox 315
contribution to GDP is around 0.2 for recent years: a number that is, perhapsfortuitously, similar to the growth accounting calculations for computers.
In summary, according to this view computers make a small contribution togrowth because they account for only a small share of capital input. Does thesame small share suggest that they likewise cannot have a large impact onproductivity? Perhaps. But the paradox remains a popular topic for other reasons.
3. You only think you see computers everywhere
The contention that computer price indexes fall too fast (and therefore computerdeflated output rises too rapidly) has several lines of logic, which are notparticularly connected.
Denison (1989) raised two different arguments against the BEA hedoniccomputer price indexes. He contended, first, that the decline in the computerprice indexes was unprecedented, and hence suspect. We can put this aside. TheU.S. price indexes for computers have been replicated for other countries, withsimilar results (see, for example, Moreau 1996 for France and Harhoff and Moch1997, for Germany). Hedonic price indexes for semiconductors fall even morerapidly. Trajtenberg (1996) shows that hedonic price indexes for CAT scanners6
also have computer-like declines, and Raff and Trajtenberg (1997) show similarlarge declines in hedonic price indexes for automobiles in the early years of thecentury. Most of these price declines have been missed by conventionaleconomic statistics (automobiles did not get into U.S. government price statisticsuntil the third and fourth decades of the century, and one cannot even determinefrom government statistics how much high-tech scanning equipment hospitalsbuy). The computer price declines seemed to Denison unprecedented becausesimilar price declines had not been published.
Denison’s second argument (one he would levy against all of the aboveindexes) was that hedonic price indexes were conceptually inappropriate fornational accounts. He thought hedonic price indexes measured willingness to payfor quality improvements (the demand side) and not the cost of producingimproved quality (the supply side). However, in Triplett (1983, 1989) I showedthis is incorrect, even when relevant. McCarthy notes: hedonic measures can begiven both supply-side and demand-side interpretations. Denison also suggestedthat demand-side and supply-side measures would diverge in the case ofcomputers, but there is no evidence of this (see Triplett 1989). There is littlecurrent support for Denison’s position that hedonic indexes are inappropriate, soit is not necessary to consider these arguments further.
A second major line of reasoning on hedonic computer price indexes pointsto what is actually done with the personal computers that sit on so many of ourdesks. Many users have noted something like the following: “I used perhaps aquarter of the capacity of the old computer that sat on my desk. Now I have anew one for which I use perhaps a tenth of its capacity. Where is the gain?”
316 Jack E. Triplett
McCarthy (1997, paragraphs 4 and 15) expresses a similar view:
“...The theoretical increase in [computers’] potential output, as measured by theincreases in their input characteristics, is unlikely to ever be realized in practice....Also, the increasing size and complexity of operating systems and software arelikely to be resulting in increasing relative inefficiencies between the hardware andsoftware.... The greater complexity means that some part of the increased computerspeed is diverted from the task of processing to handling the software itself.”
In other words, ever more powerful personal computers wind up being used totype letters, and the letters are not typed appreciably faster. Is that not evidencethat the computer price indexes are falling too fast?
This is not evidence. Typing a letter uses computer hardware, computersoftware, and the input from the person (increasingly, not a secretary) who typesit. The technical bottleneck is often the human input. But this hardly justifiesrevising upward the price index for the computer. The computer is purchased, thecapacity is paid for, and any assertion that the purchaser could have made dowith an earlier vintage is, even if proven, not relevant. And indeed, it is notproven. Increased computer capacity has been employed in an effort to makecomputing more efficient and user-friendly; not just faster (but see sections 5 and7).
A third issue has emerged in the work of McCarthy (1997), a paper of interestto OECD countries considering following the U.S. lead on hedonic price indexesfor computers. McCarthy observes that price indexes for software typically donot exist, and speculates that software prices decline less rapidly than computerprices. Actually, price indexes for word processing packages, spreadsheets, anddatabase software have been estimated (Gandal 1994, Oliner and Sichel 1994,and Harhoff and Moch 1997). This research confirms that software prices havebeen declining steadily, but not at computer-like rates.
McCarthy then contends that because software is bundled with computers theslower price decline of software implies downward bias for the computer priceindex:
“The overall quality of a computer package (hardware and all the associatedsoftware) has not been rising as rapidly as that of the hardware input characteristicson which the hedonic estimates of quality improvement are based. As a result, thequality adjustments being used in the estimation of the price deflators for computerinvestment are being overstated which leads to the price falls in computerinvestment also being overstated.”
McCarthy (1997, paragraph 18)
The issue can be addressed more cogently if McCarthy’s argument is re-statedas follows. A computer price index can be thought of as a price index forcomputer characteristics. Suppose that hedonic functions are linear, and that theprice index is also linear (a Laspeyres index). Then if there are three7
characteristics bundled into a personal computer --computer speed (s), computer
Solow productivity paradox 317
memory (m), and computer software (z)--we have:
I = aI + bI + cI (2)c s m z
where a, b, and c are weights. The proper price index for computers (I ) is ac
weighted average of price indexes for all three characteristics, or components,that are bundled into the computer transaction. However, the third characteristic,computer software that is bundled into the computer without a separate charge,is omitted from the computer price index. Because it has a price decline lowerthan the other two characteristics (I < I , I ), the computer price index based onz s c
the two characteristics will fall too fast. The same argument applies, in amodified form, if a price index for computer hardware is used in nationalaccounts to deflate both computer hardware and software (perhaps because noseparate software index is available).
If hedonic computer price indexes were constructed according to the ‘priceindex for characteristics’ method given by equation (2), I would agree they wouldbe downward biased. The bias would be the same if we calculated real computerinvestment growth as the weighted average of growth rates of hardwarecharacteristics (the form in which McCarthy cast his illustration).
But considering the actual calculations, omission of software biases thecomputer price indexes upward, which is the opposite direction from McCarthy’scontention. Computer price indexes are actually calculated by quality adjustingobserved computer prices for the value of changes in hardware characteristics.We observe prices of two different computers, P and P , where each computerc1 c2
consists of a different bundle of speed, memory, and software. The hedonicregression coefficients on computer hardware (speed and memory) are used toadjust the price difference between the two computers for changes in thecomputer’s hardware (that is, its speed and its included memory). We have, then:
(P )* = P (h [s /s ] + h [m /m ]) (3) c1 c1 s 2 1 m 2 1
where the term on the left-hand side is the quality-adjusted price of computer 1;and on the right-hand side, h is the hedonic ‘price’ for characteristic I; and s andi
m are, respectively, speed and memory, subscripted for computer 1 and computer2. The price index uses this quality-adjusted price in:
I = P / (P )*. (4) c c2 c1
Equation (4) contains no adjustment for the quantity of bundled software (i.e.,h [z /z ]). If more or improved software is included, the quality adjustment inz 2 1
equation (3)-- (h [s /s ] + h [m /m ])--is too small, not too large, because thes 2 1 m 2 1
improvement in software receives no adjustment. The adjusted price, (Pc1)*, istoo low (not too high), so that the computer price index falls too slowly--it isbiased upward, not downward, contrary to McCarthy’s contention. 8
Whether software prices are declining faster than hardware prices, or whetherthe quantity of software (bundled with the hardware) grows less rapidly than the
318 Jack E. Triplett
rate of improvement in hardware characteristics like speed and memory, is notthe issue. The price index for the computer-software bundle does not decline fastenough because no adjustment is made for the value of the increased quantity ofsoftware included in the bundle. Its quantity is treated as zero.
My own view on this matter agrees with Griliches (1994, p. 6), who indiscussing BEA computer price indexes, wrote:
“ There was nothing wrong with the price index itself. It was, indeed, a majoradvance...but...it was a unique adjustment. No other high-tech product had receivedparallel treatment....”9
4. You may not see computers ‘everywhere,’ but in the industrial sectorswhere you most see them, output is poorly measured
Griliches (1994) noted that more than 70% of private sector U.S. computerinvestment was concentrated in wholesale and retail trade; finance, insurance andreal estate; and services (divisions F, G, H, and I of the 1987 Standard IndustrialClassification System). These are exactly the sectors of the economy where10
output is least well measured, and where in some cases even the concept ofoutput is not well defined. Thus Griliches writes:
“Why has this [computer investment] not translated itself into visible productivitygains? The major answer to this puzzle is very simple: ...This investment has goneinto our ‘unmeasurable sectors,’ and thus its productivity effects, which are likelyto be quite real, are largely invisible in the data.”
Griliches (1994, 11)
That there are serious measurement problems in all of these areas is wellestablished. Griliches (1992) is an example of a long history of attempts tosharpen measurement methods and concepts for services. Triplett (1992) presentsan additional review of the conceptual issues in measuring banking output, andSherwood (1999) discusses the insurance measurement problem.
It is also the case that services account for a large part of output. Services thatdirectly affect the calculation of GDP are those in personal consumptionexpenditures (PCE) and in net exports (and of course the output of the entiregovernment sector is notoriously mismeasured). Consumption of non-housing11
services accounts for about 43 % of personal consumption expenditures, or 29% of GDP, and net export of services is about 1.3% of GDP.
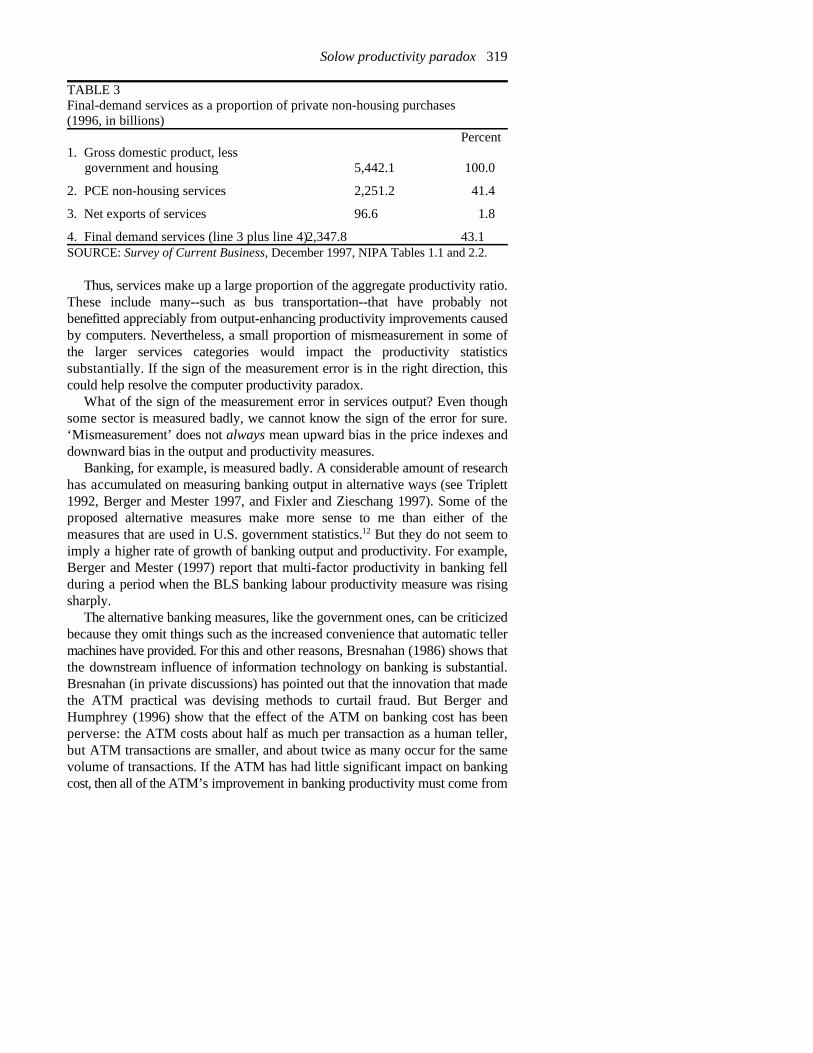
The productivity numbers are not calculated for total GDP. One widely-usedBLS productivity calculation refers to the private business economy. It isdifficult to break out an explicit services component for that aggregate. However,government and housing are excluded from private business, and one can removethese components from GDP to approximate the private business (farm and non-farm) economy (see table 3). PCE non-housing services plus net export ofservices amounts to about 43 % of final private sector non-housing demand.
Solow productivity paradox 319
TABLE 3Final-demand services as a proportion of private non-housing purchases(1996, in billions)
Percent1. Gross domestic product, less government and housing 5,442.1 100.0
2. PCE non-housing services 2,251.2 41.4
3. Net exports of services 96.6 1.8
4. Final demand services (line 3 plus line 4)2,347.8 43.1SOURCE: Survey of Current Business, December 1997, NIPA Tables 1.1 and 2.2.
Thus, services make up a large proportion of the aggregate productivity ratio.These include many--such as bus transportation--that have probably notbenefitted appreciably from output-enhancing productivity improvements causedby computers. Nevertheless, a small proportion of mismeasurement in some ofthe larger services categories would impact the productivity statisticssubstantially. If the sign of the measurement error is in the right direction, thiscould help resolve the computer productivity paradox.
What of the sign of the measurement error in services output? Even thoughsome sector is measured badly, we cannot know the sign of the error for sure.‘Mismeasurement’ does not always mean upward bias in the price indexes anddownward bias in the output and productivity measures.
Banking, for example, is measured badly. A considerable amount of researchhas accumulated on measuring banking output in alternative ways (see Triplett1992, Berger and Mester 1997, and Fixler and Zieschang 1997). Some of theproposed alternative measures make more sense to me than either of themeasures that are used in U.S. government statistics. But they do not seem to12
imply a higher rate of growth of banking output and productivity. For example,Berger and Mester (1997) report that multi-factor productivity in banking fellduring a period when the BLS banking labour productivity measure was risingsharply.
The alternative banking measures, like the government ones, can be criticizedbecause they omit things such as the increased convenience that automatic tellermachines have provided. For this and other reasons, Bresnahan (1986) shows thatthe downstream influence of information technology on banking is substantial.Bresnahan (in private discussions) has pointed out that the innovation that madethe ATM practical was devising methods to curtail fraud. But Berger andHumphrey (1996) show that the effect of the ATM on banking cost has beenperverse: the ATM costs about half as much per transaction as a human teller,but ATM transactions are smaller, and about twice as many occur for the samevolume of transactions. If the ATM has had little significant impact on bankingcost, then all of the ATM’s improvement in banking productivity must come from
320 Jack E. Triplett
consumer valuation, at the margin, for increased convenience. But since the ATMservice has typically not been charged for until recently, one must estimateconsumer surplus and add it into the banking output measure, to get an estimateof the contribution of technology to banking output and productivity.
Would adding an allowance to banking output for the convenience of ATM’syield a large upward adjustment? Frei and Harker (1997) reported that one largebank which aggressively tried to reduce customer access to human tellers veryquickly lost a substantial amount of its customer base. Beyond some point ofutilization, the value of the ATM falls below the value of the human teller.
Adding a valuation for ATMs would probably increase the measured rate ofgrowth of banking output and therefore increase banking productivity. Improvedmeasurement of banking and financial output might therefore help to resolve theparadox. But, as the foregoing suggests, the magnitudes are not clear.
Some economists have approached the measurement problem in services byexamining circumstantial, as it were, evidence of anomalous behaviour of thestatistics in some of these badly measured areas. For example, Stiroh (1998)extends Jorgenson and Stiroh’s (1995) methodology to analyze the contributionto growth of computers at the sectoral level. He identifies, from among 35industrial sectors, the most computer intensive sectors. His computer-usingservices sectors are Griliches’ poorly measured ones--wholesale and retail trade,finance, insurance and real estate, and services (SIC division I).
Stiroh finds that noncomputer input growth decreased as the use of computercapital services increased in these computer intensive sectors. Cheapercomputers substituted for other inputs, including labour. But measured outputgrowth rates increased less rapidly as well: “For all computer-using sectors ... theaverage growth rate of multifactor productivity fell while [computer] capitalgrew” (Stiroh 1998). An inverse correlation between computer investment andmultifactor productivity growth does seem anomalous. See also Morrison andBerndt (1991) for a compatible result. Either computers are not productive, oroutput growth is undercounted. This anomaly is consistent with the ‘badlymeasured services’ hypothesis. However, it also emerges in Stiroh’s results forcomputer-intensive manufacturing industries, such as stone, clay and glass, whereoutput measurement problems are, if not absent, not well publicized.
Prescott (1997) noted that prices of consumption services that he regards as‘badly defined’ (personal business, which includes finance and insurance fromGriliches’ list, plus owner-occupied housing, medical care, and education) rose64 percent between 1985 and 1995, while ‘reasonably-well defined services’ (theothers) rose only 40 percent. He felt this implied measurement error in the formerprices. The evidence of price divergence is not compelling in itself (no13
economic principle suggests that prices should always move together--it iscommonplace in price index theory that relative prices do diverge). But if theprice indexes are overstated, then deflated output growth and multifactorproductivity growth are both understated.
Solow productivity paradox 321
The Boskin Commission estimated that the CPI (which provides deflators formany components of PCE) was overstated in recent years by 1.1 percent, ofwhich approximately 0.4 percentage points was mismeasurement of prices forconsumer services. Most of that would translate into error in deflated output ofservices in the productivity measures. For measurement error to explain the14
slowdown in economic growth, real consumption, or productivity requires eitherthat measurement error increased after 1973, or that the shares of the badlymeasured sectors increased. There is little evidence for the former, and althoughservices have increased, their shares have not grown by as much as productivitydeclined. Moreover, any increasing measurement error must have occurredgradually; yet the productivity slowdown was abrupt. I doubt this can explain thepost-1973 slowdown of real per capita consumption and productivity.
Overall, mismeasurement of services probably has the right sign to resolve theparadox. But does the mismeasurement hypothesis (as typically stated) haveenough strength to resolve the paradox? My own guess is that it does not.
5. Whether or not you see computers everywhere, some of what they do isnot counted in economic statistics
An enormous amount of recent computer and software development has beendirected toward making computers easier to use. For example, when theBrookings Institution converted to Windows 95, they gave us as a manual“Windows For Dummies.” On page 12 of this manual I read:
“Windows fills the screen with lots of fun little boxes and pictures. DOS is forpeople who never put bumper stickers on their cars.”
But then the manual points out, correctly, that pictures require much morecomputing power, so using Windows 95 requires a relatively powerful computer.
Where do we count the value of increased convenience and better userinterface in economic statistics? If they are productive, then the improvement willshow up in the productivity figures, or at least in the labour productivity data. Onthe other hand, if the pictures are just more ‘fun,’ then these have created moreconsumption on the job. Consumption on the job is not counted in economicstatistics. If more advanced computer software contributes partly to output andpartly to making workers more content, some of that gain will be lost in economicstatistics.
Whether the newest developments in software and computers have in factmade computers that much more user-friendly is also an unresolved issue.Whether the benefits are worth the changeover cost is another unsettled issue (seesection 6).
The computer facilitates the reorganization of economic activity, and the gainsfrom reorganization also may not show up in economic statistics. The followingexample (but not the analysis) comes from Steiner (1995).
322 Jack E. Triplett
Consider a not so hypothetical toy company that once manufactured toys inthe United States. The computer, and faster and cheaper telecommunicationsthrough the Internet, has made it possible to operate a toy business in a globallyintegrated way. Today, the company’s head office (in the U.S.) determines whattoys are likely to sell in the United States, designs the toys, and plans themarketing campaign and the distribution of the toys. But it contracts all toymanufacturing to companies in Asia, which might not be affiliated with the U.S.company in any ownership way. When the toys are completed, they are shippedfrom the Asian manufacturer to U.S. toy retailers; thus, this U.S. toy companyhas no direct U.S. wholesale arm either. The billing and financial transactions arehandled in an offshore financial center in the Bahamas. The computer andadvanced information technology have made it possible for this company tolocate the activities of manufacturing, distribution, financial record-keeping andso forth around the world where costs are lowest.
From the standpoint of the stockholders and company management, thecomputer has permitted vast increases in the profitability of this company. Butwhere do these gains show up in U.S. productivity statistics?
In this case, the computer may have increased the productivity of Asian toymanufacturers, of Liberian shipping companies, and of Caribbean banking andpayments establishments, by giving them better access to American markets andAmerican distribution. The only activity left in the United States is the toycompany’s head office. What is the measure of ‘output’ of a head office?
If the impact of computers on the toy company’s profitability does enhanceU.S. productivity, calculating the computer’s productivity effect requiresdetermining ways to account for the design, marketing, distribution, andcoordinating activities of the U.S. head office. Those are service activities wherethe outputs are presently imperfectly measured.15
6. You don’t see computers in the productivity statistics yet, but wait a bitand you will16
David (1990) has drawn an analogy between the diffusion of electricity andcomputers. David links electricity and computers because both “form the nodalelements” of networks and “occupy key positions in a web of stronglycomplementary technical relationships.” Because of their network parallels,David predicts that computer diffusion and the effects of computers onproductivity will follow the same protracted course as electricity:
“Factory electrification did not...have an impact on productivity growth inmanufacturing before the early 1920’s. At that time only slightly more than half offactory mechanical drive capacity had been electrified.... This was four decadesafter the first central power station opened for business.”
David (1990, 357)
This idea has received very widespread diffusion in the popular press.
Solow productivity paradox 323
Whether or not the computer’s productive potential has yet to be realized fully(see section 7), I doubt that electricity provides an instructive analogy. Mokyr(1997) warns us that: “Historical analogies often mislead as much as they instructand in technological progress, where change is unpredictable, cumulative, andirreversible, the analogies [are] more dangerous than anywhere.” The networkingproperties of computers and electricity may or may not be analogous, but thecomputer differs fundamentally from electricity in its price behaviour, andtherefore in its diffusion pattern.
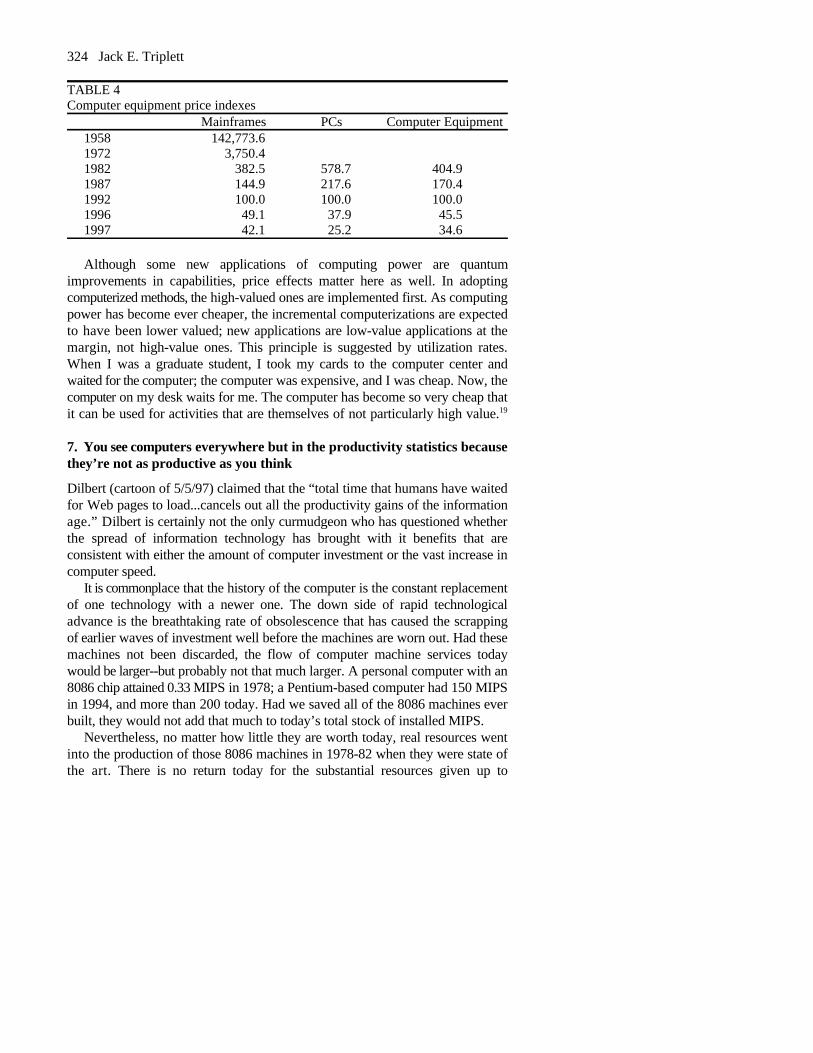
More than four decades have passed since the introduction of the commercialcomputer. The price of computing power is now less than one-half of one-tenthof 1 percent (0.0005) of what it was at its introduction (see table 2). In about 45years, the price of computing power has declined more than two thousand fold.No remotely comparable price decreases accompanied the dawning of theelectrical age. David reports that electricity prices only began to fall in the fourthdecade of electric power; and although Nordhaus (1997) estimates that the perlumen price of lighting dropped by more than 85 percent between 1883 and 1920,two-thirds of that is attributable to improved efficiency of the light bulb. Sichel(1997) presents an alternative estimate. Gordon’s (1990) price indexes forelectricity generation equipment only extend to 1947, but there is little to suggestprice declines even remotely in the league with those for computers.
Because their price histories are so different, the diffusions of electric powerand computing power have fundamentally different--not similar--patterns. In thediffusion of any innovation, one can distinguish two sources of demand for it.The innovation may supplant an earlier technology for achieving existingoutcomes—new ways of doing what had been done before. An innovation mayalso facilitate doing new things.
The introduction of electricity did not initially affect what had been donebefore by water power or steam power. Electricity made it possible to locate17
manufacturing plants away from the stream side. That is, the diffusion processfor electricity was initially the diffusion to new ways of doing things. Only aftera long lag did electricity generation affect the things that had been done before.
In the computer diffusion process, the initial applications supplanted oldertechnologies. Water and steam power long survived the introduction of18
electricity; but old, pre-computer age devices for doing calculations disappearedlong ago. In electricity, extensions to new applications preceded the displacementof old methods because the price of electricity did not make the old methodsimmediately obsolescent. In the computer diffusion process, the displacement ofold methods came first, because old calculating machines were made obsolescentby the rapidly falling price of computing power.
324 Jack E. Triplett
TABLE 4Computer equipment price indexes
Mainframes PCs Computer Equipment1958 142,773.61972 3,750.41982 382.5 578.7 404.91987 144.9 217.6 170.41992 100.0 100.0 100.01996 49.1 37.9 45.51997 42.1 25.2 34.6
Although some new applications of computing power are quantumimprovements in capabilities, price effects matter here as well. In adoptingcomputerized methods, the high-valued ones are implemented first. As computingpower has become ever cheaper, the incremental computerizations are expectedto have been lower valued; new applications are low-value applications at themargin, not high-value ones. This principle is suggested by utilization rates.When I was a graduate student, I took my cards to the computer center andwaited for the computer; the computer was expensive, and I was cheap. Now, thecomputer on my desk waits for me. The computer has become so very cheap thatit can be used for activities that are themselves of not particularly high value.19
7. You see computers everywhere but in the productivity statistics becausethey’re not as productive as you think
Dilbert (cartoon of 5/5/97) claimed that the “total time that humans have waitedfor Web pages to load...cancels out all the productivity gains of the informationage.” Dilbert is certainly not the only curmudgeon who has questioned whetherthe spread of information technology has brought with it benefits that areconsistent with either the amount of computer investment or the vast increase incomputer speed.
It is commonplace that the history of the computer is the constant replacementof one technology with a newer one. The down side of rapid technologicaladvance is the breathtaking rate of obsolescence that has caused the scrappingof earlier waves of investment well before the machines are worn out. Had thesemachines not been discarded, the flow of computer machine services todaywould be larger--but probably not that much larger. A personal computer with an8086 chip attained 0.33 MIPS in 1978; a Pentium-based computer had 150 MIPSin 1994, and more than 200 today. Had we saved all of the 8086 machines everbuilt, they would not add that much to today’s total stock of installed MIPS.
Nevertheless, no matter how little they are worth today, real resources wentinto the production of those 8086 machines in 1978-82 when they were state ofthe art. There is no return today for the substantial resources given up to

Solow productivity paradox 325
investment in computers in the relatively recent past. It is not only the hardware. Stories of very expensive ‘computer systems
redesign’ projects are legion. The Wall Street Journal (April 30, 1998, page 1)reported that “42% of corporate information-technology projects were abandonedbefore completion” and “roughly 50% of all technology projects fail to meetchief executives’ expectations.” The ‘year 2000 problem’ could be added to thelist. At the personal computing level, there is the constant churning ofstandardized personal computer operating systems, spreadsheet and wordprocessing packages. Even if every new upgrade were a substantial improvement,there is still the cost of the conversion: many persons within the computerindustry and without have asked whether conversion costs are adequatelyconsidered in the upgrade cycle. But the upgrading process goes on.
Raff and Trajtenberg (1997) show that the quality-adjusted price decline forautomobiles early in their history was comparable to computers. But for a largenumber of car buyers, the Model T proved good enough and they did not needto be on the technological frontier. The failure of the ‘Model T’ to emerge in thecomputer market may reflect fundamental differences in the computer and the carmarkets. If you bought a used Model T you could still drive it on the samehighway that the new one used (you can’t ‘drive’ the old computer on the newhighway). And you could always find someone to fix it. The computer repairindustry has shown nowhere near the growth of the computer industry.
Is all of this upgrading productive or is it wasteful? Informed opinion isdivided. One may do the same word processing tasks with new technology andwith old. What is the value of the marginal improvements in, say, convenienceand speed? They may not, as some users assert, be worth all that much--but theircost is also not high, in the newest technology. Graphics and icons, for example,take a lot of computer capacity; but because machine capacity is cheap in thenewest technology, the incremental cost of providing those is low, so they areprovided in the newest software. From the technologists’ view, they can at smallcost give users a little animated icon to show when a page is printed, instead ofa mundane ‘job printed’ signal. And they can also give software users atremendous range of menu choices at small cost, so why not do it?
The curmudgeon points to the end result of adding all these features: A farfaster computer, with far greater memory capacity, that executes many of its jobsmore slowly than the older, slower machine. More menu choices, too, have costs.
Then too, the user is conscious if the software designer is not, that changeoveritself is costly. The time cost of users is undoubtedly a far greater component20
of the cost of upgrading systems than any of the direct costs associated with thechanges. Typically, only the direct costs are recorded in organizations’ ledgers,but the ‘down time’ associated with changes affects productivity (see Blinder andQuandt 1997).
Computer industry spokespersons are fond of the analogy that says computerindustry technology has given consumers something like a Rolls-Royce that goes
326 Jack E. Triplett
200 miles per hour, gives 500 miles per gallon, and costs $100. The curmudgeonon computer and software progress hears a different story:
“We have the software equivalent of a new toll road for you to drive, but you mustbuy our new Rolls-Royce equivalent computer to use it. And you can’t drive on theold highway, which was already paid for, because we don’t maintain it anymore.”
Moreover, if past decisions on computers have been incorrect orinappropriate, that may also suggest that we have already invested too much incomputers. Computers are less productive than they were thought to be whendecisions were made to ‘computerize.’ That bodes less well for the future.
One final point should be made. One of the computer’s accomplishments mayhave been to cut the cost of various kinds of rent-seeking behaviour, and tofacilitate rivalrous oligopoly behaviour, market sharing strategies, and so forth.The computer has made it possible to execute far more stock markettransactions, for example. Bresnahan, Milgrom and Paul (1992) explored thevalue of enhanced information in the stock market. They concluded thatimproved information did not contribute to productivity because informationreally just affected who received the gains; it did not increase the social gainfrom stock market activity. That suggests the importance of distinguishing thecomputer’s effects on individuals or on firms from effects on the economy--somegains to individuals or to firms at the expense of other individuals or firms, sothat there is no net effect at the economy-wide level.
8. There is no paradox: Some economists are counting innovations and newproducts on an arithmetic scale when they should use a logarithmic scale
For many economists, and especially business economists, the precedingdiscussion will not be satisfactory. We are a ‘new economy,’ in this view,inundated with an unprecedented flow of innovations and new products, and noneof this flow of the new is reflected in the productivity numbers. This neweconomy view is repeated in the newspapers, in business publications and placessuch as Federal Reserve Bank reviews, and we hear it at conferences.
In a way, this new economy view of the paradox is not a computer paradox atall. Rather, people are stacking up and cumulating anecdotes. Those anecdotesabout new products, new services, new methods of distribution and newtechnologies are no doubt often valid observations. Although no one knows howto count the number of these ‘new’ things, I would not seriously dispute theproposition that there is more that is new today than there was at some time in thepast. Yet, these anecdotes lack historical perspective.
To have an impact on productivity, the rate of new product and newtechnology introductions must be greater than in the past. A simple numericalexample makes the point. Suppose all productivity improvements come from thedevelopment of new products. Suppose, further, that in some initial period 100
Solow productivity paradox 327
products existed and that ten percent of the products were new. In the followingperiod, there must be 11 new products to keep the rate of productivity growthconstant, and in the period after that 12 new products are required. At the end of10 years, a constant productivity rate requires 26 new products per year, andafter 20 years, 62 new products and so on.
Most of the anecdotes that have been advanced as evidence for the ‘neweconomy’ amount to assertions that there are a greater number of ‘new’ things.Diewert and Fox (1997, table 5) comment on estimates of the number of productsin the average grocery store. In 1994 there were more than twice as manyproducts in the average grocery store as in 1972 (19,000, compared with 9,000).21
But the 1948-72 rate of increase (from 2,200 in 1948 to 9,000) is over four timesas great as the 1972-94 increase (the intervals 1948-72 and 1972-94 are roughlyequal). Thus it is true that in 1994 there were many more products in grocerystores than there were two decades before, but the rate of increase in newproducts had fallen.
Diewert (1993) cites an example, taken from Alfred Marshall, of a newproduct in the 19th century: Decreased transportation costs, owing to railroads,made fresh fish from the sea available in the interior of England for the first timein the second half of the 19th century. In developing a related point, Mokyr(1997) refers to “the huge improvements in communications in the 19th centurydue to the telegraph, which for the first time allowed information to travel at arate faster than people.... The penny post, invented ... in the 1840s, did anenormous amount for communications -- compared to what was before. Itsmarginal contribution was certainly not less than Netscape’s.”
The numerical example above implied that each new product had the samesignificance as before. In fact, new products of the 1990’s must equal thesignificance of automobiles and appliances in the 1920’s and 1930’s (home airconditioning first became available in the early 1930’s, for example), and oftelevision and other communications improvements in the 1940’s and 1950’s(mobile telephones, for example, were introduced in the 1940’s). If the averagesignificance of new products in the 1990’s is not as great as for individual newproducts from the past, then the number of them must be greater still to justify thenew economy view of the paradox.
The same proposition holds for quality change. It is amazing to see qualityimprovements to automobiles in the 1990’s, great as they have been, held up aspart of the unprecedented improvement story, or--as in a press account I readrecently--quality change in automobiles given as an example of the new economy,contrasted with a ton of steel in the old. Actually, the first thing wrong with thatcontrast is that quality change in a ton of steel has been formidable. Second,quality change in autos is a very old problem in economic statistics; it did notemerge in the 1990’s as a characteristic of the new economy. Hedonic priceindex methodology was developed in the 1930’s to deal with quality change inautomobiles (Court, 1939). The study by Raff and Trajtenberg (1997) suggests
328 Jack E. Triplett
that the rate of quality improvement in automobiles was greater in the firstdecade of the twentieth century than in its last decade.
I believe that the number of new products and ‘new things’ is greater thanbefore. But that is not the question. The proper question is: Is the rate ofimprovement, the rate of introduction of new things, unprecedented historically?I do not believe we know the answer to that question.
Thus, the paradox has gained acceptability partly because some economistshave mistakenly been counting new innovations on an arithmetic scale, and--finding more of them--have thought they have evidence confirming the paradox.They ought to be looking at a logarithmic scale, a scale that says you must turnout ever greater numbers of ‘new things’ to keep the current rate of ‘new things’up to the rates of the past.
We look at the new products and new technical changes at the end of the 20thcentury, and we are impressed. We should be. But are they increasing at anincreasing rate? Is the number of new products increasing more rapidly on alogarithmic scale? I think it safe to assert that the empirical work in economichistory that would confirm the increasing rate hypothesis has not been carriedout.
Notes
The first draft of this paper was written while the author was Chief Economist, Bureau ofEconomic Analysis. Copies of the paper can be obtained from the author at: BrookingsInstitution, 1775 Massachusetts Ave. NW, Washington, DC 20036, phone 202-797-6134or e-mail: [email protected] U.S. Department of Labor (1998, and website).2 In 1977, the shares were 22 percent for information equipment and 26 percent for
industrial equipment (data provided by Nicole Spugnardi at the BEA). “Informationprocessing and related equipment” in the BEA data includes the categories office,computing and accounting machinery (which in turn includes computers and peripheralequipment), communication equipment, instruments, and photocopy and relatedequipment. Computer equipment in 1997 amounted to about 40 percent of informationprocessing equipment, and about 14 percent of producer durable equipment investment.
3 The goods-producing industries, agriculture, forestry and fishing, mining,manufacturing, and construction accounted for 49 percent of employed persons, and 49percent of the “experienced labour force,” in the 1940 Census (Statistical Abstract ofthe United States, 1944, table no. 128, pp. 116-118).
4 Oliner and Sichel (1994) figure for computing equipment’s share of the wealth capitalstock (2.0 percent) is higher than Jorgenson and Stiroh’s share of the productivecapital stock (0.5 percent) partly because Jorgenson and Stiroh’s capital stock includesland and consumer durables.
5 Alternatively, if one thought the Solow paradox referred to labour productivity, thengrowth in computer input will affect labour productivity even if it does not affectmultifactor productivity. It seems to me, as it has seemed to others (see David 1990),that Solow must have been talking about multifactor and not labour productivity. In anycase, labour productivity also slowed after 1973 and has not revived.
Solow productivity paradox 329
6 The major empirical work on semiconductor price indexes is Flamm (1993, 1997),Dulberger (1993), and Grimm (1998). Triplett (1996) compares computer,semiconductor, and semiconductor manufacturing equipment price indexes.
7 Without these two simplifying expositional assumptions, the price index becomes avery complicated construction, as I indicated in Triplett (1989), and it undulycomplicates the exposition for no gain for present purposes. Empirically, however, themeasurement is sensitive to both assumptions.
8 The exclusion of software from the hedonic regression does not necessarily bias thecoefficients of the included variables. The bias to the price index from omittedvariables might go either way, depending on the unknown correlation between includedand excluded variables, and on the unobserved movement of the excluded variable(s).
9 In the interval following BEA’s introduction of the hedonic computer equipment priceindexes in 1985, they were not extended owing to a combination of factors: (a)Shortage of resources within BEA. Though there was something to this, the “BoskinInitiative” to improve economic statistics came along soon after (1989), and there wereno hedonic projects in the Boskin initiative (and very few resources for price indeximprovements) (U.S. Department of Commerce 1990). (b) Lack of appreciation,perhaps, by decision-makers of the significance of what was done, and overreactionto somewhat mild outside criticism and more forceful, though indirect, criticism fromwithin the U.S. statistical system. Though it made sense to let the dust settle a bit afterthe introduction of the computer indexes, this was undoubtedly the most far-reachinginnovation, internationally, in national accounting in the decade of the 1980’s (for someof its international implications, see Wyckoff 1995).
10 In the revised BEA capital stock data (supplied by Shelby Herman of BEA), thesesectors account for 72.3 percent of computer capital stock in the benchmark year of1992.
11 Most services in SIC division I are intermediate products (such as the services ofconsulting economists) that do not enter final GDP.
12 The BLS output measure used in the banking industry productivity measure is asubstantially different definition from the BEA banking measure used in calculatingcomponents of GDP. See Triplett (1992).
13 Prescott (1997) includes owner-occupied housing services in his ‘badly defined’category, on the grounds that a user cost measure would be theoretically preferable toowners’ equivalent rent, which is the measure now used in the national accounts andthe CPI. Because the Jorgenson (1989) expression for the user cost of capital has therental value on the left side of the equation, Prescott’s point cannot be a theoretical onebecause rental and user-cost measures should in theory be the same. He must, rather,implicitly be asserting that user cost estimates work better in the case of owner-occupied housing than the use of rental foregone. The evidence goes against Prescott’sassertion. See Gillingham (1983) for the case of owner-occupied housing and Harper,Berndt, and Wood (1989) for analysis of comparable problems in the estimation ofuser cost for other capital goods. I do not mean to suggest that there are no problemswith measuring the cost of owner-occupied housing; just that Prescott’s reasoning isnot consistent with the empirical evidence.
14 I reviewed the Boskin Commission bias estimates for the measurement of real PCE(and therefore productivity) in Triplett (1997).
15 And in any case, there is no present convention for imputing them to head offices. In
330 Jack E. Triplett
the 1987 SIC, a company head office or management office is designated an ‘auxiliary.’The employment and expenses of auxiliary offices are lumped into the data for theindustry that the head office manages. So, if this toy company still manufactured toysin the U.S., the costs of the head office would be put into the toy manufacturingindustry, on the assumption that whatever the head office does, it contributes itsservices to the manufacturing establishments of the company. No imputation for theservices of the head office would have been made.
In a globalized world, putting the costs of head offices into manufacturingindustries no longer makes economic sense. In the new North American IndustryClassification System (NAICS), head offices are put in a separate industry and groupedin a sector with other economic units (like holding companies) that have no naturaloutput units. (Federal Register 1997).
16 Parts of this section are adapted from my “comment” on Oliner and Sichel (1994).17 David (1990, 357) notes the “unprofitability of replacing still serviceable
manufacturing plants embodying production technologies that used mechanical powerderived from water and steam.” He remarks that “applications of electric powerawaited the further physical depreciation of durable factory structures....” Thatmanufacturers waited for water-powered equipment to wear out before replacing itwith electric is eloquent testimony to the powerful impact of prices and obsolescenceon computer diffusion: the evidence suggests that computers do not deteriorateappreciably in use (Oliner, 1993), but how many older generation computers are stillin service?
18 As an illustration, Longley (1967) showed that matrix inversion algorithms for earlycomputer regression programs were patterned on short-cut methods used on mechanicalcalculators and contained inversion errors that affected regression coefficients at thefirst or second significant digits. The designers of faster and cheaper methods todisplace old ones did not initially take advantage of the computer’s speed to improvethe accuracy of the calculations.
19 It is not inefficient to let utilization of the lower cost input adjust to economize on theuse of the higher cost one.
20 It is hard to avoid wondering if much of this cost could not have been avoided, had theretention of old icons and symbols been made an objective of the upgrade design. Theanalogy to the typewriter’s QWERTY keyboard (retained on the computer) is apt: Whyis there no similar inertia in changing software commands and icons?
21 Reservations might be expressed about this interpretation of the number of products.
References
Baily, Martin N., and Robert J. Gordon (1988) ‘The productivity slowdown,measurement issues, and the explosion of computer power,’ Brookings Papers onEconomic Activity 2, 347-420
Berger, Allen N., and David B. Humphrey (1992) ‘Measurement and efficiency issuesin commercial banking,’ in Output Measurement in the Service Sectors, ed. Z.Griliches, NBER Studies in Income and Wealth 56 (Chicago: University ofChicago Press)
Berger, Allen N., and Loretta J. Mester (1997) ‘Efficiency and productivity trends inthe U.S. commercial banking industry: a comparison of the 1980s and the 1990s,’Centre for the Study of Living Standards Conference on Service Sector Productivity
Solow productivity paradox 331
and the Productivity Paradox, Manuscript (April 11-12),http://www.csls.ca/conf-pap/mest.pdf
Berndt, Ernst R., and Jack E. Triplett, eds. (1990) Fifty Years of EconomicMeasurement: The Jubilee of the Conference on Research in Income and Wealth.In NBER Studies in Income and Wealth 54 (Chicago: University of Chicago Press)
Blinder, Alan S., and Richard E. Quandt (1997) ‘The computer and the economy: willinformation technology ever produce the productivity gains that were predicted?’The Atlantic Monthly 280, 6 (December), 26-32
Bresnahan, Timothy F. (1986) ‘Measuring the spillovers from technical advance:mainframe computers in financial services,’ American Economic Review 76, 4,742-55
Bresnahan, Timothy F., Paul Milgrom, and Jonathan Paul (1992) ‘The real output ofthe stock exchange,’ in Output Measures in the Service Sectors, ed. Z. Griliches,NBER Studies in Income and Wealth 56 (Chicago: University of Chicago Press)
Brynjolfsson, Erik, and Lorin Hitt (1996) ‘Paradox lost? Firm-level evidence on thereturns to information systems spending,’ Management Science 42, 4 (April), 541
Court, Andrew T. (1939) ‘Hedonic price indexes with automotive examples,’ in TheDynamics of Automobile Demand, 99-117 (New York: General MotorsCorporation)
David, Paul A. (1990) ‘The dynamo and the computer: an historical perspective on themodern productivity paradox,’ American Economic Review 80 (May), 355-61
Denison, Edward F. (1989) Estimates of Productivity Change by Industry: AnEvaluation and an Alternative (Washington, DC: Brookings Institution)
Diewert, W. Erwin (1993) ‘The early history of price index research,’ inContributions to Economic Analysis: Essays in Index Number Theory, Volume 1,eds. W.E. Diewert and A.O. Nakamura (New York: North-Holland)
Diewert, W. Erwin, and Kevin Fox (1997) ‘Can measurement error explain theproductivity paradox?’ Centre for the Study of Living Standards Conference onService Sector Productivity and the Productivity Paradox, Manuscript (April 11-12), http://www.csls.ca/conf-pap/diewert2.pdf; also, in revised form, in THISISSUE
Dulberger, Ellen R. (1993) ‘Sources of price decline in computer processors: Selectedelectronic components,’ in Price Measurements and Their Uses, eds. M.F. Foss,M.E. Manser, and A. Young, Conference on Research in Income and Wealth,Studies in Income and Wealth 57 (Chicago: University of Chicago Press)
Federal Register (1997) Part II, Office of Management and Budget: 1997 NorthAmerican Industry Classification System--1987 Standard industrialClassification Replacement; Notice 62, 68 (April 9)
Fixler, Dennis, and Kim Zieschang (1997) ‘The productivity of the banking sector:integrating financial and production approaches to measuring financial serviceoutput,’ Centre for the Study of Living Standards Conference on Service SectorProductivity and the Productivity Paradox, Manuscript (April 11-12),http://www.csls.ca/conf-pap/fixler2.pdf; also, in revised form, in THIS ISSUE
Flamm, Kenneth (1993) ‘Measurement of DRAM prices: technology and marketstructure,’ in Price Measurements and Their Uses, eds. Murray Foss, MarilynManser, and Allan Young, NBER Studies in Income and Wealth 57 (University of
332 Jack E. Triplett
Chicago Press)))) (1997) More for Less: The Economic Impact of Semiconductors, Semiconductor
Industry AssociationFrei, Frances X., and Patrick T Harker (1997) ‘Innovation in retail banking,’ National
Academy of Science, National Research Council’s Board on Science, Technology,and Economic Policy, Conference on America’s Industrial Resurgence: Sourcesand Prospects, Draft manuscript (December 8-9),http://www2.nas.edu/step/2296.html
Gandal, Neil (1994) ‘Hedonic price indexes for spreadsheets and an empirical test fornetwork externalities,’ RAND Journal of Economics 25
Gillingham, Robert (1983) ‘Measuring the cost of shelter for homeowners: theoreticaland empirical considerations,’ Review of Economics and Statistics 65, 2 (May),254-65
Gordon, Robert J., ed. (1990) ‘Using unit value indexes to measure transaction pricesand quality change,’ in The Measurement of Durable Goods Prices, NBERmonograph (Chicago: University of Chicago Press)
Griliches, Zvi, ed. (1992) Output Measurement in the Service Sectors. NBER Studiesin Income and Wealth 56 (Chicago: University of Chicago Press)
Griliches, Zvi (1994) ‘Productivity, R&D, and the data constraint,’ AmericanEconomic Review 84, 1 (March), 1-23
))) (1997) ‘Plenary Session: perspectives on the productivity paradox,’ Centre forthe Study of Living Standards, Conference on Service Sector Productivity andthe Productivity Paradox, Ottawa, Transcription (April 11-12),http://www.csls.ca/conf-pap/Conf-fin.pdf
Grimm, Bruce T. (1998) ‘Price indexes for selected semiconductors, 1974-96,’Survey of Current Business 78, 2 (February), 8-24
Harhoff, Dietmar and Dietmar Moch (1997) ‘Price indexes for PC database softwareand the value of code compatibility,’ Research Policy 24, 4-5 (December), 509-20
Harper, Michael J., Ernst R. Berndt and David O. Wood (1989) ‘Rates of return andcapital aggregation using alternative rental prices,’ in Technology and CapitalFormation. eds. D.W. Jorgenson and R. Landau (Cambridge, MA: MIT Press)
Jorgenson, Dale W. (1980) ‘Accounting for capital,’ in Capital, Efficiency andGrowth, ed. George M. von Furstenberg (Cambridge: Ballinger)
))) (1989) ‘Capital as a factor of production,’ in Technology and Capital Formation,eds. D.W. Jorgenson and R. Landau (Cambridge, MA: MIT Press)
Jorgenson, Dale W., and Zvi Griliches (1972) ‘Issues in growth accounting: a replyto Edward F. Denison,’ Survey of Current Business 52, 5 (May), 65-94, 111
Jorgenson, Dale W., and Kevin Stiroh (1995) ‘Computers and growth,’ Economicsof Innovation and New Technology 3, 3-4, 295-316
Kreuger, A. (1993) ‘How computers have changed the wage structure: evidence frommicro data 1984-1989,’ Quarterly Journal of Economics CVIII, 33-60
Lichtenberg, Frank R. (1993) ‘The output contributions of computer equipment andpersonnel: a firm-level analysis,’ NBER working paper 4540 (November)
Longley, James W. (1967) ‘An appraisal of least squares programs for the electroniccomputer from the point of view of the user,’ Journal of the American StatisticalAssociation 62, 319 (September), 819-41
Solow productivity paradox 333
McCarthy, Paul (1997) Computer prices: how good is the quality adjustment?’Capital Stock Conference, OECD, Manuscript, Canberra (March 10-14)
Mokyr, Joel (1997) ‘Are we living in the middle of an industrial revolution?’ FederalReserve Bank of Kansas City Economic Review 82, 2, 31-43
Moreau, Antoine (1996) ‘Methodology of the price index for microcomputers andprinters in France,’ in OECD Proceedings: Industry Productivity, InternationalComparison and Measurement Issues (Paris: OECD)
Morrison, Catherine J., and Ernst R. Berndt (1991) ‘Assessing the productivity ofinformation technology equipment in U.S. manufacturing industries,’ NBERworking paper 3582 (January)
Nordhaus, William D. (1994) ‘Do real-output and real-wage measures capturereality? The history of lighting suggests not,’ in The Economics of New Goods,eds. T.F. Bresnahan and R.J. Gordon, NBER Studies in Income and Wealth 58(Chicago: University of Chicago Press)
Oliner, Stephen D. (1993) ‘Constant-quality price change, depreciation, and retirementof mainframe computers,’ in Price Measurements and Their Uses, eds. M.F. Foss,M.E. Manser, and A.H. Young, NBER Studies in Income and Wealth 57 (Chicago:University of Chicago Press)
Oliner, Stephen D., and Daniel E. Sichel (1994) ‘Computers and output growthrevisited: How big is the puzzle?’ Brookings Papers on Economic Activity 2,273-317
Prescott, Edward C. (1997) ‘On defining real consumption,’ Federal Reserve Bankof St. Louis Review 79, 3 (May/June), 47-53
Raff, Daniel M. G., and Manuel Trajtenberg (1997) ‘Quality-adjusted prices for theAmerican automobile industry: 1906-1940,’ in The Economics of New Goods, eds.T.F. Bresnahan and R.J. Gordon, NBER Studies in Income and Wealth 58(Chicago: University of Chicago Press)
Romer, P. (1986) ‘Increasing returns and long-run growth,’ Journal of PoliticalEconomy 94, 5 (October), 1002-37
Sherwood, Mark. (1999) ‘Output of the property and casualty insurance industry,’Canadian Journal of Economics, THIS ISSUE
Sichel, Daniel E. (1997) The Computer Revolution: An Economic Perspective(Washington, DC: Brookings Institution Press)
Solow, Robert M. (1987) ‘We’d better watch out,’ New York Times (July 12), BookReview, 36
Standard Industrial Classification System (1987) Executive Office of the President,Office of Management and Budget (Springfield, VA: National TechnicalInformation Service)
Steiner, Robert L. (1995) ‘Caveat! Some unrecognized pitfalls in census economicdata and the input-output accounts,’ Review of Industrial Organization 10, 6(December), 689-710
Stiroh, Kevin J. (1998) ‘Computers, productivity and input substitution,’ EconomicInquiry 36, 2 (April), 175-91
Trajtenberg, M. (1990) Economic Analysis of Product Innovation--The Case of CTScanners (Cambridge, MA: Harvard University Press)
Triplett, Jack E. (1983) ‘Concepts of quality in input and output price measures: a
334 Jack E. Triplett
resolution of the user value-resource cost debate,’ in The U.S. National Incomeand Product Accounts: Selected Topics, ed. M.F. Foss, NBER Studies in Incomeand Wealth 47 ( Chicago: University of Chicago Press)
))) (1989) ‘Price and technological change in a capital good: a survey of research oncomputers,’ in Technology and Capital Formation, eds. D.W. Jorgenson andR. Landau (Cambridge, MA: MIT Press)
))) (1992) ‘Banking output,’ in The New Palgrave dictionary of Money and Finance1, eds. P. Newman, M. Milgate, and J. Eatwell (New York: Stockton Press)
))) (1996) ‘High-tech industry productivity and hedonic price indices,’ in OECDProceedings: Industry Productivity, International Comparison and MeasurementIssues (Paris: OECD)
))) (1997) ‘Measuring consumption: the post-1973 slowdown and the researchissues,’ Federal Reserve Bank of St. Louis Review 79, 3 (May/June), 9-42
U.S. Department of Commerce, Bureau of the Census (1944) Statistical Abstract ofthe United States 1943 (Washington: U.S. Government Printing Office)
U.S. Department of Commerce, Bureau of Economic Analysis (1990) ‘Improving thequality of economic statistics,’ Survey of Current Business 70, 2 (February), 2
U.S. Department of Commerce, Bureau of Economic Analysis (1998) Survey ofCurrent Business 78, 3 (March), Table 5.4, p. D-13
U.S. Department of Labor, Bureau of Labor Statistics. ‘Multifactor productivity,major sector multifactor productivity index,’ http://146.142.4.24/cgi-bin/dsrv?mp
U.S. Department of Labor, Bureau of Labor Statistics (1998) ‘Multifactorproductivity trends, 1995 and 1996: private business, private nonfarm business, andmanufacturing,’ Press release (May 6)
Wyckoff, Andrew W. (1995) ‘The impact of computer prices on internationalcomparisons of labour productivity,’ Economics of Innovation and NewTechnology 3