Embed Size (px)
Citation preview
The Special Senate Committee on Mass Media
The Honourable Keith Davey, Chairman
The Honourable L. P. Beaubien, Deputy Chairman
The Honourable Romuald Bourque The Honourable Douglas D. Everett The Honourable Harry W. Hays, P.C. The Honourable Mary E. Kinnear The Honourable J. M. Macdonald
The Honourable Charles R. McElman The Honourable William J. Petten The Honourable J. Harper Prowse The Honourable Josie D. Quart The Honourable Donald Smith
The Honourable Herbert O. Sparrow The Honourable Frank C. Welch The Honourable Paul Yuzyk
TERMS OF REFERENCE
On Tuesday, March 18, 1969, the Senate of Canada constituted the Special Senate Committee on Mass Media by approving the following resolution: That a Special Committee of the Senate be appointed to consider and report upon the ownership and control of the major means of mass public communication in C,::anada, and in particular, and without restricting the generality of the foreegoing, to examine and report upon the extent and nature of their impact and influence on the Canadian public; That the Committee have power to engage the services of such counsel and technical, clerical and other personnel as may be necessary for the purpose of the inquiry; and That the Committee have power to send for persons, papers and records, to examine witnesses, to report from time to time and to print such papers and evidence from day to day as may be ordered by the Committee.
The Committee was reconstituted by the Senate during the second and third sessions of the 28th Parliament on October 29, 1969 and October 8, 1970.
PREFACE
Throughout the following volume ‐ particularly in Part I and in Appendix I ‐ the population figures used are those given in the Financial Post Survey of Markets (1969), projected population as at April 1, 1969. Where a listing for a selected community at this date was not available from this source, the figure is derived from the 1966 Census of Canada and denoted by the letter "C" (Metropolitan population figures are denoted by the letter "M.") Circulation figures for newspapers have been taken in most cases from Canadian Advertising Rates and Data (December, 1969). Circulation figures for radio and television stations are taken from the Bureau of Broadcast Measurement's Coverage and Circulation Report (October 27 to November 9, 1969). Radio data are based on the average daily circulation in daytime hours, for all persons two years and over. Television data are based on average daily circulation, in night‐time hours, for all persons two years and over. Cable television systems have no call letters and therefore the symbol "CATV" is often used, in conjunction with some more specific identification, such as location. CATV circulation figures were provided to the Committee by individual system operators; un‐bracketed figures indicate actual number of subscribing households at December 31, 1969 (including apartment and bulk units); bracketed figures indicate maximum potential on the same basis. The first section of Part II, on the economics of the mass media, was prepared by Hopkins, Hedlin Limited and based on studies undertaken by Hedlin, Menzies & Associates Limited, consulting economists, assisted by Douglas McArthur of the Topecon Group. The second section of Part II, on newspapers and periodicals, wa~ prepared by Douglas McArthur of the Topecon Group on behalf of Hedlin, Menzies & Associates Limited. Rodger Schwass, Norman Mogil, and Arvo Ray of Hedlin, Menzies & Associates Limited undertook the preparation of the sections on the radio and television broadcasting industries. The remainder of the studies in Part II ‐ with the exception of two papers on cablevision by the Committee's research staff ‐ were prepared by the staff of Hopkins, Hedlin Limited. The report was completed in November, 1969. Data relating to media ownership were later revised to July 31, 1970. For obvious economies of space and sense, various abbreviations have been employed throughout the following volume. They are: Arch Archibald BCT B.C. Television Systems BaP Baribeau-Pratte Beau Beaubien B-B Bromley-Browne Blk Blackburn B.B.M. Bureau of Broadcast Measurement Brl Brilliant BsE Bassett-Eaton Mof Moffat Bsh Bushnell Mort Morton Btl Butler Mtl Montreal Star Bur Burgoyne Mur Murphy Cmb Cambrian Broadcasting MysL Mystery Lake Col Columbian Nath Nathanson Crk Cruickshank Par Parisien Crp Crepault Pat Pattison Cty Countryside Pel Peladeau

Dan Dancy Broadcasting Plk Pollack Den Dennis Prt Pratte Des Desmarais Q Broad Q Broadcasting Dgl Dougall Rgs Rogers Elp-Ke Elphicke-Key Rwl Rawlinson Fra Francour S Southam Fin Finnerty Sbl Soble FP F.P. Publications Sft Sifton Frt Frontier Broadcasting Skn Skeena Geo Creco Slk Selkirk Holdings Gou Gourd Snl Snelgrove Grn Green Std Standard Broadcasting Guif-Yu Guifford-Yuill Stl Stirling Hy Hyland Synd Le Syndicat d’Oeuvres Sociales Ltee. Irv Irving T Thomson Lap Lapointe Tel Telecommunications Inc. Lpg Lepage-Society Tor Toronto Star Lpg-Ba Lapage-Baribeau Van Vancouver Broadcasting Associates Lvn Lavigne W Weekly Lyn Lynds WBC Western Broadcasting Company McC McConnell Wil Wilson M-H Maclean-Hunter Mis Misener Mng Manning

TABLE OF CONTENTS
Part 1: Concentration
Page
Chapter 1: Concentration: A National Policy Dilemma 3 Introduction 3 The Disappearing Daily 10 Broadcasting 14 Wider Considerations 15 The Urge to Grow 18 Concentration, Competition, and the Role
of Government 23 Cable Ownership 35
Chapter 2: A Profile of Ownership Concentration. 41 Chapter 3: Major Broadcasting and Mixed‐Media Ownership Patterns 63 Introduction. 63 A Synoptic View of Media Ownership Patterns in the Major Centres of Each Province 67
British Columbia 67 Alberta 67 Saskatchewan . 67 Manitoba . 68 Ontario . 68 Quebec 71 New Brunswick. 72 Nova Scotia. 72 Prince Edward Island 72 Newfoundland 73
In Perspective 73 Olapter 4: Profiles of Multi‐Media Owners . 75 Introduction . 75 The Profiles 76
The Bassett‐Eaton Group 76 Bushnell Communications Limited 77. CHUM Limited 79 The Crepault Group 81 Paul Desmarais, Jean Parisien, and Jacques Francoeur . 81 The Dougall Family 85 F. P. Publications Limited . 85 The Irving Group 86 Maclean‐Hunter Limited 90 The McConnell Family . 94 Moffat Broadcasting Limited 96
Page
Rogers Broadcasting Limited . 97 The Pratte, Baribeau, and Lepage Group . 97 The Sifton Group 99 The Southam‐Selkirk Group 100 Standard Broadcasting Corporation Limited 106 Telemedia (Quebec) Limitee 108 The Thomson Group 109 Toronto Star Limited 112 Western Broadcasting Company Limited 114
PART II Economics of the Mass Media
Section I: Advertising
Chapter 1: The Economic Importance of Advertising . 119
Introduction 119 The Economics of Advertising 120
Advertising Expenditures and Expenditures on Goods and Services . 121
Comparison of Advertising Expenditures in Canada and the United States . 124 Projections of Advertising Expenditures to 1975 126
Types of Advertising 126 Chapter 2: The Advertising Agencies 129
The Media Equation 129 Media Trade Associations 129 Advertising Agencies' Association 131 Associations Concerned with Advertising . 133 The Franchise System 134
Advertising Agencies 135
History 135 Membership 136 The Commission System . 139 Economics of Agency Operations 140 The Canadian Code of Advertising Standards 145 Editorial Advertising 146 Contra Accounts 147 Television Rights 147 Advertiser Influence on Media Content 148
Chapter 3: The Regulation of Advertising 153
Introduction 153 The Federal Role 153
Canadian Radio‐Television Commission . 153

Combines Investigation Branch 154 Chapter 3....continued Page
Food and Drug Directorate 155 The Provincial Role 157 The Newspaper and Broadcast Role 158 Discussion ‐ Two Sides of a Coin 158
Introduction 158 The Conduct of Business . 159
Section II: The Print Industry
Chapter 1: Ends and Means 165 Chapter 2: Revenue 167
Circulation Revenue 167 Aspects of Circulation, 1900‐1969 167 Circulation Revenue, 1950‐1967 171
Advertising Revenue 173 Advertising Rates, 1955‐1969 173 Retail and National Rates . 174 Volume Discount Rates 176 Co‐operative Advertising Rates . 177 Other Advertising Rates 177 What Structure for Rates? 179
Trends in National Advertising Rates, 1955‐1969 180 Comparative Rates in 1969 186
Combination Rates 189 Advertising Revenue, 1950‐1969 191
Growth in Daily Newspaper Advertising Revenues, 1950‐1967 195 . Effects of Changes of Numbers of Newspapers on Revenue Data . 199 Distribution of Daily Newspaper Advertising Revenue by Type 200 Fluctuations in Advertising Revenue . 201 Weekly Newspapers' Advertising Revenue . 202 Daily Newspapers in the Weekly Newspaper Field 204.
Chapter 3: Costs 207
Newsprint 207 Supply of Newsprint 208
Labour and Labour Unions 209 General Collective Bargaining Policy 210 Wages, Salaries, and Hours . 211
Machinery and Equipment 212 Wire Service 216 Distribution of Production Costs . 217 Employment, Wages, and Productivity 220
Concentration by Size of Firm . 222 Wages and Productivity by Size of Firm 224.
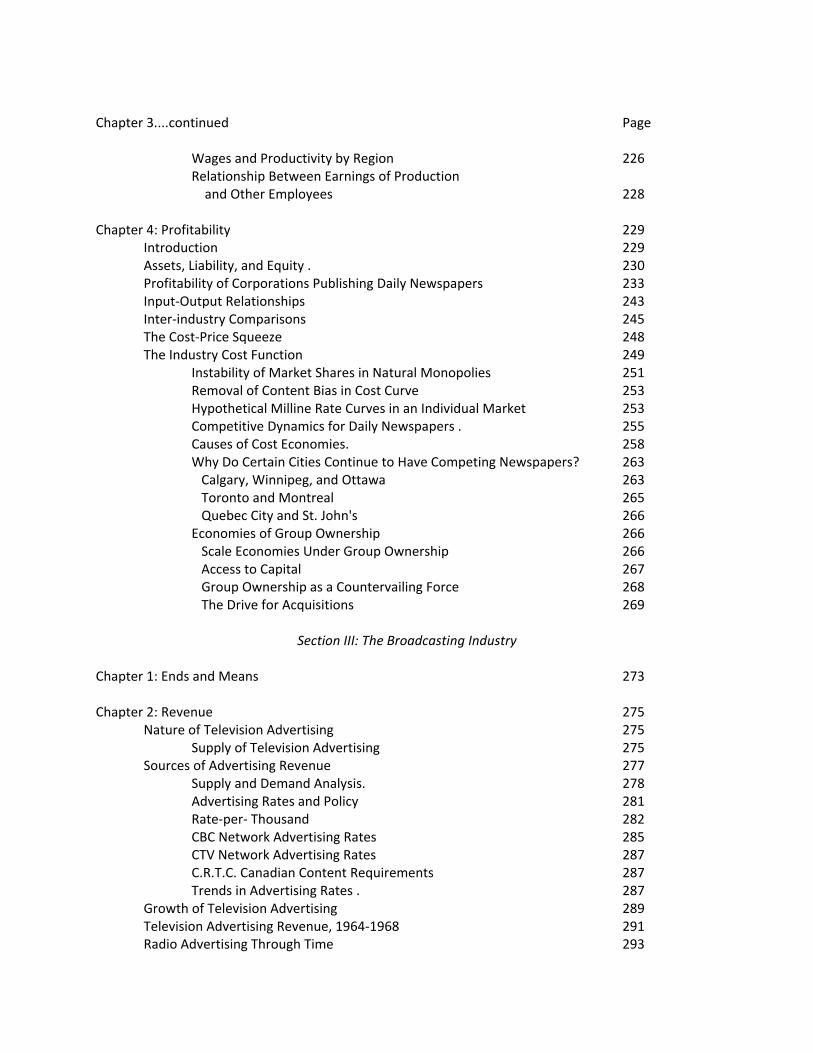
Chapter 3....continued Page
Wages and Productivity by Region 226 Relationship Between Earnings of Production and Other Employees 228
Chapter 4: Profitability 229
Introduction 229 Assets, Liability, and Equity . 230 Profitability of Corporations Publishing Daily Newspapers 233 Input‐Output Relationships 243 Inter‐industry Comparisons 245 The Cost‐Price Squeeze 248 The Industry Cost Function 249
Instability of Market Shares in Natural Monopolies 251 Removal of Content Bias in Cost Curve 253 Hypothetical Milline Rate Curves in an Individual Market 253 Competitive Dynamics for Daily Newspapers . 255 Causes of Cost Economies. 258 Why Do Certain Cities Continue to Have Competing Newspapers? 263 Calgary, Winnipeg, and Ottawa 263 Toronto and Montreal 265 Quebec City and St. John's 266 Economies of Group Ownership 266 Scale Economies Under Group Ownership 266 Access to Capital 267 Group Ownership as a Countervailing Force 268 The Drive for Acquisitions 269
Section III: The Broadcasting Industry
Chapter 1: Ends and Means 273 Chapter 2: Revenue 275
Nature of Television Advertising 275 Supply of Television Advertising 275
Sources of Advertising Revenue 277 Supply and Demand Analysis. 278 Advertising Rates and Policy 281 Rate‐per‐ Thousand 282 CBC Network Advertising Rates 285 CTV Network Advertising Rates 287 C.R.T.C. Canadian Content Requirements 287 Trends in Advertising Rates . 287
Growth of Television Advertising 289 Television Advertising Revenue, 1964‐1968 291 Radio Advertising Through Time 293
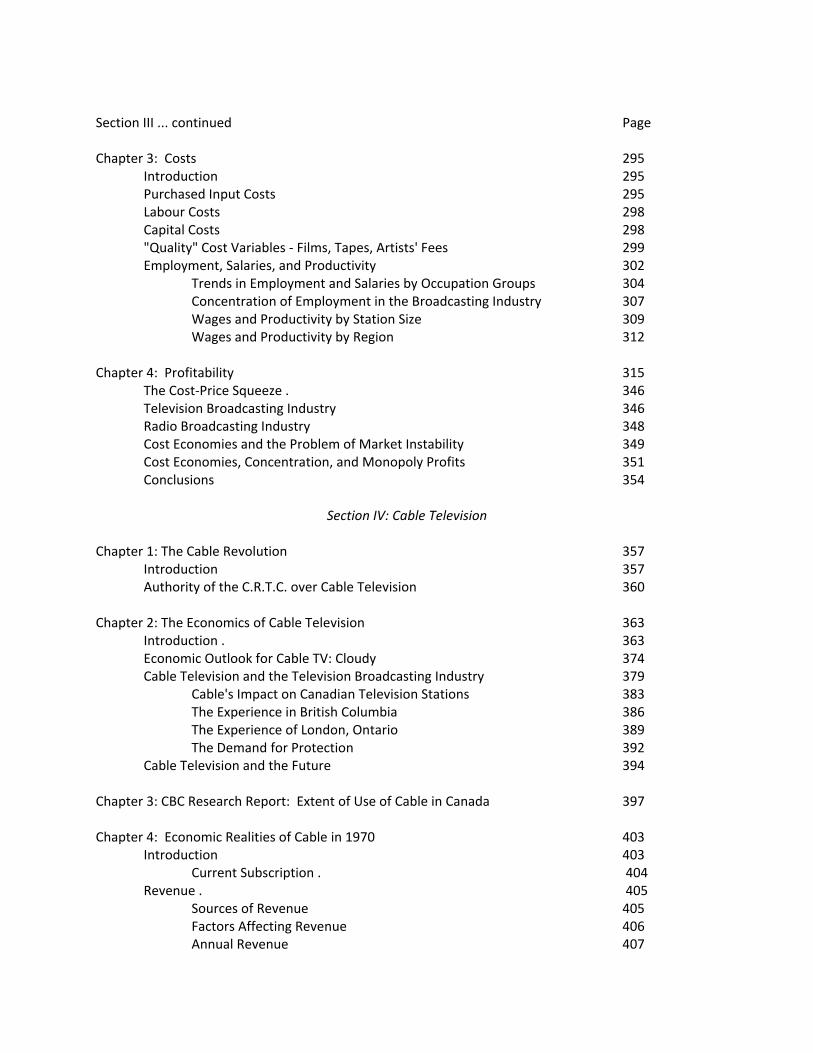
Section III ... continued Page Chapter 3: Costs 295
Introduction 295 Purchased Input Costs 295 Labour Costs 298 Capital Costs 298 "Quality" Cost Variables ‐ Films, Tapes, Artists' Fees 299 Employment, Salaries, and Productivity 302
Trends in Employment and Salaries by Occupation Groups 304 Concentration of Employment in the Broadcasting Industry 307 Wages and Productivity by Station Size 309 Wages and Productivity by Region 312
Chapter 4: Profitability 315
The Cost‐Price Squeeze . 346 Television Broadcasting Industry 346 Radio Broadcasting Industry 348 Cost Economies and the Problem of Market Instability 349 Cost Economies, Concentration, and Monopoly Profits 351 Conclusions 354
Section IV: Cable Television
Chapter 1: The Cable Revolution 357
Introduction 357 Authority of the C.R.T.C. over Cable Television 360
Chapter 2: The Economics of Cable Television 363
Introduction . 363 Economic Outlook for Cable TV: Cloudy 374 Cable Television and the Television Broadcasting Industry 379
Cable's Impact on Canadian Television Stations 383 The Experience in British Columbia 386 The Experience of London, Ontario 389 The Demand for Protection 392
Cable Television and the Future 394 Chapter 3: CBC Research Report: Extent of Use of Cable in Canada 397 Chapter 4: Economic Realities of Cable in 1970 403
Introduction 403 Current Subscription . 404
Revenue . 405 Sources of Revenue 405 Factors Affecting Revenue 406 Annual Revenue 407
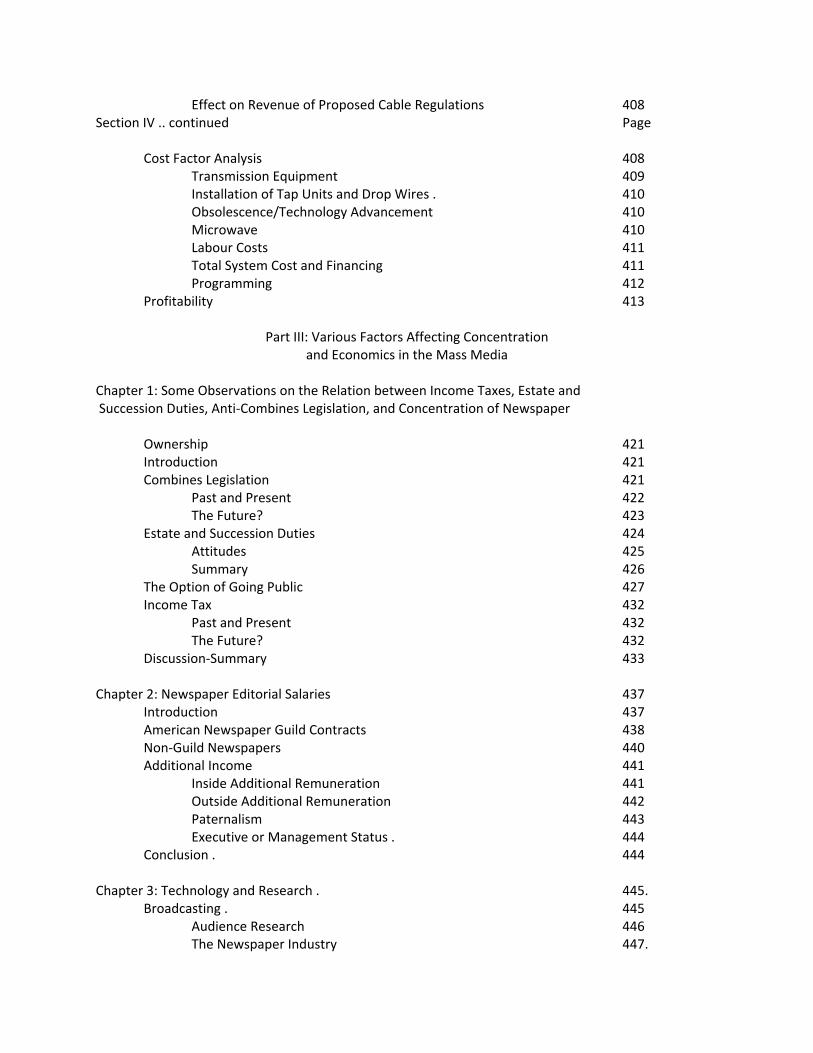
Effect on Revenue of Proposed Cable Regulations 408 Section IV .. continued Page
Cost Factor Analysis 408 Transmission Equipment 409
Installation of Tap Units and Drop Wires . 410 Obsolescence/Technology Advancement 410 Microwave 410
Labour Costs 411 Total System Cost and Financing 411 Programming 412
Profitability 413
Part III: Various Factors Affecting Concentration and Economics in the Mass Media
Chapter 1: Some Observations on the Relation between Income Taxes, Estate and Succession Duties, Anti‐Combines Legislation, and Concentration of Newspaper
Ownership 421 Introduction 421 Combines Legislation 421
Past and Present 422 The Future? 423
Estate and Succession Duties 424 Attitudes 425 Summary 426
The Option of Going Public 427 Income Tax 432
Past and Present 432 The Future? 432
Discussion‐Summary 433 Chapter 2: Newspaper Editorial Salaries 437
Introduction 437 American Newspaper Guild Contracts 438 Non‐Guild Newspapers 440 Additional Income 441
Inside Additional Remuneration 441 Outside Additional Remuneration 442 Paternalism 443 Executive or Management Status . 444
Conclusion . 444 Chapter 3: Technology and Research . 445.
Broadcasting . 445 Audience Research 446 The Newspaper Industry 447.
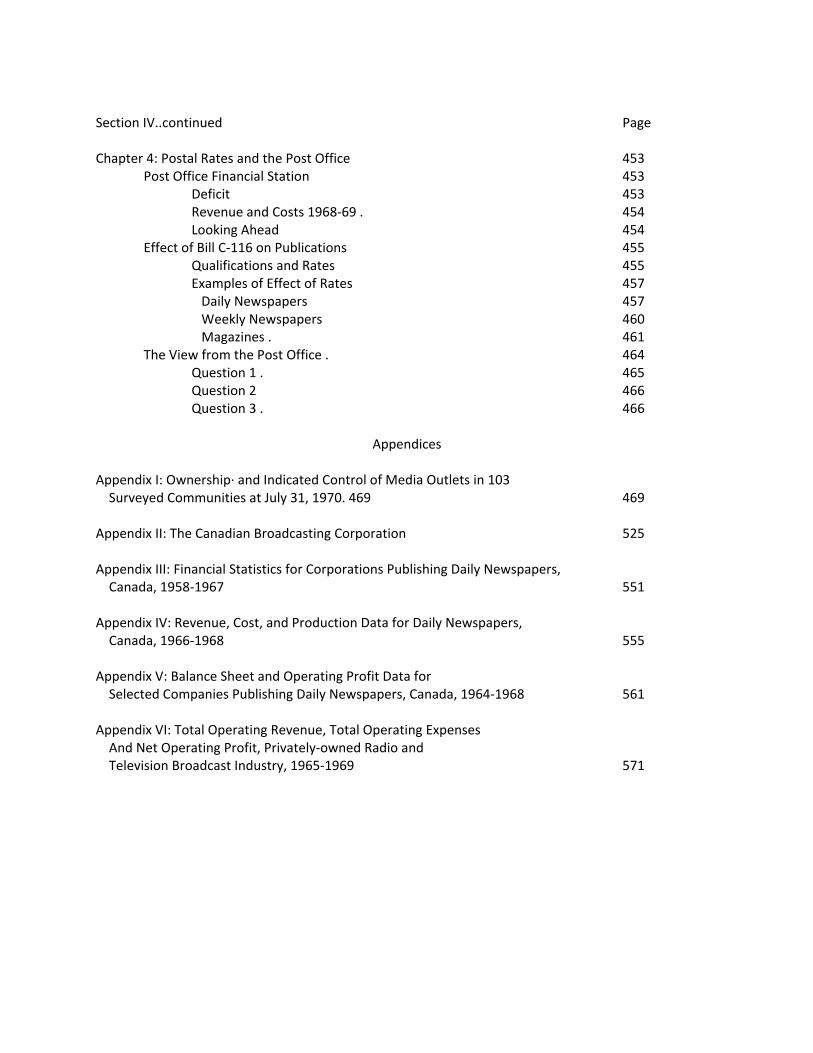
Section IV..continued Page Chapter 4: Postal Rates and the Post Office 453
Post Office Financial Station 453 Deficit 453 Revenue and Costs 1968‐69 . 454 Looking Ahead 454
Effect of Bill C‐116 on Publications 455 Qualifications and Rates 455 Examples of Effect of Rates 457 Daily Newspapers 457 Weekly Newspapers 460 Magazines . 461
The View from the Post Office . 464 Question 1 . 465 Question 2 466 Question 3 . 466
Appendices
Appendix I: Ownership∙ and Indicated Control of Media Outlets in 103 Surveyed Communities at July 31, 1970. 469 469 Appendix II: The Canadian Broadcasting Corporation 525 Appendix III: Financial Statistics for Corporations Publishing Daily Newspapers, Canada, 1958‐1967 551 Appendix IV: Revenue, Cost, and Production Data for Daily Newspapers, Canada, 1966‐1968 555 Appendix V: Balance Sheet and Operating Profit Data for Selected Companies Publishing Daily Newspapers, Canada, 1964‐1968 561 Appendix VI: Total Operating Revenue, Total Operating Expenses And Net Operating Profit, Privately‐owned Radio and Television Broadcast Industry, 1965‐1969 571

Part I
CONCENTRATION
Chapter 1:
CONCENTRATION, A NATIONAL POLICY DILEMMA
INTRODUCTION
In the White Paper on Broadcasting published in 1966, the federal government of the day foreshadowed new regulations to restrict further foreign control of Canadian mass media. But the White Paper also touched on another, still unresolved aspect of media ownership:
Within Canada, ownership or control of one medium of communication by another is equally a matter of concern if it tends to develop into a monopoly. There is a growing number of cases where either ownership or control extends to both the local newspaper and the local radio or television facilities. The Board of Broadcast Governors will be required to investigate and report on public complaints or representations about situations of this kind.
Parliament will be asked to authorize the Government to give guidance to the Board of Broadcast Governors, aimed at preventing foreign control of Broadcasting facilities, the domination of a local situation through multiple ownership, or the extension of ownership geographically in a manner that is not in the public interest.
Since the publication of the White Paper, concentration of mass media ownership - mainly in
the hands of Canadian interests - has proceeded at what appears to be a quickening pace. There has been, however, still no guidance from the federal government in this situation, nor has the new regulatory authority in broadcasting, the Canadian Radio-Television Commission (C.R.T.C.), yet developed clearly discernible guidelines of its own.
A variety of forces have combined to produce a growing concentration of media ownership. Economics and technology may be the dominant forces, since they undoubtedly favour the development of increasingly large units of both newspapers and broadcasting outlets - although not necessarily multiple ownership of both media or even of either medium. But a number of other elements have also played important parts. These include laws and regulations involving income tax and succession duties and, in a negative way, the apparent ineffectiveness of existing legislation governing mergers, trusts, and monopolies. The mounting power in the marketplace of public companies - together with their constant thrust to grow and expand - has contributed in an important way to public companies' increasingly dominant role in the communications media.
It is conceivable that some of these trends could be moderated, or even reversed, if it were considered desirable to do so. Over time, economics and technology tend to work in an inexorable way. In many countries, however, there is an underlying belief that the development of the communications media must be governed by more than economics alone because of the vital part they play in the life of the nation itself. In the introduction to its report in 1961, the
Royal Commission on Publications observed that it had been urged to base its inquiry on purely economic considerations, but that:
This has not been possible because, while many of the problems faced by Canadian periodicals are economic, the nature of modern communication is such that its effects carry enormous social and political, as well as economic, implications. Like the two sides of a coin, the "cultural" and economic are virtually inseparable, and neither can provide a complete perspective in itself. 1 In its report on its inquiry into the joint publishing arrangement between the Vancouver Sun
and Province, the Restrictive Trade Practices Commission pointed out that the democratic conduct of affairs at both local and national levels is dependent upon the formation of public opinion:
If the public cannot get the significant facts about what is going on, if it cannot get them sorted out in a significant way, if it is not enlightened by discussion that points out the possible consequences of the alternative courses of action before the community, too many opinions will be ill-formed and muddled and likely to be temporary and unstable. If well-informed public opinion is an essential of sound public policy, then the channels through which information flows to the members of the public have an importance which cannot be overemphasized. 2
Judge Learned Hand of the U.S. Supreme Court once reflected a similar outlook.
The press, he said,
serves one of the most vital of all general interests: the dissemination of news from as many different sources, and with as many different facets and colours as is possible. That interest is closely akin to, if indeed it is not the same as, the interest protected by the First Amendment; it presupposes that the right conclusions are more likely to be gathered out of a multitude of tongues, than through any kind of authoritative selection. To many this is, and always will be folly; but we have upon it staked our all.
In a decision in 1945, the U.S. Supreme Court concluded that the First Amendment,
guaranteeing the maintenance of a free press, "rests on the assumption that the widest possible dissemination of information from diverse and antagonistic sources is essential to the welfare of the public."
In Canada, the Royal Commission on Publications suggested that the very decline in the number of diverse and antagonistic sources of communication might require some impingement by government on the traditional autonomy of the press:
It is not inconceivable that new limitations may be necessary in the future, seeing that with the increased importance and mounting power of mass communications, there must be a corresponding gain in the power and importance of the relatively few people who control the media, and, therefore, a decrease in certain rights of other individuals in the community.
The growing concern evident in Canada over increasing concentration of media ownership has
its parallel in the United States, where the same trend toward multiple-media interests is dearly evident. In March, 1968, the Federal Communications Commission (F.C.C.) gave notice of its proposal to consider a new rule that would extend its present restrictions on multiple broadcasting interests. This provides that no single individual may own more than seven AM radio licences, seven FM radio licences, and seven television licences, of which only five may be for VHF stations and the remaining two for UHF stations. The F.C.C. also prohibits common ownership of two stations of the same medium (television, AM or FM radio) that reach into a single market with overlapping signals. Through its announcement in March, 1969, the F.C.C. proposed to extend this rule by providing that in future there could be no common ownership of multiple broadcasting stations of any kind in the same market.
On August 1, 1968, the U.S. Department of Justice intervened to advance its own proposal that the new restriction contemplated by the F.C.C. not only be extended to prohibit common ownership of a newspaper or newspapers and broadcasting facilities in the same community, but that the restriction be applied retroactively as existing licences came up for renewal:
The clear effect of combined ownership of similar broadcast media in the same local market is to reduce the diversity of news and information sources available, and to lessen the degree of competition for advertising· between these alternative media. This consequence is all the more unfortunate because a striking concentration of facilities in many major markets has already occurred. Moreover, combined ownership may facilitate undesirable competitive practices by which the "combined" owner seeks to exploit his advantages over the single-station owner. These practices may include granting special discounts for advertisers utilizing more than one medium or cumulative volume discounts covering advertising placed in more than one medium.
On December 12, 1968, the F.C.C. took its own proposal one step further by suggesting that a
television station should be prohibited from owning a cable television system in the same market. The Justice Department endorsed this approach in a submission on April 7, 1969, but supplemented it with its own proposal that newspapers should also be prohibited from owning cable television systems in the same community.
Not waiting for the F.C.C.to act on its earlier submission urging prohibition of common newspaper and broadcasting interests in the same community, the Justice Department broke new ground when it moved to force the Gannett newspaper group to divest itself of the ownership of a television station in Rockford, Ill. On December 5, 1968, it filed a consent decree with a U.S. District Court.
One of the most outspoken opponents of media concentration in the United States has been Nicholas Johnson, who has been one of seven members of the F.C.C. since 1966. Recently, Mr. Johnson asserted:
If we are serious about the kind of society we have undertaken, it is clear to me that we simply must not tolerate concentration of media ownership - except where concentration
creates actual countervailing social benefits. These benefits cannot be merely speculative. They must be identifiable, demonstrable and genuinely weighty enough to offset the dangers inherent in concentration.
The essential nature of the problem confronting Canada (and many other countries) as a result
of the growing concentration of media ownership was once outlined by Dr. Andrew Stewart, then Chairman of the B.B.G. in testimony before the Senate Committee on Transport and Communications:
I think there is a dilemma in this matter. Everybody is conscious of the dangers of concentration of expression of opinion. This is what we want to avoid. We want plurality of expression, and multiple ownership can go against this. On the other hand, there are considerable advantages to grouping of stations; economies that can be effected by larger scales of operation and through multiple ownership. It is certainly our view that in some of the cases of multiple ownership an improved level of service does in fact follow as a result of the economies. In this country we have a limited market. We have limited capacities in comparison, say, with the United States and, therefore, there is a case for our taking advantage of the economies which can help to maintain and improve the service. So, one is faced with this dilemma: there are gains, and there are dangers in the process.
Dr. Stewart's contention was echoed a little more than a year later by the Chairman of the new
regulatory broadcasting agency, the C.R.T.C., Pierre Juneau:
Many of the decisions that the Commission had to make during the year have forced it to think about the question of possible concentration of ownership This problem is a particularly difficult one in Canada. It seems to me that we need some groups in Canada that will be large enough to be able to compete in the entertainment, the cultural, the informational and educational fields with the enormous entities that are being created in other parts of the world and particularly by our neighbours. These groups should be able to compete or to co-operate in the production of material and in distribution of such material; on the other hand, you also want to maintain some pluralism in Canada in order to have competition within Canada. You also want to maintain as often as possible some identification by the owners with the regions in which they operate. You want to avoid situations where concentration of media ownership is such that a complete area risks being dominated exclusively or to a very large degree by one owner. I suppose you also might want to avoid ownership patterns where one operator is in such a vastly superior position vis-a-vis his competitors that this situation becomes unfair to those competitors. As both Dr. Stewart and Mr. Juneau suggested, those responsible for governing the affairs of
the country are confronted by a basic conflict between the desirability of widespread mass media ownership and the extreme danger of excessive concentration on the one hand, and the economic benefits and improved service sometimes offered by large-scale operations on the other. In the
final analysis, what is involved is a fundamental judgment about the relative weight that should be given to each consideration. Although the B.B.G. was not unaware of the problems of concentration Dr. Stewart himself indicated that the former regulatory authority placed the higher value on the benefits it considered would flow from large-scale operations. The B.B.G., he once noted, had never felt that concentration of media ownership had developed to the point that it should have called a halt to it:
We are conscious of the problems of multiple ownership, but we have never rejected an application on the basis that it has gone too far. We keep saying it can go too far, and it should be stopped, but we have not tried to devise a formula for this purpose.
As will be discussed at greater length later, the C.R.T.C. has at times voiced a greater measure
of concern than the B.B.G. about the problems of ownership concentration, a concern that occasionally has been reflected in its decisions. As suggested earlier, the shape of its policy in this regard can still be only dimly seen, although some recent decisions of the C.R.T.C. could be viewed as the evolutionary beginnings of a broad policy.
On July 10, 1969, for example, Rogers Cable TV Limited and Co-Axial Colourview were granted two-year licences to serve the Toronto area. The licences were granted contingent on Glen-Warren Productions Ltd.'s disposing of a 50 per cent ownership interest in Rogers Cable TV Ltd., which owned 90 per cent of Co-Axial Colourview Ltd. This condition was made because the share ownership of Glen-Warren Productions Ltd. was the same as Baton Broadcasting Ltd., licensee of CFTO-TV, Toronto, and because the Telegram Corporation Ltd. owns approximately 53 per cent of Glen-Warren Productions Ltd.
Concern over a balance of ownership in the communications media in a particular region was indicated again by the C.R.T.C. when it granted cable licences for Calgary and Edmonton on July 23, 1970. Community Antenna Television Ltd. was granted a three-year licence in Calgary contingent upon F .P. Publications disposing of its shares in the company before expiration of the licence. In Edmonton, Capital Cable Television Co. Ltd. was given a three-year licence contingent upon Mr. G.R.A. Rice disposing of his shares in the company in the same time period.
An application by Maclean-Hunter Cable TV Ltd. to acquire the assets of Hamilton Co-Axial (1958) Ltd. was denied by the C.R.T.C. on July 27, 1970. Maclean-Hunter's effective ownership and control of 17 cable systems and five radio stations in Ontario was cited as the reason for the denial. The Commission felt approval of the application would result in a concentration of ownership in Southern Ontario to an extent not in the public interest.
Bushnell Communications Ltd. in applications to the C.R.T.C. proposed to purchase effective ownership and control of an additional 17 cable television systems, 4 TV stations, 7 AM stations, 4 FM stations, and 1 short-wave station. The Commission denied all but one of the cable applications because it thought approval would create excessive concentration of media owner-

ship. Bushnell was told to transfer as rapidly as possible its interests in the one cable television system it was allowed to purchase.
Proprietors of newspaper groups are particularly sensitive to any suggestion that they constitute a threat either to a community or to the nation. Their sensitivity stems in part from the very heavy degree of concentration among Canadian newspapers generally. It also relates in an important way to the special nature of the medium. The Restrictive Trade Practices Commission once remarked that:
Among [the] channels of communication, the press remains the prime medium of communication for the purpose of assisting in the formulation of public opinion. For this purpose, radio and television are less effective because of the impermanence of their messages, the restricted number of channels available and the limitations of the periods during which information can be conveyed.
The same point was made a dozen years before by the Royal Commission on the Press in
Britain. It is not surprising, therefore, that large group-interests seek to allay concern that concentration of daily newspaper ownership might produce a comparable concentration of political power.
As long ago as 1951, Roy Thomson, stung by protests about his continued accumulation of newspapers, purchased an advertisement in the Globe and Mail to explain his "creed" as a publisher. His explanation read, in part:
I can state with the utmost emphasis that no person or group can buy or influence editorial support from any newspaper in the Thomson Group. It has often been asked, "Why does the Thomson Company buy newspapers? " My answer to that is to say that the business I know best is publishing newspapers .... I can state, with the utmost sincerity, that each and everyone of the newspapers associated with the Thomson Company has the interest of its community at heart, and equally that of Canada too. Each newspaper may perceive this interest in its own way, and will do this without advice, counselor guidance from the central office of the Thomson organization. This is, and will continue to be, my policy.
For some years, Southam Press Ltd. has reiterated its own particular "creed" in its annual report. It reads:
In an industry as important to the growth and maturity of Canadian public opinion as newspaper and magazine publishing, the company has pursued a number of basic policies, all of which are intended to assure objectivity of the printed word. These are:
1 The company will have no financial interests in enterprises outside the communications field.

2 Officers of the company or its subsidiaries and senior publishing executives may not act as directors of other unrelated firms operated for profit unless the company has an interest in such firms to be served thereby.
3 The company's newspapers and magazines are operated under individual management and develop independent editorial policies. There is no "Southam" editorial policy.
4 Officers, editorial personnel, and all other key employees of the company are expected to remain free from political and other outside activities when such activities might influence or appear to influence the editorial freedom or independence of any of the company's publications.
For a number of years, Southam Press also has held extensive interests in broadcasting both in its own right and through its 30 per cent share of the voting stock of Selkirk Holdings Ltd., a company with extensive broadcasting interests. In 1959, Southam adopted a policy of divesting itself of any majority holdings of a broadcasting station. "This followed from our conclusion, reached after careful consideration, that we should not control broadcasting stations in cities in which we publish newspapers," the company said in its annual report of 1960. In its annual report of 1969, Southam Press noted that it no longer was responsible for the management or operation of any broadcasting property. The company also announced a further change in its position:
We have now adopted a policy of consolidating, where possible, our broadcasting investments. A specific objective is to eliminate those situations in which both this company and Selkirk hold interests in the same properties. Agreement in principle has been reached with Selkirk to this end. Any changes in ownership which result will require the approval of the Canadian Radio-Television Commission. A first application has already gone before the C.R.T.C. in connection with the shareholdings of Wentworth Radio and Niagara Television in Hamilton. If approved, this application will be a step toward the separation of ownership between Southam and Selkirk in these two properties.
This application was approved and further applications to consolidate broadcast holdings within Selkirk holdings have been filed with C.R.T.C.
It may very well be that the attitude expressed by some of the large newspaper groups with regard to independence of editorial policy enjoyed by their several constituents can and should be accepted at face value. This acceptance may be tempered somewhat by the awareness that head office is able to influence, at least within certain limits, editorial approach through its power over the appointment of individual publishers and its control over their operating and capital budgets. These considerations apart, however, it is necessary to weigh the possibility that no matter how benign and enlightened the approach of present owners, there exists a very real potential for power to be concentrated in other, less benevolent hands to an extent commensurate with the concentration of media ownership. In an age of the "take-over," this is a particular

danger for widely held public companies. Nor can it be readily assumed that, because the owner of a newspaper does not control a broadcasting outlet in the same or another community, his minority interest deprives him of all significant influence - actual or potential.
In October, 1969, Stuart W. Griffiths, President and Managing Director of Bushnell Communications Ltd., appeared before a hearing of the C.R.T.C in Vancouver to argue against blanket maintenance of a ruling in 1966 by the B.B.G. prohibiting multiple ownership of CTV network affiliate stations, an issue that will be touched on later. Mr. Griffiths, whose company operates CJOH-TV in Ottawa, was seeking to acquire a number of other radio and television stations, including CFCF-TV in Montreal. He contended in his brief that there was strong economic pressure for the amalgamation of existing broadcasting stations into larger units. At the same time, Mr. Griffiths maintained that not all mergers were desirable:
Clearly some kinds of amalgamation will not well serve the audience. If choices are reduced as a result of amalgamation, if the useful check-and-balance between, for example, print and electronic media is removed because of amalgamation, then the audience may be less well served.
Where the owner of a newspaper also has a controlling interest in broadcasting facilities in the
same community, the kind of "check-and-balance" about which Mr. Griffiths spoke is very unlikely to exist. It is certainly open to question how effective this counter-balance is likely to be if the owner of the newspaper has a substantial minority interest in community broadcasting facilities - even more questionable if he controls them.
THE DISAPPEARING DAILY Writing in the Canada Year Book of 1959,S W. H: Kesterton pointed out that daily newspapers in Canada (as elsewhere) have undergone a marked "mutation" during this century:
Extensive gains in circulation, a great increase in timeliness, a remarkable enlargement of the mechanical plant and business operation, and innovations of newspaper production and news presentation were the essential features of the transformation. These striking changes were caused by the interaction of two factors - a remarkable economic and population growth and revolutionary developments in the technology of journalism. The hand-in-hand growth in circulation and technology has had a vicious circle quality. To serve vastly increased readership, newspapers require elaborate and costly equipment; to pay for elaborate and costly equipment, publishers must secure vastly enlarged readership. Under such conditions, many an entrepreneur has found himself caught up in a situation in which he has had to gain all or nearly all the potential subscribers of his area if his enterprise is to continue. Thus in many communities there has no longer been room for two newspapers as there had been in the days of Mackenzie and Howe and rival journals have given no quarter in publishing battles that have ended only when all but one contestant has been driven from the field .... This process has brought about a trend toward what Oswald
Garrison Villard has called, in reference to the United States, "the disappearing daily." Today the one-newspaper city has become the rule, the multi-newspaper city the exception.
What Professor Kesterton wrote is as true today as it was a decade ago and, if anything, there has been an intensification of the forces of economics and technology that have led to the decline of newspaper competition. It is often said that one of the great differences between publishing and broadcasting is that anyone can start a newspaper, while the number of frequencies available for broadcasting is limited and must be made subject to government control. In fact, it is probably more possible today to start a radio or television station than a newspaper, at least in a major city.
In its inquiry into the newspaper situation in Vancouver, the Restrictive Trade Practices Commission noted that all attempts in the years immediately prior to 1960 to establish a major new daily newspaper in cities already served by an existing paper had failed.
There have been few attempts since. In 1961, Le Nouveau Journal was begun in Montreal, but folded the following year. The Metro Express of Montreal and the Vancouver Times both began publication in 1964. The Times folded in 1965, and the Metro Express in 1966. The only exception to this rule of failure for newspapers in cities with existing dailies is Le Journal de Montreal, which came on the street in 1964 and today has a circulation of 48,350 and its companion paper, Le Journal de Quebec, which be gain in Quebec City in 1967, and has a circulation of some 20,000.
In all, a total of thirty papers have been started in Canada since 1957, and, with the exceptions already noted, they have been started in smaller communities lacking an existing daily, often as a result of a growth of population making it feasible to transform a weekly newspaper into a daily newspaper. Of those thirty newspapers that were started, twelve subsequently ceased publication. During the same period, five other previously established dailies passed out of existence, including such newspapers as the Montreal Herald, the Vancouver News-Herald, La Patrie, and Quebec L 'Evenement Journal.
In a discussion paper in an issue of the Anti-Trust Bulletin, Charles D. Mahaffie, Jr., Chief of the General Litigation Section of the Anti-Trust Division of the U.S. Department of Justice, applauded the development of the new competition in some metropolitan centres from the growth of suburban or community dailies: I think that one of the most important jobs facing the Anti-Trust Division is to see to it that this trend continues. In the area of newspaper mergers, we are and will continue to be particularly concerned with mergers which may eliminate the actual and potential competition afforded by the suburban, small-city and community newspapers.
In Canada, the owners of some metropolitan dailies - most notably of the Toronto Star and of the Telegram - have clearly moved to head off, if possible, the development of the kind of competition from suburban and community papers that has become such a notable feature of the newspaper industry in the United States. Through Inland Publishing Co., the Telegram Corporation Ltd. wholly owns seven weekly newspapers around the Toronto area with a total circulation of nearly 100,000, equivalent to 40 per cent of the Telegram's daily circulation. These
papers (circulation in parentheses) are: Bramalea Guardian of Brampton (12,000); Burlington Post (19,850); Mississauga News (24,119); Newmarket Era (8,158); Oakville Beaver (16,200); Stouffvi1le Tribune (6,106); Ajax-Whitby News Advertiser (11,000).
The Toronto Star last year revealed that it has had an interest in fourteen weekly newspapers in and around Metropolitan Toronto for some years. The disclosure was made at the time the Star announced that it was taking over full ownership of the Oakville Daily Journal-Record, and the South Peel Weekly of Port Credit, in which it previously shared ownership on a fifty-fifty basis with the Thomson Group. At the same time, the Star disposed of the half-interest it previously shared with Thomson in the Brampton Daily Times and Conservator, a daily newspaper, and the Georgetown Herald, a weekly. The net result was to leave the Star with controlling interest in eleven weeklies and the Oakville daily. The circulation of the Oakville daily paper is 7,792. The weeklies (circulation in parentheses) are: Aurora Banner (5,143); Burlington Gazette (9,085); Etobicoke Advertiser-Guardian (4,900); The Lakeshore Advertiser (approximately 10,000 as reported by the Advertiser); Mississauga Times (13,202); Toronto Mirror with its two editions, the North York edition (53,512) and the Scarborough edition (37,992) (total 91,434); Richmond Hill Liberal (7,435), Weston-York Times (4,149); Willowdale Enterprise (13,472) and Woodbridge and Vaughan News (3,010). The combined circulation of these weeklies amounts to 161,800 with the Oakville daily bringing the total circulation of suburban and community newspapers controlled by the Star to about 170,000, almost 44 per cent of the total circulation of the Star itself; the largest newspaper in Canada.
Announcing the transaction involving Thomson, Beland Honderich, President and Publisher of the Star, said that the acquisition of the two papers was in line with the company's established policy of investing in the development of suburban community newspaper. "What we needed to find was some way to provide detailed local coverage that would complement the metropolitan, national and foreign news in the Daily Star" he said. "We decided that the answer was to move directly. into suburban areas and provide capital to establish local newspapers to develop and improve their news coverage." Mr. Honderich took pains to emphasize the editorial independence of each of the newspapers: "In each case, these newspapers are edited by and for the people resident in the suburban communities, and we are now considering the practicability of establishing local boards of directors to supervise the editorial operation of each newspaper."
In addition to acquiring newspapers in surrounding communities that form part of its major market .area, the Toronto Star has also been experimenting with a special zone edition of the newspaper that is aimed at holding, if not increasing, the circulation of the daily in that area.
Through its Fairway Press Division the Kitchener-Waterloo Record owns six weeklies in surrounding communities. They are the Elmira Signet, the Fergus News-Record, the New Hamburg Independent, the Preston Times, the Hespeler Herald, and the Waterloo Chronicle. Their combined circulation is almost 25,000. The Restrictive Trade Practices Commission maintained in its report on Pacific Press that a further decline in the number of independent dailies would be prejudicial to the public interest. At the same time, the Commission welcomed the trend as it had developed to that point:
To serve the public in the way we consider the public should be served, a newspaper must reach a large public and bring to it news and views of comprehensive nature on a world-wide scale. A daily of this character must be a newspaper of many pages with extensive sources of information and a well-balanced editorial staff. To pay for the news and other ingredients of a large daily paper and bring it to a wide public at a price the public can and will pay, the publisher needs large revenues from advertising, which are dependent upon a large circulation. To print a large newspaper every day for a wide circulation requires ... heavy capital investment in plant and machinery. Big newspapers with big circulation in the larger cities, with a corresponding decrease in the number of dailies, are not only inevitable but desirable in providing the type of newspaper required in our present circumstances.
There are massive economies to be gained from large-scale newspaper operations. In the major
metropolitan centres, economic viability is related in an important way to the scale of operation and the competitive conditions that exist. This is not to deny, however, that in a number of less populous communities there are many smaller newspapers today that are financially sound, particularly if - as is usually the case - they face no other daily newspaper competition. While there are evident economies of scale in the operation of a single newspaper, it is far less clear that substantial economies result from the multiple ownership of any type of newspapers by a single group.
Given the more stringent financial circumstances facing smaller dailies because of their inability to obtain the full advantages of the economies of scale, it can be argued that group control provides important offsetting advantages. The combined operation of such a group may make available common news services at a price well below what each paper would otherwise be compelled to pay. Each paper may gain a price advantage through the bulk purchase of supplies, as well as provide an agency for soliciting national advertising that otherwise might be unavailable to papers of that size. Collectively, they may acquire an access to capital that would never be available individually.
Perhaps most important of all, the head office of a group of this nature is in a position to provide to each paper expertise in management that in such an operation can be particularly crucial, spelling the difference between profit and loss.
But a critical question that deserves serious consideration is whether group ownership of a large metropolitan daily is necessary because of compelling financial and economic considerations, and whether it provides any decisive advantages in the form of improved services to the public. Because of its size and financial capacity, such a paper is generally in a position to maintain a competent management of its own without being forced to look to the headquarters of a group for executive expertise. Nor is there any evidence that a large, independently owned newspaper is likely to lack reasonable access to capital on acceptable terms, or to be at any marked disadvantage in the acquisition of supplies or equipment.
At the same time, it must be acknowledged that if one independent newspaper in a community has been taken over by powerful group-interests, there may be compelling reasons for the owner of a competing independent to sell out to another group. This is particularly true if the latter is already in a weak position, making the owner fearful of being driven to the wall because of the
very large resources that might now be mustered by the new owners of the competing daily. Past experience suggests that major group-owners of newspapers competing in the same community tend strongly to reach an early detente.
It might .be argued that larger newspapers that form part of a group are able to secure important economies through their access to a common source of news, such as that available to member papers from Southam News Services. It appears significant, however, that there is relatively far less pooling of news resources by F.P. Publications. F.P. Publications for example, does not maintain a common news service for the coverage of parliamentary and government affairs in Ottawa. Although office space is jointly shared in the National Press Building, correspondents of each of the F.P. Publications dailies primarily serve their own newspapers - an arrangement that recognizes the different news requirements of each.
In this context, the rational advanced by the directors of Southam Press in 1968 for the two
acquisitions set in motion that year is of some interest:
The addition of the Montreal Gazette and Owen Sound Sun-Times to the company’s group of newspapers will strengthen our operations in a number of ways. First, both papers have been competently managed for some years by teams of men who have joined Southam as willing supporters of the ownership changes. Second, both papers will be using and helping to pay for the company’s joint advertising and news services; these, in turn, will be expanded and improved. Third, the Gazette gives the company and all its newspaper people a direct link with the intricate and vitally important national unity crisis that centres in the Province of Quebec. Your directors hope that an increase in understanding of national problems of executives of the company spread from Quebec to British Columbia will result from the normal contacts between our newspaper divisions.
Many of the considerations about scale of operation and multiplicity of ownership of daily
newspapers are considerations in the field of broadcasting. A number of smaller radio and television stations are financially precarious operations, and may gain particular benefit - both in financial terms and in terms of the service they are able to provide - through group ownership or other co-operative arrangements. At the same time, many of the larger radio and television stations are highly profitable as independent operations, and under today's conditions very viable economically.
A number of factors that enter the broadcasting picture, however, are not present, or at least not to the same degree, in combined newspapers and broadcasting operations. Informed and experienced broadcasters argue with some force that considerable economic benefits are to be derived from the common ownership and operation of a radio and a television station. Many overhead costs may be spread out over both enterprises, such as accounting, engineering, administration, and purchasing. Extensive joint use may be made of personnel in both operations, which makes it possible to obtain more qualified staff members at lower cost than would otherwise be the case. These considerations are of greater importance for smaller broadcasting operations than larger ones.
To what extent present economic conditions will continue to prevail, however, is an open question. Both the former and present chairmen of the regulatory authority over broadcasting have emphasized the advantages which they consider to flow from large group-owned operations.
Stuart W. Griffiths, President and Managing Director of Bushnell Communications, strongly argued this position when he appeared before the C.R.T.C. at its Vancouver hearing in October 1969, to support multiple ownership of CTY affiliated stations: "Looking at Canadian broadcasting in all its manifestations, we see growing an inescapable pressure towards amalgamations of various kinds."
As noted earlier, Mr. Griffiths acknowledged that not all kinds of amalgamations should be regarded as acceptable, particularly if they resulted in a reduction of choice; where motivated only by profit without any commensurate increase in service to the public; or involved an extension of mixed-media ownership:
But most broadcasters whose interest is in making a profit by improving their service, will have to turn to amalgamations of some kind in order to achieve their objectives. The economic survival of small stations is already in jeopardy with the increased costs of programming due to higher standards and higher expectations from the audience, including the expectation of colour. Larger stations face a larger number of pressures towards joining with other stations. The demands for improved technical and program production standards are greater. They move inevitably into increased community involvement. They must deal with the program needs of cablecasting. The exigencies of mobilizing blocks of Canadian capital large enough to lead to substantial development of broadcasting in this country, and the economies that inevitably derive from a larger base of operations all point to amalgamation.
The widespread installation of cable television, increased programming by cable television systems, and their ultimate introduction of commercials – all could conceivably have an adverse impact on smaller television stations, particularly those that lack the resources to adjust to radically changed conditions.
The introduction of new competition from establishment of an alternate Canadian station in a community is another variable element in the whole economic picture. Second stations have been established in a number of centres of Canada, and virtually all of those in the larger cities appear to be in a sound financial position, although this is less true generally of stations in smaller cities. In a city such as Lethbridge, with a population of around 37,000, two of the major broadcasting enterprises – Selkirk Holdings and Maclean-Hunter – are confronted y financial problems despite the fact they share facilities for operation of stations that serve partially as relays for their primary outlets in Calgary. The situation can become very much more difficult for an independent station owner operating in a relatively small community if his market becomes divided as the result of the installation of a satellite transmitter to relay the broadcasts of another and larger Canadian station based in a major city.
One alternative that has been suggested in such a situation is that the local television broadcaster be allowed to operate two transmitters, one broadcasting the network programmes of the CBC and the other of CTV. During non-network time, however, the station would broadcast only its own programming and commercials to the area it serves. But some authorities within the industry argue that most small, independent broadcasters lack the resources to fmance such an undertaking. The only alternative they consider practical is for one of the major groups to establish such a "twin-stick" operation or for the large stations operating in the nearest metropolitan city to extend CBC and CTV network programming through installation of their own partial satellite stations, each originating only a limited amount of local programmes.
WIDER CONSIDERATIONS
While the pressures towards amalgamation about which Mr. Griffiths spoke undoubtedly exist, it is difficult if not impossible to determine in any precise way the extent to which they stem from the cold logic of economics and technology, and to what extent they stem from other factors discussed in the following section. In the end, it may be possible to do no more than arrive at a judgment based more on instinct than on hard facts. Even then it is necessary to bear in mind the importance of other, non-economic factors, that affect our society in an important way.
Even assuming for the sake of argument that a case could be made for the common ownership of a number of outlets in each of the media of mass communications, other important' questions would remain. What justification can be advanced for the common ownership of newspapers and broadcasting stations? Our inquiry does not provide any evidence that there are substantial or even significant economic advantages to be derived from mixed media ownership and, indeed, one owner of a daily newspaper and radio and television stations in the same community readily acknowledged as much privately during the course of an interview. Although quality of media content has not entered into our considerations, it seems equally open to question whether mixed media ownership leads to any significant improvement in the service offered to the public by either medium.
Many of the same issues relating to groups whose business is confined to the mass media might also be raised in connection with the media interests of conglomerates having extensive financial interests in a number of other industries. But another important question arises in the case of conglomerates that involves the public interest in a vital way.
It is apparent that it is possible in the communications media for conglomerate owners to be employed - either directly or indirectly - to further or protect the other interests of the conglomerate. In Canada, there are a number of such conglomerates with extensive interests in the mass media. In some instances, particularly in the case of conglomerates made up of a number of private companies, the extent of these non-media interests is not even fully known, with the result that the public has no way of discerning if or when "an axe is being ground."
The following examples are only illustrative of the potential for conflict of interests and are not intended to imply that related media and non-media interests are improperly used.

M. Paul Desmarais of Montreal owns over 80 per cent of Gelco Enterprises Ltd. which in turn owns La Presse, the largest French-language daily in Quebec, and owns 46.6% of Trans·Canada Newspapers Ltd., which publishes three French dailies and a number of weeklies. At the same time, M. Desmarais owns 35.6 per cent of Power Corporation of which he is Chairman and Chief Executive Officer. Power Corporation has widespread non-media interests, including Shawinigan Industries Ltd., Canada Steamship Lines Ltd., Imperial Life Assurance Company, Dominion Glass Company Ltd., Show Mart Inc., Blue Bonnets Raceway Inc., Chemcell Ltd., Laurentide Financial Corporation Ltd., and Argus Corporation (which itself is a holding company with other extensive industrial interests that also controls Standard Broadcasting Corporation Ltd). Power Corporation also has a significant holding in the Investors Group, which in turn holds shares in virtually every sector of the Canadian economy. Argus, which among other broadcasting holdings controls radio stations CFRB (Toronto) and CJAD (Montreal), has extensive interests in B.C. Forest Products, Dominion Stores, Domtar, Hollinger Mines, and Massey-Ferguson.
One of the most diverse conglomerate operations is that controlled by K.C. Irving of New Brunswick, who also has extensive newspapers and broadcasting holdings in the province. In the case of most of the non-broadcasting properties, the full extent of the Irving interest is unknown. The section of this report dealing with the Irving holdings, however, contains a list of all the provincial and inter-provincial companies registered with the New Brunswick Provincial Secretary in which Mr. Irving or members of his family are listed as officers and/or directors. These include oil refining, service stations, machinery, pulp and paper, shipping, highway transportation, construction, mining, fishing, lumber, and dry dock facilities.
The McConnell family, which through Commercial Trust Co. Ltd. controls the Montreal Star and Montreal Standard Publishing Company, which publishes Weekend, Perspectives and Perspectives!Dimanche, and which has applied to the C.R.T.C . to purchase Cable TV Ltd. in Montreal from Famous Players, has indicated non-media interests in SLSR Ltd. (previously St. Lawrence Sugar Refineries Ltd.), Aero-Hydraulics Corp., Canada Cement Co., and Belding-Corticelli Ltd.
James Pattison, who controls radio station CJOR (Vancouver), also controls Neonex International Ltd., a recently-created conglomerate with interests in a supermarket chain, a paint company, a finance company, distribution of sporting goods and equipment, a magazine and paperback distributing company, a large trailer manufacturing company, two trucking firms, a helicopter charter service, a large General Motors dealership, a sign company, a major floor-covering distributorship, and a milling and food products enterprise.
Through the Telegram Corporation Ltd., the Bassett-Eaton interests control CFTO-TV (Toronto), the Telegram of Toronto, Glen-Warren Productions Ltd. � which produces shows and commercials for television - and Israel Canada Productions (based in Tel Aviv) which produces 80 per cent of Israeli television. The Telegram Corporation also owns seven weekly newspapers through its subsidiary, Inland Publishing Co. Ltd. Another subsidiary of the Telegram Corporation Ltd., the Telegram Publishing Co., holds 19.7 per cent of the common shares of Maple Leaf Gardens Ltd. and 31 per cent of the common shares of Argonaut Football Club Ltd. The non-media interests of the Eaton family are very extensive. According to the D.B.S. report

on inter-corporate ownership as of 1965, they include Eaton's (Canada) Ltd., The T. Eaton Co. Ltd., Berkley Contracting Ltd., Eaton Centre Ltd., T. Eaton Acceptance Co. Ltd., T. Eaton Drug Co. Ltd., T Eaton House Furnishings Co. Ltd., T. Eaton Realty Co. Ltd., Franklin Manufacturing Co. Ltd., Greenwich Canadian Co. Ltd., Guelph Stove Co. Ltd., International Realty Co. Ltd., Mace Development Ltd., Spencer David Ltd., and Trail Mercantile Co. Ltd.
RKO Distributing Corp. (Canada) Ltd. owns two radio stations in Windsor which are subject to divestiture under the foreign ownership regulation. This company is controlled by RKO General Inc. of the United States which in turn is controlled by the General Tire and Rubber Co., a leading American conglomerate. RKO Distributing also controls Fleetwood Corp. in Canada according to the D.B.S. record of inter-corporate holdings for 1965. Among other interests in this country, General Tire owns the General Tire and Rubber Co. (Canada) Ltd.
Famous Players Canadian Corporation Ltd., which is in the process of divesting itself of widespread holdings in the broadcasting and cable television field to comply with foreign-owner restrictions, has long had extensive interests in other fields. It is the largest owner and operator of motion picture theatres in Canada and has interests in bowling centres, confection distribution, hotels, and the Ontario Muzak franchise.
The principal shareholders and officers of F.P. Publications Ltd., whose daily newspapers have the largest combined circulation of any group in Canada, have widespread financial interests in other non-media areas. They are G. Maxwell Bell, Chairman, and R. Howard Webster, Deputy Chairman of the Board of Directors. The extent of their non-media interests is not known with any precision. However, Mr. Bell, who is understood to have extensive holdings in the petroleum industry, is listed in the Directory of Directors for 1968 as a member of the boards of The Jockey Club, Canadian Pacific Railway Co., The Bank of Nova Scotia, and Northern Electric, as well as those of a number of newspapers that form part of the F.P. group. Mr. Webster is listed as chairman of The Globe and Mail Ltd., Windsor Hotel Ltd., Lord Simcoe Hotel Ltd., and the Penobscot Building, Detroit, and president of Detroit Marine Terminals, Inc., Canadian Fur Investments Ltd., Durand Corp. and Annis Furs (Detroit). He is also a director of Sun Publishing Co. Ltd., which forms part of the F.P. group.
Without further belaboring the obvious potential for conflict of interest that can arise within conglomerates with media holdings, it may be worth recalling that for some years it has been the expressed policy of Southam Press to maintain no financial association with enterprises outside the communications field. Officers, editorial personnel, and other key employees of the company are also expected to remain free from political and other outside activities if they "might influence or appear to influence the editorial freedom or independence of any of the company's publications. "
THE URGE TO GROW If most of the larger Canadian dailies and, equally, most of the larger radio and television stations are at present capable of being economically viable as independent operations, the question then arises why there has been such a marked trend toward their absorption by large groups. The answer may have been provided in part years ago by Roy Thomson: the normal
human spirit of acquisitiveness. "I am in the business of making money and I buy more newspapers in order to make more money to buy more newspapers to make more money to buy more newspapers ... " he once declared.
In 1965 (when this remark appeared), Lord Thomson was estimated to control more than 100 newspapers, 200 magazines, twenty-five printing companies, seventeen television stations, twelve radio stations, two book publishing companies, two airlines, and a number of other interests.
In The First Freedom, Bryce W. Rucker observed:
Their lavish incomes stake them to more monopoly papers, which further enrich them. If you doubt the formula, listen to William Randolph Hearst, Jr., editor-in-chief of Hearst newspapers. He said that if one were to merge independent morning and evening papers which earned $100,000 a year, the profits under monopoly ownership would be $500,000. Is it any wonder chain operators try to drive competition out of business? Or that .. few competitive dailies remain?
Among the groups, whether public or private, there is a strong and deep-seated compulsion
toward constant growth and expansion.
In the annual report of 1968 of Selkirk Holdings Ltd., already one of the largest broadcasting groups, President J .S. MacKay noted that the company continued its policy of acquisition because, "While we recognize the importance of a continuing review of our holdings, we also recognize the necessity of Selkirk continuing to grow in order to maintain our position as a leading publicly owned broadcast communication company."
In the annual report, of 1969, Mr. MacKay stated: "A basic policy of your company is to pursue a balanced diversified expansion of its investments with due regard to the public interest as expressed in legislation and interpreted by the Canadian Radio-Television Commission."
To provide for its own future growth, another major public broadcasting company, CHUM Ltd. announced in September, 1969, that it was seeking shareholder approval at a special meeting of an extensive reorganization of the capital structure in order to facilitate the company's expansion plans.
The propensity for growth was also underlined in the statement of President Donald F. Hunter to Maclean-Hunter shareholders in the annual report of 1969. He wrote:
Your company set new records in revenue and income during 1969, with virtually all divisions and subsidiaries contributing to the increases. These results are particularly gratifying after the slow-down in 1968. . Revenue increased to $58,500,000 from $47,669,000 and consolidated net income to $3,335,000 (83.4¢ per share) from $1,946,000 (48.7¢ per share) in the previous year.

Maclean's magazine, which began 1969 with its new, standard magazine page size, showed an increase of 25% in total number of advertising pages ... Chatelaine, for the first time in history, recorded press runs of over one million copies in every month ... The general outlook for Maclean-Hunter business publications is healthy and encouraging ... Careful attention is being given to the new technologies of communicating business information so that when they become practical they can be utilized as an extension of our existing services. In the printing division ... we are continuing to expand out facilities ... A major step taken during the year was the refinancing of our community television antenna operations with the public issue of debentures and stock in Maclean-Hunter Cable TV Ltd., with your company retaining control with 60.4% of the common shares. A total of $14,520,000 was raised through the arrangements which were completed in January 1970, and after paying off the substantial bank loans which have been necessary to finance our cable TV expansion to date, there was a cash surplus of about $3,200,000. This is being used to complete the new systems we are developing in the Toronto and St. Catharines areas in the next two years. The major additions to our Cable TV operations during the year were the purchase of systems in Hamilton, London and Peterborough, and the approval of new licenses for the city of St. Catharines, the towns of Ajax, Pickering Streetsville, and certain areas in the Township of Mississauga, near Toronto. Maclean-Hunter Cable TV Ltd. now has 90,000 subscribers in seventeen systems in Ontario and we anticipate that it will generate a good return over the long term. At the same time, we will be watching with interest the pronouncements of the Canadian Radio-Television Commission with regard to the content of programming, microwave distribution and the possibilities of advertising on Cable TV.
While part of this growth and expansion of the group media owners may take the form of
establishing new services, their future appears to rest heavily on the acquisition of existing media outlets either from independents or other groups. It seems evident that the consequence of such acquisitions can only be the continued concentration of media ownership during the coming years.
As later sections will indicate in more detail, there are a number of other factors that serve to facilitate this development in varying degrees. The federal regulations restricting foreign ownership of broadcasting stations, for example, may be desirable in themselves, but the forced divestiture of foreign-held shareholdings is resulting in a substantial proportion of these interests being gathered into the hands of already large Canadian groups, particularly those that are public companies. It has been estimated by some knowledgeable authorities that around $100 million in broadcasting assets will be forced on the market by the foreign-ownership provisions.
Concern among many independent owners about the consequences of succession duties, while not necessarily founded on fact, appears to have provided a significant incentive to sell. A further incentive to sell has developed in recent years from a desire to avoid the impending imposition of capital gains taxes feared by many media owners.
Quite apart from any innate instinct for growth, the income tax also appears to provide a substantial incentive for groups to become eager buyers in the marketplace. Proposals For Tax Reform, the federal government's White Paper on Taxation made public in November, 1969, outlined· the nature of the encouragement provided by the present tax structure:
If a corporation which earns a large profit distributes that profit to its shareholders, the present system classifies those distributions as income and levies an income tax on them, just as it does on wages and salaries. On the other hand, if the corporation does not distribute the profits the value of shares in the corporation will almost certainly increase. If a shareholder realizes on his share of that increase by selling his shares at a profit, the present system usually classifies that profit as a capital gain and it is tax-exempt.
Many of the media groups generate substantial profits from their operations. For example, one
of the largest, Southam, reported net income after tax in 1969 of $8.07 million, up $450,000 from the previous year. This represented 15.3 per cent of total assets and a profit of $.077 on every dollar of operating revenue. Out of net income of $8.07 million, Southam paid out $4.18 million in dividends and charged an amount of $5.49 million against retained earnings, representing the excess of cost of properties acquired during the year over the value attributed to their net tangible assets. This reduced consolidated retained earnings at year-end, 1969, to $27.9 million from $29.5 million at year-end, 1968. The Southam annual report of 1969 notes that:
New records were established for revenue and profits; the former exceeding $100,000,000 for the first time ... Although operating revenues increased 33.5 per cent, inflationary pressures on wages and material costs produced a 37.2 per cent rise in operating expenses. The end result was a 13.3 per cent increase in profits before capital losses.
The net profit of the company, from which the retained earnings were derived, represented the
balance left from earnings after the payment of federal and provincial corporation taxes. The dividends paid in cash, $4.185 million, were, of course, liable to personal taxation in the hands of the shareholders. The retained earnings, however, were not liable to further taxation so long as they were not paid out as dividends. They might, however, be used to purchase additional newspapers or other assets. The management might well have every reason to hope and expect that in time these new acquisitions would contribute to an appreciation of the capital value of the company, which in turn would produce a tax-free capital gain in the value of the shares owned by its stockholders. The same effect might be achieved by acquiring new assets in whole or in part through the distribution of company shares to the seller, the amount of cash involved in the transaction being reduced commensurately.
The issue is more than academic, since the newspaper industry generally has a substantial volume of retained earnings ready for profitable investment.
In its annual report of 1967, Southam said that it had acquired a substantial minority interest (49 per cent) in the Brandon Sun at a cost of $586,000. The company's investment in Selkirk Holdings was increased by 77,000 class A shares to a total of 257,000, partly by purchase in the open market and partly by the exchange of Southam's 20 per cent interest in Calgary Television Ltd., for Selkirk shares. In November, 1968, the company acquired a 50 per cent interest in Greater Winnipeg Cablevision Limited. "The funds necessary to finance the company's capital expenditures and investments were provided mainly by retained earnings and depreciation," the directors reported. Despite these acquisitions, working capital of the company increased that year by $1.289 million.
The annual report of 1968 noted that early in 1969 Southam completed the purchase of the Owen Sound Sun- Times for $950,000 in cash. The Gazette Printing Company Limited comprising the daily newspaper and a weekly which it owned, were acquired for $3.710 million in cash and 100,000 Southam shares, which, at the then-current market price, would have been worth approximately $6.0 million.
On May 1, 1969, Southam purchased the Citizen, a daily newspaper published in Prince George with a circulation of approximately 12,000, for $2 million. The Southam annual report of 1969 noted that: "The funds for these acquisitions and for the additions to plant and equipment were provided from operations, by bank credit and by the issue of 100,000 common shares [as partial consideration for the Gazette purchase]. Working capital at year end was $4,626,000, down $557,000 on the year, but adequate for our requirements."
In the view of a number of senior management officials, public companies, particularly those with shares listed on one or more of the major stock exchanges, often enjoy a significant advantage over private groups in bidding for the purchase of existing media outlets. They point out that in relation to current earnings, the shares of a publicly-listed company are usually valued at a considerably higher multiple than that commanded by the shares of private companies. The Financial Post's Corporation Service estimated the market value of the outstanding shares of Southam Press as of April 25, 1969, was 25.1 times current earnings. It has been suggested to us that a price/earnings ratio of 10/15 would be a reasonable norm for private companies.
One senior executive, whose company is in the process of disposing of substantial interests in broadcasting and cable television, contended that public companies were usually able to outbid private companies for facilities being offered for sale because of this important difference in the multiple of price to earnings. By way of illustration, he pointed out that a private company whose own shares were likely to command no more than ten to twelve times earnings if they were offered for sale would be extremely reluctant to pay a price that would represent a significantly higher multiple for a new acquisition. On the other hand, a public company whose shares were traded at a multiple of, say, twenty times earnings would have no hesitation in paying a price that represented eighteen times the current earnings of the asset being purchased because the effect would be to improve its own relative earnings position. It is this kind of arithmetic that has

accounted for the upsurge of many public companies, particularly the mammoth conglomerate corporations that have sprouted on both sides of the border.
In addition to the increasingly dominant position assumed by a number of groups individually in the field of mass communications, there appears to be an emerging trend toward the development of common interests between various major groups.
This is evident in the eight-year partnership of the Thomson group and the Toronto Star in the ownership of a limited number of small daily and weekly newspapers, recently abandoned, and the closely intertwined interests of Southam and Selkirk. It was reflected also in the proposed partnership of the Bassett-Eaton and Maclean-Hunter interests attempting to purchase the RKO television station in Windsor, and in the long-standing common interest of Southam and F.P. Publications in the Vancouver Sun and Province.
The joint venture launched by the Toronto Star and Southam in forming Southstar Publishers Limited, which publishes and distributes the Canadian and Canadian Homes to thirteen papers as weekend supplements and also sells the Canadian Star Weekly on newsstands, is another example.
If additional evidence of this trend were required, it was furnished by the announcement, in 1969, that the Southstar papers would henceforth be printed by the Montreal Standard Publishing Company in Montreal. Montreal Standard publishes Weekend and is a direct competitor of Southstar in the weekly supplement field. The two competitors also joined forces to form Magna Media Limited, a new company whose function is to sell advertising for the publications of both companies.
The Commission has reconsidered the policy adopted by the B.B.G. in March, 1966, of prohibiting multiple interests in CTV -affiliated stations, other than those existing at the time. The factors resulting in this policy issued in December, 1969, are important.
The B.B.G. directive stipulated:
It will be the policy of the Board not to approve (a) any transfer of shares referred to it which would result in one person holding shares directly or indirectly in more than one company licensed to operate an affiliated station; or (b) any arrangement subsequent to this approval whereby any person may in any other way, participate in the control or management of more than one company licensed to operate an affiliated station. Notwithstanding this policy, control of CICH·TV in Halifax had already been allowed to pass
from the hands of Finlay MacDonald, a local resident, to that of CTV Atlantic Ltd., in which the CTV network had a 50 per cent interest, at the time the C.R.T.C. came into existence. Through a decision announced on March 21, 1969, the Commission approved an application which had the effect of authorizing the CTV network, which is controlled on an equal share basis by each of the affiliated stations, to increase its interest in CICH-TV to 75 per cent.

The C.R.LC. offered the cryptic explanation that it approved the share transfer "because it appears to be the most practical solution in the interest of the station's performance and the network at this moment." The Commission added that it would be "interested in the methods used by the licensee to ensure community participation and safeguard community interests." Similar expressions of interest in maintaining community participation have accompanied a number of other C.R.T.C. decisions approving the complete takeover of local financial holdings by major broadcasting groups.
As a condition of the CICH share transfer, the Commission stipulated that the stock of the Halifax station in the CTV network should not be voted. It further provided that Mr. MacDonald would represent the station on CTV's board of directors "and that he will discharge his duties independently in the interests of the Halifax TV station”.
Given the fact that Mr. MacDonald's share interest had been reduced to a nominal position, the responsibility imposed on him would appear to be at odds with the realities of corporate power.
On July 23, 1969, the C.R.T .C. announced its intention to reconsider the policy concerning ownership of shares in affiliates of the CTV network established by the B.B.G. At the same time it authorized Selkirk Holdings and the Western Broadcasting Co. to acquire all the shares of Canastel Broadcasting Corporation. Canastel, in turn, owned a substantial minority of the shares of British Columbia Television Broadcasting Systems, operator of CHAN-TV in Vancouver - a CTV affiliate - and CHEK-TV in Victoria - a CBC affiliate.
Both Selkirk Holdings and Western Broadcasting have a strong minority interest in British Columbia Television. The effect of the decision, therefore, was to give them a significant minority interest as well in a second CTV affiliate, CICH-TV.
Having approved this move, the Commission filed the caveat that it would defer a decision on the disposal of the shares owned by Canastel in CICH Limited until after its review of the B.B.G. policy on multiple ownership of the network. This reservation, however, clearly failed to cover the breach of the former B.B.G. policy.
The C.R.T.C. explained that it was reviewing the B.B.G. directive because "recent developments in broadcasting, such as the extension of second English-language television service and the Order-in-Council on foreign ownership, have brought about several applications which relate to this policy established by the Board of Broadcast Governors."
In October, 1969, at the C.R.T.C. hearings in Vancouver, opportunity to express opinions on CTV multiple ownership was given to broadcasters. Reference was made earlier to the arguments in favour of dropping the blanket rule against multiple ownership of CTV affiliates advanced by Stuart Griffiths, the Bushhnell spokesman. Bushnell Communications had at the time applied for C.R.T.C. approval of the purchase of CFCF in Montreal, three other television and four other radio stations owned by the Thomson and Davies interests. Bushnell already owned CJOH-TV of Ottawa.
During his testimony, Mr. Griffiths made a point of denying press reports that Bushnell's purchase of these stations, together with a number of cable television companies, represented part of a power struggle with the Bassett-Eaton interests, who through CFTO-TV in Toronto have a major stake in the financing and programming of the network. However, he left open the possibility that the move could portend a struggle in other areas, since he suggested that cable television was "rapidly overtaking the two networks now."
E. A. Goodman, representing the Bassett-Eaton broadcasting interests, agreed with Mr. Griffiths that the Commission should consider the ownership of CTV affiliated stations on the merits of each case: "We submit there are advantages to allowing certain larger groups to grow up in broadcasting in Canada." While asserting that the Bassett-Eaton Group had no present negotiations for the acquisition of an interest in another CTV station, he acknowledged that it was negotiating for the purchase of two television stations affiliated to the CBC network.
Mr. Goodman advanced these arguments in support of multiple CTV ownership:
The first is that if CTV is to effectively compete both with its American competition and with the Canadian Broadcasting Corporation, it is essential that the network maintains a national outlook with an ever-increasing degree of program excellence. This can best be achieved by allowing national growth in those broadcasting groups which have significant investments in Canadian broadcasting. At the present time, almost 60 per cent of the households that receive the CTV signal are also able to receive a signal from at least one, and often two or three, American networks. The percentage of CTV households that receive the CBC signal is, of course, almost 100 per cent. This requires CTV to expend significant sums of money both in the production and in the purchase of program packages. The history of the network is that those stations that have the most resources are both willing and able to spend larger sums on programming, even on a pro rata basis. The next argument is that allowing certain broadcasting groups to have either regional or national holdings will not denigrate from the standard of local coverage that is given by their individual stations but will increase it. We believe that an examination of the news, public affairs and community service provided on a local basis will show that the stations with more resources are just as interested in doing local broadcasting as smaller stations and more able to do so. If Canadian programs are to compete with the best American programs, it is necessary that the programs produced be of international stature with international sales. This again requires large resources. The allowing of larger broadcasting holdings will facilitate higher standards of production and will assist not only the broadcasting industry but individual Canadians in the industry. Under the existing corporate structure of CTV, there is available the means to allow legitimate expansion of broadcasting interest and still offer protection to the smaller stations of the network and prevent control being assumed by anyone group or combination of groups.

Two reservations about a change in the B.B.G. policy were fIled with the C.R.T.C. Central Ontario Television Ltd., which owns CKCO-TV in Kitchener-Waterloo, a CTV affiliate, contended a company with an interest in one affiliate should be permitted to hold a minority interest in another, but not to exercise control or management of more than one network station.
While the CTV network operated on the principle of "one station, one vote," experience had suggested that some votes were more equal than others, the company said. Those stations that carried the largest share of the financing load and responsibility for programming tended to have unequal influence:
If there was any significant reduction of varying viewpoints through combination
amongst the middle-level stations or if, conversely, one organization were in a position to have a vote representing a half, or almost half of the total cost of any program under discussion, it would seem apparent that decisions could be influenced by the lack of breadth amongst the participants, or by the concentration of effective voting power represented by such a large proportion of the cost.
The National Association of Broadcast Employees and Technicians suggested that no interest
should be permitted to have effective control of more than two stations affiliated to a single network and that a limit be placed on the total number of television stations controlled by a single interest.
On December 23, 1969, the C.R.T.C. announced its revised policy on CTY multiple ownership. The policy supports the C.R.T.C.'s applied philosophy to examine and evaluate each situation on its own merit "taking into account policies established by the Commission, circumstances surrounding each application and factors likely to affect the overall development of the CTV network."
The first major opportunity to see this policy applied came in the Bushnell Communications decision. On July 6, 1970, it was announced that Bushnell could acquire CFCF-TY in Montreal and CKWS-TY in Kingston - both CTY affiliates together with CHEX-TY in Peterborough and CFCH-TY in North Bay. The decision also granted to Bushnell' eleven radio stations in seven cities, and Cablevue (Belleville) Limited. Among the conditions for licence, the C.R.T.C. included the following concerning its reasons for permitting multiple ownership of the CTY affiliates:

Page 27 missing
against competition from newcomers, leaving both to succeed or fail upon the basis of their service to the public. The Commission had consistently sought free and open competition and refused to consider economic injury in any aspect as being a factor in the public interest." This position, he subsequently admitted, had been somewhat modified as a result of a court decision decreeing that economic injury had to be taken into account when it would result in the reduction or elimination of service to the public.
One of the elements that need to be taken into consideration in relation to ownership concentration is cable television. At present, the vast majority of these systems are employed in a passive way to relay the signals of existing television stations. The C.R.T.C. has made it clear, however, that it expects cable systems to begin playing an increasingly active role by undertaking an increasing volume of programming of their own.
The C.R.T.C.'s stated policy of favouring local ownership of cable systems, while at the same time remaining unwilling to give cable licences to other media owners in the same community, suggests that herein lies a method of diversifying media ownership. However, this seems to be in conflict with the Commission's desire to license operators capable of producing, in time, high quality cable programming, which implies that these owners should have some experience in broadcasting.
The cable systems, therefore, offer the opportunity for provision of increased diversity of programming and of ownership. In its submission to the C.R.T.C. in October, 1969, on the question of microwave relay systems in conjunction with cable television, the Canadian Association of Broadcasters suggested that the dual ownership of a television station and a cable television system should not be regarded as producing excessive concentration of ownership because the latter would only be assisting the former in extending its service in keeping with the provisions of the Broadcasting Act.
Considering the fact that many cable television systems are, in fact, the instrument of increased competition for many local television stations, this is a rather dubious argument. It becomes even more so when the possibility of cable systems becoming increasingly involved in their own programming is taken into account. To date, the C.R.T.C. - as indicated later - has been inclined to frown on such dual ownership. It has not, however, adopted any overall policy in this regard. In Ottawa, for example, Ottawa-Cornwall Broadcasting Limited (previously Bushnell Communications), which operates CJOH-TV in Ottawa, also holds 75 per cent of Laurentian Cablevision Limited in Hull and a minority interest in Skyline Cablevision Limited in Ottawa. However, the C.R.T.C. refused to allow a complete takeover of Skyline in its decision of July 6, 1970. More common is the C.R.T.C.'s refusal to permit owners of other local media to participate in the ownership of community cable systems.
Two types of ownership concentration have been more favourably received by the C.R.T.C. These are: first, multiple ownership of cable systems by corporations not involved in other media operations; and second, ownership of cable systems by corporations involved in media operations not adjacent to the cable operation(s).

Jarmain Cable Systems Limited has restricted its operations to date to cable. Currently it owns five systems extending to London, Oshawa, Chatham, Paris, Bowmanville, Bradford, and Holland Landing. David R. Graham, through three separately incorporated companies, holds interests in three systems in Winnipeg, Toronto, and Calgary.
With the increasing attractiveness of cable, many of the major media corporations started collecting systems. Famous Players, best known for its widespread interests in motion picture theatres, held, at the end of 1969 at least partial ownership of nineteen cable systems. At the same time, it shared ownership in eight television and two radio stations. Famous Players, because it is American-controlled, is now disqualified and is endeavouring to sell its holdings.
Southam Press Limited directly or indirectly holds interests in six cable systems. Southam plans to consolidate its broadcasting interests in Selkirk Holdings, subject to C.R.T.C. approval. Selkirk has interests in seven television and five radio stations.
Maclean-Hunter Limited, Canada's leading publisher of consumer magazines and business publications, has purchased and received licences for seventeen cable systems in Ontario operated by three companies; Maclean-Hunter Cable TV Limited, Peterborough Cable Television Limited, and Huron Cable TV Limited.
Some of the earlier C.R.T.C. decisions reflect concern over too much concentration of ownership regionally among broadcast holdings and between broadcast and cable holdings. One involved an application by British Columbia Television to authorise Famous Players' and Selkirk's increasing of their minority holdings in the company. In rejecting the application, the Commission said that it was
concerned about excessive concentrations of ownership in communications media. Two aspects of excessive concentration are apparent in this application. One is the ownership of the CTV Network through its affiliated stations. The other aspect is the general matter of ownership of broadcasting stations and CA TV systems.
Recalling the pronouncement of the B.B.G. with regard to multiple interests in CTV
affiliates, the Commission noted that Famous Players already was a shareholder in CKCO-TV, Kitchener, and CHAN-TV through its holdings in British Columbia Television. 'The Commission confirms the policy statement of the B.B.G. and will not now authorize a transfer of shares which would increase the participation of any person or party in the ownership, control or management of more than one company licensed to operate an affiliated station of the CTV Network."
The C.R.T.C. further opposed the application because it would result in a further increase in the 26.7 per cent of the company shares already held by Selkirk: "With respect to the proposal by Selkirk Holdings Ltd. to purchase shares in British Columbia Television Broadcasting System Ltd., the Commission notes that Southam Press Ltd. is a shareholder in Selkirk Holdings Ltd." The announcement continued:
Southam Press Ltd. and Selkirk Holdings Ltd. have direct or indirect interests in several other Canadian FM, AM and television stations, as well as in CATV systems. Concentration of ownership is a complex problem which is made more difficult by the distribution of the population of Canada. The Commission realizes that the development of communication in Canada may sometimes require the participation of large entities. However, considering the facts before it at this time the Commission has decided to deny this application. In March, 1969, the Commission authorized Western Broadcasting Co. to increase its minority
holdings in B.C. Television substantially through the purchase of shares from another company, although Western Broadcasting had extensive broadcasting interests at that time.
The Commission has taken into account the existence of a pre-emptive rights agreement among the shareholders, but decided that other factors, such as balance of ownership and the need to clarify a complicated ownership situation in the interests of the station's performance were of greater importance in these circumstances. [Again without further explanation.] On July 23, 1969, the Commission, as previously pointed out, permitted Selkirk and Western
to acquire a share interest for the first time in Halifax's CJCH-TV, another CTV station, and to increase their holdings in British Columbia Television through the purchase of Canastel. This decision not only conflicted with the B.B.G. ruling regarding CTV affiliates, but also conflicted with the position previously taken by the C.R.T.C. with regard to increasing the holding of Selkirk in British Columbia Television because of its already extensive interests in broadcasting and the large minority share holding of Southam in this company.
The C.R.T.C. also raised the problem of ownership during 1968 in connection with an application for the renewal of the licence of radio station CHSJ in Saint John. This station, as well as CHSJ-TV in Saint John, is owned by the Irving group, which includes among its media holdings the ownership of all five of the English-language daily newspapers in New Brunswick. The C.R.T.C. announced that it was renewing the licence for a period of only one year, to March 31, 1970, and explained: "The Commission is developing a licensing policy which will take into account concentration of ownership in the media serving a community. The Commission will reconsider this licence in the light of the new policy."
The new policy has yet to be disclosed, nor, it appears, may it ever be handed down in a single policy statement per se. As the annual report of the Commission in 1969 states:
The Commission's continuing concern about concentration of ownership of broadcasting undertakings and the evolution of policy in this sphere can be traced in decisions taken throughout the year. Conditions relating to concentration of ownership were attached to decisions on licence applications by the following: Express Cable Television Limited, British Columbia; Surrey Cablevision Limited, British Columbia; British Columbia Television Broadcasting System Ltd., B.C.; Rogers Cable Television Limited, Ontario; Baton Broadcasting Limited, Ontario; New Brunswick Broadcasting Limited, N.B.
Many of these decisions have been herein discussed.

In a separate decision, the Commission also denied an application for renewal of the licence previously granted by the Department of Transport to Saint John Cablevision Ltd. to maintain a broadcasting undertaking in the city. Ownership of this company, which never went into operation, was equally divided between Irving and Famous Players. "In its announcement of June 13, 1968, the Canadian Radio-Television Commission expressed its concern about excessive concentration of ownership in communication media. In view of this concern, the Commission will not approve this application in the public interest."
"However, the Commission approves of this share transfer because it appears to be the most practical solution in the interest of the station's performance at this moment. The Commission will be interested in the methods used by the licensee to ensure community participation and safeguard community interests." The decision did not disclose why the station's performance suffered because Maclean-Hunter, while having a majority interest, fell short of complete ownership of all outstanding shares. The C.R.T.C. never indicated subsequently what methods have been adopted by the licensee "to ensure community participation and safeguard community interests," nor whether these methods are to its satisfaction. Judgment will not likely come until application for licence renewal is made two years hence.
A similar situation arose in the case of Great Lakes Broadcasting System Ltd., a licensee of radio stations in Chatham, Orillia, and Kitchener. hi this instance, the C.R.T.C.. authorized Maclean-Hunter to increase its percentage of ownership from 50 per cent to 100 per cent. Again the C.R.T.C. maintained it was the most practical solution in the interests of the station's performance and again expressed interest in the arrangements for safeguarding community interests and providing community participation.
In its decision of July 6, 1970, the C.R.T.C. openly expressed its concern over another type of media concentration - mixed-media ownership. The decision granted Bushnell Communications Ltd. the right to purchase and operate all of the Thomson-Davies broadcasting interests. It noted that: "These applications lead to the separation of a group of broadcasting stations from a significant newspaper group. The Commission thinks this separation is desirable. Under the circumstances, the Commission accepts the arrangement which results in the entire broadcasting group being transferred to the applicant."
The decision resulted in a reduction of the Thomson-Davies newspaper and broadcasting concentration but increased considerably the broadcasting ownership concentration of Bushnell Communications Limited. This suggests that the C.R.T.C. prefers broadcasting concentration to mixed-media concentration, while of course retaining reservations about concentration of any kind. Presumably the same concern over mixed-media ownership acted in the request that F.P. Publications dispose of its shares in Community Antenna Television Limited, which is licensed to operate in Calgary.
One of the strangest cases involves the decision, in August, 1968, by the C.R.T.C. approving the sale by Roy G. Chapman and Mrs. A. M. Chapman of approximately one-third interest in Okanagan Valley Television Company Limited, operator of a primary television station in Kelowna and satellite stations in eight other communities, including Penticton, to British Columbia Television Broadcasting System Limited. British Columbia Television operates television stations in Vancouver and Victoria, and its control is divided among Western

Broadcasting, Selkirk, and Famous Players - all of which have other extensive broadcasting interests. At the time British Columbia Television acquired its one-third interest in Okanagan, Selkirk held one-third directly, through a wholly-owned subsidiary, the remaining one-third being held by the Bromley-Browne family. The C.R.T.C. advanced the following reasons for the approval of this share exchange, and, in the process, sought to develop something of its own philosophy with regard to ownership:
The C.R.T.C. maintains concern regarding concentration of ownership of communications media. It is convinced that equitable balance of ownership is a form of guarantee for safeguarding community interests and sustaining the presentation of vital news and informational services. In addition to criteria already expressed by the B.B.C. in various licensing decisions, the C.R.T.C. has four points of consideration used in making decisions regarding ownership of broadcasting outlets: 1. The balance between shareholders from the community and shareholders from outside the community to be served by the station. 2 The balance on the Board of Directors of the company between members of the community to be served by the station and other members of the Board. 3 The capacity of the company - as demonstrated by the structure of ownership and by the composition of the Board of Directors - to understand the characteristics of the community to be served and to meet the various needs of that community, 4 Extent of ownership of other commercial undertakings which might influence the performance of broadcasting stations. The Commission recognizes, as well, the need for adequate economic resources in the natural development and expansion of broadcasting. The decision to allow the transfer of shares of CHBC-TV, Kelowna, B,C., to British Columbia Television Broadcasting System Ltd., is directly related to a normal need for expansion and improvement of general broadcasting service as well as assurance of the continued capacity of local participation as a safeguard for community interests. Having set out some of the factors considered, the C.R.T.C. indicated that in its opinion
economic and financial considerations outweighed those relating to community participation or concentration of ownership. However, the C.R.T.C. provided no insight for the public into the lack of adequate economic resources that resulted from the one-third Chapman ownership, nor did it suggest how any prospective deficiency would be better overcome by the one-third participation of British Columbia Television.
This decision by the C.R.T.C. provided for Mr. Chapman to retain one share in Okanagan to continue qualifying as a director of the company. In October, 1969, however, the C.R.T.C. had before it applications for new television stations from B.C. Television and Mr. Chapman which not only were directly competitive, but which also would provide extensive direct competition for Okanagan if either was approved.
British Columbia Television, which now holds a one-third interest in Okanagan, applied for permission to establish stations in Kamloops and Kelowna (the site of Okanagan's primary station) to relay broadcasts of British Columbia Television's CHAN-TV in Vancouver. British Columbia Television further proposed that the Kelowna station be employed to further relay CHAN signals to relays in Vernon and Penticton (where Okanagan also has a relay station.)
Mr. Chapman, the sale of whose interests in Okanagan to British Columbia Television was related to the future financing of the company's growth, applied for a licence on behalf of a company to be incorporated. He proposed to establish a new primary television station at Kelowna and satellites in Penticton and Vernon, which presuppose some substantial financial backing.
At the C.R.T.C. hearing in Vancouver in October, 1969, Mr. Chapman withdrew his application in favour of the competing proposal of British Columbia Television. The latter company argued that the move would enable it to secure additional national advertising revenue not available to the competing American television station KVQS, in Bellingham, just south of the British Columbia border. The company undertook to guarantee the independently owned television station in Kamloops and Okanagan, in which British Columbia Television has a one-third interest, that it would make up the difference if their national advertising revenues did not increase by 10 per cent a year.· Approval of this proposal would result in British Columbia Television's CTV station in Vancouver competing with two CBC affiliates, in one of which it has a one-third interest, while at the same time guaranteeing them a specific annual increase in national advertising revenue.
Both the report of the Fowler Committee and the federal government's White Paper on Broadcasting contended that, in addition to establishing certain minimum national standards, the new regulatory authority should be expected to impose additional programming requirements on the more prosperous broadcasting stations related to their ability to pay. The White Paper said that standards of quality and public service should not be formulated on a universally applicable basis.
Private broadcasters operating in the larger and more profitable markets can afford to provide a greater variety and higher quality of programming than those in less favoured areas, and it is therefore logical to relate regulatory requirements to the profit-potential of individual stations.
The Fowler Committee had this further observation with regard to the disclosure of financial
information relating to broadcasting stations:
The Canadian Broadcasting Authority should report annually to Parliament, in considerable detail, on all aspects of the broadcasting system - for the private sector as well as the public sector. Parliament should be given a complete picture of the purpose and performance of the broadcasting system so that it can be viewed as a whole. The annual report should deal in detail with the year's program performances by both public and private broadcasters. It should assess performance against the standards laid down by the Authority, and against any undertakings that may have been given by broadcasters. It should also report on the financial position of all broadcasters. For the CBC, the Authority's annual report to Parliament will necessarily cover details of the financial results and administration of the CBC, but Parliament and the public also have the right to know about the financial health of the private broadcasters, since they are essential elements of the Canadian broadcasting system. There is a need to standardize the form of accounting by the CBC and the private stations, so that their achievements and their failures can be accurately compared by Parliament and the public.
While the report of the Committee was not precise, it appeared to suggest that
information relating to the financial position of each of the private broadcasting stations should be made public. All stations are now required to report financial information in considerable detail to both the C.R.T.C. and D.B.S. This information, however, is regarded as confidential and not available for public scrutiny.
To date, the Commission has not moved to implement the proposal of the Fowler Committee and the federal government with regard to programming requirements based on ability to pay. Whether the C.R.T.C. itself is prepared to follow such a course remains unknown, but the fact that it has not done so to date is at least understandable in terms of the very heavy load of other problems confronting it and the lack of complete information available on which to base such decisions.
If and when the C.R.T.C. does move to implement the policy of the government, there may be further justification for the disclosure of financial information beyond that advanced by the Fowler Committee. It can be argued that if the regulatory agency is to impose special programming requirements on stations according to ability to pay, then the public has the right to scrutinize the financial data that provide the basis for the Commission's judgment. Failing that, the public lacks any means of reaching a judgment of its own about the manner in which the regulatory agency performs its public trust.
CABLE OWNERSHIP
Cable ownership has been separated for study from daily newspapers, radio and television ownership because it is less developed as an industry, because the size of each system is more limited than for other media due to its restriction to a licensed area, and because in 1970 cable is primarily a programme-transmitting service rather than a programme-producing industry. It is analyzed primarily as it exists within the 103 communities included in Appendix 1 - those in which a daily newspaper is published, or where there is a primary television station.
Table 1 shows that in the 103 communities there were ninety-five separate cable systems approved by the C.R.T.C. as of July 31, 1970. These systems were not necessarily operational. However, conditions of each licence specify that cables must be laid throughout the area within the two year term of licence. The ninety-five cable systems compare to 116 daily newspapers, ninety-seven television and 272 radio stations in the same communities.
These cable systems occur in sixty-one of the 103, or 60 per cent of the communities. Cable has developed fastest in those areas which can pick up off-the-air American television networks. This means the Prairies and the Maritimes have been slower to establish cable systems. By July, 1970, eight of the 19 (42 per cent) Prairie communities under study and three of the 12 (25 per cent) Maritime communities had licensed cable systems. Four of the cable systems in Edmonton and Calgary were not yet laying cable as they were licensed only in July. On the other hand, 79 per cent of the Ontario) 61 per cent of the Quebec and 60 per cent of the British Columbia communities have at least one cable system.
Of the ninety-five systems, 61 or 64 per cent are group-owned and 34, or 36 per cent are independently-owned. This means there is a slightly lower proportion of group ownership in cable than among daily newspapers (64 per cent as against 66.4 per cent) but considerably more than among television and radio stations (64 per cent as against 47.9 per cent).

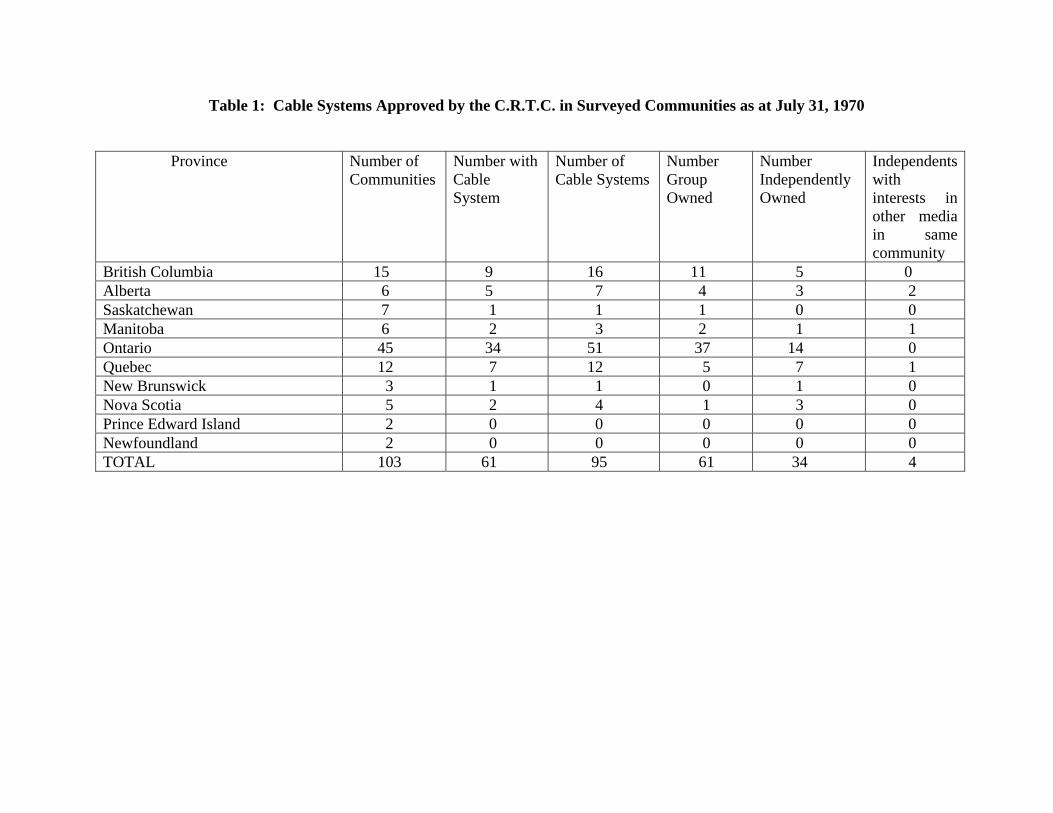
Table 1: Cable Systems Approved by the C.R.T.C. in Surveyed Communities as at July 31, 1970 Province Number of
Communities Number with Cable System
Number of Cable Systems
Number Group Owned
Number Independently Owned
Independents with interests in other media in same community
British Columbia 15 9 16 11 5 0 Alberta 6 5 7 4 3 2 Saskatchewan 7 1 1 1 0 0 Manitoba 6 2 3 2 1 1 Ontario 45 34 51 37 14 0 Quebec 12 7 12 5 7 1 New Brunswick 3 1 1 0 1 0 Nova Scotia 5 2 4 1 3 0 Prince Edward Island 2 0 0 0 0 0 Newfoundland 2 0 0 0 0 0 TOTAL 103 61 95 61 34 4

Of the thirty-four independently-owned cable systems, four are owned by individuals or corporations which have other media interests in the same community. Four more are controlled by interests which own two cable systems in the same community but own no other media. This leaves twenty-six systems which exist entirely independently of other media holdings in the same or another community.
Table 2 examines development of cable by community size. Larger communities are more likely than smaller communities to have cable although a surprisingly large number of towns with populations of less than 30,000 do have cable. Just over 76 per cent of metropolitan areas (population over 100,000) have at least one cable system and about half have more than one. About 69 per cent of cities with 30,000 to 100,000 population and about 50 per cent of those under 30,000 have cable.
The C.R.T.C. has followed a policy of dividing major metropolitan centres for licensing among a number of cable operators. Toronto has the most systems eleven. Hamilton follows with seven systems; Montreal and Vancouver have six, and Ottawa-Hull has three. The twenty-one communities with populations of over 100,000 account for forty-nine of the ninety-five systems.
The five metropolitan areas currently without cable are Regina, Saskatoon, Sudbury, Saint John and St. John's. Metropolitan areas with one cable system are Victoria, Kitchener-Waterloo, St. Catharines, Thunder Bay, Windsor and Quebec City.
Up to this point cable ownership has been discussed in terms of numbers of systems regardless of size. The influence of a cable system can extend only to the extremities of the licensed area. In metropolitan areas, the licensed area is usually only a section of the city. In smaller communities where there may only be one system, the licensed area covers only the more-densely-populated parts where the system can operate profitably. Cable does not usually extend to rural areas as do the other media.
Hence it does not seem appropriate to assess cable ownership on the basis of communities penetrated. Rather it should be examined on the basis of proportion of households reached by a particular owner in a city, in an area, in a province or in Canada as a whole.
By pro-rating 1966 D.B.S. census data, it is estimated that at December 31, 1969, there were approximately 5,600,000 households in Canada. Of these, the C.R.T.C. estimates, 2,495,200, or 45 per cent, were in cable-serviced areas and 1,013,300, or 18 per cent subscribed to cable. The C.R.T.C. projected the subscription from 1,013,300 to 1,070,900 by March 31, 1970, an increase of 5.7 per cent in a period of three months. In contrast to these figures for cable television, the Committee's Media Usage study (conducted by Canadian Facts Co. Ltd.) indicates that 99 per cent of households have at least one radio, 98 per cent have at least one television set, and 90 per cent of individuals claim to read a daily newspaper.

swalSAS a10W JO l tlHM sa!HunWWo;) alqB;) qHM saH!UnWWo;) sa!Hunwwo;) JO JaqwnN swalsAs aJOW JO l q}!M saH!unWWO;) afqB;) q}!M sa!l!unwwOJ sa!HunwwOJ JO JaqwnN swalsAs aJOW JO lllHM sa!HunwwoJ alqB;) qHM sa!HunwwoJ sa!l!unwwoJ JO JaqwnN swalsAs aJOW JO l qHM sa!Hunwwo;) alqBJ ql!M sa!l!unWWO;) sa!l!unwwo;) JO JaqwnN lI')'Or--'OlI')N<'>lI')NN rn ",...00( "d"~ 0 .-. Table 3 P informathn operators. It Antenna Tel, commercial , compilation the number ( Saskatchewan and Manitoba .• In this stu outlets from Potential cirCl subscribed. S thumb cable ' cabled areas a
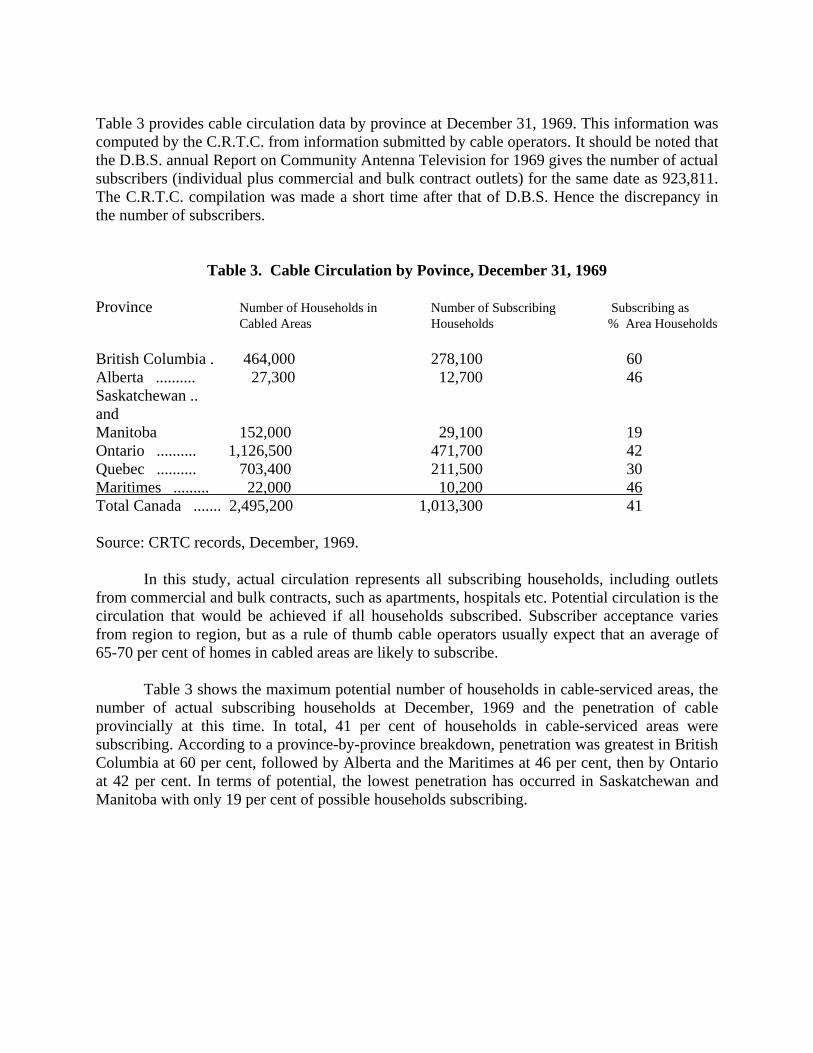
Table 3 provides cable circulation data by province at December 31, 1969. This information was computed by the C.R.T.C. from information submitted by cable operators. It should be noted that the D.B.S. annual Report on Community Antenna Television for 1969 gives the number of actual subscribers (individual plus commercial and bulk contract outlets) for the same date as 923,811. The C.R.T.C. compilation was made a short time after that of D.B.S. Hence the discrepancy in the number of subscribers.
Table 3. Cable Circulation by Povince, December 31, 1969 Province Number of Households in Number of Subscribing Subscribing as Cabled Areas Households % Area Households British Columbia . 464,000 278,100 60 Alberta .......... 27,300 12,700 46 Saskatchewan .. and Manitoba 152,000 29,100 19 Ontario .......... 1,126,500 471,700 42 Quebec .......... 703,400 211,500 30 Maritimes ......... 22,000 10,200 46 Total Canada ....... 2,495,200 1,013,300 41 Source: CRTC records, December, 1969.
In this study, actual circulation represents all subscribing households, including outlets from commercial and bulk contracts, such as apartments, hospitals etc. Potential circulation is the circulation that would be achieved if all households subscribed. Subscriber acceptance varies from region to region, but as a rule of thumb cable operators usually expect that an average of 65-70 per cent of homes in cabled areas are likely to subscribe.
Table 3 shows the maximum potential number of households in cable-serviced areas, the number of actual subscribing households at December, 1969 and the penetration of cable provincially at this time. In total, 41 per cent of households in cable-serviced areas were subscribing. According to a province-by-province breakdown, penetration was greatest in British Columbia at 60 per cent, followed by Alberta and the Maritimes at 46 per cent, then by Ontario at 42 per cent. In terms of potential, the lowest penetration has occurred in Saskatchewan and Manitoba with only 19 per cent of possible households subscribing.

Chapter 2:
A PROFILE OF OWNERSHIP CONCENTRATION
This section is concerned to draw a profile of the mass media in Canada and to show the extent of common interests within each medium and between media, as well as the communications interests held by conglomerate organizations with far-reaching holdings in other industries. It concentrates primarily on the ownership of daily newspapers and radio and television stations in Canada.
For the purposes of analyzing ownership patterns, the study has confined itself to those communities in which a daily newspaper is published or in which a primary television station is located. A few additional communities have been included where major group companies have an interest in one or more radio stations. Television stations that operate in these communities completely or partially as satellites of a primary station located elsewhere have been included.
This section uses the terms "group" and "independent" in a special way. For purposes of the study, "group" has been taken to mean two or more media units under common ownership operating in more than one community, whether or not these media units are of the same kind. "Independent" ownership may include two or more media units, but confined to one community.
A list of all the daily newspapers, radio and television stations and cable systems for each community covered in this survey is to be found in Appendix 1. This survey includes all changes in ownership up to July 31, 1970.
The survey includes 103 communities in which there are 116 daily newspapers, ninety-seven television stations, 272 radio stations (AM and FM counted separately) and ninety-five cable operations.
The extent of common interests among and between the mass media in Canada today varies from region to region. In part, because of the complexities arising from the tangled threads of inter-corporate holdings, the extent of concentration is not easily measured.
Even the nature of a group is not easily defined. For our purposes, an organization has been identified as a group if it has multiple interests in different communities in one medium or more, or if it is a conglomerate with major interests in other non-media industries. Since multiple holdings are not readily traced in all cases, some of the smaller organizations that come within the definition may have been excluded.
Undertaking what represents the first comprehensive analysis of mass media ownership in Canada has been somewhat hampered by the fact that the ownership of newspapers in Canada is not a matter of public record, as it is in the United States. While the ownership of most newspapers is common knowledge and is recorded in the case of most public companies, the source of control occasionally remains unknown for some time. A notable example is the case of the Fredericton Gleaner, which passed into the control of K.C. Irving several months before its
acquisition was acknowledged. A more recent example was provided by the Toronto Daily Star, which in announcing that it had acquired complete ownership of the Oakville Daily Journal-Record disclosed for the first time that it had previously shared control of the paper with the Thomson group. Through the transaction, the Toronto Star also acquired total ownership of the South Peel Weekly in Port Credit (now the Mississauga Times) and the announcement of the transaction disclosed for the first time the Star's ownership of twelve other weeklies in communities in and around Metropolitan Toronto. It is only in recent years that the ownership of broadcasting stations and cable television systems has become a matter of public record by decision first of the Department of Transport and later of the regulatory authority. Up-to-date information on current ownership is, ·however, not compiled or maintained in a way that makes it readily available for public scrutiny.
Table 4 provides a rough measure of one aspect of common ownership. It indicates that out of a total of 485 units of mass communication in Canada (newspapers, AM and FM radio stations and television stations - groups have a significant, although not necessarily a controlling interest, in 251, or 51.8 per cent.
A total of seventy-seven out of 116 daily newspapers, or 66.4 per cent, are group owned; one company, Southam Press Limited, has a substantial minority interest in three others that are listed as independent.
Out of a total of ninety-seven television stations, including relay stations located in some of the communities that form part of this study, forty-seven, or 48.5 per cent are group-owned or are stations in which groups have a substantial minority interest.
By media outlet, there is a similar proportion of concentration among radio stations. Of the total number of 272 located in the selected communities, groups have a significant interest in 129, or 47.4 per cent.
By province the greatest degree of concentration is found in Quebec, followed closely by British Columbia. Groups have interests in forty-seven out of seventy-two media outlets, or 65.3 per cent in Quebec and forty-four out of sixty-eight, or 64.7 per cent in B.C. In Quebec groups control 64.3 per cent of the newspapers, 70.7 per cent of the radio and 64.7 per cent of the television stations. In B.C. group ownership controls 83.3 per cent of the newspapers, 58.3 per cent of the radio and 4.7.1 per cent of the television stations. Table 4 shows that at the other end of the scale, there is a relatively smaller degree of concentration in the Atlantic provinces, and in Manitoba. .

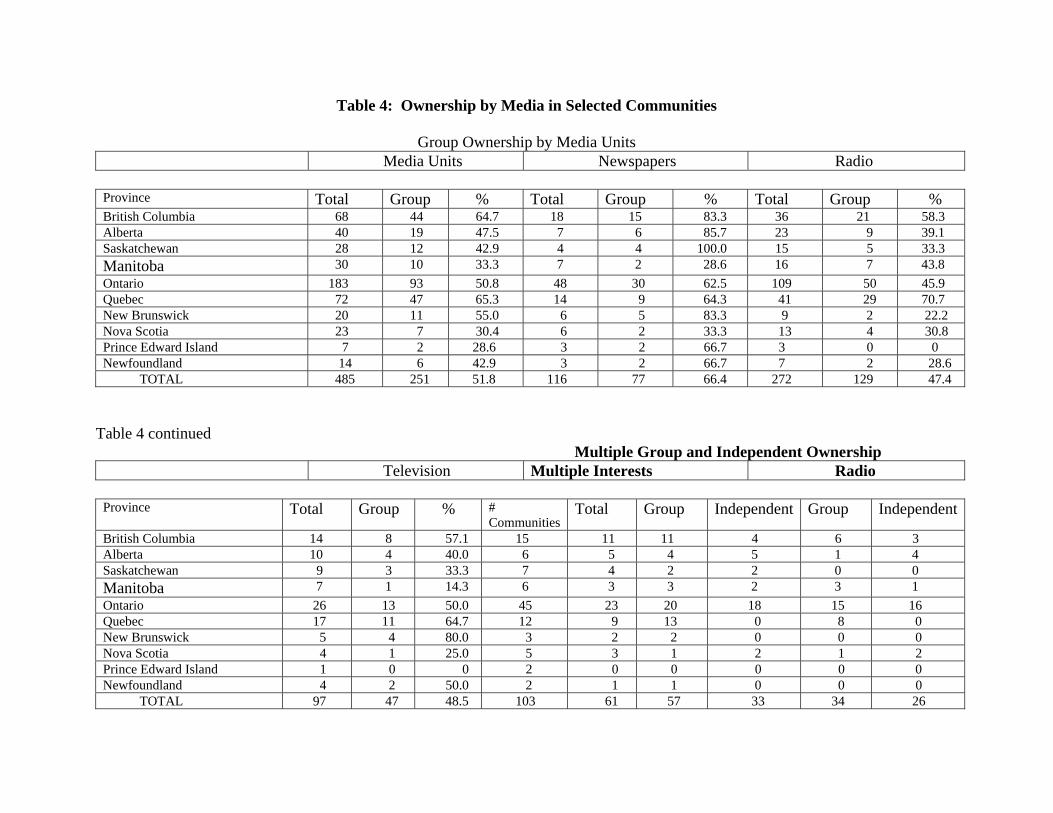
Table 4: Ownership by Media in Selected Communities
Group Ownership by Media Units Media Units Newspapers Radio
Province Total Group % Total Group % Total Group % British Columbia 68 44 64.7 18 15 83.3 36 21 58.3 Alberta 40 19 47.5 7 6 85.7 23 9 39.1 Saskatchewan 28 12 42.9 4 4 100.0 15 5 33.3 Manitoba 30 10 33.3 7 2 28.6 16 7 43.8
Ontario 183 93 50.8 48 30 62.5 109 50 45.9 Quebec 72 47 65.3 14 9 64.3 41 29 70.7 New Brunswick 20 11 55.0 6 5 83.3 9 2 22.2 Nova Scotia 23 7 30.4 6 2 33.3 13 4 30.8 Prince Edward Island 7 2 28.6 3 2 66.7 3 0 0 Newfoundland 14 6 42.9 3 2 66.7 7 2 28.6 TOTAL 485 251 51.8 116 77 66.4 272 129 47.4
Table 4 continued Multiple Group and Independent Ownership Television Multiple Interests Radio
Province Total Group % #
Communities Total Group Independent Group Independent
British Columbia 14 8 57.1 15 11 11 4 6 3 Alberta 10 4 40.0 6 5 4 5 1 4 Saskatchewan 9 3 33.3 7 4 2 2 0 0 Manitoba 7 1 14.3 6 3 3 2 3 1
Ontario 26 13 50.0 45 23 20 18 15 16 Quebec 17 11 64.7 12 9 13 0 8 0 New Brunswick 5 4 80.0 3 2 2 0 0 0 Nova Scotia 4 1 25.0 5 3 1 2 1 2 Prince Edward Island 1 0 0 2 0 0 0 0 0 Newfoundland 4 2 50.0 2 1 1 0 0 0 TOTAL 97 47 48.5 103 61 57 33 34 26
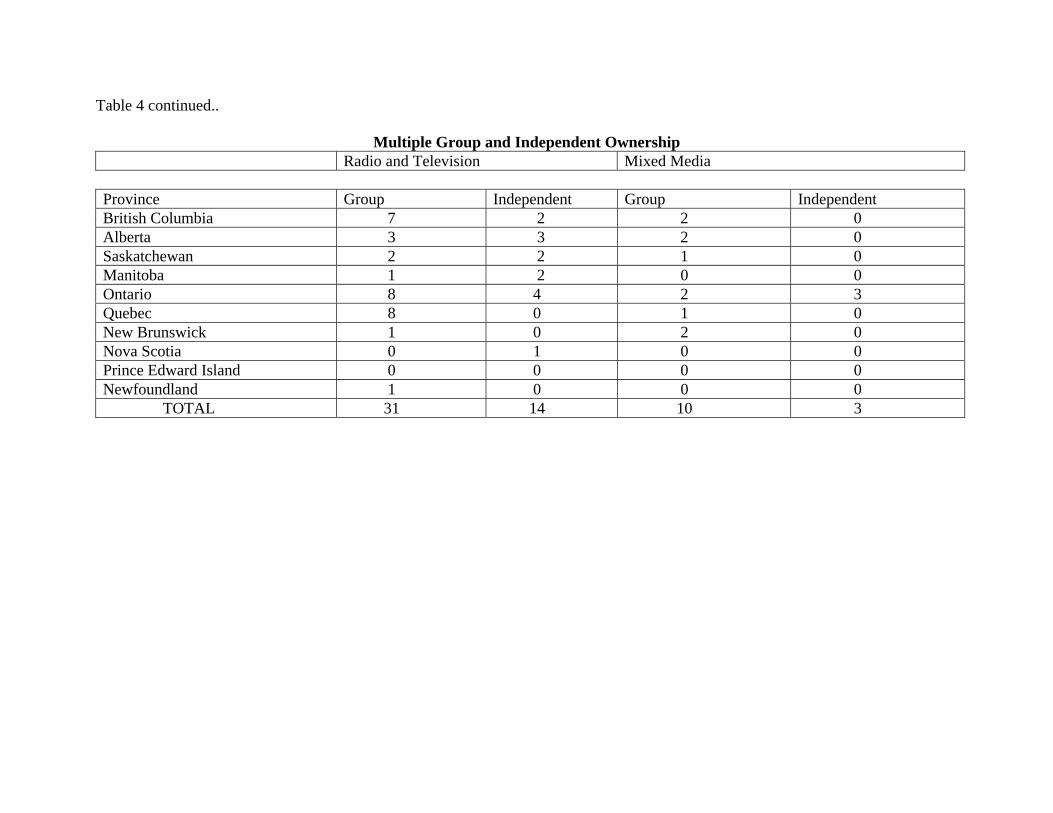
Table 4 continued..
Multiple Group and Independent Ownership Radio and Television Mixed Media
Province Group Independent Group Independent British Columbia 7 2 2 0 Alberta 3 3 2 0 Saskatchewan 2 2 1 0 Manitoba 1 2 0 0 Ontario 8 4 2 3 Quebec 8 0 1 0 New Brunswick 1 0 2 0 Nova Scotia 0 1 0 0 Prince Edward Island 0 0 0 0 Newfoundland 1 0 0 0 TOTAL 31 14 10 3

Total number of communities in which multiple interests exist. This may not correspond to the total of multiple group and independent interests because more than one multiple interest may exist in one community. Note: Total Media Units does not include cable television systems or shortwave radio.

The table also provides an overview of the extent to which groups or independents have
common interests in two or more of the media in the communities analyzed. Out of a total of 103 communities across Canada, there are multiple common interests in sixty-one. Groups have multiple holdings in fifty-seven communities, independents in thirty-three. (The total of group and independent common interests does not necessarily coincide with the total number of communities because of multiple holdings by more than one interest - groups or independents - in some centres.)
Groups have interests in two or more radio stations in thirty-four of these 103 communities, independents in twenty-six. In thirty-one communities, groups have common radio and television interests, independents in fourteen.
In eleven communities, group owners of daily newspapers also have mixed-media ties through interests in broadcasting stations and the same is true for independent newspaper owners in three communities. It should be noted that as of July, 1969, twenty-three communities had common ownership between the newspaper and a broadcasting interest. The C.R.T.C. approved sales of the Power broadcast holdings to Beaubien and the Thomson-Davies interests to Bushnell have reduced this number with common print-broadcast interests by more than half.
Tables 5, 5a, 6 and 6a provide a listing of multi-media interests in metropolitan areas and in communities of less than 100,000 population respectively. Table 7 contains a summary of aggregate multiple holdings for all communities surveyed in Canada.
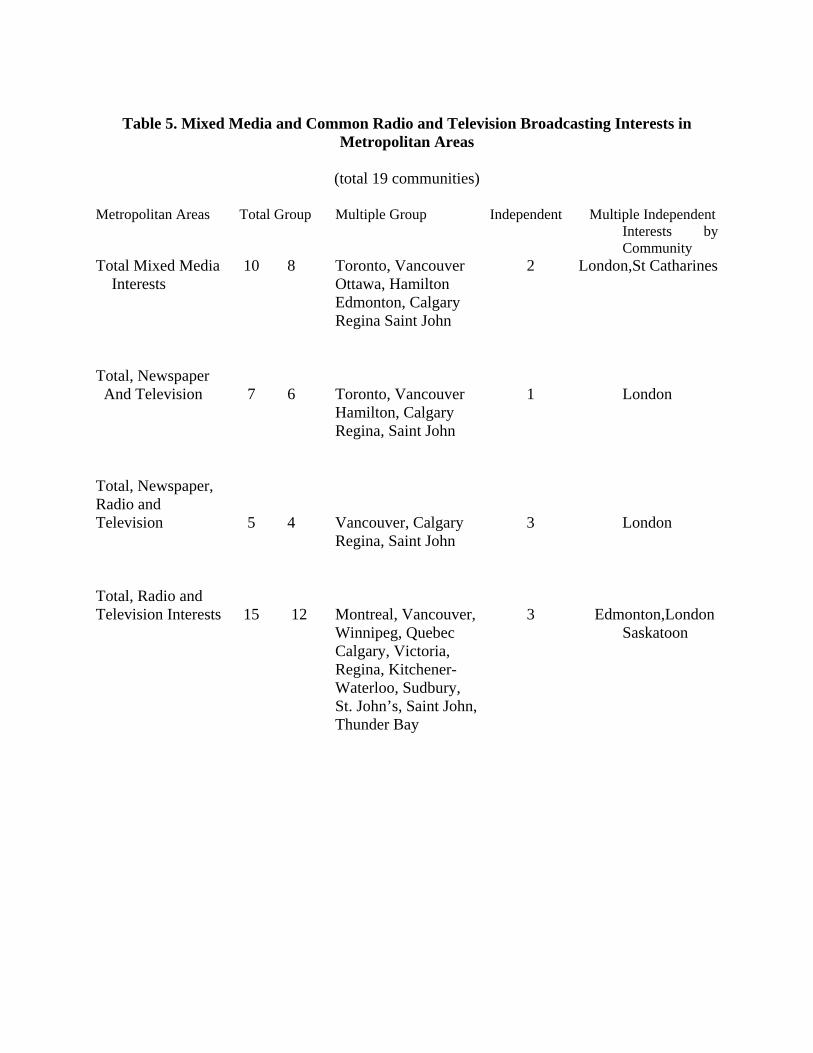
Table 5. Mixed Media and Common Radio and Television Broadcasting Interests in
Metropolitan Areas
(total 19 communities) Metropolitan Areas Total Group Multiple Group Independent Multiple Independent
Interests by Community
Total Mixed Media 10 8 Toronto, Vancouver 2 London,St Catharines Interests Ottawa, Hamilton Edmonton, Calgary Regina Saint John Total, Newspaper And Television 7 6 Toronto, Vancouver 1 London Hamilton, Calgary Regina, Saint John Total, Newspaper, Radio and Television 5 4 Vancouver, Calgary 3 London Regina, Saint John Total, Radio and Television Interests 15 12 Montreal, Vancouver, 3 Edmonton,London Winnipeg, Quebec Saskatoon Calgary, Victoria, Regina, Kitchener- Waterloo, Sudbury, St. John’s, Saint John, Thunder Bay
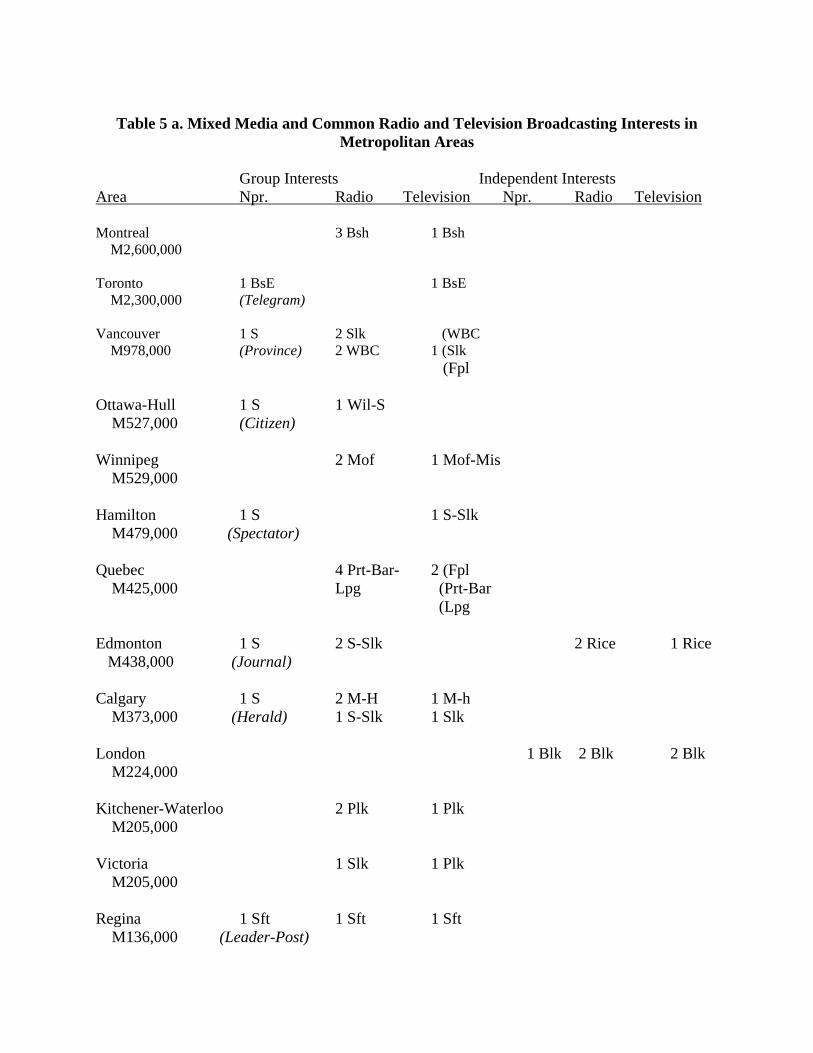
Table 5 a. Mixed Media and Common Radio and Television Broadcasting Interests in
Metropolitan Areas
Group Interests Independent Interests Area Npr. Radio Television Npr. Radio Television Montreal 3 Bsh 1 Bsh M2,600,000 Toronto 1 BsE 1 BsE M2,300,000 (Telegram) Vancouver 1 S 2 Slk (WBC M978,000 (Province) 2 WBC 1 (Slk (Fpl Ottawa-Hull 1 S 1 Wil-S M527,000 (Citizen) Winnipeg 2 Mof 1 Mof-Mis M529,000 Hamilton 1 S 1 S-Slk M479,000 (Spectator) Quebec 4 Prt-Bar- 2 (Fpl M425,000 Lpg (Prt-Bar (Lpg Edmonton 1 S 2 S-Slk 2 Rice 1 Rice M438,000 (Journal) Calgary 1 S 2 M-H 1 M-h M373,000 (Herald) 1 S-Slk 1 Slk London 1 Blk 2 Blk 2 Blk M224,000 Kitchener-Waterloo 2 Plk 1 Plk M205,000 Victoria 1 Slk 1 Plk M205,000 Regina 1 Sft 1 Sft 1 Sft M136,000 (Leader-Post)

Table 5 a continued Saskatoon 1 Mur 1 Mur M133,000 Sudbury 2 Cmb 1 Cmb M121,000 St. John’s 1 Stl 1 Stl M108,000 St. Catharines 1 Bur 2 Bur M106,000 Saint John 2 Irv 1 Irv 1 Irv M102,000 (Telegraph Journal, Times- Globe) Thunder Bay 2 Dg. 1 Dgl
Table 6. Mixed Media and Common Radio and Television Broadcasting Interests in Communities Under 100,000 Population
(Total 33 Communities) Total Group Multiple Group Independent Multiple-Independent
Interests by Communities by Communities
Total Mixed 4 3 Moncton, Grandby 1 Bellevill Media Interest Nelson Total Newspaper 1 1 Moncton 0 And Television Total Newspaper 0 0 0 Radio and Television Total, Radio and 28 18 Sherbrooke, Sault Ste 10 Sydney, Brandon, Marie, Kingston Red Deer, Medicine Peterborough, North Hat, Kamloops, Bay, Lethbridge, Pembroke, Dawson Jonquiere, Timmins Creek, Lloydminister, Prince Albert, Barrie, Wingham, Thompson Prince George, Rimouski, Terrace-Kitimat, Kelowna, Rouyn, Vernon, Rieviere Du Loup,Matane
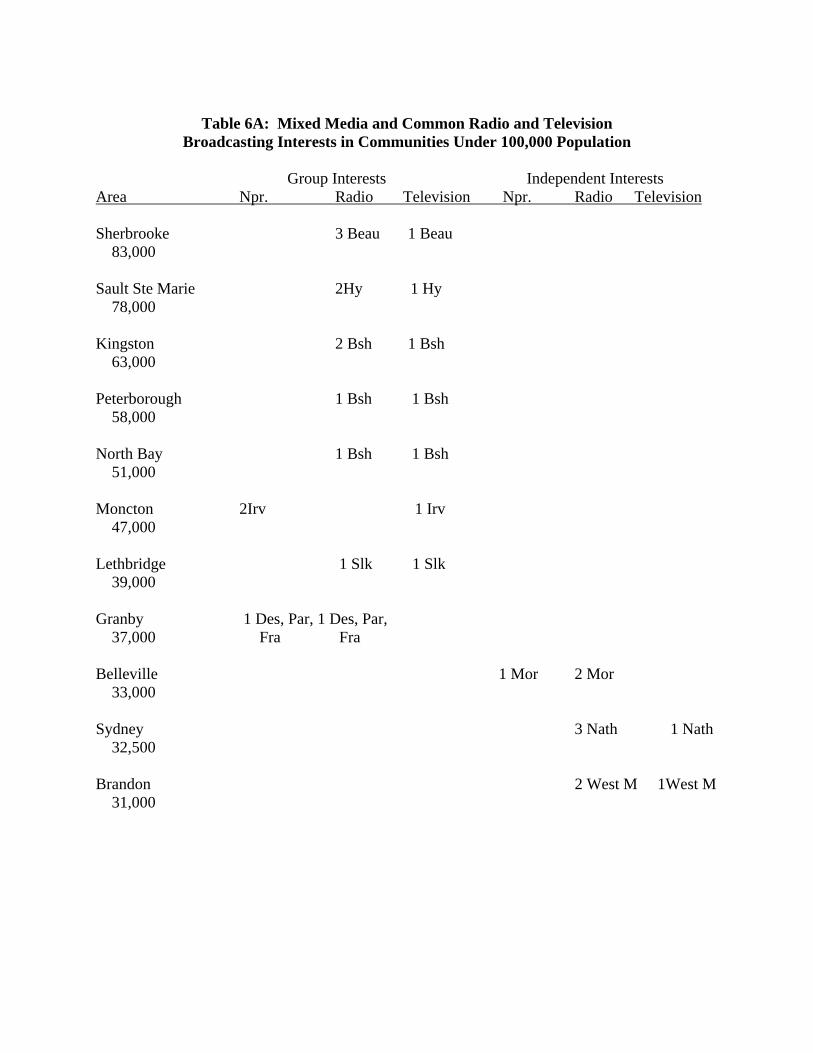
Table 6A: Mixed Media and Common Radio and Television
Broadcasting Interests in Communities Under 100,000 Population
Group Interests Independent Interests Area Npr. Radio Television Npr. Radio Television Sherbrooke 3 Beau 1 Beau 83,000 Sault Ste Marie 2Hy 1 Hy 78,000 Kingston 2 Bsh 1 Bsh 63,000 Peterborough 1 Bsh 1 Bsh 58,000 North Bay 1 Bsh 1 Bsh 51,000 Moncton 2Irv 1 Irv 47,000 Lethbridge 1 Slk 1 Slk 39,000 Granby 1 Des, Par, 1 Des, Par, 37,000 Fra Fra Belleville 1 Mor 2 Mor 33,000 Sydney 3 Nath 1 Nath 32,500 Brandon 2 West M 1West M 31,000
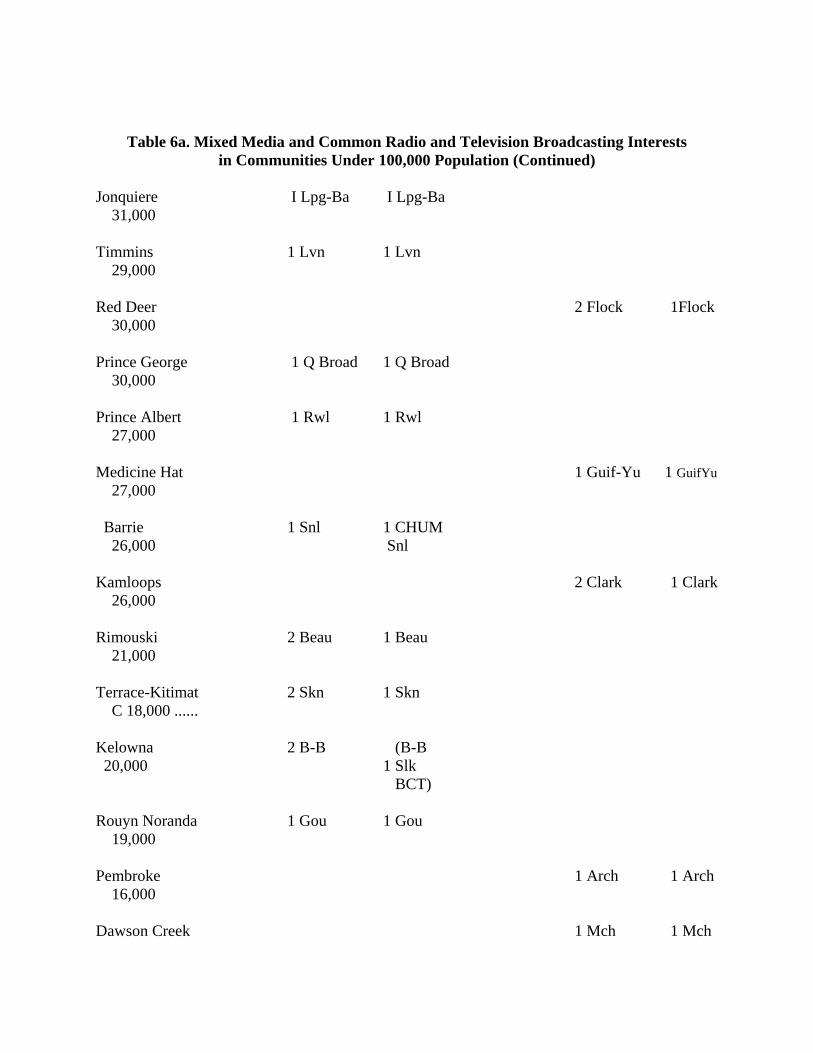
Table 6a. Mixed Media and Common Radio and Television Broadcasting Interests in Communities Under 100,000 Population (Continued)
Jonquiere I Lpg-Ba I Lpg-Ba 31,000 Timmins 1 Lvn 1 Lvn 29,000 Red Deer 2 Flock 1Flock 30,000 Prince George 1 Q Broad 1 Q Broad 30,000 Prince Albert 1 Rwl 1 Rwl 27,000 Medicine Hat 1 Guif-Yu 1 GuifYu 27,000 Barrie 1 Snl 1 CHUM 26,000 Snl Kamloops 2 Clark 1 Clark 26,000 Rimouski 2 Beau 1 Beau 21,000 Terrace-Kitimat 2 Skn 1 Skn C 18,000 ...... Kelowna 2 B-B (B-B 20,000 1 Slk BCT) Rouyn Noranda 1 Gou 1 Gou 19,000 Pembroke 1 Arch 1 Arch 16,000 Dawson Creek 1 Mch 1 Mch
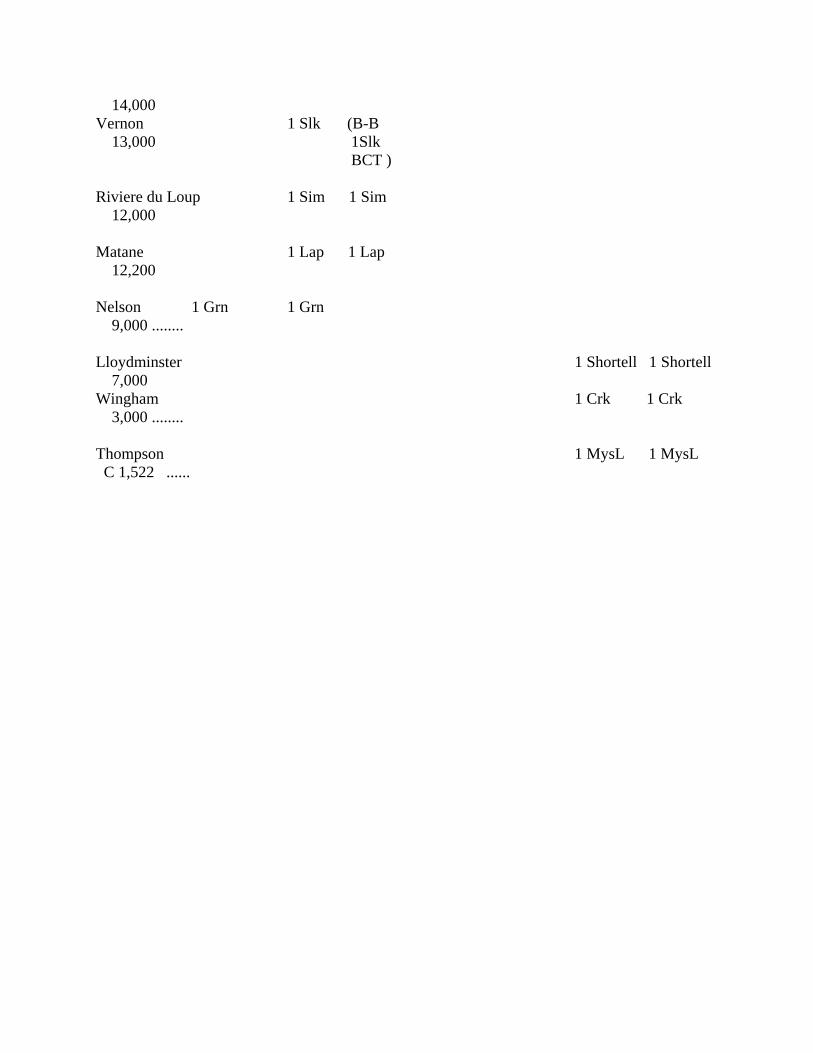
14,000 Vernon 1 Slk (B-B 13,000 1Slk BCT ) Riviere du Loup 1 Sim 1 Sim 12,000 Matane 1 Lap 1 Lap 12,200 Nelson 1 Grn 1 Grn 9,000 ........ Lloydminster 1 Shortell 1 Shortell 7,000 Wingham 1 Crk 1 Crk 3,000 ........ Thompson 1 MysL 1 MysL C 1,522 ......
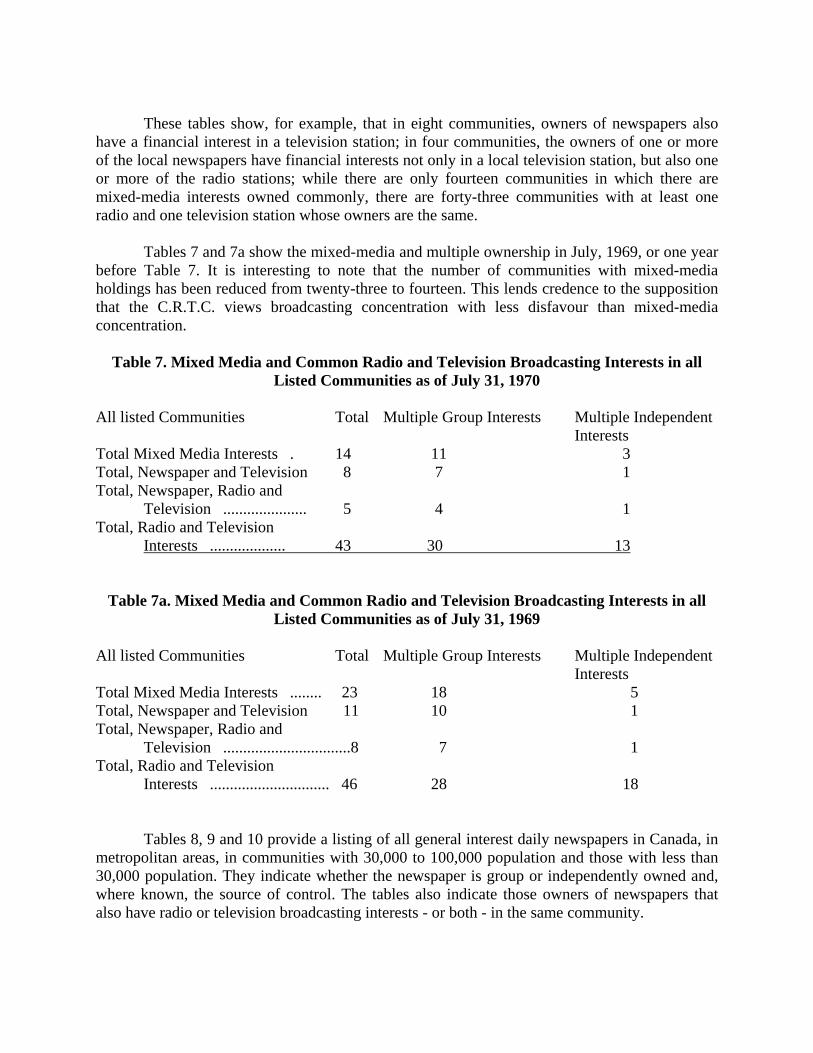
These tables show, for example, that in eight communities, owners of newspapers also
have a financial interest in a television station; in four communities, the owners of one or more of the local newspapers have financial interests not only in a local television station, but also one or more of the radio stations; while there are only fourteen communities in which there are mixed-media interests owned commonly, there are forty-three communities with at least one radio and one television station whose owners are the same.
Tables 7 and 7a show the mixed-media and multiple ownership in July, 1969, or one year before Table 7. It is interesting to note that the number of communities with mixed-media holdings has been reduced from twenty-three to fourteen. This lends credence to the supposition that the C.R.T.C. views broadcasting concentration with less disfavour than mixed-media concentration.
Table 7. Mixed Media and Common Radio and Television Broadcasting Interests in all Listed Communities as of July 31, 1970
All listed Communities Total Multiple Group Interests Multiple Independent Interests Total Mixed Media Interests . 14 11 3 Total, Newspaper and Television 8 7 1 Total, Newspaper, Radio and
Television ..................... 5 4 1 Total, Radio and Television
Interests ................... 43 30 13
Table 7a. Mixed Media and Common Radio and Television Broadcasting Interests in all Listed Communities as of July 31, 1969
All listed Communities Total Multiple Group Interests Multiple Independent Interests Total Mixed Media Interests ........ 23 18 5 Total, Newspaper and Television 11 10 1 Total, Newspaper, Radio and
Television ................................8 7 1 Total, Radio and Television
Interests .............................. 46 28 18
Tables 8, 9 and 10 provide a listing of all general interest daily newspapers in Canada, in metropolitan areas, in communities with 30,000 to 100,000 population and those with less than 30,000 population. They indicate whether the newspaper is group or independently owned and, where known, the source of control. The tables also indicate those owners of newspapers that also have radio or television broadcasting interests - or both - in the same community.


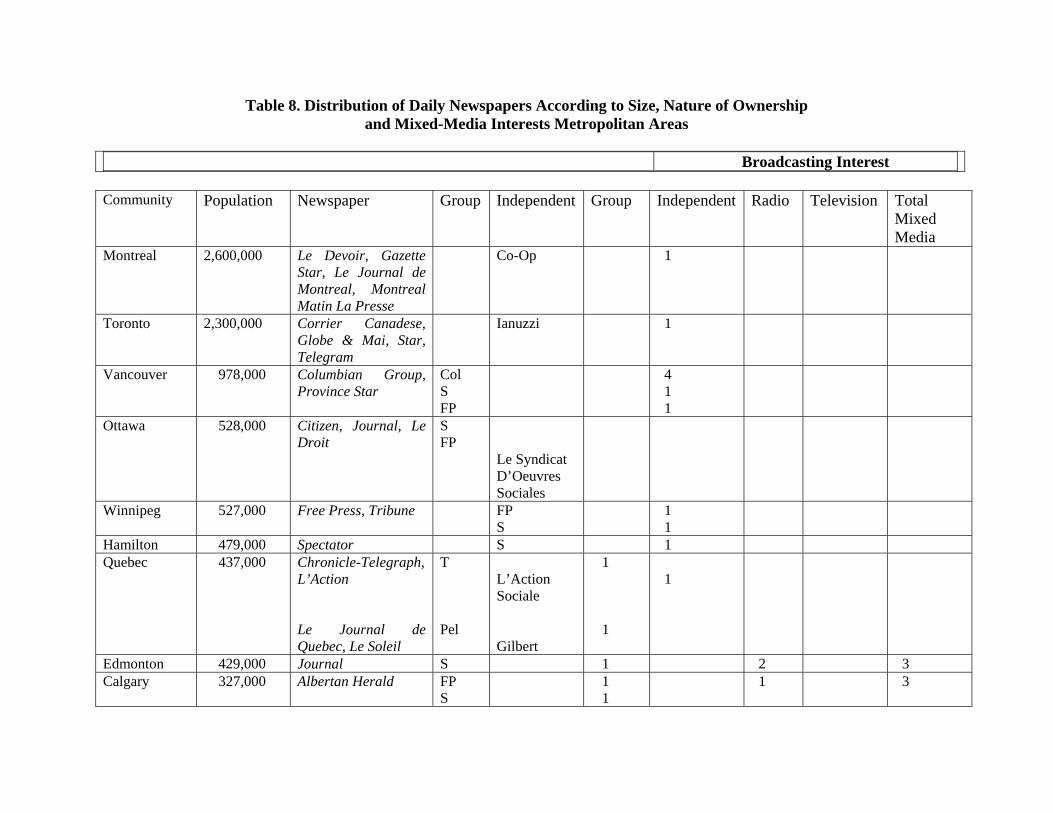
Table 8. Distribution of Daily Newspapers According to Size, Nature of Ownership and Mixed-Media Interests Metropolitan Areas
Broadcasting Interest
Community Population Newspaper Group Independent Group Independent Radio Television Total
Mixed Media
Montreal 2,600,000 Le Devoir, Gazette Star, Le Journal de Montreal, Montreal Matin La Presse
Co-Op 1
Toronto 2,300,000 Corrier Canadese, Globe & Mai, Star, Telegram
Ianuzzi 1
Vancouver 978,000 Columbian Group, Province Star
Col S FP
4 1 1
Ottawa 528,000 Citizen, Journal, Le Droit
S FP
Le Syndicat D’Oeuvres Sociales
Winnipeg 527,000 Free Press, Tribune FP S
1 1
Hamilton 479,000 Spectator S 1 Quebec 437,000 Chronicle-Telegraph,
L’Action Le Journal de Quebec, Le Soleil
T Pel
L’Action Sociale Gilbert
1 1
1
Edmonton 429,000 Journal S 1 2 3 Calgary 327,000 Albertan Herald FP
S 1
1 1 3

Table 8 .. continued Community Population Newspaper Group Independent Group Independent Radio Television Total
Mixed Media
Windsor 223,000 Star Graybiel 1 London 224,000 Free Press Blackburn
(25%$) 1 2 1 4
Halifax 206,000 Chronical-Herald, Mail-Star
Dennis Dennis
1 1
Kitchener-Waterloo
204,000 Record Motz (48%$) 1
Victoria 181,000 Colonist Times
FP FP
1 1
Regina 136,000 Leader-Post Sft 1 1 1 1 Saskatoon 123,000 Star-Phoenix Sft 1 St. John’s 107,000 Daily News
Telegram T
Bonnell 1
1
Thunder Bay 106,000 Times-Journal News-Chronicle
T T
1 1
St. Catharines 103,000 Standard Bur 1 2 3 Saint-John 103,000 Telegraph-Journal
and Times-Globe Irv 2 1 1 4
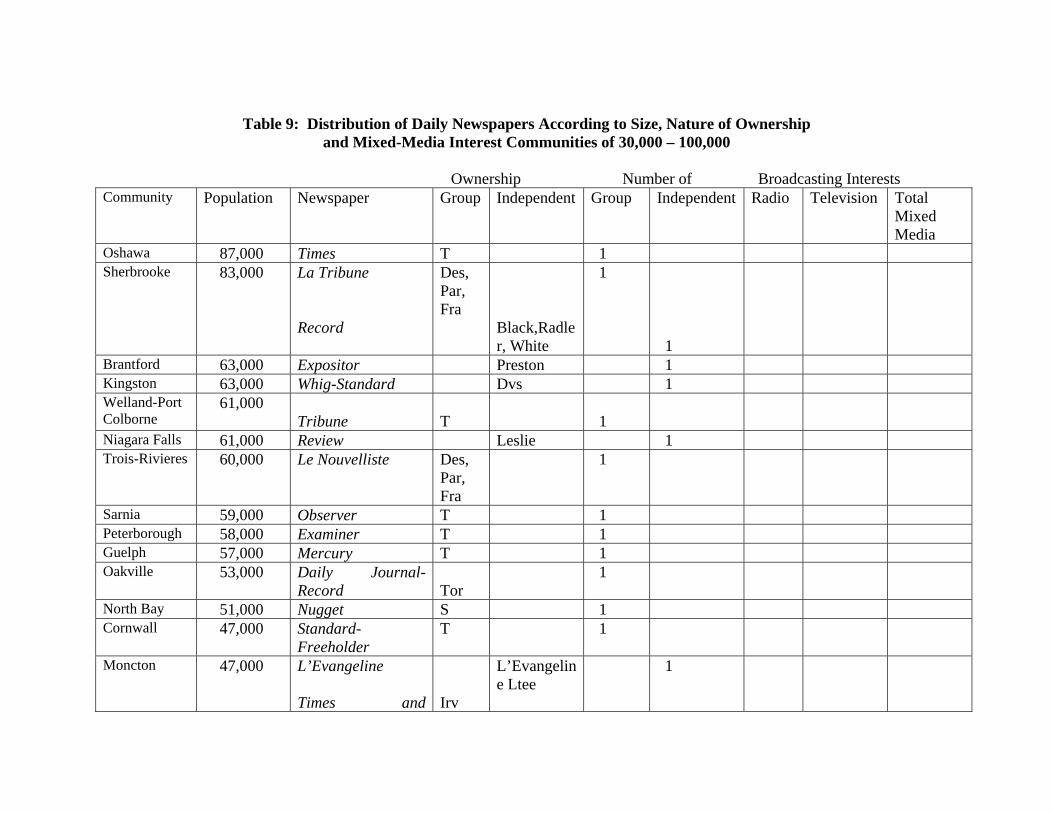
Table 9: Distribution of Daily Newspapers According to Size, Nature of Ownership
and Mixed-Media Interest Communities of 30,000 – 100,000 Ownership Number of Broadcasting Interests Community Population Newspaper Group Independent Group Independent Radio Television Total
Mixed Media
Oshawa 87,000 Times T 1 Sherbrooke 83,000 La Tribune
Record
Des, Par, Fra
Black,Radler, White
1 1
Brantford 63,000 Expositor Preston 1 Kingston 63,000 Whig-Standard Dvs 1 Welland-Port Colborne
61,000 Tribune
T
1
Niagara Falls 61,000 Review Leslie 1 Trois-Rivieres 60,000 Le Nouvelliste Des,
Par, Fra
1
Sarnia 59,000 Observer T 1 Peterborough 58,000 Examiner T 1 Guelph 57,000 Mercury T 1 Oakville 53,000 Daily Journal-
Record Tor
1
North Bay 51,000 Nugget S 1 Cornwall 47,000 Standard-
Freeholder T 1
Moncton 47,000 L’Evangeline Times and
Irv
L’Evangeline Ltee
1
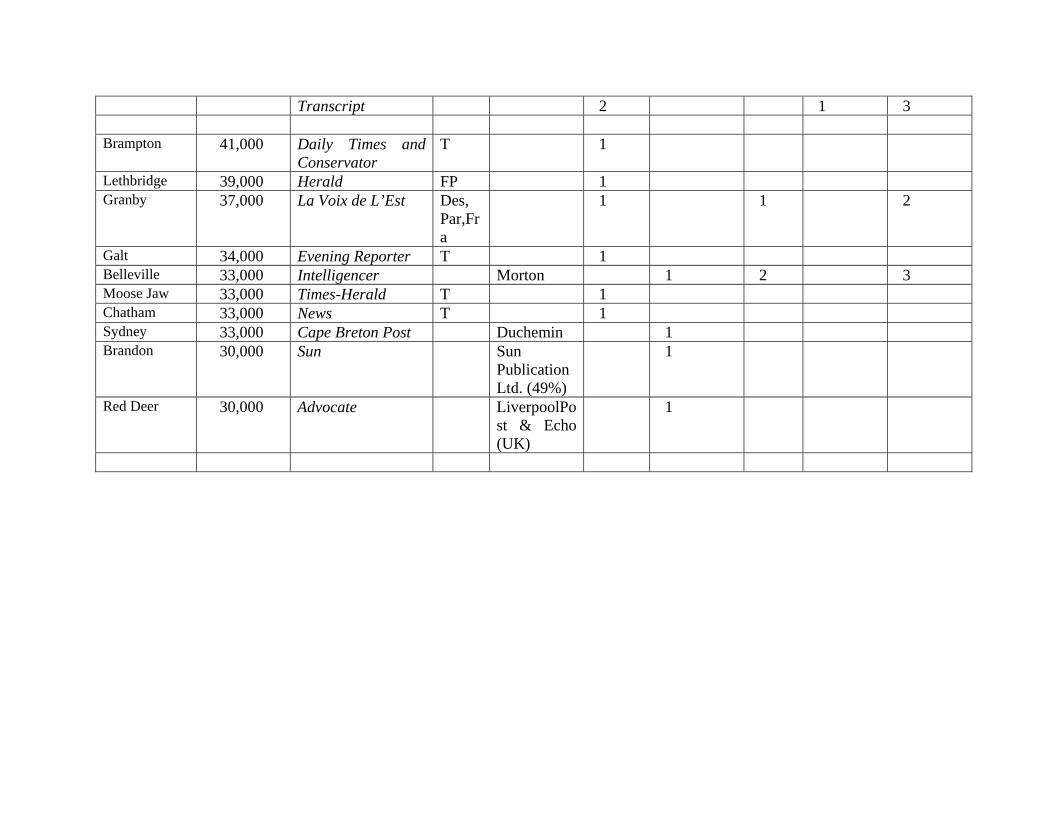
Transcript 2 1 3 Brampton 41,000 Daily Times and
Conservator T 1
Lethbridge 39,000 Herald FP 1 Granby 37,000 La Voix de L’Est Des,
Par,Fra
1 1 2
Galt 34,000 Evening Reporter T 1 Belleville 33,000 Intelligencer Morton 1 2 3 Moose Jaw 33,000 Times-Herald T 1 Chatham 33,000 News T 1 Sydney 33,000 Cape Breton Post Duchemin 1 Brandon 30,000 Sun Sun
Publication Ltd. (49%)
1
Red Deer 30,000 Advocate LiverpoolPost & Echo (UK)
1
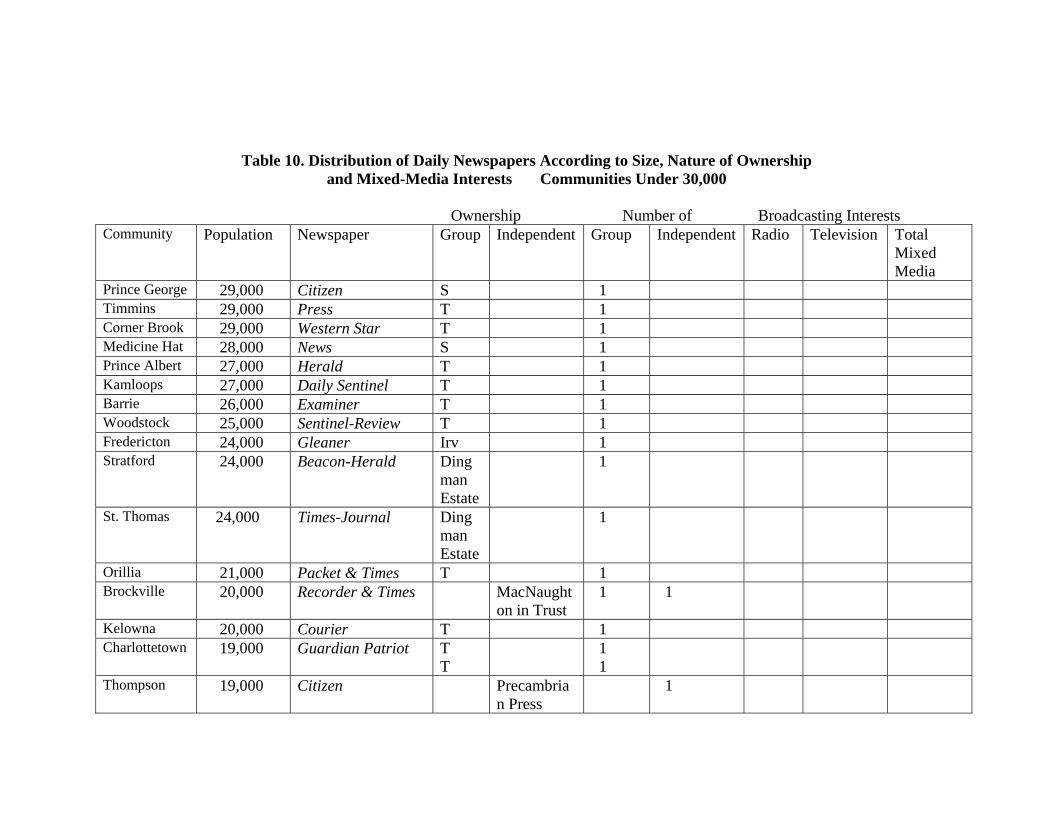
Table 10. Distribution of Daily Newspapers According to Size, Nature of Ownership and Mixed-Media Interests Communities Under 30,000
Ownership Number of Broadcasting Interests Community Population Newspaper Group Independent Group Independent Radio Television Total
Mixed Media
Prince George 29,000 Citizen S 1 Timmins 29,000 Press T 1 Corner Brook 29,000 Western Star T 1 Medicine Hat 28,000 News S 1 Prince Albert 27,000 Herald T 1 Kamloops 27,000 Daily Sentinel T 1 Barrie 26,000 Examiner T 1 Woodstock 25,000 Sentinel-Review T 1 Fredericton 24,000 Gleaner Irv 1 Stratford 24,000 Beacon-Herald Ding
man Estate
1
St. Thomas 24,000 Times-Journal Dingman Estate
1
Orillia 21,000 Packet & Times T 1 Brockville 20,000 Recorder & Times MacNaught
on in Trust 1 1
Kelowna 20,000 Courier T 1 Charlottetown 19,000 Guardian Patriot T
T 1
1
Thompson 19,000 Citizen Precambrian Press
1
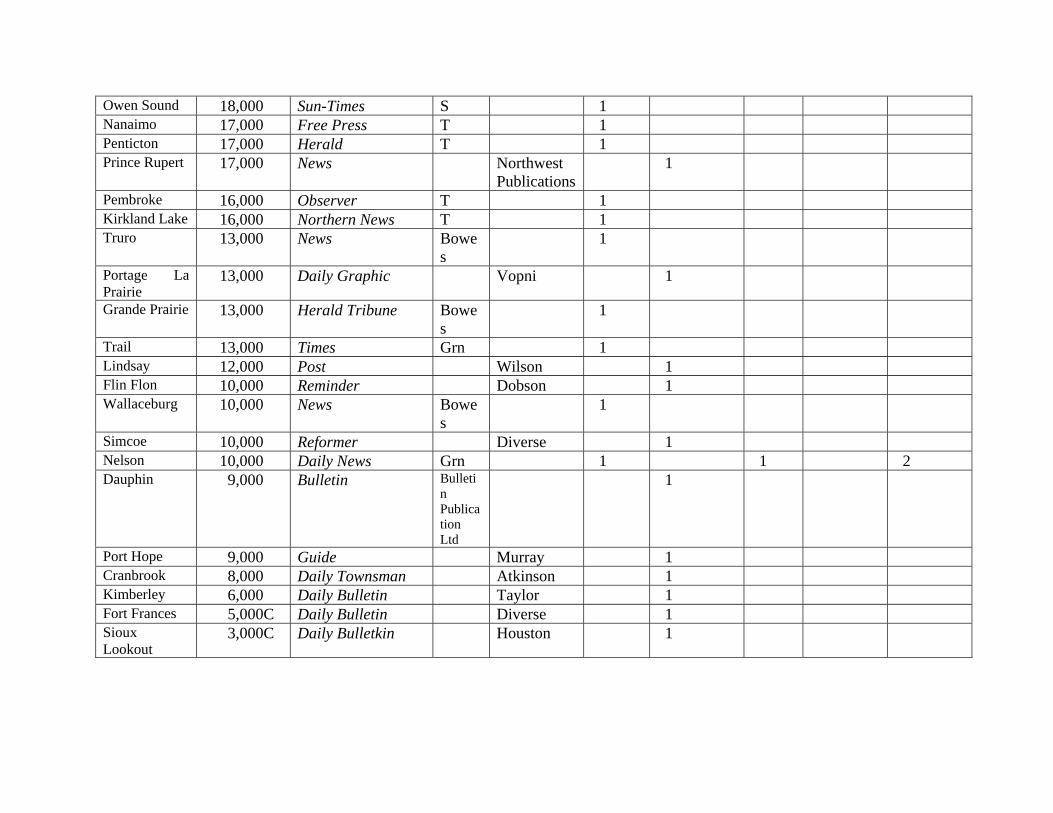
Owen Sound 18,000 Sun-Times S 1 Nanaimo 17,000 Free Press T 1 Penticton 17,000 Herald T 1 Prince Rupert 17,000 News Northwest
Publications 1
Pembroke 16,000 Observer T 1 Kirkland Lake 16,000 Northern News T 1 Truro 13,000 News Bowe
s 1
Portage La Prairie
13,000 Daily Graphic Vopni 1
Grande Prairie 13,000 Herald Tribune Bowes
1
Trail 13,000 Times Grn 1 Lindsay 12,000 Post Wilson 1 Flin Flon 10,000 Reminder Dobson 1 Wallaceburg 10,000 News Bowe
s 1
Simcoe 10,000 Reformer Diverse 1 Nelson 10,000 Daily News Grn 1 1 2 Dauphin 9,000 Bulletin Bulleti
n Publication Ltd
1
Port Hope 9,000 Guide Murray 1 Cranbrook 8,000 Daily Townsman Atkinson 1 Kimberley 6,000 Daily Bulletin Taylor 1 Fort Frances 5,000C Daily Bulletin Diverse 1 Sioux Lookout
3,000C Daily Bulletkin Houston 1


There are 116 general-interest daily newspapers published in Canada, 118 if the Daily
Racing Form and Daily Construction News are included. Of the 116, forty-six are published in metropolitan cities, twenty-eight in communities with a population between 30,000 and 100,000 and forty-two in communities with less than 30,000 population.
According to Professor W. H. Kesterton sixty-six dailies were published in eighteen towns or cities with more than two newspapers around the turn of the century. By 1958, only fourteen out of ninety-nine general-interest dailies were published in four cities with more than two newspapers.
Today there are five cities in which more than two newspapers are published, representing a total of twenty-three dailies. There are six in Montreal, (four of which are French-language), six in Vancouver (if the four relatively small suburban dailies of the Columbian group are included); four in Toronto (including the new Italian-language daily); four in Quebec (one English-language and three French-language), and three in Ottawa, (one of them French-language).
Professor Kesterton estimates there were eighteen communities with more than two papers in 1900. In 1958, there were four and today there are five, if the suburban papers of Vancouver are included. In 1900, there were seventeen communities with two dailies and, by 1958, this total had declined to eleven. Today there are ten communities with two daily newspapers, a number of which are jointly owned.
There are fifteen Canadian communities in which two or more dailies are published, but only ten in which two or more are published by separate owners.
The fifteen communities in which two or more dailies are published are: Victoria, Vancouver, Calgary, Winnipeg, Thunder Bay, Toronto, Ottawa, Montreal, Sherbrooke, Quebec City, Moncton, Saint John, Halifax, Charlottetown, and St. John's.
In five of these communities - Halifax, Victoria, Thunder Bay, Saint John, and Charlottetown - the two papers are published by the same owner. In Moncton and Sherbrooke, there is only limited competition between the two papers because in each community one is published in French and the other in English.
Out of eleven of the largest cities in Canada, groups have a monopoly in seven -Hamilton, Edmonton, Victoria, Regina, Saskatoon, Sudbury, and Saint John.
In three of the fifteen cities with two or more papers, competition exists only between group-owned newspapers - Ottawa, Winnipeg and Calgary. In Vancouver, the Columbian Group provides only limited competition for the Vancouver Sun and Province, respectively controlled by F.P. Publications and Southam Press, which are jointly published by Pacific Press, in which the two groups share ownership equally.

In the ten communities with two or more papers published by separate owners, groups control one of the papers in seven communities. There are only three cities in Canada in which there is major competition involving at least one independent paper - Montreal, Quebec City, and St. John's.
There are seventy-two Canadian communities in which one daily is published compared to sixty-seven communities in 1958. There are fifty-six communities with populations exceeding 10,000 which have no daily newspapers and four communities with populations between 30,000 and 100,000 without a daily.
For the purpose of this analysis, the Toronto Star, the Telegram of Toronto, and the Montreal Star are regarded as groups. The Toronto Star is included because of its ownership of the Oakville daily and eleven weekly newspapers and also because of the interest it shares with Southam in Southstar Publishers Limited. The latter publishes The Canadian Magazine, which is distributed by thirteen daily newspapers as a weekend supplement, The Canadian Star Weekly and Canadian Homes.
The Telegram has been included because of the widespread interest of its two principals - John Bassett and John David Eaton (through trusts created for their respective children) - in other non-media enterprises and a number of suburban weeklies around Toronto. Station CFTO-TV, and CKLW-TV, which are also controlled in the same way, have also been classified as part of a group operation for the same reason.
The Montreal Star comes within the definition of a group because of its interest in Weekend and Perspectives, two weekly supplements, the latter distributed by a number of French-language newspapers which also share ownership in the publishing company. The Montreal Star also qualifies because of the conglomerate interests of the McConnell family, which controls the newspaper.
Out of the total of 116 daily newspapers published· in Canada, seventy-seven are controlled by groups, thirty-nine by independents. Table 11 shows the number of dailies published by each group owner. It includes those which are defined as forming part of this category because of media interests in more than one of the selected communities, or interests of a conglomerate nature, even though they may publish only one daily newspaper.
Table 12 shows the number of papers owned by groups in each province. It also lists the number of papers controlled by each group by province, together with total group ownership, the total circulation of the papers published by each group by province and the proportion it represents of the total circulation for all daily papers published in the province.

Table 11. Number of Papers Published by Group Owners
Thomson 30 Southam 11 F.P. Publications 8 Desmarais Parisien, Francreur 4 Irving 5 Columbian 4 Toronto Star 2 Sifton 2 Peladeau 2 Telegram 1 Green 2 Montreal Star 1 Bowes 3 Dingman Estate 2
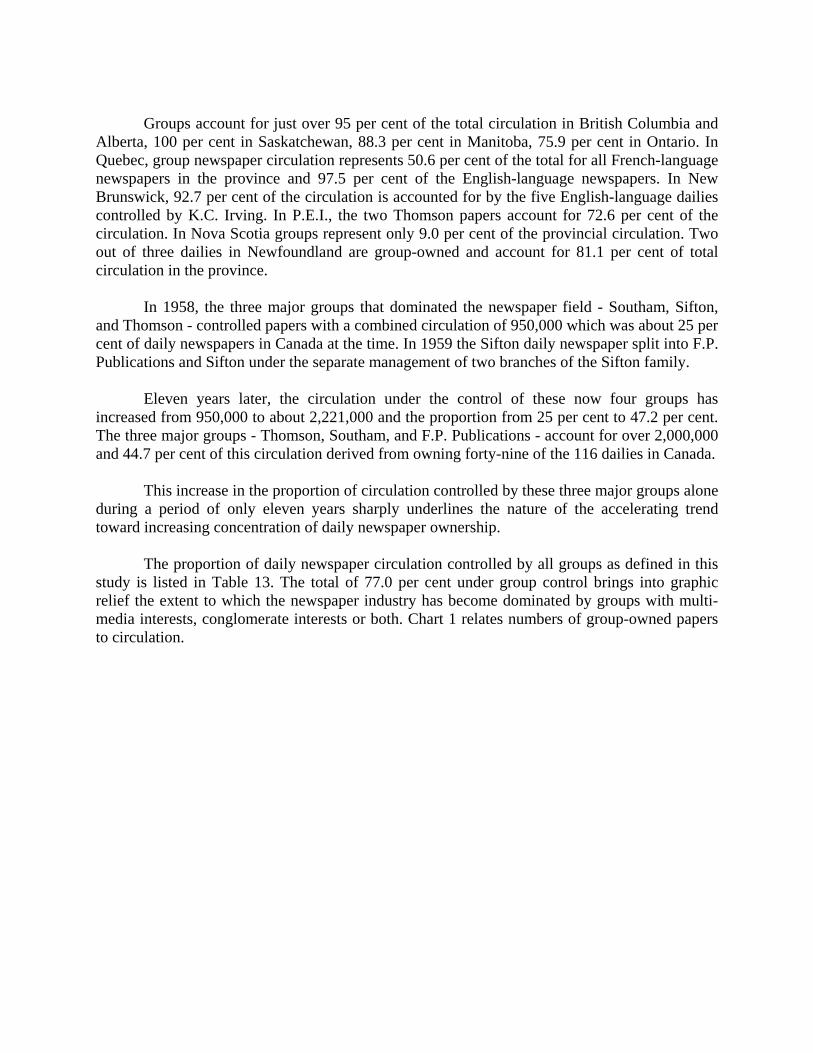
Groups account for just over 95 per cent of the total circulation in British Columbia and
Alberta, 100 per cent in Saskatchewan, 88.3 per cent in Manitoba, 75.9 per cent in Ontario. In Quebec, group newspaper circulation represents 50.6 per cent of the total for all French-language newspapers in the province and 97.5 per cent of the English-language newspapers. In New Brunswick, 92.7 per cent of the circulation is accounted for by the five English-language dailies controlled by K.C. Irving. In P.E.I., the two Thomson papers account for 72.6 per cent of the circulation. In Nova Scotia groups represent only 9.0 per cent of the provincial circulation. Two out of three dailies in Newfoundland are group-owned and account for 81.1 per cent of total circulation in the province.
In 1958, the three major groups that dominated the newspaper field - Southam, Sifton, and Thomson - controlled papers with a combined circulation of 950,000 which was about 25 per cent of daily newspapers in Canada at the time. In 1959 the Sifton daily newspaper split into F.P. Publications and Sifton under the separate management of two branches of the Sifton family.
Eleven years later, the circulation under the control of these now four groups has increased from 950,000 to about 2,221,000 and the proportion from 25 per cent to 47.2 per cent. The three major groups - Thomson, Southam, and F.P. Publications - account for over 2,000,000 and 44.7 per cent of this circulation derived from owning forty-nine of the 116 dailies in Canada.
This increase in the proportion of circulation controlled by these three major groups alone during a period of only eleven years sharply underlines the nature of the accelerating trend toward increasing concentration of daily newspaper ownership.
The proportion of daily newspaper circulation controlled by all groups as defined in this study is listed in Table 13. The total of 77.0 per cent under group control brings into graphic relief the extent to which the newspaper industry has become dominated by groups with multi-media interests, conglomerate interests or both. Chart 1 relates numbers of group-owned papers to circulation.
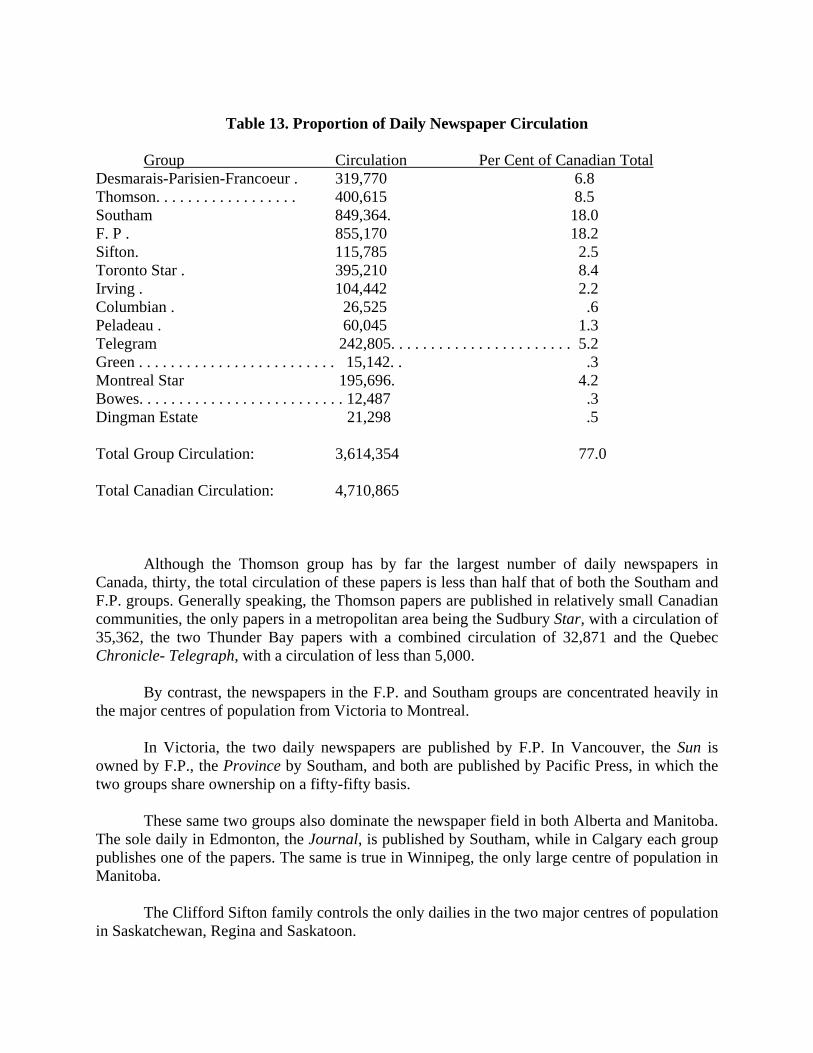
Table 13. Proportion of Daily Newspaper Circulation
Group Circulation Per Cent of Canadian Total
Desmarais-Parisien-Francoeur . 319,770 6.8 Thomson. . . . . . . . . . . . . . . . . . 400,615 8.5 Southam 849,364. 18.0 F. P . 855,170 18.2 Sifton. 115,785 2.5 Toronto Star . 395,210 8.4 Irving . 104,442 2.2 Columbian . 26,525 .6 Peladeau . 60,045 1.3 Telegram 242,805. . . . . . . . . . . . . . . . . . . . . . . 5.2 Green . . . . . . . . . . . . . . . . . . . . . . . . . 15,142. . .3 Montreal Star 195,696. 4.2 Bowes. . . . . . . . . . . . . . . . . . . . . . . . . . 12,487 .3 Dingman Estate 21,298 .5 Total Group Circulation: 3,614,354 77.0 Total Canadian Circulation: 4,710,865
Although the Thomson group has by far the largest number of daily newspapers in Canada, thirty, the total circulation of these papers is less than half that of both the Southam and F.P. groups. Generally speaking, the Thomson papers are published in relatively small Canadian communities, the only papers in a metropolitan area being the Sudbury Star, with a circulation of 35,362, the two Thunder Bay papers with a combined circulation of 32,871 and the Quebec Chronicle- Telegraph, with a circulation of less than 5,000.
By contrast, the newspapers in the F.P. and Southam groups are concentrated heavily in the major centres of population from Victoria to Montreal.
In Victoria, the two daily newspapers are published by F.P. In Vancouver, the Sun is owned by F.P., the Province by Southam, and both are published by Pacific Press, in which the two groups share ownership on a fifty-fifty basis.
These same two groups also dominate the newspaper field in both Alberta and Manitoba. The sole daily in Edmonton, the Journal, is published by Southam, while in Calgary each group publishes one of the papers. The same is true in Winnipeg, the only large centre of population in Manitoba.
The Clifford Sifton family controls the only dailies in the two major centres of population in Saskatchewan, Regina and Saskatoon.

In Ontario, newspaper ownership is far more diverse than in the western provinces, but
F.P. and Southam plays a major role in the larger metropolitan areas. F.P. publishes the Globe and Mail (Toronto), the largest morning newspaper in Canada. Southam owns the only daily in Hamilton, the Spectator, and in Ottawa, the two English-language dailies are also published by F.P. and Southam.
In Montreal, where a substantial degree of competition continues to exist, the only English-language morning newspaper, The Gazette, has become part of the Southam Group. Among French-language newspapers in Quebec, Paul Desmarais has come to assume a major position. He controls La Presse of Montreal, the largest French-language daily, and owns 46.6 per cent of Les Journaux Trans-Canada limitee, the publisher of Le Nouvelliste in Trois-Rivieres, La Tribune in Sherbrooke, and La Voix de L'Est in Granby, together with a number of weekly newspapers.
There is a substantial degree of concentration of ownership in New Brunswick, where all five of the English-language dailies are controlled by K.C. Irving. The only other daily, L'Evangeline of Moncton, is an independently-owned French-language newspaper (in which Irving interests regularly place extensive advertising).
In Nova Scotia, two of six dailies are group owned. In Charlottetown, the capital of Prince Edward Island, the morning and afternoon newspapers are published by the Thomson Group, as are the largest of two newspapers in St. John's and the only other daily, the Western Star in Corner Brook, Newfoundland.

Chapter 3:
MAJOR BROADCASTING AND MIXED-MEDIA OWNERSHIP PATTERNS
The ownership of broadcasting interests, particularly of radio stations, is considerably more diverse than that of newspapers. Large companies with widespread interests in broadcasting have assumed an important position in many of the larger communities, however, and there appears to be an accelerating trend toward the increased concentration of ownership within these groups.
Over the last decade, nearly a dozen television stations that were once controlled by local interests or in which local interests had a substantial minority interest, have come under the control of major broadcasting groups. Table 14 lists, by community, television stations under group control or in which groups have a substantial ownership interest.
In British Columbia, CHAN-TV in Vancouver and CHEK-TV in Victoria, both previously separately and independently controlled, have been taken over by the British Columbia Television Broadcasting System Limited, in which Western Broadcasting Company, Selkirk and Famous Players divide individual minority interests. Between them, Selkirk and British Columbia Television - in which Selkirk also has a substantial minority interest, have assumed the two-thirds holdings previously held by local persons in Okanagan Valley Television Company Limited. This company operates CHBC-TV in Kelowna, which has satellite stations in Penticton and seven other British Columbia communities.
In Alberta, Maclean-Hunter and Selkirk have taken over control of the two television stations in Calgary, CFCN-TV and CHCT-TV respectively, both of which were originally controlled by local interests. In Lethbridge, CJLH-TV, in which ownership was once divided between the Lethbridge Herald and Selkirk, is now wholly owned by Selkirk.
In Thunder Bay, Ontario, control of CKPR-TV has shifted from an independent local interest to the Dougall family, which controls two radio stations in the same community and also has an interest in radio stations in Dryden, Kenora, and Fort Frances. CFCH-AM and CFCH-TV in North Bay shifted from local ownership to control by Thomson and then to Bushnel1 communication Ltd.

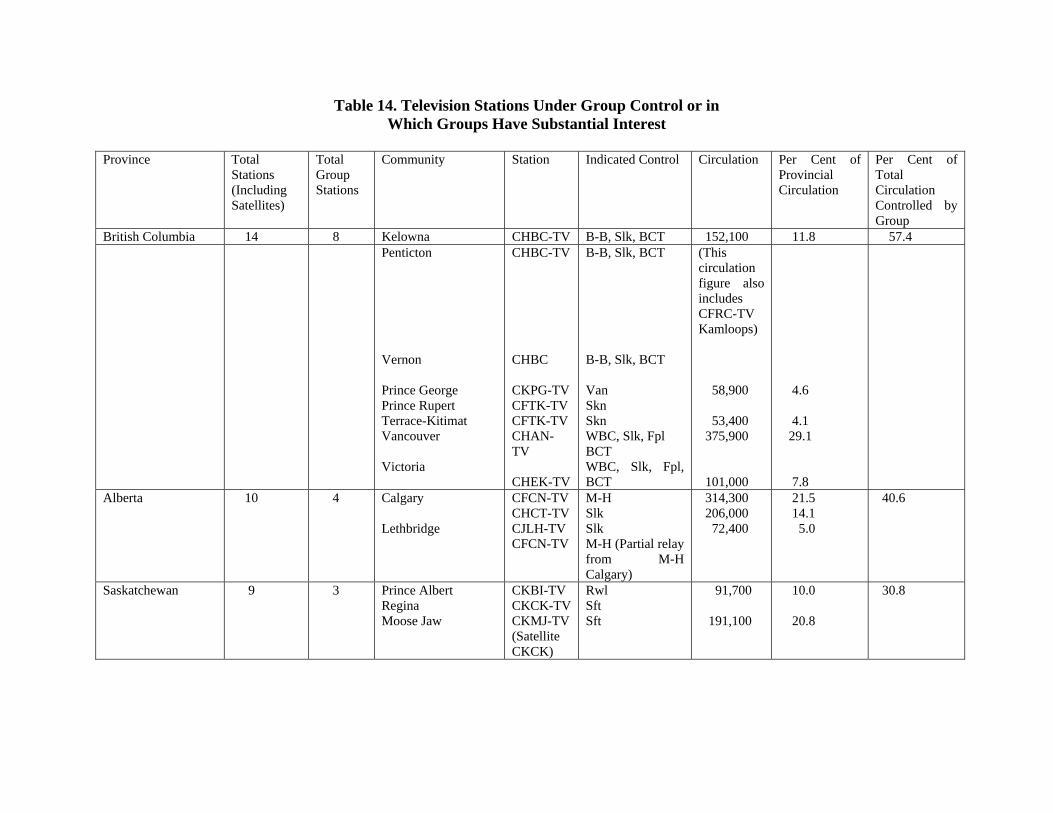
Table 14. Television Stations Under Group Control or in Which Groups Have Substantial Interest
Province Total
Stations (Including Satellites)
Total Group Stations
Community Station Indicated Control Circulation Per Cent of Provincial Circulation
Per Cent of Total Circulation Controlled by Group
British Columbia 14 8 Kelowna CHBC-TV B-B, Slk, BCT 152,100 11.8 57.4 Penticton
Vernon Prince George Prince Rupert Terrace-Kitimat Vancouver Victoria
CHBC-TV CHBC CKPG-TV CFTK-TV CFTK-TV CHAN-TV CHEK-TV
B-B, Slk, BCT B-B, Slk, BCT Van Skn Skn WBC, Slk, Fpl BCT WBC, Slk, Fpl, BCT
(This circulation figure also includes CFRC-TV Kamloops) 58,900 53,400 375,900 101,000
4.6 4.1 29.1 7.8
Alberta 10 4 Calgary Lethbridge
CFCN-TV CHCT-TV CJLH-TV CFCN-TV
M-H Slk Slk M-H (Partial relay from M-H Calgary)
314,300 206,000 72,400
21.5 14.1 5.0
40.6
Saskatchewan 9 3 Prince Albert Regina Moose Jaw
CKBI-TV CKCK-TV CKMJ-TV (Satellite CKCK)
Rwl Sft Sft
91,700 191,100
10.0 20.8
30.8
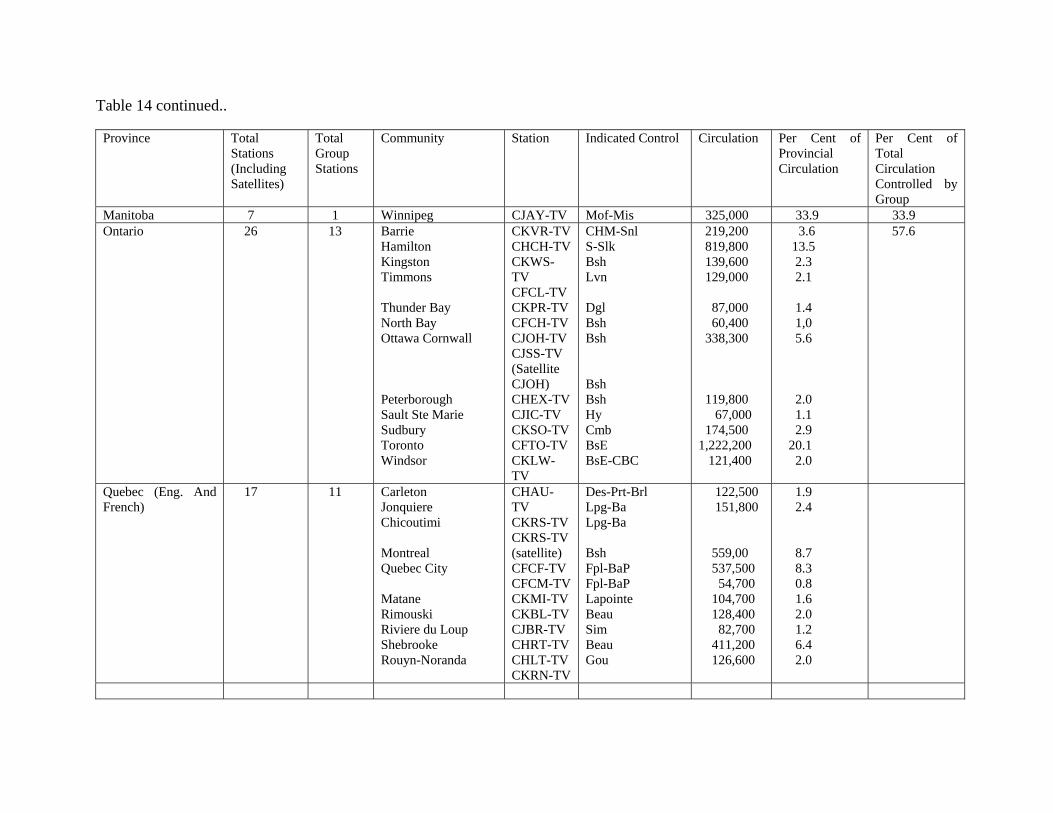
Table 14 continued..
Province Total Stations (Including Satellites)
Total Group Stations
Community Station Indicated Control Circulation Per Cent of Provincial Circulation
Per Cent of Total Circulation Controlled by Group
Manitoba 7 1 Winnipeg CJAY-TV Mof-Mis 325,000 33.9 33.9 Ontario 26 13 Barrie
Hamilton Kingston Timmons Thunder Bay North Bay Ottawa Cornwall Peterborough Sault Ste Marie Sudbury Toronto Windsor
CKVR-TV CHCH-TV CKWS-TV CFCL-TV CKPR-TV CFCH-TV CJOH-TV CJSS-TV (Satellite CJOH) CHEX-TV CJIC-TV CKSO-TV CFTO-TV CKLW-TV
CHM-Snl S-Slk Bsh Lvn Dgl Bsh Bsh Bsh Bsh Hy Cmb BsE BsE-CBC
219,200 819,800 139,600 129,000 87,000 60,400 338,300 119,800 67,000 174,500 1,222,200 121,400
3.6 13.5 2.3 2.1 1.4 1,0 5.6 2.0 1.1 2.9 20.1 2.0
57.6
Quebec (Eng. And French)
17 11 Carleton Jonquiere Chicoutimi Montreal Quebec City Matane Rimouski Riviere du Loup Shebrooke Rouyn-Noranda
CHAU-TV CKRS-TV CKRS-TV (satellite) CFCF-TV CFCM-TV CKMI-TV CKBL-TV CJBR-TV CHRT-TV CHLT-TV CKRN-TV
Des-Prt-Brl Lpg-Ba Lpg-Ba Bsh Fpl-BaP Fpl-BaP Lapointe Beau Sim Beau Gou
122,500 151,800 559,00 537,500 54,700 104,700 128,400 82,700 411,200 126,600
1.9 2.4 8.7 8.3 0.8 1.6 2.0 1.2 6.4 2.0
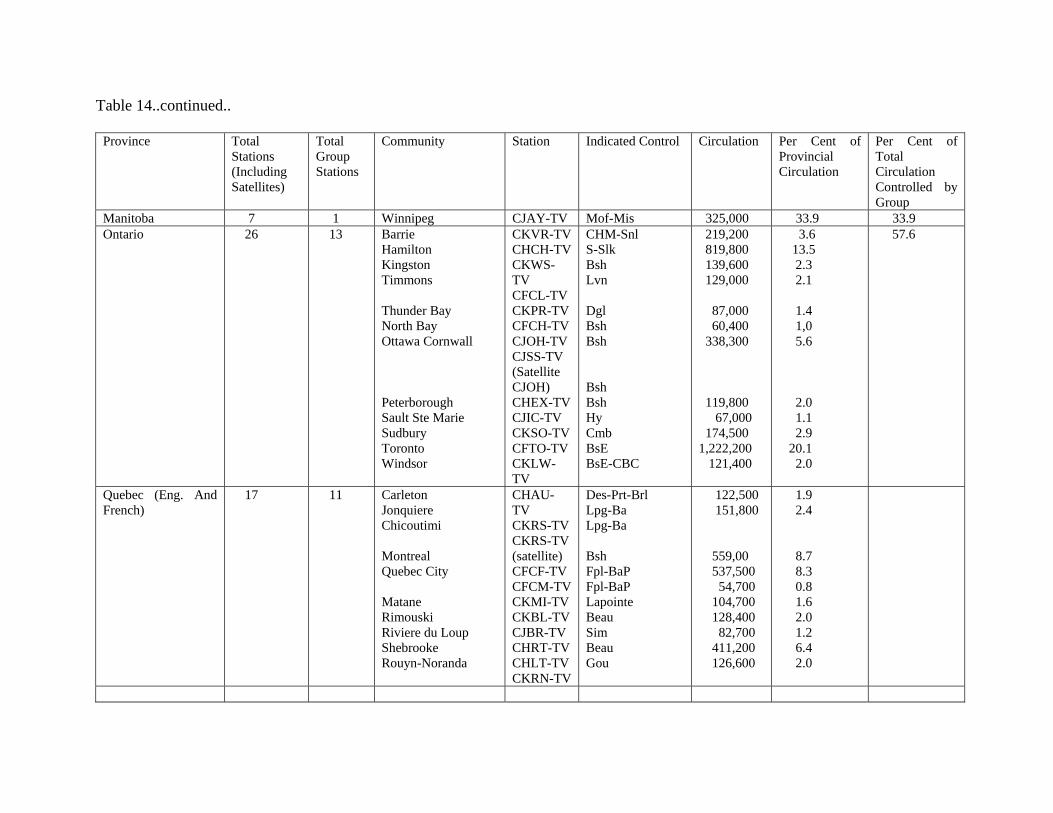
Table 14..continued..
Province Total Stations (Including Satellites)
Total Group Stations
Community Station Indicated Control Circulation Per Cent of Provincial Circulation
Per Cent of Total Circulation Controlled by Group
Manitoba 7 1 Winnipeg CJAY-TV Mof-Mis 325,000 33.9 33.9 Ontario 26 13 Barrie
Hamilton Kingston Timmons Thunder Bay North Bay Ottawa Cornwall Peterborough Sault Ste Marie Sudbury Toronto Windsor
CKVR-TV CHCH-TV CKWS-TV CFCL-TV CKPR-TV CFCH-TV CJOH-TV CJSS-TV (Satellite CJOH) CHEX-TV CJIC-TV CKSO-TV CFTO-TV CKLW-TV
CHM-Snl S-Slk Bsh Lvn Dgl Bsh Bsh Bsh Bsh Hy Cmb BsE BsE-CBC
219,200 819,800 139,600 129,000 87,000 60,400 338,300 119,800 67,000 174,500 1,222,200 121,400
3.6 13.5 2.3 2.1 1.4 1,0 5.6 2.0 1.1 2.9 20.1 2.0
57.6
Quebec (Eng. And French)
17 11 Carleton Jonquiere Chicoutimi Montreal Quebec City Matane Rimouski Riviere du Loup Shebrooke Rouyn-Noranda
CHAU-TV CKRS-TV CKRS-TV (satellite) CFCF-TV CFCM-TV CKMI-TV CKBL-TV CJBR-TV CHRT-TV CHLT-TV CKRN-TV
Des-Prt-Brl Lpg-Ba Lpg-Ba Bsh Fpl-BaP Fpl-BaP Lapointe Beau Sim Beau Gou
122,500 151,800 559,00 537,500 54,700 104,700 128,400 82,700 411,200 126,600
1.9 2.4 8.7 8.3 0.8 1.6 2.0 1.2 6.4 2.0
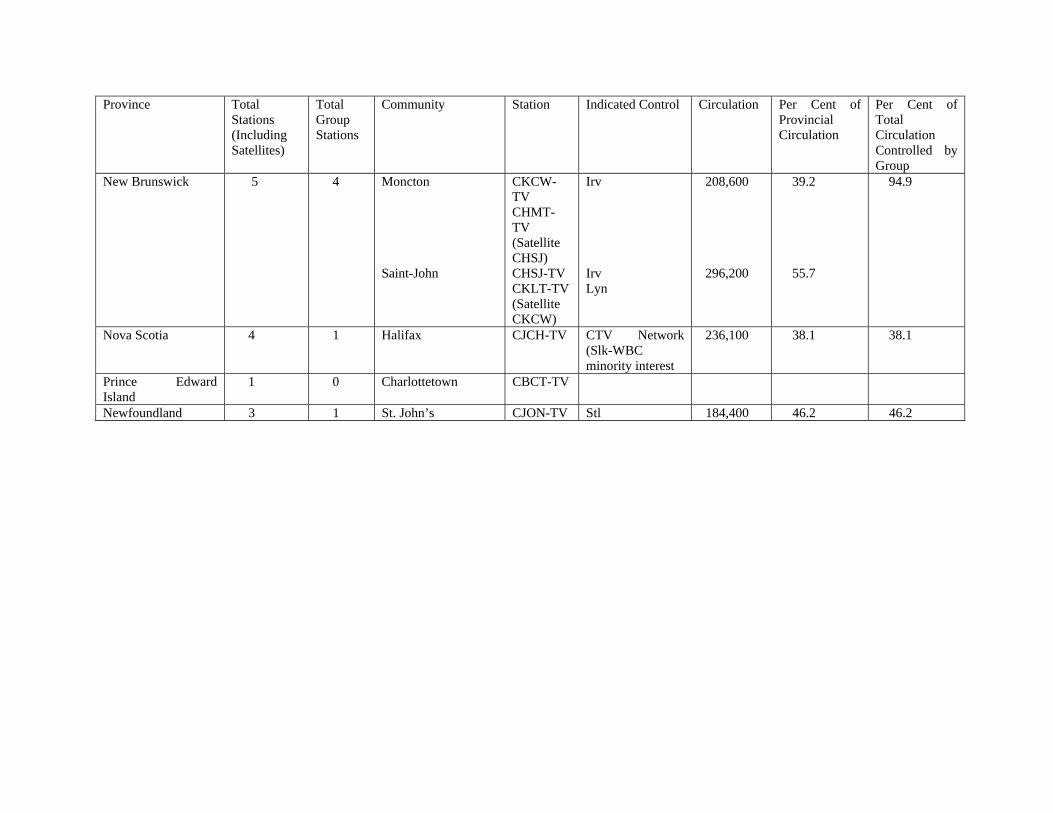
Province Total Stations (Including Satellites)
Total Group Stations
Community Station Indicated Control Circulation Per Cent of Provincial Circulation
Per Cent of Total Circulation Controlled by Group
New Brunswick 5 4 Moncton Saint-John
CKCW-TV CHMT-TV (Satellite CHSJ) CHSJ-TV CKLT-TV (Satellite CKCW)
Irv Irv Lyn
208,600 296,200
39.2 55.7
94.9
Nova Scotia 4 1 Halifax CJCH-TV CTV Network (Slk-WBC minority interest
236,100 38.1 38.1
Prince Edward Island
1 0 Charlottetown CBCT-TV
Newfoundland 3 1 St. John’s CJON-TV Stl 184,400 46.2 46.2

In Barrie, CKVR-TV, originally controlled by Ralph Snelgrove, has come under the
control of Allan Waters of CHUM, with Snelgrove retaining only a minority interest.
In Quebec, CHLT-TV in Sherbrooke, CIBR-TV in Rimouski, both came under the control of the Power Group and then were transferred to Telemedia (Quebec) Limitee (Beaubien).
CICH-TV in Halifax, originally controlled by local interests, is now under the control of the CTV Network, with Selkirk and Western Broadcasting sharing a 25 per cent interest.
The present pattern of ownership is infinitely more tangled in broadcasting than in daily newspapers - in part because of the substantial number of stations involved, in part because ownership is frequently divided among a number of individuals and/or corporate interests.
There are a number of groups with widespread interests in broadcasting, some of which also have extensive publishing interests - such as Southam and Maclean-Hunter. Until July of 1970, Thomson and Power Corp. also had extensive broadcast interests but these have been sold with the C.R.T.C.'s approval to Bushnell Communications Limited and Telemedia (Quebec) Limitee.
A number of public companies have been moving aggressively in recent years to increase their broadcasting holdings. These include the Western Broadcasting Company, controlled by Frank Griffiths, Maclean-Hunter, Selkirk Holdings (in which Southam has 30 per cent voting interest), CHUM Limited and Bushnell Communications.
Standard Broadcasting, with major radio stations in Toronto and Montreal (CFRB and ClAD, respectively), continues its long struggle for permission from the regulatory authority to establish a television station in Toronto, as well.
Famous Players Canadian Corporation Limited has massive interests in radio and television and cable TV, but it has been ordered to divest itself of much of its broadcasting holdings to comply with federal foreign ownership regulations.
Starlaw Investments Limited, the beneficial owner of the Montreal Star and Montreal Standard Publishing Co. Ltd., has applied for the licence to operate Cable TV Ltd., a Famous Players system in Montreal.
In addition to the public companies, there are also a number of private family groups with major broadcasting interests throughout Canada. They include Bromley-Browne, Moffat, Dougall, Rawlinson, the Clifford Siftons, Rogers, Stirling, Flock, Baribeau et Fils, Inc., La Societe Lepage Inc., Pratte, Lavigne, Tietolman and Irving.
A later section will include a listing of the media interests of each of the major groups.

A SYNOPTIC VIEW OF MEDIA OWNERSHIP PATTERNS
IN THE MAJOR CENTRES OF EACH PROVINCE
BRITISH COLUMBIA Between them, a number of groups play a leading role in broadcasting in British Columbia. Among the most important are Selkirk Holdings Limited, (in which Southam Press holds 30 per cent of the voting stock to give it the largest single interest), and Western Broadcasting Company, controlled by Frank Griffiths. Southam controls the Vancouver Province and has a half-interest in Pacific Press which publishes both the Province and the Vancouver Sun, controlled by F. P. publications. The latter owns the two Victoria dailies.
Selkirk controls radio stations in Vancouver, Vernon and Victoria, while Western Broadcasting has two radio stations in Vancouver. As indicated earlier, Famous Players, Selkirk and Western Broadcasting control British Columbia Television Broadcasting System Limited, which owns the two private television stations in Vancouver and Victoria. British Columbia Television and Selkirk independently each share a substantial minority interest with the Bromley-Browne family in Okanagan Valley Television Co. Ltd., which owns the television stations in Kelowna and Penticton.
Skeena Broadcasters Limited has a primary television station in Terrace-Kitimat, a relay in Prince Rupert and a number of other smaller British Columbia communities and radio stations in Prince Rupert, Kitimat and Terrace.
Between them, the eight group-owned television stations -- of a total of fourteen - accounted for 57.4 per cent of the daily night-time circulation of B.C. stations estimated by the Bureau of Broadcast Measurement for the survey period in November, 1969.
ALBERTA Southam-Selkirk, Maclean-Hunter and Moffat Broadcasting Limited, together with the Rawlinson family, dominate radio and television in Alberta. Southam, which publishes one of two papers in Calgary and the only daily in Edmonton and in Medicine Hat, has a direct 40 per cent interest in CFAC-AM (Calgary) and CFRN-AM and CFRN-FM (Edmonton) and the remaining 60 per cent of these stations is held by Selkirk Holdings in which Southam has a 30 per cent interest. Selkirk also controls radio stations in Grande Prairie and Lethbridge and one of the two television stations in both Calgary and Lethbridge. The other television station in both these cities is controlled by Maclean-Hunter, which also has a radio station in Calgary.
In all, four out of ten television stations in the listed communities are controlled by these groups, which had 40.6 per cent of the circulation in the BBM survey period.

SASKATCHEWAN
In Saskatchewan, the Sifton group has major holdings in the two major daily newspapers
and broadcasting, with the Rawlinson family forming the other predominant interest in broadcasting.
The Sifton family owns the only newspaper in Regina, one of five radio stations and one of two television stations, the other having been acquired from Moffat Broadcasting Limited by the CBC early in 1969 at the direction of the C.R.T.C. In addition, the Sifton family owns the only daily newspaper in Saskatoon, the Star-Phoenix, and CKMJ-TV (Moose Jaw), a satellite of CKCK-TV (Regina).
The Rawlinson family controls a radio station in Regina and the single radio station and television station in Prince Albert.
The three group-owned television stations, out of a total of nine in the province, accounted for 30.8 per cent of the total daily night-time circulation in the BBM survey.
MANITOBA Ownership of newspapers and broadcasting stations is widely dispersed among independent interests throughout most centres in Manitoba. Groups, however, play a leading part in Winnipeg. The two daily newspapers are owned by F.P. and Southam. In Brandon, Southam has a 49 per cent interest in the Brandon Sun. Western Broadcasting and Moffat each control two radio stations and Sifton owns one of a total of sixteen in the province. The only private television station in Winnipeg is 50 per cent owned by Moffat Broadcasting, the other two - one English and one French - by the CBC. Although there are seven primary television stations in Manitoba, the one station controlled by Moffat accounts for 33.9 per cent of the total daily night-time circulation.
ONTARIO Ownership of the mass media in Ontario is so widely dispersed among so many communities that it defies any attempt to summarize its nature succinctly. What follows is a brief summary of the situation in 20 Ontario cities with populations of 50,000 or more. Toronto
Three of the four daily newspapers are group-controlled - the Toronto Star, a publicly-
owned company, through the share holdings of the present directors and Atkinson-Hindmarsh interests, the Telegram by John Bassett and John David Eaton through trust arrangements, and the Globe and Mail by F. P. Publications Limited. The only independent is the recently established Italian-language daily.

Seven out of 15 radio stations are group-controlled, two by Standard Broadcasting Corporation (which in turn is controlled by Argus Corporation), two by Rogers Broadcasting, two by CHUM (controlled by Allan Waters) and one by Maclean-Hunter.
The only private television station is also controlled by the Bassett-Eaton interests. Ottawa-Hull
The two English-language dailies are group-owned by F.P. and Southam, the latter having a 38 per cent interest in two of the radio stations. Le Droit is an independent French language newspaper. Five out of the eleven radio stations are controlled by groups – two by CHUM; two y Telemedia (Quebec) Limitee; and one by Raymond Crepault. The only private television station, CJOH-TV is owned by Bushnell Communications. Hamilton
The only daily newspaper is owned by Southam which also has a substantial indirect minority interest through Selkirk Holdings in the only television station, CHCH-TV, a non-network operation. Southam used to own 35 per cent of CHCH while Selkirk held 15 per cent. In keeping with its policy to consolidate its broadcast holdings in Selkirk, Southam sold its share. Selkirk also bought the remaining 50 per cent of other outstanding shares to gain lOOper cent control. One radio station each is owned by Rogers and Sifton and two by the Soble .estate. Windsor
The only newspaper, the Windsor Star, is independently owned. Four of the five radio stations are owned by groups - two by RKO, and two by Stirling. The television station was also controlled by RKO until it divested itself of its holdings to comply with the foreign ownership regulations of the federal government. The Bassett-Eaton group has acquired 75 per cent and CBC 25 per cent of the station, but the CBC is to buyout Bassett-Eaton in five years. RKO will, of course, have to sell its radio holdings as well. Recently it was announced that Baton Broadcasting (Bassett) had purchased these radio stations subject to C.R.T.C. approval. London
The only daily, the London Free Press, two radio stations, and the only television station in the city are all controlled by the Blackburn family. Southam has a 25 per cent interest in London Free Press Holdings Limited, which has virtually all the shares of the broadcasting stations. Of the two other radio stations, one is 50 per cent owned by the Jeffery family and managed by the Thomson Group and one is controlled by H. J. McManus. Kitchener-Waterloo
The single daily serving this community is independently owned by the Motz family, although Southam has a 48 per cent interest. Two of the four radio stations are owned by Maclean-Hunter, two by Carl Pollock - Mr. Pollock also controls the television station.

Sudbury The Sudbury Star is controlled by Thomson. Two of the four radio stations and the television station are owned by Cambrian Broadcasting Limited, which is controlled by the Cooper, Miller and Plaunt families. J. C. Lavigne has been authorized to launch a new television station which will become operational in 1971. St. Catharines
The only daily and two of the four radio stations are controlled by the Burgoyne family, the other two radio stations being controlled by other independent interests. Thunder Bay
The two dailies published in this amalgamated community are owned by Thomson. Two of the four radio stations are owned by the Dougall family, which also controls the television station. Oshawa
The daily newspaper is owned by Thomson and the two radio stations are commonly owned by local interests. Sault Ste. Marie The Sault Ste. Marie Star is independently owned. Two of the radio stations are controlled by Greco, a small group owner with other radio stations at Blind River and Elliot Lake, and two radio stations and the television station are independent and controlled through the Hyland estate. Brantford
The daily, the Expositor, is independently owned, as are two radio stations. Kingston The Kingston Whig-Standard is owned by the Davies family, which used to share an interest in two out of six radio stations and the Kingston television station. These were sold together with other Davies-Thomson broadcast holdings to Bushnell Communications Limited in July 1970. Welland –Pt. Colborne
The daily newspaper, the Evening Tribune is owned by the Thomson group. The single radio station is independently owned.

Niagara Falls
The one daily newspaper and one radio station in this city are independently and separately owned. Sarnia The single daily is owned by Thomson; one radio station is independently controlled and the other is owned by the Ivey family of London. Peterborough The Peterborough Examiner is Thomson-owned. CHUM and Snelgrove share control of one radio station. Davies-Thomson interests in the two other radio stations and the television station were bought by Bushnell Communications Limited. Guelph The newspaper, the Mercury, is owned by the Thomson group; the one radio station independently owned. Oakville
The only newspaper, the Daily Journal-Record, is wholly owned by Toronto Star Limited, ownership having formerly been shared with Thomson. The single radio station is independently owned. North Bay The North Bay Nugget is owned and operated by Southam Press Limited. One radio station and the television station are owned by Bushnell Communications Limited at present but the C.R.T.C. has instructed Bushnell to sell these interests as soon as possible. One radio station in the community is independently owned.
QUEBEC Only fourteen daily newspapers are published in Quebec - compared to forty-eight in Ontario - and those fourteen papers are published in only five communities: Granby, Montreal, Quebec City, Sherbrooke, and Trois-Rivieres. Nine of the total are group-owned. Paul Desmarais with Jean Parisien, through Gelco Enterprises, owns the largest French-language daily, La Presse, in Montreal. Les Journaux Trans-Canada Limitee, in which Mr. Desmarais has the largest shareholdings, also owns the only daily newspapers in Granby and Trois-Rivieres and the only French-language paper in Sherbrooke. Two dailies are published by the Peladeau Group, one in Montreal and one in Quebec City. The Montreal Star, the Montreal Gazette (a Southam paper), and the Thomson-owned Chronicle-Telegraph (Quebec City) are the other group-owned dailies.
A total of twenty-nine of the forty-one radio stations in the surveyed communities in Quebec are group-owned, the highest proportion of any province in Canada. Seven of these stations are controlled by the newly formed TeIemedia (Quebec) Limitee which is controlled by Philippe de Gaspe Beaubien; five by Crepault; four by a combination of Baribeau-Pratte interests; two each by Standard Broadcasting, Stirling, Tietolman and Bushnell; one by a combination of Baribeau and the Lepage Societe. Single stations are also owned by DesmaraissParisien-Franreur, Simard, Gourd, and Lapointe. There are only six private, independently-owned stations, the remaining six being owned by the CBC.
The degree of concentration among groups is less in television. Eleven of seventeen stations are group controlled. Beaubien controls the television stations in Sherbrooke and Rimouski through Telemedia (Quebec) Limitee. Desmarais has a substantial minority interest in CHAU-TV at Carleton, Quebec as does the Pratte group. The Lepage Societe and the Baribeau interests control the station at Jonquiere; Famous Players and Baribeau-Pratte control two television stations in Quebec City (one French, one English); and Bushnell, in July 1970, obtained C.R.T.C. approval to purchase CFCF-TV in Montreal.
The eleven group-controlled television stations accounted for 35.3 per cent of the total daily night time circulation in the BBM survey period.
NEW BRUNSWICK As indicated previously, K. C. Irving has a dominant interest in the mass media of New Brunswick. He owns five of the six dailies, the sixth being the French-language L 'Evangeline of Moncton. He owns one of four radio stations in Saint John. CH5J-TV in Saint John, also Irving owned, has long covered a substantial part of New Brunswick, including Fredericton, the capital. CHSJ-TV recently installed a satellite in Moncton at the direction of the C.R.T.C., further extending the coverage of this station substantially. At the same time, the C.R.T.C. also ordered the installation in Saint John of a satellite of television station CKCW-TV in Moncton. The effect of the move is to make available alternative television service for the first time in a substantial part of the province, with the Moncton station becoming an affiliate of the CTV Network and CHSJ- TV remaining an affiliate of CBC. There is one French CBC-owned television station in the province. During the BBM survey period, CHSJ-TV had an estimated 55.7 per cent of the total daily night time circulation of the two stations then in operation and CKCW-TV had 39.2 per cent.
NOVA SCOTIA There is only a relatively small degree of concentration of ownership of the mass media in Nova Scotia. Thomson's New Glasgow News and Bowes' Truro News are the only group-owned papers. The Dennis family controls the two Halifax dailies. Four of 13 radio stations are group owned, three of them by the Manning family, with one station in Amherst and two in Truro. The other group station is CJCH in Halifax, which is wholly owned by CHUM Ltd. CTV has the controlling interest in CJCH - TV, the only affiliate station controlled by the CTV Network with Selkirk and Western Broadcasting having significant minority shareholdings.

CJCH - TV, one of four television stations in the province, accounted for 38.1 per cent of the total daily night time circulation in the BBM survey.
PRINCE EDWARD ISLAND The two daily newspapers in Charlottetown are Thomson-owned and a third, in Summerside, is independent. Of the three radio stations in the communities surveyed, two are independents and one is owned by the CBC. The only television station has recently been taken over by the CBC.
NEWFOUNDLAND Two of the three Newfoundland dailies were acquired by Thomson from the Herder family in 1970 - the St. John's Evening Telegram and the Corner Brook Western Star. Two of seven radio stations in the communities surveyed are group owned, one by Butler, who has radio stations also in Grand Falls, Marystown and Gander, and the other by Stirling. Stirling also controls the only private television station in the province, CION-TV (St. John's), the other two stations being owned by the CBC. CJON-TV had 46.2 per cent of the total daily night-time circulation during the BBM survey period.
IN PERSPECTIVE The extent of ownership concentration of the mass media should not be regarded as a Canadian phenomenon. It is a reflection of a trend that has been evident in a number of other countries. This is particularly true of the United States. In fact, the trend may not have progressed as far in Canada as the United States, in part because of the ownership of a number of publicly owned radio and television stations by the CBC.
As of 1967, there were only five American cities, according to Arthur B. Hanson, General Counsel of the American Newspaper Publishers Association, in which three or more dailies were published. (There were fifteen newspapers published in New York at the turn of the century; today there are three.) There are the same number of cities in which this is true today in Canada. Mr. Hanson told the U.S. Senate Sub-committee there were thirty-seven cities in which two separately-owned newspapers were published, which compares favourably with the 10 cities in which two or more separately-owned dailies are published in Canada today. Out of some 1,600 cities with dailies, 96 per cent were controlled by a single newspaper management.
In twenty-three American cities, there were two papers published under a joint publishers' arrangement in late 1967, a situation that in Canada exists today only in Vancouver.
In The First Freedom by Bryce W. Rucker, it is estimated that chains (companies with interests in two or more of the same mediums in different communities) controlled 871 out of 1,761 daily newspapers in the United States as of mid-1967, 49.3 per cent. This is a narrower definition than has been adopted here for a group and so is not directly comparable to the situation in Canada.
Rucker calculated that in 1960 the rate of growth of chain ownership amounted to 12.5 per cent per annum. By 1962, the rate had increased to 33 per cent and by 1967 amounted to 46.2 per cent. As of that year, he calculated that the chains controlled 61.8 per cent of the total daily newspaper circulation of the United States and owned 19 out of the twenty-five largest newspapers south of the border.
As in Canada, there are also extensive multiple interests in broadcasting. Rucker estimated that 373 chains in 1967 controlled 1,297 AM radio stations out of a total of 4,130, a total of 31.4 per cent and 31 per cent of the FM stations, as well.
He maintained that chains controlled 73.6 per cent of all commercial television stations and the average number of stations held by each chain amounted to 3.9. In early 1967, newspapers held interests in one-third of the VHF television stations and 22 per cent of the UHF stations, according to Rucker. There was a newspaper-television monopoly in twenty-seven cities and in another twenty-seven cities the owner of the only daily newspaper had a financial interest in the only TV station. In another seventeen cities the owner of the only daily had an interest in one of two television stations. In sum, 81.3 per cent of American VHF television stations and 62.8 per cent of UHF stations were owned by broadcasting chains, newspaper interests or both. Out of 156 VHF stations in the top fifty markets in the United States, representing 75 per cent of all television households, 81.5 per cent were controlled by chains. Only 5.13 per cent were owned by broadcasters with no other media or other special interests. In March, 1969, the New York Times reported that 155 publishers had a financial stake in 260 out of 496 commercial television stations. Of these, 160 were wholly owned by publishing interests.
According to the Federal Communications Commission, there were seventy-three communities in late 1967 in which one person or company controlled all of the local newspaper and broadcasting outlets.
While it is by no means exhaustive, nor even directly comparable with the Canadian experience, the brief survey of the situation in the United States makes it clear that the extent of ownership concentration among the media and the problems this may generate is by no means unique to Canada.

Chapter 4:
PROFILES OF MULTI-MEDIA OWNERS
INTRODUCTION
This chapter contains brief profiles, arranged alphabetically, of twenty groups holding extensive media interests in Canada. In some cases, non-media interests are also included.
Those groups studied are: Bassett-Eaton; Bushnell Communications Limited; CHUM Limited; Raymond Crepault; Desmarais-Parisien-Francoeur; Dougall Family; F.P. Publications Limited; K. C. Irving; Maclean-Hunter Limited; McConnell Family; Moffat Broadcasting Limited; Pratte-Baribeau-Lepage; Rogers Broadcasting Limited; Sifton; Southam-Selkirk; Standard Broadcasting Corporation Limited; Telemedia (Quebec) Limitee; Thomson; Toronto Star Limited; Western Broadcasting Company Limited.
In September, 1968, the Governor General in Council issued a direction to the Canadian Radio-Television Commission which had the effect of limiting foreign ownership in any broadcasting undertaking to 20 per cent. The effective date of the order has twice been extended to allow ample opportunity for companies with foreign investors to comply.
Two groups with sizeable holdings are still in the process of divesting: Famous Players Canadian Corporation which is controlled by Gulf and Western Industries Inc. of Houston, Texas; and Columbia Broadcasting System which with a number of Canadian associates, has considerable holdings in cable.
ProfIles on these two groups have not been included in this study because while both groups are in the process of divesting themselves of some or all of their Canadian broadcasting holdings, the process involves many separate transactions which must be approved by the C.R.T.C. Until this process is complete, the ownership of these holdings is unclear.
This information was obtained from a variety of official public sources and in some cases from group owners themselves. Circulation figures for publications are drawn from Canadian Advertising Rates and Data (December, 1969). Newspaper circulation represents daily average excluding bulk. Magazine and weekly newspaper information includes paid and non-paid circulation.
Broadcast circulation data are drawn from the 1969 BBM Coverage and Circulation Report of the survey conducted October 27 to November 9. They represent the number of people two years and over listening/viewing on an average daily basis. In the case of radio, day-time rates were used and for television night-time rates were used.
Cable circulation indicates the actual number of subscribing households and maximum potential number (in parentheses) in each licensed system. It should be noted that "maximum"

indicates 100 per cent of current number of households and that this degree of penetration is extremely unlikely for a given system. This information was supplied to the Committee by the individual cable operators since the Official Secrets Act forbade its extraction from DBS annual reports, but it is the same as the information in these reports.
THE PROFILES
THE BASSETT-EATON GROUP
The Bassett-Eaton group is represented by the Telegram Corporation Limited. Shares are held in trust for the three sons of Toronto publisher John W.H. Bassett and the four sons of John David Eaton, recently retired head of Canada's largest retailer.
Through its wholly owned subsidiary, the Telegram Publishing Co. Limited, the corporation publishes the Toronto Telegram. Another subsidiary, Inland Publishing Co. Ltd., publishes seven weekly newspapers in the Toronto area, which have a total circulation of nearly 100,000.
The corporation owns 53.17 per cent interest in Baton Broadcasting Limited which operates CFTO TV, Toronto's only private television station. It also controls 75 per cent of the shares of CKLW-TV in Windsor, the remaining interest being held by the CBC. Baton Broadcasting will be bought out by the CBC in 5 years by C.R.T.C. ruling.
Telegram Corporation Limited owns 50.52 per cent of the common shares of Glen-Warren Productions Limited, a company whose principal activity is the production of shows and commercials for television.
Glen-Warren Productions Limited used to hold 50 per cent of the common shares of Rogers Cable TV Limited. However, the C.R.T.C. ruled that the cable television licence held by Rogers Cable TV Limited would be renewed only on condition that Glen-Warren Productions Limited dispose of its shareholding. These shares have since been sold to the Rogers family.
Baton Broadcasting Limited also controls Israel Canada Productions, based in Tel Aviv and responsible for producing 80 per cent of Israeli television.
The corporation, through the Telegram Publishing Co. Limited, also holds a 19.7 per cent interest in Maple Leaf Gardens Limited, a company which owns Maple Leaf Gardens and the Toronto Maple Leaf Hockey Club, as well as a 31 per cent interest in Argonaut Football Club Limited which owns the Toronto Argonaut Football Club.
The non-media interests of the Eaton family are extensive, including a number of companies associated with the retail operations, as well as manufacturing and real estate.
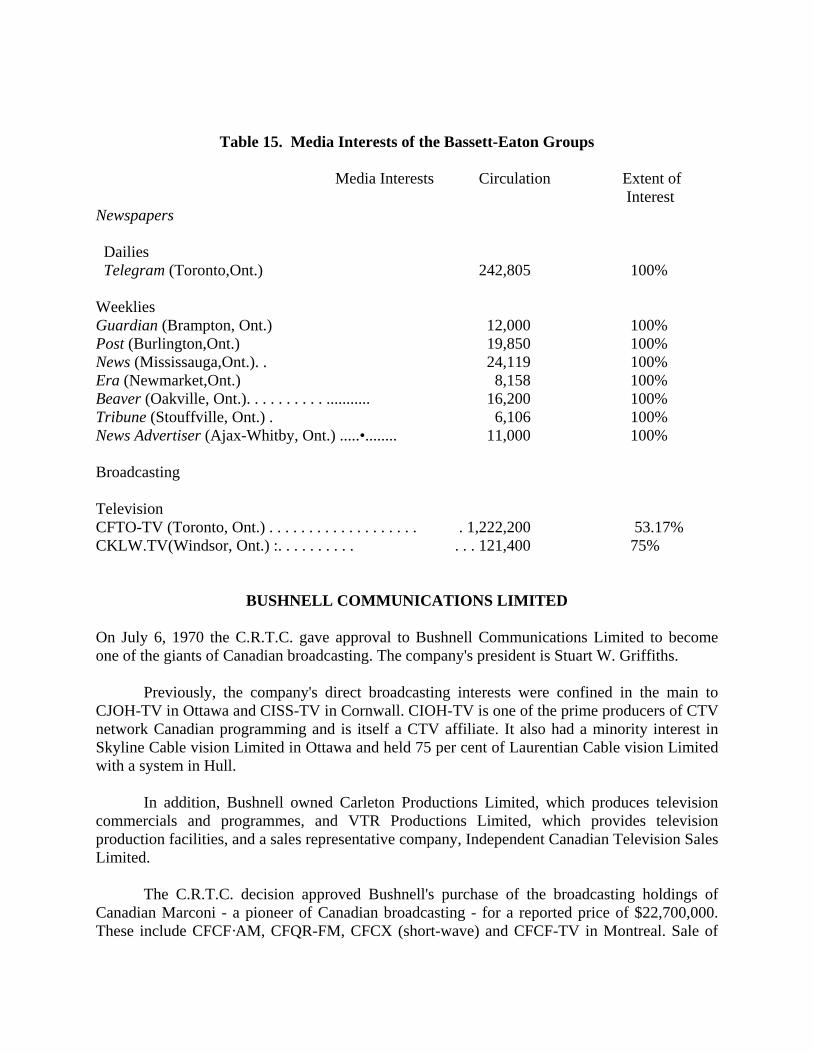
Table 15. Media Interests of the Bassett-Eaton Groups Media Interests Circulation Extent of Interest Newspapers Dailies Telegram (Toronto,Ont.) 242,805 100% Weeklies Guardian (Brampton, Ont.) 12,000 100% Post (Burlington,Ont.) 19,850 100% News (Mississauga,Ont.). . 24,119 100% Era (Newmarket,Ont.) 8,158 100% Beaver (Oakville, Ont.). . . . . . . . . . ........... 16,200 100% Tribune (Stouffville, Ont.) . 6,106 100% News Advertiser (Ajax-Whitby, Ont.) .....•........ 11,000 100% Broadcasting Television CFTO-TV (Toronto, Ont.) . . . . . . . . . . . . . . . . . . . . 1,222,200 53.17% CKLW.TV(Windsor, Ont.) :. . . . . . . . . . . . . 121,400 75%
BUSHNELL COMMUNICATIONS LIMITED
On July 6, 1970 the C.R.T.C. gave approval to Bushnell Communications Limited to become one of the giants of Canadian broadcasting. The company's president is Stuart W. Griffiths.
Previously, the company's direct broadcasting interests were confined in the main to CJOH-TV in Ottawa and CISS-TV in Cornwall. CIOH-TV is one of the prime producers of CTV network Canadian programming and is itself a CTV affiliate. It also had a minority interest in Skyline Cable vision Limited in Ottawa and held 75 per cent of Laurentian Cable vision Limited with a system in Hull.
In addition, Bushnell owned Carleton Productions Limited, which produces television commercials and programmes, and VTR Productions Limited, which provides television production facilities, and a sales representative company, Independent Canadian Television Sales Limited.
The C.R.T.C. decision approved Bushnell's purchase of the broadcasting holdings of Canadian Marconi - a pioneer of Canadian broadcasting - for a reported price of $22,700,000. These include CFCF·AM, CFQR-FM, CFCX (short-wave) and CFCF-TV in Montreal. Sale of
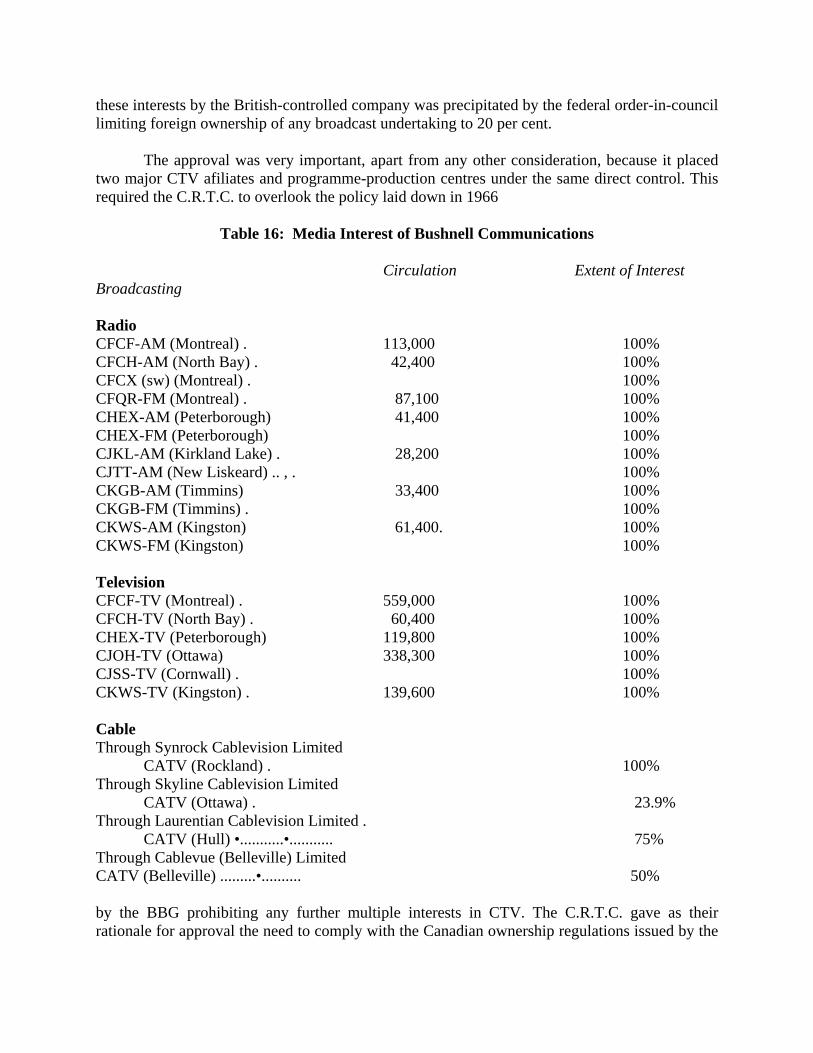
these interests by the British-controlled company was precipitated by the federal order-in-council limiting foreign ownership of any broadcast undertaking to 20 per cent.
The approval was very important, apart from any other consideration, because it placed two major CTV afiliates and programme-production centres under the same direct control. This required the C.R.T.C. to overlook the policy laid down in 1966
Table 16: Media Interest of Bushnell Communications
Circulation Extent of Interest Broadcasting Radio CFCF-AM (Montreal) . 113,000 100% CFCH-AM (North Bay) . 42,400 100% CFCX (sw) (Montreal) . 100% CFQR-FM (Montreal) . 87,100 100% CHEX-AM (Peterborough) 41,400 100% CHEX-FM (Peterborough) 100% CJKL-AM (Kirkland Lake) . 28,200 100% CJTT-AM (New Liskeard) .. , . 100% CKGB-AM (Timmins) 33,400 100% CKGB-FM (Timmins) . 100% CKWS-AM (Kingston) 61,400. 100% CKWS-FM (Kingston) 100% Television CFCF-TV (Montreal) . 559,000 100% CFCH-TV (North Bay) . 60,400 100% CHEX-TV (Peterborough) 119,800 100% CJOH-TV (Ottawa) 338,300 100% CJSS-TV (Cornwall) . 100% CKWS-TV (Kingston) . 139,600 100% Cable Through Synrock Cablevision Limited
CATV (Rockland) . 100% Through Skyline Cablevision Limited
CATV (Ottawa) . 23.9% Through Laurentian Cablevision Limited .
CATV (Hull) •...........•........... 75% Through Cablevue (Belleville) Limited CATV (Belleville) .........•.......... 50% by the BBG prohibiting any further multiple interests in CTV. The C.R.T.C. gave as their rationale for approval the need to comply with the Canadian ownership regulations issued by the
Governor-in-Council on September 20, 1968, and the opportunity for improved programming, offered by dual ownership. They safeguarded themselves by stating that advertisers cannot be obliged to purchase space in both CJOH-TV and CFCF-TV (Bushnell hoped to operate the stations as a mini-network during certain periods) and by stating that Bushnell could exercise only one vote as a member of CTV Television Network Limited.
The decision also granted to Bushnell all the broadcasting interests held separately and jointly by Thomson and Davies. These include CFCH-AM and CFCH-TV in North Bay, CKWS-AM and CKWS-FM and CKWS-TV in Kingston, CHEX-AM, CHEX-FM and CHEX-TV in Peterborough, CKGB-AM and CKGB-FM in Timmins, CJKL in Kirkland Lake, and CJTT in New Liskeard. However, although the C.R.T.C. indicated approval of separating these broadcasting interests from a newspaper publishing corporation, the C.R.T.C. was concerned about the extensive holdings this brought under the control of Bushnell. It specified that as rapidly as possible, Bushnell should dispose of CFCH and CFCH-TV in North Bay to a person acceptable to the Commission. It is thought that under new ownership the television station will form part of a system for second service to the north.
Bushnell also applied for permission to purchase and operate Cablevue (Belleville) Limited, Metro Cable TV Limited, Cornwall Cable Vision 1961 Limited, Community Video (Montrose-Fruitvale) Limited, Community Video Limited (Rossland and Trail), Community Video (Nanaimo) Limited, Community Video (Red Deer) Limited, North West Community Video Limited (Vancouver, Nelson, Castlegar, Kinnaird), Aurora Cable TV Limited, Northumberland Cable TV Limited, Smiths Falls Cablevision Limited, and an additional 61.57 per cent of the common shares of Skyline Cablevision. Of all these twelve applications, only a 50 per cent purchase of Cablevue (Belleville) Limited was approved, as part of the Thomson, Davies transaction, and here Bushnell was requested to sell again as soon as possible. The decision clearly reflects C.R.T.C. reservation in allowing broadcast ownership concentration in a system which could lead to a broad cable network.
Control of Bushnell Communications Limited, will be exercised through a voting trust agreement involving 78.5 per cent of the outstanding voting shares. The trustees are E. L. Bushnell, G. E. Beament, and A. Martineau. Bushnell is a public company, the shares of which are traded over-the-counter.
The Bushnell media holdings are shown in Table 16.
CHUM LIMITED
CHUM Limited, controlled by Allan F. Waters, was incorporated under Ontario charter on October 2, 1944, as York Broadcasters Limited. In 1959, the company's name was changed to Radio Chum-1050, and in 1969 the name was changed to the present one.
Before 1957, the company owned only one radio station, CHUM-AM, which was licensed to broadcast with a power of 1,000 watts from sunrise to sunset. Subsequently it received permission to broadcast twenty-four hours a day with a power of 50,000 watts. In May, 1962, the company became a partner in Peterborough Broadcasting Co., a joint venture operating
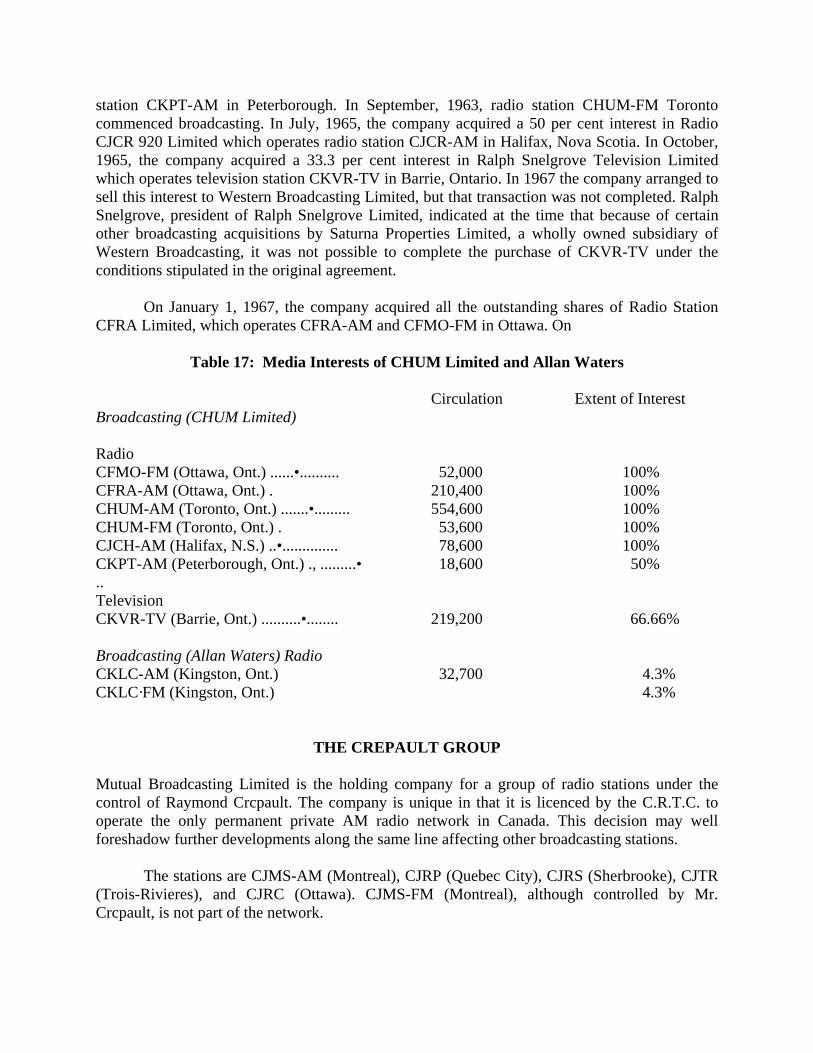
station CKPT-AM in Peterborough. In September, 1963, radio station CHUM-FM Toronto commenced broadcasting. In July, 1965, the company acquired a 50 per cent interest in Radio CJCR 920 Limited which operates radio station CJCR-AM in Halifax, Nova Scotia. In October, 1965, the company acquired a 33.3 per cent interest in Ralph Snelgrove Television Limited which operates television station CKVR-TV in Barrie, Ontario. In 1967 the company arranged to sell this interest to Western Broadcasting Limited, but that transaction was not completed. Ralph Snelgrove, president of Ralph Snelgrove Limited, indicated at the time that because of certain other broadcasting acquisitions by Saturna Properties Limited, a wholly owned subsidiary of Western Broadcasting, it was not possible to complete the purchase of CKVR-TV under the conditions stipulated in the original agreement.
On January 1, 1967, the company acquired all the outstanding shares of Radio Station CFRA Limited, which operates CFRA-AM and CFMO-FM in Ottawa. On
Table 17: Media Interests of CHUM Limited and Allan Waters
Circulation Extent of Interest Broadcasting (CHUM Limited) Radio CFMO-FM (Ottawa, Ont.) ......•.......... 52,000 100% CFRA-AM (Ottawa, Ont.) . 210,400 100% CHUM-AM (Toronto, Ont.) .......•......... 554,600 100% CHUM-FM (Toronto, Ont.) . 53,600 100% CJCH-AM (Halifax, N.S.) ..•.............. 78,600 100% CKPT-AM (Peterborough, Ont.) ., .........• 18,600 50% .. Television CKVR-TV (Barrie, Ont.) ..........•........ 219,200 66.66% Broadcasting (Allan Waters) Radio CKLC-AM (Kingston, Ont.) 32,700 4.3% CKLC·FM (Kingston, Ont.) 4.3%
THE CREPAULT GROUP
Mutual Broadcasting Limited is the holding company for a group of radio stations under the control of Raymond Crcpault. The company is unique in that it is licenced by the C.R.T.C. to operate the only permanent private AM radio network in Canada. This decision may well foreshadow further developments along the same line affecting other broadcasting stations.
The stations are CJMS-AM (Montreal), CJRP (Quebec City), CJRS (Sherbrooke), CJTR (Trois-Rivieres), and CJRC (Ottawa). CJMS-FM (Montreal), although controlled by Mr. Crcpault, is not part of the network.
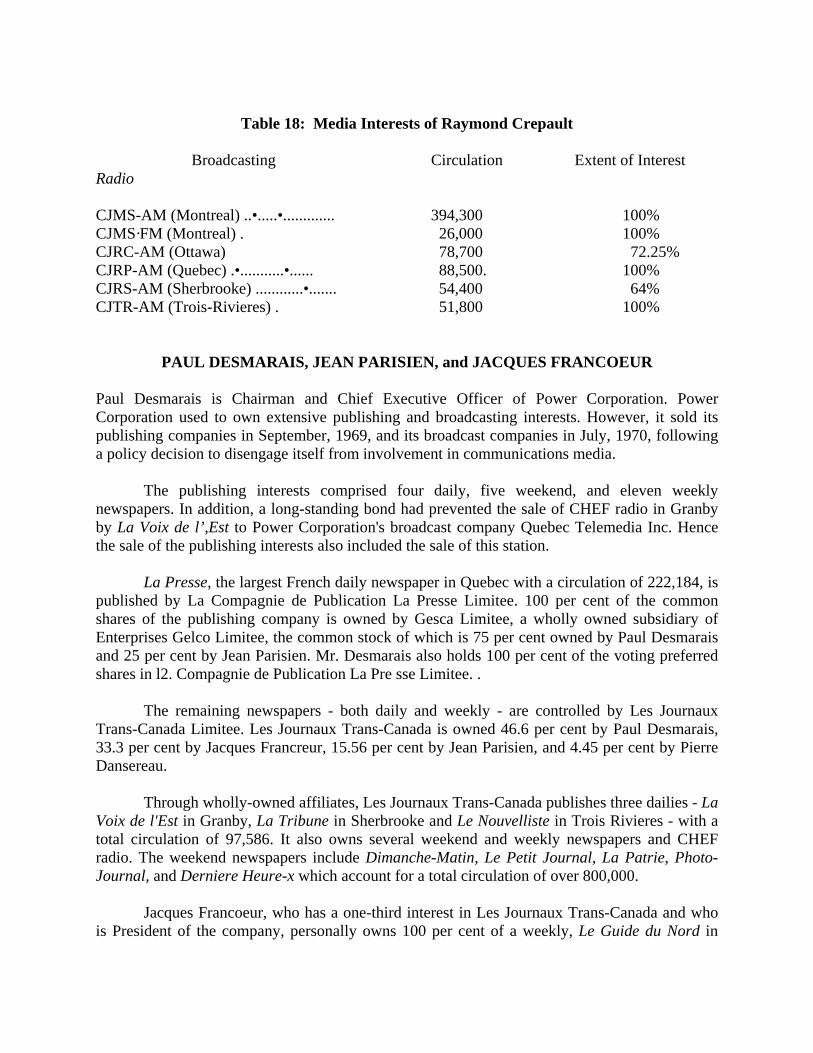
Table 18: Media Interests of Raymond Crepault
Broadcasting Circulation Extent of Interest
Radio CJMS-AM (Montreal) ..•.....•............. 394,300 100% CJMS·FM (Montreal) . 26,000 100% CJRC-AM (Ottawa) 78,700 72.25% CJRP-AM (Quebec) .•...........•...... 88,500. 100% CJRS-AM (Sherbrooke) ............•....... 54,400 64% CJTR-AM (Trois-Rivieres) . 51,800 100%
PAUL DESMARAIS, JEAN PARISIEN, and JACQUES FRANCOEUR
Paul Desmarais is Chairman and Chief Executive Officer of Power Corporation. Power Corporation used to own extensive publishing and broadcasting interests. However, it sold its publishing companies in September, 1969, and its broadcast companies in July, 1970, following a policy decision to disengage itself from involvement in communications media.
The publishing interests comprised four daily, five weekend, and eleven weekly newspapers. In addition, a long-standing bond had prevented the sale of CHEF radio in Granby by La Voix de l’,Est to Power Corporation's broadcast company Quebec Telemedia Inc. Hence the sale of the publishing interests also included the sale of this station.
La Presse, the largest French daily newspaper in Quebec with a circulation of 222,184, is published by La Compagnie de Publication La Presse Limitee. 100 per cent of the common shares of the publishing company is owned by Gesca Limitee, a wholly owned subsidiary of Enterprises Gelco Limitee, the common stock of which is 75 per cent owned by Paul Desmarais and 25 per cent by Jean Parisien. Mr. Desmarais also holds 100 per cent of the voting preferred shares in l2. Compagnie de Publication La Pre sse Limitee. .
The remaining newspapers - both daily and weekly - are controlled by Les Journaux Trans-Canada Limitee. Les Journaux Trans-Canada is owned 46.6 per cent by Paul Desmarais, 33.3 per cent by Jacques Francreur, 15.56 per cent by Jean Parisien, and 4.45 per cent by Pierre Dansereau.
Through wholly-owned affiliates, Les Journaux Trans-Canada publishes three dailies - La Voix de l'Est in Granby, La Tribune in Sherbrooke and Le Nouvelliste in Trois Rivieres - with a total circulation of 97,586. It also owns several weekend and weekly newspapers and CHEF radio. The weekend newspapers include Dimanche-Matin, Le Petit Journal, La Patrie, Photo-Journal, and Derniere Heure-x which account for a total circulation of over 800,000.
Jacques Francoeur, who has a one-third interest in Les Journaux Trans-Canada and who is President of the company, personally owns 100 per cent of a weekly, Le Guide du Nord in
Montreal (circulation 16,500). The publisher of this weekly, Irving Mandel, is also publisher of seven of the weeklies owned by Les Journaux Trans-Canada.
In July, 1970, the C.R.T.C. approved the sale by Power Corporation of the assets of Quebec Telemedia Inc., its broadcast holding corporation, to Philippe de Gaspe Beaubien. With the sale, Power Corporation divested itself of all ownership and management responsibility in broadcasting. Mr. Beaubien formed a new company, TeIemedia (Quebec) Limitee, which is discussed under the profile of the media interests of Philippe de Gaspe Beaubien.
Paul Desmarais also owns just over 30 per cent of Power Corporation, a widely diversified corporation. Its major subsidiary companies are Canada Steamship Lines (50.5 per cent), Dominion Glass Company (62 7 per cent), Campeau Corporation (54 per cent) - a large real estate development company - The Investors Group (50.3 per cent directly and a further 7.04 per cent through Imperial Life of which Power controls 51 per cent). Power Corporation also holds 54 per cent of Laurentide Financial Corporation. Major non-subsidiary companies include Consolidated Bathurst and Northern and Central Gas.
By indirect investment in other corporations, Power Corporation has acquired three minority holdings in broadcast in which it has no management involvement and are mentioned here only for the record. They are in CHUM Ltd. through Imperial Life Assurance, Standard Broadcasting through a 10 per cent interest in Argus Corporation, and Skyline Cablevision through Campeau Corporation.
Mr. Desmarais also retains a 33.3 per cent interest in Prades Inc. in equal partnerships with Messrs. C. Pratte and J. Brillant. This corporation owns 80 per cent of CHAD-TV, (Carleton, P.Q.) with its nine satellites and 95.7 per cent of CKSM-AM (Shawinigan, P.Q.).
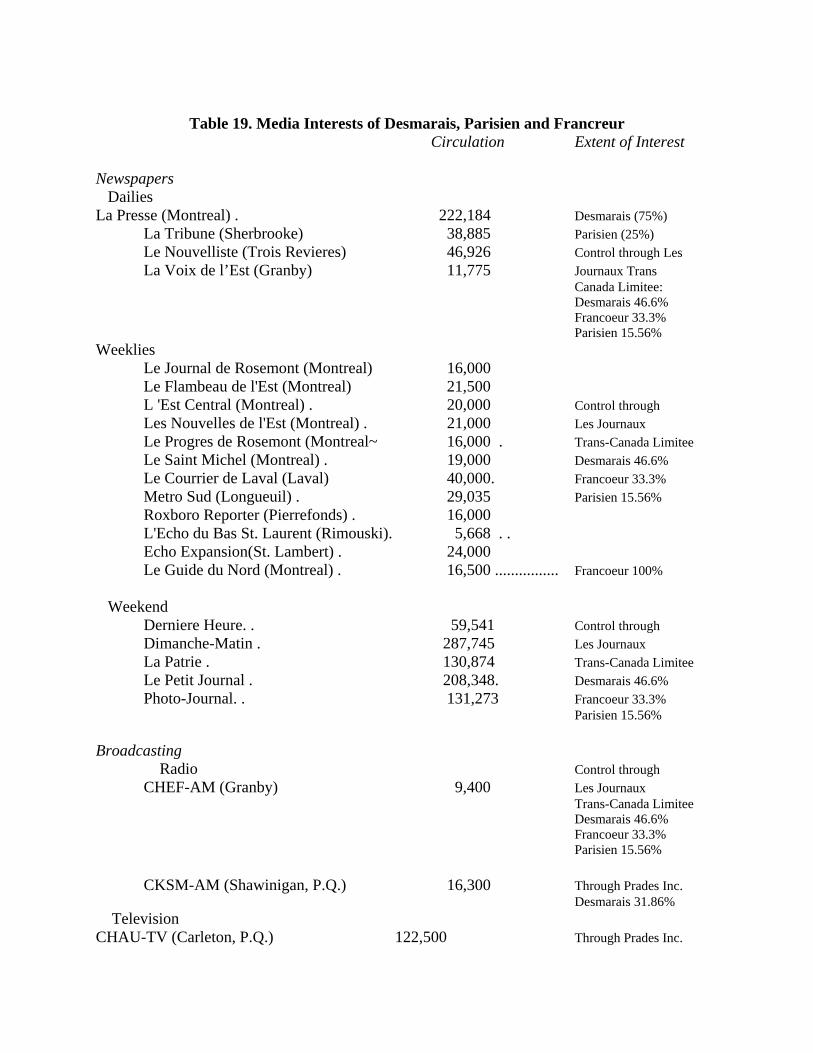
Table 19. Media Interests of Desmarais, Parisien and Francreur
Circulation Extent of Interest Newspapers Dailies La Presse (Montreal) . 222,184 Desmarais (75%) La Tribune (Sherbrooke) 38,885 Parisien (25%) Le Nouvelliste (Trois Revieres) 46,926 Control through Les
La Voix de l’Est (Granby) 11,775 Journaux Trans Canada Limitee:
Desmarais 46.6% Francoeur 33.3% Parisien 15.56% Weeklies
Le Journal de Rosemont (Montreal) 16,000 Le Flambeau de l'Est (Montreal) 21,500 L 'Est Central (Montreal) . 20,000 Control through Les Nouvelles de l'Est (Montreal) . 21,000 Les Journaux Le Progres de Rosemont (Montreal~ 16,000 . Trans-Canada Limitee Le Saint Michel (Montreal) . 19,000 Desmarais 46.6%
Le Courrier de Laval (Laval) 40,000. Francoeur 33.3% Metro Sud (Longueuil) . 29,035 Parisien 15.56% Roxboro Reporter (Pierrefonds) . 16,000 L'Echo du Bas St. Laurent (Rimouski). 5,668 . . Echo Expansion(St. Lambert) . 24,000 Le Guide du Nord (Montreal) . 16,500 ................ Francoeur 100%
Weekend Derniere Heure. . 59,541 Control through Dimanche-Matin . 287,745 Les Journaux La Patrie . 130,874 Trans-Canada Limitee Le Petit Journal . 208,348. Desmarais 46.6% Photo-Journal. . 131,273 Francoeur 33.3%
Parisien 15.56% Broadcasting
Radio Control through CHEF-AM (Granby) 9,400 Les Journaux Trans-Canada Limitee Desmarais 46.6% Francoeur 33.3% Parisien 15.56%
CKSM-AM (Shawinigan, P.Q.) 16,300 Through Prades Inc. Desmarais 31.86% Television CHAU-TV (Carleton, P.Q.) 122,500 Through Prades Inc.
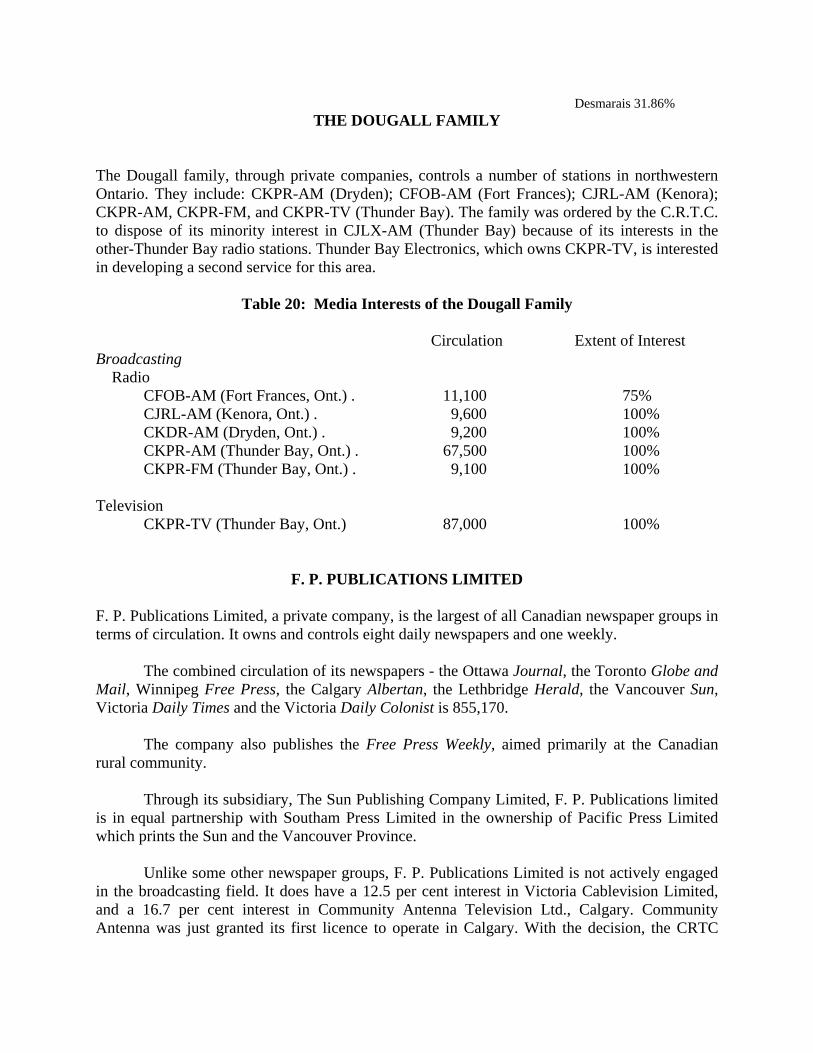
Desmarais 31.86% THE DOUGALL FAMILY
The Dougall family, through private companies, controls a number of stations in northwestern Ontario. They include: CKPR-AM (Dryden); CFOB-AM (Fort Frances); CJRL-AM (Kenora); CKPR-AM, CKPR-FM, and CKPR-TV (Thunder Bay). The family was ordered by the C.R.T.C. to dispose of its minority interest in CJLX-AM (Thunder Bay) because of its interests in the other-Thunder Bay radio stations. Thunder Bay Electronics, which owns CKPR-TV, is interested in developing a second service for this area.
Table 20: Media Interests of the Dougall Family Circulation Extent of Interest Broadcasting Radio
CFOB-AM (Fort Frances, Ont.) . 11,100 75% CJRL-AM (Kenora, Ont.) . 9,600 100% CKDR-AM (Dryden, Ont.) . 9,200 100% CKPR-AM (Thunder Bay, Ont.) . 67,500 100% CKPR-FM (Thunder Bay, Ont.) . 9,100 100%
Television
CKPR-TV (Thunder Bay, Ont.) 87,000 100%
F. P. PUBLICATIONS LIMITED
F. P. Publications Limited, a private company, is the largest of all Canadian newspaper groups in terms of circulation. It owns and controls eight daily newspapers and one weekly.
The combined circulation of its newspapers - the Ottawa Journal, the Toronto Globe and Mail, Winnipeg Free Press, the Calgary Albertan, the Lethbridge Herald, the Vancouver Sun, Victoria Daily Times and the Victoria Daily Colonist is 855,170.
The company also publishes the Free Press Weekly, aimed primarily at the Canadian rural community.
Through its subsidiary, The Sun Publishing Company Limited, F. P. Publications limited is in equal partnership with Southam Press Limited in the ownership of Pacific Press Limited which prints the Sun and the Vancouver Province.
Unlike some other newspaper groups, F. P. Publications Limited is not actively engaged in the broadcasting field. It does have a 12.5 per cent interest in Victoria Cablevision Limited, and a 16.7 per cent interest in Community Antenna Television Ltd., Calgary. Community Antenna was just granted its first licence to operate in Calgary. With the decision, the CRTC

requested that within three years, being the duration of the licence, F. P. dispose of its share in Community Antenna. History F. P. Publications was formed in 1959 as a result of a three-way deal by the principals which consisted of a purchase of shares of The Journal Publishing Company of Ottawa Limited; the acquisition by an exchange of shares of Free Press Weekly Ltd., with its subsidiary Winnipeg Free Press Company Limited from the Victor Sifton family; and the acquisition by an exchange of shares of The Albertan Publishing Company Limited, The Lethbridge Herald Company Ltd., and Victoria Press Limited from G. Maxwell Bell.
In 1961, F. P. Publications acquired an interest in the Sun Publishing Company Limited from the Cromie family, and two years later a further acquisition of shares made Sun Publishing a subsidiary of F. P. Publications.
In 1965 the company entered into a merger with The Globe and Mail Limited. The Free Press Weekly activities were expanded in 1965 when the company purchased the mailing list of Farmers Advocate, which ceased publication. In 1968 the Free Press Weekly agreed to service the mailing list of the Family Herald, which ceased publication.
The company's interest in Calgary Television Limited was discharged in 1967 through an exchange of shares with Selkirk Holdings Limited, of which Southam Press Limited is the largest single shareholder. The company's interest in Lethbridge Television Limited was discharged in a similar exchange with Selkirk in 1968.
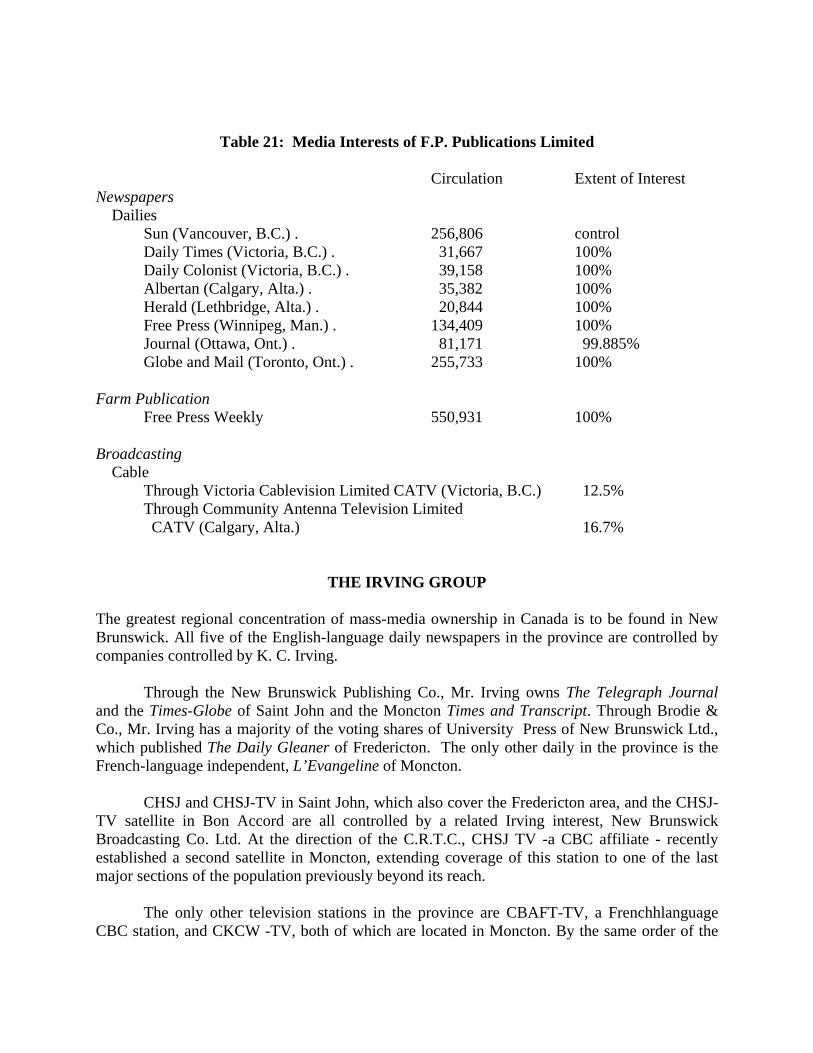
Table 21: Media Interests of F.P. Publications Limited Circulation Extent of Interest Newspapers Dailies
Sun (Vancouver, B.C.) . 256,806 control Daily Times (Victoria, B.C.) . 31,667 100% Daily Colonist (Victoria, B.C.) . 39,158 100% Albertan (Calgary, Alta.) . 35,382 100% Herald (Lethbridge, Alta.) . 20,844 100% Free Press (Winnipeg, Man.) . 134,409 100% Journal (Ottawa, Ont.) . 81,171 99.885% Globe and Mail (Toronto, Ont.) . 255,733 100%
Farm Publication
Free Press Weekly 550,931 100% Broadcasting Cable
Through Victoria Cablevision Limited CATV (Victoria, B.C.) 12.5% Through Community Antenna Television Limited CATV (Calgary, Alta.) 16.7%
THE IRVING GROUP
The greatest regional concentration of mass-media ownership in Canada is to be found in New Brunswick. All five of the English-language daily newspapers in the province are controlled by companies controlled by K. C. Irving.
Through the New Brunswick Publishing Co., Mr. Irving owns The Telegraph Journal and the Times-Globe of Saint John and the Moncton Times and Transcript. Through Brodie & Co., Mr. Irving has a majority of the voting shares of University Press of New Brunswick Ltd., which published The Daily Gleaner of Fredericton. The only other daily in the province is the French-language independent, L’Evangeline of Moncton.
CHSJ and CHSJ-TV in Saint John, which also cover the Fredericton area, and the CHSJ-TV satellite in Bon Accord are all controlled by a related Irving interest, New Brunswick Broadcasting Co. Ltd. At the direction of the C.R.T.C., CHSJ TV -a CBC affiliate - recently established a second satellite in Moncton, extending coverage of this station to one of the last major sections of the population previously beyond its reach.
The only other television stations in the province are CBAFT-TV, a Frenchhlanguage
CBC station, and CKCW -TV, both of which are located in Moncton. By the same order of the
C.R.T.C. extending the service of the Saint John station to Moncton, CKCW-TV was directed to establish a satellite station in Saint John and to switch its affiliation to the CTV Network. At the same time, the Commission stipulated that the three satellite stations of CKCW- TV were to continue to remain affiliated to the CBC. In all, eight of twenty media outlets in the surveyed communities are controlled by Irving interests - five newspapers, one radio station, and two television stations. In addition to the media outlets which it controls, the K. C. Irving Group has probably the most diverse non-media interests of any conglomerate organization in Canada. Because virtually all of these interests are in private companies, up-to-date information as to their extent is not available on the public record. The report of DBS on Inter-Corporate Ownership for 1965, the most recent compilation available of information fIled in compliance with the Corporations and Labour Unions Returns Act, provides some insight into the range and extent of the non-media Irving interests as of that year. The summary for Irving holdings is shown in Table 22. A further indication of the extent of Irving interests is provided from the list of provincial and extra-provincial companies in which Mr. Irving and/or members of his family serve as officers, directors - or both. Taken from returns filed as of August, 1969, with the Department of the Provincial Secretary of New Brunswick, they are as shown in the following table. By any standard, the interests of the Irving family are very large. They assume gigantic proportions, however, in a province that lags behind many other parts of the country in industrial development. These interests represent an important factor in terms of the income they generate in New Brunswick and in terms of the employment dependent upon them. Intra-Provincial Companies in which Irving Group Associated Atlantic Towing Ltd.; Atlantic Truck and Trailer Ltd.; Boston Brook Enterprises Limited; Brunswick Motors Limited; Canada Veneers Limited; Charlotte Pulp and Paper Co. Ltd.; City Transit Limited; Courtenay Apartments Limited; Engineering Consultants Limited; General Realty Company Limited; Ferro-Chemi-Crete Enngineering Limited; Grand Lake Timber Ltd.; Harbour Development Limited; HighlandHardwoodsLimited;Industrial Security Limited; J. D. Irving, Limited;K. C. Irving, Limited; Irving Oil Terminals Limited; Irving Oil Transport Limited;
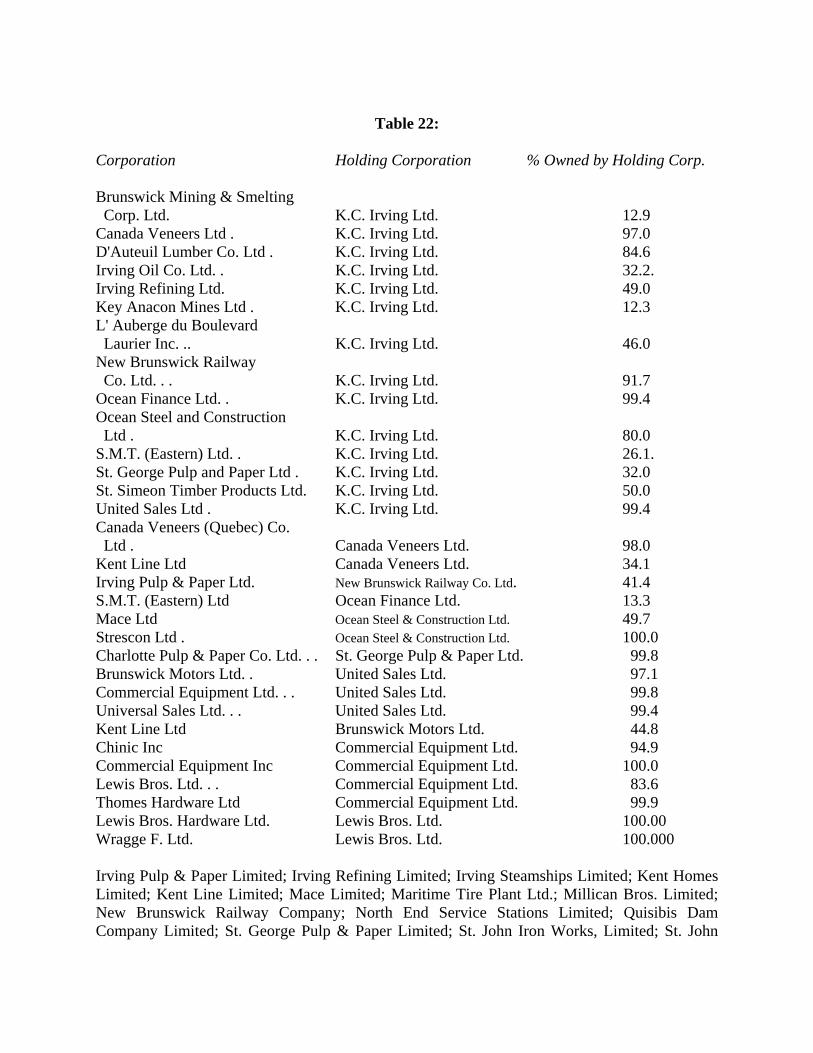
Table 22:
Corporation Holding Corporation % Owned by Holding Corp. Brunswick Mining & Smelting Corp. Ltd. K.C. Irving Ltd. 12.9 Canada Veneers Ltd . K.C. Irving Ltd. 97.0 D'Auteuil Lumber Co. Ltd . K.C. Irving Ltd. 84.6 Irving Oil Co. Ltd. . K.C. Irving Ltd. 32.2. Irving Refining Ltd. K.C. Irving Ltd. 49.0 Key Anacon Mines Ltd . K.C. Irving Ltd. 12.3 L' Auberge du Boulevard Laurier Inc. .. K.C. Irving Ltd. 46.0 New Brunswick Railway Co. Ltd. . . K.C. Irving Ltd. 91.7 Ocean Finance Ltd. . K.C. Irving Ltd. 99.4 Ocean Steel and Construction Ltd . K.C. Irving Ltd. 80.0 S.M.T. (Eastern) Ltd. . K.C. Irving Ltd. 26.1. St. George Pulp and Paper Ltd . K.C. Irving Ltd. 32.0 St. Simeon Timber Products Ltd. K.C. Irving Ltd. 50.0 United Sales Ltd . K.C. Irving Ltd. 99.4 Canada Veneers (Quebec) Co. Ltd . Canada Veneers Ltd. 98.0 Kent Line Ltd Canada Veneers Ltd. 34.1 Irving Pulp & Paper Ltd. New Brunswick Railway Co. Ltd. 41.4 S.M.T. (Eastern) Ltd Ocean Finance Ltd. 13.3 Mace Ltd Ocean Steel & Construction Ltd. 49.7 Strescon Ltd . Ocean Steel & Construction Ltd. 100.0 Charlotte Pulp & Paper Co. Ltd. . . St. George Pulp & Paper Ltd. 99.8 Brunswick Motors Ltd. . United Sales Ltd. 97.1 Commercial Equipment Ltd. . . United Sales Ltd. 99.8 Universal Sales Ltd. . . United Sales Ltd. 99.4 Kent Line Ltd Brunswick Motors Ltd. 44.8 Chinic Inc Commercial Equipment Ltd. 94.9 Commercial Equipment Inc Commercial Equipment Ltd. 100.0 Lewis Bros. Ltd. . . Commercial Equipment Ltd. 83.6 Thomes Hardware Ltd Commercial Equipment Ltd. 99.9 Lewis Bros. Hardware Ltd. Lewis Bros. Ltd. 100.00 Wragge F. Ltd. Lewis Bros. Ltd. 100.000 Irving Pulp & Paper Limited; Irving Refining Limited; Irving Steamships Limited; Kent Homes Limited; Kent Line Limited; Mace Limited; Maritime Tire Plant Ltd.; Millican Bros. Limited; New Brunswick Railway Company; North End Service Stations Limited; Quisibis Dam Company Limited; St. George Pulp & Paper Limited; St. John Iron Works, Limited; St. John

Motor Line Limited; St. John Pulp & Paper, Limited; St. John Sulphite Sales Limited; Strescon Limited; Sulphite Towing Limited; Terminal Realties Limited; Thorne's Industrial Division Limited; United Sales Limited; Universal Constructors & Engineers Limited; Universal Sales Limited; Irving Oil Company Limited - Dominion Charter. Extra-Provincial Companies in which Irving Group Associated
Commercial Equipment, Limited; Interprovincial Coach Lines Limited; Irving Oil Company Limited; Marque Construction Limited; Ocean Finance Limited; Ocean Steel & Construction Limited; Saint John Shipbuilding & Dry Dock Co., Ltd.
The C.R.T.C. has indicated its concern at the extent to which the communications media in New Brunswick are dominated by the Irving Group. In 1968 the C.R.T.C. extended to March 31, 1970 - the licence of CHSJ-TV in Saint John. In so doing the C.R.T.C. stated: "The Commission is developing a licensing policy which will take into account concentration of ownership in the media serving a community. The Commission will consider this license in the light of the new policy."
The license to operate CHSJ-TV was renewed in 1970 on the condition that no member of the Irving family would be allowed to hold shares in Moncton Broadcasting Co. Ltd., the company operating the second TV station in Saint John.
In addition, the Commission refused to renew the licence previously granted by the Department of Transport to Saint John Cablevision Ltd., a CATV company established to serve the city of the same name, in which the Irving group shared a fifty-fifty interest with Famous Players. "In its announcement of June 13, 1968, the Canadian Radio-Television Commission expressed its concern about excessive concentration of ownership in communications media," the Commission noted in connection with the application for renewal of the cable system's licence. "In view of this concern, the Commission will not approve this application in the public interest. "
In an announcement December 20, 1968, the C.R.T.C. laid down a policy under which CHSJ-TV in Saint John was to establish a relay station in Moncton, while remaining affiliated to the CBC, and CKCW-TV in Moncton was to establish a relay station in Saint John. CKCW-TV was directed to switch its primary station and the Saint John relay to the CTV network from the CBC, while continuing to carry the network programs of the latter on its satellite stations.
As part of its overall Maritime coverage plan, the C.R.T.C. noted that the approach it proposed would "maintain the possibility of a CBC-owned and operated station in Saint John-Fredericton area if and when such a station becomes possible and indispensable."
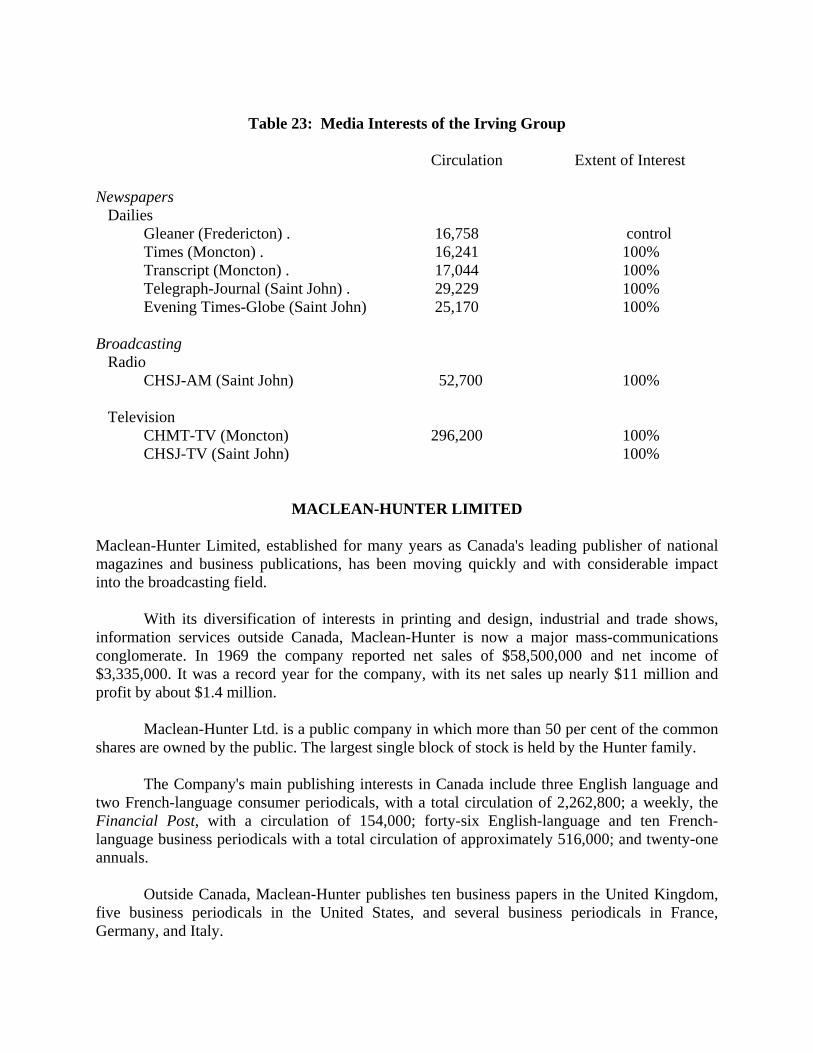
Table 23: Media Interests of the Irving Group
Circulation Extent of Interest
Newspapers Dailies
Gleaner (Fredericton) . 16,758 control Times (Moncton) . 16,241 100% Transcript (Moncton) . 17,044 100% Telegraph-Journal (Saint John) . 29,229 100% Evening Times-Globe (Saint John) 25,170 100%
Broadcasting Radio
CHSJ-AM (Saint John) 52,700 100% Television
CHMT-TV (Moncton) 296,200 100% CHSJ-TV (Saint John) 100%
MACLEAN-HUNTER LIMITED Maclean-Hunter Limited, established for many years as Canada's leading publisher of national magazines and business publications, has been moving quickly and with considerable impact into the broadcasting field.
With its diversification of interests in printing and design, industrial and trade shows, information services outside Canada, Maclean-Hunter is now a major mass-communications conglomerate. In 1969 the company reported net sales of $58,500,000 and net income of $3,335,000. It was a record year for the company, with its net sales up nearly $11 million and profit by about $1.4 million.
Maclean-Hunter Ltd. is a public company in which more than 50 per cent of the common shares are owned by the public. The largest single block of stock is held by the Hunter family.
The Company's main publishing interests in Canada include three English language and two French-language consumer periodicals, with a total circulation of 2,262,800; a weekly, the Financial Post, with a circulation of 154,000; forty-six English-language and ten French-language business periodicals with a total circulation of approximately 516,000; and twenty-one annuals.
Outside Canada, Maclean-Hunter publishes ten business papers in the United Kingdom, five business periodicals in the United States, and several business periodicals in France, Germany, and Italy.
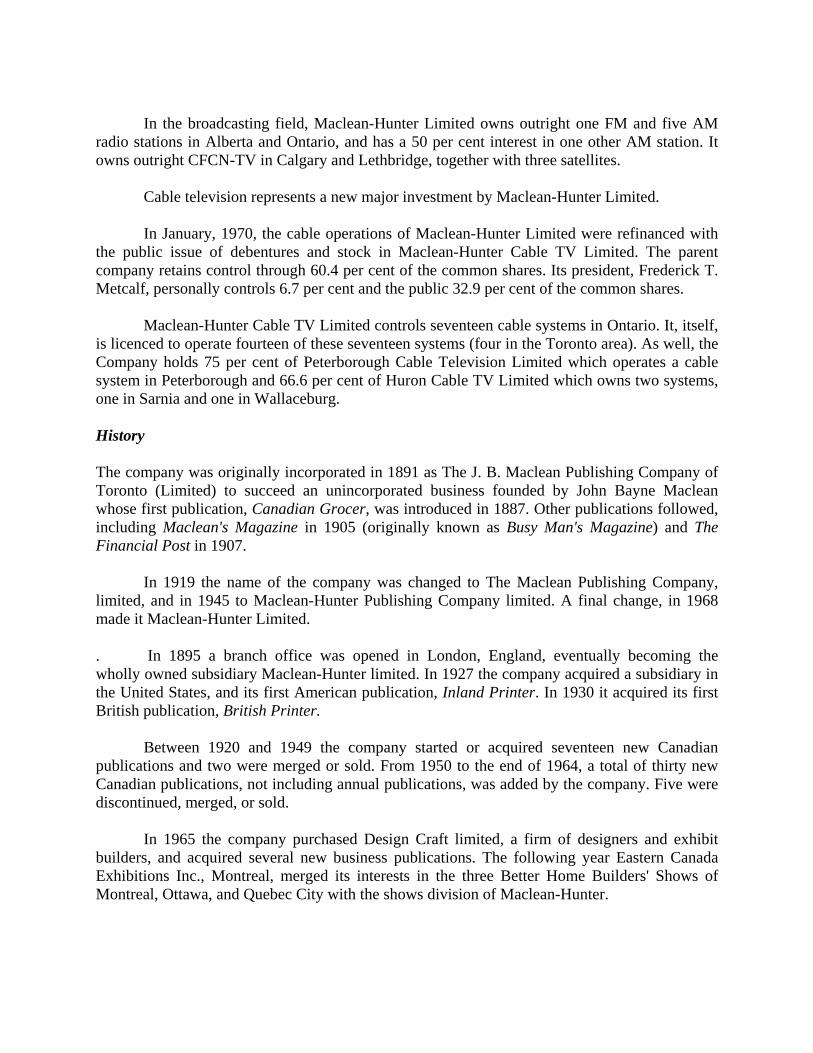
In the broadcasting field, Maclean-Hunter Limited owns outright one FM and five AM
radio stations in Alberta and Ontario, and has a 50 per cent interest in one other AM station. It owns outright CFCN-TV in Calgary and Lethbridge, together with three satellites.
Cable television represents a new major investment by Maclean-Hunter Limited. In January, 1970, the cable operations of Maclean-Hunter Limited were refinanced with
the public issue of debentures and stock in Maclean-Hunter Cable TV Limited. The parent company retains control through 60.4 per cent of the common shares. Its president, Frederick T. Metcalf, personally controls 6.7 per cent and the public 32.9 per cent of the common shares.
Maclean-Hunter Cable TV Limited controls seventeen cable systems in Ontario. It, itself, is licenced to operate fourteen of these seventeen systems (four in the Toronto area). As well, the Company holds 75 per cent of Peterborough Cable Television Limited which operates a cable system in Peterborough and 66.6 per cent of Huron Cable TV Limited which owns two systems, one in Sarnia and one in Wallaceburg. History The company was originally incorporated in 1891 as The J. B. Maclean Publishing Company of Toronto (Limited) to succeed an unincorporated business founded by John Bayne Maclean whose first publication, Canadian Grocer, was introduced in 1887. Other publications followed, including Maclean's Magazine in 1905 (originally known as Busy Man's Magazine) and The Financial Post in 1907.
In 1919 the name of the company was changed to The Maclean Publishing Company, limited, and in 1945 to Maclean-Hunter Publishing Company limited. A final change, in 1968 made it Maclean-Hunter Limited. . In 1895 a branch office was opened in London, England, eventually becoming the wholly owned subsidiary Maclean-Hunter limited. In 1927 the company acquired a subsidiary in the United States, and its first American publication, Inland Printer. In 1930 it acquired its first British publication, British Printer.
Between 1920 and 1949 the company started or acquired seventeen new Canadian publications and two were merged or sold. From 1950 to the end of 1964, a total of thirty new Canadian publications, not including annual publications, was added by the company. Five were discontinued, merged, or sold.
In 1965 the company purchased Design Craft limited, a firm of designers and exhibit builders, and acquired several new business publications. The following year Eastern Canada Exhibitions Inc., Montreal, merged its interests in the three Better Home Builders' Shows of Montreal, Ottawa, and Quebec City with the shows division of Maclean-Hunter.

In 1967 the company acquired two French·language publications and a translation service. That same year Trans Canada Expositions Limited was formed in equal partnership with Southam Business Publications Ltd. The company also acquired the remaining minority interest in two more English-language publications and later introduced a new national magazine, Hostess, with English· and French· language editions. Later acquisitions included a travel industry newspaper and directory.
Maclean-Hunter limited moved into the broadcasting field in a major way in 1966 when it acquired all the outstanding shares of Shoreacres Broadcasting Co. Ltd., operators of Radio Station CKEY Toronto, as well as a controlling interest in the Voice of the Prairies limited and CFCN Television Ltd., of Calgary. In order to comply with a Board of Broadcast Governors requirement that no person might have an interest in more than one station on the CTV television network, Maclean-Hunter sold a minority interest in CJCH-TV Halifax.
In April, 1967, Maclean-Hunter expanded into cable television by entering a three-way partnership in Huron Cable TV Limited serving Sarnia, Ontario. Later in the year the company acquired cable television systems in seven other Ontario communities from Metronics Corporation Ltd. Terms of the agreement included an additional one-third interest in Huron Cable TV.
In April, 1968 the company, which held a 50 per cent equity in Greatlakes Broadcasting System Limited, acquired the remaining interests. Greatlakes Broadcasting operates radio station CFCO Chatham and CHYM-AM and FM in Kitchener/Waterloo.
In the same year the company acquired the remaining equity in CFCN Television limited and The Voice of The Prairies Ltd. (radio station CFCN). Six additional cable television systems were acquired in Ontario in 1969, by the company's subsidiary, Maclean-Hunter Cable TV limited.
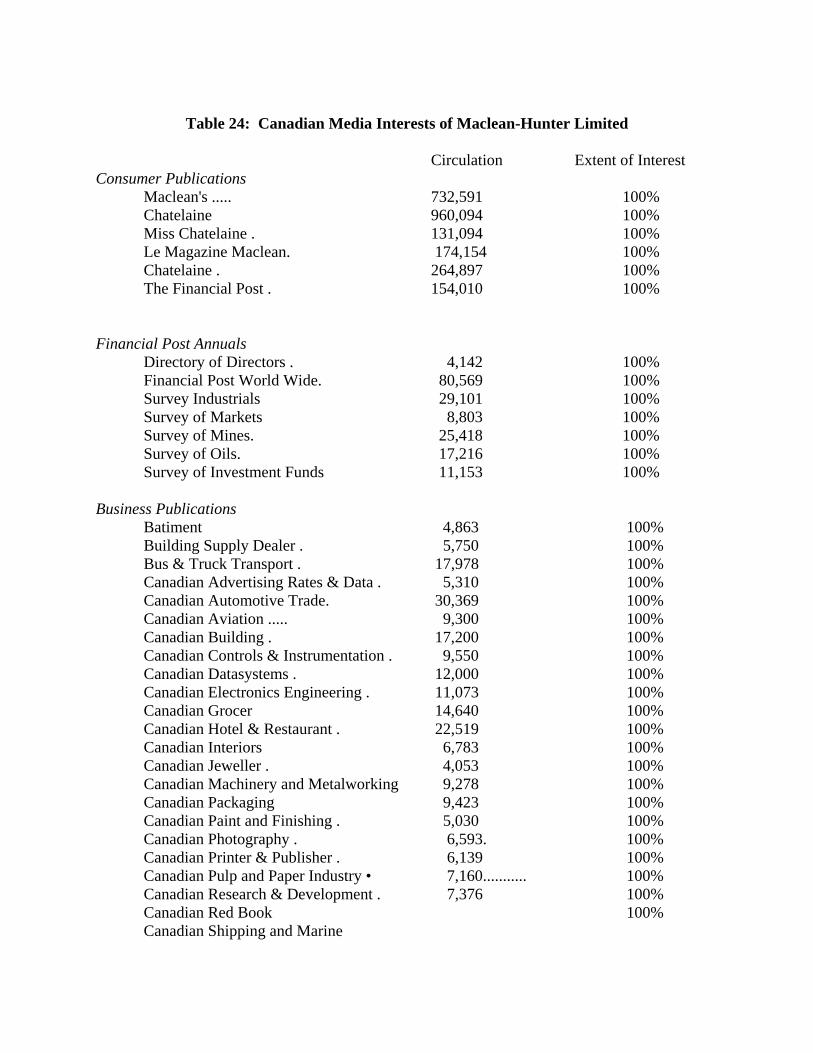
Table 24: Canadian Media Interests of Maclean-Hunter Limited
Circulation Extent of Interest
Consumer Publications Maclean's ..... 732,591 100% Chatelaine 960,094 100% Miss Chatelaine . 131,094 100% Le Magazine Maclean. 174,154 100% Chatelaine . 264,897 100% The Financial Post . 154,010 100%
Financial Post Annuals
Directory of Directors . 4,142 100% Financial Post World Wide. 80,569 100% Survey Industrials 29,101 100% Survey of Markets 8,803 100% Survey of Mines. 25,418 100% Survey of Oils. 17,216 100% Survey of Investment Funds 11,153 100%
Business Publications Batiment 4,863 100% Building Supply Dealer . 5,750 100% Bus & Truck Transport . 17,978 100% Canadian Advertising Rates & Data . 5,310 100% Canadian Automotive Trade. 30,369 100% Canadian Aviation ..... 9,300 100% Canadian Building . 17,200 100% Canadian Controls & Instrumentation . 9,550 100% Canadian Datasystems . 12,000 100% Canadian Electronics Engineering . 11,073 100% Canadian Grocer 14,640 100% Canadian Hotel & Restaurant . 22,519 100% Canadian Interiors 6,783 100% Canadian Jeweller . 4,053 100% Canadian Machinery and Metalworking 9,278 100% Canadian Packaging 9,423 100% Canadian Paint and Finishing . 5,030 100% Canadian Photography . 6,593. 100% Canadian Printer & Publisher . 6,139 100% Canadian Pulp and Paper Industry • 7,160........... 100% Canadian Research & Development . 7,376 100% Canadian Red Book 100% Canadian Shipping and Marine
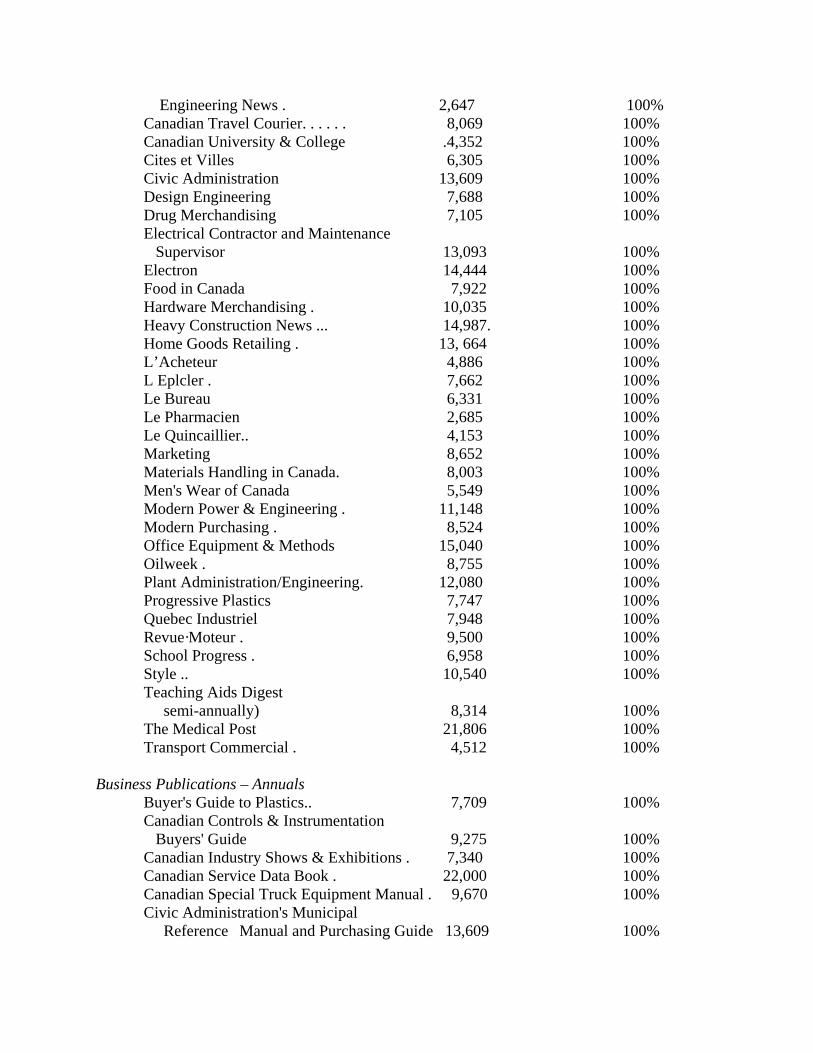
Engineering News . 2,647 100% Canadian Travel Courier. . . . . . 8,069 100% Canadian University & College .4,352 100% Cites et Villes 6,305 100% Civic Administration 13,609 100% Design Engineering 7,688 100% Drug Merchandising 7,105 100% Electrical Contractor and Maintenance Supervisor 13,093 100% Electron 14,444 100% Food in Canada 7,922 100% Hardware Merchandising . 10,035 100% Heavy Construction News ... 14,987. 100% Home Goods Retailing . 13, 664 100% L’Acheteur 4,886 100% L Eplcler . 7,662 100% Le Bureau 6,331 100% Le Pharmacien 2,685 100% Le Quincaillier.. 4,153 100% Marketing 8,652 100% Materials Handling in Canada. 8,003 100% Men's Wear of Canada 5,549 100% Modern Power & Engineering . 11,148 100% Modern Purchasing . 8,524 100% Office Equipment & Methods 15,040 100% Oilweek . 8,755 100% Plant Administration/Engineering. 12,080 100% Progressive Plastics 7,747 100% Quebec Industriel 7,948 100% Revue·Moteur . 9,500 100% School Progress . 6,958 100% Style .. 10,540 100% Teaching Aids Digest semi-annually) 8,314 100% The Medical Post 21,806 100% Transport Commercial . 4,512 100%
Business Publications – Annuals
Buyer's Guide to Plastics.. 7,709 100% Canadian Controls & Instrumentation
Buyers' Guide 9,275 100% Canadian Industry Shows & Exhibitions . 7,340 100% Canadian Service Data Book . 22,000 100% Canadian Special Truck Equipment Manual . 9,670 100% Civic Administration's Municipal Reference Manual and Purchasing Guide 13,609 100%
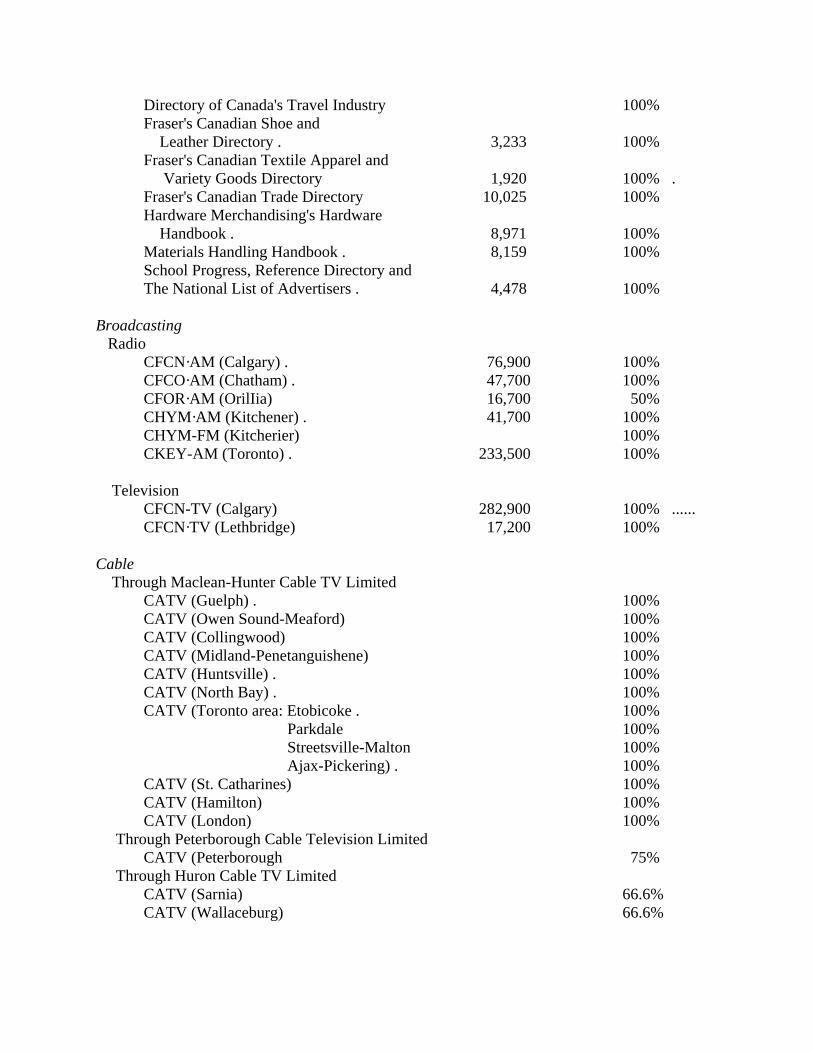
Directory of Canada's Travel Industry 100% Fraser's Canadian Shoe and
Leather Directory . 3,233 100% Fraser's Canadian Textile Apparel and Variety Goods Directory 1,920 100% . Fraser's Canadian Trade Directory 10,025 100% Hardware Merchandising's Hardware Handbook . 8,971 100% Materials Handling Handbook . 8,159 100% School Progress, Reference Directory and The National List of Advertisers . 4,478 100%
Broadcasting Radio
CFCN·AM (Calgary) . 76,900 100% CFCO·AM (Chatham) . 47,700 100% CFOR·AM (OrilIia) 16,700 50% CHYM·AM (Kitchener) . 41,700 100% CHYM-FM (Kitcherier) 100% CKEY-AM (Toronto) . 233,500 100%
Television CFCN-TV (Calgary) 282,900 100% ......
CFCN·TV (Lethbridge) 17,200 100% Cable Through Maclean-Hunter Cable TV Limited
CATV (Guelph) . 100% CATV (Owen Sound-Meaford) 100% CATV (Collingwood) 100% CATV (Midland-Penetanguishene) 100% CATV (Huntsville) . 100% CATV (North Bay) . 100% CATV (Toronto area: Etobicoke . 100%
Parkdale 100% Streetsville-Malton 100% Ajax-Pickering) . 100%
CATV (St. Catharines) 100% CATV (Hamilton) 100% CATV (London) 100%
Through Peterborough Cable Television Limited CATV (Peterborough 75%
Through Huron Cable TV Limited CATV (Sarnia) 66.6% CATV (Wallaceburg) 66.6%
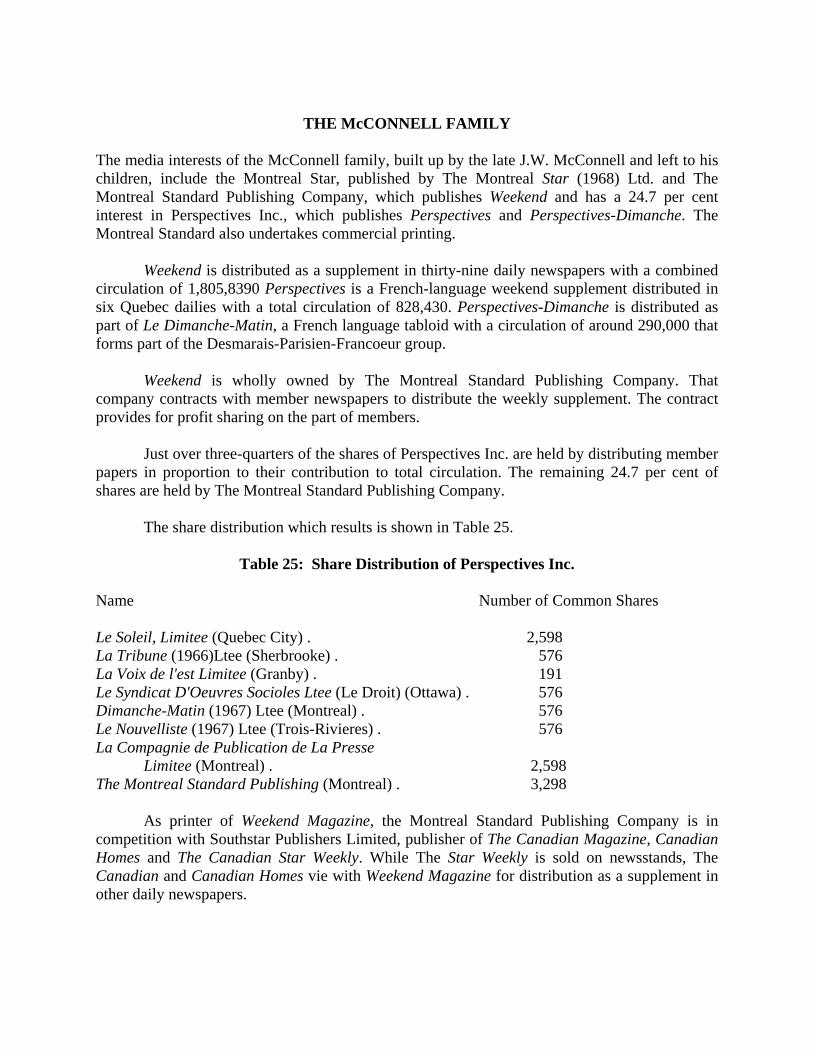
THE McCONNELL FAMILY
The media interests of the McConnell family, built up by the late J.W. McConnell and left to his children, include the Montreal Star, published by The Montreal Star (1968) Ltd. and The Montreal Standard Publishing Company, which publishes Weekend and has a 24.7 per cent interest in Perspectives Inc., which publishes Perspectives and Perspectives-Dimanche. The Montreal Standard also undertakes commercial printing.
Weekend is distributed as a supplement in thirty-nine daily newspapers with a combined circulation of 1,805,8390 Perspectives is a French-language weekend supplement distributed in six Quebec dailies with a total circulation of 828,430. Perspectives-Dimanche is distributed as part of Le Dimanche-Matin, a French language tabloid with a circulation of around 290,000 that forms part of the Desmarais-Parisien-Francoeur group.
Weekend is wholly owned by The Montreal Standard Publishing Company. That company contracts with member newspapers to distribute the weekly supplement. The contract provides for profit sharing on the part of members.
Just over three-quarters of the shares of Perspectives Inc. are held by distributing member papers in proportion to their contribution to total circulation. The remaining 24.7 per cent of shares are held by The Montreal Standard Publishing Company.
The share distribution which results is shown in Table 25.
Table 25: Share Distribution of Perspectives Inc. Name Number of Common Shares Le Soleil, Limitee (Quebec City) . 2,598 La Tribune (1966)Ltee (Sherbrooke) . 576 La Voix de l'est Limitee (Granby) . 191 Le Syndicat D'Oeuvres Socioles Ltee (Le Droit) (Ottawa) . 576 Dimanche-Matin (1967) Ltee (Montreal) . 576 Le Nouvelliste (1967) Ltee (Trois-Rivieres) . 576 La Compagnie de Publication de La Presse
Limitee (Montreal) . 2,598 The Montreal Standard Publishing (Montreal) . 3,298
As printer of Weekend Magazine, the Montreal Standard Publishing Company is in competition with Southstar Publishers Limited, publisher of The Canadian Magazine, Canadian Homes and The Canadian Star Weekly. While The Star Weekly is sold on newsstands, The Canadian and Canadian Homes vie with Weekend Magazine for distribution as a supplement in other daily newspapers.

Late in 1969, it was announced by Southstar Publishers Limited, which is jointly owned by The Toronto Star and Southam Press, that The Canadian and Canadian Homes would be printed by the Montreal Standard Publishing Company.
It was also announced that Southstar and The Montreal Standard have joined forces to establish Magna Media Limited to act as the advertising sales agency for The Canadian, Canadian Homes, Weekend, Perspectives, and Perspectives-Dimanche.
At the apex of the McConnell family holdings are 88 per cent of the shares of the Commercial Trust Company Limited held by the Montreal Trust Company as part of a voting trust agreement under which the shares are voted at the direction of J .G. McConnell and Mrs. P.M. Laing during their lifetimes.
The Commercial Trust Company in turn, holds virtually all the shares in The Montreal Star (1968) Ltd. as a trustee for Starlaw Investments Ltd., the beneficial owner. Commercial Trust also holds all of the shares of The Montreal Standard Publishing Co. Ltd. and of Canada Wide Feature Service Ltd. and Infocor Limited, as a trustee for Starlaw, which again is the beneficial owner.
Starlaw Investments Ltd. is owned by SLSR Holdings Limited (previously St. Lawrence Sugar Refineries Limited) and Montreal Star Holdings Limited (previously The Montreal Star Company Limited), which it should be noted is a different corporate entity from that which publishes the daily newspaper.
The circle is completed with ownership in trust by the Commercial Trust Company of virtually all of the outstanding shares of the companies that control Starlaw Investments - SLSR Holdings Limited and Montreal Star Holdings Limited. The Commercial Trust Company is the registered owner of the shares of these two companies as the sole trustee on behalf of the descendents of the late Mr. McConnell.
Currently Starlaw Investments have before the C.R.T.C. an application to purchase Cable TV Limited from Famous Players, but approval has not yet been given.
Table 26: Media Interests of the McConnell Family
Circulation Extent of Interest Dailies
Star (Montreal, P.Q.) 195,696 control Weekend Magazines
Weekend Magazine 1,805,839 control Perspectives 828,430 24.7%
Perspectives-Dimanche 290,000 24.7%
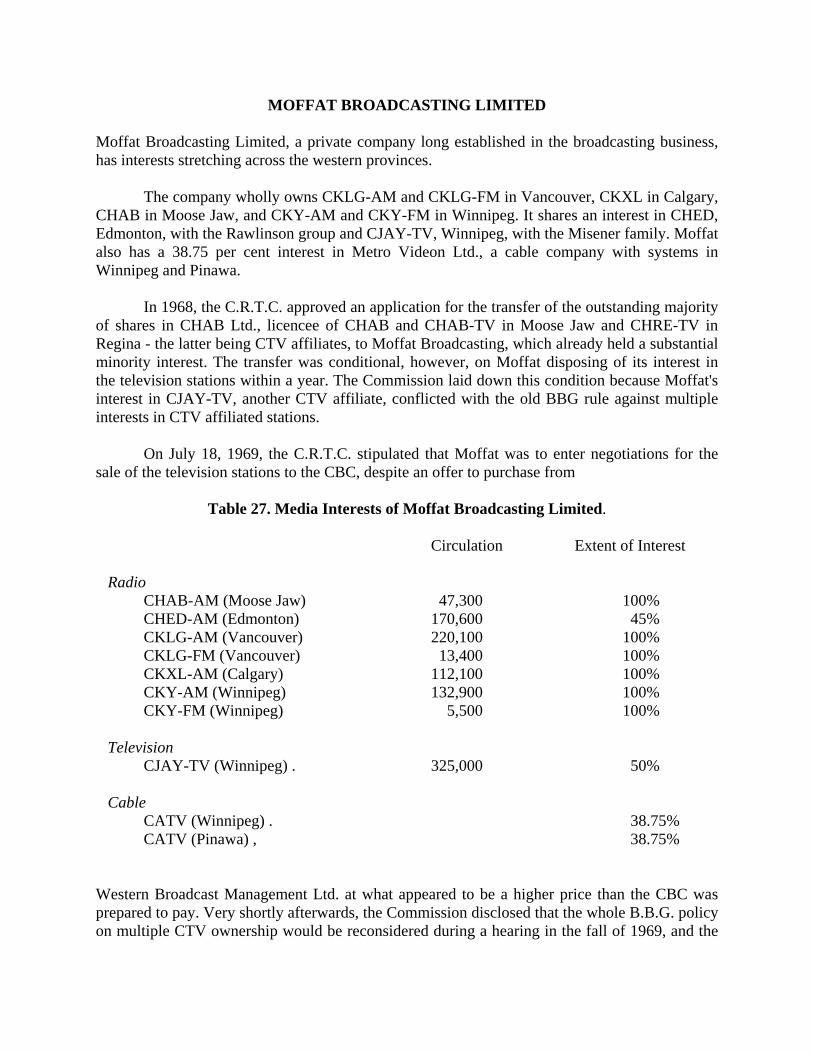
MOFFAT BROADCASTING LIMITED Moffat Broadcasting Limited, a private company long established in the broadcasting business, has interests stretching across the western provinces.
The company wholly owns CKLG-AM and CKLG-FM in Vancouver, CKXL in Calgary, CHAB in Moose Jaw, and CKY-AM and CKY-FM in Winnipeg. It shares an interest in CHED, Edmonton, with the Rawlinson group and CJAY-TV, Winnipeg, with the Misener family. Moffat also has a 38.75 per cent interest in Metro Videon Ltd., a cable company with systems in Winnipeg and Pinawa.
In 1968, the C.R.T.C. approved an application for the transfer of the outstanding majority of shares in CHAB Ltd., licencee of CHAB and CHAB-TV in Moose Jaw and CHRE-TV in Regina - the latter being CTV affiliates, to Moffat Broadcasting, which already held a substantial minority interest. The transfer was conditional, however, on Moffat disposing of its interest in the television stations within a year. The Commission laid down this condition because Moffat's interest in CJAY-TV, another CTV affiliate, conflicted with the old BBG rule against multiple interests in CTV affiliated stations.
On July 18, 1969, the C.R.T.C. stipulated that Moffat was to enter negotiations for the sale of the television stations to the CBC, despite an offer to purchase from
Table 27. Media Interests of Moffat Broadcasting Limited.
Circulation Extent of Interest Radio CHAB-AM (Moose Jaw) 47,300 100% CHED-AM (Edmonton) 170,600 45% CKLG-AM (Vancouver) 220,100 100% CKLG-FM (Vancouver) 13,400 100% CKXL-AM (Calgary) 112,100 100% CKY-AM (Winnipeg) 132,900 100% CKY-FM (Winnipeg) 5,500 100% Television
CJAY-TV (Winnipeg) . 325,000 50% Cable
CATV (Winnipeg) . 38.75% CATV (Pinawa) , 38.75%
Western Broadcast Management Ltd. at what appeared to be a higher price than the CBC was prepared to pay. Very shortly afterwards, the Commission disclosed that the whole B.B.G. policy on multiple CTV ownership would be reconsidered during a hearing in the fall of 1969, and the
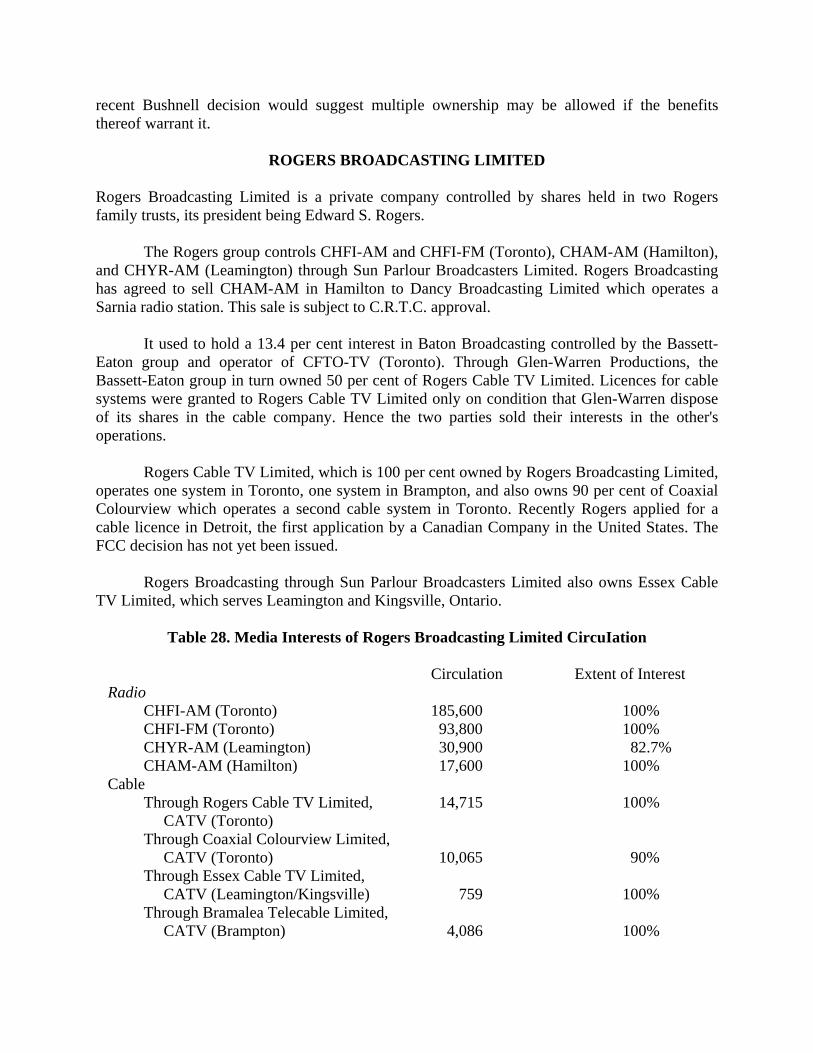
recent Bushnell decision would suggest multiple ownership may be allowed if the benefits thereof warrant it.
ROGERS BROADCASTING LIMITED Rogers Broadcasting Limited is a private company controlled by shares held in two Rogers family trusts, its president being Edward S. Rogers.
The Rogers group controls CHFI-AM and CHFI-FM (Toronto), CHAM-AM (Hamilton), and CHYR-AM (Leamington) through Sun Parlour Broadcasters Limited. Rogers Broadcasting has agreed to sell CHAM-AM in Hamilton to Dancy Broadcasting Limited which operates a Sarnia radio station. This sale is subject to C.R.T.C. approval.
It used to hold a 13.4 per cent interest in Baton Broadcasting controlled by the Bassett-Eaton group and operator of CFTO-TV (Toronto). Through Glen-Warren Productions, the Bassett-Eaton group in turn owned 50 per cent of Rogers Cable TV Limited. Licences for cable systems were granted to Rogers Cable TV Limited only on condition that Glen-Warren dispose of its shares in the cable company. Hence the two parties sold their interests in the other's operations.
Rogers Cable TV Limited, which is 100 per cent owned by Rogers Broadcasting Limited, operates one system in Toronto, one system in Brampton, and also owns 90 per cent of Coaxial Colourview which operates a second cable system in Toronto. Recently Rogers applied for a cable licence in Detroit, the first application by a Canadian Company in the United States. The FCC decision has not yet been issued.
Rogers Broadcasting through Sun Parlour Broadcasters Limited also owns Essex Cable TV Limited, which serves Leamington and Kingsville, Ontario.
Table 28. Media Interests of Rogers Broadcasting Limited CircuIation
Circulation Extent of Interest Radio
CHFI-AM (Toronto) 185,600 100% CHFI-FM (Toronto) 93,800 100% CHYR-AM (Leamington) 30,900 82.7% CHAM-AM (Hamilton) 17,600 100%
Cable Through Rogers Cable TV Limited, 14,715 100% CATV (Toronto) Through Coaxial Colourview Limited,
CATV (Toronto) 10,065 90% Through Essex Cable TV Limited, CATV (Leamington/Kingsville) 759 100% Through Bramalea Telecable Limited,
CATV (Brampton) 4,086 100%

THE PRATTE, BARIBAU AND LEPAGE GROUP The Pratte, Baribeau and Lepage families have extensive and often intricately interlocked broadcasting interests in Quebec. The nature and extent of these interests are indicated in the chart that follows.

THE SIFTON GROUP
The Sifton group has deversified interests in the news media in Saskatchewan and Ontario, being actively engaged in newspaper, magazine, television, and radio projects. The group functions through Armadale Company Limited, which was incorporated as a private company in Ontario on December 19, 1961.
Through its media holding company, Armadale Enterprises Limited (formerly Phoenix Management Limited), the group owns the Regina Leader-Post and the Saskatoon Star-Phoenix in Saskatchewan, and Toronto Life magazine.
The holding company, through Armadale Communications Limited (formerly Transcanada Communications Limited), in which it has a 98 per cent interest, controls radio stations CKOC (Hamilton), CKRC (Winnipeg), and CKCK (Regina), as well as CKCK-TV (Regina), together with three re-broadcasting stations serving Saskatchewan areas and has a 25 per cent interest in CFJR (Brockville).
Outside its media interests Armadale owns Jonquil Limited, a real estate firm, has a 50 per cent interest in Toronto Airways Limited, as well as an II per cent interest in Quality Records Limited. History
The Sifton group represents one branch of a well-known publishing family. The major participants in Armadale Co. Limited are Clifford Sifton and his son Michael. Clifford Sifton is the son of the late Sir Clifford Sifton, former owner of the Winnipeg Free Press, who first acquired that paper in the late 1890s.
In 1928, the Siftons acquired the Regina Leader-Post, the Saskatoon Star-Phoenix, the Saskatchewan Farmer, and radio station CKCK (Regina). In 1940, they purchased station CKRC (Winnipeg), CKRM (Regina) and a one-third interest in All Canada Radio. In 1941, the Siftons purchased a 50 per cent interest in CKOC (Hamilton). In 1947, they acquired an interest in Quality Records.
The family sold Station CKRM in 1950. In 1953/54, Clifford Sifton and his late brother Victor divided their interests - with Victor retaining the Winnipeg Free Press, and Clifford holding the other properties.
At this time Wentworth Broadcasting, a Sifton Company, acquired a one-third interest in CHCH-TV (Hamilton). The following year Clifford Sifton acquired a licence to operate CKCK-TV (Regina).
In 1957, Wentworth Broadcasting reduced its interest in CHCH-TV to 25 per cent. The following year, the Saskatchewan Farmer ceased publication.

CKCK-TV satellites were established at Willowbunch and Colgate, Saskatchewan in 1962. A third satellite, CKMJ-TV (Moose Jaw) was established in 1964.
In 1963, Armadale Co. Limited acquired a one-third interest in Toronto Airways Limited.
In 1965, Armadale sold its interest in All Canada and in 1967, it acquired Toronto Life magazine.
In 1968, Armadale's interest in Toronto Airways was increased to 50 per cent and at the same time the company acquired its interest in CFJR (Brockville).
In July 1969, the Siftons severed their interests in CHCH-TV (Niagara Television Limited) and acquired the other 50 per cent of radio station CKOC (Hamilton) from Southam Press and Selkirk Holdings.
In 1970, reorganization brought the broadcasting holdings under Armadale Communications Limited (formerly Transcanada Communications Limited), and the Saskatoon Star-Phoenix and Toronto Life under Armadale Publishers Limited. At the same time, the group's media holding company changed its name from Phoenix Management Limited to Armadale Enterprises Limited.
Table 29: Media Interests of the Sifton Group
Circulation Extent of Interest
Newspapers Leader-Post (Regina) 65,197 100% Star-Phoenix (Saskatoon) . 50,588 100%
Broadcasting Radio
CFJR-AM (Brockville) 20,300 25% CKCK-AM (Regina) 165,200 98% CKOC-AM (Hamilton) 139,000 98% CKRC-AM (Winnipeg) 188,500 98%
Television
CKCK-TV (Regina, Sask.) 191,000 98% CKMJ-TV (Moose Jaw, Sask.) 98%
Magazines
Toronto Life 32,000 100%

THE SOUTHAM-SELKIRK GROUP
Southam Press Limited, the oldest of the media companies with a history dating back to 1877, has the largest and most diversified interests in Canadian mass media and related fields of all media groups in Canada.
The combined circulation of the eleven daily newspapers that it controls amounts to 849,364 and represents 18.0 per cent of the total Canadian circulation, making it a close second behind F.P. Publications. In addition, Southam has a 49 per cent interest in the Brandon Sun, a 48 per cent interest in the Kitchener-Waterloo Record and a 25 per cent interest in the London Free Press. It shares a 50 per cent interest in Pacific Press Limited, which publishes the F.P.-owned Vancouver Sun and the Vancouver Province, part of the Southam group.
The Toronto Star and Southam each own a 50 per cent interest in Southstar Publishers Limited, which publishes The Canadian Magazine and Canadian Homes for distribution as a supplement in thirteen daily newspapers, and The Canadian Star Weekly for newsstand distribution. Recently this group liaison was further extended by an agreement to have the Southstar publications printed by the Montreal Standard Publishing Company Limited, owned by the McConnell family interests, and publisher of the competing newspaper supplement, Weekend. Southstar and the Montreal Standard have also joined forces to form Magna Media Limited to handle advertising sales, marketing and research for the publications of both companies.
Southam has extensive broadcasting interests directly and as the largest single shareholder in Selkirk Holdings Limited (30 per cent of voting and just over 30 per cent of non-voting stock) it has a further indirect interest in a number of radio and television stations, cable television systems, television programming, and commercial production and in advertising sales representation for several broadcasting companies.
Southam has mixed-media interests either directly or through Selkirk Holdings in Ottawa, London, Hamilton, Winnipeg (cable), Edmonton, Calgary, and Vancouver.
In addition to its daily newspapers, Southam wholly owns a national weekly newspaper dealing with economic and financial matters, The Financial Times of Canada, and the News and Chronicle, a weekly in Pointe Claire, Quebec, with a circulation of approximately 17,500. Through another wholly-owned subsidiary, Southam Business Publications Limited, the company produces thirty-four trade magazines and fifteen industrial annuals. It has a 50 per cent interest in C.O. Nickle Publishing Company, which publishes magazines relating to the petroleum field, and a 7.9 per cent interest in Homemakers' Digest.
Through its Southam-Murray Division, the company maintains a very large printing operation, while another subsidiary produces continuous business forms. Through a variety of companies, including Trans-Canada Expositions Limited, in which it and Maclean-Hunter each own 50 per cent, Southam has extensive interests in a wide variety of trade shows. Whitehold Investments Limited of Montreal is another wholly-owned interest of Southam Press, which also

has a 10.7 per cent interest in Quality Records Limited. It has an 84 per cent share of Panex Inc., a designer and producer of exhibits and displays.
Southam Press Limited is a public corporation. Its outstanding three million common shares are listed on the Montreal, Toronto, and Vancouver stock exchanges and are estimated to be held by some 2,500 individuals and corporations. While it is estimated that no single interest holds more than 3.6 per cent, control over the company is exercised by a large number of persons related to the Southam family by birth and marriage.
With a gross operating revenue in 1969 of $104.7 million and a net profit of $8.07 million, Southam stands out as the giant in the field of communications and related areas in Canada. With gross operating revenue in the same year of $105 million and net profit of $11.9 million, Thomson Newspapers Limited, represented an even larger media operation than that of Southam. But the Thomson figures include the operating results of the company's extensive media holdings in the United States. If these were excluded the remaining totals would be substantially less than those for Southam. 1Southam's after-tax profit in 1969 represents 7.7 per cent of gross revenue, 7.6 per cent of operating revenue, 15.3 per cent of total assets, 31.4 per cent of fixed assets. Southam's Broadcasting Interests
Southam's extensive and long-standing interests in broadcasting properties fall into three categories: those in which it has a direct interest not shared by Selkirk Holdings; those in which it shares a direct interest with Selkirk; those in which its interest is only indirect as the largest single shareholder of Selkirk, a broadcasting holding company established in 1959 that had as its base the former holdings of Taylor, Pearson and Carson (Canada). Direct Southam Broadcasting Interests Not Shared With Selkirk
Southam has a 25 per cent interest in CFPL-AM, CFPL-FM, and CFPL-TV in London, Ontario, owned by CFPL Broadcasting Limited. This interest evolves through its ownership of 25 per cent of London Free Press Holdings Limited which owns virtually all of the outstanding common shares of CFPL Broadcasting Limited. Southam also owns directly approximately 25 per cent of the outstanding preferred shares of the company. Control of the broadcasting property, as with the daily newspaper, rests with the Blackburn family.
Southam also has a 38.1 per cent interest in CKOY Limited, licencee of CKOY -AM and CKBY -FM (Ottawa). CKOY Limited in turn has a 4.9 per cent interest in Ottawa Cablevision Limited, which has a CATV system in Ottawa and one in Hazeldean. Southam has a further indirect interest through a Selkirk subsidiary, Castleton Investment, which holds a 34.3 per cent interest in Ottawa Cablevision. Pembroke Cablevision Limited is wholly-owned by Ottawa Cablevision.

Direct Southam Broadcasting Interests Shared With Selkirk
Southam has a 40 per cent voting interest in Edmonton Broadcasting Company Limited, operator of CJCA-AM and CJCA-FM, and in Calgary Broadcasting Limited, operator of CFAC-AM. In each case, Selkirk holds the remaining 60 per cent interest.
Southam also holds 25 per cent directly of Greater Winnipeg Cablevision Limited, in which Selkirk has a similar share. Indirect Southam Broadcasting Interests Through Selkirk
Selkirk received gross revenues in 1968 of $7,037,347, on which it earned $591,754 after taxes. This represented 8.05 per cent of gross revenue, 39.9 per cent of the depreciated value of its fixed assets, which totalled $1,300,567.
In addition to the Selkirk interests already mentioned above, Selkirk wholly owns the following broadcasting properties: Niagara Television Limited which operates CHCH-TV (Hamilton) and broadcasts into Toronto; Calgary Television Limited, operator of CHCT-TV (Calgary) and satellites in Drumheller and Banff; Lethbridge Television Limited, operator of CJLH-TV (Lethbridge), a partial satellite of the Calgary station, with relays of its own in Coleman and Burmis, Alberta; Lethbridge Broadcasting, operator of CJOC; Island Broadcasting Company, operator of CJVI (Victoria); CKWX Radio Limited, operator of CKWX and CKFX (Vancouver); Interior Broadcasting Limited, operator of CJIB (Vernon).
Selkirk has a 38 per cent direct interest in Northern Broadcasting Corp. Limited, operator of CKGP (Grande Prairie, Alberta). J. S. MacKay, President of Selkirk, has a further 12 per cent voting interest in the company personally and a retired associate of the Selkirk Group, Gerald Gaetz, holds an additional 24.4 per cent.
Directly and indirectly, Selkirk has an interest of about 36 per cent in the British Columbia Television Broadcasting System Limited. This includes direct holdings of Selkirk, the holdings of a wholly-owned subsidiary, Castleton Investments, and a 44.9 per cent interest in Canastel Broadcasting Corporation Limited. (The remaining 55.1 per cent of Canastel is owned by Western Broadcasting Company.) The largest shareholder in B. C. Television with an interest of about 44.4 per cent is Western Broadcasting. B. C. Television operates CHAN-TV (Vancouver), together with a number of satellites, and CHEK-TV (Victoria). It also has a one-third interest in Okanagan Valley Television Company Limited, operator of CHBC-TV (Kelowna) and eight satellites including one in both Penticton and Vernon. Selkirk has an additional interest (33.3 per cent) in Okanagan through its subsidiary, Interior Broadcasting. Through Lethbridge Television Limited, Selkirk has a 25 per cent interest in Cablevision Lethbridge Limited. Through Canastel, Selkirk and Western Broadcasting share a 25 per cent interest in CJCH-TV (Halifax).
All-Canada Radio Television Limited, another wholly-owned Selkirk subsidiary, acts as a media representative selling advertising time for more than seventy radio and television stations
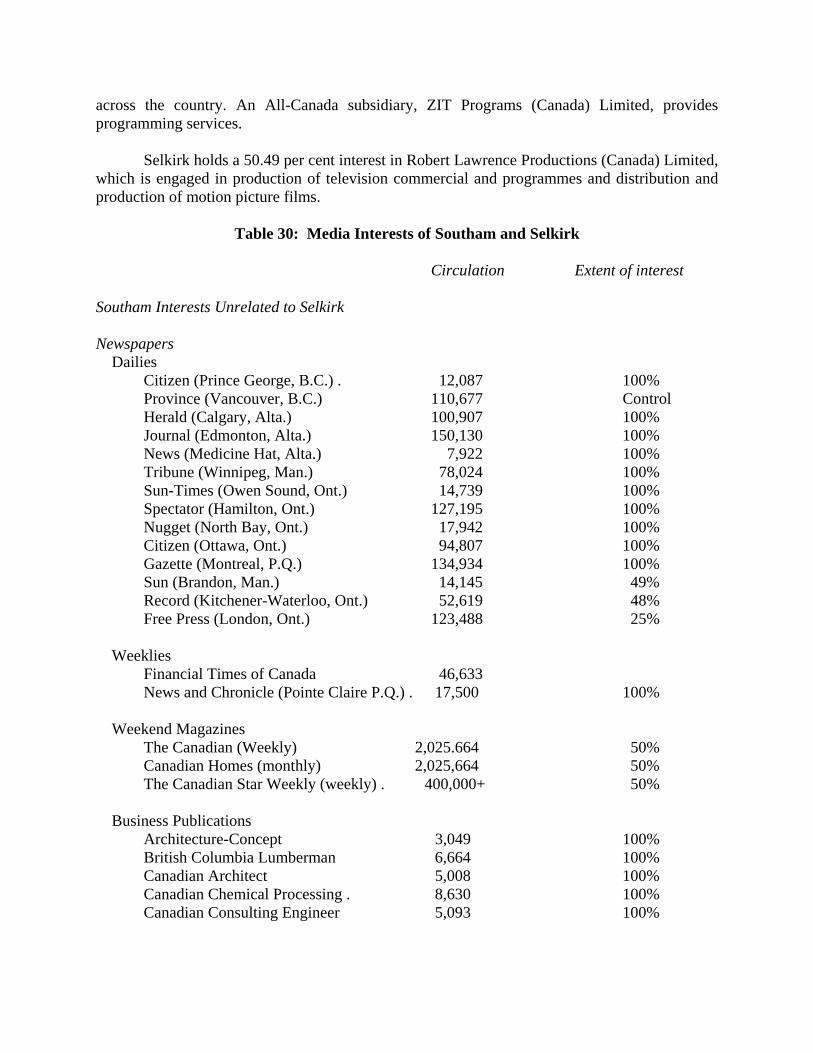
across the country. An All-Canada subsidiary, ZIT Programs (Canada) Limited, provides programming services.
Selkirk holds a 50.49 per cent interest in Robert Lawrence Productions (Canada) Limited, which is engaged in production of television commercial and programmes and distribution and production of motion picture films.
Table 30: Media Interests of Southam and Selkirk Circulation Extent of interest Southam Interests Unrelated to Selkirk Newspapers Dailies
Citizen (Prince George, B.C.) . 12,087 100% Province (Vancouver, B.C.) 110,677 Control Herald (Calgary, Alta.) 100,907 100% Journal (Edmonton, Alta.) 150,130 100% News (Medicine Hat, Alta.) 7,922 100% Tribune (Winnipeg, Man.) 78,024 100% Sun-Times (Owen Sound, Ont.) 14,739 100% Spectator (Hamilton, Ont.) 127,195 100% Nugget (North Bay, Ont.) 17,942 100% Citizen (Ottawa, Ont.) 94,807 100% Gazette (Montreal, P.Q.) 134,934 100% Sun (Brandon, Man.) 14,145 49% Record (Kitchener-Waterloo, Ont.) 52,619 48% Free Press (London, Ont.) 123,488 25%
Weeklies Financial Times of Canada 46,633 News and Chronicle (Pointe Claire P.Q.) . 17,500 100%
Weekend Magazines
The Canadian (Weekly) 2,025.664 50% Canadian Homes (monthly) 2,025,664 50% The Canadian Star Weekly (weekly) . 400,000+ 50%
Business Publications
Architecture-Concept 3,049 100% British Columbia Lumberman 6,664 100% Canadian Architect 5,008 100% Canadian Chemical Processing . 8,630 100% Canadian Consulting Engineer 5,093 100%
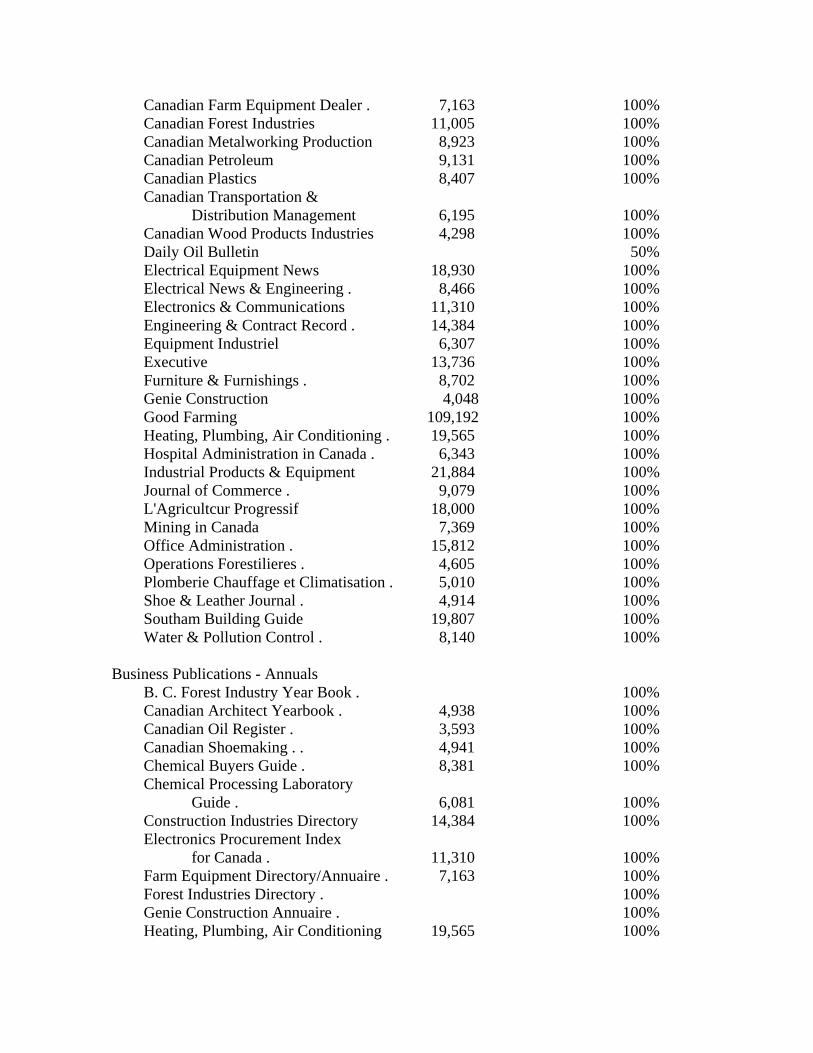
Canadian Farm Equipment Dealer . 7,163 100% Canadian Forest Industries 11,005 100% Canadian Metalworking Production 8,923 100% Canadian Petroleum 9,131 100% Canadian Plastics 8,407 100% Canadian Transportation &
Distribution Management 6,195 100% Canadian Wood Products Industries 4,298 100% Daily Oil Bulletin 50% Electrical Equipment News 18,930 100% Electrical News & Engineering . 8,466 100% Electronics & Communications 11,310 100% Engineering & Contract Record . 14,384 100% Equipment Industriel 6,307 100% Executive 13,736 100% Furniture & Furnishings . 8,702 100% Genie Construction 4,048 100% Good Farming 109,192 100% Heating, Plumbing, Air Conditioning . 19,565 100% Hospital Administration in Canada . 6,343 100% Industrial Products & Equipment 21,884 100% Journal of Commerce . 9,079 100% L'Agricultcur Progressif 18,000 100% Mining in Canada 7,369 100% Office Administration . 15,812 100% Operations Forestilieres . 4,605 100% Plomberie Chauffage et Climatisation . 5,010 100% Shoe & Leather Journal . 4,914 100% Southam Building Guide 19,807 100% Water & Pollution Control . 8,140 100%
Business Publications - Annuals
B. C. Forest Industry Year Book . 100% Canadian Architect Yearbook . 4,938 100% Canadian Oil Register . 3,593 100% Canadian Shoemaking . . 4,941 100% Chemical Buyers Guide . 8,381 100% Chemical Processing Laboratory
Guide . 6,081 100% Construction Industries Directory 14,384 100% Electronics Procurement Index
for Canada . 11,310 100% Farm Equipment Directory/Annuaire . 7,163 100% Forest Industries Directory . 100% Genie Construction Annuaire . 100% Heating, Plumbing, Air Conditioning 19,565 100%
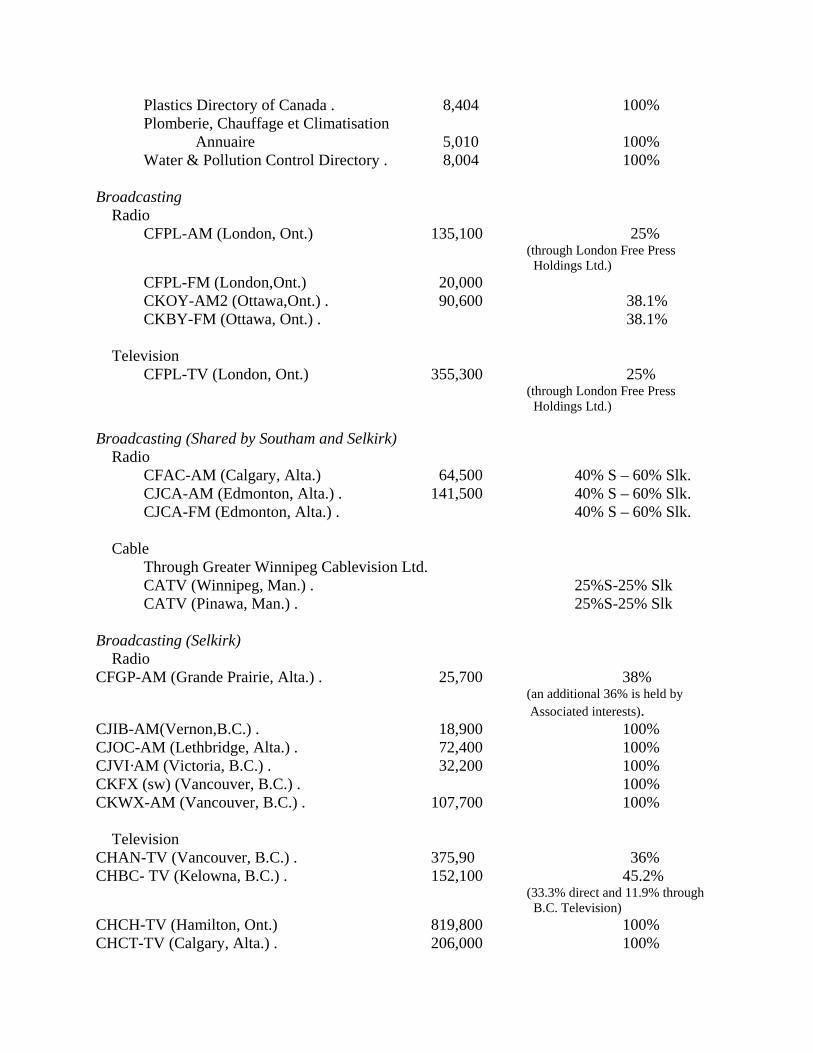
Plastics Directory of Canada . 8,404 100% Plomberie, Chauffage et Climatisation
Annuaire 5,010 100% Water & Pollution Control Directory . 8,004 100%
Broadcasting Radio
CFPL-AM (London, Ont.) 135,100 25% (through London Free Press Holdings Ltd.) CFPL-FM (London,Ont.) 20,000 CKOY-AM2 (Ottawa,Ont.) . 90,600 38.1% CKBY-FM (Ottawa, Ont.) . 38.1%
Television
CFPL-TV (London, Ont.) 355,300 25% (through London Free Press Holdings Ltd.) Broadcasting (Shared by Southam and Selkirk) Radio
CFAC-AM (Calgary, Alta.) 64,500 40% S – 60% Slk. CJCA-AM (Edmonton, Alta.) . 141,500 40% S – 60% Slk. CJCA-FM (Edmonton, Alta.) . 40% S – 60% Slk.
Cable
Through Greater Winnipeg Cablevision Ltd. CATV (Winnipeg, Man.) . 25%S-25% Slk CATV (Pinawa, Man.) . 25%S-25% Slk
Broadcasting (Selkirk) Radio CFGP-AM (Grande Prairie, Alta.) . 25,700 38%
(an additional 36% is held by Associated interests).
CJIB-AM(Vernon,B.C.) . 18,900 100% CJOC-AM (Lethbridge, Alta.) . 72,400 100% CJVI·AM (Victoria, B.C.) . 32,200 100% CKFX (sw) (Vancouver, B.C.) . 100% CKWX-AM (Vancouver, B.C.) . 107,700 100% Television CHAN-TV (Vancouver, B.C.) . 375,90 36% CHBC- TV (Kelowna, B.C.) . 152,100 45.2% (33.3% direct and 11.9% through B.C. Television) CHCH-TV (Hamilton, Ont.) 819,800 100% CHCT-TV (Calgary, Alta.) . 206,000 100%
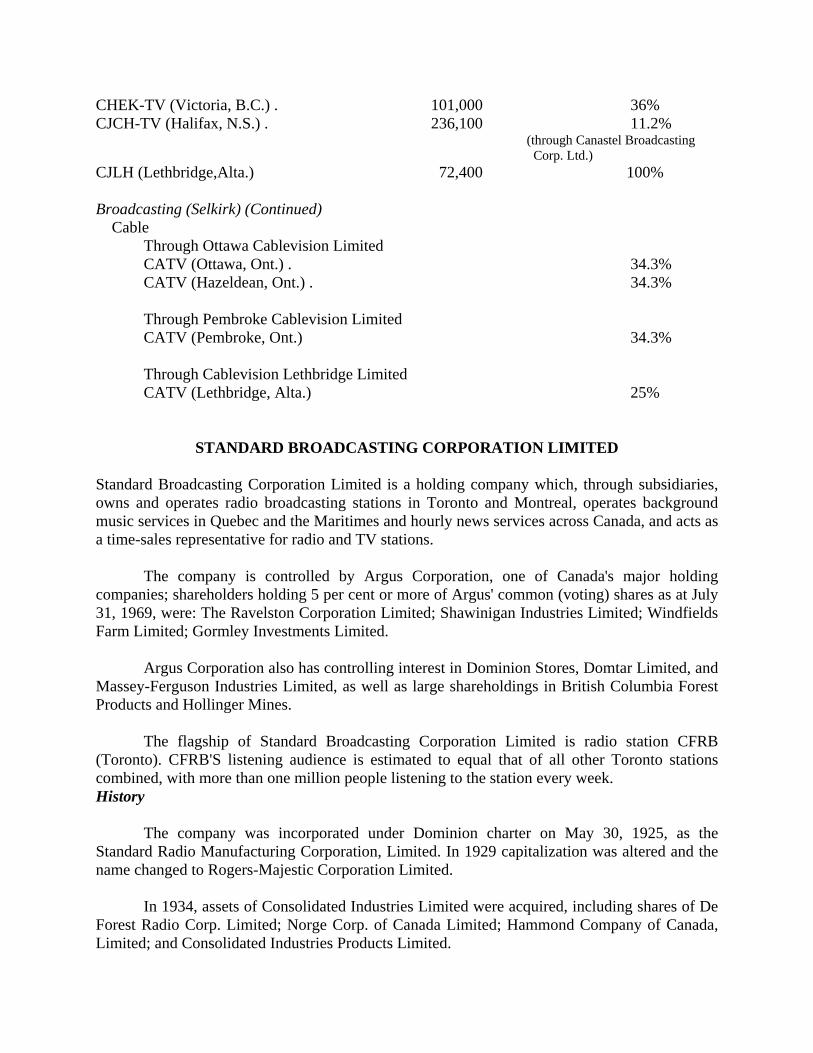
CHEK-TV (Victoria, B.C.) . 101,000 36% CJCH-TV (Halifax, N.S.) . 236,100 11.2% (through Canastel Broadcasting Corp. Ltd.) CJLH (Lethbridge,Alta.) 72,400 100% Broadcasting (Selkirk) (Continued) Cable
Through Ottawa Cablevision Limited CATV (Ottawa, Ont.) . 34.3% CATV (Hazeldean, Ont.) . 34.3%
Through Pembroke Cablevision Limited CATV (Pembroke, Ont.) 34.3% Through Cablevision Lethbridge Limited CATV (Lethbridge, Alta.) 25%
STANDARD BROADCASTING CORPORATION LIMITED Standard Broadcasting Corporation Limited is a holding company which, through subsidiaries, owns and operates radio broadcasting stations in Toronto and Montreal, operates background music services in Quebec and the Maritimes and hourly news services across Canada, and acts as a time-sales representative for radio and TV stations.
The company is controlled by Argus Corporation, one of Canada's major holding companies; shareholders holding 5 per cent or more of Argus' common (voting) shares as at July 31, 1969, were: The Ravelston Corporation Limited; Shawinigan Industries Limited; Windfields Farm Limited; Gormley Investments Limited.
Argus Corporation also has controlling interest in Dominion Stores, Domtar Limited, and Massey-Ferguson Industries Limited, as well as large shareholdings in British Columbia Forest Products and Hollinger Mines.
The flagship of Standard Broadcasting Corporation Limited is radio station CFRB (Toronto). CFRB'S listening audience is estimated to equal that of all other Toronto stations combined, with more than one million people listening to the station every week. History
The company was incorporated under Dominion charter on May 30, 1925, as the Standard Radio Manufacturing Corporation, Limited. In 1929 capitalization was altered and the name changed to Rogers-Majestic Corporation Limited.
In 1934, assets of Consolidated Industries Limited were acquired, including shares of De Forest Radio Corp. Limited; Norge Corp. of Canada Limited; Hammond Company of Canada, Limited; and Consolidated Industries Products Limited.

In 1941, all the assets of Rogers-Majestic Corporation Limited, except shares and bonds
of Rogers Radio Broadcasting Company and shares of Canadian Radio Artists Bureau Limited, were sold to Small Electric Motors (Canada) Limited for $645,000 net. In 1941, the name of the company was changed to Standard Radio Limited.
In 1959, the company made an unsuccessful bid to obtain a licence to operate the first private commercial television station in the Toronto area.
Late in 1960, the company purchased all the outstanding shares of CJAD Limited, a leading English-language radio station in Montreal, Radio Time Sales (Quebec) Limited, and Radio Time Sales (Ontario) Limited.
Subsequent to this acquisition Radio Time Sales (Quebec) Limited was taken over by CJAD Limited, while Radio Time Sales (Ontario) Limited was accounted for as a dormant subsidiary.
In December, 1960, the company incorporated Standard Broadcast Sales Limited as a time-sales representative company for radio.
On July 1, 1961, CKFM, CFRB's FM station began separate broadcasting. CJFM, CJAD's FM station commenced operations in October, 1962.
In December, 1962, Standard Broadcast Sales Limited and Radio Time Sales (Ontario) Limited were amalgamated to form Standard Broadcast Sales Company Limited.
In 1963, CJAD, a Background Music Service, using the transmission facilities of CJFM (Montreal) was introduced. A similar service, using the transmission facilities of CKFM (Toronto) was formed in 1966.
Early in 1966 the company formed Canadian Standard Broadcast Sales Inc., incorporated in New York as an American sales organization. The company acquired the business of the American sales representative which formerly handled Standard Radio Limited time sales in the United States.
In June, 1966, the company formed a new, wholly-owned subsidiary, Standard Broadcast Productions Limited to produce and distribute syndicated Canadian programme material for radio stations.
Standard Broadcast Productions subsequently launched Standard Broadcast News, a service which delivers news reports from both Canada and abroad to subscribing stations in some fifteen localities across Canada.
Included in the company's operations is the Canadian Talent Library, a non-profit trust which distributes recordings by Canadian artists to 172 Canadian stations.

In the 1967-68 fiscal year the company formed Standard Sound Systems Company Limited as a wholly-owned subsidiary to take over the background music services in Toronto and Montreal. The Toronto operation was sold in October, 1968, with the acquisition of the Muzak franchise for Montreal, Quebec and the Maritimes.
In July, 1968, the corporate name of the company was changed to the present title.
Standard Broadcasting has tried unsuccessfully for years to obtain a television licence for a third VHF channel in Toronto. At one point the company had arranged with CKCO-TV (Kitchener-Waterloo) and WOKR-TV (Rochester, N.Y.), both using Channel 13, to take over that channel for themselves, with CKCO-TV moving to Channel 6 when the CBC's CBLT moved to Channel 5. However, the C.R.T.C. chose to make Channel 6 available in the London area for the CBC and in the Kingston-Belleville area for a new television station.
Standard Broadcasting has also bid for a UHF channel for the Toronto area against three others, including a partnership composed of Toronto Star Limited and The Montreal Star Company Limited, and Canadian Film Industries. The fourth bidder is Niagara Television Limited, licencee of CHCH-TV (Hamilton), which is owned by Selkirk Holdings. Financial Position Consolidated net income for the year ended March 31, 1969, increased by 17 per cent to $2,247,234. Gross revenues were 18 per cent higher at $10,660,936 against $8,984,543 for the previous year.
Table 31: Media Interests of Standard Broadcasting
Circulation Extent of Interest Radio
CFRB-AM (Toronto, Ont.) 852,500 100% CFRX (sw) (Toronto, Ont.) 100% CJAD-AM (Montreal, P.Q.) 310,000 100% CJFM-FM (Montreal, P.Q.) 27,000 100% CKFM-FM (Toronto, Ont.) 81,600 100%
TELEMEDIA (QUEBEC) LIMITED
Philippe de Gaspe Beaubien came to broadcasting in 1968 following four years as Chief Administrator of Expo facilities. For about two years he was the President of Quebec Telemedia Inc., the broadcast holding company owned by Power Corporation. In 1970, Power Corporation determined to separate itself from all involvement in communications media. Beaubien agreed to purchase all the holdings of Telemedia Inc. and its name and gained C.R.T.C. approval on June 17, 1970. In addition, he bought with approval, CKCH-AM and CKCH-FM in Hull, previously owned by La Compagnie Radiodiffusion CKCH de Hull Ltee

The Quebec Telemedia holdings were extensive and valuable. Mr. Beaubien's new
holding company, Telemedia (Quebec) Ltee, financed the transaction by giving back to Telemedia Inc. and Trans Canada Corporation Fund, notes totalling $7.25 million. These companies do not have any ownership of or management involvement with Telemedia (Quebec) Ltee.
The holdings of Telemedia (Quebec) Ltee are:
1 CHLT Tele 7 Ltee and CHLT Radio Sherbrooke Ltee (CHLT-TV, with rebroadcast to Edmundston, N.B.; CHLT -AM, with rebroadcast to Causapscal; and CHLT-FM in Sherbrooke only)
2 CKTS in Sherbrooke, sold some years ago by the Bassett family to Power Corporation
3 CJBR-TV Ltee and CJBR Radio Ltee
(TV, AM and FM radio in Rimouski with television rebroadcast to Edmundston, N.B. and AM radio to Causapscal)
4 CKAC Ltee, AM radio in Montreal
5 Radio Trois Rivieres Inc.; CHLN-AM radio 6 CKCH-AM in Hull
The purchase of CKAC and CHLN had been completed by the previous Power
Corporation company, but had not received C.R.T.C. approval. The companies were transferred directly to Telemedia (Quebec) Ltee. The approval of this transfer of ownership was granted with some reservation on the part of the C.R .T.C.:
The Commission is satisfied that acceptance of these proposals will clarify a series of complicated situations and may enable the new owner to maintain or improve the service provided by these stations. It is concerned, however, about the concentration of ownership of both radio and television to the extent proposed in these applications and about the large financial interests of a corporation whose principals own a considerable interest in other media.
The Commission is developing licensing policies which will take into account concentration of ownership in the media. After such policies are established, the Commission may examine this matter with the new company.
Table 32: Media Interests of Telemedia (Quebec) Limitee Circulation Extent of Interest
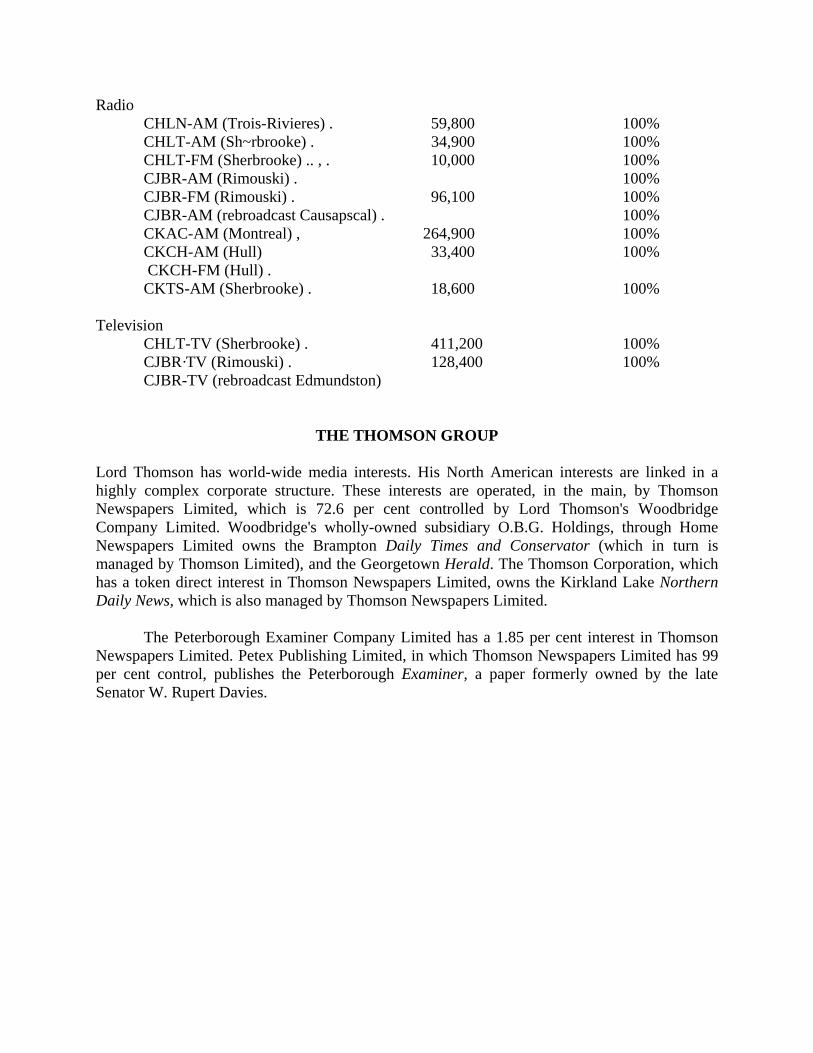
Radio CHLN-AM (Trois-Rivieres) . 59,800 100% CHLT-AM (Sh~rbrooke) . 34,900 100% CHLT-FM (Sherbrooke) .. , . 10,000 100% CJBR-AM (Rimouski) . 100% CJBR-FM (Rimouski) . 96,100 100% CJBR-AM (rebroadcast Causapscal) . 100% CKAC-AM (Montreal) , 264,900 100% CKCH-AM (Hull) 33,400 100% CKCH-FM (Hull) . CKTS-AM (Sherbrooke) . 18,600 100%
Television
CHLT-TV (Sherbrooke) . 411,200 100% CJBR·TV (Rimouski) . 128,400 100% CJBR-TV (rebroadcast Edmundston)
THE THOMSON GROUP Lord Thomson has world-wide media interests. His North American interests are linked in a highly complex corporate structure. These interests are operated, in the main, by Thomson Newspapers Limited, which is 72.6 per cent controlled by Lord Thomson's Woodbridge Company Limited. Woodbridge's wholly-owned subsidiary O.B.G. Holdings, through Home Newspapers Limited owns the Brampton Daily Times and Conservator (which in turn is managed by Thomson Limited), and the Georgetown Herald. The Thomson Corporation, which has a token direct interest in Thomson Newspapers Limited, owns the Kirkland Lake Northern Daily News, which is also managed by Thomson Newspapers Limited.
The Peterborough Examiner Company Limited has a 1.85 per cent interest in Thomson Newspapers Limited. Petex Publishing Limited, in which Thomson Newspapers Limited has 99 per cent control, publishes the Peterborough Examiner, a paper formerly owned by the late Senator W. Rupert Davies.

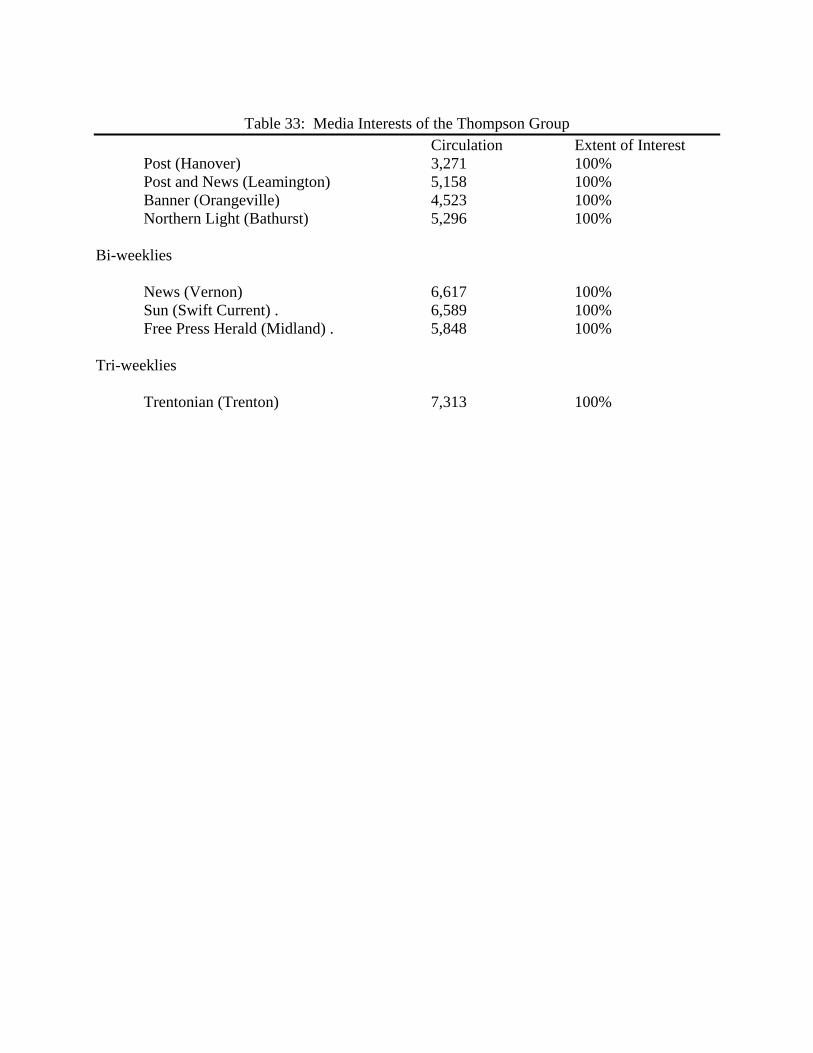
Table 33: Media Interests of the Thompson Group
Circulation Extent of Interest Post (Hanover) 3,271 100% Post and News (Leamington) 5,158 100% Banner (Orangeville) 4,523 100% Northern Light (Bathurst) 5,296 100%
Bi-weeklies
News (Vernon) 6,617 100% Sun (Swift Current) . 6,589 100% Free Press Herald (Midland) . 5,848 100%
Tri-weeklies
Trentonian (Trenton) 7,313 100%
TORONTO STAR LIMITED Toronto Star Limited was originally founded in 1892 as the Star Printing & Publishing Company Limited. Control was acquired by J. E. Atkinson in the early 1900s, and in 1933 it sold all its realty to Toronto Star Realty Limited and all undertakings and other assets to The Toronto Star Limited.
Upon the death of Mr. Atkinson in 1948 his will provided that the shares in the capital stock of the two companies should ultimately belong to The Atkinson Charitable Foundation. The Charitable Gifts Act passed by the Ontario Legislature made it impossible to carry out the terms of the will, and, early in 1958, the Supreme Court of Ontario granted approval for the newly-formed Hawthorn Publishing Company Limited to purchase the predecessor companies. The name of the company was changed to Toronto Star Limited by Supplementary Letters Patent as of April 30, 1958.
Under letters patent of amalgamation dated April 3, 1967, the former company Toronto Star Limited and Charth Investment and Publishing Company Limited amalgamated to form a new company under the corporate name of Toronto Star Limited. Charth Investment was incorporated as a private company by letters patent of Ontario dated May 8, 1958, and operated as an investment company whose sole holding, at the time of the merger, consisted of the majority of the common stock of Toronto Star Limited.
The purpose of the amalgamation was to provide a suitable share structure for the future sale of nonvoting shares to the public, if so required.
Total revenue for the 1968-1969 fiscal year increased to $52,275,000 from $48,535,000 for the previous fiscal year. Consolidated net income for the year ended September 30, 1969, amounted to $11,559,000 (including profit on sale of land and equipment of $8,790,000) compared with $1,523,000 (after deducting severance pay of $120,000) for the year ended September 30, 1968.
A 2-for-l split of Class B, C, D, and common shares was effected by S.L.P. dated March 2, 1970. Earnings per share based on the new combined Class B, C, D, and common shares, after giving effect to the 2-for-l split in March, 1970, were $4.81 in 1968-69 and 63 cents in 1967-68; the 1968-69 figure includes an extraordinary gain of $3.66 per combined share, against an extraordinary loss of 5 cents per combined share in 1967-68.2
Toronto Star Limited publishes the Toronto Daily Star, Canada's largest daily newspaper with a circulation of 387,418.
Toronto Star Limited has had an interest in a significant number of weekly newspapers in and around Metro Toronto for some years. This information was not generally known until last year when the company announced that it had acquired full ownership of the Oakville Daily

Journal-Record, a daily newspaper published in suburban Oakville, and the South Peel Weekly of Port Credit.
The company previously shared equal partnership in the two papers with the Thomson Group. At the same time, the Thomson Group acquired full ownership of the Brampton Daily Times and Conservator, a daily newspaper, and the Georgetown Herald, a weekly. These two papers had also been previously jointly owned by the two groups.
Toronto Star Limited was one of the unsuccessful applicants for the first private television licence issued in the Toronto area. Recently, the company joined with Infocor, a sister company of The Montreal Star, to file application with the C.R.T.C. for an UHF television licence in Toronto. The application was denied. The company has filed an application to purchase York Cablevision which owns a system in Toronto and is currently controlled by the Columbia Broadcasting System and S. W. Welsh. This application is still pending. Southstar Publications Limited
In 1965 Toronto Star Limited entered into a fifty-fifty partnership with Southam Press Limited to form a new company, Southstar Publishers Limited for the purpose of publishing a new weekly magazine supplement, The Canadian, and a monthly supplement, Canadian Homes.
The Canadian, with a combined circulation of 2,025,664 is distributed in nine Southam papers - Vancouver Province, Edmonton Journal, Calgary Herald, Medicine Hat News, Winnipeg Tribune, Hamilton Spectator, Ottawa Citizen, North Bay Nugget, and Montreal Gazette; two Sifton group papers - Saskatoon Star-Phoenix and Regina Leader-Post; the London Free Press and the Toronto Daily Star.
Canadian Homes is distributed with The Canadian in these same papers.
In October, 1968, the ailing Star Weekly, whose circulation dropped from 860,127 in 1958 to 685,739 in 1966 was replaced by The Canadian Star Weekly which is sold on newsstands and by carrier boys throughout the country.
President B. H. Honderich indicated in the 1968 annual report of Toronto Star Limited that the new publication had relieved the strain on production capacities at its Toronto harbour plant and improved the competitive position of The Canadian.
One year later it was announced by Southstar Publishers Limited that The Canadian and Canadian Homes would be printed in Montreal by the Montreal
Standard Publishing Company Limited, the company which publishes Weekend, a direct competitor to The Canadian. Weekend, which has a combined circulation of 2,848,000 is distributed in thirty-nine newspapers across Canada and by controlled circulation in five other cities.

At the same time it was announced that Southstar Publishers Limited and the Montreal Standard Publishing Company Limited, had formed a new company, Magna Media Limited, for the purpose of advertising sales, marketing and research for the weekly supplements published by the holding companies.
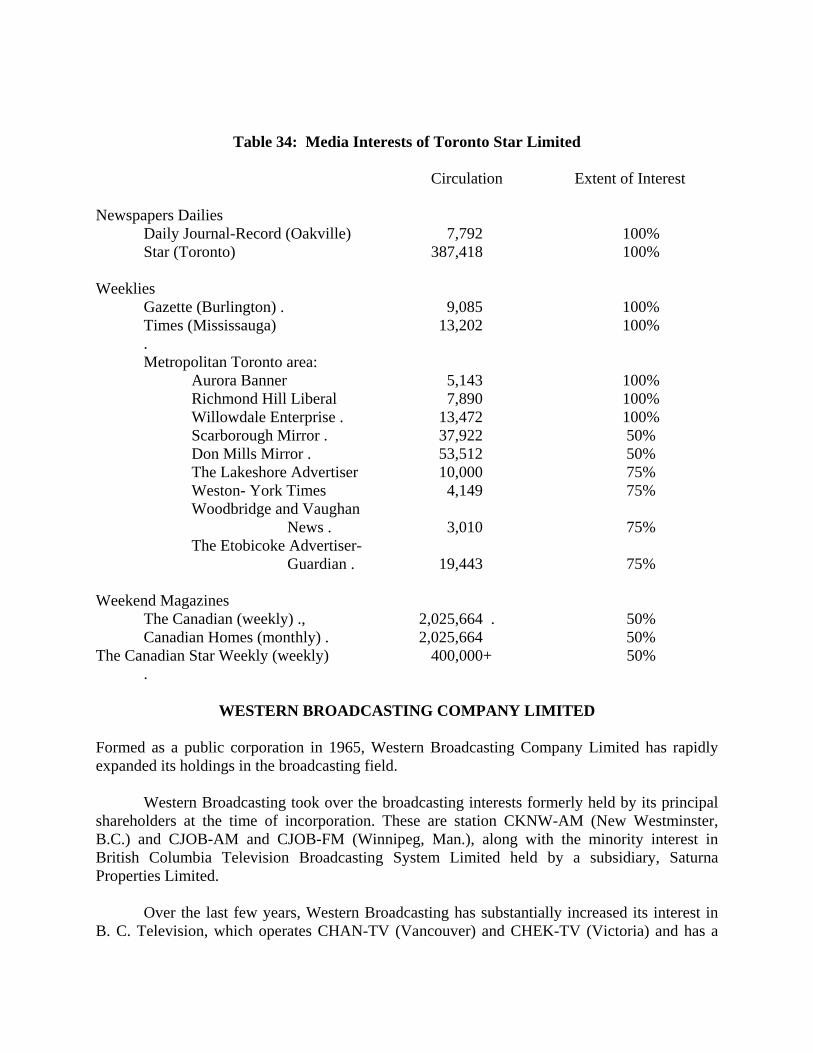
Table 34: Media Interests of Toronto Star Limited
Circulation Extent of Interest Newspapers Dailies
Daily Journal-Record (Oakville) 7,792 100% Star (Toronto) 387,418 100%
Weeklies
Gazette (Burlington) . 9,085 100% Times (Mississauga) 13,202 100% . Metropolitan Toronto area:
Aurora Banner 5,143 100% Richmond Hill Liberal 7,890 100% Willowdale Enterprise . 13,472 100% Scarborough Mirror . 37,922 50% Don Mills Mirror . 53,512 50% The Lakeshore Advertiser 10,000 75% Weston- York Times 4,149 75% Woodbridge and Vaughan
News . 3,010 75% The Etobicoke Advertiser-
Guardian . 19,443 75% Weekend Magazines
The Canadian (weekly) ., 2,025,664 . 50% Canadian Homes (monthly) . 2,025,664 50%
The Canadian Star Weekly (weekly) 400,000+ 50% .
WESTERN BROADCASTING COMPANY LIMITED
Formed as a public corporation in 1965, Western Broadcasting Company Limited has rapidly expanded its holdings in the broadcasting field.
Western Broadcasting took over the broadcasting interests formerly held by its principal shareholders at the time of incorporation. These are station CKNW-AM (New Westminster, B.C.) and CJOB-AM and CJOB-FM (Winnipeg, Man.), along with the minority interest in British Columbia Television Broadcasting System Limited held by a subsidiary, Saturna Properties Limited.
Over the last few years, Western Broadcasting has substantially increased its interest in B. C. Television, which operates CHAN-TV (Vancouver) and CHEK-TV (Victoria) and has a
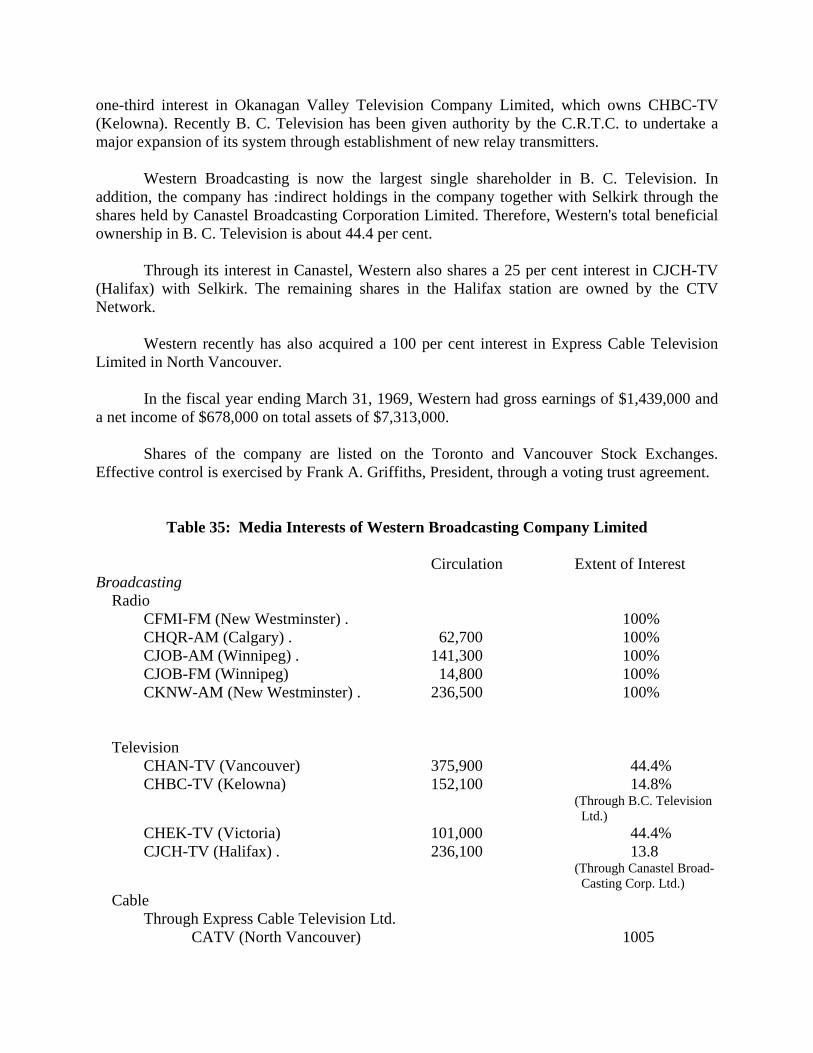
one-third interest in Okanagan Valley Television Company Limited, which owns CHBC-TV (Kelowna). Recently B. C. Television has been given authority by the C.R.T.C. to undertake a major expansion of its system through establishment of new relay transmitters.
Western Broadcasting is now the largest single shareholder in B. C. Television. In addition, the company has :indirect holdings in the company together with Selkirk through the shares held by Canastel Broadcasting Corporation Limited. Therefore, Western's total beneficial ownership in B. C. Television is about 44.4 per cent.
Through its interest in Canastel, Western also shares a 25 per cent interest in CJCH-TV (Halifax) with Selkirk. The remaining shares in the Halifax station are owned by the CTV Network.
Western recently has also acquired a 100 per cent interest in Express Cable Television Limited in North Vancouver.
In the fiscal year ending March 31, 1969, Western had gross earnings of $1,439,000 and a net income of $678,000 on total assets of $7,313,000.
Shares of the company are listed on the Toronto and Vancouver Stock Exchanges. Effective control is exercised by Frank A. Griffiths, President, through a voting trust agreement.
Table 35: Media Interests of Western Broadcasting Company Limited
Circulation Extent of Interest Broadcasting Radio
CFMI-FM (New Westminster) . 100% CHQR-AM (Calgary) . 62,700 100% CJOB-AM (Winnipeg) . 141,300 100% CJOB-FM (Winnipeg) 14,800 100% CKNW-AM (New Westminster) . 236,500 100%
Television
CHAN-TV (Vancouver) 375,900 44.4% CHBC-TV (Kelowna) 152,100 14.8% (Through B.C. Television Ltd.) CHEK-TV (Victoria) 101,000 44.4% CJCH-TV (Halifax) . 236,100 13.8 (Through Canastel Broad- Casting Corp. Ltd.)
Cable Through Express Cable Television Ltd.
CATV (North Vancouver) 1005
PART II
ECONOMICS OF THE MASS MEDIA
Section One: ADVERTISING
Chapter 1:
THE ECONOMIC IMPORTANCE OF ADVERTISING
Introduction No clear understanding of the structure and role of mass media in Canada today is possible without a clear understanding of the relationship between advertising and non-advertising content of a newspaper or radio or television programming. Publishing a newspaper or operating a private broadcast station is a business, and the owners must receive more revenue than they spend if the enterprise is to survive. The major source of that revenue is advertising, and the economics of advertising ultimately determine all other decisions basic to the operation of a newspaper or broadcast station. Without an audience, advertising is useless; thus the number of readers, listeners, or viewers helps directly to determine how much advertising a newspaper or station can get, and how much it can charge for it.
It is in the area of the real relationships between audience, non-advertising content, and advertising that confusion most often arises in respect to the structure and role of mass media. Non-advertising content - news, information, and entertainment - is the primary means of attracting readers, listeners, and viewers. Advertisements, in the strict content sense, are of secondary importance and interest to the vast majority of the audience, although advertisements also contribute to informing (and, to a lesser degree, to entertaining) the audience. But, in the strict economic sense, media require an audience primarily to provide customers for the firms that buy advertising in the media in order to sell their goods and services.
No free-enterprise broadcast station or newspaper can survive indefinitely if too large a proportion of its audience does not respond to its advertisements; the medium must either change its content to attract an audience that is more responsive to advertising or lose advertising to another medium. Newspapers and broadcast stations devote the largest part of their promotion and research effort to attempt to prove to advertisers and advertising agencies that their particular audience is large, strategically located, affluent, and responsive to advertisements by buying the goods and services being advertised.
This description of the financial objectives of the mass media in no way questions or denigrates the importance and sincerity of their other, equally basic objectives - to entertain tastefully, to educate, to inform objectively, or to stimulate public discussion. It merely recognizes that the simple facts of life in a free-enterprise economy ultimately dictate all other policies and actions in the media industries, just as they do in all other profit-motivated industries.
The historic union between the media and advertising can be attributed primarily to a communality of purpose: each is concerned with the dissemination of information, in the broadest sense of the word information. Publishers, broadcasters, and advertisers have a "message" they undertake to distribute to a large portion of the public. Given this common
purpose, it is not unexpected that they have found the means used by the one are also suited to the other. It is nevertheless conceivable that publishers and broadcasters could undertake to inform and entertain independently of those who inform for the purpose of advertising. In order to do so, the former would have to meet their costs of production by charging consumers directly for services rendered. In publishing, this would result in a much higher direct price to the consumer than that which now prevails for newspapers and periodicals. In broadcasting, it would require a completely different distribution system. Closed circuits would have to be utilized so that charges could be assessed to those using the services - and, again, the direct price to the consumer would be much higher than it is under the present system.
There are slightly over five million households in Canada today. Each of these households is an active or potential consumer of consumer goods produced by Canadian industry. Any effort to inform these households of the kinds of consumer goods available is a gigantic marketing endeavour. The mass media are well suited to this marketing operation. It is no exaggeration to suggest that there is no other marketing technique known today that would make it economically feasible to mass-market consumer goods.
THE ECONOMIC OF ADVERTISING Advertising constitutes approximately 55 per cent of the gross income of the Canadian broadcasting industry, 65 per cent of the gross income of the newspaper publishing industry, and 70 per cent of gross income accruing to publishers of periodicals. (The figure for broadcasting appears low because of grants from the federal government to the CBC. In the private broadcasting sector, advertising accounts for 93 per cent of gross revenues.)
The demand for advertising depends on three things: first, the nature of the product to be advertised; second, the size of the firm advertising; and, third, the nature of the market for the product. The most important aspect of the demand for advertising is, of course, the nature of the product. Heavy advertising occurs in oligopolistic markets with non-price competition among slightly differentiated products - for example, soaps, gasoline, and cigarettes.
The rapid growth of advertising revenues in recent years can be attributed to several factors: first to technological advances which create new wants; second, to highly specialized markets; third, to technological advances in selling techniques; fourth, to increased competition in all markets; and, finally, to the growth in number of media outlets, in population, and in the numbers of media users.
Since 1950, total net advertising has more than tripled in Canada. In 1950, total expenditure was $227.9 millions; by 1956, expenditures had nearly doubled, to $448.4 millions, and, by 1968, they had more than doubled again, to $1,010.1 millions (Table 36). Broadcasting, of course, has seen the greatest growth in advertising revenue (See Chart 4), largely because of the commercial introduction of television. Television's phenomenal growth can be accounted for by the fact that it reaches the entire cross-section of the nation more continuously and more intensively than any other medium. Although the advertising cost per unit is highest in television because television is the most influential medium, the return from investment in television advertising, although not quantifiable, is believed to be the highest for many products.

Table 36: Total Advertising Expenditures, Canada, 1950-1968
Total Advertising Change From Expenditures Year Previous
Dollars Per Cent
1950 . . . . . . . . . . . . . 228,000,000 51 ............. 254,300,000 11.6 52 ............. 285,000,000 12.1 53 ............. 323,500,000 13.5 54 .............. 356,200,000 10.1 55 ............. 395,600,000 11.1 56 ............. 448,400,000 13.3 57 ............. 477,500,000 6.5 58 ............. 504,400,000 5.6 59 ............. 541,100,000 7.3 60 ............. 573,600,000 6.0 61 ............. 609,000,000 6.2 62 ............. 642,600,000 5.5 63 ............. 677,200,000 5.4 64 ............. 725,700,000 7.2 65 ............. 800,000,000 10.2 66 ............. 868,000,000 8.5 67 ............. 933,600,000 7.6 68* ............ 1,010,000,000 8.2 · ADVERTISING EXPENDITURES AND EXPENDITURES ON GOODS AND SERVICES In Table 36, three distinct trends can be noted in the rate of growth of total advertising expenditures during the period 1950-68.
The first notable trend is to be found between the years 1950 and 1956, when advertising expenditures increased at a rate considerably faster than the over-all trend for the period as a whole.
The second trend is to be found between the years 1956 and 1963, when the rate of growth slowed considerably, relative to the period 1950-56. The third trend can be found in the period 1963-68 when the rate of growth of advertising expenditures was faster than that prevailing in the period 1956 – 63 but not so fast as that prevailing between 1950 and 1956.
The data in Table 37 indicate the relationship between total advertising expenditures in Canada and gross national expenditures, expenditures on consumer goods, and retail sales. As can be seen from Table 37, movements in advertising expenditures have been closely related to movements in expenditures n consumer goods and services. Changes in advertising expenditures follow the pattern of changes in consumer expenditures much more closely than changes in either gross national expenditures or retail sales. This result was not unexpected, since consumer products receive the greatest emphasis in advertising programmes. But while rates of change in advertising expenditures have corresponded closely to rates of change in expenditures on consumer goods and services, the two have not completely paralleled each other. Column 5 in Table 37, indicates total advertising expenditures as a percentage of expenditures on consumer goods and services


Table 37: Advertising Expenditures, Gross National Expenditures,
Consumer Expenditures & Retail Sales Canada, 1950-1968
Year Advertising Expenditures
Gross National Expenditures
Advertising Expenditures As Per Cent of G.N.P.
Expenditures On Consumer Goods and Services
Advertising Expenditures as Per Cent of Consumer Spending on Goods and Services
Retail Sales Advertising Expenditures As Per Cent of Retail Sales
1950 227,959,000 17,955,000,000 1.27 11,991,000,000 1.90 9,620,000,000 2.37 51 254,345,000 21,060,000,000 1.21 13,399,000,000 1.89 10,693,000,000 2.37 52 285,053,000 24,042,000,000 1.19 14,818,000,000 1.93 11,532,000,000 2.47 53 323,565,000 25,327,000,000 1.40 15,717,000,000 2.06 12,128,000,000 2.67 54 356,223,000 25,233,000,000 1.41 16,561,000,000 2.15 12,066,000,000 2.95 55 395,628,000 27,895,000,000 1.42 17,902,000,000 2.21 13,112,000,000 3.02 56 448,498,000 31,374,000,000 1.43 19,466,000,000 2.30 13,299,000,000 3.37 57 477,578,000 32,907,000,000 1.45 20,886,000,000 2.29 15,381,000,000 3.49 58 504,417,000 34,094,000,00 1.48 22,211,000,000 2.27 14,795,000,000 3.40 59 541,101,000 36,266,000,000 1.49 23,620,000,000 2.29 15,381,000,000 3.51 60 573,684,000 37,775,000,000 1.52 24,705,000,000 2.32 16,073,000,000 3.71 61 609,063,000 39,080,000,000 1.56 25,120,000,000 2.43 16,073,000,000 3.78 62 642,613,000 42,353,000,000 1.52 26,636,000,000 2.41 17,137,000,000 3.75 63 677,213,000 45,465,000,000 1.49 28,364,000,000 2.39 18,207,000,000 3.71 64 725,711,000 49,783,000,000 1.46 30,647,000,000 2.37 19,493,000,000 3.72 65 800,064,000 54,897,000,000 1.46 33,134,000,000 2.42 21,155,000,000 3.78 66 868,047,000 61,421,000,000 1.41 36,057,000,000 2.41 22,678,000,000 3.82 67 933,682,000 65,608,000,000 1.42 38,998,000,000 2.39 23,785,000,000 3.92 68 1,010,000,000 71,454,000,000 1.41 42,360,000,000 2.38 25,412,000,000 3.97

The period between 1950 and 1956 was one in which there was a marked increase in the intensity of advertising relative to consumer expenditures. This intensification can be attributed partially to the large increase in circulation of the mass media during the previous decade, and partially to the reaction of business to profitable advertising results during the take-off in consumer spending which occurred during the 1940s.
The period 1957·60 was one of relative stability in advertising expenditures, with growth in spending on advertising pretty well paralleling the growth in spending on consumer products. However, by 1960 the impact of television had made itself felt in two ways. First, by 1960, television coverage had reached sufficient size to make television appealing as a form of mass advertising coverage. Second, by 1960, advertisers were becoming aware that television advertising was more effective for some products than advertising through the other, older media. These realizations led to a significant spurt in total advertising spending from a level of approximately 2.30 per cent of consumer spending in 1960, to a new level of approximately 2.40 per cent in 1961. Since 1961, total advertising expenditures as a percentage of consumer expenditures have remained relatively constant in the range of 2.40 per cent.
Column 3 contains the results of advertising expenditures calculated as a percentage of Canadian G.N.P. And column 7 contains the results of advertising expenditures calculated as a percentage of total retail sales in Canada. As can be seen, there is a great deal more variability in these percentages than in the percentages found in column 5.
As has been already stated, spending by business on advertising tends to be related much more directly to spending on consumer goods and services than to either G.N.P. or retail sales. For this reason, care must be taken in drawing conclusions concerning trends in advertising expenditures. For instance, the fact that the ratio of advertising expenditures to G.N.P. is falling has led some to conclude that the emphasis on advertising in the Canadian economy is declining. In fact this is simply a reflection of the fact that sales of consumer goods and services are declining as a proportion of G.N.P. in Canada. Advertising expenditures appear to have stabilized in the range of approximately 0.03 percentage points on either side of 2.40 per cent of expenditures on consumer goods and services.
COMPARISON OF ADVERTISING EXPENDITURES IN CANADA AND THE UNITED STATES
Table 38 shows advertising expenditures in the United States for selected years by type of medium.
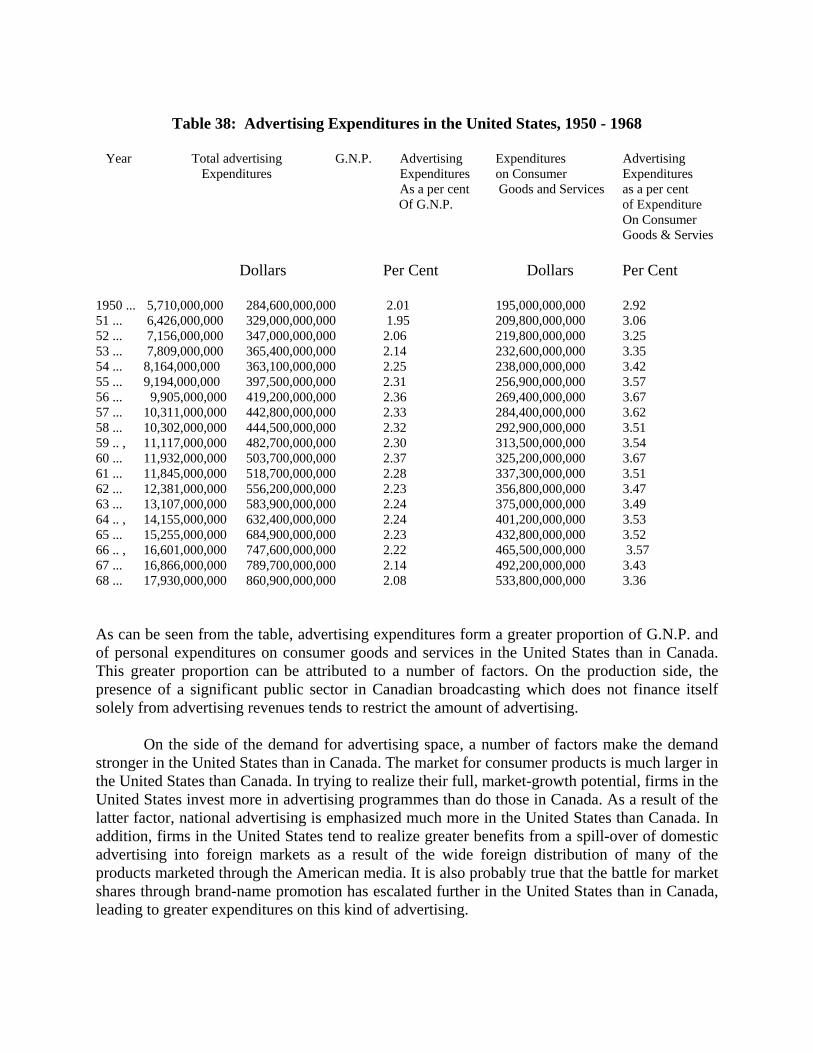
Table 38: Advertising Expenditures in the United States, 1950 - 1968
Year Total advertising G.N.P. Advertising Expenditures Advertising Expenditures Expenditures on Consumer Expenditures As a per cent Goods and Services as a per cent Of G.N.P. of Expenditure On Consumer Goods & Servies
Dollars Per Cent Dollars Per Cent
1950 ... 5,710,000,000 284,600,000,000 2.01 195,000,000,000 2.92 51 ... 6,426,000,000 329,000,000,000 1.95 209,800,000,000 3.06 52 ... 7,156,000,000 347,000,000,000 2.06 219,800,000,000 3.25 53 ... 7,809,000,000 365,400,000,000 2.14 232,600,000,000 3.35 54 ... 8,164,000,000 363,100,000,000 2.25 238,000,000,000 3.42 55 ... 9,194,000,000 397,500,000,000 2.31 256,900,000,000 3.57 56 ... 9,905,000,000 419,200,000,000 2.36 269,400,000,000 3.67 57 ... 10,311,000,000 442,800,000,000 2.33 284,400,000,000 3.62 58 ... 10,302,000,000 444,500,000,000 2.32 292,900,000,000 3.51 59 .. , 11,117,000,000 482,700,000,000 2.30 313,500,000,000 3.54 60 ... 11,932,000,000 503,700,000,000 2.37 325,200,000,000 3.67 61 ... 11,845,000,000 518,700,000,000 2.28 337,300,000,000 3.51 62 ... 12,381,000,000 556,200,000,000 2.23 356,800,000,000 3.47 63 ... 13,107,000,000 583,900,000,000 2.24 375,000,000,000 3.49 64 .. , 14,155,000,000 632,400,000,000 2.24 401,200,000,000 3.53 65 ... 15,255,000,000 684,900,000,000 2.23 432,800,000,000 3.52 66 .. , 16,601,000,000 747,600,000,000 2.22 465,500,000,000 3.57 67 ... 16,866,000,000 789,700,000,000 2.14 492,200,000,000 3.43 68 ... 17,930,000,000 860,900,000,000 2.08 533,800,000,000 3.36 As can be seen from the table, advertising expenditures form a greater proportion of G.N.P. and of personal expenditures on consumer goods and services in the United States than in Canada. This greater proportion can be attributed to a number of factors. On the production side, the presence of a significant public sector in Canadian broadcasting which does not finance itself solely from advertising revenues tends to restrict the amount of advertising.
On the side of the demand for advertising space, a number of factors make the demand stronger in the United States than in Canada. The market for consumer products is much larger in the United States than Canada. In trying to realize their full, market-growth potential, firms in the United States invest more in advertising programmes than do those in Canada. As a result of the latter factor, national advertising is emphasized much more in the United States than Canada. In addition, firms in the United States tend to realize greater benefits from a spill-over of domestic advertising into foreign markets as a result of the wide foreign distribution of many of the products marketed through the American media. It is also probably true that the battle for market shares through brand-name promotion has escalated further in the United States than in Canada, leading to greater expenditures on this kind of advertising.
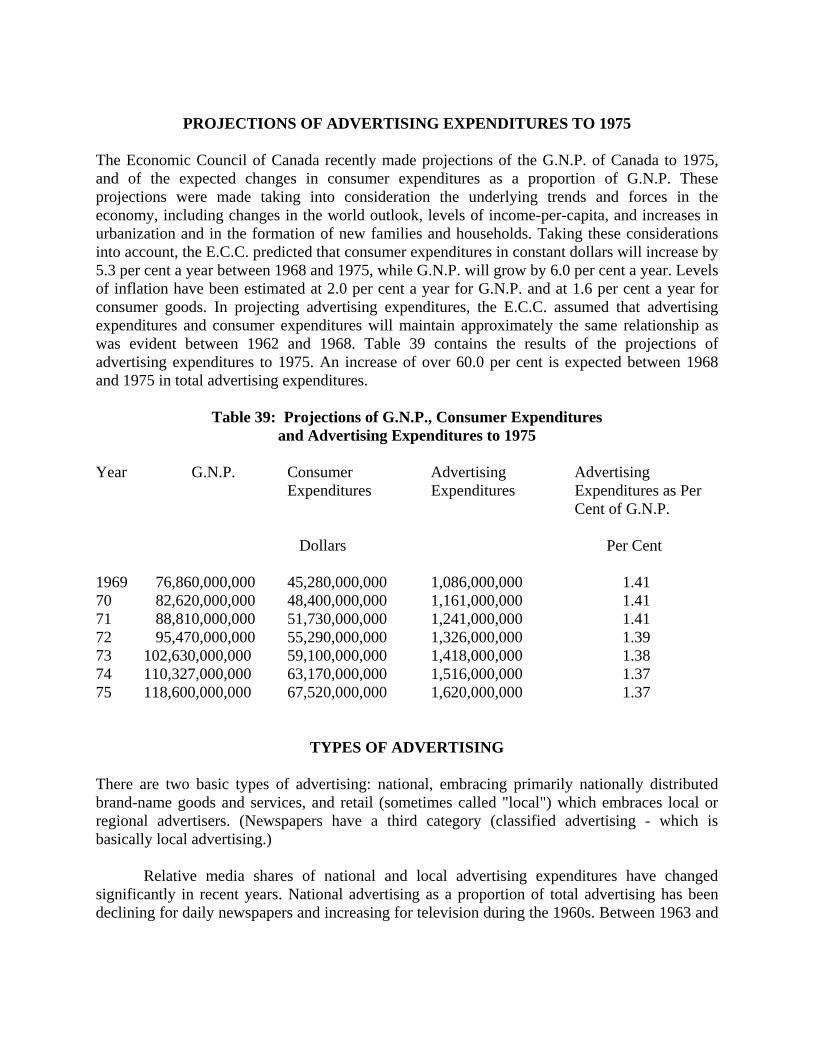
PROJECTIONS OF ADVERTISING EXPENDITURES TO 1975
The Economic Council of Canada recently made projections of the G.N.P. of Canada to 1975, and of the expected changes in consumer expenditures as a proportion of G.N.P. These projections were made taking into consideration the underlying trends and forces in the economy, including changes in the world outlook, levels of income-per-capita, and increases in urbanization and in the formation of new families and households. Taking these considerations into account, the E.C.C. predicted that consumer expenditures in constant dollars will increase by 5.3 per cent a year between 1968 and 1975, while G.N.P. will grow by 6.0 per cent a year. Levels of inflation have been estimated at 2.0 per cent a year for G.N.P. and at 1.6 per cent a year for consumer goods. In projecting advertising expenditures, the E.C.C. assumed that advertising expenditures and consumer expenditures will maintain approximately the same relationship as was evident between 1962 and 1968. Table 39 contains the results of the projections of advertising expenditures to 1975. An increase of over 60.0 per cent is expected between 1968 and 1975 in total advertising expenditures.
Table 39: Projections of G.N.P., Consumer Expenditures and Advertising Expenditures to 1975
Year G.N.P. Consumer Advertising Advertising Expenditures Expenditures Expenditures as Per Cent of G.N.P. Dollars Per Cent 1969 76,860,000,000 45,280,000,000 1,086,000,000 1.41 70 82,620,000,000 48,400,000,000 1,161,000,000 1.41 71 88,810,000,000 51,730,000,000 1,241,000,000 1.41 72 95,470,000,000 55,290,000,000 1,326,000,000 1.39 73 102,630,000,000 59,100,000,000 1,418,000,000 1.38 74 110,327,000,000 63,170,000,000 1,516,000,000 1.37 75 118,600,000,000 67,520,000,000 1,620,000,000 1.37
TYPES OF ADVERTISING There are two basic types of advertising: national, embracing primarily nationally distributed brand-name goods and services, and retail (sometimes called "local") which embraces local or regional advertisers. (Newspapers have a third category (classified advertising - which is basically local advertising.)
Relative media shares of national and local advertising expenditures have changed significantly in recent years. National advertising as a proportion of total advertising has been declining for daily newspapers and increasing for television during the 1960s. Between 1963 and
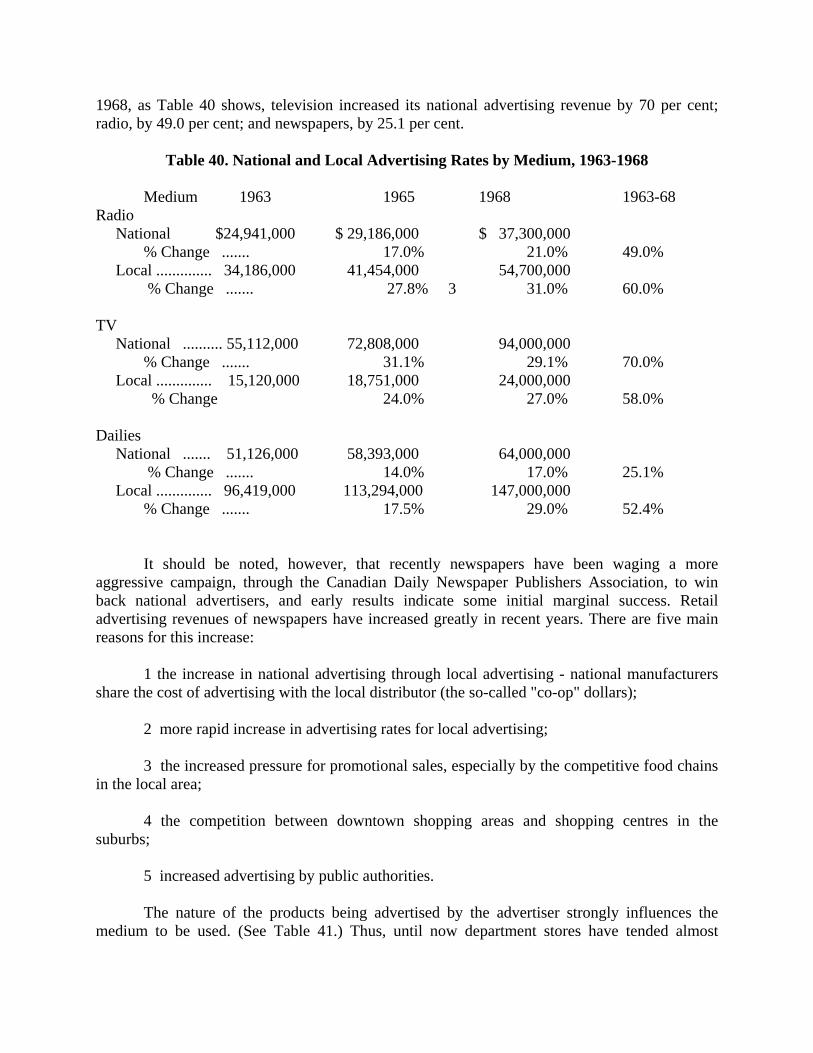
1968, as Table 40 shows, television increased its national advertising revenue by 70 per cent; radio, by 49.0 per cent; and newspapers, by 25.1 per cent.
Table 40. National and Local Advertising Rates by Medium, 1963-1968 Medium 1963 1965 1968 1963-68 Radio National $24,941,000 $ 29,186,000 $ 37,300,000 % Change ....... 17.0% 21.0% 49.0% Local .............. 34,186,000 41,454,000 54,700,000
% Change ....... 27.8% 3 31.0% 60.0% TV National .......... 55,112,000 72,808,000 94,000,000 % Change ....... 31.1% 29.1% 70.0% Local .............. 15,120,000 18,751,000 24,000,000
% Change 24.0% 27.0% 58.0% Dailies National ....... 51,126,000 58,393,000 64,000,000 % Change ....... 14.0% 17.0% 25.1% Local .............. 96,419,000 113,294,000 147,000,000 % Change ....... 17.5% 29.0% 52.4%
It should be noted, however, that recently newspapers have been waging a more
aggressive campaign, through the Canadian Daily Newspaper Publishers Association, to win back national advertisers, and early results indicate some initial marginal success. Retail advertising revenues of newspapers have increased greatly in recent years. There are five main reasons for this increase:
1 the increase in national advertising through local advertising - national manufacturers share the cost of advertising with the local distributor (the so-called "co-op" dollars);
2 more rapid increase in advertising rates for local advertising;
3 the increased pressure for promotional sales, especially by the competitive food chains in the local area;
4 the competition between downtown shopping areas and shopping centres in the suburbs;
5 increased advertising by public authorities.
The nature of the products being advertised by the advertiser strongly influences the medium to be used. (See Table 41.) Thus, until now department stores have tended almost
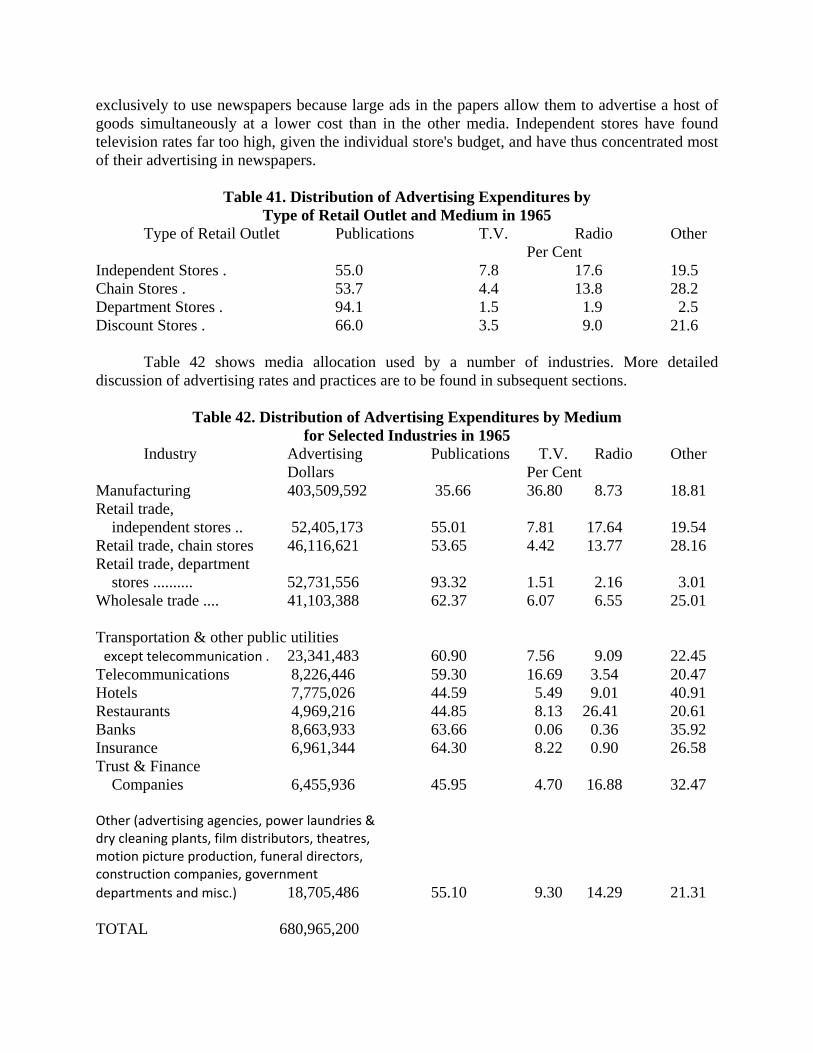
exclusively to use newspapers because large ads in the papers allow them to advertise a host of goods simultaneously at a lower cost than in the other media. Independent stores have found television rates far too high, given the individual store's budget, and have thus concentrated most of their advertising in newspapers.
Table 41. Distribution of Advertising Expenditures by Type of Retail Outlet and Medium in 1965
Type of Retail Outlet Publications T.V. Radio Other Per Cent Independent Stores . 55.0 7.8 17.6 19.5 Chain Stores . 53.7 4.4 13.8 28.2 Department Stores . 94.1 1.5 1.9 2.5 Discount Stores . 66.0 3.5 9.0 21.6
Table 42 shows media allocation used by a number of industries. More detailed discussion of advertising rates and practices are to be found in subsequent sections.
Table 42. Distribution of Advertising Expenditures by Medium for Selected Industries in 1965
Industry Advertising Publications T.V. Radio Other Dollars Per Cent Manufacturing 403,509,592 35.66 36.80 8.73 18.81 Retail trade, independent stores .. 52,405,173 55.01 7.81 17.64 19.54 Retail trade, chain stores 46,116,621 53.65 4.42 13.77 28.16 Retail trade, department stores .......... 52,731,556 93.32 1.51 2.16 3.01 Wholesale trade .... 41,103,388 62.37 6.07 6.55 25.01 Transportation & other public utilities except telecommunication . 23,341,483 60.90 7.56 9.09 22.45 Telecommunications 8,226,446 59.30 16.69 3.54 20.47 Hotels 7,775,026 44.59 5.49 9.01 40.91 Restaurants 4,969,216 44.85 8.13 26.41 20.61 Banks 8,663,933 63.66 0.06 0.36 35.92 Insurance 6,961,344 64.30 8.22 0.90 26.58 Trust & Finance Companies 6,455,936 45.95 4.70 16.88 32.47 Other (advertising agencies, power laundries & dry cleaning plants, film distributors, theatres, motion picture production, funeral directors, construction companies, government
departments and misc.) 18,705,486 55.10 9.30 14.29 21.31
TOTAL 680,965,200
Chapter 2:
THE ADVERTISING AGENCIES Individually, Canadian media operators are independent people, defenders of the free-enterprise system under which they function. Collectively, they have established a complex network of associations and relationships to protect and serve their interests. By establishing various criteria for recognition within their ranks, they have sought to establish - standards and raise the level of recognized professionalism within their industry. Toronto is the centre of the English-speaking media in Canada and is headquarters for most of the nationwide associations that have emerged in various related fields.
THE MEDIA EQUATION Three major elements constitute the media equation: the media themselves and their trade
associations (print, radio, television); the advertiser; and the advertising agency.
MEDIA TRADE ASSOCIATIONS Canadian Daily Newspaper Publishers Association, 250 Bloor Street East, Toronto 285, represents almost all daily newspapers in Canada. Its purpose is to elevate the standard of newspaper publishing in Canada, to foster business and business interests of its members. The C.D.N.P.A. formerly controlled the franchises of advertising agencies and the commission system through which advertising agencies are paid for their services. Since April, 1970, they have restricted themselves to providing a credit listing service to member newspapers, which decide themselves whether or not to do business with agencies.
Canadian Association of Broadcasters (L' Association Canadienne des Radio-diffusers), 85 Sparks Street, Ottawa 4, represents 286 radio, 54 television stations, and the CTV network, or nearly all the private sector of broadcasting in Canada. Established in 1926, as a voluntary trade association, the C.A.B.'s aims and objectives are to foster and develop, protect and serve the interests of broadcasting. C.A.B.'s head office is in Ottawa, with branches in Montreal and Toronto.
The C.A.B. controls the franchise and commission system in radio and television. Association Canadienne de la Radio et de la Television de Langue Francaise Inc., 1454 Mountain Street, Montreal 25, represents the majority of French radio and television stations in promoting, encouraging and developing interest towards French radio and television broadcasting. Periodical Press Association, 100 University Avenue, Toronto 116, represents three sectors of the print media: Agricultural Press Association of Canada, Canadian Business Press, and the Magazine Publishers Association of Canada. The Periodical Press Association stipulates no capital requirements for agencies seeking franchises to place national advertising in member publications. The disappearance of agricultural magazines over the years has reduced

membership in the Agricultural Press Association to two: the Country Guide and Le Bulletin des Agriculteurs.
The Magazine Publishers Association of Canada also has a membership of two: Chatelaine (English and French) and Maclean's (English and French). Although some 400-500 business publications exist in Canada, the circulations of only 50 per cent are audited. Publications audited by the Canadian Circulations Audit Board are eligible for membership in the Canadian Business Press Association. The greater number of publications represented in the C.B.P.A. are produced by Maclean-Hunter Ltd., Southam Business Publications Ltd., and National Business Publications Ltd. To prevent domination of the Association by member publications from these groups, each group is allowed a maximum of five votes at the annual meetings of the C.B.P.A. C.B.P.A. publications come under direct competition from American business publications in seeking advertising dollars, particularly in such specialized fields as oil and mining.
Canadian Weekly Newspapers Association, 2 Bloor Street East, Toronto 285, represents 454 member newspapers across Canada. Its purpose is to maintain high standards of newspaper writing and publishing, and to promote the business and business interest of members.
French Weeklies Association of Canada (Hebdos du Canada), Saint-Jean, Quebec, represents 100 French-language newspapers. The association provides services to help develop information and culture in French-speaking Canada.
Outdoor Advertising Association of Canada, 250 Bloor Street East, Toronto 285, represents 50 members operating in 181 market areas in Canada. The OAAC awards franchises to companies on a regional basis. Regional sales representatives, or "solicitors," sell national advertising in their franchise areas.
Transit Advertising- Trans-Ad Division, Warnock Hersey International Ltd., 1220 Yonge Street, Toronto 290, represents 40 member companies in providing advertisers and advertising agencies with research data on transit advertising.
Radio Sales Bureau, 321 Bloor Street East, Toronto 285, created by the Canadian Association of Broadcasters in 1961, operates independently in the promotion of radio as an effective advertising medium. The Bureau is concerned only with the promotion of national advertising. It represents 114 stations, of which 12 are outside the C.A.B.
Television Bureau of Advertising of Canada, 500 University Avenue, Toronto 101, created by the C.A.B. in 1961 as well, promotes television as an effective advertising medium on a local, regional and national scale. Membership 45 stations.
Magazine Advertising Bureau of Canada, 11 King Street West, Toronto 105, promotes magazines as an effective advertising medium. Membership ten, representing consumer magazines.

Canadian Industrial Advertisers, 53 Gibson Avenue, Hamilton, promotes industrial advertising. Membership seventy, representing major industrial advertisers. (See A.I.A. below.)
Graphic Arts Industries Association, 75 Albert Street, Ottawa, advances the interest of printing and allied industries. Membership-553.
Packaging Association of Canada (Association Canadienne de l'Emballage), 45 Charles Street East, Toronto 189, promotes the study, knowledge and understanding of improved techniques for packaging, packing, shipping and storing of merchandise, and the use and development of graphic arts in the packaging industry. Membership-1,200.
Canadian Direct Mail Association, 4102 Hingston Avenue, Montreal 28, promotes the use of direct mail as an effective means of advertising. Membership-100.
ADVERTISING AGENCIES ASSOCIATION
Institute of Canadian Advertising, 8 King Street East, Toronto 210, promotes and protects the interests of advertising agencies and the advancement of the profession. Membership forty-eight; about 40 per cent of agencies in Canada. Member agencies placed about 85 to 90 per cent of all national advertising in 1969. Ardiel Advertising Agency Limited, Cardon, Rose Limited, 4 Lawton Boulevard 1411 Crescent Street, Toronto 195, Ontario Montreal 107, Quebec., . Baker Advertising Limited Chapman Morris Advertising Limited 20 Toronto Street Suite 303 Toronto, 210, Ontario 71 Emereld Street South Hamilton, Ontario Bozell & Jacobs of Canada Ltd. Chisholm & Basford Likmited 797 Don Mill Road 48 St. Clair Avenue West Don Mills 402, Ontario Toronto 195, Ontario Leo Burnett Company of Canada Cockfield, Brown & Company Limited Limited, 165 University Avenue 200 Canada Cement Building Toronto 110, Ontario Montreal 111, Quebec Camp Associates Advertising Limited Crombie Advertising Company Limited 43 Eglinton Avenue East 355 St. James Street West Toronto 315, Ontario Montreal 126, Quebec Canadian Advertising Agency Limited Doyle Dane Berbach (Canada) Limited 630 Sherbrooke Street West 250 Bloor Street East Montreal 111, Quebec Toronto 285, Ontario

Dunsky Advertising Limited MacManus, John & Adams of Suite 400 Canada Limited 5165 Queen Mary Road 250 Bloor Street East, 8th Floor Montreal, Quebec Toronto 285, Ontario Foote Cone & Belding McCann-Erickson Advertising Advertising Limited of Canada Limited 10 St. Mary Street 151 Bloor Street West Toronto 189, Ontario Toronto 181, Ontario Foster Advertising Limited McConnell Advertising Limited 3 Place Ville Marie 234 Eglinton Avenue East Montreal 113, Quebec Toronto 315, Ontario Freeman, Mathes and Milne Limited McKim/Benton & Bowles Limited 2 Carlton Street 151 Bloor Street West Toronto 200, Ontario Toronto 181, Ontario Goodis, Goldberg, Soren Limited Muter, Culiner, Frankfurter 23 Prince Andrew Place & Gould Limited Don Mills 403, Ontario 89 Avenue Road Toronto 180, Ontario F.H. Hayhurst Co. Limited Needham, Harper & Steers of Canada 55 Eglinton Avenue East Limited, Suite 300 Toronto 315, Ontario Toronto 191, Ontario Gordon Hill Advertising Limited Norman, Craig & Kummel (Canada) 130 Bloor Street West Limited Toronto 181, Ontario 1129 Leslie Street Don Mills 403, Ontario Imperial Advertising Limited O’Brien Advertising Limited 5670 Spring Garden Road 1030 West Georgia Street Halifax, Nova Scotia Vancouver 5, British Columbia Industrial Advertising Agency Limited Ogilvy & Mather (Canada) Limited 1500 Stanley Street 88 University Avenue Montreal 110, Quebec Toronto 116, Ontario Albert Jarvis Limited Paul, Phelan and Perry Limited 1000 Yonge Street 33 Bloor Street East Toronto 289, Ontario Toronto 285, Ontario
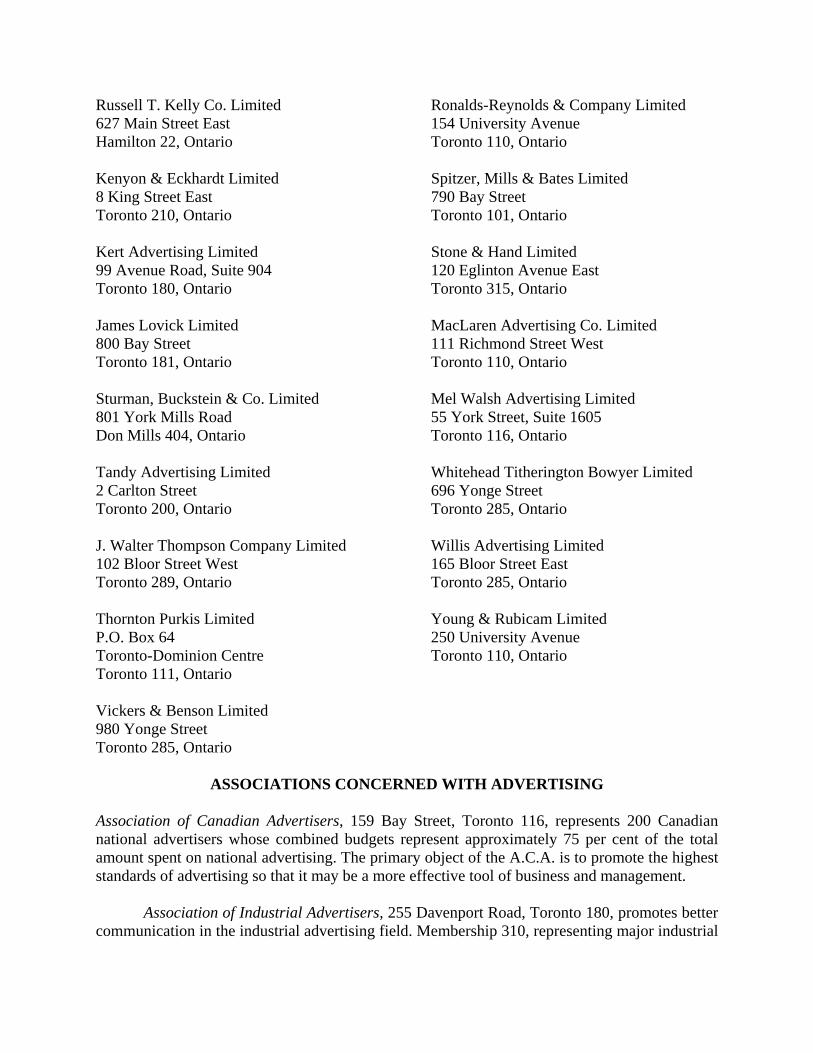
Russell T. Kelly Co. Limited Ronalds-Reynolds & Company Limited 627 Main Street East 154 University Avenue Hamilton 22, Ontario Toronto 110, Ontario Kenyon & Eckhardt Limited Spitzer, Mills & Bates Limited 8 King Street East 790 Bay Street Toronto 210, Ontario Toronto 101, Ontario Kert Advertising Limited Stone & Hand Limited 99 Avenue Road, Suite 904 120 Eglinton Avenue East Toronto 180, Ontario Toronto 315, Ontario James Lovick Limited MacLaren Advertising Co. Limited 800 Bay Street 111 Richmond Street West Toronto 181, Ontario Toronto 110, Ontario Sturman, Buckstein & Co. Limited Mel Walsh Advertising Limited 801 York Mills Road 55 York Street, Suite 1605 Don Mills 404, Ontario Toronto 116, Ontario Tandy Advertising Limited Whitehead Titherington Bowyer Limited 2 Carlton Street 696 Yonge Street Toronto 200, Ontario Toronto 285, Ontario J. Walter Thompson Company Limited Willis Advertising Limited 102 Bloor Street West 165 Bloor Street East Toronto 289, Ontario Toronto 285, Ontario Thornton Purkis Limited Young & Rubicam Limited P.O. Box 64 250 University Avenue Toronto-Dominion Centre Toronto 110, Ontario Toronto 111, Ontario Vickers & Benson Limited 980 Yonge Street Toronto 285, Ontario
ASSOCIATIONS CONCERNED WITH ADVERTISING Association of Canadian Advertisers, 159 Bay Street, Toronto 116, represents 200 Canadian national advertisers whose combined budgets represent approximately 75 per cent of the total amount spent on national advertising. The primary object of the A.C.A. is to promote the highest standards of advertising so that it may be a more effective tool of business and management.
Association of Industrial Advertisers, 255 Davenport Road, Toronto 180, promotes better communication in the industrial advertising field. Membership 310, representing major industrial

advertisers. The Canadian A.I.A. is Region Six of the U.S.-based Association of Industrial Advertisers. Canadian Industrial Advertisers, on the other hand is a wholly Canadian organization.
American Marketing Association, Toronto Chapter, 154 University Avenue, Toronto 110, supports studies to improve the methods and techniques of marketing research. Membership 400, representing agencies and advertisers participating in marketing functions.
Audit Bureau of Circulations, 335 Bay Street, Toronto 105 ,reports figures and facts relating to the quantity and quality of member publishers' circulations, verifies the data through regular audit, then disseminates the data to its advertiser, advertising agency and publisher members. Membership 4,070.
BBM Bureau of Measurement, 120 Eglinton Avenue East, Toronto 310, conducts measurements of radio and television station audiences for the use of its members. Membership 530.
Canadian Advertising Advisory Board, 159 Bay Street, Toronto 116, advances the interests of the advertising industry as a whole and handles consumer complaints. Its membership, totalling 125, consists of the main media organizations and associations, individual advertisers and advertising agencies.
Canadian Advertising & Marketing Personnel Bureau, 67 Yonge Street, Toronto 215, services advertising agencies and marketing companies in personnel matters and staff recruitment. Most agencies operating in Canada are members.
Canadian Advertising Research Foundation Inc., 159 Bay Street, Toronto 116, conducts research into advertising and marketing techniques. Membership 12, representing industry organizations.
Federation of Canadian Advertising & Sales Clubs, Suite 369, Queen Elizabeth Hotel, Montreal, promotes the use of sound advertising and sales in Canada and acts as a clearing house of information for member clubs. Membership 33 clubs representing 6,500 members.
Professional Marketing Research Society, 369 Olive wood Road, Toronto 570, provides a forum for the development and advancement of marketing research and encourages the highest ethical practices. Membership 64.
THE FRANCHISE SYSTEM Agencies have traditionally placed national advertising with the mass media through a system of franchises granted by the media. With a franchise, the agency could collect the 15 per cent commission paid by the media for national advertising. That system, in the case of Canadian daily newspapers, was altered in April of this year. The broadcast media retain their regulations.
The Canadian Daily Newspaper Publishers Association in April exchanged the franchise system for what a C.D.N.P.A. officer calls "a simple credit listing system." As before, it requires
that agencies demonstrate degrees of solvency before they may place advertising in newspapers. An agency with an "A" rating will have net liquid assets exceeding immediate liabilities by at least $50,000. One in a "B" category will have working capital twice its anticipated monthly billings in newspapers. An agency that can meet neither of these conditions may yet be given a "C" rating; it may operate but must accompany an ad insertion order with a cheque for the full amount of the advertisement. The credit ratings are for the guidance of member newspapers, which may or may not grant the 15 per cent commissions and the 2 per cent discounts for paying in cash.
The C.D.N.P.A. has dropped other requirements that had gone with receiving a franchise. An agency need no longer prove that it has three or more national advertising accounts worth at least $150,000 annually, or that it spends at least $20,000 a year in daily newspapers. The C.D.N.P.A. no longer refuses business from "house agencies," or agencies that are subsidiaries of major companies (since April, it has given listings to Bo Claro, a subsidiary of Bristol-Myers, and to Drake Advertising, a subsidiary of Office Overload).
The Canadian Association of Broadcasters is the other major media association which lays down requirements for agencies. The C.A.B. continues to grant franchises although officers also say the system is in effect a credit rating system. The C.A.B. requires an applicant for national enfranchisement to show a net working capital position of at least $50,000. For regional enfranchisement, it requires $15,000 net working capital position. The Canadian Business Press Association does not insist on certain capital requirements in granting franchises to agencies wishing to use this medium.
The franchise system has been under discussion in the trade for many months. Some agency spokesmen have submitted that control by the media associations left the agencies powerless to maintain and improve standards within the profession. The C.D.N.P.A., however, says that as a watchdog of the professional and ethical aspects of advertising "we never really did have any control and we don't have it now." The .C.A.B. maintains a similar position.
While the C.D.N.P.A. has moved to meet pressures for change from the Institute of Canadian Advertising, the C.A.B. reports that no changes are imminent. One of the arguments put forward by the C.A.B. executive against change is that the I.C.A. does not fully represent the advertising agency trade and should therefore not be allowed to assume effective control over it. Warren Wilkes, President of the I.C.A., interviewed for this study, felt an organization with strong disciplinary powers would be valuable. (The I.C.A. does have its own Standards of Practice, but due to lack of appropriate machinery it is unable to discipline its members effectively.) Mr. Wilkes foresaw the possibility of the I.C.A. working with the provincial governments through legislation and regulation to establish such a strong nation-wide organization.
ADVERTISING AGENCIES
HISTORY
The first advertising agents appeared on the North American continent in the early 1800s when newspapers hired people to solicit orders for advertising. Some of the more astute individuals quickly realized that they could solicit orders for several publications as readily as for one and could make a good deal more money by performing this service on a commission basis than by working for a single paper. There was the additional advantage of enabling advertisers to buy space in a number of papers while dealing with only one person, thus saving time and trouble. The newspaper proprietors paid their agents 25 per cent commission for their services.
The newspaper agency system lasted from about 1841 to the l850s, but the commission system adopted by the first advertising agencies remains today. The newspaper agency was gradually replaced by a space-jobbing system in which the agent became the middleman. Instead of working for publishers for a commission he became a jobber working for his own profit, who sold space to advertisers and then bought space to fill his orders. This system, in turn, was replaced by one of space wholesaling in which the agent, anticipating the needs of the advertisers, bought space in large quantities and resold it to them as they wished, in smaller lots.
A further evolutionary stage was the advertising concession agency in which the agents contracted annually with the publications they represented to pay them a lump sum and take over most of the risk and management of the entire advertising space in the papers. In 1875, the firm of N.W. Ayer & Son, Inc., of Philadelphia, negotiated the first open-contract-plus commission plan. The agency agreed to place the advertising of Dingee and Conrad, a firm of Pennsylvania rose growers, for a year at the lowest prices that could be obtained from the publishers. For this service it would receive 12.5 per cent commission on the actual cost of the space. The firm experimented with different rates with various advertisers, the rates ranging from 8-12.5 per cent. N.W. Ayer & Son finally concluded that any business handled at less than 10 per cent was unprofitable, and in July, 1878, the first contract based on a 15 per cent commission was negotiated. The 15 per cent commission, which forms the basis of negotiation between advertising agencies and media associations today, has been in effect for eighty-seven years.
The development of the advertising agency business in the United States was matched by similar growth in Canada. As both the publishing and advertising business grew, it became apparent on both sides that some rules and regulations would be required to bring the relationship into a more secure association. The Canadian Association of Advertising Agencies was organized in 1905 and incorporated as a trade association in 1923. Membership consisted of national advertising agencies operating in Canada. In 1965 the by-laws were amended to allow expansion in membership and function and the name of the organization was changed to the Institute of Canadian Advertising.
MEMBERSHIP
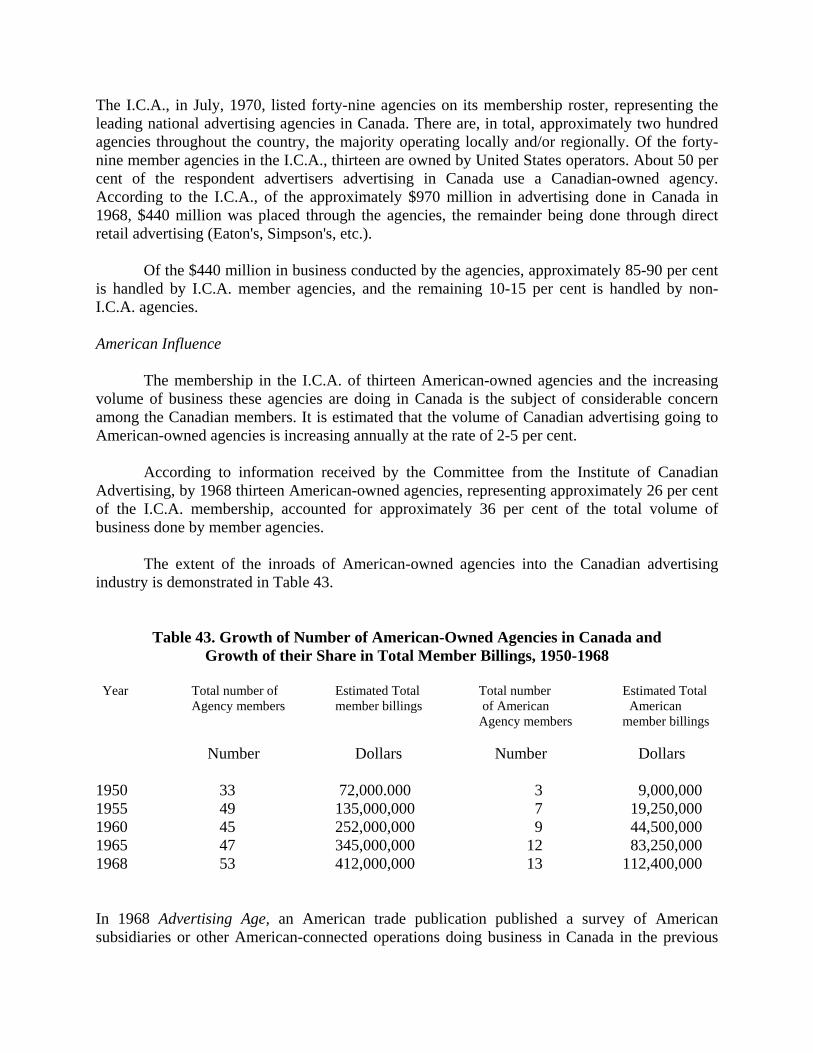
The I.C.A., in July, 1970, listed forty-nine agencies on its membership roster, representing the leading national advertising agencies in Canada. There are, in total, approximately two hundred agencies throughout the country, the majority operating locally and/or regionally. Of the forty-nine member agencies in the I.C.A., thirteen are owned by United States operators. About 50 per cent of the respondent advertisers advertising in Canada use a Canadian-owned agency. According to the I.C.A., of the approximately $970 million in advertising done in Canada in 1968, $440 million was placed through the agencies, the remainder being done through direct retail advertising (Eaton's, Simpson's, etc.).
Of the $440 million in business conducted by the agencies, approximately 85-90 per cent is handled by I.C.A. member agencies, and the remaining 10-15 per cent is handled by non-I.C.A. agencies. American Influence
The membership in the I.C.A. of thirteen American-owned agencies and the increasing volume of business these agencies are doing in Canada is the subject of considerable concern among the Canadian members. It is estimated that the volume of Canadian advertising going to American-owned agencies is increasing annually at the rate of 2-5 per cent.
According to information received by the Committee from the Institute of Canadian Advertising, by 1968 thirteen American-owned agencies, representing approximately 26 per cent of the I.C.A. membership, accounted for approximately 36 per cent of the total volume of business done by member agencies.
The extent of the inroads of American-owned agencies into the Canadian advertising industry is demonstrated in Table 43.
Table 43. Growth of Number of American-Owned Agencies in Canada and Growth of their Share in Total Member Billings, 1950-1968
Year Total number of Estimated Total Total number Estimated Total Agency members member billings of American American Agency members member billings Number Dollars Number Dollars 1950 33 72,000.000 3 9,000,000 1955 49 135,000,000 7 19,250,000 1960 45 252,000,000 9 44,500,000 1965 47 345,000,000 12 83,250,000 1968 53 412,000,000 13 112,400,000 In 1968 Advertising Age, an American trade publication published a survey of American subsidiaries or other American-connected operations doing business in Canada in the previous
year. The publication surveyed the top 125 American advertisers and their subsidiaries and divisions and received replies from 166 advertising and marketing executives. Approximately 88 per cent of the respondents said they advertise in Canada. Of those, more than 55 per cent said their American executives help make decisions on their Canadian advertising campaigns.
According to statistics obtained from Advertising Age and Marketing Magazine, in 1968, of the top sixteen advertising agencies, in terms of gross billings, five were American-owned. (It is interesting to note that the I.C.A. in 1968 requested its members not to release their annual gross billings because they were meaningless in terms of profit ratio. Nevertheless, Advertising Age, an American publication, compiled gross billing figures for agencies in Canada for 1967 and 1968, which are included in our table.)
An analysis of these figures bears out the contention of some Canadian members of the I.C.A. that at least some American-owned agencies are increasing their share of the volume of Canadian advertising at a rapid rate. The analysis reveals that six Canadian-owned firms, led by MacLaren Advertising Co. Ltd., the perennial leader during the period under examination, 1963-68, led the Top 16 in gross billings in 1968. In this period a Canadian-owned firm, Goodis, Goldberg, Soren Limited, was the fastest-growing agency in terms of gross billings, although it just made the Top 16 list in 1968, with billings of $8 million. However, between 1963, when its billings totalled only $2.46 million and 1968 its gross billings grew 254 per cent. Three American-owned firms follow Goodis, Goldberg, Soren Limited in volume growth. In second place is Ogilvy & Mather (Canada) Ltd., which grew 236.4 per cent ($4.4 million in 1963 to $14.8 million in 1968), although it stood only thirteenth on the Top 16 list. In third place is Spitzer, Mills & Bates Limited, having increased its gross billings by 137.3 per cent, from $8.2 million in 1963 to $19.6 million in 1968. It is followed, in fourth position, by McCann-Erickson Advertising of Canada Limited, at 77 per cent, having increased its gross billings from $9.6 million to $17 million.
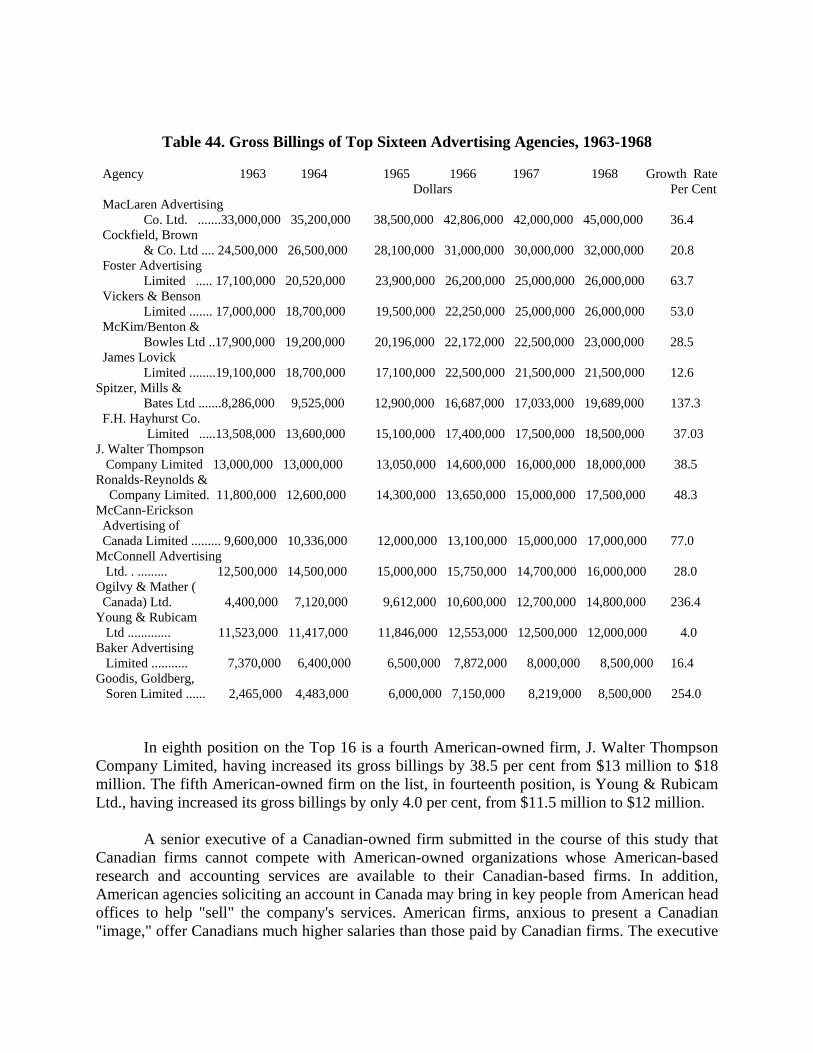
Table 44. Gross Billings of Top Sixteen Advertising Agencies, 1963-1968 Agency 1963 1964 1965 1966 1967 1968 Growth Rate Dollars Per Cent MacLaren Advertising
Co. Ltd. .......33,000,000 35,200,000 38,500,000 42,806,000 42,000,000 45,000,000 36.4 Cockfield, Brown
& Co. Ltd .... 24,500,000 26,500,000 28,100,000 31,000,000 30,000,000 32,000,000 20.8 Foster Advertising
Limited ..... 17,100,000 20,520,000 23,900,000 26,200,000 25,000,000 26,000,000 63.7 Vickers & Benson
Limited ....... 17,000,000 18,700,000 19,500,000 22,250,000 25,000,000 26,000,000 53.0 McKim/Benton &
Bowles Ltd ..17,900,000 19,200,000 20,196,000 22,172,000 22,500,000 23,000,000 28.5 James Lovick
Limited ........19,100,000 18,700,000 17,100,000 22,500,000 21,500,000 21,500,000 12.6 Spitzer, Mills &
Bates Ltd .......8,286,000 9,525,000 12,900,000 16,687,000 17,033,000 19,689,000 137.3 F.H. Hayhurst Co.
Limited .....13,508,000 13,600,000 15,100,000 17,400,000 17,500,000 18,500,000 37.03 J. Walter Thompson Company Limited 13,000,000 13,000,000 13,050,000 14,600,000 16,000,000 18,000,000 38.5 Ronalds-Reynolds & Company Limited. 11,800,000 12,600,000 14,300,000 13,650,000 15,000,000 17,500,000 48.3 McCann-Erickson Advertising of Canada Limited ......... 9,600,000 10,336,000 12,000,000 13,100,000 15,000,000 17,000,000 77.0 McConnell Advertising Ltd. . ......... 12,500,000 14,500,000 15,000,000 15,750,000 14,700,000 16,000,000 28.0 Ogilvy & Mather ( Canada) Ltd. 4,400,000 7,120,000 9,612,000 10,600,000 12,700,000 14,800,000 236.4 Young & Rubicam Ltd ............. 11,523,000 11,417,000 11,846,000 12,553,000 12,500,000 12,000,000 4.0 Baker Advertising Limited ........... 7,370,000 6,400,000 6,500,000 7,872,000 8,000,000 8,500,000 16.4 Goodis, Goldberg, Soren Limited ...... 2,465,000 4,483,000 6,000,000 7,150,000 8,219,000 8,500,000 254.0
In eighth position on the Top 16 is a fourth American-owned firm, J. Walter Thompson Company Limited, having increased its gross billings by 38.5 per cent from $13 million to $18 million. The fifth American-owned firm on the list, in fourteenth position, is Young & Rubicam Ltd., having increased its gross billings by only 4.0 per cent, from $11.5 million to $12 million.
A senior executive of a Canadian-owned firm submitted in the course of this study that Canadian firms cannot compete with American-owned organizations whose American-based research and accounting services are available to their Canadian-based firms. In addition, American agencies soliciting an account in Canada may bring in key people from American head offices to help "sell" the company's services. American firms, anxious to present a Canadian "image," offer Canadians much higher salaries than those paid by Canadian firms. The executive

said this is a major factor in raising agency costs in Canada. Yet another competitive factor is the rate of commission charged. Some American agencies work on the straight 15 per cent commission charged by their American parents. Most Canadian agencies, on the other hand, work on a 17.65 per cent commission, in order to meet their operating costs. One suggested method of redressing the competitive imbalance was application of taxes by the Canadian government to the management fees paid by the Canadian subsidiaries of their American parents.
A differing view on the competitive factors was expressed by the director of an American-owned firm based in Toronto. He acknowledged that Canadian-owned agencies are under pressure to compete internationally. (Some agencies, such as MacLaren Advertising Co. and Bradley Vale Ltd. of Toronto are operating successfully in Britain and elsewhere.) However, the director submitted that his firm is more or less self-sufficient. It does not use the resources of its American parent because Canadian advertising regulations differ from those in the United States, and material prepared for American audiences is not always suitable for Canadian audiences.
THE COMMISSION SYSTEM The commission system of payment to advertising agencies for their services, originally
developed for newspaper advertising, now applies to all the various media that carry national advertising. The commission paid by media is 15 per cent of the publisher's media rate. (The print media also grant to the advertiser a 2 per cent cash discount for payment of bills within thirty days.) This means that the agency pays eighty-five cents for each dollar's worth of space or broadcast time purchased for a client at the published rate. The agency bills the client one dollar and retains fifteen cents to pay for its service to both the medium and the advertiser. Under this system, the advertiser cannot buy space or time directly from the medium at less than the published rate; nor is the agency permitted to rebate any part of the commission to the advertiser. In addition, the agency receives a 15 per cent mark-up on the net costs of advertising production - photography, artwork, recording, etc. - which is done under agency supervision.
The commission system has been the target of some criticism. Those senior executives interviewed who criticized the system, described it as a form of price control or restraint of trade. One executive suggested the system was ludicrous, in that the agency works for the client but his income is derived from the media, and the amount of income is in direct proportion to the size of the client's advertising budget. In recent years some agencies and advertisers have abandoned the commission system in favour of a fee negotiated between agency and advertiser. Under this system the advertiser pays the agency for the time and work performed, rather than on the basis of the space or time purchased. The agency still receives the commission directly from the media but, in turn, deducts this income from the amount of the fee collected from the client. Other agencies favour a combination of fees and commission to fit specific situations.
Mr. Jack N. Milne, Managing Director of the I.C.A, in an official statement issued in August, 1969, said that the annual analysis of the operations of the member agencies indicated that the advertising agency business in Canada as a whole has not kept pace with the growth of the Canadian G.N.P. He noted that total Canadian advertising expenditure measured as a percentage of G.N.P., is not more than 60 per cent of the same rate in the United States. The
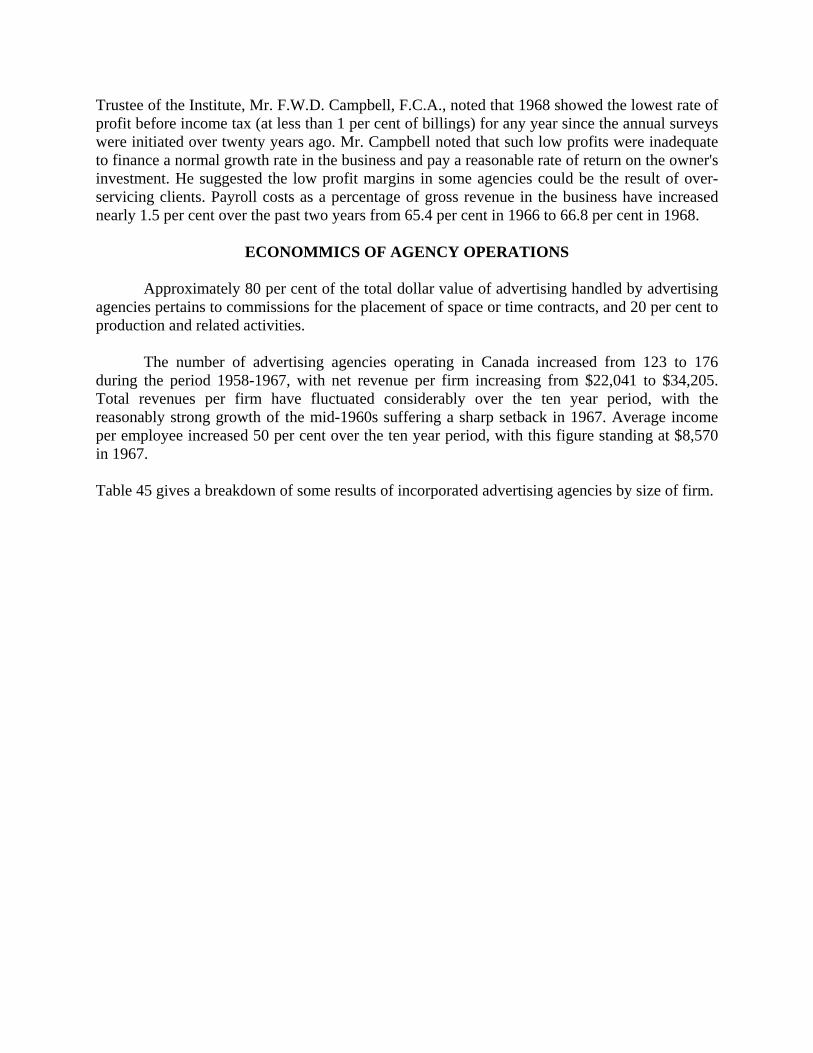
Trustee of the Institute, Mr. F.W.D. Campbell, F.C.A., noted that 1968 showed the lowest rate of profit before income tax (at less than 1 per cent of billings) for any year since the annual surveys were initiated over twenty years ago. Mr. Campbell noted that such low profits were inadequate to finance a normal growth rate in the business and pay a reasonable rate of return on the owner's investment. He suggested the low profit margins in some agencies could be the result of over-servicing clients. Payroll costs as a percentage of gross revenue in the business have increased nearly 1.5 per cent over the past two years from 65.4 per cent in 1966 to 66.8 per cent in 1968.
ECONOMMICS OF AGENCY OPERATIONS Approximately 80 per cent of the total dollar value of advertising handled by advertising
agencies pertains to commissions for the placement of space or time contracts, and 20 per cent to production and related activities.
The number of advertising agencies operating in Canada increased from 123 to 176 during the period 1958-1967, with net revenue per firm increasing from $22,041 to $34,205. Total revenues per firm have fluctuated considerably over the ten year period, with the reasonably strong growth of the mid-1960s suffering a sharp setback in 1967. Average income per employee increased 50 per cent over the ten year period, with this figure standing at $8,570 in 1967. Table 45 gives a breakdown of some results of incorporated advertising agencies by size of firm.
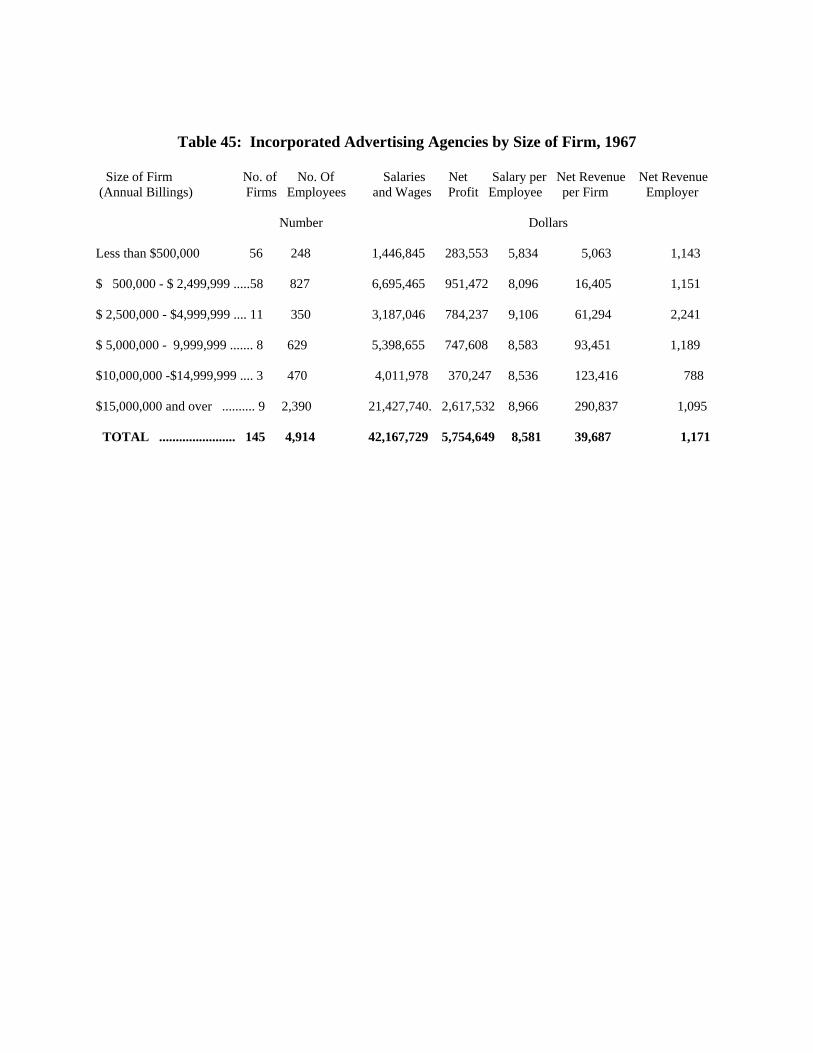
Table 45: Incorporated Advertising Agencies by Size of Firm, 1967 Size of Firm No. of No. Of Salaries Net Salary per Net Revenue Net Revenue (Annual Billings) Firms Employees and Wages Profit Employee per Firm Employer Number Dollars Less than $500,000 56 248 1,446,845 283,553 5,834 5,063 1,143 $ 500,000 - $ 2,499,999 .....58 827 6,695,465 951,472 8,096 16,405 1,151 $ 2,500,000 - $4,999,999 .... 11 350 3,187,046 784,237 9,106 61,294 2,241 $ 5,000,000 - 9,999,999 ....... 8 629 5,398,655 747,608 8,583 93,451 1,189 $10,000,000 -$14,999,999 .... 3 470 4,011,978 370,247 8,536 123,416 788 $15,000,000 and over .......... 9 2,390 21,427,740. 2,617,532 8,966 290,837 1,095 TOTAL ....................... 145 4,914 42,167,729 5,754,649 8,581 39,687 1,171
Table 46. Indices of Billings and Expenditures for Advertising Agencies, 1958-67
Year Advertising Index Commissionable Index Payments Index Commission Dollars Dollars Dollars Dollars 1958 ................... 504,417,000 100.0 233,789,000 100.0 23,826,000 100.0 35,227,000 15.1 1959 ................... 541,101,000 107.3 250,080,000 107.0 26,013,000 109.2 37,679,000 15.1 1960 ................... 573,684,000 113.7 267,756,000 114.5 28,252,000 118.6 39,994,000 14.9 1961 ................... 609,063,000 120.7 277,806,000 118.8 29,313,000 123.0 41,254,000 14.8 1962 .................. 642,613,000 127. 296,762,000 126.9 31,157,000 130.8 44,270,000 14.9 1964 ................... 725,711,000 143.9 311,332,000 133.2 33,171,000 139.2 46,597,000 15.0
While most of the data in this table are self-explanatory, the figures on net profit deserve some comment. These figures indicate that the largest firms, classified by total billings, tend to earn a lower net profit per employee than the smaller firms. The most profitable firms are the medium size firms, with an average of thirty-two employees per firm. These firms earned profits per employee of almost twice the overall average for all firms in 1967. These figures would indicate that there are diseconomies involved in large scale advertising agencies. These diseconomies likely are a result of the fact that advertising agencies are highly labour-intensive, giving rise to significant management and communication problems as size is expanded beyond a certain limit.
From Table 46 it can be seen that advertising agencies' commissionable billings did not grow as quickly over the ten year period covered as did total advertising expenditures.
Total advertising expenditures increased by 85.1 per cent from 1958 to 1967, while billings of advertising agencies increased by 79.7 per cent. This suggests a decline in the relative importance of advertising agencies in terms of total advertising. Partially this is due to a decline in the importance of national advertising relative to total advertising, a problem which will be discussed in more detail later.
As would be expected, the year to year fortunes of advertising agencies are closely tied to the buoyancy of advertising expenditures. 1967 was a poor profit year for advertising agencies, with average net profit per firm falling from $39,872 in 1966 to $34,205 in 1967. Commissionable billings of advertising agencies rose only 11.8 index points (1958=100) in 1967, as opposed to 16.2 index points in 1966. This decline in the rate of advance of commissionable billings, accompanied by an advance in payments to employees of 13.7 index points, contributed to the decline in profits in 1967. The decline in the rate of advance in commissionable billings can be directly attributed to the decline in the rate of growth of advertising expenditures. In 1966, advertising expenditures advanced by 23.5 index points, while in 1967 the advance was only 13.0 points.
Table 47: Commissionable Agency Billings by Medium, 1967 Type of Medium Total Commissionable Total Billings Gross National Billings by Agencies to each Medium Advertising Publications .............. 156,270,000 37.2 166,727,000·
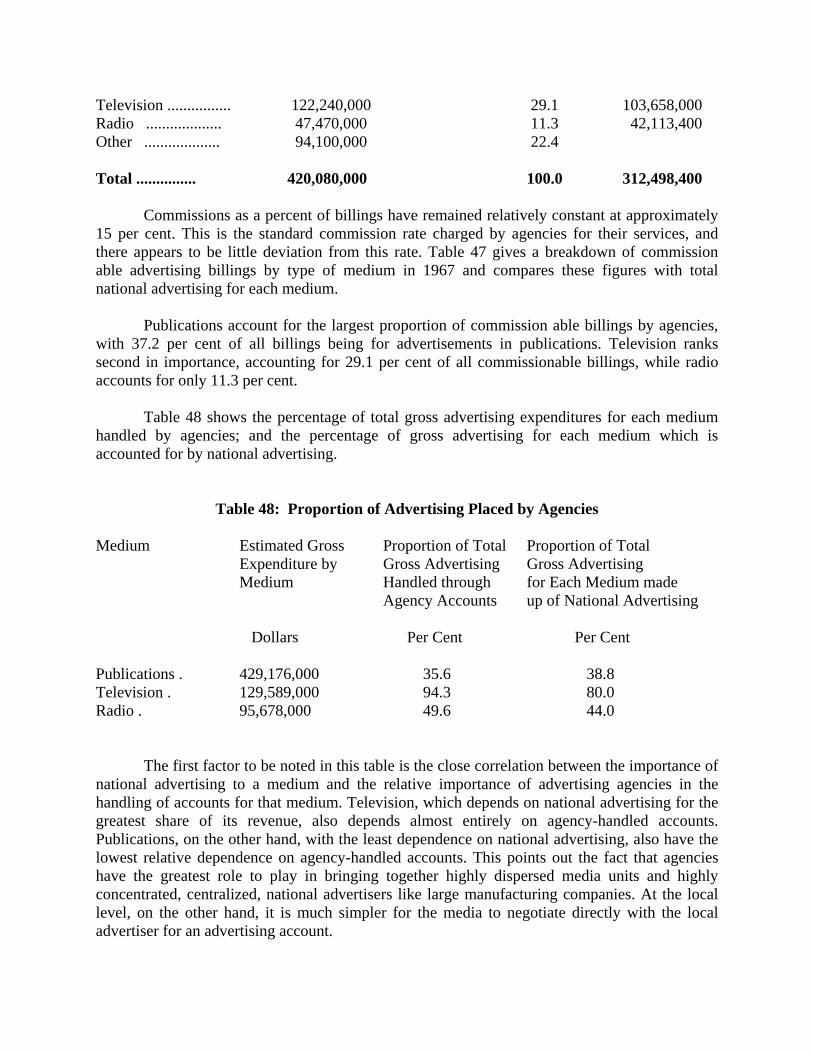
Television ................ 122,240,000 29.1 103,658,000 Radio ................... 47,470,000 11.3 42,113,400 Other ................... 94,100,000 22.4 Total ............... 420,080,000 100.0 312,498,400
Commissions as a percent of billings have remained relatively constant at approximately 15 per cent. This is the standard commission rate charged by agencies for their services, and there appears to be little deviation from this rate. Table 47 gives a breakdown of commission able advertising billings by type of medium in 1967 and compares these figures with total national advertising for each medium.
Publications account for the largest proportion of commission able billings by agencies, with 37.2 per cent of all billings being for advertisements in publications. Television ranks second in importance, accounting for 29.1 per cent of all commissionable billings, while radio accounts for only 11.3 per cent.
Table 48 shows the percentage of total gross advertising expenditures for each medium handled by agencies; and the percentage of gross advertising for each medium which is accounted for by national advertising.
Table 48: Proportion of Advertising Placed by Agencies Medium Estimated Gross Proportion of Total Proportion of Total Expenditure by Gross Advertising Gross Advertising Medium Handled through for Each Medium made Agency Accounts up of National Advertising Dollars Per Cent Per Cent Publications . 429,176,000 35.6 38.8 Television . 129,589,000 94.3 80.0 Radio . 95,678,000 49.6 44.0
The first factor to be noted in this table is the close correlation between the importance of national advertising to a medium and the relative importance of advertising agencies in the handling of accounts for that medium. Television, which depends on national advertising for the greatest share of its revenue, also depends almost entirely on agency-handled accounts. Publications, on the other hand, with the least dependence on national advertising, also have the lowest relative dependence on agency-handled accounts. This points out the fact that agencies have the greatest role to play in bringing together highly dispersed media units and highly concentrated, centralized, national advertisers like large manufacturing companies. At the local level, on the other hand, it is much simpler for the media to negotiate directly with the local advertiser for an advertising account.

The second factor to be noted is that broadcasters, and television broadcasters in
particular, tend to depend on advertising agencies for a considerable proportion of their non-national accounts. This arises out of the many technical variations and complexities to be found in television advertising, with the consequent dependence of television advertisers on the agencies for both advice and production work.
THE CANADIAN CODE OF ADVERTISING STANDARDS The Canadian Advertising Advisory Board was incorporated in 1957 by the Institute of Canadian Advertising and the Association of Canadian Advertisers. The Board consists of four directors from the I.C.A., four from the A.C.A., and one from each national media organization - the Canadian Association of Broadcasters, Canadian Business Press, Canadian Daily Newspaper Publishers Association, Canadian Weekly Newspapers Association, Magazine Advertising Bureau, Outdoor Advertising Association of Canada, Transit Advertising.
The Board administers the Canadian Code of Advertising Standards. Two industry councils, one English and one French, handle complaints and inquiries from consumers, competitors and government regarding the quality of advertising. Each complaint is investigated immediately, and issues that cannot be resolved at the staff level are referred to a meeting of the full Council. Media organizations have agreed not to run advertising that the Council has found to be in violation of the Code. A summary of complaints, since the Code was first issued in 1963 to June, 1969 follows:6 Disposition of cases
Sustained 14 Not sustained 35 Outstanding 15
64 Source of complaints
Consumers 28 Government 13 Manufacturers 5 Trade associations 14 Media groups 2 Better Business Bureau 2
64 Code Standards Invoked
False and misleading 46 Disparaging claims 9 Public decency 4 Human misery (exploitation) 2 Bait & Switch tactics 3
64

According to the C.A.A.B., investigation often reveals that the real complaint by
consumers is over poor service, or an attitude interpreted as disinterest on the part of management or the sales staff.
In the fall of 1969 the C.A.A.B. launched an intensive campaign to encourage consumers to register complaints. The campaign, which ran from October 1, 1969 to March 31, 1970, produced the following results: Total complaints received 793 Non-advertising complaints 137 For Council action 656 Disposition
Taste and opinion (non-actionable) . 188 Sustained (corrective action secured) . 59 Not sustained . 327 Pending (under review) . 44 No decision made . 38 656
Source of Complaints Consumer (Male 356, Female 264) . 620 Trade . 26 Business organizations . 6 Governmental bodies . 4 656
Major Complaint Areas CODE - Misleading . 286
Price . 53 Deceptive . 25 Bait and switch . 28
NON-CODE – Offensive . 64 Immoral . 51 Bad taste 33 Unrealistic . 28
Type of Advertising National advertising . 446 Retail (local) advertising ; . 210
Sustained Complaints Source: Consumer (Male 39 - Female 11) . 50
Trade . 8 Group . 1
National Advertising 25. Retail Advertising . 34
EDITORIAL ADVERTISING
One aspect of advertising in Canada is "editorial advertising," as practised in many Canadian daily newspapers. Under this practice, material with a news or editorial appearance is published in space paid for by one or more advertisers. Notable examples are the "Dining Out" column by Mary Walpole, a regular Saturday feature of the Globe and Mail, and the Toronto Star's "Shopping with Liz" column. In each case the "columnists" present in editorial style comment on specific restaurants and stores which have contracted to run an "advertisement." The effect has been that Mary Walpole was regarded by many Globe and Mail readers as that paper's authority on restaurants. It is only recently that the columns in both the Globe and Mail and the Star began carrying a small line of type indicating that the column is an advertising feature.
The Toronto Telegram every Thursday carries a full-page editorial advertising feature in the business section: "Perspective-A Business Forum." The page carries the note: "The editorial and advertising content of this page has, in its entirety, been prepared by Communications Research and Development Limited, an independent company which purchases this space from the Telegram." The page features special articles with illustrations, on particular businesses and organizations that are clients of Communications Research and Development Limited.
Related to the practice of editorial advertising is the common practice of newspapers to carry special advertising supplements and sections, in which specially prepared editorial material complements advertisements placed by an advertiser or a group of advertisers. Such lucrative advertising practice, particularly employed in some financial and business publications and in the travel sections of newspapers is known in the trade as "brass cheque" advertising. In some instances travel writers may gather editorial material on the spot, courtesy of airlines, government travel offices and resort operators.
CONTRA ACCOUNTS Another advertiser-media arrangement (sometimes involving agencies as well) that is believed to be relatively common but is difficult to quantify in a detailed way, is the contra-account practice. This arrangement involves a direct exchange of goods and services between advertiser and media or advertiser-media-agency, in which either no money, or less than the full regular value, changes hands.
For example, a restaurant or hotel might agree to placing an advertising program with a publication or broadcast station in which an agreed amount of space or time would be allocated, at regular or discounted rates, over a specified period of time. Rather than pay the advertising charges in the customary way, the advertiser provides meals or room accommodation to personnel of the publication or broadcast station. Each party keeps a simple debit/credit account and, at the end of the specified period, any balance due either party is paid in the customary way or enough additional goods and services are exchanged to bring the account into balance.
Other forms of the contra-account practice are reputed to involve such things as the provision of automobiles by auto manufacturers to media company personnel at no charge, or
substantially reduced lease rates or sale prices; the sale, at cost or lower, of consumer goods, appliances, etc., or an outright gift of products or services being advertised.
The I.C.A. has not concerned itself with the practice of contra accounts. One official suggested that if any arrangements did exist, they were set privately between the parties involved.
TELEVISION RIGHTS The arrangement of Maclaren Advertising Co. Ltd. of Toronto for the production of the National Hockey League telecasts is unique in the Canadian advertising business, if not all of North America. The agreement dates back to the early 1930 s when Jack Maclaren, then president of Maclaren Advertising, and Conn Smythe, owner of Maple Leaf Gardens, conceived the idea of a national radio broadcast of hockey games emanating from the Gardens.
Mr. Maclaren purchased the broadcast rights from Maple Leaf Gardens and then set out to sell the time to advertisers. General Motors agreed to be the sponsor and the Canadian Broadcasting Corporation agreed to carry the broadcasts. The show was an instant success and soon became a national institution. The original contract between MacLaren and Maple Leaf Gardens was renewed annually, but eventually it became renewable every five years. an arrangement that is still in effect.
MacLaren went on to obtain similar broadcast rights from the Montreal Forum. Imperial Oil subsequently replaced General Motors as sponsor of the broadcasts. With the advent of television, in 1952, the broadcast numbers became enormous, both in terms of audience size and the amount of money involved. According to George Sinclair, president of Maclaren Advertising Co. Ltd., the cost of the contract became so great that the advertiser signed contracts involving many millions of dollars directly with the CBC (and later with CTV) rather than through the advertising agency. MacLaren became, in effect, the agent, negotiating contracts, first for Imperial Oil, then for additional sponsors - Ford Motor Co. of Canada Ltd. and Molson's Brewery.
Maclaren now buys broadcast time and produces a "package" show that is carried on three networks: CBC English, CBC French and CTV, on Wednesday and Saturday nights, during the regular hockey season. As packagers, the agency hires the talent for the play-by-play commentary and the intermission fill-in. It negotiates with Maple Leaf Gardens and the Forum for camera placements and lighting.
Mr. Sinclair indicated there are a number of interests to be served in packaging the show, such as the two participating hockey teams, N.H.L. rules, various American teams that resent being part of a television entertainment package, the three sponsors and the three networks. It is the agency's responsibility to placate all these interests so the broadcasts can take place.
Mr. Sinclair said it was essential that one organization should negotiate with all these interests. The advertisers pay the total cost of the show. The agency is paid a commission for placing the show on the networks, and collects a fee for producing the package. The
responsibility for programme content rests with the agency, which hires the various commentators and guests. Mr. Sinclair described the show package as an "incredible trust" handed to Maclaren. The agency is subjected to "massive amounts of help" from both advertisers and the viewing public over the capabilities or otherwise of the commentators and guests. Mr. Sinclair indicated, without revealing actual cost figures, that the cost of producing the broadcast, measured by cost-per-thousand-viewers, is competitive with other television broadcasts.
ADVERTISER INFLUENCE ON MEDIA CONTENT On the occasion of his retirement as president of Eaton's, in August 1969, John David Eaton was asked if he had ever tried to use his power and influence to quash newspaper stories. "Instead of answering directly John David countered: 'Wouldn't you?' There were all sorts of things from their private lives that people wouldn't want to see in the paper. The frankness of this reply by the head of one of Canada's biggest retail advertisers is quite singular. His statement stands alone against statements and assertions by editors, advertisers and agencies interviewed for this study who disassociated themselves from any suggestion that some advertisers attempt, on occasion, to influence editorial or program content. "In all my years in the business I am not aware of any attempt by an advertiser to influence the press" was the repeated comment.
Nonetheless. it is a fact that the bigger the advertiser the more sensitive the media are to the relationship. The power and influence of such major retail advertisers as Eaton's and Simpson's and the food chain stores are demonstrated by the favourable positions their advertisements are given in the daily press across Canada. For example, the rear section pages of the newspapers are reserved exclusively for Eaton's and Simpson's and readers are conditioned to the location of these advertisements. The large food chains are given favoured treatment, usually beginning on Wednesdays, as they advertise their specials for the coming weekend. Again, the reading public expects to find these advertisements in the usual place, at the usual time. It should be noted that some papers charge a position rate, but it does not necessarily follow in all cases that these rates are enforced.
If advertisers wielded great powers over the newspapers in the past, this influence does seem to have diminished. For example, when Ralph Nader, the crusading American, made his first disclosures on automobile defects, naming names, the press carried the news stories on one page and automobile industry advertisements on another. Today, after recovering from its initial hostility and disclaimers, the industry itself has taken on the job of revealing certain defects in particular models and announcing their recall. It has had no apparent effect on advertising programs. In 1967, for example, General Motors again headed the list of the top 100 Canadian national advertisers, with an expenditure in all media of $9,056,544.
In this connection, however, a classic case of advertising nervousness popped to the surface in 1968 when the CBC rescheduled a particular episode of its series, Quentin Durgens, M.P., to avoid its coinciding with the introduction of a new line of automobiles. This particular episode was about auto safety. General Motors was the sponsor of the programme.
The CBC insisted that the advertising agency involved applied no pressure to have the show rescheduled. The corporation said it made the decision itself.
In the early days of radio broadcasting an advertiser, who paid all the production costs of the show, exercised direct control over content, and taxed the writers' and producers' creative abilities by trying to get in as many commercials, either directly or indirectly, as possible into his allotted time slot.
However, the tremendous costs involved in television programming preclude all but the biggest and wealthiest advertisers from producing a package show. Today the common practice is for the advertiser to purchase "spot" time - usually thirty or sixty seconds -- in the programme he considers will be seen by the audience he is trying to reach.
Here, the advertiser can wield considerable influence. Stanley E. Cohen, Washington editor of Advertising Age, speaking to a private Toronto group recently, submitted that the advertiser's influence rests in his capacity to withhold support.
According to Mr. Cohen, the advertiser has certain incentives to exercise this power:
1 He wants a favourable environment for his commercials.
2 As a part of the business establishment, he may be reluctant to be associated with "progressive" ideas.
3 The advertiser and his agency normally wish to avoid personal responsibility for failures or controversy.
There are some notable exceptions. In the summer of 1968 Xerox Corporation sponsored a series, ''Of Black America," which was presented by the Columbia Broadcasting System. The series, an attempt to set the record straight on the history of the black man in America, was highly successful, despite its controversial theme. There was one notable reaction to the series: the headquarters of the Ku Klux Klan ordered Xerox to remove its copying machine from its premises.
Xerox of Canada Ltd. also sponsors programs that are considered avant-garde and thought-provoking; yet have the desirable effect of improving not only the image of television but also the image of Xerox.
The influence of the advertiser's dollar is manifest in different ways. The current example is the controversy raging in both Canada and the United States over cigarette advertising.
The controversy is producing· interesting contrasts. On August 29, 1969, the New York Times announced that all cigarette advertisements it publishes, beginning January 1, 1970, must carry a health warning as to the tar and nicotine content of the cigarette smoke. At that time the Times said it would accept the warning that the U.S. Government requires on cigarette packages - "CAUTION: cigarette smoking may be hazardous to your health" - but it believed the warning to be inadequate. The newspaper, in its editorial, urged that a stronger warning be required not only on cigarette packs but in all cigarette advertising as well.

An interesting follow-up to the Times' statement occurred on November 6, 1969, when the U.S. Senate Commerce Committee voted to outlaw cigarette commercials from broadcasting media after January 1, 1971. At the same time it adopted a newly-worded health warning for cigarette packs, which will now say: "Excessive cigarette smoking is dangerous to your health."
Here in Canada,· the Federation of Canadian Advertising and Sales Clubs, meeting in Kitchener on January 30,1969, passed a resolution opposing any federal ban on radio and television cigarette advertising.
According to a Canadian Press despatch,
the 26 delegates from across Canada supported a resolution saying it would be discriminatory for the government to eliminate advertising of any particular product from any selected medium. It supports a position recently taken by the C.A.B. that if Parliament is convinced cigarettes pose a clear and present danger to the health of the Canadian public the Commons should prohibit cigarette sales entirely.
The C.A.B., in a brief to the Commons Health Committee on May 27, 1969, submitted
that any prohibition of cigarette advertising on radio and television would be ineffective and discriminatory against one segment of the communications media.
On the one hand, in the case of the New York Times, the advertiser's dollar has obviously little influence on the newspaper. In the case of the C.A.B., supported by the Federation of Canadian Advertising and Sales Clubs, it would appear to have considerable influence.
Mr. Cohen, in his Toronto talk, noted that in the case of television programming there are some built-in restraints against an advertiser abusing his power. One is counter-power. The more popular the artist or programme, the less prospect that these artists or programmes will be responsive to the advertiser's threats. Because the advertiser lives in constant fear of public opinion he will not carelessly expose himself to criticism by engaging in any action which could lead to bad publicity. For example, he does not want to be held responsible if a popular programme or artist is taken off the air. And, concluded Mr. Cohen, regulatory agencies and legislative bodies themselves have the authority to move in on any power-wielding advertiser.
Chapter 3:
THE REGULATION OF ADVERTISING
INTRODUCTION At a rapidly quickening pace the Canadian mass market-place is altering its basic premise from caveat emptor -let the buyer beware - to caveat venditor - let the seller beware. During the past twenty years, the regulation of advertising, and the zeal with which regulation has been enforced, have steadily grown. The present, and particularly the future, implications for both the mass media and society in general would appear to be considerable. So far, however, relatively little research has been done in the field.
A complete analysis of all forms of advertising regulation would have been far beyond the terms of reference, resources and time span of this study. This paper does provide an over-view of the wide range of government departments and agencies now empowered to control various classes and kinds of advertising matter. It goes on to pose certain questions that arise from this control, actual and potential. The federal role is examined in greater detail than that of provincial governments, but the greater amount of space accorded the higher jurisdiction should not blur the very real fact that provincial power and inclination in this field is great and growing.
THE FEDERAL ROLE
CANADIAN RADIO-TELEVISION COMMISSION The broadest and most absolute powers of advertising regulation in Canada are conferred upon the C.R.T.C. in Section 16 of the Broadcasting Act and apply to all radio and television commercials.
Under Section 16, the Commission may, in theory, exercise the most minute control over both the character of broadcast advertising and the time allotted to it.
The implications in terms of the nature of and the revenues from advertising, are tremendous. The operating reality is less awesome. The Commission in fact regulates time allotment in a manner which permits substantial revenues to accrue to broadcasting stations. It has not turned itself into a monolithic clearing house which passes judgment upon each commercial message, but has instead delegated authority in certain fields to other agencies (Food and Drug Directorate, Combines Investigation Branch).
For these reasons the general activity of the C.R.T .C. is not dwelt upon at length in this paper.
COMBINES INVESTIGATION BRANCH
A major initiative in advertising regulation applicable to all media and to almost all conceivable types of advertising is now taking place under the authority of this Branch of the Department of Consumer' and Corporate Affairs. If sustained, the policy thrust of 1969 will come to have considerable social significance in the 1970s, and will influence both media operator and advertiser accordingly.
The department proposes to interpose itself in the public marketplace between consumer and merchant with the express aim of protecting the interests of the former. Its statutory vehicles in this regard include the Hazardous Products Act (including such matters as poisonous compounds for household use), the Precious Metals Marking Act (definitions of sterling, and karat weight, for instance), the National Trade Mark and True Labelling Act, and the Weights and Measures Act.
In 1969, the enforcement of regulations concerning food under the Food and Drugs Act was transferred to this Branch from the Food and Drug Directorate of the Department of National Health and Welfare.
Finally, and most important, the Branch administers the reconstituted Combines Investigation Act.
Section 33C, added in 1960, has already been employed in a number of successful court cases:
(1) Everyone who, for the purpose of promoting the sale or use of an article, makes any materially misleading representation to the public, by any means whatever, concerning the price at which such or like articles have been, are, or will be, ordinarily sold, is guilty of an offence punishable on summary conviction.
This is aimed at such devices as "compare price at.,.," "below regular price, .. ," and other
familiar advertising techniques. The history of enforcement, which is more intensive than may be commonly supposed by the public (see below), may be found in detail in the annual reports of the Director since 1960.
The newest weapon is Section 33D of the Combines Investigation Act, which until July 31, 1969 was Section 306 of the Criminal Code. The section makes it an indictable offence, punishable with imprisonment for up to five years, to publish or cause to be published an advertisement containing a statement that purports to be a statement of fact but that is untrue, deceptive or misleading or is intentionally so worded or arranged that it is deceptive or misleading.
The Section provides for summary conviction of persons who publish or cause to be published a statement or guarantee of performance, efficacy or length of life of anything not based on an adequate and proper test of the article concerned.
During a long life in the Criminal Code this section, largely in the hands of provincial
attorneys-general, was rarely enforced.
Its new home in the Combines Investigation Act continues the provincial enforcement role but shares it fully with the Director of the Combines Investigation Branch who is, under other provisions of that Act, compelled to conduct an investigation upon receipt of a complaint.
The philosophy of the department is made clear in two appended documents. A news release dated July 31, 1969 by the Minister of Consumer and Corporate Affairs makes clear a determination not only to enforce 33D but to test its provisions systematically before the courts with a view to early repair of such h:gislative deficiencies as may be revealed by the judiciary.
The second document, Notes for an Address to the Broadcast Executives Society, November 12, 1969, by D.H.W.Henry, Q.C., Director of Investigation and Research under the Combines Investigation Act, is particularly useful both in its statement of a deliberate enforcement policy of the foregoing and other provisions, of the manner in which this is to be done - and in the implications the reader may take from it as to the possible future course of policy.
FOOD AND DRUG DIRECTORATE A description of the regulation of food advertising is included in this section because the relevant experience lies here, although the function has since been transferred to the Combines Branch. Enforcement under Combines follows the same course as is described here.
The Directorate now deals with advertising in the fields of drugs, cosmetics and devices (the latter involving largely the paraphernalia of mechanical birth control). For many years this directorate has held sweeping - but commonly accepted and uncontroversial - powers to limit, control, rewrite or ban outright mass media advertising of every sort in the fields listed above.
The authority derives from the Health and Welfare Department Act, the Food and Drugs Act. (and regulations thereto), the Proprietary or Patent Medicine Act, the Criminal Code of Canada, the Broadcast Act and regulations thereto. In all cases, as in the Combines legislation above, the sanction is against the advertiser, not the medium that accepts the advertising, although the methods of enforcement in. the broadcast field differ sharply from the print field.
The general tenor of advertising restriction in Canada is similar to that of every country in the Western Hemisphere. Specifically, though, Canada is unique in that it has developed a list of 45 diseases or conditions for which a cure may not be advertised in any circumstances, even if a cure is professionally acknowledged to exist. The rationale of the latter point is that the general public is not capable of diagnosing for itself the condition to be treated.
The various Acts constitute statements of intent but have been refined by regulation to make possible the statement: "No person shall label, package, treat, process, sell or advertise any food, drug or device in a manner that is false, misleading or deceptive or is likely to create an
erroneous impression regarding its character, value, quantity, composition, merit or safety." - Guide for Manufacturers and Advertisers, Food and Drug Directorate, 1961.
In addition, whole classes or kinds of drugs or devices may not be advertised. This includes narcotics and experimental drugs. In the field of cosmetics the main emphasis of practical enforcement has been against claims of a quasi-medical nature. Although the Directorate is "concerned" by certain of them, claims as to the results of cosmetic use in terms of beautification have not so far been challenged, on the theory that the user is competent to judge the question for him or herself.
Close liaison is necessary between Food and Drug and Consumer Affairs in deciding what is a drug and what is a food. Generally speaking, jurisdiction passes to Food and Drug if the food substance contains any non-natural or generic additives whatsoever, such as added vitamins, artificial sweeteners, etc.
Advertising enforcement methods, insofar as they apply to the mass media, are interesting. So far as radio and television advertising is concerned the Food and Drug Directorate has absolute control because under Broadcast Act regulations it acts as a clearing agency for the C.R.LC. No advertisement in the areas of jurisdiction may be broadcast until the script has been approved by the Directorate. The Combines Branch also acts as an agent of the C.R.T.C., in watching for instances of economic fraud in advertising.
In the food field two officials dedicated 90 per cent of their time vetting 9,618 commercials in the six-month period ending March 31, 1969. In the drug field, another two persons spent an equivalent amount of time screening 3,446 commercials during the same period. Although in theory an advertiser whose commercial has been rejected might appeal to the C.R.T.C., in practice Food and Drug is conceded to wield full authority to reject, accept or amend as it pleases and the advertiser has no effective recourse.
The Directorate concedes that a double standard exists in the case of print advertising. Here there is no requirement to submit advertising material. In practice, the Directorate does run an advisory service and many large advertisers submit their copy to it as a matter of course.
Sometimes the Directorate lets it be known informally in the trade that it intends to take a particular interest in a certain type of advertising campaign. This happened when fluoride toothpastes were introduced, and the campaign relating thereto was worked out in close collaboration between the manufacturers, their ad agencies and the Directorate, which was concerned lest too extravagant claims be made for this new product.
Conversely, though, the advisory service is just that: it cannot issue a restraining order even if it inspects beforehand advertising copy to which it takes exception. Figures are not available but the Directorate concedes that "fairly often" a print advertiser will say that he disagrees with a Directorate interpretation of the regulations and proposes to go ahead and advertise.
The only course then open to the Directorate is prosecution under the Food and Drug Act or other authorizing statutes. Again, no statistics are available but it was inferred that where there is an area of genuine dispute with a determined antagonist the Directorate is extremely reluctant to go to court.
There are two reasons. First, if the case is lost, a new line of greater freedom has thereby been drawn for all advertisers. Second, there is an evident fear that a good many of the regulations upon which the policy is based have never been tested in court and may in fact be illegal.
Several cases have been prepared on what the Directorate thought were good grounds, only to be over-ruled by the Department of Justice because the regulation itself might be defective and the judicial over-turning of it might place the entire policy in jeopardy.
These problems result in greater latitude in print advertising than in broadcast commercials; and the Directorate agrees that this, coupled with the inflexibility of the broadcast preview system, is a source of irritation to ad agencies and manufacturers.
Over many years there has been no serious challenge of the right of Parliament, through the Directorate, to limit advertising. This is interesting in view of the legal doubt about the validity of certain regulations.
It must be said that the attitude of the persons interviewed appeared to be that of men reasonable in attitude and fair by inclination, entirely willing to be persuaded that certain classes and kinds of materials should be removed from prohibited lists. For instance, there was open satisfaction that recent amendments to the Criminal Code will make it possible soon to devise a schedule of mechanical birth control apparatus which will become eligible to be advertised.
This was considered socially desirable and the limitation was considered to mitigate .unfairly against domestic manufacturers of such apparatus competing against American manufacturers who are able to advertise in the women's magazines which enter Canada in large number. It was agreed that this also constituted a form of discrimination against Canadian magazines attempting to compete with these American imports for advertising revenue.
There exists, of course, an assortment of other federal statutes which have at least a peripheral influence on certain types of advertising (that is, a federally chartered limited company must state that it is limited) but these were not considered germane to the main thrust of this study.
THE PROVINCIAL ROLE As noted earlier, a detailed study here was impossible. However, it is a field of great magnitude and cannot be ignored in any examination of the regulatory picture.
In one province alone, Ontario, a considerable variety of advertising regulation exists. Control of advertising in at least some degree is exercised by The Liquor Control Board of

Ontario, Ontario Human Rights Commission, Ontario Board of Film Censors, Ontario Superintendent of Insurance, Ontario Department of Transport, Financial and Consumer Affairs Department, Ontario Securities Commission, Ontario Police Commission, Ontario Racing Commission, and others.
Most other provinces have similar, if not exactly equivalent, assortments of regulation. Some go farther. Alberta, for instance, has in force a wide-ranging set of provisions in the consumer protection area, which involve surveillance of retail advertising to detect such banned practices as the issuance of trading stamps and the holding of a wide variety of contests, promotional gimmicks, "free" offers, and so on.
It should be noted, too, that in some areas provincial enforcement can be far more subtle, and absolute, than that which exists so far at the federal level. Some industries are under total provincial control. Brewing and distilling are examples.
Much of the federal enforcement must in the end revolve around open argument in open court. At the provincial level, numerous stories of different methods are too persistent to ignore, although they are almost impossible to impartially document.
In some provinces, for example, it has been said frequently that persons connected with alcohol, either at the primary distilling level or at the drink·by the-glass retail level, may be subjected to painful scrutiny by liquor boards if critical comments about the regulations applicable to them appear in the news columns of papers or on broadcast news.
The implications here concerning the freedom of the press and the access of the individual citizen to the press for the airing of his grievance are obvious.
THE NEWSPAPER AND BROADCAST ROLE For many years publishers and broadcasters, both individually and as groups, have possessed codes of advertising conduct which list various conditions under which advertising will or will not be accepted. These constitute perfectly reasonable statements of intent, but they are not reproduced as part of this paper for two reasons. First, various people in the industry have made known their intention to bring these codes to the attention of the Committee directly. Second, the codes are largely irrelevant in the context of the regulatory debate. Almost every article of them begins with the word "knowingly" or a similar disclaimer. Had these codes achieved the desired results, in the eyes of Parliament, the new initiatives in regulation would presumably not have been required.
The role of media in actually covering as news the judicial enforcement of advertising law and regulation appears to be ambiguous. One major purpose of prosecution by an agency such as the Combines Investigation Branch is that of deterrence. In the case of many matters before the courts, this principle is duly noted by the press and the final adjudication is given major prominence in news coverage. No detailed analysis has been conducted in conjunction with this study, but the impression that media tend almost completely to ignore, or reduce to microscopic proportions, convictions since 1960 under the Combines Investigation Act, #33C -

for instance - is so widespread as to suggest that representatives of the media might be asked to demonstrate otherwise, if they care to do so. The reasons for this may be two-fold. There may be a human reluctance to embarrass a good customer. Or there may be a reluctance to suggest, through prominent coverage, guilt by association, because for the prosecution to succeed the ad must indeed have been published. Thus, news coverage may carry with it the implication that misleading advertising was in fact foisted upon readers, listeners or viewers by the very newspaper, radio station or television station reporting the court case. Such an implication raises certain questions. (See discussion below.)
DISCUSSION - TWO SIDES OF A COIN
INTRODUCTION
The rationale of almost all advertising regulation is protection, in one way or another, of the consumer. In practice, this concept has seldom been seriously challenged in Canada. However, the specific protection of the rights of one group within society always carries with it the possibility, however remote, that the rights of other groups may in the process be injured.
In this context, questions may be asked. Does freedom of the press as understood in Canada confer upon the publisher the right, and even the duty, to publish commercial messages as he sees fit - within certain obvious legal limitations which apply also to his news columns? In a mercantile system that renders the manufacturer or purveyor of goods uniquely dependent upon advertising for commercial success, should a lawful concern engaged in lawful enterprise not enjoy a clear right to advertise?
There exists in the field of advertising regulation a theoretical threat both to freedom of the press and to the right to conduct lawful business. No attempt is made here to quantify or qualify this threat, but examples are provided for purposes of discussion.
THE CONDUCT OF BUSINESS Government regulation
In the main areas of federal legislation a double standard has been shown to exist. Under the Food and Drugs Act, broadcast commercial messages simply may not be shown until approved. Right of appeal to the C.R.T.C. exists but the question may be asked whether in practice, media dependent for their very existence upon this body care to occupy its time in appeals of this nature. Certainly, no record of such an appeal can be found.
Therefore much depends upon the enforcement officials themselves. Their attitude and outlook can have the practical effect of altering the nature of commerce in certain cases. It must be stressed that the attitude encountered everywhere in this study, at the federal level, was one of fairness. But people can change and the regulations under which they function would appear to confer considerable latitude to personal opinions in the enforcement field.
Voluntary Enforcement
This involves the refusal of individual media to accept advertising for various reasons. Only seldom does such refusal enter public prominence, but it enjoys in fact a long historical existence.
When publishers gather there is often mention that this or that fly-by-night concern has in effect been banished from a community by the refusal of the media to accept its advertising. On the face of it, this is an eminently laudable objective; a responsible exercise of a publisher's duty to protect his readers, listeners or viewers. There is no reason to doubt that the great majority of such refusals fall into this category.
But there are also subjective reasons for suspecting that in some cases the fly-by-night banishment stems from other motives.
A fledgling community business concern challenging the methods, and perhaps pricing, of established firms might in theory be confronted by hostile publishers responsive to the complaints of old and valued advertisers that the new concern was "unethical." The interloper could then be refused advertising space without the question of its ethical probity ever having been submitted to a court of law.
A much more visible example occurred in Canada recently when the CBC television network and privately-owned CFTO-TV in Toronto announced that they would no longer accept cigarette advertising during prime-time hours. This was very much in keeping with the thrust of government educational efforts and a visible social attitude in respect to cigarettes. Little open protest was heard. Yet the manufacture and sale of cigarettes is a lawful undertaking in this country, subject to certain conditions as to the age of the customer, etc. The corporation so engaged is a creature of law and is in theory subject only to such restraints as are contained in law. In this case, however, these corporations were informed that they would be denied access to their market-place at a time and through a medium previously considered by them to be valuable judging by the volume hitherto of prime-time television cigarette advertising. The decision was not one of law, and thus appealable through the judicial or political process, but one of private, extra-legal social judgment.
Morever, it can be argued that the broadcasters who made the judgment suffered no revenue loss. They may even have gained. The prime time thus vacated was immediately available to other advertisers previously unable to obtain as much of the over-subscribed prime-time as they wished. It is conceivable that some of this time may have been sold at rates higher than were paid by the cigarette companies who were presumably able to achieve discounts by virtue of their enormous advertising purchasing power. The decision may also have had the effect of forcing the cigarette companies into the daytime and late night broadcasting hours, which are more difficult to sell.
This paper holds no brief for cigarettes. The example is used only to suggest that altruism, profit, and the rule of law are not always bedfellows and that in theory at least the accomplished fate of one industry might be the future fate of others.
The Media as Enforcer
The earlier-noted speech by Mr. D.H.W. Henry is worthy of examination in another context. It was delivered to advertising executives and suggested strongly that advertising agencies might in future be called upon to help enforce the deceptive and misleading advertising sanctions of the Combines Investigations Branch in their own self-interest.
Mr. Henry made clear that his Branch might in future consider advertising agencies to be party to illegal advertising, and that agencies involved in the preparation of such advertising might be charged before the courts accordingly.
While attributing no motives to Mr. Henry personally, it would not seem unfair to speculate about the direction in which this speech appeared to be taking the enforcement process.
As matters now stand the enforcer must go through the time consuming business of tracing each potentially deceptive, misleading or untruthful advertisement back to its originating source, perhaps a retailer, perhaps a manufacturer.
Administratively, it would be much more convenient to concentrate enforcement procedures upon one class or kind of person or company which would then be compelled, upon pain of conviction itself, to regulate those companies submitting material to it.
The upheld conviction of an advertising agency would immediately cause all agencies to police their clients a great deal more carefully. But a great deal of advertising does not go through agencies.
The upheld conviction of a newspaper, radio station or television station would be far more effective, and would place the advertising departments of each medium in the position of being the final arbiter of legality on pain of conviction themselves.
It is true that the legislation now specifically exempts the medium that publishes the advertisement in good faith. It is vulnerable only if it "knowingly" accepts advertising deficient in the eyes of the law.
But ignorance of the law is no defence. In a few years, once a body of case law has been developed by the random prosecution of individual offenders, might it not be possible to say to publishers, in effect, "it is now possible for you to know or not to know that which is misleading, deceptive or untrue and we will henceforth begin to prosecute, in certain areas, those who publish such advertisements?"
This could, in theory, have the effect of turning each advertising department into an enforcement arm for the government agency. But such a development could hold wide ramifications in respect to the conduct and freedom of the press.

Section Two: THE PRINT INDUSTRY
Chapter 1:
ENDS AND MEANS
The following section discusses economic conditions and economic factors in the daily newspaper and periodicals publishing industry. The data in this section apply to publishing establishments which both print and publish their respective newspapers and periodicals. Any establishments that only print or only publish particular newspapers and periodicals are not included.
The data contain the results for 99.7 per cent of the daily newspapers in Canada considered in terms of total revenue. They contain also the results of 71.0 per cent of weekly newspapers considered in the same way. Publishers of magazines and other periodicals tend to do much less of their own printing, with the result that these results include less than 50 per cent of the other periodicals classified by total revenue. Newspapers as a whole account for 75 per cent of the data included in this section. As a result the conclusions are most applicable to daily newspapers.
It would have been desirable if the data could have been separated for each type of publication so that the results could have been applied with complete accuracy to groups of firms publishing each type of publication; but two problems arise in doing this. First, the data used to make the calculations are aggregated by statisticians in the Dominion Bureau of Statistics to include all firms that both print and publish newspapers and periodicals. An attempt to go back and disaggregate this data was beyond the time and financial resources available. Second, such a disaggregation is not possible in many cases, since a number of establishments print and publish a number of different types of periodicals. An attempt to allocate costs between types of periodicals would require arbitrary allocations that would not contribute realistically to the analysis undertaken.
Chapter 2:
REVENUE
CIRCULATION REVENUE
Aspects of Circulation, 1900 – 1969 Circulation is important to newspapers, both because of the revenues generated directly through circulation sales and because of the relationship of demand for advertising space to the amount of consumer market coverage provided by the paper. As a result, an effort has been made to establish underlying trends in the circulation of daily newspapers and in the factors affecting circulation.
The twentieth century has been a period of general success for daily newspapers in Canada. Total circulation of daily newspapers has grown at a rate faster than the growth in population, giving rise to a marked increase in circulation-per-capita. Much of this growth has come through expanded circulation of existing papers, with the result that the average circulation-per-paper has also become larger. Chart 5 shows the trends in growth of total population, urban population, and of circulation of daily newspapers since 1900. (The data are plotted on a vertical logarithmic axis to permit comparison between rates of change.) Up until 1950, growth in circulation tended to follow, in a rough sort of way, the growth of population in urban centres. Since 1950, this relationship has not been maintained. The period 1955-60 in particular was one of very slow circulation growth, accompanied by a sharp decrease in the proportion of circulation to population in urban centres. The rate of growth in circulation in this period was the lowest since the 1930s, a decade during which the rate of growth in circulation was negligible.
Since 1960, the rate of growth in circulation has increased somewhat, but it is still not equivalent to the great boom in circulation that occurred between 1940 and 1955. The strongest competitor cutting into the circulation of dailies during the post-1955 period has no doubt, been television.
The data on circulation growth during the twentieth century are summarized in Table 49, which contains indices of circulation and per capita circulation in Canada for selected years.
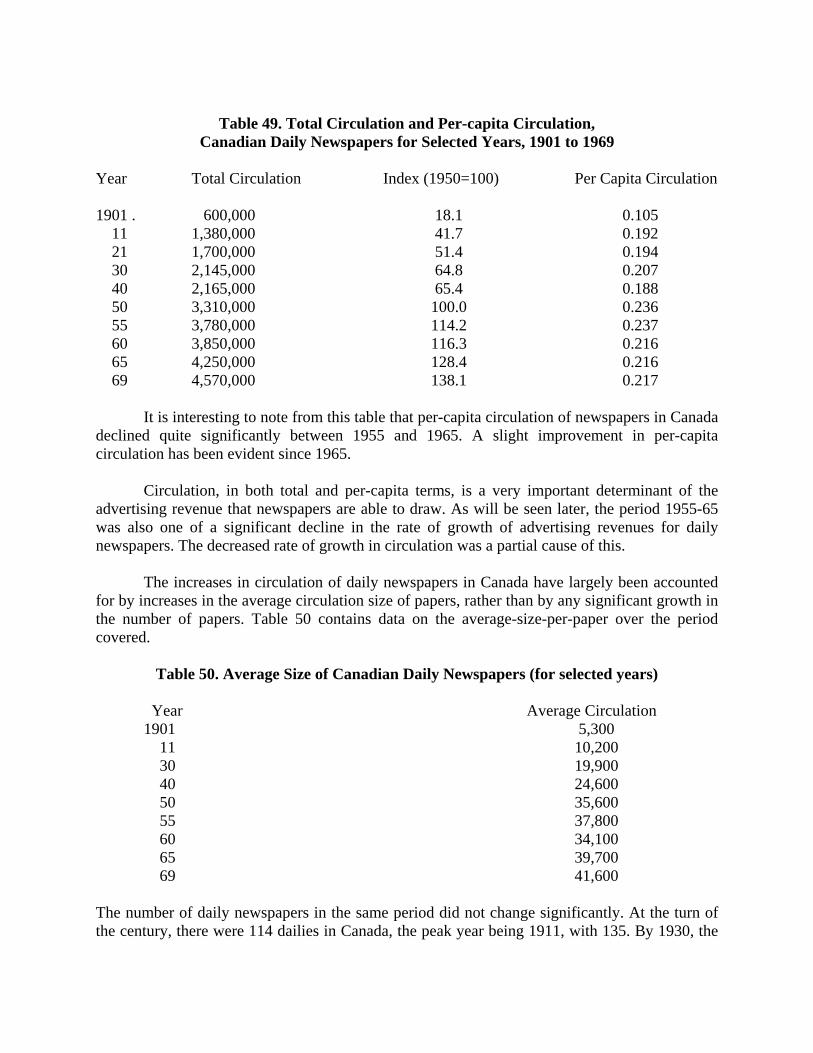
Table 49. Total Circulation and Per-capita Circulation,
Canadian Daily Newspapers for Selected Years, 1901 to 1969 Year Total Circulation Index (1950=100) Per Capita Circulation 1901 . 600,000 18.1 0.105 11 1,380,000 41.7 0.192 21 1,700,000 51.4 0.194 30 2,145,000 64.8 0.207 40 2,165,000 65.4 0.188 50 3,310,000 100.0 0.236 55 3,780,000 114.2 0.237 60 3,850,000 116.3 0.216 65 4,250,000 128.4 0.216 69 4,570,000 138.1 0.217
It is interesting to note from this table that per-capita circulation of newspapers in Canada declined quite significantly between 1955 and 1965. A slight improvement in per-capita circulation has been evident since 1965.
Circulation, in both total and per-capita terms, is a very important determinant of the advertising revenue that newspapers are able to draw. As will be seen later, the period 1955-65 was also one of a significant decline in the rate of growth of advertising revenues for daily newspapers. The decreased rate of growth in circulation was a partial cause of this.
The increases in circulation of daily newspapers in Canada have largely been accounted for by increases in the average circulation size of papers, rather than by any significant growth in the number of papers. Table 50 contains data on the average-size-per-paper over the period covered.
Table 50. Average Size of Canadian Daily Newspapers (for selected years)
Year Average Circulation 1901 5,300 11 10,200 30 19,900 40 24,600 50 35,600 55 37,800 60 34,100 65 39,700 69 41,600
The number of daily newspapers in the same period did not change significantly. At the turn of the century, there were 114 dailies in Canada, the peak year being 1911, with 135. By 1930, the
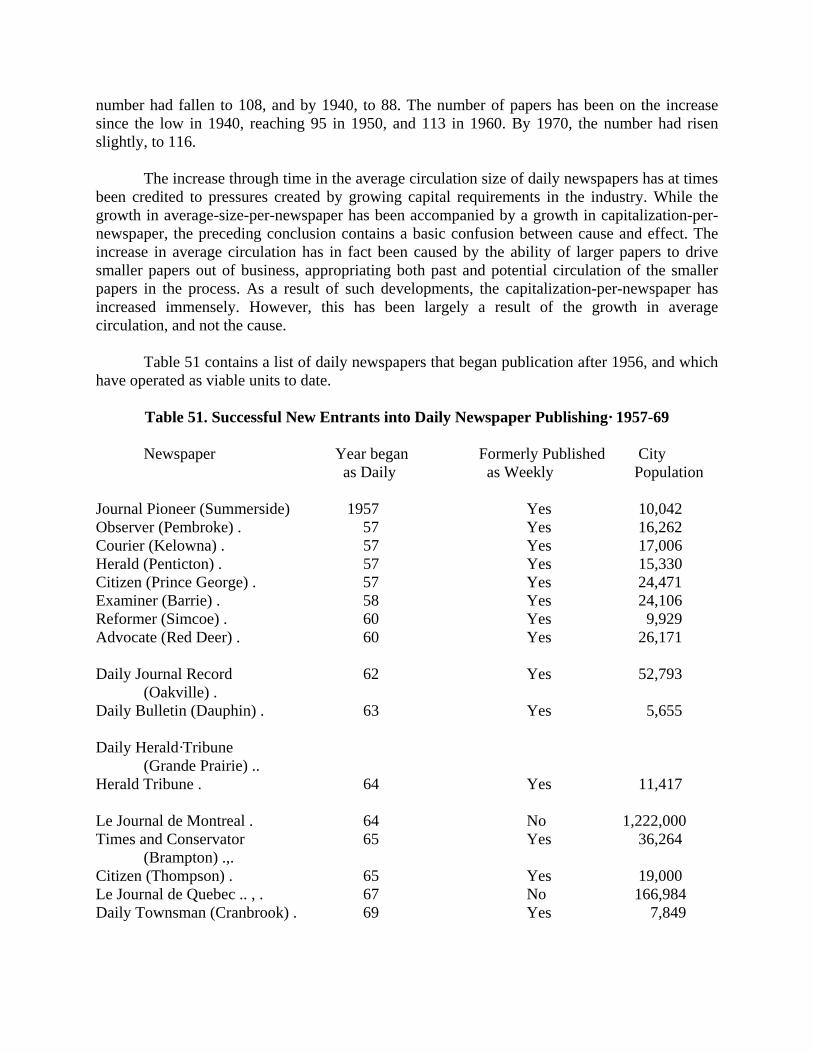
number had fallen to 108, and by 1940, to 88. The number of papers has been on the increase since the low in 1940, reaching 95 in 1950, and 113 in 1960. By 1970, the number had risen slightly, to 116.
The increase through time in the average circulation size of daily newspapers has at times been credited to pressures created by growing capital requirements in the industry. While the growth in average-size-per-newspaper has been accompanied by a growth in capitalization-per-newspaper, the preceding conclusion contains a basic confusion between cause and effect. The increase in average circulation has in fact been caused by the ability of larger papers to drive smaller papers out of business, appropriating both past and potential circulation of the smaller papers in the process. As a result of such developments, the capitalization-per-newspaper has increased immensely. However, this has been largely a result of the growth in average circulation, and not the cause.
Table 51 contains a list of daily newspapers that began publication after 1956, and which have operated as viable units to date.
Table 51. Successful New Entrants into Daily Newspaper Publishing· 1957-69
Newspaper Year began Formerly Published City as Daily as Weekly Population
Journal Pioneer (Summerside) 1957 Yes 10,042 Observer (Pembroke) . 57 Yes 16,262 Courier (Kelowna) . 57 Yes 17,006 Herald (Penticton) . 57 Yes 15,330 Citizen (Prince George) . 57 Yes 24,471 Examiner (Barrie) . 58 Yes 24,106 Reformer (Simcoe) . 60 Yes 9,929 Advocate (Red Deer) . 60 Yes 26,171 Daily Journal Record 62 Yes 52,793
(Oakville) . Daily Bulletin (Dauphin) . 63 Yes 5,655 Daily Herald·Tribune
(Grande Prairie) .. Herald Tribune . 64 Yes 11,417 Le Journal de Montreal . 64 No 1,222,000 Times and Conservator 65 Yes 36,264
(Brampton) .,. Citizen (Thompson) . 65 Yes 19,000 Le Journal de Quebec .. , . 67 No 166,984 Daily Townsman (Cranbrook) . 69 Yes 7,849

It is significant that practically all of these papers are in relatively small urban centres.
Only two, Le Journal de Montreal and Le Journal de Quebec are in cities with populations in excess of 100,000. These two papers are published by the same company. These two papers are the only ones which were not weeklies before becoming dailies. These two are the only ones with a circulation in excess of 10,000 a day. (practically all of the papers started with a circulation of 3,000 to 7,000.) These qualifications make a number of things clear. The opportunities to publish a new daily newspaper successfully do not generally lie where major competitors exist, as either major weeklies or other dailies,
New dailies generally eliminate the major weekly paper in a city by virtue of their own creation. New dailies are also not known for success where direct competition from other dailies is a factor. The Montreal and Quebec examples are exceptions - Le Journal de Montreal was founded during a newspaper strike. All of the other successful dailies had no direct competition from other dailies. During the same period, papers began publication, but were forced to close, in Montreal, Guelph, Vancouver; and Hull. In each of these latter cases, significant competition was present from other dailies.
It is difficult to pinpoint any specific size of city as the minimum necessary to support a daily newspaper. The basic factor is the city's ability to generate advertising revenue. This ability depends upon the wealth of the community, its importance as a retail·shopping centre, and the degree of concentration of the circulation of other daily newspapers and radio and television in the community.
The circulation that a paper can draw is probably the best rule-of·thumb measure in determining whether or not a daily newspaper can be successful. Generally speaking, unless a community is highly isolated from competing media, a circulation of approximately 5,000 will permit the successful publication of a daily newspaper - provided that it has a monopoly.
It is very important that a paper of this size have a monopoly in the local market. A monopoly paper has a relatively captive advertising market. A paper of the same size competing with a larger paper does not have such a hold on advertising. As well, cost considerations are almost certain to lead advertisers to desert a paper of this size if a larger paper exists in the same market. Table 52 shows the per-capita distribution of daily newspapers by province.
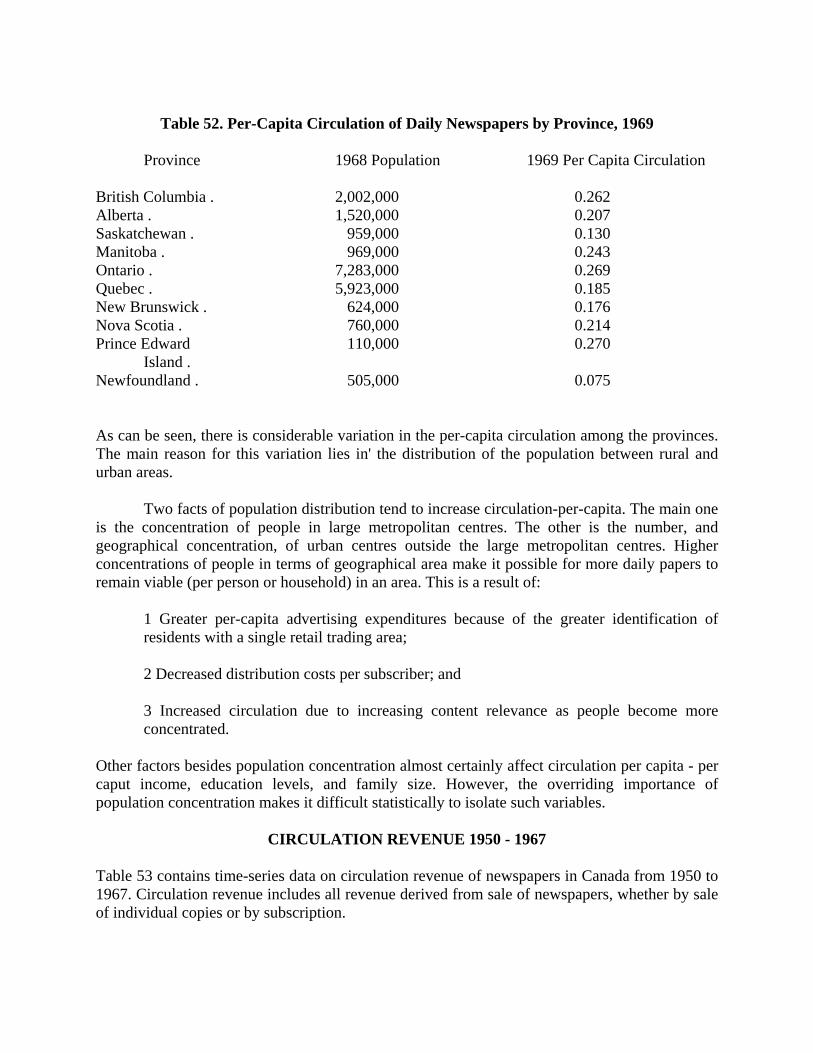
Table 52. Per-Capita Circulation of Daily Newspapers by Province, 1969
Province 1968 Population 1969 Per Capita Circulation
British Columbia . 2,002,000 0.262 Alberta . 1,520,000 0.207 Saskatchewan . 959,000 0.130 Manitoba . 969,000 0.243 Ontario . 7,283,000 0.269 Quebec . 5,923,000 0.185 New Brunswick . 624,000 0.176 Nova Scotia . 760,000 0.214 Prince Edward 110,000 0.270
Island . Newfoundland . 505,000 0.075 As can be seen, there is considerable variation in the per-capita circulation among the provinces. The main reason for this variation lies in' the distribution of the population between rural and urban areas.
Two facts of population distribution tend to increase circulation-per-capita. The main one is the concentration of people in large metropolitan centres. The other is the number, and geographical concentration, of urban centres outside the large metropolitan centres. Higher concentrations of people in terms of geographical area make it possible for more daily papers to remain viable (per person or household) in an area. This is a result of:
1 Greater per-capita advertising expenditures because of the greater identification of residents with a single retail trading area;
2 Decreased distribution costs per subscriber; and
3 Increased circulation due to increasing content relevance as people become more concentrated.
Other factors besides population concentration almost certainly affect circulation per capita - per caput income, education levels, and family size. However, the overriding importance of population concentration makes it difficult statistically to isolate such variables.
CIRCULATION REVENUE 1950 - 1967 Table 53 contains time-series data on circulation revenue of newspapers in Canada from 1950 to 1967. Circulation revenue includes all revenue derived from sale of newspapers, whether by sale of individual copies or by subscription.
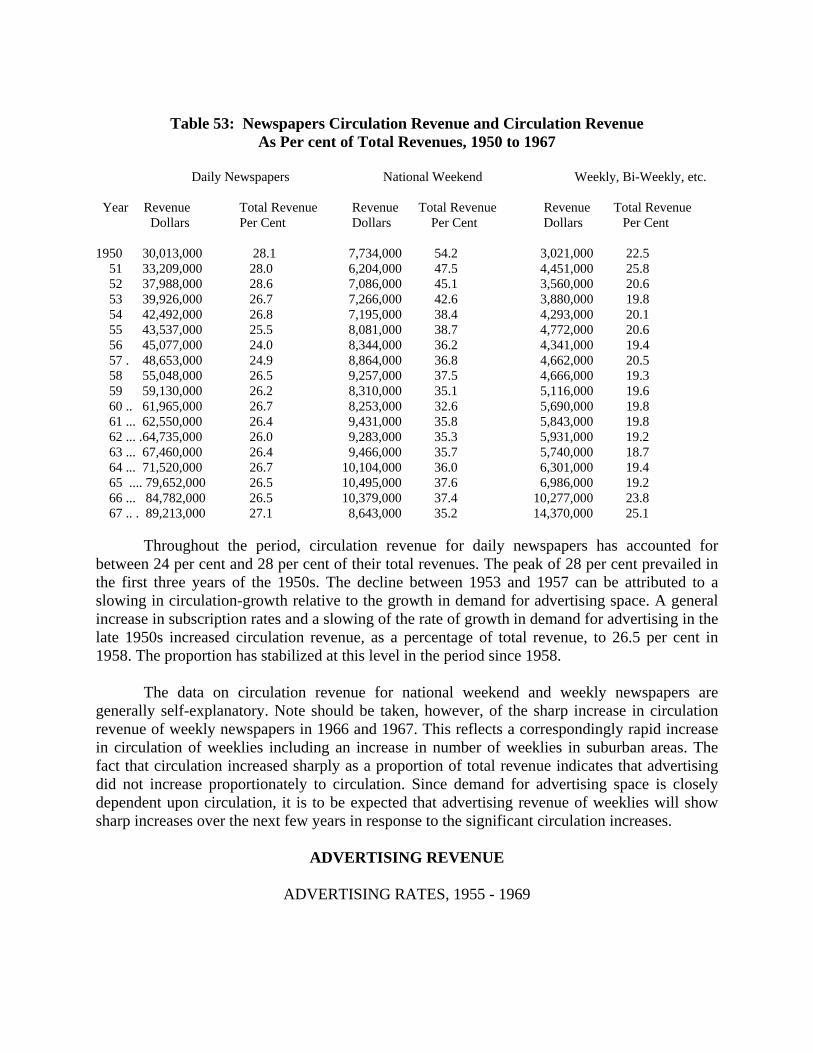
Table 53: Newspapers Circulation Revenue and Circulation Revenue
As Per cent of Total Revenues, 1950 to 1967 Daily Newspapers National Weekend Weekly, Bi-Weekly, etc. Year Revenue Total Revenue Revenue Total Revenue Revenue Total Revenue
Dollars Per Cent Dollars Per Cent Dollars Per Cent
1950 30,013,000 28.1 7,734,000 54.2 3,021,000 22.5 51 33,209,000 28.0 6,204,000 47.5 4,451,000 25.8 52 37,988,000 28.6 7,086,000 45.1 3,560,000 20.6 53 39,926,000 26.7 7,266,000 42.6 3,880,000 19.8 54 42,492,000 26.8 7,195,000 38.4 4,293,000 20.1 55 43,537,000 25.5 8,081,000 38.7 4,772,000 20.6 56 45,077,000 24.0 8,344,000 36.2 4,341,000 19.4 57 . 48,653,000 24.9 8,864,000 36.8 4,662,000 20.5 58 55,048,000 26.5 9,257,000 37.5 4,666,000 19.3 59 59,130,000 26.2 8,310,000 35.1 5,116,000 19.6 60 .. 61,965,000 26.7 8,253,000 32.6 5,690,000 19.8 61 ... 62,550,000 26.4 9,431,000 35.8 5,843,000 19.8 62 ... .64,735,000 26.0 9,283,000 35.3 5,931,000 19.2 63 ... 67,460,000 26.4 9,466,000 35.7 5,740,000 18.7 64 ... 71,520,000 26.7 10,104,000 36.0 6,301,000 19.4 65 .... 79,652,000 26.5 10,495,000 37.6 6,986,000 19.2 66 ... 84,782,000 26.5 10,379,000 37.4 10,277,000 23.8 67 .. . 89,213,000 27.1 8,643,000 35.2 14,370,000 25.1
Throughout the period, circulation revenue for daily newspapers has accounted for between 24 per cent and 28 per cent of their total revenues. The peak of 28 per cent prevailed in the first three years of the 1950s. The decline between 1953 and 1957 can be attributed to a slowing in circulation-growth relative to the growth in demand for advertising space. A general increase in subscription rates and a slowing of the rate of growth in demand for advertising in the late 1950s increased circulation revenue, as a percentage of total revenue, to 26.5 per cent in 1958. The proportion has stabilized at this level in the period since 1958.
The data on circulation revenue for national weekend and weekly newspapers are generally self-explanatory. Note should be taken, however, of the sharp increase in circulation revenue of weekly newspapers in 1966 and 1967. This reflects a correspondingly rapid increase in circulation of weeklies including an increase in number of weeklies in suburban areas. The fact that circulation increased sharply as a proportion of total revenue indicates that advertising did not increase proportionately to circulation. Since demand for advertising space is closely dependent upon circulation, it is to be expected that advertising revenue of weeklies will show sharp increases over the next few years in response to the significant circulation increases.
ADVERTISING REVENUE
ADVERTISING RATES, 1955 - 1969
Advertising rates are generally quoted in cents per line per advertisement placed. To the advertiser, the coverage provided is as important as the cost per line per advertisement placed. In comparing the costs of advertising for two separate daily newspapers, the advertiser is interested in the cost per consumer reached.
Comparisons are frequently based on a milline rate, that is the cost of an agate line of advertising per 1,000 circulation. For our purposes, we have employed the alternative formula based on one million circulation calculated in the following way:
Agate-line rate x 1,000,000 Circulation of paper
This rate is interpreted as the cost of circulating one agate line of advertising to a standard circulation of one million subscribers. The milline rate gives a measure of the cost-per-line of advertising actually printed and distributed.
A comparison of milline rates for different papers gives a relative comparison of the costs of distributing a single line of advertising to a single subscriber. To the advertiser, this is the most important rate to use. In choosing between alternative advertising vehicles, his main concern is with the cost of distributing each line of advertising to each potential customer. (The use of the multiple of one million should not be allowed to cause confusion. The multiple is introduced to make the result large enough to be workable. To get the actual cost per line per consumer one could leave this multiple out.)
Retail advertisers, on the other hand, had more advertising alternatives, and more marketing alternatives in general. Retail advertisers could, in many instances, obtain satisfactory results with the once-a-week, limited geographical coverage provided by weekly newspapers. They could also distribute advertising flyers at reasonable cost within the market area covered. This alternative generally was not, and still is not, open to national advertisers because of prohibitive costs involved in distributing flyers over a wide geographical area and because flyers are generally read only if they provide price and market selection information. Brand-name promotion, of interest to national advertisers, is virtually impossible through the use of flyers. Retailers can also effectively practise price competition by word of mouth transmission of this information, making it possible to cut back on advertising if it becomes too costly.
For these reasons it was possible to demand, and get, a premium on national advertising without adversely affecting the volume of such advertising. Cutting the national rate down to the retail rate would not have generated significantly greater revenues, while bringing the retail rate up to the national rate would have seriously affected revenues.
The spread of television and the use of more regularized national advertising appears to have changed all of this. National advertising has an effective alternative to newspapers, making it much more cost sensitive. Likewise, the greater regularization of national advertising has caused national advertisers to look more closely at alternatives. The effect of television on national advertising receipts of daily newspapers has already been indicated.
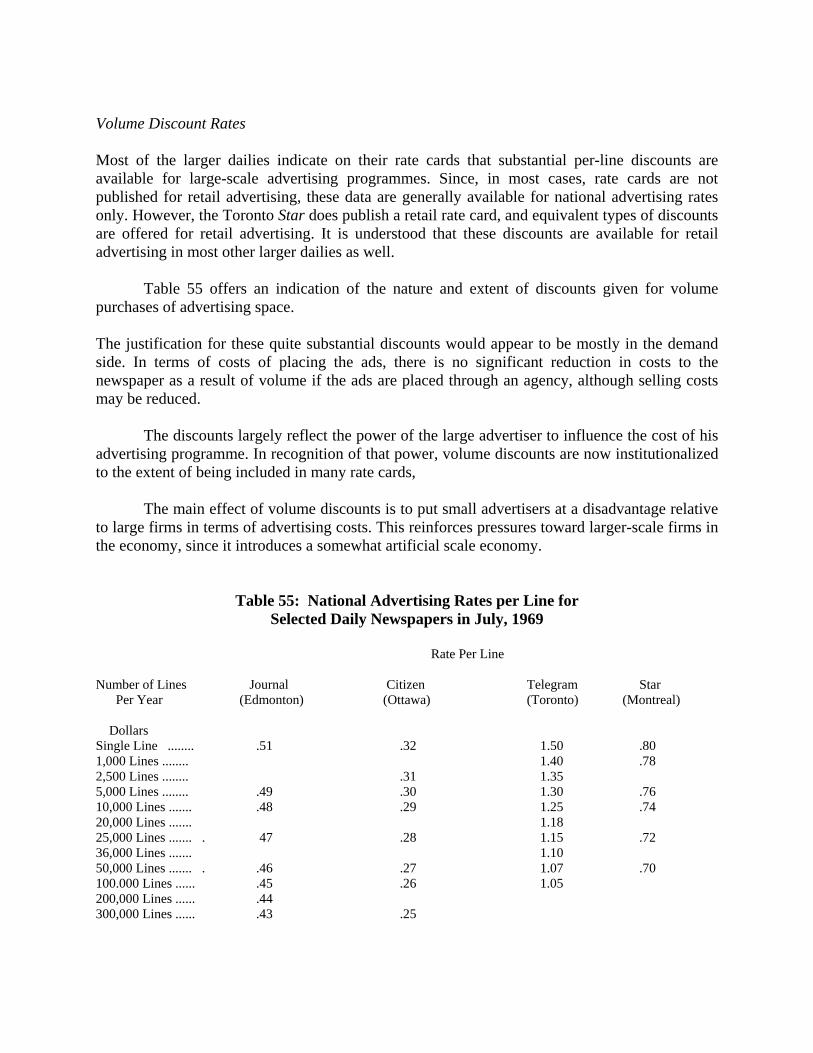
Volume Discount Rates Most of the larger dailies indicate on their rate cards that substantial per-line discounts are available for large-scale advertising programmes. Since, in most cases, rate cards are not published for retail advertising, these data are generally available for national advertising rates only. However, the Toronto Star does publish a retail rate card, and equivalent types of discounts are offered for retail advertising. It is understood that these discounts are available for retail advertising in most other larger dailies as well.
Table 55 offers an indication of the nature and extent of discounts given for volume purchases of advertising space. The justification for these quite substantial discounts would appear to be mostly in the demand side. In terms of costs of placing the ads, there is no significant reduction in costs to the newspaper as a result of volume if the ads are placed through an agency, although selling costs may be reduced.
The discounts largely reflect the power of the large advertiser to influence the cost of his advertising programme. In recognition of that power, volume discounts are now institutionalized to the extent of being included in many rate cards,
The main effect of volume discounts is to put small advertisers at a disadvantage relative to large firms in terms of advertising costs. This reinforces pressures toward larger-scale firms in the economy, since it introduces a somewhat artificial scale economy.
Table 55: National Advertising Rates per Line for Selected Daily Newspapers in July, 1969
Rate Per Line Number of Lines Journal Citizen Telegram Star Per Year (Edmonton) (Ottawa) (Toronto) (Montreal) Dollars Single Line ........ .51 .32 1.50 .80 1,000 Lines ........ 1.40 .78 2,500 Lines ........ .31 1.35 5,000 Lines ........ .49 .30 1.30 .76 10,000 Lines ....... .48 .29 1.25 .74 20,000 Lines ....... 1.18 25,000 Lines ....... . 47 .28 1.15 .72 36,000 Lines ....... 1.10 50,000 Lines ....... . .46 .27 1.07 .70 100.000 Lines ...... .45 .26 1.05 200,000 Lines ...... .44 300,000 Lines ...... .43 .25
Source: C.A.R.D .. July, 1969. Co-operative Advertising Rates The separation of national advertising from retail has created a problem that always exists when two different prices are charged for a closely similar or identical product: the problem of how to prevent national advertisers from devising means of placing ads disguised as retail advertising. This problem has become more pressing as franchised dealers become a more popular form of merchandising. In this situation, it is possible for the local dealer to place the ad for the nationally-marked product and be reimbursed by the producer for the cost of the ad.
Daily newspapers have devised a method that appears to be a very effective solution to this problem. If a local dealer places an advertisement for a product that is marketed nationally, it is up to the newspaper's discretion to decide whether the relevant rate will be the national or the retail rate. Practically every rate card gives the criterion used to make this decision. For example:
Co-operative advertising by local dealers will be accepted at local rates when manufacturer or distributor is carrying an adequate national advertising campaign.
It is said that this solution appears very effective. There is no indication, however, of how much potential advertising is lost to other media as a result of this practice. Other Advertising Rates The structure of relative rates for other types of advertising is not nearly so institutionalized as that of national and retail rates. Table 56 outlines various rates for a selected group of daily newspapers.

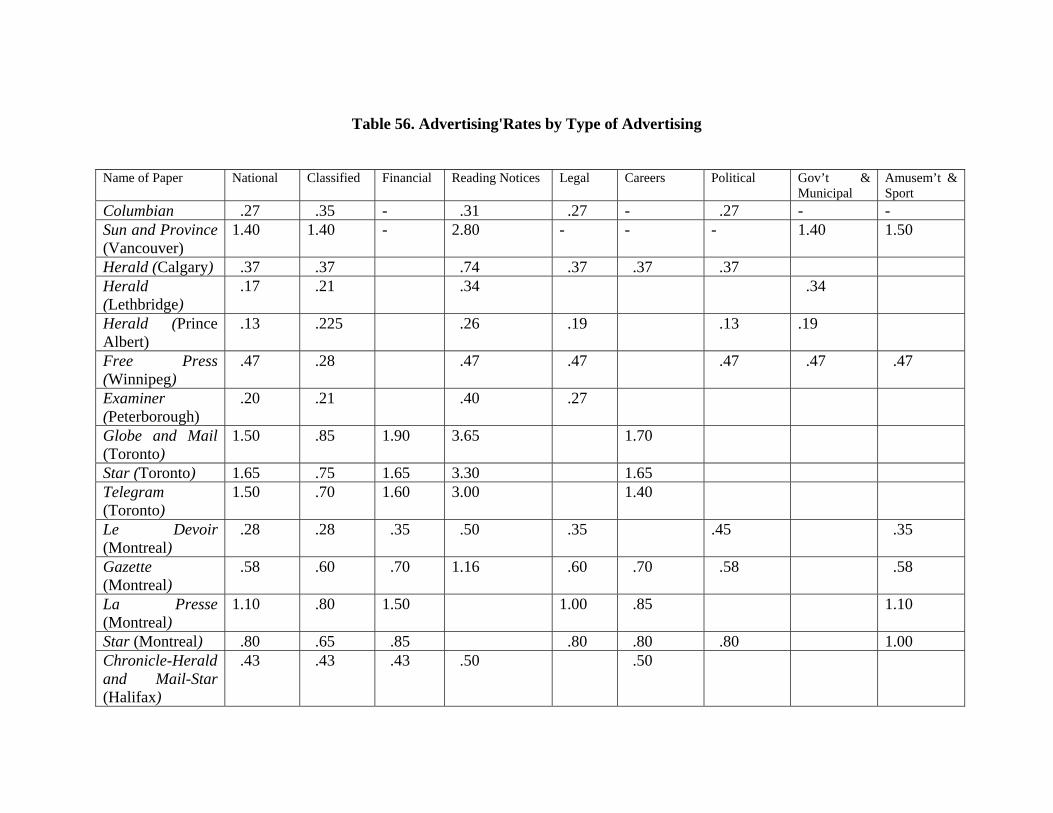
Table 56. Advertising'Rates by Type of Advertising
Name of Paper National Classified Financial Reading Notices Legal Careers Political Gov’t & Municipal
Amusem’t & Sport
Columbian .27 .35 - .31 .27 - .27 - - Sun and Province (Vancouver)
1.40 1.40 - 2.80 - - - 1.40 1.50
Herald (Calgary) .37 .37 .74 .37 .37 .37 Herald (Lethbridge)
.17 .21 .34 .34
Herald (Prince Albert)
.13 .225 .26 .19 .13 .19
Free Press (Winnipeg)
.47 .28 .47 .47 .47 .47 .47
Examiner (Peterborough)
.20 .21 .40 .27
Globe and Mail (Toronto)
1.50 .85 1.90 3.65 1.70
Star (Toronto) 1.65 .75 1.65 3.30 1.65 Telegram (Toronto)
1.50 .70 1.60 3.00 1.40
Le Devoir (Montreal)
.28 .28 .35 .50 .35 .45 .35
Gazette (Montreal)
.58 .60 .70 1.16 .60 .70 .58 .58
La Presse (Montreal)
1.10 .80 1.50 1.00 .85 1.10
Star (Montreal) .80 .65 .85 .80 .80 .80 1.00 Chronicle-Herald and Mail-Star (Halifax)
.43 .43 .43 .50 .50

There is very little standardization in the relationship of different types of rates among different newspapers. This can be seen by comparing classified rates with national rates. For four of the newspapers selected, classified rates are greater than national rates; for four, the two are the same; and, for seven, classified rates are less. Rates for reading notices (advertisements made up in editorial-type format) are generally considerably higher than national rates. Other types of rates are generally equal to or higher than the national rates.
While the rates used in Table 56 are drawn from the rate cards, it must be recognized that, with the general exception of national rates, the rates stated on rate cards are not necessarily the rates always paid by the advertiser. Special rates can often be negotiated by the advertiser if his business is sufficiently important to the newspaper.
In addition to the types of rates listed in Table 56 extra premiums are charged for colour advertising and, in some cases, for a guaranteed space on a specified page or position on a page. The size of the colour premium various considerably from paper to paper, with the premium for a single colour varying anywhere from 10 per cent to 35 per cent of the rate for non-colour, calculated on the basis of the minimum size ad accepted (usually 600 to 1,000 lines). The premium increases with the number of colours used. About 90 per cent of the dailies in Canada now have the facilities to print colour advertisements.
While most papers specify in their rate cards that a special position premium is charged for guaranteed position, this appears to be rarely invoked. Currently, positioning of ads appears to be used as a non-price bargaining tool. Large advertisers are often given choice positions to encourage them to continue their advertising programme.
Discounts are offered by all newspapers for early payment of outstanding accounts. The general practice is to allow a 2 per cent discount for payment of accounts by the twentieth day of the month following the publication of the advertisement. What Structure for Rates? The problem of the appropriate relationship for different types of advertising rates is a complex one. It is also an extremely important one, at a time when each of the media is uncertain about its competitive position as an advertising vehicle.
One of the major difficulties about establishing an optimum rate structure is that costs provide little guidance. All advertising is expected to generate revenue in excess of the publishing costs, since the revenue from advertising is used to subsidize the publication of news and editorial content. As a result, while it can be safely concluded that no advertising should be carried if it does not meet its own costs, the proportion above costs at which each rate should be set depends almost entirely on the conditions influencing demand for that type of space.
In a very general way, there is a useful guideline for establishing the optimum relationship between different rates for any individual newspaper. An overall mean rate should be established which, if charged equally for all advertising, would generate sufficient revenue to meet the total costs of publishing a newspaper containing that amount of advertising. Some rates
should be adjusted downward from the mean, and some upward. Which should move which way, and the extent of the differential, depends almost entirely upon the conditions of demand for that type of advertising.
Those types of advertising for which the volume is highly price-sensitive within the relevant rate range should be adjusted downward from the mean. This is true as long as the downward adjustment of rates generates sufficient extra advertising volume as to increase total net revenue from that type of advertising (that is, revenue after costs of producing the ads themselves). Such price-sensitivity is likely to exist where some other type of advertising medium is judged to be of almost equal value in terms of rates or where alternative marketing techniques exist at reasonable costs.
Those types of advertising for which the volume is price-insensitive should be adjusted upward from the mean. In such cases, higher rates will not significantly decrease volume, yielding greater total net receipts on such types of advertising.
A great deal of study remains to be done in establishing the price-sensitivity of different types of ads. As a preliminary conclusion, it seems that classified advertising is likely the least price-sensitive, retail advertising more price-sensitive, and national advertising the most price-sensitive. This is based almost solely on the fact that classified advertising has the least competitive, and national advertising the most competitive, alternatives.
One strong word of caution should be made about this conclusion as it pertains to national rates. It is possible that a large part of national advertising currently placed in dailies could get much better value for money by switching to television but cannot make the shift because television time is not available. If this were the case, then national advertising in dailies would be insensitive to rate changes. The major factor influencing volume would be availability of television time, and not relative rates. If this is the case, it is a gloomy portent of the future. If new VHF channels and original advertising on cable are both permitted in the near future, it could be expected there would be a much larger shift of national advertising from dailies to television than is currently evident. This would have serious consequences for daily newspapers in the more heavily-populated areas where new television outlets can be expected to develop.
There are reasons for expecting however, that the relative position of rates, rather than the availability of time, is the main factor preventing a further shifting of advertising from the dailies to television. First, in many market areas television stations are not able to sell all of the time they have available. Second, if television broadcasters are profit maximizers, they would be expected to increase rates to a point at which rates are at the maximum level which will still fill the available time. If this be so, it would be true conversely that a reduction in national newspaper rates relative to television rates would draw a greater share of national advertising back to newspapers.

Trends in National Advertising Rates 1955-1969 Tables 57 and 58 contain time-series data on national advertising rates. The papers included are those which have been publishing since at least 1955. Rates are based on volume contracts of 5,000 lines per year where applicable. Milline rates have been calculated, since these give the most accurate measure of unit costs to advertisers for advertising space,

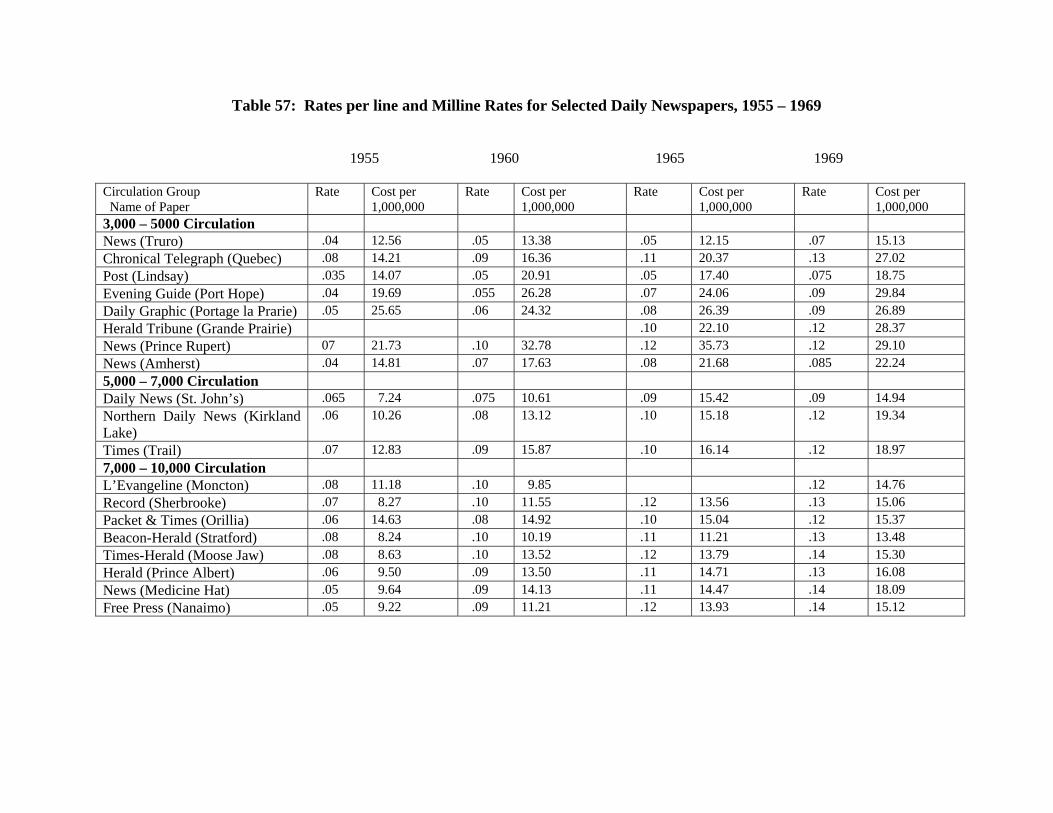
Table 57: Rates per line and Milline Rates for Selected Daily Newspapers, 1955 – 1969
1955 1960 1965 1969
Circulation Group Name of Paper
Rate Cost per 1,000,000
Rate Cost per 1,000,000
Rate Cost per 1,000,000
Rate Cost per 1,000,000
3,000 – 5000 Circulation
News (Truro) .04 12.56 .05 13.38 .05 12.15 .07 15.13
Chronical Telegraph (Quebec) .08 14.21 .09 16.36 .11 20.37 .13 27.02
Post (Lindsay) .035 14.07 .05 20.91 .05 17.40 .075 18.75
Evening Guide (Port Hope) .04 19.69 .055 26.28 .07 24.06 .09 29.84
Daily Graphic (Portage la Prarie) .05 25.65 .06 24.32 .08 26.39 .09 26.89
Herald Tribune (Grande Prairie) .10 22.10 .12 28.37
News (Prince Rupert) 07 21.73 .10 32.78 .12 35.73 .12 29.10
News (Amherst) .04 14.81 .07 17.63 .08 21.68 .085 22.24
5,000 – 7,000 Circulation
Daily News (St. John’s) .065 7.24 .075 10.61 .09 15.42 .09 14.94
Northern Daily News (Kirkland Lake)
.06 10.26 .08 13.12 .10 15.18 .12 19.34
Times (Trail) .07 12.83 .09 15.87 .10 16.14 .12 18.97
7,000 – 10,000 Circulation
L’Evangeline (Moncton) .08 11.18 .10 9.85 .12 14.76
Record (Sherbrooke) .07 8.27 .10 11.55 .12 13.56 .13 15.06
Packet & Times (Orillia) .06 14.63 .08 14.92 .10 15.04 .12 15.37
Beacon-Herald (Stratford) .08 8.24 .10 10.19 .11 11.21 .13 13.48
Times-Herald (Moose Jaw) .08 8.63 .10 13.52 .12 13.79 .14 15.30
Herald (Prince Albert) .06 9.50 .09 13.50 .11 14.71 .13 16.08
News (Medicine Hat) .05 9.64 .09 14.13 .11 14.47 .14 18.09
Free Press (Nanaimo) .05 9.22 .09 11.21 .12 13.93 .14 15.12
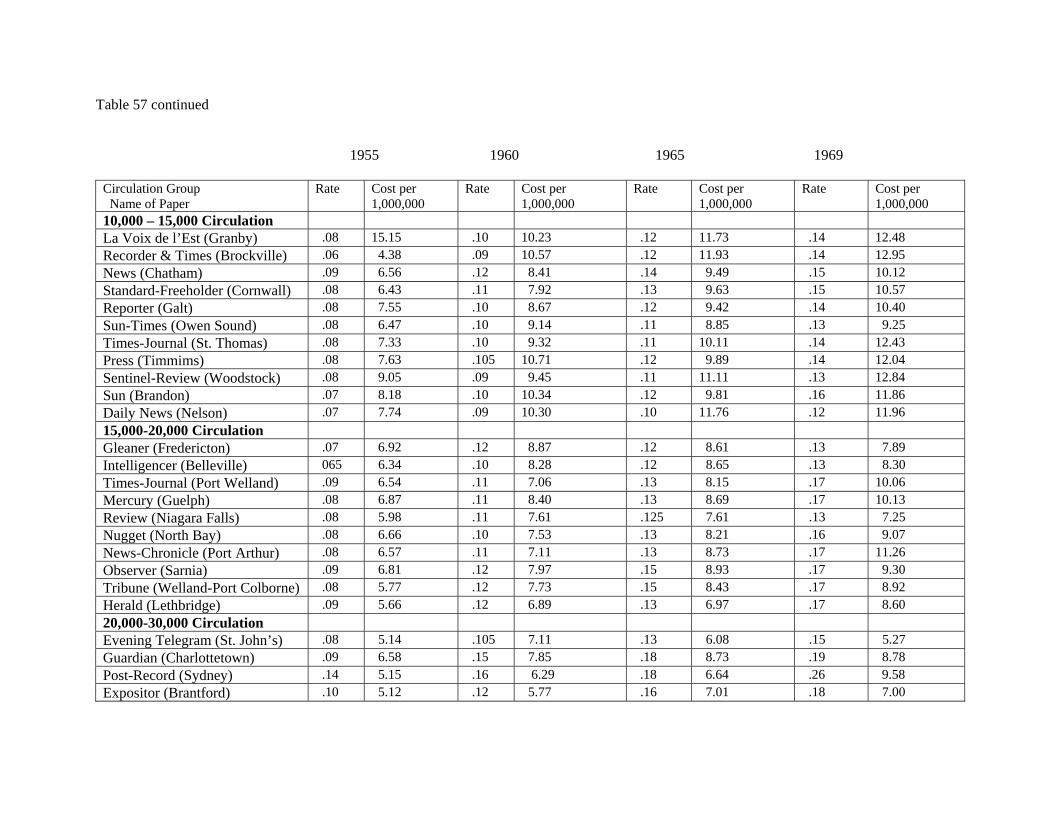
Table 57 continued
1955 1960 1965 1969
Circulation Group Name of Paper
Rate Cost per 1,000,000
Rate Cost per 1,000,000
Rate Cost per 1,000,000
Rate Cost per 1,000,000
10,000 – 15,000 Circulation
La Voix de l’Est (Granby) .08 15.15 .10 10.23 .12 11.73 .14 12.48
Recorder & Times (Brockville) .06 4.38 .09 10.57 .12 11.93 .14 12.95
News (Chatham) .09 6.56 .12 8.41 .14 9.49 .15 10.12
Standard-Freeholder (Cornwall) .08 6.43 .11 7.92 .13 9.63 .15 10.57
Reporter (Galt) .08 7.55 .10 8.67 .12 9.42 .14 10.40
Sun-Times (Owen Sound) .08 6.47 .10 9.14 .11 8.85 .13 9.25
Times-Journal (St. Thomas) .08 7.33 .10 9.32 .11 10.11 .14 12.43
Press (Timmims) .08 7.63 .105 10.71 .12 9.89 .14 12.04
Sentinel-Review (Woodstock) .08 9.05 .09 9.45 .11 11.11 .13 12.84
Sun (Brandon) .07 8.18 .10 10.34 .12 9.81 .16 11.86
Daily News (Nelson) .07 7.74 .09 10.30 .10 11.76 .12 11.96
15,000-20,000 Circulation
Gleaner (Fredericton) .07 6.92 .12 8.87 .12 8.61 .13 7.89
Intelligencer (Belleville) 065 6.34 .10 8.28 .12 8.65 .13 8.30
Times-Journal (Port Welland) .09 6.54 .11 7.06 .13 8.15 .17 10.06
Mercury (Guelph) .08 6.87 .11 8.40 .13 8.69 .17 10.13
Review (Niagara Falls) .08 5.98 .11 7.61 .125 7.61 .13 7.25
Nugget (North Bay) .08 6.66 .10 7.53 .13 8.21 .16 9.07
News-Chronicle (Port Arthur) .08 6.57 .11 7.11 .13 8.73 .17 11.26
Observer (Sarnia) .09 6.81 .12 7.97 .15 8.93 .17 9.30
Tribune (Welland-Port Colborne) .08 5.77 .12 7.73 .15 8.43 .17 8.92
Herald (Lethbridge) .09 5.66 .12 6.89 .13 6.97 .17 8.60
20,000-30,000 Circulation
Evening Telegram (St. John’s) .08 5.14 .105 7.11 .13 6.08 .15 5.27
Guardian (Charlottetown) .09 6.58 .15 7.85 .18 8.73 .19 8.78
Post-Record (Sydney) .14 5.15 .16 6.29 .18 6.64 .26 9.58
Expositor (Brantford) .10 5.12 .12 5.77 .16 7.01 .18 7.00
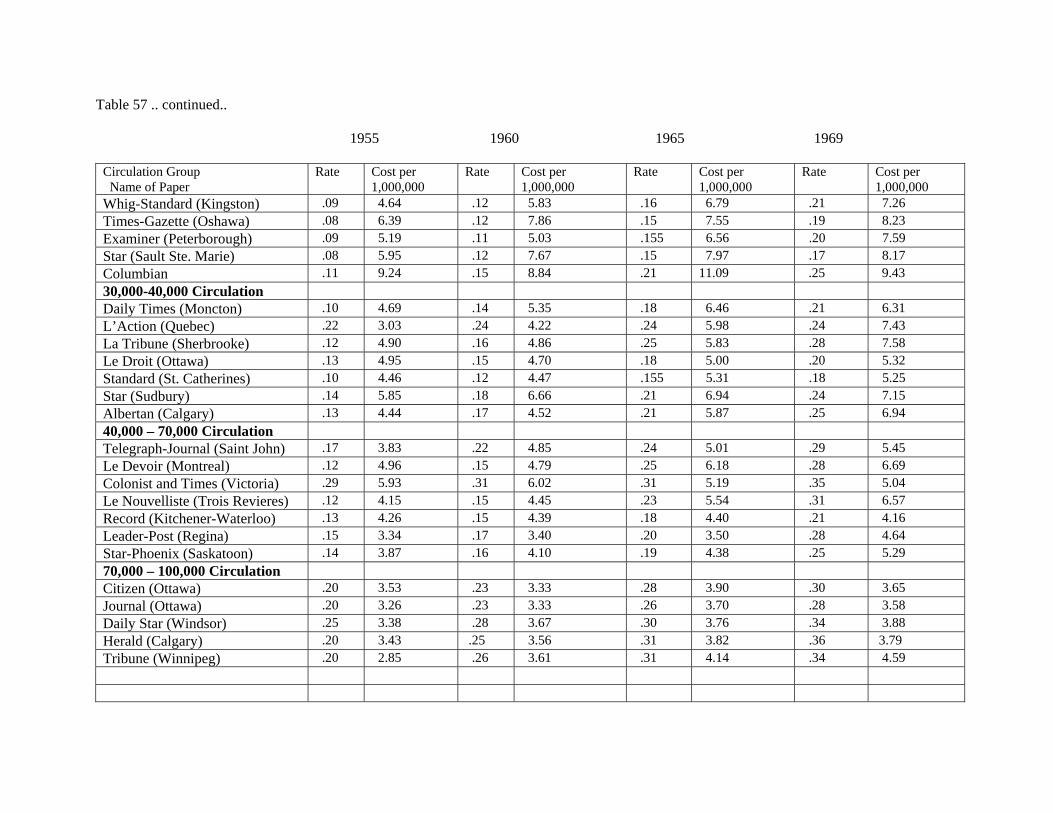
Table 57 .. continued..
1955 1960 1965 1969
Circulation Group Name of Paper
Rate Cost per 1,000,000
Rate Cost per 1,000,000
Rate Cost per 1,000,000
Rate Cost per 1,000,000
Whig-Standard (Kingston) .09 4.64 .12 5.83 .16 6.79 .21 7.26
Times-Gazette (Oshawa) .08 6.39 .12 7.86 .15 7.55 .19 8.23
Examiner (Peterborough) .09 5.19 .11 5.03 .155 6.56 .20 7.59
Star (Sault Ste. Marie) .08 5.95 .12 7.67 .15 7.97 .17 8.17
Columbian .11 9.24 .15 8.84 .21 11.09 .25 9.43
30,000-40,000 Circulation
Daily Times (Moncton) .10 4.69 .14 5.35 .18 6.46 .21 6.31
L’Action (Quebec) .22 3.03 .24 4.22 .24 5.98 .24 7.43
La Tribune (Sherbrooke) .12 4.90 .16 4.86 .25 5.83 .28 7.58
Le Droit (Ottawa) .13 4.95 .15 4.70 .18 5.00 .20 5.32
Standard (St. Catherines) .10 4.46 .12 4.47 .155 5.31 .18 5.25
Star (Sudbury) .14 5.85 .18 6.66 .21 6.94 .24 7.15
Albertan (Calgary) .13 4.44 .17 4.52 .21 5.87 .25 6.94
40,000 – 70,000 Circulation
Telegraph-Journal (Saint John) .17 3.83 .22 4.85 .24 5.01 .29 5.45
Le Devoir (Montreal) .12 4.96 .15 4.79 .25 6.18 .28 6.69
Colonist and Times (Victoria) .29 5.93 .31 6.02 .31 5.19 .35 5.04
Le Nouvelliste (Trois Revieres) .12 4.15 .15 4.45 .23 5.54 .31 6.57
Record (Kitchener-Waterloo) .13 4.26 .15 4.39 .18 4.40 .21 4.16
Leader-Post (Regina) .15 3.34 .17 3.40 .20 3.50 .28 4.64
Star-Phoenix (Saskatoon) .14 3.87 .16 4.10 .19 4.38 .25 5.29
70,000 – 100,000 Circulation
Citizen (Ottawa) .20 3.53 .23 3.33 .28 3.90 .30 3.65
Journal (Ottawa) .20 3.26 .23 3.33 .26 3.70 .28 3.58
Daily Star (Windsor) .25 3.38 .28 3.67 .30 3.76 .34 3.88
Herald (Calgary) .20 3.43 .25 3.56 .31 3.82 .36 3.79
Tribune (Winnipeg) .20 2.85 .26 3.61 .31 4.14 .34 4.59
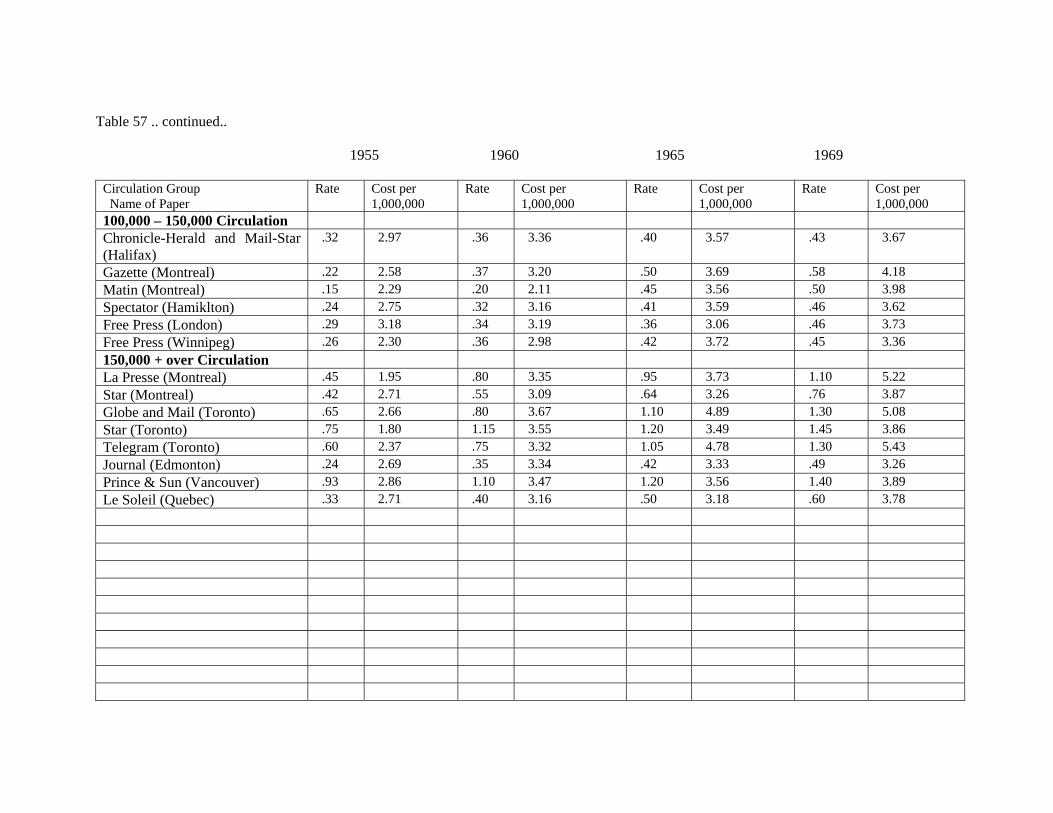
Table 57 .. continued..
1955 1960 1965 1969
Circulation Group Name of Paper
Rate Cost per 1,000,000
Rate Cost per 1,000,000
Rate Cost per 1,000,000
Rate Cost per 1,000,000
100,000 – 150,000 Circulation
Chronicle-Herald and Mail-Star (Halifax)
.32 2.97 .36 3.36 .40 3.57 .43 3.67
Gazette (Montreal) .22 2.58 .37 3.20 .50 3.69 .58 4.18
Matin (Montreal) .15 2.29 .20 2.11 .45 3.56 .50 3.98
Spectator (Hamiklton) .24 2.75 .32 3.16 .41 3.59 .46 3.62
Free Press (London) .29 3.18 .34 3.19 .36 3.06 .46 3.73
Free Press (Winnipeg) .26 2.30 .36 2.98 .42 3.72 .45 3.36
150,000 + over Circulation
La Presse (Montreal) .45 1.95 .80 3.35 .95 3.73 1.10 5.22
Star (Montreal) .42 2.71 .55 3.09 .64 3.26 .76 3.87
Globe and Mail (Toronto) .65 2.66 .80 3.67 1.10 4.89 1.30 5.08
Star (Toronto) .75 1.80 1.15 3.55 1.20 3.49 1.45 3.86
Telegram (Toronto) .60 2.37 .75 3.32 1.05 4.78 1.30 5.43
Journal (Edmonton) .24 2.69 .35 3.34 .42 3.33 .49 3.26
Prince & Sun (Vancouver) .93 2.86 1.10 3.47 1.20 3.56 1.40 3.89
Le Soleil (Quebec) .33 2.71 .40 3.16 .50 3.18 .60 3.78

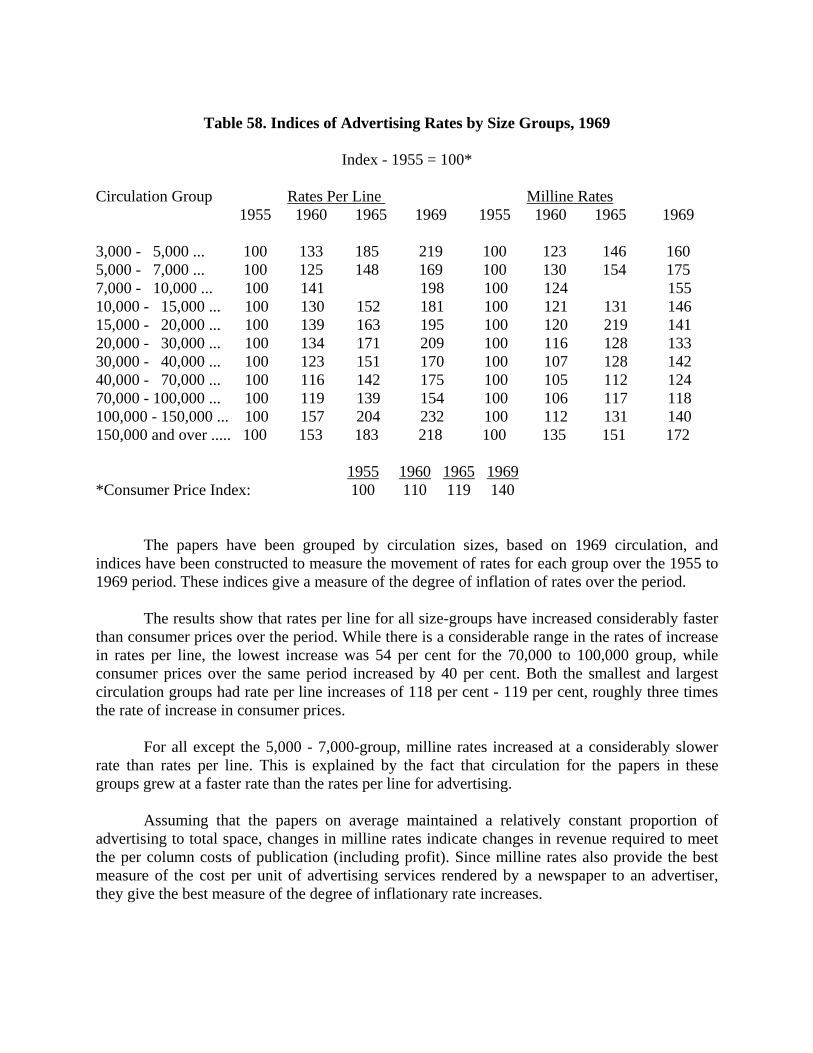
Table 58. Indices of Advertising Rates by Size Groups, 1969
Index - 1955 = 100* Circulation Group Rates Per Line Milline Rates 1955 1960 1965 1969 1955 1960 1965 1969 3,000 - 5,000 ... 100 133 185 219 100 123 146 160 5,000 - 7,000 ... 100 125 148 169 100 130 154 175 7,000 - 10,000 ... 100 141 198 100 124 155 10,000 - 15,000 ... 100 130 152 181 100 121 131 146 15,000 - 20,000 ... 100 139 163 195 100 120 219 141 20,000 - 30,000 ... 100 134 171 209 100 116 128 133 30,000 - 40,000 ... 100 123 151 170 100 107 128 142 40,000 - 70,000 ... 100 116 142 175 100 105 112 124 70,000 - 100,000 ... 100 119 139 154 100 106 117 118 100,000 - 150,000 ... 100 157 204 232 100 112 131 140 150,000 and over ..... 100 153 183 218 100 135 151 172
1955 1960 1965 1969 *Consumer Price Index: 100 110 119 140
The papers have been grouped by circulation sizes, based on 1969 circulation, and indices have been constructed to measure the movement of rates for each group over the 1955 to 1969 period. These indices give a measure of the degree of inflation of rates over the period.
The results show that rates per line for all size-groups have increased considerably faster than consumer prices over the period. While there is a considerable range in the rates of increase in rates per line, the lowest increase was 54 per cent for the 70,000 to 100,000 group, while consumer prices over the same period increased by 40 per cent. Both the smallest and largest circulation groups had rate per line increases of 118 per cent - 119 per cent, roughly three times the rate of increase in consumer prices.
For all except the 5,000 - 7,000-group, milline rates increased at a considerably slower rate than rates per line. This is explained by the fact that circulation for the papers in these groups grew at a faster rate than the rates per line for advertising.
Assuming that the papers on average maintained a relatively constant proportion of advertising to total space, changes in milline rates indicate changes in revenue required to meet the per column costs of publication (including profit). Since milline rates also provide the best measure of the cost per unit of advertising services rendered by a newspaper to an advertiser, they give the best measure of the degree of inflationary rate increases.
While milline rates increased for all groups, the rate of inflation was, for a number of groups, considerably less than the overall rate of inflation in the economy as indicated by the consumer price index. Milline rates for the four smallest circulation groups, the 30,000-to-40,000 groups, and the 150,000 + -group increased at a faster rate than consumer prices. Milline rates for intermediate-size papers in the 40,000-to-100,000 circulation range increased at a considerably slower rate than consumer prices. Advertisers in papers of this size range thus experienced an increase in per-unit coasts of advertising which was considerably less than the per-unit increase in the prices of products which they marketed.
It is nevertheless undeniable that inflationary trends in advertising rates have been relatively strong over the period. It has already been concluded that this inflation was sparked by growth in demand throughout most of the period. The rate of growth in demand for advertising space has permitted rate increases of the extent indicated. These rate increases have been such as to yield an increase in profit’s share of the total value added of the industry, indicating that demand growth was greater than the growth in costs. In light of this conclusion, other trends in demand for advertising space revealed in this study, which have been classified as “problems” for daily newspapers, must be kept in perspective. These problems, such as the increasingly strong position of weeklies in the retail advertising field, and the appropriation of national advertising by television, really imply two things. First, daily newspaper publishing would have been even more profitable in the past if such “problems” had not presented themselves. Second, these “problem” trends offer warnings for the future. If daily newspaper publishing is to remain a healthy, viable industry, steps must be taken by publishers to ensure that dangerous trends evident today are not the thin edge of more destructive forces of the future. Comparative Rates in 1969 Chart 6 plots the 1969 national milline rates for all daily newspapers in Canada against the circulation of the papers. The results are extremely important. The solid line of the graph traces the trend in rates as the circulation size of newspapers increases. Fitted to the data, it forms a relatively smooth curve linear line sloping downward to the right. This line indicates that, as a general relationship, the larger the circulation of a newspaper, the lower the milline rate charged. The shape of this line suggests that the larger the circulation of a paper, the smaller is the cost-per-line-printed. Assuming that advertising space is a relatively constant proportion of total space, the milline rate could be transposed by an appropriate multiple to yield the revenue per million lines printed. This revenue function would take the same shape as the functional relationship between milline rates and circulation. If revenue per line is roughly equal to cost per line (“cost” including “normal” profit) then cost-per-line-printed decreases as circulation increases. The supposition that the revenue-per-line function takes the same general shape as the cost function assumes that daily newspaper publishers in the large size range do not take
significantly larger “monopoly” profits than those in the smaller size range. This assumption is justified on a number of grounds. First, profitability data by and large support this assumption. Second, the countervailing power of large-scale manufacturing firms, chain stores, and department stores is probably sufficient to prevent newspapers in general from taking large monopoly profits. Third, if the shape of the graph is dictated by the fact that some daily newspapers are taking larger monopoly profits than others, then one would have to conclude that the small dailies are the culprits.
This is highly improbable, and it is not supported by other data. Fourth, the generation of monopoly profits depends upon an industry being isolated from effective competition from other industries providing a similar service. Competition from weeklies, radio, and television is relatively strong for papers of all sizes, making it improbable that small dailies are in a position to generate significantly greater monopoly profits than larger papers.
If these assumptions are correct, then the graph outlined here also outlines the shape of the cost function for the industry. This in turn suggests that costs-per-line decrease significantly as the number of lines printed increases. Since costs are extremely important in determining milline rates, the whole question of the relationship of costs to circulation is investigated in more detail in a separate section.
Assuming for the moment that the shape of the rate function on the graph is determined by realities invoked by costs, this has important implications for competitive conditions in the industry. Since advertisers, in choosing their advertising vehicle, are primarily concerned with the cost-per-potential-consumer-reached, it follows that larger circulation papers are in a position to offer advertisers a more attractive advertising vehicle than smaller papers in the same market. Further, the greater the discrepancy in circulation, the greater the differences in relative costs to advertisers.
An example from the graph illustrates this point. Suppose there are two daily newspapers in an area, one with a circulation of 10,000, and the other with a circulation of 50,000. If the papers both operate under conditions similar to existing papers in Canada, the milline rate charge for the smaller paper will be approximately $13.50, while for the larger paper it will be approximately $4.75. Faced with a choice between the two papers, advertising will find the lower cost paper to give better value for money, since the smaller paper costs almost three times as much per-potential-customer as the larger paper.
This example indicates, in a preliminary way, the tremendous competitive advantage that larger papers appear to have, on the basis of data presented so far, over competing smaller papers. The extent to which relationship is immutable due to underlying conditions of production will be investigated further in the next section on costs. Assuming for the moment, however, that the general relationship of milline rates to size does hold, what can a smaller paper competing with a larger do. to attract the necessary share of advertising dollars?
First, a smaller paper must isolate a separate and distinguishable part of the reading community from the other daily papers, and be able to show clearly that there is little duplication
of coverage with larger papers with lower milline rates. Second, it must provide lower cost-per-reader coverage than weeklies which have circulation among the same readers. Third, it would do well to have a readership that cannot be reached at a lower cost by some other medium like television. This would help to avoid the possibility that advertisers may obtain lower cost total coverage by using a combination of television and the larger daily, rather than the two dailies. Fourth, it must somehow convince advertisers that the coverage it provides is in some way important enough to the advertiser to justify his paying a much higher rate-per-potential-customer-reached.
If the smaller paper in a competitive situation is unable to do all of these things, it stands little chance of attracting sufficient advertising dollars to remain operational. Nothing is more cold-blooded than the advertising dollar. Understandably an advertiser wishes to minimize his expenditure-per-consumer, and the lower the cost-per-potential-customer reached, the more attractive the advertising alternative.
The conclusions reached on the basis of the data in this graph provide an extremely important hypothesis regarding the causal forces leading to the development of monopoly daily papers in most Canadian cities. It would appear that larger papers are able to offer a lower-cost advertising vehicle than smaller papers. If this is so, larger papers are in a position to appropriate a larger share of the advertising in the market. Since advertising is the life-blood of a newspaper, this makes it difficult for a smaller paper to survive. For the same reason, new entrants have little chance of competing effectively. By its very nature, a new entrant starts small, relative to the size of the competing paper, and this size factor is an immediate strike against the now entrant. Combination Rates When two papers integrate their advertising activities and require that ads be placed in both papers at a single rate, the papers are said to have established a combination rate. Combination rates are established when there is a common interest on the part of the publishers to maintain both papers. The practice is a means of restraining the competitive factors that arise when two papers of a different size operate in the same market. As has been pointed out, if the papers operate independently and restrict themselves to relatively normal profits, the cost to advertisers per potential customer would appear to be much lower for the larger paper. As a result, through time, advertisers would be expected to withdraw support from the smaller, more costly paper, switching to the larger paper. This would eventually lead to great difficulties for the smaller paper.
The use of a combination rate in fact forces the advertiser to subsidize the operation of the smaller paper. If he wishes to advertise in a daily newspaper, he must advertise in both papers. The result is that advertisers usually carry a greater advertising load than they would if they could place ads in the single paper of their choice. In addition, the establishment of a common rate for both papers diminishes the force of competitive cost factors which lead to increasing discrepancies in relative market shares of advertising if each paper has its own rate.
An alternative to the use of combination rates would be to maintain the rates for the larger paper at abnormally high levels so as to minimize the discrepancy in the two sets of rates. The larger paper would then earn large monopoly profits, and rates could be kept at a level that would permit the smaller paper to continue to draw sufficient advertising so as to be profitable also.
This alternative has disadvantages. In some cases it would be suspect as a form of price fixing under restrictive trade practices legislation. It would also lead to milline rates for the larger paper greatly out of line with other papers in Canada of equal size. This would create a strong adverse reaction on the part of advertisers, a reaction most papers are not willing to risk.
By the use of combination rates, a more reasonable milline rate can be set for the larger paper while at the same time keeping the advertising cost per subscriber the same for both papers. A rate can be set that keeps the two papers, each taken as a single unit, profitable, even though excess profits from the one paper are in fact subsidizing the other.
Combination rates offer an advantage in addition to that of establishing a common milline rate for two papers of differing sizes. In cases where there is considerable duplication of circulation (for example, morning and evening papers in the same city) not even equal milline rates Would be sufficient to attract sufficient advertising to both papers Most advertisers would use the larger paper, with the result that the smaller paper would receive very little advertising. By the introduction of combinations, advertisers are faced with an all-or-nothing choice. The combination rate system generates a greater volume of advertising than there

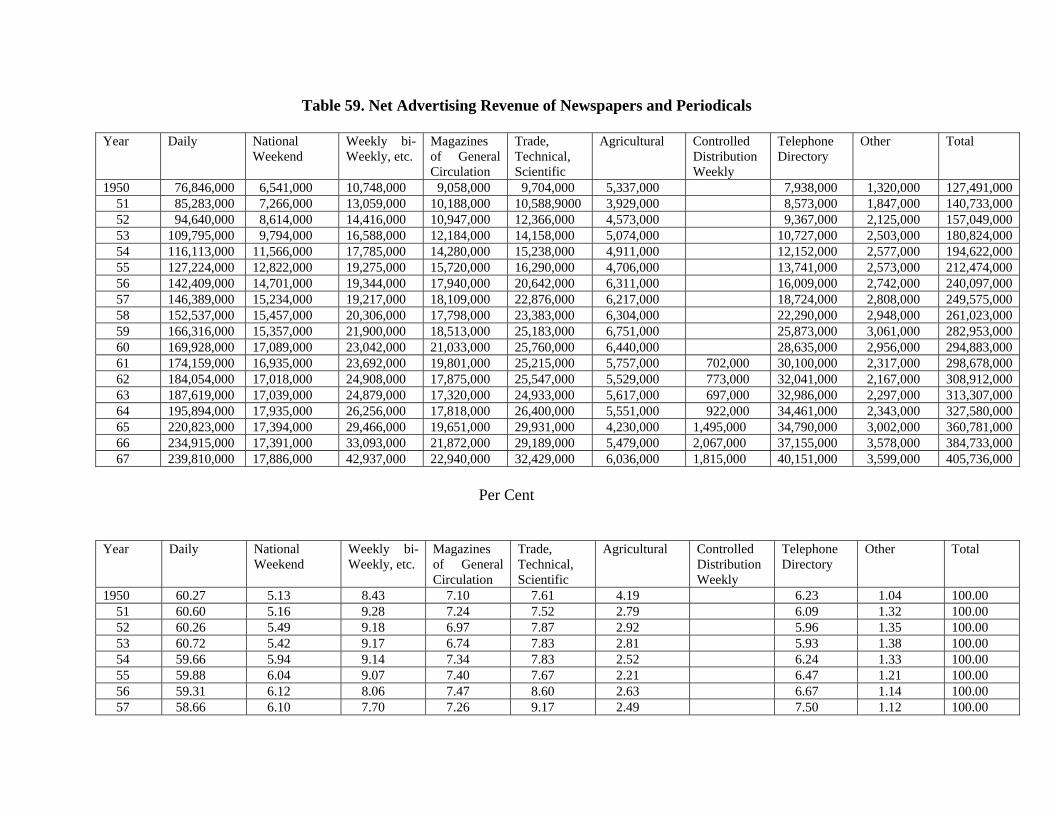
Table 59. Net Advertising Revenue of Newspapers and Periodicals
Year Daily National Weekend
Weekly bi-Weekly, etc.
Magazines of General Circulation
Trade, Technical, Scientific
Agricultural Controlled Distribution Weekly
Telephone Directory
Other Total
1950 76,846,000 6,541,000 10,748,000 9,058,000 9,704,000 5,337,000 7,938,000 1,320,000 127,491,000 51 85,283,000 7,266,000 13,059,000 10,188,000 10,588,9000 3,929,000 8,573,000 1,847,000 140,733,000 52 94,640,000 8,614,000 14,416,000 10,947,000 12,366,000 4,573,000 9,367,000 2,125,000 157,049,000 53 109,795,000 9,794,000 16,588,000 12,184,000 14,158,000 5,074,000 10,727,000 2,503,000 180,824,000 54 116,113,000 11,566,000 17,785,000 14,280,000 15,238,000 4,911,000 12,152,000 2,577,000 194,622,000 55 127,224,000 12,822,000 19,275,000 15,720,000 16,290,000 4,706,000 13,741,000 2,573,000 212,474,000 56 142,409,000 14,701,000 19,344,000 17,940,000 20,642,000 6,311,000 16,009,000 2,742,000 240,097,000 57 146,389,000 15,234,000 19,217,000 18,109,000 22,876,000 6,217,000 18,724,000 2,808,000 249,575,000 58 152,537,000 15,457,000 20,306,000 17,798,000 23,383,000 6,304,000 22,290,000 2,948,000 261,023,000 59 166,316,000 15,357,000 21,900,000 18,513,000 25,183,000 6,751,000 25,873,000 3,061,000 282,953,000 60 169,928,000 17,089,000 23,042,000 21,033,000 25,760,000 6,440,000 28,635,000 2,956,000 294,883,000 61 174,159,000 16,935,000 23,692,000 19,801,000 25,215,000 5,757,000 702,000 30,100,000 2,317,000 298,678,000 62 184,054,000 17,018,000 24,908,000 17,875,000 25,547,000 5,529,000 773,000 32,041,000 2,167,000 308,912,000 63 187,619,000 17,039,000 24,879,000 17,320,000 24,933,000 5,617,000 697,000 32,986,000 2,297,000 313,307,000 64 195,894,000 17,935,000 26,256,000 17,818,000 26,400,000 5,551,000 922,000 34,461,000 2,343,000 327,580,000 65 220,823,000 17,394,000 29,466,000 19,651,000 29,931,000 4,230,000 1,495,000 34,790,000 3,002,000 360,781,000 66 234,915,000 17,391,000 33,093,000 21,872,000 29,189,000 5,479,000 2,067,000 37,155,000 3,578,000 384,733,000 67 239,810,000 17,886,000 42,937,000 22,940,000 32,429,000 6,036,000 1,815,000 40,151,000 3,599,000 405,736,000
Per Cent
Year Daily National Weekend
Weekly bi-Weekly, etc.
Magazines of General Circulation
Trade, Technical, Scientific
Agricultural Controlled Distribution Weekly
Telephone Directory
Other Total
1950 60.27 5.13 8.43 7.10 7.61 4.19 6.23 1.04 100.00 51 60.60 5.16 9.28 7.24 7.52 2.79 6.09 1.32 100.00 52 60.26 5.49 9.18 6.97 7.87 2.92 5.96 1.35 100.00 53 60.72 5.42 9.17 6.74 7.83 2.81 5.93 1.38 100.00 54 59.66 5.94 9.14 7.34 7.83 2.52 6.24 1.33 100.00 55 59.88 6.04 9.07 7.40 7.67 2.21 6.47 1.21 100.00 56 59.31 6.12 8.06 7.47 8.60 2.63 6.67 1.14 100.00 57 58.66 6.10 7.70 7.26 9.17 2.49 7.50 1.12 100.00
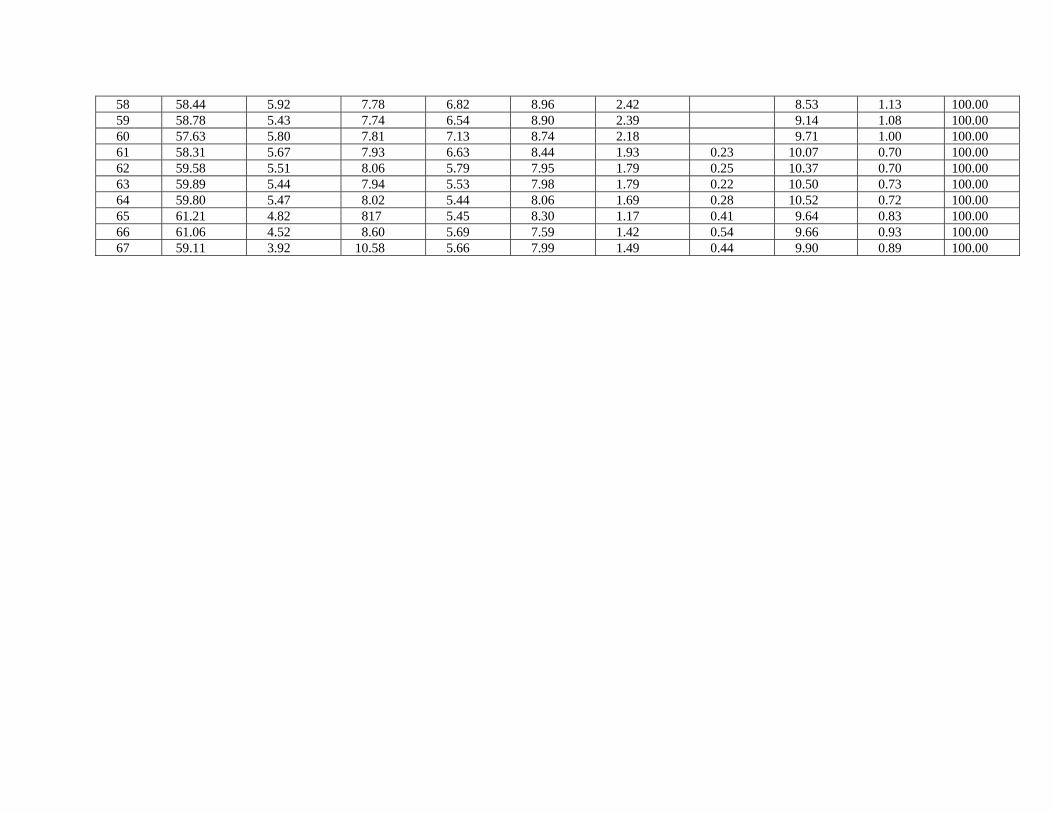
58 58.44 5.92 7.78 6.82 8.96 2.42 8.53 1.13 100.00 59 58.78 5.43 7.74 6.54 8.90 2.39 9.14 1.08 100.00 60 57.63 5.80 7.81 7.13 8.74 2.18 9.71 1.00 100.00 61 58.31 5.67 7.93 6.63 8.44 1.93 0.23 10.07 0.70 100.00 62 59.58 5.51 8.06 5.79 7.95 1.79 0.25 10.37 0.70 100.00 63 59.89 5.44 7.94 5.53 7.98 1.79 0.22 10.50 0.73 100.00 64 59.80 5.47 8.02 5.44 8.06 1.69 0.28 10.52 0.72 100.00 65 61.21 4.82 817 5.45 8.30 1.17 0.41 9.64 0.83 100.00 66 61.06 4.52 8.60 5.69 7.59 1.42 0.54 9.66 0.93 100.00 67 59.11 3.92 10.58 5.66 7.99 1.49 0.44 9.90 0.89 100.00
There are a number of explanations for the rapid growth in revenues during the period 1950-56. The period was one of relatively rapid growth in consumer expenditures. These expenditures increased by 64 per cent over the period, advancing from $11.9 billion in 1950 to $19.5 billion in 1956. However, this in itself does not account for all of the growth. It was further augmented by an increasing emphasis on advertising by business as the earlier successes of mass advertising programmes became apparent. The lack of any widespread application of new technology meant that daily newspapers got their full share of these proportionately increasing advertising expenditures.
A number of reasons can be advanced for this increasing emphasis on advertising. First, the first half of the 1950s was one of a great consumer boom in Canada, with producers of consumer goods becoming more and more conscious of the gains to be had from going directly to the consumer with messages about their products. Second, the advertising battle between producers of competing products escalated rapidly over the period as producers became more aware of the need to match their competitors in advertising expenditures if they were to maintain their market shares. Third, the 1940s and early 1950s were a period of significantly increased circulation of the mass media, and of daily newspapers in particular. The circulation of daily newspapers increased by 53.0 per cent from 1940 to 1950, and a further 12.6 per cent from 1950 to 1955. Circulation-per-capita in Canada increased from 0.1879 in 1940 to 0.2364 in 1950, and to 0.2374 in 1955. These growths in circulation increased the effectiveness of advertising in daily newspapers. Advertisers were perhaps a bit slow to realize the implications of these changes, but when this realization came in the early 1950s they took full advantage of it.
The growing emphasis on newspaper advertising as a marketing technique for consumer goods and services is made apparent by the growth of advertising receipts of daily newspapers as a proportion of expenditures on consumer goods and services. Table 60 shows these figures for the 1950 to 1967 period. During the period 1950-56 this proportion rose from 0.641 per cent to 0.732 per cent. Further, in no year over the period did this proportion fall relative to the previous year, something which was not true for any of the two later periods.
However, as has been pointed out in an earlier section, the situation in the period 1950-56 was not confined to daily newspapers alone. Advertising as a whole was being emphasized much more as a marketing technique. This is indicated by the fact that total advertising expenditures increased from 1.90 per cent of consumer expenditures in 1950 to 2.30 per cent of consumer expenditures in 1956.
It is interesting to note that most of the rapid growth in daily newspaper advertising in the period 1950-56 went to already-established papers. The only new dailies initiated during this period were the Daily Miner and News (Kenora), the Packet and Times (Orillia), the Daily Sentinel (Kamloops), and the Daily Bulletin (Kimberley) .
The rate of growth of daily newspaper advertising slowed rather abruptly in 1957, a year significant for advertising in a number of ways. First of all, it inaugurated a period of much-reduced growth in advertising revenues of daily newspapers, which except for one brief interlude in 1959, was to last until 1964. Second, it marked the beginning of a long decline in the proportion of daily newspaper advertising to total expenditures on consumer goods and services;
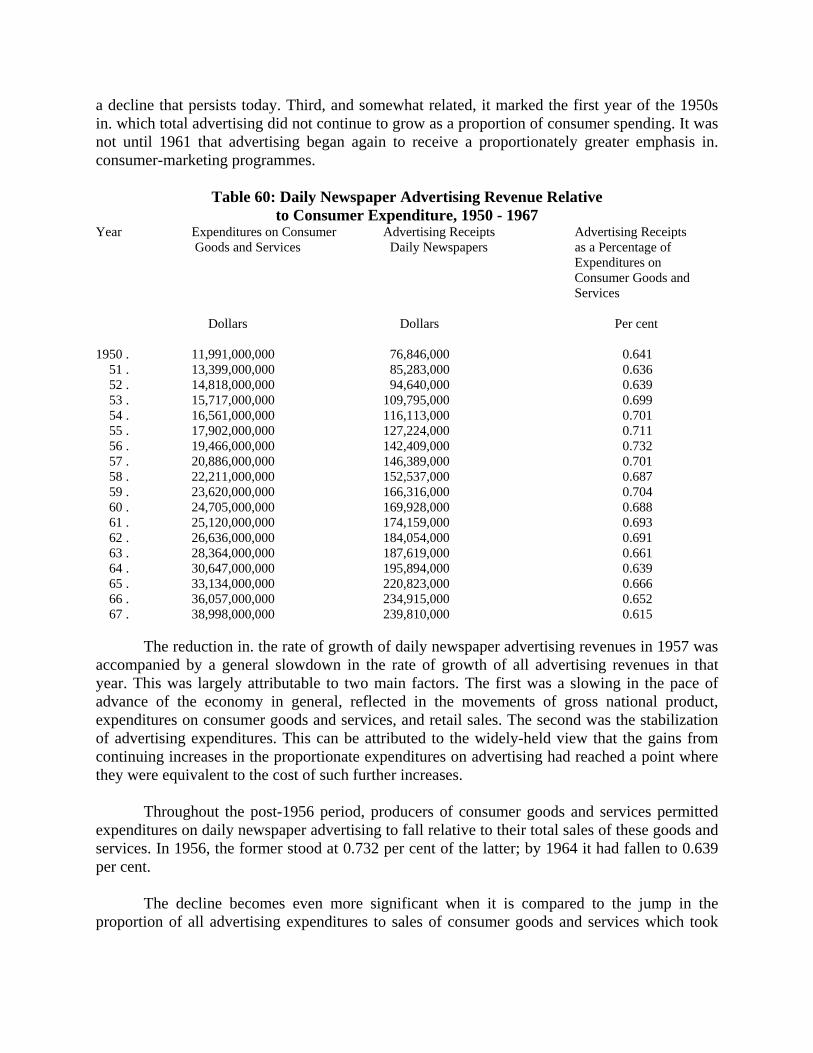
a decline that persists today. Third, and somewhat related, it marked the first year of the 1950s in. which total advertising did not continue to grow as a proportion of consumer spending. It was not until 1961 that advertising began again to receive a proportionately greater emphasis in. consumer-marketing programmes.
Table 60: Daily Newspaper Advertising Revenue Relative to Consumer Expenditure, 1950 - 1967
Year Expenditures on Consumer Advertising Receipts Advertising Receipts Goods and Services Daily Newspapers as a Percentage of
Expenditures on Consumer Goods and Services
Dollars Dollars Per cent 1950 . 11,991,000,000 76,846,000 0.641 51 . 13,399,000,000 85,283,000 0.636 52 . 14,818,000,000 94,640,000 0.639 53 . 15,717,000,000 109,795,000 0.699 54 . 16,561,000,000 116,113,000 0.701 55 . 17,902,000,000 127,224,000 0.711 56 . 19,466,000,000 142,409,000 0.732 57 . 20,886,000,000 146,389,000 0.701 58 . 22,211,000,000 152,537,000 0.687 59 . 23,620,000,000 166,316,000 0.704 60 . 24,705,000,000 169,928,000 0.688 61 . 25,120,000,000 174,159,000 0.693 62 . 26,636,000,000 184,054,000 0.691 63 . 28,364,000,000 187,619,000 0.661 64 . 30,647,000,000 195,894,000 0.639 65 . 33,134,000,000 220,823,000 0.666 66 . 36,057,000,000 234,915,000 0.652 67 . 38,998,000,000 239,810,000 0.615
The reduction in. the rate of growth of daily newspaper advertising revenues in 1957 was accompanied by a general slowdown in the rate of growth of all advertising revenues in that year. This was largely attributable to two main factors. The first was a slowing in the pace of advance of the economy in general, reflected in the movements of gross national product, expenditures on consumer goods and services, and retail sales. The second was the stabilization of advertising expenditures. This can be attributed to the widely-held view that the gains from continuing increases in the proportionate expenditures on advertising had reached a point where they were equivalent to the cost of such further increases.
Throughout the post-1956 period, producers of consumer goods and services permitted expenditures on daily newspaper advertising to fall relative to their total sales of these goods and services. In 1956, the former stood at 0.732 per cent of the latter; by 1964 it had fallen to 0.639 per cent.
The decline becomes even more significant when it is compared to the jump in the proportion of all advertising expenditures to sales of consumer goods and services which took
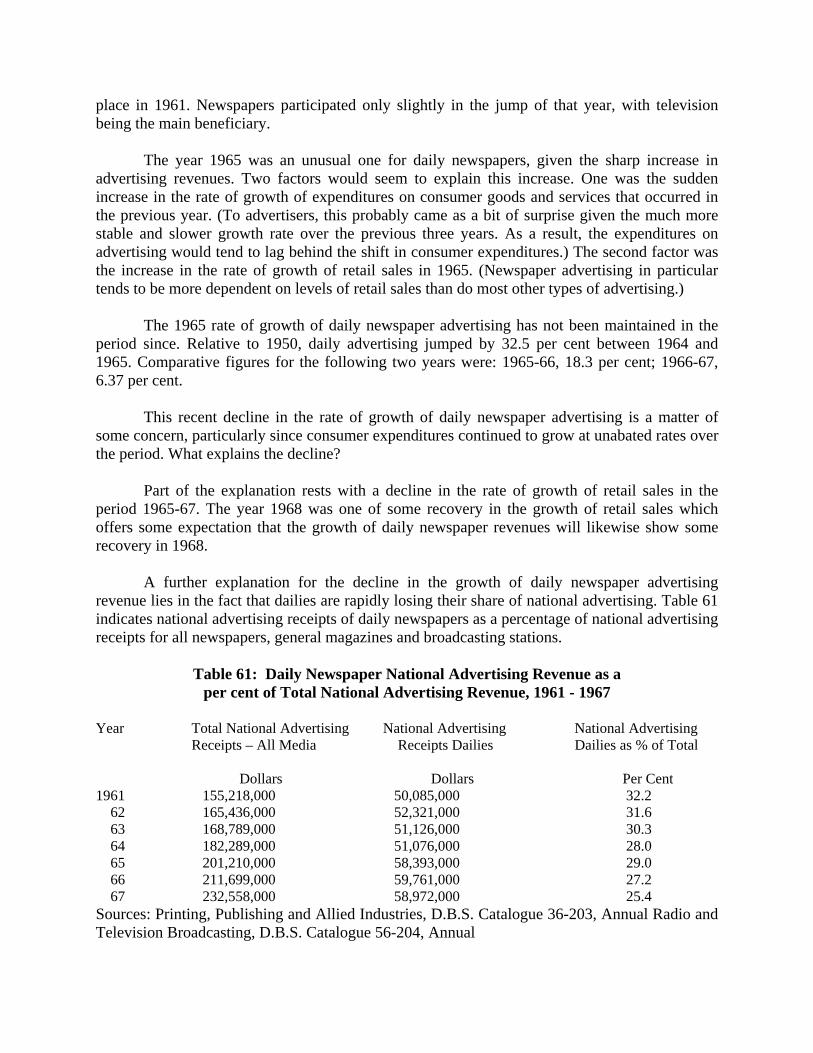
place in 1961. Newspapers participated only slightly in the jump of that year, with television being the main beneficiary.
The year 1965 was an unusual one for daily newspapers, given the sharp increase in advertising revenues. Two factors would seem to explain this increase. One was the sudden increase in the rate of growth of expenditures on consumer goods and services that occurred in the previous year. (To advertisers, this probably came as a bit of surprise given the much more stable and slower growth rate over the previous three years. As a result, the expenditures on advertising would tend to lag behind the shift in consumer expenditures.) The second factor was the increase in the rate of growth of retail sales in 1965. (Newspaper advertising in particular tends to be more dependent on levels of retail sales than do most other types of advertising.)
The 1965 rate of growth of daily newspaper advertising has not been maintained in the period since. Relative to 1950, daily advertising jumped by 32.5 per cent between 1964 and 1965. Comparative figures for the following two years were: 1965-66, 18.3 per cent; 1966-67, 6.37 per cent.
This recent decline in the rate of growth of daily newspaper advertising is a matter of some concern, particularly since consumer expenditures continued to grow at unabated rates over the period. What explains the decline?
Part of the explanation rests with a decline in the rate of growth of retail sales in the period 1965-67. The year 1968 was one of some recovery in the growth of retail sales which offers some expectation that the growth of daily newspaper revenues will likewise show some recovery in 1968.
A further explanation for the decline in the growth of daily newspaper advertising revenue lies in the fact that dailies are rapidly losing their share of national advertising. Table 61 indicates national advertising receipts of daily newspapers as a percentage of national advertising receipts for all newspapers, general magazines and broadcasting stations.
Table 61: Daily Newspaper National Advertising Revenue as a per cent of Total National Advertising Revenue, 1961 - 1967
Year Total National Advertising National Advertising National Advertising Receipts – All Media Receipts Dailies Dailies as % of Total
Dollars Dollars Per Cent 1961 155,218,000 50,085,000 32.2 62 165,436,000 52,321,000 31.6 63 168,789,000 51,126,000 30.3 64 182,289,000 51,076,000 28.0 65 201,210,000 58,393,000 29.0 66 211,699,000 59,761,000 27.2 67 232,558,000 58,972,000 25.4 Sources: Printing, Publishing and Allied Industries, D.B.S. Catalogue 36-203, Annual Radio and Television Broadcasting, D.B.S. Catalogue 56-204, Annual
As can be seen from this table, the importance of daily newspapers in the national advertising picture has declined quite rapidly, a problem of some concern to the industry. The relevance of this problem to the rate structure of daily newspapers is elsewhere investigated. Effects of Changes in Numbers of Newspapers on Revenue Data Some of the changes in the rate of growth of revenues in a particular year might be attributable to the number of dailies then being published. The discussion so far has treated shifts in advertising revenues as being largely a result of shifts in demand for advertising space.
From 1950 to 1956, a period of rapid growth in revenues, only four new dailies emerged. All had circulations below 5,000. Papers ceasing publication during that period were the Edmonton Bulletin and the Montreal Le Canada. Since the relatively large, combined circulations of approximately 50,000 for these two papers appears to have been rapidly picked up by competing papers in those two cities, this change would not have much effect on total advertising revenues.
During the period 1957-64, the period of a slowing of growth of advertising revenues, twenty new dailies began publication and eight ceased publication. Of the eight that ceased publication, four had started during the period. Another four of those that came into being during the period closed down after 1964. Of the sixteen new additions that remained operational in 1964, at least eleven were in the under-5,000 circulation range. Only one, Le Journal de Montreal, was over 10,000 in circulation.
Of the eight that ceased publication, only four had been operational before 1957. One of these, Chicoutimi Le Progres du Saguenay, was located in a single newspaper town. As a result, its closing would have caused some decline in the aggregate advertising revenue data. However, since this was in the 3,500 circulation range, the change was not significant. The other three that ceased publication were of a somewhat larger size. The Montreal Herald was in the 35,000 range the Vancouver Herald in the 30,000 range, and Montreal La Patrie in the 20,000 range. All three of these papers ceased publication in 1957 - La Patrie becoming a weekly in that year. The year 1957 was a rather poor one for growth in daily newspaper revenues. However, there are two reasons for suspecting that this was a phenomenon resulting largely from the rate of growth in demand for advertising space, rather than from the closing of three relatively large newspapers. The first of these reasons is that 1957 was a year of rather slow growth in the economy itself, and particularly in retail sales. The second is that all three of these papers were published in cities with other papers. As a result, a good deal of the circulation, and an even larger portion of the advertising accounts appear to have switched to other papers. In the case of the Vancouver Herald, the accounts .receivable were sold as assets to one of the competing papers in the city.
During the post-1964 period, six papers began publication and eight ceased publication. With the exception of two, these were again relatively small papers, with the changes in advertising opportunities not being large enough to influence total revenue figures appreciably. The two larger papers, the Montreal Metro Express and the Vancouver Times, both began publication in 1964, with the latter ceasing publication in 1965 and the former in 1966. Again, these two papers published in cities with competitors, where the changes in total advertising
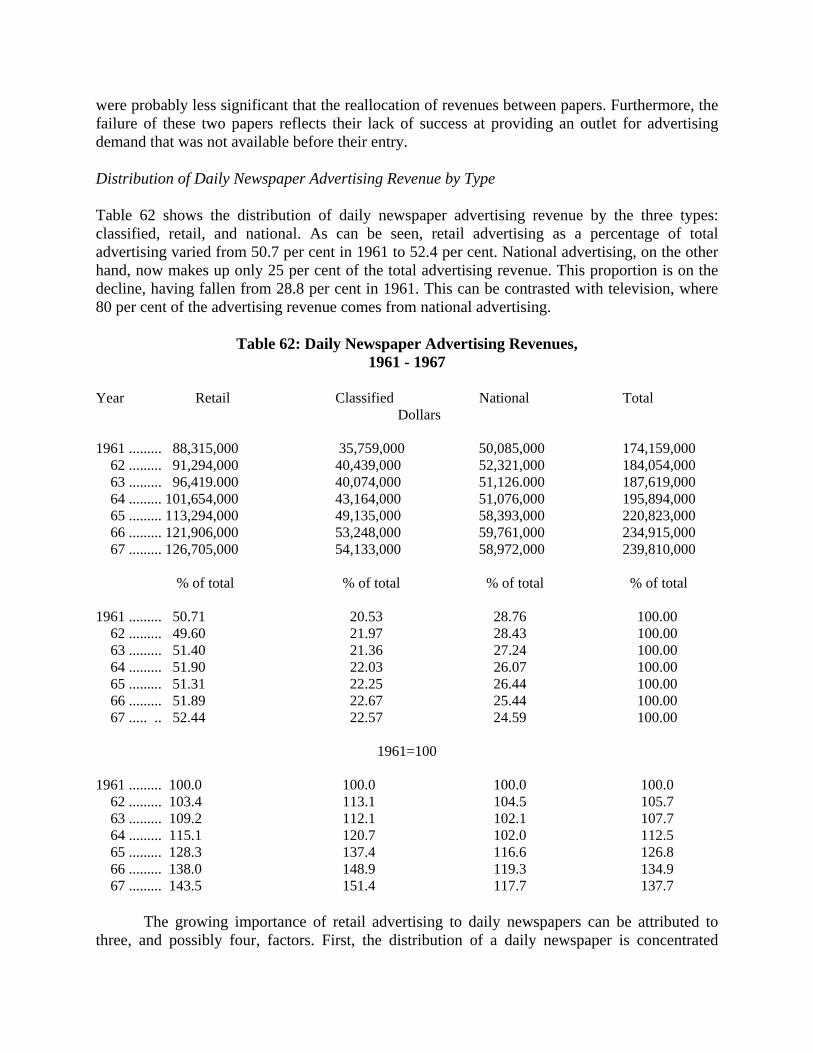
were probably less significant that the reallocation of revenues between papers. Furthermore, the failure of these two papers reflects their lack of success at providing an outlet for advertising demand that was not available before their entry. Distribution of Daily Newspaper Advertising Revenue by Type Table 62 shows the distribution of daily newspaper advertising revenue by the three types: classified, retail, and national. As can be seen, retail advertising as a percentage of total advertising varied from 50.7 per cent in 1961 to 52.4 per cent. National advertising, on the other hand, now makes up only 25 per cent of the total advertising revenue. This proportion is on the decline, having fallen from 28.8 per cent in 1961. This can be contrasted with television, where 80 per cent of the advertising revenue comes from national advertising.
Table 62: Daily Newspaper Advertising Revenues, 1961 - 1967
Year Retail Classified National Total Dollars 1961 ......... 88,315,000 35,759,000 50,085,000 174,159,000 62 ......... 91,294,000 40,439,000 52,321,000 184,054,000 63 ......... 96,419.000 40,074,000 51,126.000 187,619,000 64 ......... 101,654,000 43,164,000 51,076,000 195,894,000 65 ......... 113,294,000 49,135,000 58,393,000 220,823,000 66 ......... 121,906,000 53,248,000 59,761,000 234,915,000 67 ......... 126,705,000 54,133,000 58,972,000 239,810,000 % of total % of total % of total % of total 1961 ......... 50.71 20.53 28.76 100.00 62 ......... 49.60 21.97 28.43 100.00 63 ......... 51.40 21.36 27.24 100.00 64 ......... 51.90 22.03 26.07 100.00 65 ......... 51.31 22.25 26.44 100.00 66 ......... 51.89 22.67 25.44 100.00 67 ..... .. 52.44 22.57 24.59 100.00
1961=100
1961 ......... 100.0 100.0 100.0 100.0 62 ......... 103.4 113.1 104.5 105.7 63 ......... 109.2 112.1 102.1 107.7 64 ......... 115.1 120.7 102.0 112.5 65 ......... 128.3 137.4 116.6 126.8 66 ......... 138.0 148.9 119.3 134.9 67 ......... 143.5 151.4 117.7 137.7
The growing importance of retail advertising to daily newspapers can be attributed to three, and possibly four, factors. First, the distribution of a daily newspaper is concentrated

within a fairly limited geographical area centered around the urban centre in which the newspaper is published. This distribution area is closely coincident with the markets served by retail chain and department stores. In terms of national advertising, newspapers do not really have any form of organization that corresponds closely to broadcast networks, which give regional or national coverage. Newspapers owned as part of a group may be considered somewhat akin to networks, but in fact the similarities are small. Networks are unique in that a single production of both the advertising message and the accompanying programme material can be distributed on a regional or national basis.
Second, newspapers are still the medium best suited to providing the kind of advertising messages preferred by retailers. Retailers tend to depend upon information advertising, containing a good deal of information on product selection and prices. Such ads require more time to absorb than the ten-to sixty-second announcements available on television. Many consumers also prefer to have these ads on record for future reference, a facility not yet available through television.
The third factor is that most national advertising is done by producers who market one or a few products on a regional or national basis. Their interest is in using highly persuasive techniques to convince the consumer to pick their brand name off the store shelf. Television, with its ability to involve the viewer in life-like situations is much more effective at this than newspapers. Thus, television has a "natural" advantage over newspapers for certain types of advertising.
The fourth factor that could have some effect on the relative importance of retail advertising vis-a-vis national advertising is the relation of the rates for these two types of advertising. Rates for national advertising in daily newspapers are considerably higher than those for retail advertising.
Of the three types of daily newspaper advertising revenues, only classified has matched the overall growth rate of all advertising expenditures in the period 1961-1967. Total advertising expenditures over the period grew by 53.3 per cent, while classified ad revenues grew by 51.4 per cent. Retail advertising, on the other hand, grew by only 43.5 per cent, and national advertising grew by 17.7 per cent. These figures reflect clearly the effect of competing media, particularly television, on newspaper advertising revenues. Fluctuations in Advertising Revenue
Advertising lineage undergoes considerable fluctuation from month to month within any given year. Table 63 indicates monthly advertising lineage, and these figures as a percentage of the annual total, and of the monthly average, for thirteen daily newspapers in Canada in 1968. Similar fluctuations in advertising lineage occur within any given week as well. The early part of the week tends to be the low lineage period, with a steady growth from Monday until Thursday. Thursday is the peak day, with a decline occurring on Friday and Saturday. The Thursday peak results from the emphasis on Thursday advertising by retail chain and department stores in anticipation of heavy weekend shopping. These weekly fluctuations also mean that publishers

have considerable labour and equipment in excess of needs, particularly in the early part of the week. This problem is reduced somewhat through the advance preparation of advertising editorial and filler material, with as much as possible of this work channelled into the early parts of the week.
Table 63: Monthly Lineage for Thirteen Daily Newspapers* in 1968
1968 1968 Month Lineage Total Monthly Average thousand lines % % January .................... 22,745,000 7.2 85.3 February ................... 23,176,000 7.3 86.9 March ...................... 27,356,000 8.5 102.6 April ...................... 27,730,000 8.6 104.0 May ....................... 30,341,000 9.4 113.8 June ....................... 26,610,000 8.4 99.8 July ....................... 22,744,000 7.2 85.3 August ..................... 24,703,000 7.8 92.7 September 27,774,000 8.6 104.2 October .................... 29,656,000 9.2 111.2 November .................. 30,680,000 9.6 115.1 December ................... 26,426,000 8.2 99.4 Total ..................... 319,941,000 100.0 *Montreal: Star, .Gazette, La Presse; Toronto: Globe & Mail, Telegram, Star; Calgary Herald; Hamilton Spectator; Kitchener-Waterloo Record; Lethbridge Herald; North Bay Nugget; Ottawa Citizen; Regina Leader-Post. Source: Media Records Inc., New York Editor and Publisher, 1968, Monthly. The growth pattern of advertising revenue for weekly newspapers has been less stable than that of dailies. Weeklies participated fully in the advertising boom in the first half of the 1950s, but were strongly affected by the slowdown in growth of retail sales in the period 1956-57. In the period 1957-60, the growth of advertising revenues going to weeklies recovered somewhat, but again slowed to a very low rate in the period 1960-63. The difficulties in the period 1960-63 can be attributed to the influence of television on both revenue sources and circulation. (See Table 64.)
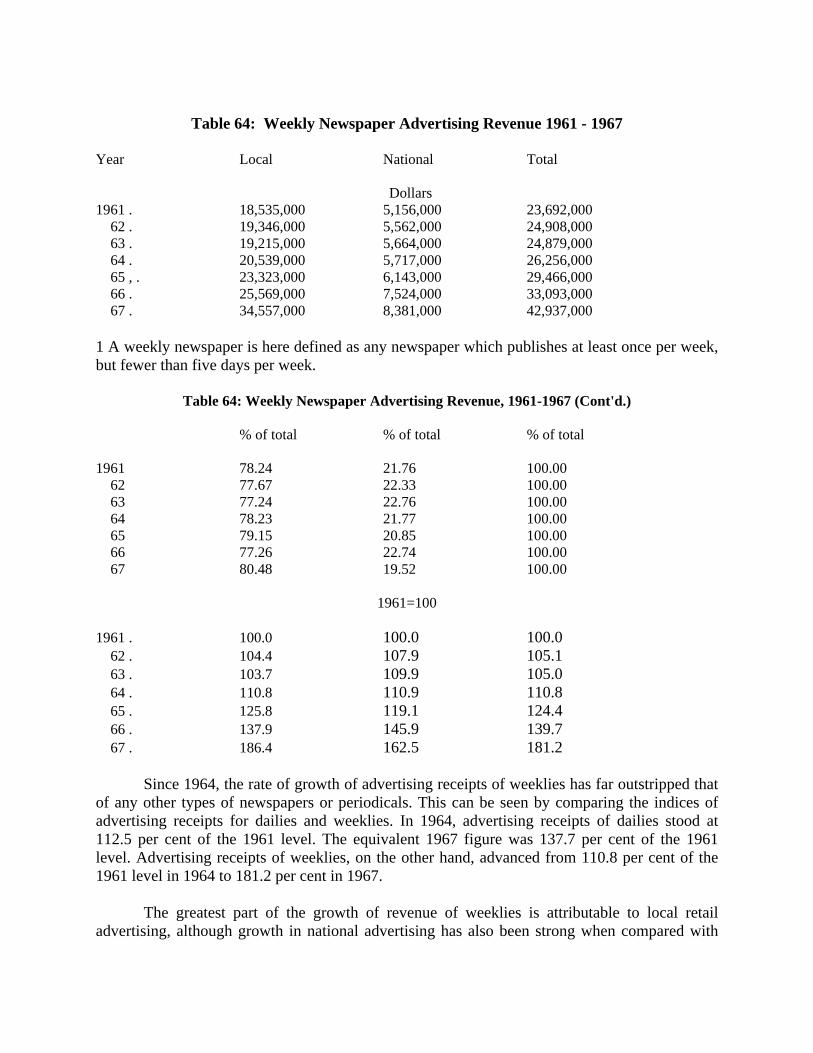
Table 64: Weekly Newspaper Advertising Revenue 1961 - 1967
Year Local National Total
Dollars 1961 . 18,535,000 5,156,000 23,692,000 62 . 19,346,000 5,562,000 24,908,000 63 . 19,215,000 5,664,000 24,879,000 64 . 20,539,000 5,717,000 26,256,000 65 , . 23,323,000 6,143,000 29,466,000 66 . 25,569,000 7,524,000 33,093,000 67 . 34,557,000 8,381,000 42,937,000 1 A weekly newspaper is here defined as any newspaper which publishes at least once per week, but fewer than five days per week.
Table 64: Weekly Newspaper Advertising Revenue, 1961-1967 (Cont'd.)
% of total % of total % of total 1961 78.24 21.76 100.00 62 77.67 22.33 100.00 63 77.24 22.76 100.00 64 78.23 21.77 100.00 65 79.15 20.85 100.00 66 77.26 22.74 100.00 67 80.48 19.52 100.00
1961=100 1961 . 100.0 100.0 100.0 62 . 104.4 107.9 105.1 63 . 103.7 109.9 105.0 64 . 110.8 110.9 110.8 65 . 125.8 119.1 124.4 66 . 137.9 145.9 139.7 67 . 186.4 162.5 181.2
Since 1964, the rate of growth of advertising receipts of weeklies has far outstripped that of any other types of newspapers or periodicals. This can be seen by comparing the indices of advertising receipts for dailies and weeklies. In 1964, advertising receipts of dailies stood at 112.5 per cent of the 1961 level. The equivalent 1967 figure was 137.7 per cent of the 1961 level. Advertising receipts of weeklies, on the other hand, advanced from 110.8 per cent of the 1961 level in 1964 to 181.2 per cent in 1967.
The greatest part of the growth of revenue of weeklies is attributable to local retail advertising, although growth in national advertising has also been strong when compared with

that of the dailies. National advertising accounts for approximately 20 per cent of the advertising receipts of weeklies. This phenomenal rate of growth of advertising receipts of weekly newspapers is a matter of some concern to daily newspapers. Much of the growth in receipts of weeklies would appear to be at the expense of dailies. Why is this so? Four factors appear to contribute to the relative strength of weeklies 1. A growing preference of some retail advertisers for the selectivity of coverage provided by urban weeklies. Weeklies give more selective household coverage geographically than many of the larger dailies. If retail advertisers wish to promote items or specials that are restricted to a single shopping centre, the metropolitan daily becomes an expensive form of advertising. It gives coverage throughout the metropolitan and surrounding area, and advertising rates are set on this basis. Weeklies on the, other hand, generally have a circulation restricted to a much smaller community; a community with boundaries more coincidental with those of individual community shopping areas. 2. Growth in circulation. The circulation growth of weeklies has been even greater than the growth in advertising revenues. Advertisers are primarily concerned with consumer coverage. Since weeklies can provide this coverage, they can draw the advertising dollars. 3. The development of cost-reducing centralization of the composing and printing operations. One of the most dominant cost factors in weekly newspapers has been the large unused capacity carried in composing and printing equipment. During the 1960s there has been a shift in many areas towards the use of a single centralized composing and printing plant by a number of weekly newspapers, thereby markedly reducing overhead costs for each individual newspaper. This development of centralized composing and printing has been as much the result of growing regional concentrations of population as any other factor. With a wide geographical dispersion of the population weekly newspapers are likewise widely dispersed. Distance alone, with resulting time and transportation cost factors, prevents any significant centralization of operations. However, in areas around the larger metropolitan centres, the growth in population has provided an opportunity for new weeklies to develop and established ones to extend their circulation, leading to a recapitalization of the industry. With distances between circulation areas reduced, this recapitalization has in a number of cases taken the form of centralized composing and printing plants. 4. The application of new technology to reduce costs. Many weeklies are now printed by the offset process, which uses printing plates that are photographic negatives of the page to be printed. As a result, the pages of the paper can be "made up" through clipping and pasting copy onto sheets of paper the size of the page. This stage of the composition of the paper can be handled quite readily without the aid of the highly-skilled and highly-paid staff and costly equipment used for makeup with hot type. The development of offset printing has given renewed life to the "family newspaper" in which all of the publishing tasks can be handled by the publisher and his family in co-operation with a contract printer who does the actual composing and printing.
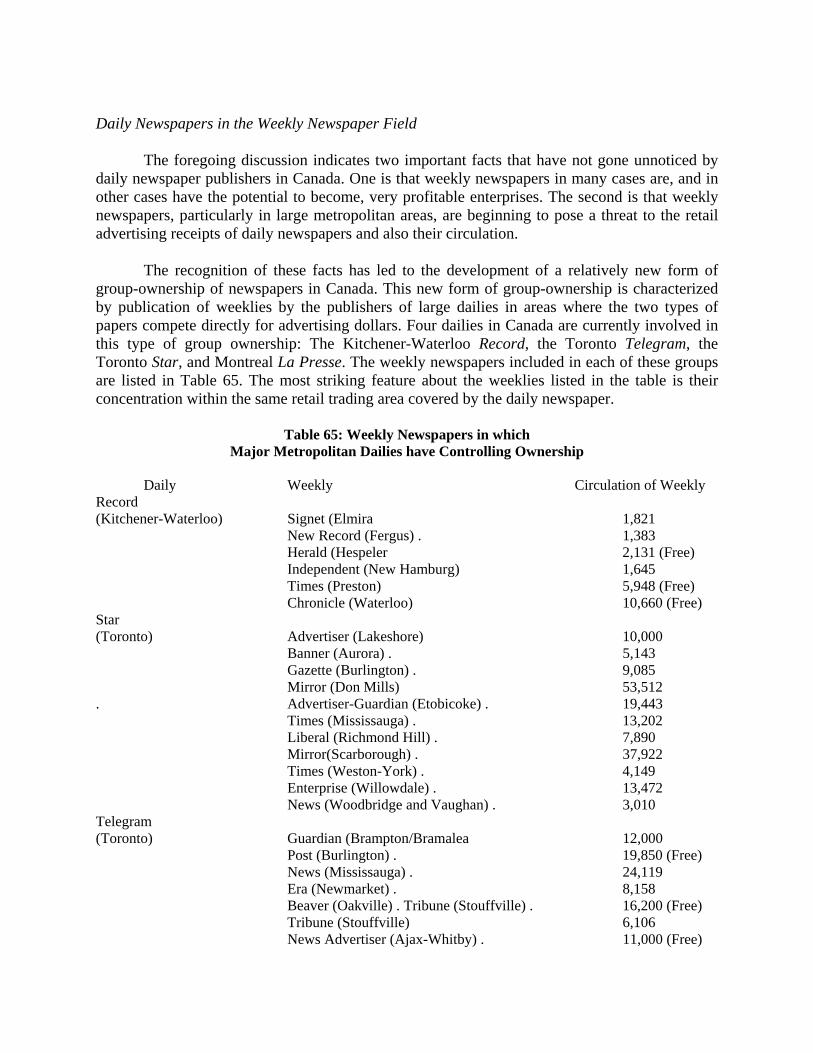
Daily Newspapers in the Weekly Newspaper Field
The foregoing discussion indicates two important facts that have not gone unnoticed by daily newspaper publishers in Canada. One is that weekly newspapers in many cases are, and in other cases have the potential to become, very profitable enterprises. The second is that weekly newspapers, particularly in large metropolitan areas, are beginning to pose a threat to the retail advertising receipts of daily newspapers and also their circulation.
The recognition of these facts has led to the development of a relatively new form of group-ownership of newspapers in Canada. This new form of group-ownership is characterized by publication of weeklies by the publishers of large dailies in areas where the two types of papers compete directly for advertising dollars. Four dailies in Canada are currently involved in this type of group ownership: The Kitchener-Waterloo Record, the Toronto Telegram, the Toronto Star, and Montreal La Presse. The weekly newspapers included in each of these groups are listed in Table 65. The most striking feature about the weeklies listed in the table is their concentration within the same retail trading area covered by the daily newspaper.
Table 65: Weekly Newspapers in which Major Metropolitan Dailies have Controlling Ownership
Daily Weekly Circulation of Weekly
Record (Kitchener-Waterloo) Signet (Elmira 1,821 New Record (Fergus) . 1,383 Herald (Hespeler 2,131 (Free) Independent (New Hamburg) 1,645 Times (Preston) 5,948 (Free) Chronicle (Waterloo) 10,660 (Free) Star (Toronto) Advertiser (Lakeshore) 10,000 Banner (Aurora) . 5,143 Gazette (Burlington) . 9,085 Mirror (Don Mills) 53,512 . Advertiser-Guardian (Etobicoke) . 19,443 Times (Mississauga) . 13,202 Liberal (Richmond Hill) . 7,890
Mirror(Scarborough) . 37,922 Times (Weston-York) . 4,149 Enterprise (Willowdale) . 13,472 News (Woodbridge and Vaughan) . 3,010
Telegram (Toronto) Guardian (Brampton/Bramalea 12,000
Post (Burlington) . 19,850 (Free) News (Mississauga) . 24,119 Era (Newmarket) . 8,158 Beaver (Oakville) . Tribune (Stouffville) . 16,200 (Free) Tribune (Stouffville) 6,106 News Advertiser (Ajax-Whitby) . 11,000 (Free)

In many ways, the publishers within each of these groups are still undecided about how
and to what extent the publication of weeklies should be integrated with the publication of the dailies to provide maximum advantage. Most publishers are watching developments in large cities in the United States, where a few suburban daily papers have had significant success. As a result, there has no doubt been some thought that some of these weeklies might someday be consolidated and developed into dailies.
On the other hand, many suburban dailies in the United States have suffered great financial problems. In addition, Toronto and Montreal differ from many larger American cities in that the "inner city" continues to grow as a residential area. The metropolitan area of the Canadian city remains much more of an integrated whole with strong common interests, making it much easier to maintain circulation for the metropolitan daily.
These publishers, for the present at least, seem content to build up local community circulation with the idea of publishing the paper on a weekly basis for some time into the future. They concentrate on major suburban shopping centres for advertising revenue, having concluded that advertising dollars can be mobilized in these centres by local weeklies which the daily with total metropolitan coverage can hot attract.
Neither the editorial nor the production activities of the dailies are currently integrated with those of the weeklies. On the composing and printing side, there appears to be no contemplation of integration. Very few cost economies would be realized by carrying out these activities in plants used to produce daily newspapers, given that the content of the papers is different. The costs involved in introducing special press runs for the weeklies would be greater than any savings in capital outlay. In fact, on the composing and printing side, integration has taken quite a different direction.
These groups are using modern offset plants to produce a number, and in some cases, all of the weekly papers in each respective group. This spreading of overhead costs has led to significant cost reductions for individual papers. A good example of this is the case of Inland Publishing Co. (printer of the Toronto Telegram) which has just completed construction of a modern new offset plant with a computerized photo composition unit. This plant is used to compose and print most of the weeklies published by Inland.
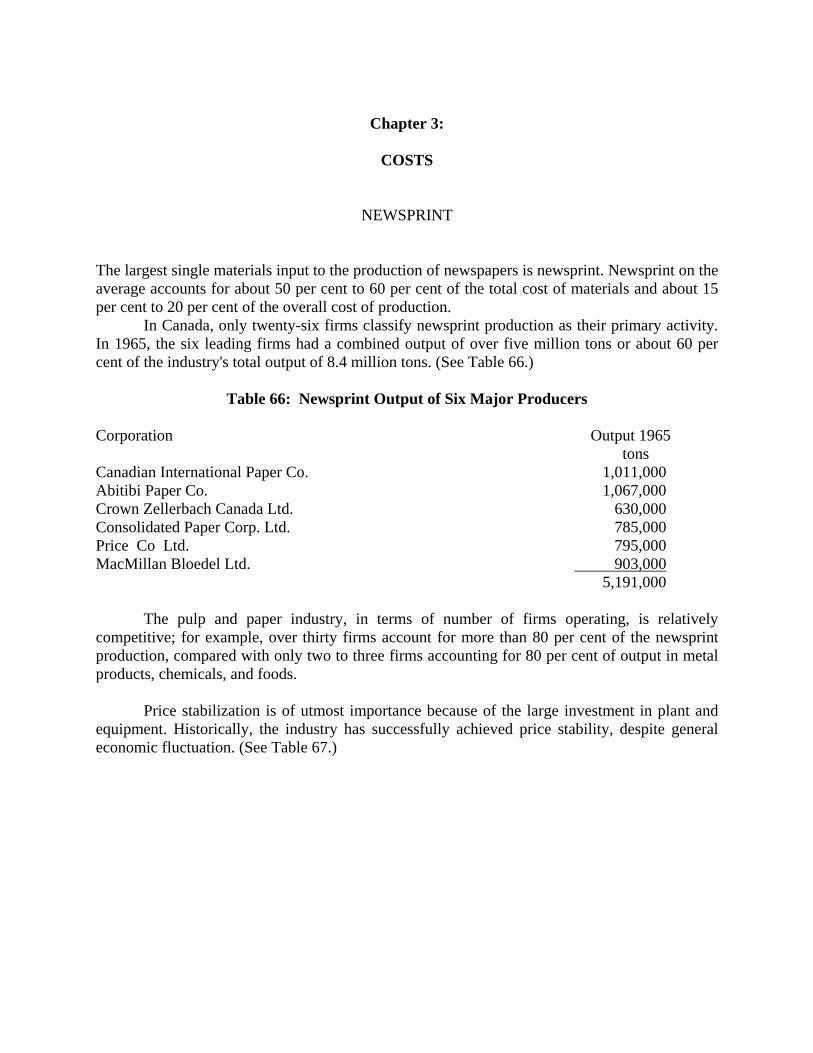
Chapter 3:
COSTS
NEWSPRINT
The largest single materials input to the production of newspapers is newsprint. Newsprint on the average accounts for about 50 per cent to 60 per cent of the total cost of materials and about 15 per cent to 20 per cent of the overall cost of production.
In Canada, only twenty-six firms classify newsprint production as their primary activity. In 1965, the six leading firms had a combined output of over five million tons or about 60 per cent of the industry's total output of 8.4 million tons. (See Table 66.)
Table 66: Newsprint Output of Six Major Producers Corporation Output 1965
tons Canadian International Paper Co. 1,011,000 Abitibi Paper Co. 1,067,000 Crown Zellerbach Canada Ltd. 630,000 Consolidated Paper Corp. Ltd. 785,000 Price Co Ltd. 795,000 MacMillan Bloedel Ltd. 903,000
5,191,000
The pulp and paper industry, in terms of number of firms operating, is relatively competitive; for example, over thirty firms account for more than 80 per cent of the newsprint production, compared with only two to three firms accounting for 80 per cent of output in metal products, chemicals, and foods.
Price stabilization is of utmost importance because of the large investment in plant and equipment. Historically, the industry has successfully achieved price stability, despite general economic fluctuation. (See Table 67.)
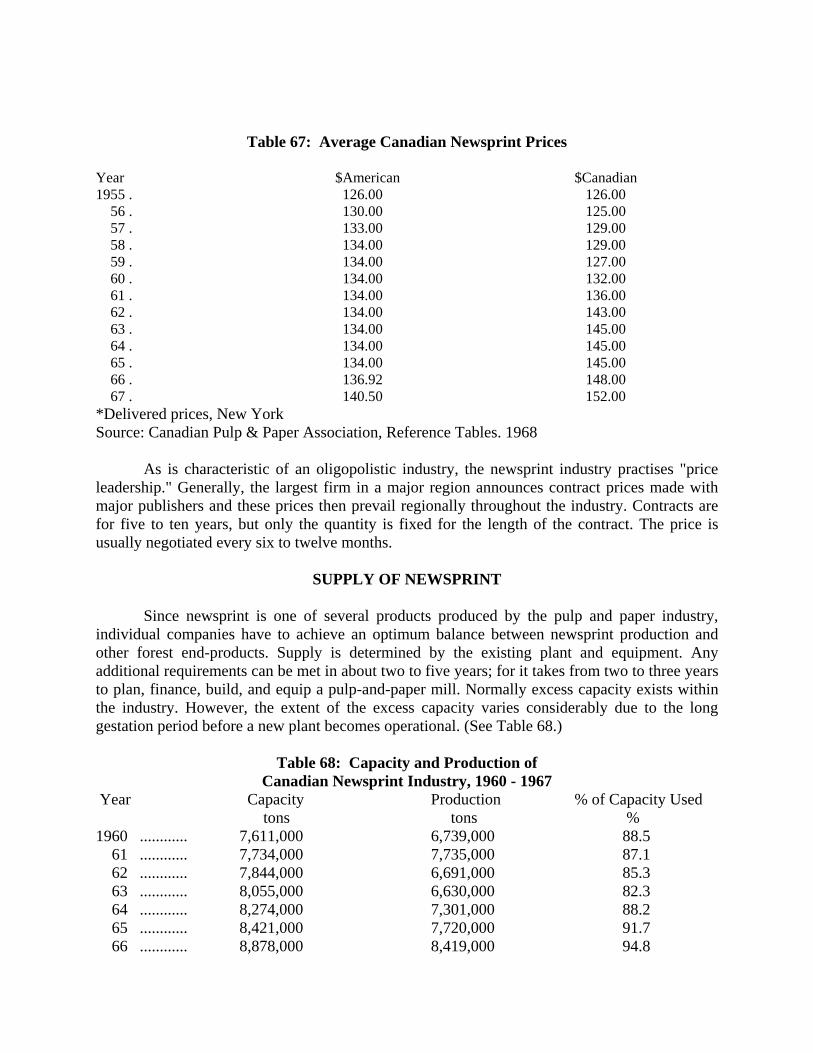
Table 67: Average Canadian Newsprint Prices Year $American $Canadian 1955 . 126.00 126.00 56 . 130.00 125.00 57 . 133.00 129.00 58 . 134.00 129.00 59 . 134.00 127.00 60 . 134.00 132.00 61 . 134.00 136.00 62 . 134.00 143.00 63 . 134.00 145.00 64 . 134.00 145.00 65 . 134.00 145.00 66 . 136.92 148.00 67 . 140.50 152.00 *Delivered prices, New York Source: Canadian Pulp & Paper Association, Reference Tables. 1968
As is characteristic of an oligopolistic industry, the newsprint industry practises "price leadership." Generally, the largest firm in a major region announces contract prices made with major publishers and these prices then prevail regionally throughout the industry. Contracts are for five to ten years, but only the quantity is fixed for the length of the contract. The price is usually negotiated every six to twelve months.
SUPPLY OF NEWSPRINT
Since newsprint is one of several products produced by the pulp and paper industry, individual companies have to achieve an optimum balance between newsprint production and other forest end-products. Supply is determined by the existing plant and equipment. Any additional requirements can be met in about two to five years; for it takes from two to three years to plan, finance, build, and equip a pulp-and-paper mill. Normally excess capacity exists within the industry. However, the extent of the excess capacity varies considerably due to the long gestation period before a new plant becomes operational. (See Table 68.)
Table 68: Capacity and Production of Canadian Newsprint Industry, 1960 - 1967
Year Capacity Production % of Capacity Used tons tons % 1960 ............ 7,611,000 6,739,000 88.5 61 ............ 7,734,000 7,735,000 87.1 62 ............ 7,844,000 6,691,000 85.3 63 ............ 8,055,000 6,630,000 82.3 64 ............ 8,274,000 7,301,000 88.2 65 ............ 8,421,000 7,720,000 91.7 66 ............ 8,878,000 8,419,000 94.8
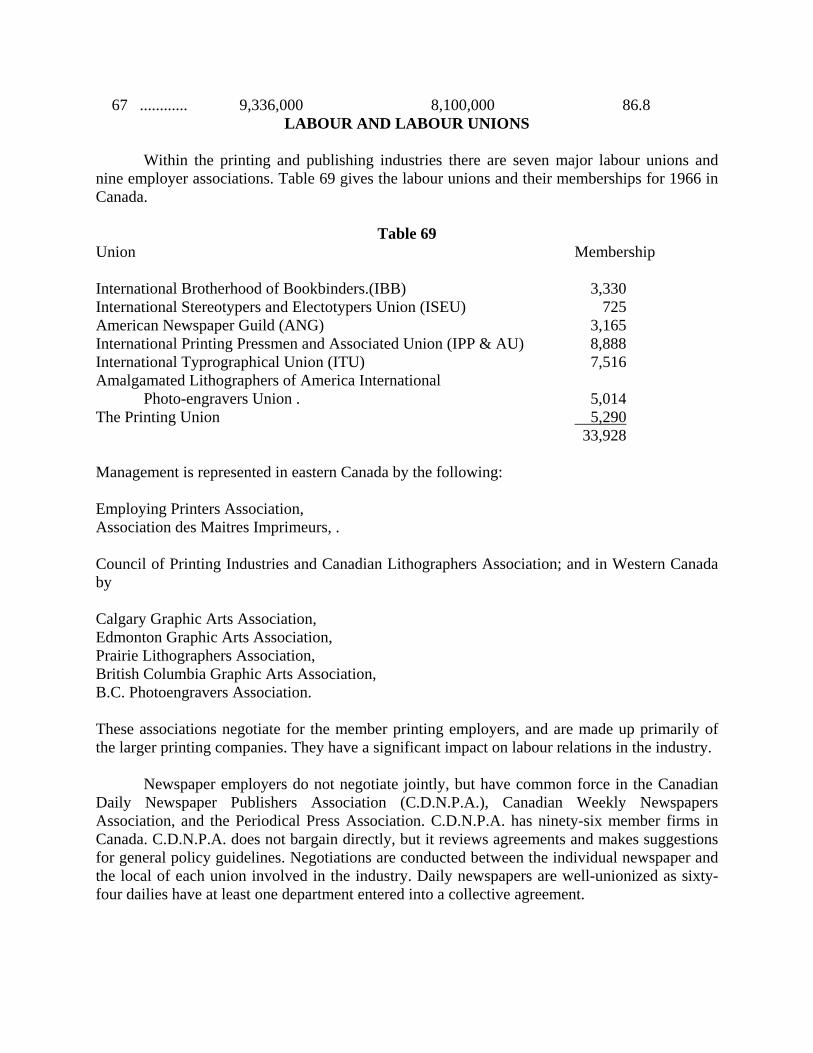
67 ............ 9,336,000 8,100,000 86.8 LABOUR AND LABOUR UNIONS
Within the printing and publishing industries there are seven major labour unions and
nine employer associations. Table 69 gives the labour unions and their memberships for 1966 in Canada.
Table 69 Union Membership International Brotherhood of Bookbinders.(IBB) 3,330 International Stereotypers and Electotypers Union (ISEU) 725 American Newspaper Guild (ANG) 3,165 International Printing Pressmen and Associated Union (IPP & AU) 8,888 International Typrographical Union (ITU) 7,516 Amalgamated Lithographers of America International
Photo-engravers Union . 5,014 The Printing Union 5,290 33,928 Management is represented in eastern Canada by the following: Employing Printers Association, Association des Maitres Imprimeurs, . Council of Printing Industries and Canadian Lithographers Association; and in Western Canada by Calgary Graphic Arts Association, Edmonton Graphic Arts Association, Prairie Lithographers Association, British Columbia Graphic Arts Association, B.C. Photoengravers Association. These associations negotiate for the member printing employers, and are made up primarily of the larger printing companies. They have a significant impact on labour relations in the industry.
Newspaper employers do not negotiate jointly, but have common force in the Canadian Daily Newspaper Publishers Association (C.D.N.P.A.), Canadian Weekly Newspapers Association, and the Periodical Press Association. C.D.N.P.A. has ninety-six member firms in Canada. C.D.N.P.A. does not bargain directly, but it reviews agreements and makes suggestions for general policy guidelines. Negotiations are conducted between the individual newspaper and the local of each union involved in the industry. Daily newspapers are well-unionized as sixty-four dailies have at least one department entered into a collective agreement.
GENERAL COLLECTIVE BARGAINING POLICY
Although the international printing unions have a marked influence in collective-
bargaining practices, the actual negotiations are conducted between the individual newspaper and the locals. In Canada each union has a local in each city; each local will have an individual agreement with the various newspapers in the city, and another with local employers associations.
The mechanical crafts (typographers, pressmen, stereotypers) must have their agreements approved by their respective International. Most unions will have "general laws" established - that is, unilateral union policies which employers are presumed to uphold. When a local makes a new gain in a collective agreement, the international union passes a "general law" in which a subsequent contract cannot be signed by any local unless that specific provision is included.
This form of union unilateralism is a significant factor in these labour relations. For most unions "general laws" are not subject to negotiation or arbitration.
These "general laws" interfere with the fundamental principles of collective bargaining. In spite of employer opposition, these "laws" demonstrate a relatively strong bargaining power held by labour in the printing industry.
The union's influence on each of its locals varies. For instance, I.T.U. has a strong influence on its locals whereas, I.P.P. and A.U. gives no direction as to what each local should demand. On the other hand, L.P.T.U. does not have any "general laws," but relies heavily on contract conferences which prepare local leaders for future contract negotiations. Similarly, A.N.G. has no "general laws"; but, the local must have the approval of the International Executive Board (I.E.B.) before any agreement can be signed. The duty of collective bargaining is solely up to the local governing body. However, any negotiation of a national nature (e.g. press associations, feature syndicates) are handled by I.E.B. and then ratified by the local members of A.N.G.
The A.N.G. has been seeking a major goal of wage equality, for reporters, display advertising salesmen, and classified salesmen. This equality takes the form of a demand for "$200 or better" as a union slogan.
The printing industry has undergone significant technological changes in recent years. Now, unions are not so much concerned with wages and hours, but with job security. Automation is a major issue, and several unions have tried to solve their problem by bargaining for specific press manning, more liberal severance pay, early retirement to make jobs available for younger members, and a judicious timing of labour-saving innovations. Several unions have instituted their own training centres to adapt their manpower to the new technology.
There has been a tendency towards co-operative negotiations, especially in the mechanical crafts. This co-operation can be either between locals or with unions; generally, all

international unions encourage co-operative bargaining. One exception to co-operative bargaining, in Canada, is the Canadian locals of the A.N.G. On the management side, co-operative bargaining is a different matter. Differences in markets, labour cost structure, and productivity, have tended to prevent employers from presenting a collective front; any wage discrimination enjoyed by an employer is not going to be easily sacrificed in co-operative bargaining.
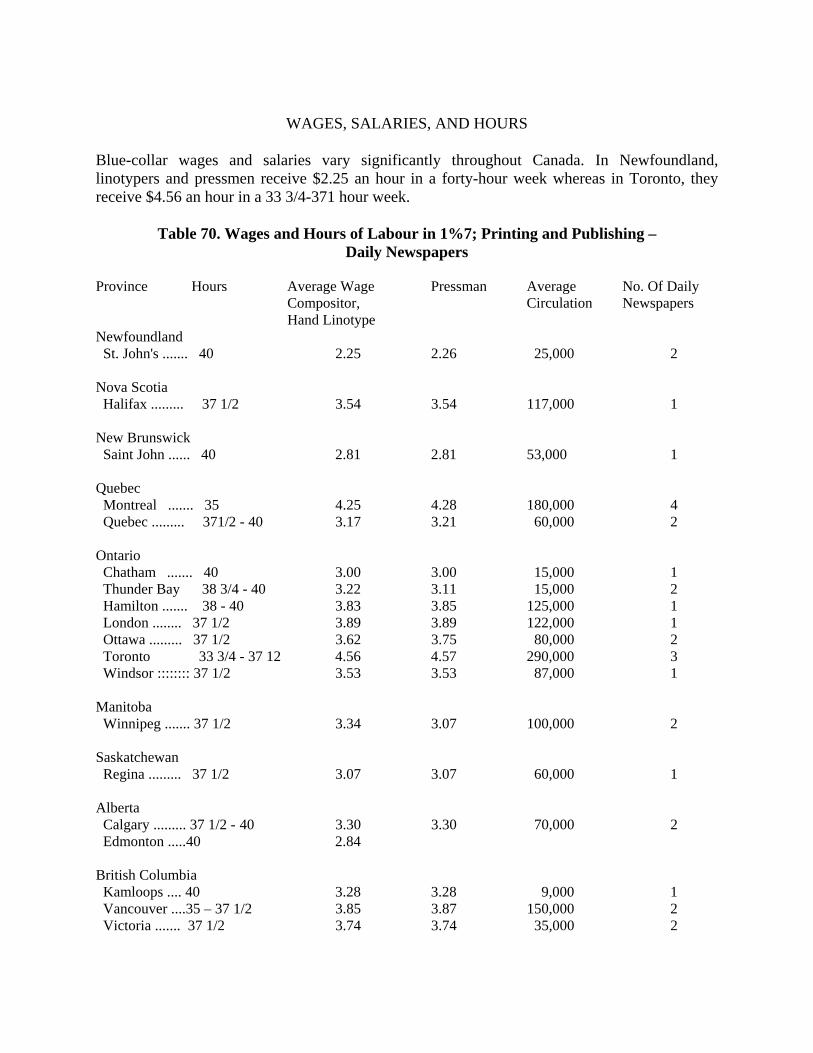
WAGES, SALARIES, AND HOURS
Blue-collar wages and salaries vary significantly throughout Canada. In Newfoundland, linotypers and pressmen receive $2.25 an hour in a forty-hour week whereas in Toronto, they receive $4.56 an hour in a 33 3/4-371 hour week.
Table 70. Wages and Hours of Labour in 1%7; Printing and Publishing – Daily Newspapers
Province Hours Average Wage Pressman Average No. Of Daily
Compositor, Circulation Newspapers Hand Linotype Newfoundland St. John's ....... 40 2.25 2.26 25,000 2 Nova Scotia Halifax ......... 37 1/2 3.54 3.54 117,000 1 New Brunswick Saint John ...... 40 2.81 2.81 53,000 1 Quebec Montreal ....... 35 4.25 4.28 180,000 4 Quebec ......... 371/2 - 40 3.17 3.21 60,000 2 Ontario Chatham ....... 40 3.00 3.00 15,000 1 Thunder Bay 38 3/4 - 40 3.22 3.11 15,000 2 Hamilton ....... 38 - 40 3.83 3.85 125,000 1 London ........ 37 1/2 3.89 3.89 122,000 1 Ottawa ......... 37 1/2 3.62 3.75 80,000 2 Toronto 33 3/4 - 37 12 4.56 4.57 290,000 3 Windsor :::::::: 37 1/2 3.53 3.53 87,000 1 Manitoba Winnipeg ....... 37 1/2 3.34 3.07 100,000 2 Saskatchewan Regina ......... 37 1/2 3.07 3.07 60,000 1 Alberta Calgary ......... 37 1/2 - 40 3.30 3.30 70,000 2 Edmonton .....40 2.84 British Columbia Kamloops .... 40 3.28 3.28 9,000 1 Vancouver ....35 – 37 1/2 3.85 3.87 150,000 2 Victoria ....... 37 1/2 3.74 3.74 35,000 2

Source: Economic and Research Branch, Canada Department of Manpower, Wages, Rates, Salaries and Hours of Labour.
There are two main characteristics of the wage structure as presented in Table 70. First, there is a very close correlation between the average wage in the industry and the regional distribution of Canadian income. Newfoundland pressmen receive the lowest average wage, and southern Ontario and southern British Columbia pressmen earn the highest. Since each local bargains individually, wage rates will be set which reflect the regional income standards. The trend towards co-operative bargaining may reduce the disparity between regions.
Second, there is a significant correlation between the size (circulation) of a newspaper and the wage rate. Generally, newspapers with a circulation of between 10,000 and 50,000 pay, on the average, about $3.25 an hour; newspapers with a circulation of between 50,000 and 100,000, an average of $3.40 an hour; and newspapers with a circulation of over 100,000, an average of $3.90 an hour.
Table 71 shows the regional pattern of wages within the province of Ontario. Again, the correlation between wage rates and circulation is evident. For example, as of October 1, 1969, the Woodstock Daily Sentinel-Review pays a pressman a minimum of $134 for a forty-hour week, while the Toronto Star pays a pressman a minimum of $173 for a thirty-five-hour week. It can, however, be argued that large newspapers demand and obtain the most competent employees; and that large newspapers have, on average, a more experienced staff.
There is a dearth of information on white-collar workers. Since most white-collar workers, in the Canadian newspaper industry, do not belong to the A.N.G., published data on their salaries are not available.
MACHINERY AND EQUIPMENT The Canadian market for machinery and equipment used in printing and allied industries is over $100 million annually, about one half consisting of machinery and equipment; and a large part of the remainder of printing plates and related goods.
In 1967, the total cost of materials, fuel, and electricity amounted to about $403 million; although paper accounted for much of this cost machinery and equipment constituted an important element of total costs.
Due to the complexity of machinery and equipment used in the newspaper publishing industry, a detailed analysis is impossible. However, we will outline the nature of the supplying industries.
It is worthy of note that a significant part (about 90 per cent) of all machinery and equipment used by a newspaper is imported.

There are a number of different types of presses used in the printing and publishing industries. The letterpress is the most common type used by newspapers, but the offset press has become increasingly popular among smaller papers.
Nearly all printing presses are imported duty-free, for Canadian use. The Canadian market for most types of printing presses is not large enough to support economically viable domestic production. Any domestic production is highly specialized and largely for export. The Canadian factory shipments consist of "printing, bookbinding machinery," and goods other than printing presses. Most of the Canadian production of printing presses are of the business form printing press, produced by Ashton Press; Ashton Press exports well over half its output. With little exception, virtually all Canadian requirements are met by imports. Parts of

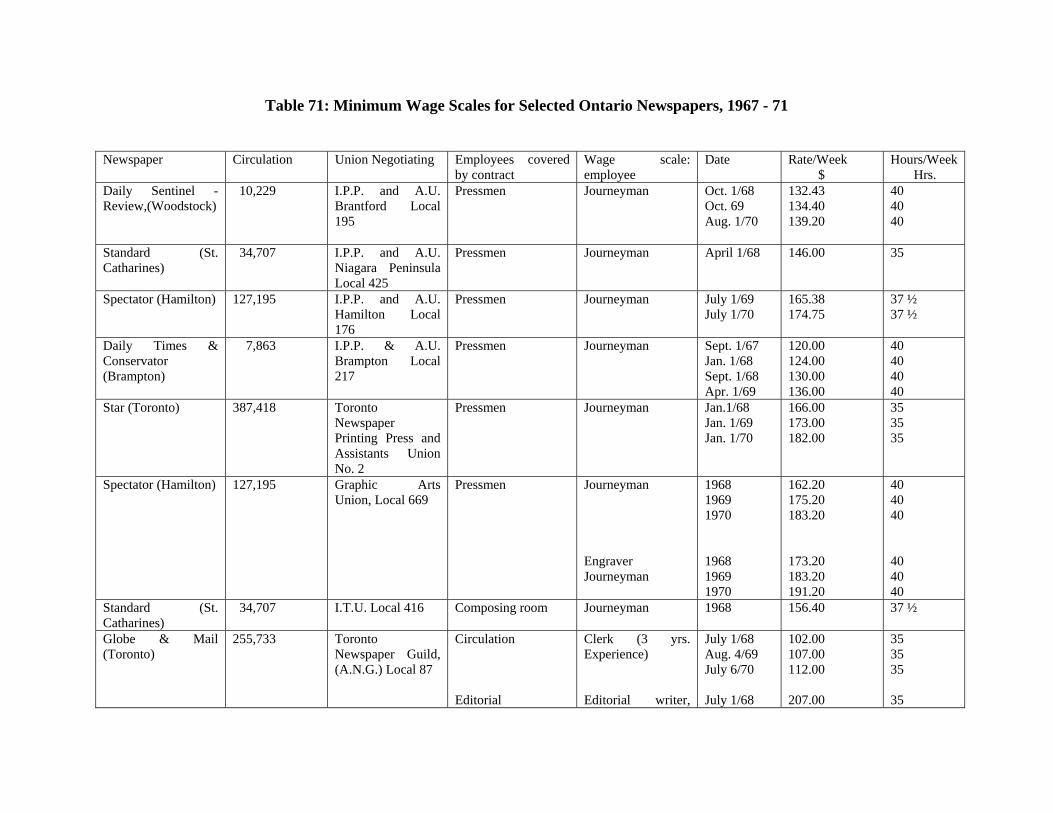
Table 71: Minimum Wage Scales for Selected Ontario Newspapers, 1967 - 71
Newspaper Circulation Union Negotiating Employees covered by contract
Wage scale: employee
Date Rate/Week $
Hours/Week Hrs.
Daily Sentinel -Review,(Woodstock)
10,229 I.P.P. and A.U. Brantford Local 195
Pressmen Journeyman Oct. 1/68 Oct. 69 Aug. 1/70
132.43 134.40 139.20
40 40 40
Standard (St. Catharines)
34,707 I.P.P. and A.U. Niagara Peninsula Local 425
Pressmen Journeyman April 1/68 146.00 35
Spectator (Hamilton) 127,195 I.P.P. and A.U. Hamilton Local 176
Pressmen Journeyman July 1/69 July 1/70
165.38 174.75
37 ½ 37 ½
Daily Times & Conservator (Brampton)
7,863 I.P.P. & A.U. Brampton Local 217
Pressmen Journeyman Sept. 1/67 Jan. 1/68 Sept. 1/68 Apr. 1/69
120.00 124.00 130.00 136.00
40 40 40 40
Star (Toronto) 387,418 Toronto Newspaper Printing Press and Assistants Union No. 2
Pressmen Journeyman Jan.1/68 Jan. 1/69 Jan. 1/70
166.00 173.00 182.00
35 35 35
Spectator (Hamilton) 127,195 Graphic Arts Union, Local 669
Pressmen Journeyman Engraver Journeyman
1968 1969 1970 1968 1969 1970
162.20 175.20 183.20 173.20 183.20 191.20
40 40 40 40 40 40
Standard (St. Catharines)
34,707 I.T.U. Local 416 Composing room Journeyman 1968 156.40 37 ½
Globe & Mail (Toronto)
255,733 Toronto Newspaper Guild, (A.N.G.) Local 87
Circulation Editorial
Clerk (3 yrs. Experience) Editorial writer,
July 1/68 Aug. 4/69 July 6/70 July 1/68
102.00 107.00 112.00 207.00
35 35 35 35

senior Ottawa correspondent
Jan. 4/71 230.00 35
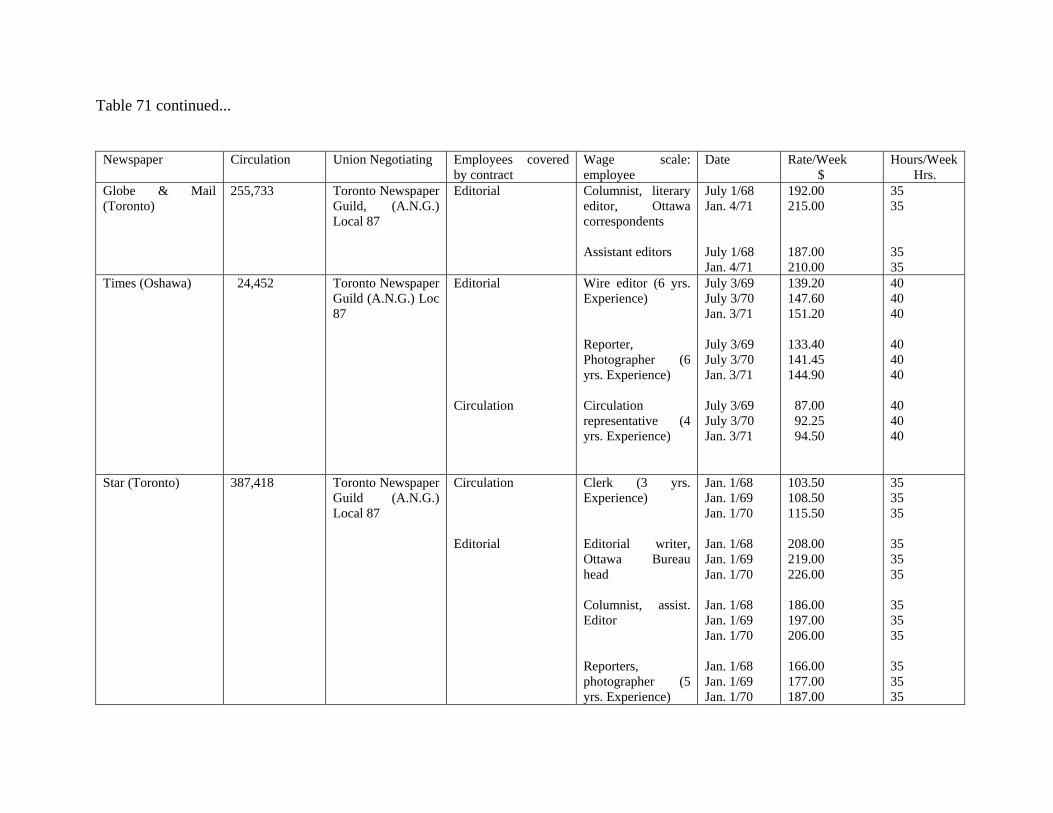
Table 71 continued...
Newspaper Circulation Union Negotiating Employees covered by contract
Wage scale: employee
Date Rate/Week $
Hours/Week Hrs.
Globe & Mail (Toronto)
255,733 Toronto Newspaper Guild, (A.N.G.) Local 87
Editorial Columnist, literary editor, Ottawa correspondents Assistant editors
July 1/68 Jan. 4/71 July 1/68 Jan. 4/71
192.00 215.00 187.00 210.00
35 35 35 35
Times (Oshawa) 24,452 Toronto Newspaper Guild (A.N.G.) Loc 87
Editorial Circulation
Wire editor (6 yrs. Experience) Reporter, Photographer (6 yrs. Experience) Circulation representative (4 yrs. Experience)
July 3/69 July 3/70 Jan. 3/71 July 3/69 July 3/70 Jan. 3/71 July 3/69 July 3/70 Jan. 3/71
139.20 147.60 151.20 133.40 141.45 144.90 87.00 92.25 94.50
40 40 40 40 40 40 40 40 40
Star (Toronto) 387,418 Toronto Newspaper Guild (A.N.G.) Local 87
Circulation Editorial
Clerk (3 yrs. Experience) Editorial writer, Ottawa Bureau head Columnist, assist. Editor Reporters, photographer (5 yrs. Experience)
Jan. 1/68 Jan. 1/69 Jan. 1/70 Jan. 1/68 Jan. 1/69 Jan. 1/70 Jan. 1/68 Jan. 1/69 Jan. 1/70 Jan. 1/68 Jan. 1/69 Jan. 1/70
103.50 108.50 115.50 208.00 219.00 226.00 186.00 197.00 206.00 166.00 177.00 187.00
35 35 35 35 35 35 35 35 35 35 35 35

printing presses are imported from the country of origin of the machines for which they are intended.
The Canadian plate-making and typesetting industry is composed of a large number of relatively small firms; and because of this, there is considerable diversity and specialization within the industry. The outstanding feature of this industry is the amount by which the materials used enhance in value by processing. For example, in 1966 the cost of materials was $15.2 million; of fuel and electricity, and wages, $28 million; value of shipments, $58 million. Here is a great deal of highly-skilled labour input.
Table 72: Canadian Factory Shipments of Printing Plates, Moulds, Transfer and Trade Composition for 1965 and 1966
Year Offset Printing Electrotyping Photo-engraving Trade com- Plates Stereotyping Com- position or Position Plates type-setting
Dollars 1965 .............. 13,249,000 5,630,000 14,147,000 14,120,000 66 .............. 16,064,000 5,474,000 15,601,000 16,263,000
Imports supply only a small part of the market. Virtually all the plate making connected with the Canadian market is done in Canada. Canadian publishers purchase the plates that are used for Canadian advertisers. But, for advertising of American companies and their Canadian subsidiaries, plates are imported.
The market for types for printing is relatively small ($500,000 - $1,000,000 annually) because type-setters normally cast and compose type in a single operation. This would usually enter into the trade of printing plates, moulds, or transfers rather than type. There are about twelve companies in Canada which produce type from imported parts.
WIRE SERVICE At present 103 of 116 Canadian daily newspapers are members of the Canadian Press
Association. The association is a non-profit organization directed by newspaper executives from Canadian newspapers.
The major expense of a wire service is staffing. Each year a General Cost "defined as expenses of the corporation essential to national service from which all members benefit," is determined by an annual budget. Revenue from non-member sources is deducted, and the remaining cost is divided among all the member newspapers according to a formula.
The total assessment is divided among member cities on the basis of circulation as given in the formula R=100(l/c)0.2863 - where R is the number of cost units per 1,000 circulation (c). Thus for a city of 50,000 circulation, there are 32.63 cost units per 1,000 circulation giving a
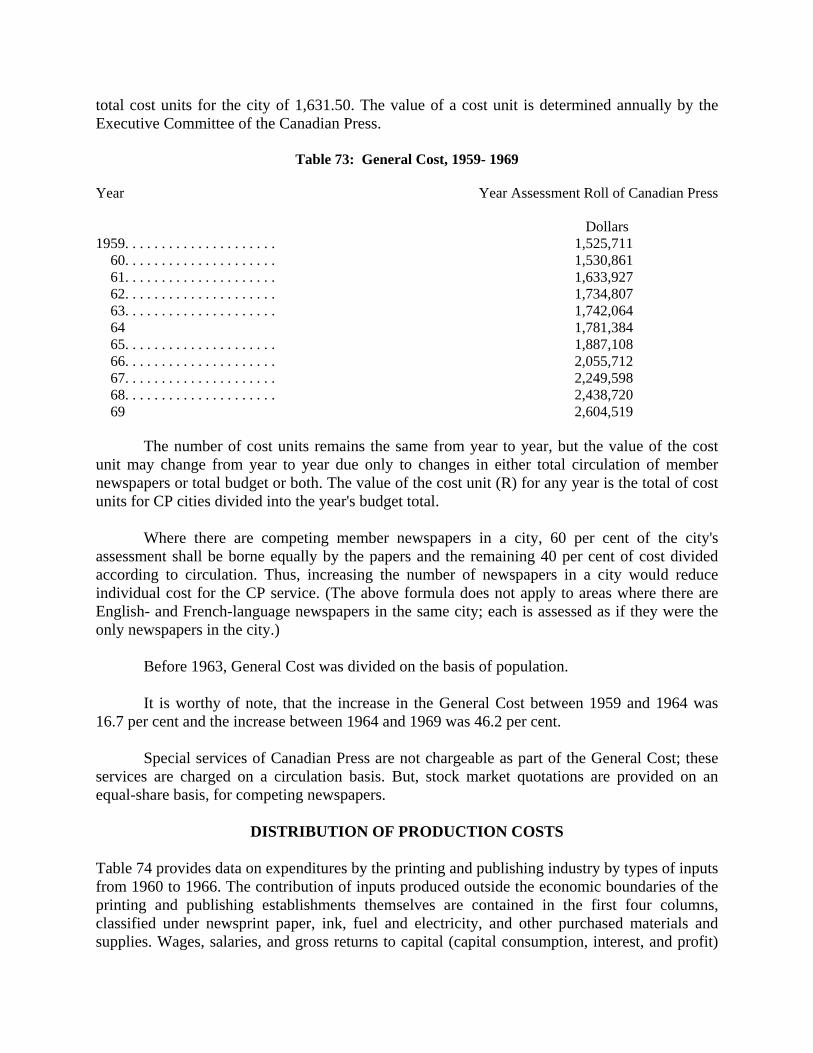
total cost units for the city of 1,631.50. The value of a cost unit is determined annually by the Executive Committee of the Canadian Press.
Table 73: General Cost, 1959- 1969 Year Year Assessment Roll of Canadian Press
Dollars 1959. . . . . . . . . . . . . . . . . . . . . 1,525,711 60. . . . . . . . . . . . . . . . . . . . . 1,530,861 61. . . . . . . . . . . . . . . . . . . . . 1,633,927 62. . . . . . . . . . . . . . . . . . . . . 1,734,807 63. . . . . . . . . . . . . . . . . . . . . 1,742,064 64 1,781,384 65. . . . . . . . . . . . . . . . . . . . . 1,887,108 66. . . . . . . . . . . . . . . . . . . . . 2,055,712 67. . . . . . . . . . . . . . . . . . . . . 2,249,598 68. . . . . . . . . . . . . . . . . . . . . 2,438,720 69 2,604,519
The number of cost units remains the same from year to year, but the value of the cost unit may change from year to year due only to changes in either total circulation of member newspapers or total budget or both. The value of the cost unit (R) for any year is the total of cost units for CP cities divided into the year's budget total.
Where there are competing member newspapers in a city, 60 per cent of the city's assessment shall be borne equally by the papers and the remaining 40 per cent of cost divided according to circulation. Thus, increasing the number of newspapers in a city would reduce individual cost for the CP service. (The above formula does not apply to areas where there are English- and French-language newspapers in the same city; each is assessed as if they were the only newspapers in the city.)
Before 1963, General Cost was divided on the basis of population.
It is worthy of note, that the increase in the General Cost between 1959 and 1964 was 16.7 per cent and the increase between 1964 and 1969 was 46.2 per cent.
Special services of Canadian Press are not chargeable as part of the General Cost; these services are charged on a circulation basis. But, stock market quotations are provided on an equal-share basis, for competing newspapers.
DISTRIBUTION OF PRODUCTION COSTS Table 74 provides data on expenditures by the printing and publishing industry by types of inputs from 1960 to 1966. The contribution of inputs produced outside the economic boundaries of the printing and publishing establishments themselves are contained in the first four columns, classified under newsprint paper, ink, fuel and electricity, and other purchased materials and supplies. Wages, salaries, and gross returns to capital (capital consumption, interest, and profit)

make up the remainder of the total revenues received by the establishments. This latter group makes up returns to resources specific to the industry itself, and as such are considered to make up the value added to the final product by the industry.
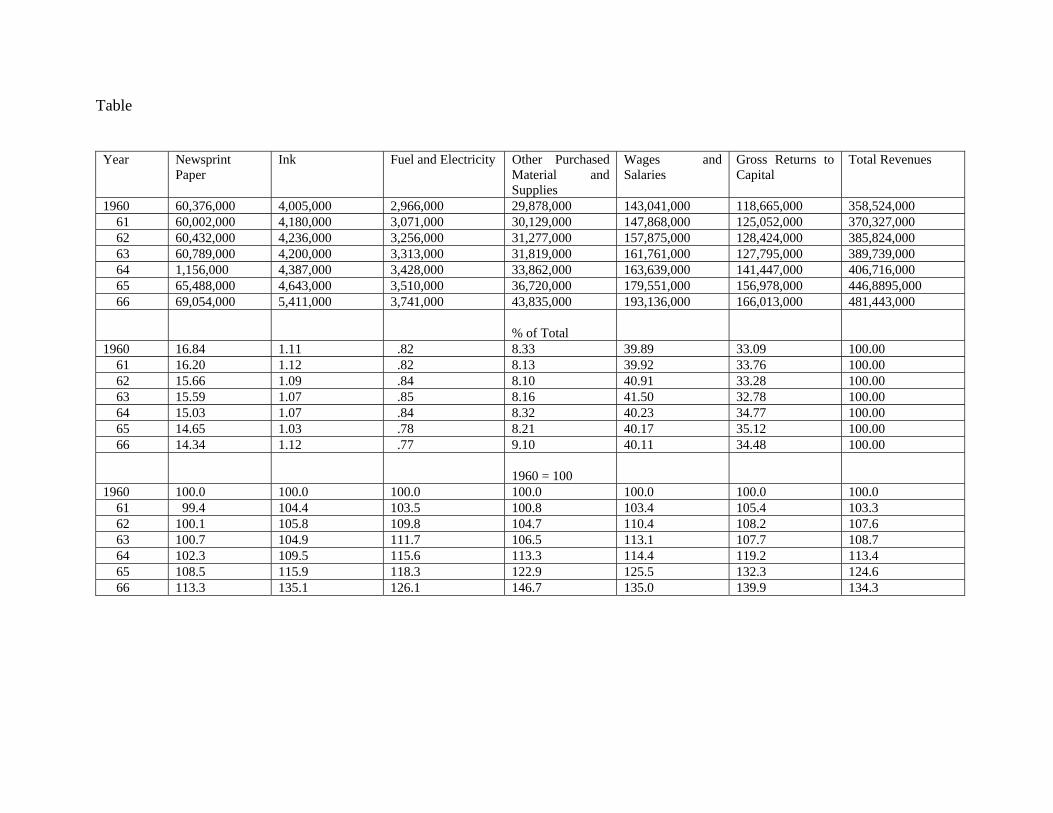
Table
Year Newsprint Paper
Ink Fuel and Electricity Other Purchased Material and Supplies
Wages and Salaries
Gross Returns to Capital
Total Revenues
1960 60,376,000 4,005,000 2,966,000 29,878,000 143,041,000 118,665,000 358,524,000 61 60,002,000 4,180,000 3,071,000 30,129,000 147,868,000 125,052,000 370,327,000 62 60,432,000 4,236,000 3,256,000 31,277,000 157,875,000 128,424,000 385,824,000 63 60,789,000 4,200,000 3,313,000 31,819,000 161,761,000 127,795,000 389,739,000 64 1,156,000 4,387,000 3,428,000 33,862,000 163,639,000 141,447,000 406,716,000 65 65,488,000 4,643,000 3,510,000 36,720,000 179,551,000 156,978,000 446,8895,000 66 69,054,000 5,411,000 3,741,000 43,835,000 193,136,000 166,013,000 481,443,000
% of Total
1960 16.84 1.11 .82 8.33 39.89 33.09 100.00 61 16.20 1.12 .82 8.13 39.92 33.76 100.00 62 15.66 1.09 .84 8.10 40.91 33.28 100.00 63 15.59 1.07 .85 8.16 41.50 32.78 100.00 64 15.03 1.07 .84 8.32 40.23 34.77 100.00 65 14.65 1.03 .78 8.21 40.17 35.12 100.00 66 14.34 1.12 .77 9.10 40.11 34.48 100.00
1960 = 100
1960 100.0 100.0 100.0 100.0 100.0 100.0 100.0 61 99.4 104.4 103.5 100.8 103.4 105.4 103.3 62 100.1 105.8 109.8 104.7 110.4 108.2 107.6 63 100.7 104.9 111.7 106.5 113.1 107.7 108.7 64 102.3 109.5 115.6 113.3 114.4 119.2 113.4 65 108.5 115.9 118.3 122.9 125.5 132.3 124.6 66 113.3 135.1 126.1 146.7 135.0 139.9 134.3
The first factor to be noted is that goods and services purchased from other industries generally make up from 25 per cent to 27 per cent of the total output of the industry. This makes the industry as a whole relatively immune to changing conditions in the industries that supply it with inputs. For instance, a 5 per cent rise in the prices of all inputs used by the industry would increase total costs for the industry as a whole by only slightly over 1 per cent. This is a situation considerably different from that in a number of other industries, many of which have 50 per cent and over of their costs accounted for by goods and services produced externally. Nevertheless, care must be taken in applying this overall conclusion specifically to individual firms in the industry. Generally, the importance of purchased inputs increases significantly with the size of firm, with some of the large daily newspapers having Up to 50 per cent of their costs accounted for by newsprint alone.
Turning to newsprint, it can be seen that newsprint expenditures have been falling, as a proportion of total costs, through the time period covered. In 1960, newsprint accounted for 16.84 per cent of total costs to the industry; in 1966, it represented 14.34 per cent of total costs. This fall comes about because expenditures have risen more slowly over the period on newsprint than for any other input. From 1960 to 1965, expenditures on newsprint rose only 8.5 per cent. A large jump in 1966 resulted in an increase of 14.4 per cent over the whole period. The most significant contributing factor to this jump in 1966 was the sharp advance in newsprint prices in that year.
Ink makes up a very small proportion of total costs, being only slightly over 1 per cent in each of the years considered. As a result, even though expenditures on ink rose by 35.1 per cent over the period, changes in ink's cost generally have little effect on the economic health of the industry as a whole. Fuel and electricity are likewise relatively unimportant, and have been declining in importance as a result of an advance in expenditures of only 26.1 per cent over the period, the lowest percentage advance for any input group other than newsprint paper.
Expenditures on other materials and supplies have increased in relative importance through time, because expenditures on this group have increased by 46.7 per cent over the period considered. This group is made up of a "mixed bag" of items, and as such it is difficult to identify any particular item as the reason for this advance.
Expenditures on wages and salaries constitute by far the largest proportion of total costs compared to any other individual input. Labour's share of costs has remained relatively stable over the period, with the advance in expenditures on labour being approximately equal to the advance in total revenues.
Capital's share increased over the period, moving from approximately 33 per cent of total revenue in 1960 to 34.5 per cent in 1966. Since this figure is the gross capital return, this advance can be attributed to either a relative increase in capital costs reflected in increased capital consumption, or to a relative increase in net profit over the period. Given the fluctuations in the gross share going to capital over the period, the change appears to be attributable most directly to an increase in profitability. Changes in capital costs themselves would be expected to show more stability than is indicated in these figures.
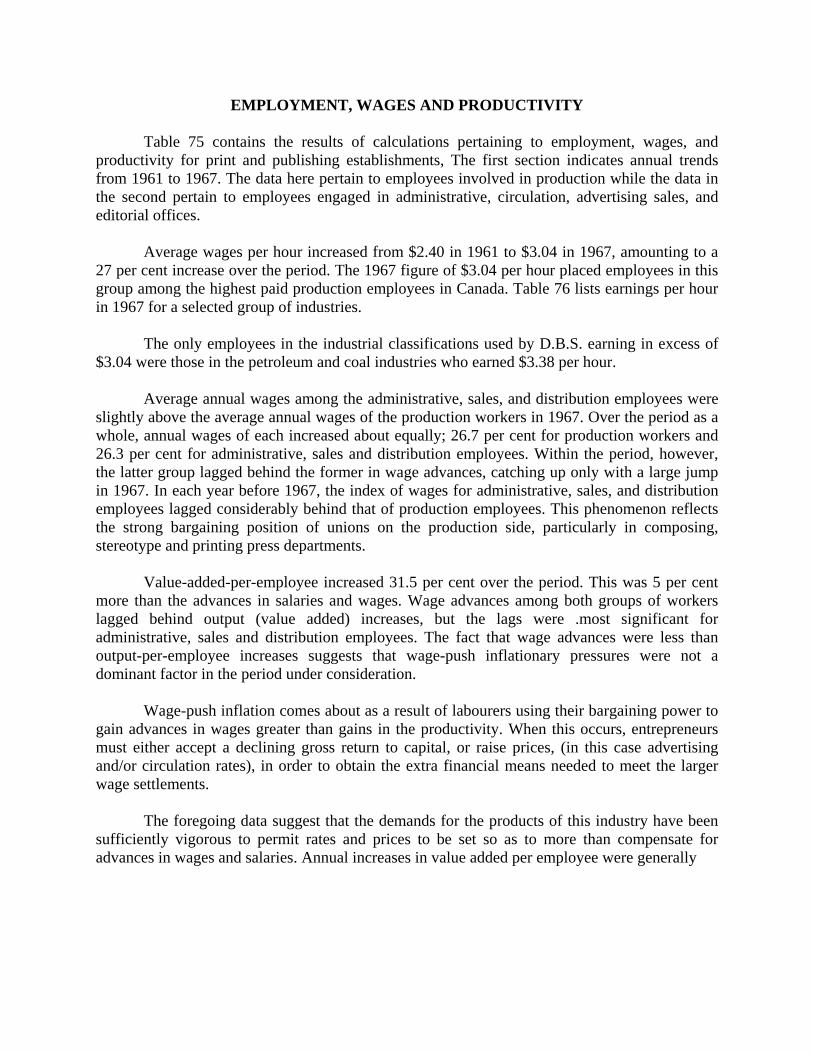
EMPLOYMENT, WAGES AND PRODUCTIVITY Table 75 contains the results of calculations pertaining to employment, wages, and
productivity for print and publishing establishments, The first section indicates annual trends from 1961 to 1967. The data here pertain to employees involved in production while the data in the second pertain to employees engaged in administrative, circulation, advertising sales, and editorial offices.
Average wages per hour increased from $2.40 in 1961 to $3.04 in 1967, amounting to a 27 per cent increase over the period. The 1967 figure of $3.04 per hour placed employees in this group among the highest paid production employees in Canada. Table 76 lists earnings per hour in 1967 for a selected group of industries.
The only employees in the industrial classifications used by D.B.S. earning in excess of $3.04 were those in the petroleum and coal industries who earned $3.38 per hour.
Average annual wages among the administrative, sales, and distribution employees were slightly above the average annual wages of the production workers in 1967. Over the period as a whole, annual wages of each increased about equally; 26.7 per cent for production workers and 26.3 per cent for administrative, sales and distribution employees. Within the period, however, the latter group lagged behind the former in wage advances, catching up only with a large jump in 1967. In each year before 1967, the index of wages for administrative, sales, and distribution employees lagged considerably behind that of production employees. This phenomenon reflects the strong bargaining position of unions on the production side, particularly in composing, stereotype and printing press departments.
Value-added-per-employee increased 31.5 per cent over the period. This was 5 per cent more than the advances in salaries and wages. Wage advances among both groups of workers lagged behind output (value added) increases, but the lags were .most significant for administrative, sales and distribution employees. The fact that wage advances were less than output-per-employee increases suggests that wage-push inflationary pressures were not a dominant factor in the period under consideration.
Wage-push inflation comes about as a result of labourers using their bargaining power to gain advances in wages greater than gains in the productivity. When this occurs, entrepreneurs must either accept a declining gross return to capital, or raise prices, (in this case advertising and/or circulation rates), in order to obtain the extra financial means needed to meet the larger wage settlements.
The foregoing data suggest that the demands for the products of this industry have been sufficiently vigorous to permit rates and prices to be set so as to more than compensate for advances in wages and salaries. Annual increases in value added per employee were generally

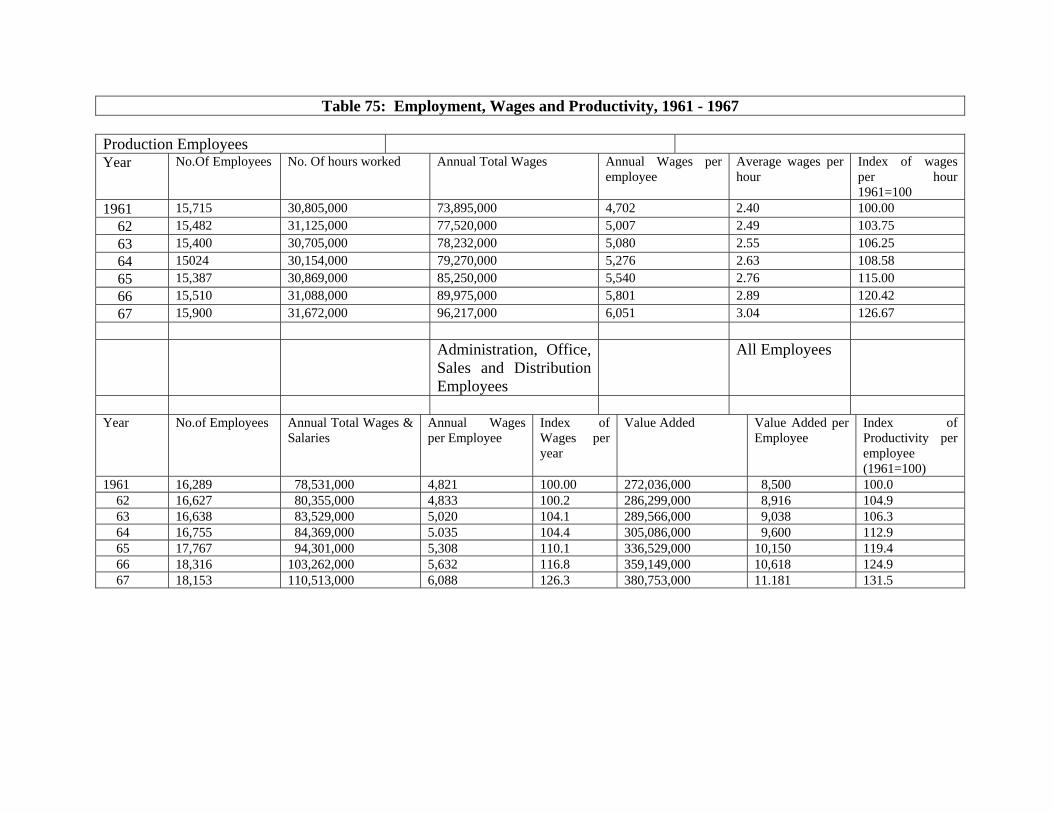
Table 75: Employment, Wages and Productivity, 1961 - 1967 Production Employees Year No.Of Employees No. Of hours worked Annual Total Wages Annual Wages per
employee Average wages per hour
Index of wages per hour 1961=100
1961 15,715 30,805,000 73,895,000 4,702 2.40 100.00
62 15,482 31,125,000 77,520,000 5,007 2.49 103.75
63 15,400 30,705,000 78,232,000 5,080 2.55 106.25
64 15024 30,154,000 79,270,000 5,276 2.63 108.58
65 15,387 30,869,000 85,250,000 5,540 2.76 115.00
66 15,510 31,088,000 89,975,000 5,801 2.89 120.42
67 15,900 31,672,000 96,217,000 6,051 3.04 126.67
Administration, Office, Sales and Distribution Employees
All Employees
Year No.of Employees Annual Total Wages & Salaries
Annual Wages per Employee
Index of Wages per year
Value Added Value Added per Employee
Index of Productivity per employee (1961=100)
1961 16,289 78,531,000 4,821 100.00 272,036,000 8,500 100.0 62 16,627 80,355,000 4,833 100.2 286,299,000 8,916 104.9 63 16,638 83,529,000 5,020 104.1 289,566,000 9,038 106.3 64 16,755 84,369,000 5.035 104.4 305,086,000 9,600 112.9 65 17,767 94,301,000 5,308 110.1 336,529,000 10,150 119.4 66 18,316 103,262,000 5,632 116.8 359,149,000 10,618 124.9 67 18,153 110,513,000 6,088 126.3 380,753,000 11.181 131.5

Table 76: Average Hourly Earnings in Selected Industries, 1967 Industry Average Hourly Earnings – Dollars Textile Products 1.89 Furniture & Fixtures 1.91 Primary Metal 2.54 Electrical Products 2.33 Petroleum & Coal 3.38 Chemicals 2.60 Food & Beverages 2.12
equal to, or greater than, increases in wages and salaries. As a consequence, gross returns to capital increased over the period as a whole. This suggests that conditions of demand had a greater influence than employment costs in the determination of rates and prices.
An increase in the share of returns going to capital does not always indicate the presence of demand-induced inflation. If the shifts in returns are evident over a fairly long period of time in terms of a clearly distinguishable trend, this can indicate a shift in the capital intensity, (that is, capital to labour ratios) in the industry. However, significant year-to-year shifts in capital's share within a fairly short time do not usually reflect any real changes in capital intensity.
CONCENTRATION BY SIZE OF FIRM Table 77 shows the results of measures used to establish the degree of economic
concentration in the industry under consideration. The data are for 1966, since this is the last year for which data are available in the necessary amount of detail. Concentration is considered on the basis of producing establishments. These charts and tables say nothing about concentration of ownership. Establishments with revenue of less than $25,000 per year have been omitted, since these establishments tend to be generally owner-operated, making it difficult to establish relevant data on employees.
The two smallest groups of establishments make up over one half of the total number of establishments but account for only 3.4 per cent of the total revenue, and 5.9 per cent of the total employment for all establishments. On the other hand establishments with revenue of over $5 million per year account for only 4.0 per cent of the establishments, but account for 63.7 per cent of total revenues and 53.5 per cent of total employment. The two largest size groups, making up 12.8 per cent of the total establishments, account for 76.3 per cent of total employment and 84.4 per cent of total revenues.

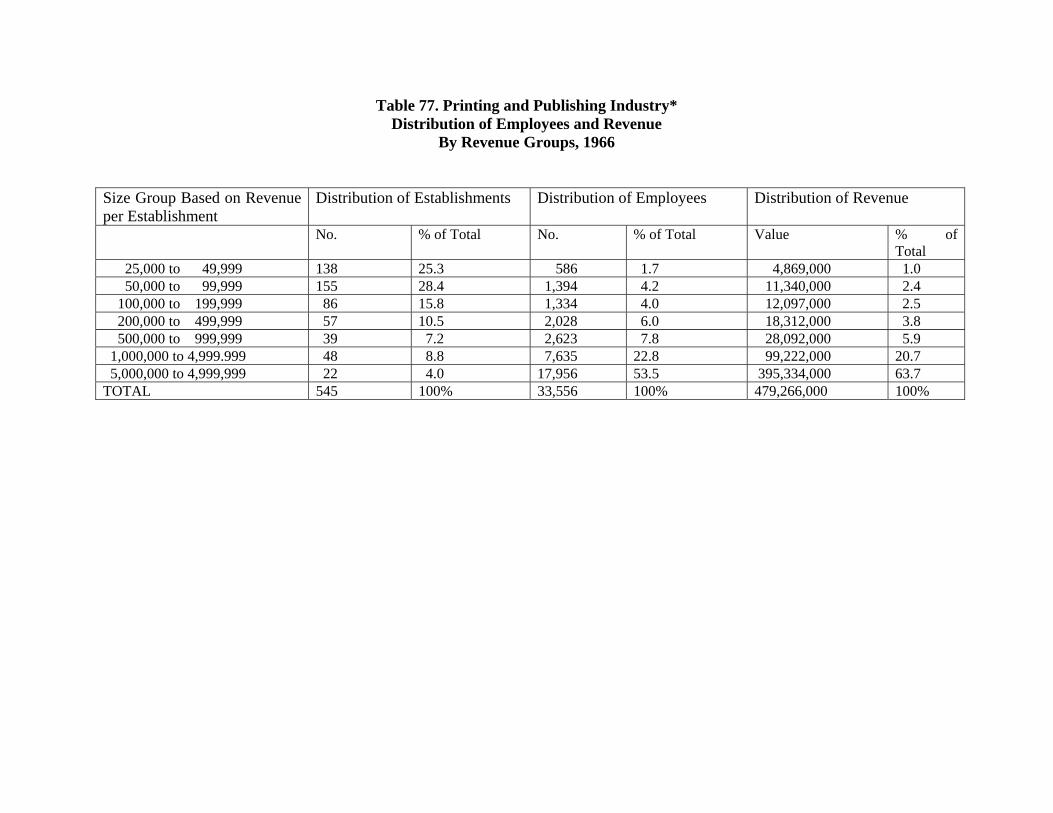
Table 77. Printing and Publishing Industry* Distribution of Employees and Revenue
By Revenue Groups, 1966 Size Group Based on Revenue per Establishment
Distribution of Establishments Distribution of Employees Distribution of Revenue
No. % of Total No. % of Total Value % of Total
25,000 to 49,999 138 25.3 586 1.7 4,869,000 1.0 50,000 to 99,999 155 28.4 1,394 4.2 11,340,000 2.4 100,000 to 199,999 86 15.8 1,334 4.0 12,097,000 2.5 200,000 to 499,999 57 10.5 2,028 6.0 18,312,000 3.8 500,000 to 999,999 39 7.2 2,623 7.8 28,092,000 5.9 1,000,000 to 4,999.999 48 8.8 7,635 22.8 99,222,000 20.7 5,000,000 to 4,999,999 22 4.0 17,956 53.5 395,334,000 63.7 TOTAL 545 100% 33,556 100% 479,266,000 100%
These results are not unexpected given the wide differences in annual circulation of publications of establishments in this group. Nevertheless, it does point out the degree to which such circulation discrepancies do give rise to differences in employment and revenue. It also points out that the revenue-generating ability per employee increases as firms become larger, since the discrepancies in distribution of revenues between size groups are greater than the discrepancies in distribution of employment.
WAGES AND PRODUCTIVITY BY SIZE OF FIRM
Table 78 indicates the results of a study of wages and productivity by size of establishment. The establishments included are the same as those used to study the degree of economic concentration above. Size is determined on the basis of total revenues from printing and publishing for each establishment. The data are for the year 1966, the latest year for which data are available in the necessary detail.
The first factor to consider is the large disparity in wages between the smallest and the largest firms. Wages per hour among production workers range from $1.75 among the smallest firms to $3.48 among the largest firms. The latter figure is almost twice the former, as indicated by the index of wages per hour. Among administration, sales, and distribution employees almost the same disparity in wages exists. The annual wages of those in the largest plants are almost twice of those in the smallest plant. It is also to be noted that for both groups of employees, average wages for each size group are without exception higher than those for the next smaller group.
Turning to the labour productivity index (measuring relative differences in the value of product per employee), we find an even greater discrepancy than that for wages. Productivity per employee for plants in the largest size group is more than double that of plants in the smallest size group. Again, labour productivity increases in all cases as one moves from any size group to the next largest size group.
The explanation for these great discrepancies in labour productivity between different sizes of establishments can only be tentatively set out at this point. The hypothesis will be examined in more detail at a later point.
Assuming that wages are a fair measure of the share of the total product generated by the activities of labour, one factor contributing to the great discrepancies in productivity per employee between small and large firms is the superior productive capacity of labour. However this in itself does not go far enough, since the labour productivity index ranges from 100.0 to 206.3 over the size groups considered, while the wages indices range from 100.0 to slightly less than 200.
The remaining discrepancy in productivity per employee must reflect either a greater capital intensity among the larger firms, or larger profits among the larger firms. While there is no means of ascertaining from these data which of these is the more correct, there is no doubt a combination of these factors in force. Data examined in other parts of this study indicate that higher profits probably are the stronger of these two forces.

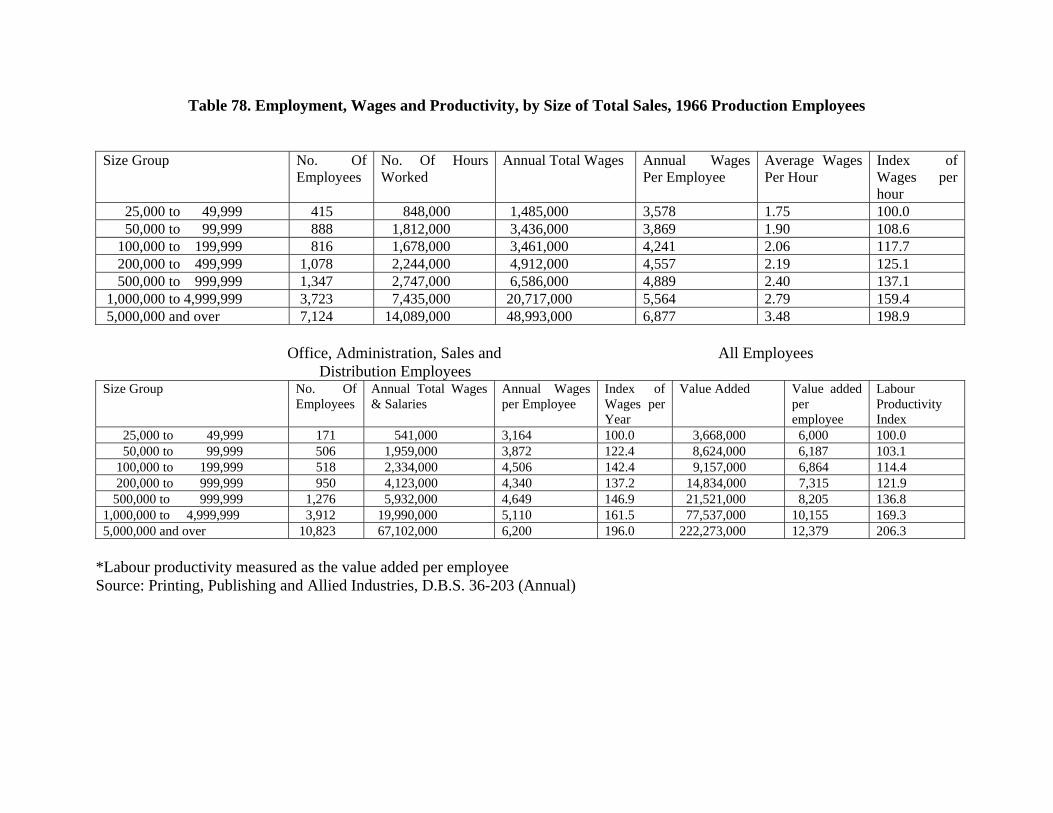
Table 78. Employment, Wages and Productivity, by Size of Total Sales, 1966 Production Employees Size Group No. Of
Employees No. Of Hours Worked
Annual Total Wages Annual Wages Per Employee
Average Wages Per Hour
Index of Wages per hour
25,000 to 49,999 415 848,000 1,485,000 3,578 1.75 100.0 50,000 to 99,999 888 1,812,000 3,436,000 3,869 1.90 108.6 100,000 to 199,999 816 1,678,000 3,461,000 4,241 2.06 117.7 200,000 to 499,999 1,078 2,244,000 4,912,000 4,557 2.19 125.1 500,000 to 999,999 1,347 2,747,000 6,586,000 4,889 2.40 137.1 1,000,000 to 4,999,999 3,723 7,435,000 20,717,000 5,564 2.79 159.4 5,000,000 and over 7,124 14,089,000 48,993,000 6,877 3.48 198.9
Office, Administration, Sales and All Employees Distribution Employees
Size Group No. Of Employees
Annual Total Wages & Salaries
Annual Wages per Employee
Index of Wages per Year
Value Added Value added per employee
Labour Productivity Index
25,000 to 49,999 171 541,000 3,164 100.0 3,668,000 6,000 100.0 50,000 to 99,999 506 1,959,000 3,872 122.4 8,624,000 6,187 103.1 100,000 to 199,999 518 2,334,000 4,506 142.4 9,157,000 6,864 114.4 200,000 to 999,999 950 4,123,000 4,340 137.2 14,834,000 7,315 121.9 500,000 to 999,999 1,276 5,932,000 4,649 146.9 21,521,000 8,205 136.8 1,000,000 to 4,999,999 3,912 19,990,000 5,110 161.5 77,537,000 10,155 169.3 5,000,000 and over 10,823 67,102,000 6,200 196.0 222,273,000 12,379 206.3
*Labour productivity measured as the value added per employee Source: Printing, Publishing and Allied Industries, D.B.S. 36-203 (Annual)
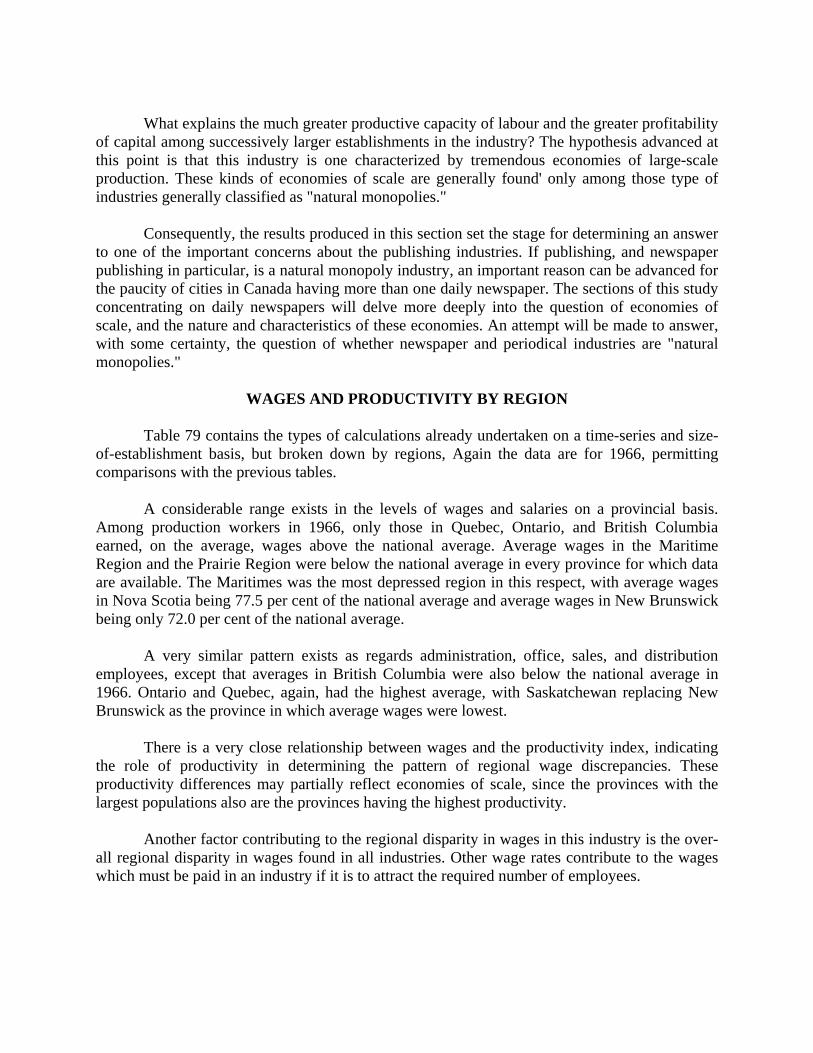
What explains the much greater productive capacity of labour and the greater profitability
of capital among successively larger establishments in the industry? The hypothesis advanced at this point is that this industry is one characterized by tremendous economies of large-scale production. These kinds of economies of scale are generally found' only among those type of industries generally classified as "natural monopolies."
Consequently, the results produced in this section set the stage for determining an answer to one of the important concerns about the publishing industries. If publishing, and newspaper publishing in particular, is a natural monopoly industry, an important reason can be advanced for the paucity of cities in Canada having more than one daily newspaper. The sections of this study concentrating on daily newspapers will delve more deeply into the question of economies of scale, and the nature and characteristics of these economies. An attempt will be made to answer, with some certainty, the question of whether newspaper and periodical industries are "natural monopolies."
WAGES AND PRODUCTIVITY BY REGION
Table 79 contains the types of calculations already undertaken on a time-series and size-of-establishment basis, but broken down by regions, Again the data are for 1966, permitting comparisons with the previous tables.
A considerable range exists in the levels of wages and salaries on a provincial basis. Among production workers in 1966, only those in Quebec, Ontario, and British Columbia earned, on the average, wages above the national average. Average wages in the Maritime Region and the Prairie Region were below the national average in every province for which data are available. The Maritimes was the most depressed region in this respect, with average wages in Nova Scotia being 77.5 per cent of the national average and average wages in New Brunswick being only 72.0 per cent of the national average.
A very similar pattern exists as regards administration, office, sales, and distribution employees, except that averages in British Columbia were also below the national average in 1966. Ontario and Quebec, again, had the highest average, with Saskatchewan replacing New Brunswick as the province in which average wages were lowest.
There is a very close relationship between wages and the productivity index, indicating the role of productivity in determining the pattern of regional wage discrepancies. These productivity differences may partially reflect economies of scale, since the provinces with the largest populations also are the provinces having the highest productivity.
Another factor contributing to the regional disparity in wages in this industry is the over-all regional disparity in wages found in all industries. Other wage rates contribute to the wages which must be paid in an industry if it is to attract the required number of employees.

Table 79: Employment, Wages and Productivity by Region, 1966
Production Employees Region No. Of
Employees No. Of Hours Worked
Annual Total Wages Annual Wages per Employee
Average Wages per Hour
Index of Wages per Hour per=100
Nova Scotia 492 1,026,000 2,300,000 4,674 2.24 77.5 New Brunswick 339 748,000 1,580,000 4,661 2.08 77.5 Quebec 3,759 7,608,000 23,815,000 6,335 3.13 108.3 Ontario 6,888 13,575,000 40,557,000 5,888 2.99 103.5 Manitoba 894 1,844,000 4,559,000 5,100 2.47 85.5 Saskatchewan 653 1,320,000 3,037,000 4,651 2.30 79.6 Alberta 938 1,934,000 4,922,000 5,247 2.55 88.2 British Columbia 1,315 2,546,000 8,269,000 6,288 3.25 112.5
Administration, Office, Sales and Distribution Employees All Employees Region No. Of
Employees Annual Total Wages & Salaries
Annual Wages per Employee
Index of Wages per year (Canada=100)
Value Added Value added per employee
Index of Productivity per employee (Canada =100)
Nova Scotia 567 2,373,000 4,185 74.3 9,309,000 8,790 82.8 New Brunswick 323 1,498,000 4,638 82.4 5,517,000 8,334 78.5 Quebec 3,702 22,501,000 6,078 107.9 85,073,000 11,402 107.4 Ontario 9,421 56,140,000 5,959 105.8 173,466,000 10,636 100.2 Manitoba 1,026 4,262,000 4,154 73.8 17,385,000 9,055 85.3 Saskatchewan 482 2,186,000 4,535 80.5 10,082,000 8,883 83.7 Alberta 848 3,811,000 4,494 79.8 19,687,000 11,023 103.8 British Columbia 1,680 9,397,000 5,593 99.3 34,798,000 11,619 109.4 TOTAL 18,316 103,161,000 5,632 100.0 359,149,000 10,618 100.0
RELATIONSHIP BETWEEN EARNINGS OF PRODUCTION AND OTHER EMPLOYEES
A comparison between average wages of production workers and average wages and
salaries of administrative, office, sales, and distribution employees indicates that, almost without exception, the average earnings of the former are equal to or greater than the average earnings of the latter.
In the period 1961-67, the growth in earnings of office workers lagged behind that in the earnings of production workers in each year except 1967. Likewise they were at a lower level in each year except 1961 and 1967, and in these latter years, the differences were marginal. Compared on the basis of size groups, office employees had lower earnings in all but two groups. A similar pattern can be found in the regional comparisons.
These results give rise to some questions that are further investigated in another section of this report. Given the role of the media in informing and educating, one must wonder why the salaries for the group containing the editorial and administrative employees are no higher than for the production workers. While some will certainly agree that this is fair on the basis of equity, the question here is how newspapers and periodicals can draw and keep highly-trained, professional people with such a salary structure.
These figures cannot be used to say anything definite about the salaries of professional employees, since they contain earnings of others as well. However, while the figures on office and administrative employees include clerical and other help of this nature, the figures on production workers also contain lower-skilled help in those departments. The figures do, then, offer some suggestions regarding relative earnings in the industry.
Chapter 4:
PROFITABILITY
INTRODUCTION
The tables in this chapter contain financial and profitability results for corporations in Canada engaged in daily newspaper publishing. The original aggregated data were extracted and aggregated for this study by the Corporations and Labour Unions Returns Act Administration of D.B.S. from income tax returns filed with the Department of National Revenue.
Not all daily newspaper publishing companies in Canada are included in these tables. Problems arose with respect to identifying all of the relevant corporations within the taxation records in the limited time available to extract and aggregate the data. Nevertheless the aggregated data are reasonably complete, with only a limited number of smaller corporations, and some holding companies, not included. The aggregated data have been compiled according to standard accounting practices, using year-end balance sheets and profit-and-loss statements. The balance sheets contain a breakdown of assets and liabilities, while the profit-and-loss statements contain a breakdown of income, expenses, and net profit.

All assets are stated at book value. No adjustment is made in these values to take account
of goodwill or other related intangibles.
All assets are matched by corresponding liabilities and equity. Capital values represent purchasing power which someone has agreed to hold in the form of capital assets, rather than utilizing it for consumption. These capital values are assigned to physical inputs, such as land, buildings, equipment, and inventories; and financial inputs such as cash, securities, and accounts receivable. The purchasing power that provides a firm with the ability to retain these capital inputs comes from four main sources: accounts payable, outside debt, share capital, and retained earnings.
Equity capital is purchasing power provided by shareholders. Since retained earnings (plus any other surplus) consist of deferred individual payments, retained earnings, other surplus, and share capital make up the total of equity capital.
The identification of equity capital is important in determining profitability rates. In determining the profitability of an enterprise as it pertains to the owners, the relevant measure is the return on equity after obligations to liabilities have been met. Obligations to liabilities are met in terms of interest payments. Consequently, the most relevant measure of profitability, in terms of the owners of an enterprise, is profit, after interest payments have been made, as a percentage of total equity. In order to arrive at a measure of the profit actually received by the owners, a further deduction must be made to take account of income tax payments.
In terms of resource allocation within the economy as a whole, a slightly different concept is applied. From the viewpoint of obtaining an optimum use of resources, the rate of return on all assets is the relevant concept. The profit figure used in arriving at this rate is net profit, including interest payments and income tax payments.
This discussion indicates that there are three relevant net profit figures:
Net Profit A = net profit excluding interest and income tax payments as expenses.
Net Profit B = net profit, including interest payments, but excluding income tax payments as an expense.
Net Profit C = net profit, including interest and income tax payments as expenses.
ASSETS, LIABILITIES, AND EQUITY
Tables 80 and 81 contain data on the distribution and trends in assets, liabilities, and equity for all of the companies for which data were available. Most of the results found in these tables are self-explanatory. A couple of factors do deserve special attention, however.
First, there has been a sharp increase in assets in the form of investment in affiliates. Investment in affiliates represented 10.6 per cent of total assets in 1958 compared to 17.8 per
cent in 1967. This asset figure grew by 183 per cent over the ten-year period, while all other assets grew by considerably less than 100 per cent over the same period. The continued growth in this asset figure is explained by a continuous trend toward both group ownership and ownership interests in enterprises other than newspaper publishing.
Second, retained earnings constitute the largest single item in terms of liabilities and equity. Retained earnings in recent years have been greater than total liabilities in absolute terms, and have grown at a much faster rate than any individual type of liability, and than liabilities in total. Total liabilities grew by 34.7 per cent over the ten-year period, while retained earnings grew by 101.5 per cent. Only common and preferred shares had a growth rate in the same range as retained earnings, but this was largely explainable by major share issues by single large companies in 1965 and 1967. Share capital also makes up a much smaller proportion of total liabilities and equity than retained earnings. Retained earnings now make up approximately 45 per cent of total equity and liabilities.


Table 80. Asset Distribution as a Proportion of Total Assets Corporations Publishing Daily Newspapers, 1958 - 1967
Year Cash & Securities
As a % of Total Assets
Accounts Receivable as of % of Total Assets
Inventories as a % of Total Assets
Current Assets as a % of Total Assets
Land as a % of Total Assets
Net – Buildings and Equipment as a % of Total Assets
Investment in Affiliates as a % of Total Assets
Other assets as a % of Total Assets (Residue)
1958 14.3 11.8 4.5 32.4 6.1 39.8 10.6 11.1 59 13.9 11.8 3.9 31.5 5.7 39.8 12.7 10.3 60 14.6 12.0 3.9 31.6 6.2 40.4 12.2 9.6 61 13.9 11.9 3.7 30.8 6.3 38.2 15.4 9.3 62 14.9 12.0 3.4 31.4 6.5 38.5 14.8 8.8 63 14.9 11.8 3.0 31.2 6.3 39.8 15.1 7.6 64 15.1 11.5 3.9 28.9 6.6 42.1 14.2 8.2 65 12.4 12.2 3.5 29.1 6.0 40.6 17.3 7.0 66 10.9 12.8 3.7 28.6 6.2 40.8 17.1 7.3 67 16.0 12.7 3.1 33.2 5.8 38.0 17.8 5.2
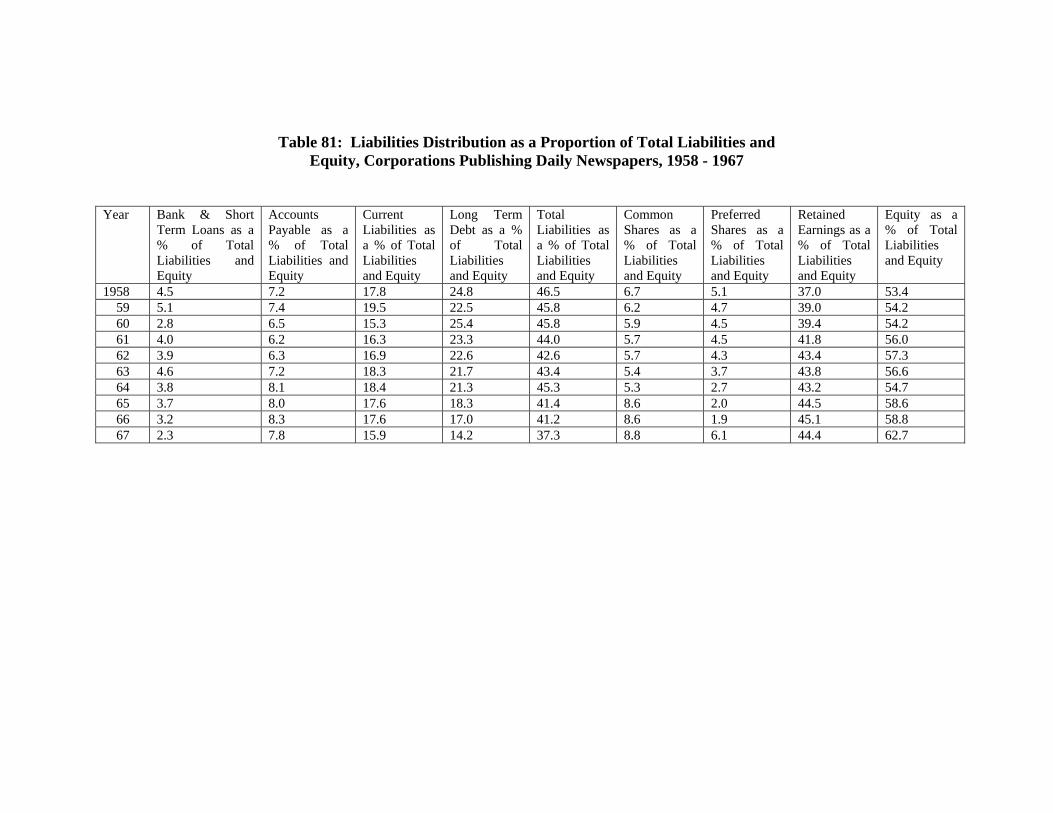
Table 81: Liabilities Distribution as a Proportion of Total Liabilities and Equity, Corporations Publishing Daily Newspapers, 1958 - 1967
Year Bank & Short Term Loans as a % of Total Liabilities and Equity
Accounts Payable as a % of Total Liabilities and Equity
Current Liabilities as a % of Total Liabilities and Equity
Long Term Debt as a % of Total Liabilities and Equity
Total Liabilities as a % of Total Liabilities and Equity
Common Shares as a % of Total Liabilities and Equity
Preferred Shares as a % of Total Liabilities and Equity
Retained Earnings as a % of Total Liabilities and Equity
Equity as a % of Total Liabilities and Equity
1958 4.5 7.2 17.8 24.8 46.5 6.7 5.1 37.0 53.4 59 5.1 7.4 19.5 22.5 45.8 6.2 4.7 39.0 54.2 60 2.8 6.5 15.3 25.4 45.8 5.9 4.5 39.4 54.2 61 4.0 6.2 16.3 23.3 44.0 5.7 4.5 41.8 56.0 62 3.9 6.3 16.9 22.6 42.6 5.7 4.3 43.4 57.3 63 4.6 7.2 18.3 21.7 43.4 5.4 3.7 43.8 56.6 64 3.8 8.1 18.4 21.3 45.3 5.3 2.7 43.2 54.7 65 3.7 8.0 17.6 18.3 41.4 8.6 2.0 44.5 58.6 66 3.2 8.3 17.6 17.0 41.2 8.6 1.9 45.1 58.8 67 2.3 7.8 15.9 14.2 37.3 8.8 6.1 44.4 62.7
Retained earnings represent capital to which individual corporations have privileged access. This capital is generated internally from profits, and thus does not move through the competitive capital markets. The corporate decision makers decide what portion of the profits they shall make available for the company's use from this source. In addition, personal income tax is not paid immediately on the income from which such earnings come.
The internal generation of capital funds is most significant in terms of its effects on the structure of the industry. A high degree of internal generation of capital tends to result in an industry that expands from within the established corporate structure, rather than through new capital from outside. Retained earnings built up by firms established in the industry require profitable opportunities for utilization.
Any firm has only so much room to expand capacity of its existing plants, due to constraints imposed by the rate of growth of its market. After this growth has been taken care of by investment in plant and equipment, any additional retained earnings require alternative forms of investment if they are to be profitably utilized. An attractive alternative for any company is to use such funds to purchase other firms already established in the industry. Thus, a high level of retained earnings in an industry tends to contribute to a concentration of ownership of establishments into the hands of fewer and fewer large corporations.
One of the main factors contributing to the high level of retained earnings is a feature of the income tax system that gives high-income shareholders a tax deferment on their share of profits which are retained in the corporation. Shareholders currently get a tax credit on dividends to make an allowance for tax already paid on corporation profits. However, any shareholder with a marginal rate of tax slightly in excess of 40 per cent can obtain a tax deferment by leaving earnings in the corporation in the form of retained earnings.
Such retained earnings are reflected in the market value of the shares of a corporation. Since a corporation has an indefinite life span, this capitalization of retained earnings in terms of market values of shares is not generally discounted by the amount of the deferred tax. Because of the indefinite deferment, the discounted present value of the tax owing in the future approaches zero. As a results, it is often to the advantage of a high-income shareholder to have a large proportion of his earnings in the company in the form of retained earnings.
The data found in Table 81 probably tend to underestimate the contribution that retained earnings make to the capital structure of this industry. This arises from the fact that the data do not include holding companies, which may have acquired share capital in their subsidiaries from earnings which they have received as dividends from these subsidiaries.
PROFITABILITY OF CORPORATIONS
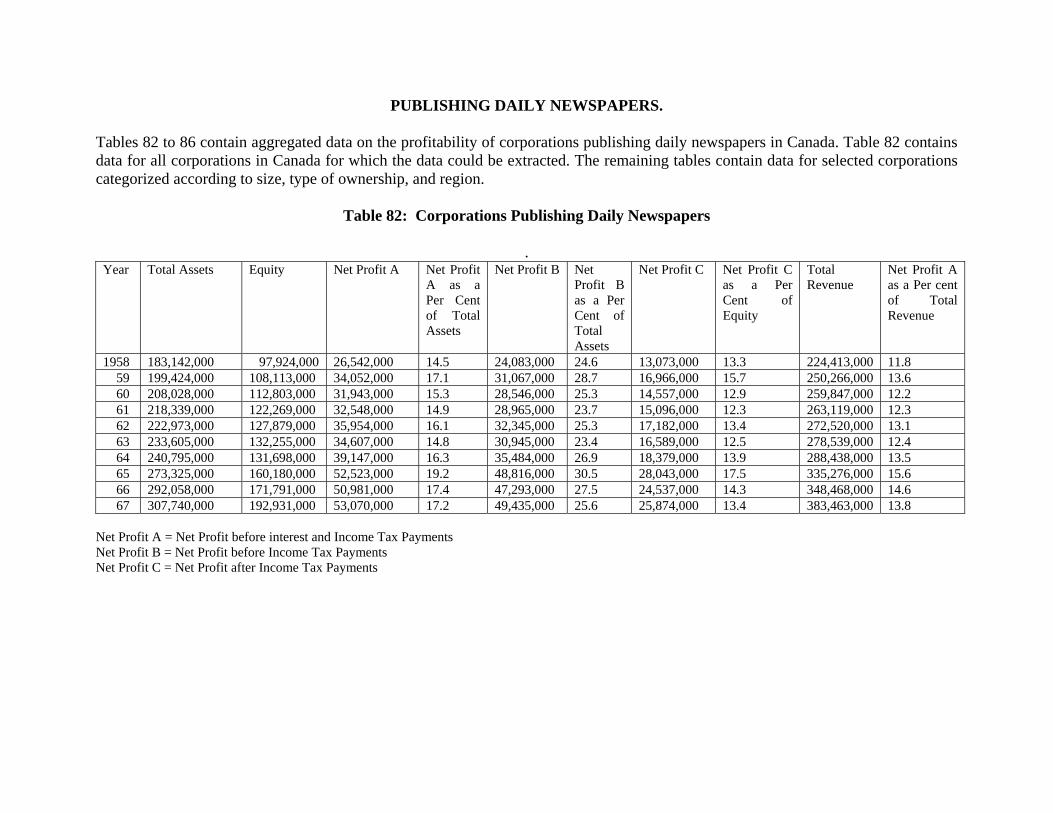
PUBLISHING DAILY NEWSPAPERS.
Tables 82 to 86 contain aggregated data on the profitability of corporations publishing daily newspapers in Canada. Table 82 contains data for all corporations in Canada for which the data could be extracted. The remaining tables contain data for selected corporations categorized according to size, type of ownership, and region.
Table 82: Corporations Publishing Daily Newspapers .
Year Total Assets Equity Net Profit A Net Profit A as a Per Cent of Total Assets
Net Profit B Net Profit B as a Per Cent of Total Assets
Net Profit C Net Profit C as a Per Cent of Equity
Total Revenue
Net Profit A as a Per cent of Total Revenue
1958 183,142,000 97,924,000 26,542,000 14.5 24,083,000 24.6 13,073,000 13.3 224,413,000 11.8 59 199,424,000 108,113,000 34,052,000 17.1 31,067,000 28.7 16,966,000 15.7 250,266,000 13.6 60 208,028,000 112,803,000 31,943,000 15.3 28,546,000 25.3 14,557,000 12.9 259,847,000 12.2 61 218,339,000 122,269,000 32,548,000 14.9 28,965,000 23.7 15,096,000 12.3 263,119,000 12.3 62 222,973,000 127,879,000 35,954,000 16.1 32,345,000 25.3 17,182,000 13.4 272,520,000 13.1 63 233,605,000 132,255,000 34,607,000 14.8 30,945,000 23.4 16,589,000 12.5 278,539,000 12.4 64 240,795,000 131,698,000 39,147,000 16.3 35,484,000 26.9 18,379,000 13.9 288,438,000 13.5 65 273,325,000 160,180,000 52,523,000 19.2 48,816,000 30.5 28,043,000 17.5 335,276,000 15.6 66 292,058,000 171,791,000 50,981,000 17.4 47,293,000 27.5 24,537,000 14.3 348,468,000 14.6 67 307,740,000 192,931,000 53,070,000 17.2 49,435,000 25.6 25,874,000 13.4 383,463,000 13.8
Net Profit A = Net Profit before interest and Income Tax Payments Net Profit B = Net Profit before Income Tax Payments Net Profit C = Net Profit after Income Tax Payments
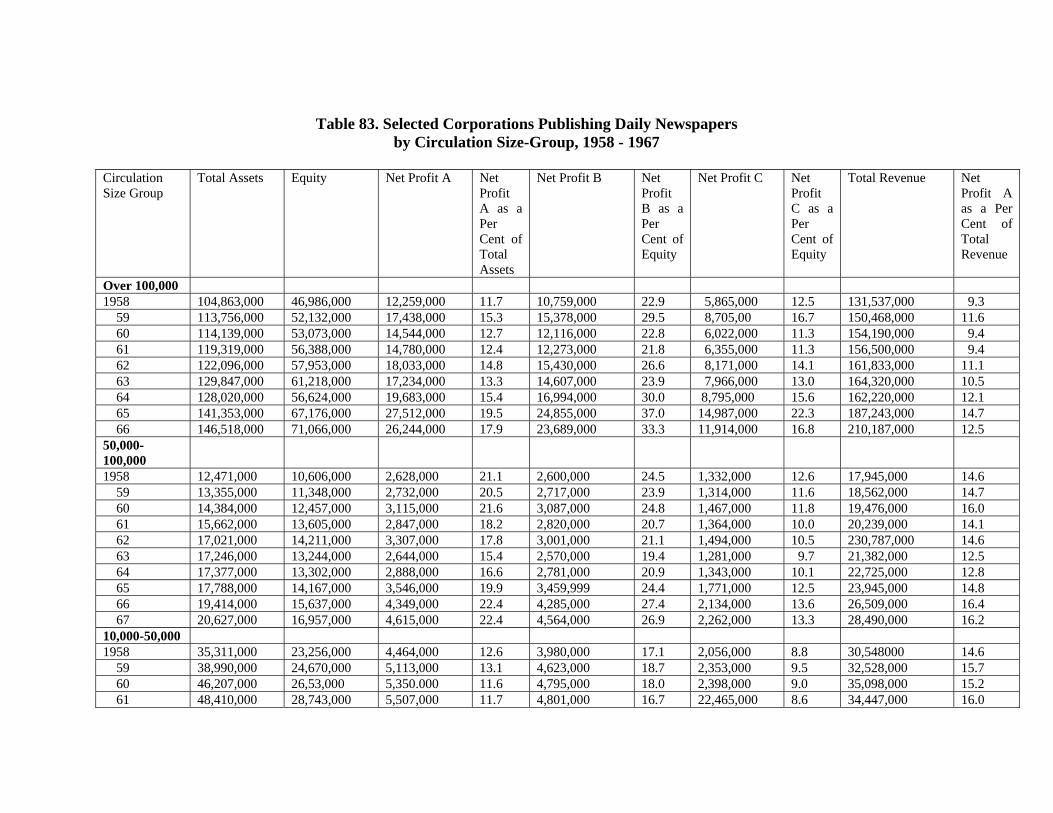
Table 83. Selected Corporations Publishing Daily Newspapers
by Circulation Size-Group, 1958 - 1967
Circulation Size Group
Total Assets Equity Net Profit A Net Profit A as a Per Cent of Total Assets
Net Profit B Net Profit B as a Per Cent of Equity
Net Profit C Net Profit C as a Per Cent of Equity
Total Revenue Net Profit A as a Per Cent of Total Revenue
Over 100,000 1958 104,863,000 46,986,000 12,259,000 11.7 10,759,000 22.9 5,865,000 12.5 131,537,000 9.3 59 113,756,000 52,132,000 17,438,000 15.3 15,378,000 29.5 8,705,00 16.7 150,468,000 11.6 60 114,139,000 53,073,000 14,544,000 12.7 12,116,000 22.8 6,022,000 11.3 154,190,000 9.4 61 119,319,000 56,388,000 14,780,000 12.4 12,273,000 21.8 6,355,000 11.3 156,500,000 9.4 62 122,096,000 57,953,000 18,033,000 14.8 15,430,000 26.6 8,171,000 14.1 161,833,000 11.1 63 129,847,000 61,218,000 17,234,000 13.3 14,607,000 23.9 7,966,000 13.0 164,320,000 10.5 64 128,020,000 56,624,000 19,683,000 15.4 16,994,000 30.0 8,795,000 15.6 162,220,000 12.1 65 141,353,000 67,176,000 27,512,000 19.5 24,855,000 37.0 14,987,000 22.3 187,243,000 14.7 66 146,518,000 71,066,000 26,244,000 17.9 23,689,000 33.3 11,914,000 16.8 210,187,000 12.5 50,000-100,000
1958 12,471,000 10,606,000 2,628,000 21.1 2,600,000 24.5 1,332,000 12.6 17,945,000 14.6 59 13,355,000 11,348,000 2,732,000 20.5 2,717,000 23.9 1,314,000 11.6 18,562,000 14.7 60 14,384,000 12,457,000 3,115,000 21.6 3,087,000 24.8 1,467,000 11.8 19,476,000 16.0 61 15,662,000 13,605,000 2,847,000 18.2 2,820,000 20.7 1,364,000 10.0 20,239,000 14.1 62 17,021,000 14,211,000 3,307,000 17.8 3,001,000 21.1 1,494,000 10.5 230,787,000 14.6 63 17,246,000 13,244,000 2,644,000 15.4 2,570,000 19.4 1,281,000 9.7 21,382,000 12.5 64 17,377,000 13,302,000 2,888,000 16.6 2,781,000 20.9 1,343,000 10.1 22,725,000 12.8 65 17,788,000 14,167,000 3,546,000 19.9 3,459,999 24.4 1,771,000 12.5 23,945,000 14.8 66 19,414,000 15,637,000 4,349,000 22.4 4,285,000 27.4 2,134,000 13.6 26,509,000 16.4 67 20,627,000 16,957,000 4,615,000 22.4 4,564,000 26.9 2,262,000 13.3 28,490,000 16.2 10,000-50,000 1958 35,311,000 23,256,000 4,464,000 12.6 3,980,000 17.1 2,056,000 8.8 30,548000 14.6 59 38,990,000 24,670,000 5,113,000 13.1 4,623,000 18.7 2,353,000 9.5 32,528,000 15.7 60 46,207,000 26,53,000 5,350.000 11.6 4,795,000 18.0 2,398,000 9.0 35,098,000 15.2 61 48,410,000 28,743,000 5,507,000 11.7 4,801,000 16.7 22,465,000 8.6 34,447,000 16.0
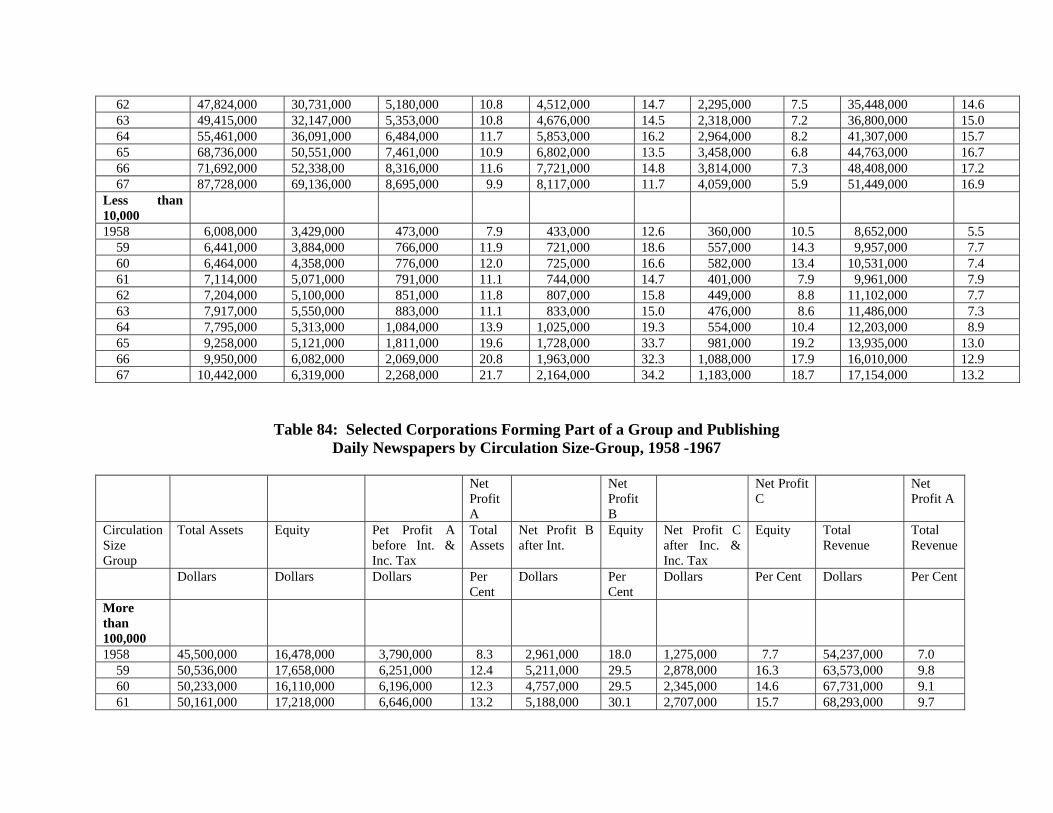
62 47,824,000 30,731,000 5,180,000 10.8 4,512,000 14.7 2,295,000 7.5 35,448,000 14.6 63 49,415,000 32,147,000 5,353,000 10.8 4,676,000 14.5 2,318,000 7.2 36,800,000 15.0 64 55,461,000 36,091,000 6,484,000 11.7 5,853,000 16.2 2,964,000 8.2 41,307,000 15.7 65 68,736,000 50,551,000 7,461,000 10.9 6,802,000 13.5 3,458,000 6.8 44,763,000 16.7 66 71,692,000 52,338,00 8,316,000 11.6 7,721,000 14.8 3,814,000 7.3 48,408,000 17.2 67 87,728,000 69,136,000 8,695,000 9.9 8,117,000 11.7 4,059,000 5.9 51,449,000 16.9 Less than 10,000
1958 6,008,000 3,429,000 473,000 7.9 433,000 12.6 360,000 10.5 8,652,000 5.5 59 6,441,000 3,884,000 766,000 11.9 721,000 18.6 557,000 14.3 9,957,000 7.7 60 6,464,000 4,358,000 776,000 12.0 725,000 16.6 582,000 13.4 10,531,000 7.4 61 7,114,000 5,071,000 791,000 11.1 744,000 14.7 401,000 7.9 9,961,000 7.9 62 7,204,000 5,100,000 851,000 11.8 807,000 15.8 449,000 8.8 11,102,000 7.7 63 7,917,000 5,550,000 883,000 11.1 833,000 15.0 476,000 8.6 11,486,000 7.3 64 7,795,000 5,313,000 1,084,000 13.9 1,025,000 19.3 554,000 10.4 12,203,000 8.9 65 9,258,000 5,121,000 1,811,000 19.6 1,728,000 33.7 981,000 19.2 13,935,000 13.0 66 9,950,000 6,082,000 2,069,000 20.8 1,963,000 32.3 1,088,000 17.9 16,010,000 12.9 67 10,442,000 6,319,000 2,268,000 21.7 2,164,000 34.2 1,183,000 18.7 17,154,000 13.2
Table 84: Selected Corporations Forming Part of a Group and Publishing Daily Newspapers by Circulation Size-Group, 1958 -1967
Net
Profit A
Net Profit B
Net Profit C
Net Profit A
Circulation Size Group
Total Assets Equity Pet Profit A before Int. & Inc. Tax
Total Assets
Net Profit B after Int.
Equity Net Profit C after Inc. & Inc. Tax
Equity Total Revenue
Total Revenue
Dollars Dollars Dollars Per Cent
Dollars Per Cent
Dollars Per Cent Dollars Per Cent
More than 100,000
1958 45,500,000 16,478,000 3,790,000 8.3 2,961,000 18.0 1,275,000 7.7 54,237,000 7.0 59 50,536,000 17,658,000 6,251,000 12.4 5,211,000 29.5 2,878,000 16.3 63,573,000 9.8 60 50,233,000 16,110,000 6,196,000 12.3 4,757,000 29.5 2,345,000 14.6 67,731,000 9.1 61 50,161,000 17,218,000 6,646,000 13.2 5,188,000 30.1 2,707,000 15.7 68,293,000 9.7
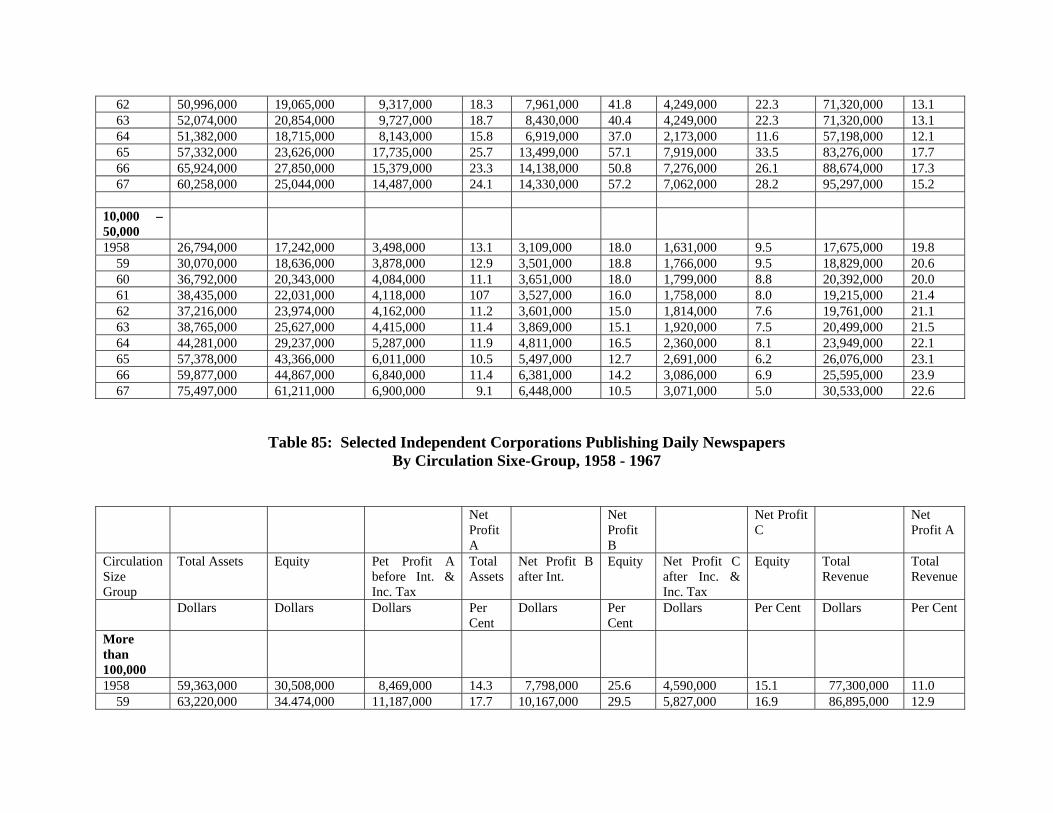
62 50,996,000 19,065,000 9,317,000 18.3 7,961,000 41.8 4,249,000 22.3 71,320,000 13.1 63 52,074,000 20,854,000 9,727,000 18.7 8,430,000 40.4 4,249,000 22.3 71,320,000 13.1 64 51,382,000 18,715,000 8,143,000 15.8 6,919,000 37.0 2,173,000 11.6 57,198,000 12.1 65 57,332,000 23,626,000 17,735,000 25.7 13,499,000 57.1 7,919,000 33.5 83,276,000 17.7 66 65,924,000 27,850,000 15,379,000 23.3 14,138,000 50.8 7,276,000 26.1 88,674,000 17.3 67 60,258,000 25,044,000 14,487,000 24.1 14,330,000 57.2 7,062,000 28.2 95,297,000 15.2 10,000 – 50,000
1958 26,794,000 17,242,000 3,498,000 13.1 3,109,000 18.0 1,631,000 9.5 17,675,000 19.8 59 30,070,000 18,636,000 3,878,000 12.9 3,501,000 18.8 1,766,000 9.5 18,829,000 20.6 60 36,792,000 20,343,000 4,084,000 11.1 3,651,000 18.0 1,799,000 8.8 20,392,000 20.0 61 38,435,000 22,031,000 4,118,000 107 3,527,000 16.0 1,758,000 8.0 19,215,000 21.4 62 37,216,000 23,974,000 4,162,000 11.2 3,601,000 15.0 1,814,000 7.6 19,761,000 21.1 63 38,765,000 25,627,000 4,415,000 11.4 3,869,000 15.1 1,920,000 7.5 20,499,000 21.5 64 44,281,000 29,237,000 5,287,000 11.9 4,811,000 16.5 2,360,000 8.1 23,949,000 22.1 65 57,378,000 43,366,000 6,011,000 10.5 5,497,000 12.7 2,691,000 6.2 26,076,000 23.1 66 59,877,000 44,867,000 6,840,000 11.4 6,381,000 14.2 3,086,000 6.9 25,595,000 23.9 67 75,497,000 61,211,000 6,900,000 9.1 6,448,000 10.5 3,071,000 5.0 30,533,000 22.6
Table 85: Selected Independent Corporations Publishing Daily Newspapers By Circulation Sixe-Group, 1958 - 1967
Net Profit A
Net Profit B
Net Profit C
Net Profit A
Circulation Size Group
Total Assets Equity Pet Profit A before Int. & Inc. Tax
Total Assets
Net Profit B after Int.
Equity Net Profit C after Inc. & Inc. Tax
Equity Total Revenue
Total Revenue
Dollars Dollars Dollars Per Cent
Dollars Per Cent
Dollars Per Cent Dollars Per Cent
More than 100,000
1958 59,363,000 30,508,000 8,469,000 14.3 7,798,000 25.6 4,590,000 15.1 77,300,000 11.0 59 63,220,000 34.474,000 11,187,000 17.7 10,167,000 29.5 5,827,000 16.9 86,895,000 12.9

60 63,906,000 36,963,000 8,348,000 13.1 7,359,000 19.9 3,677,000 10.0 86,465,000 9.7 61 69,158,000 39,170,000 8,134,000 11.8 7,085,000 18.1 3,648,000 9.3 88207,000 9.2 62 71,100,000 38,888,000 8,716,000 12.3 7,469,000 19.2 3,922,000 10.1 90,513,000 9.6 63 77,800,000 40,364,000 7,525,000 9.7 6,177,000 15.3 3,206,000 7.9 91,357,000 8.2 64 76,638,000 37,909,000 11,540,000 15.1 10,065,000 26.6 6,622,000 17.5 95,022,000 12.1 65 84,021,000 43,550,000 17,777,000 15.2 11,356,000 26.1 7,068,000 16.2 103,967,000 12.3 66 85,710,000 45,115,000 10,022,000 11.7 8,599,000 19.1 4,456,000 9.9 109,864,000 9.1 67 86,260,000 46,022,000 10,757,000 12.5 9,359,000 20.3 4,852,000 10.5 114,890,000 9.4 10,000 – 50,000
1958 8,571,000 6,014,000 966,000 11.3 871,000 14.5 425,000 7.1 12,873,000 7.5 59 8,920,000 6,034,000 1,235,000 13.9 1,122,000 18.6 587,000 9.7 13,699,000 9.0 60 9,415,000 6,220,000 1,253,000 13.3 1,141,000 18.3 599,000 9.6 14,697,000 8.5 61 9,975,000 6,712,000 1,289,000 13.9 1,274,000 19.0 707,000 10.5 15,262,000 9.1 62 10,608,000 6,757,000 1,018,000 9.6 911,000 13.5 481,000 7.1 15,687,000 6.5 63 10,650,000 6,520,000 938,000 8.8 807,000 12.4 398,000 6.1 16,301,000 5.8 64 11,180,000 6,854,000 1,197,000 10.7 1,042,000 15.2 604,000 8.8 17,358,000 6.9 65 11,358,000 7,185,000 1,450,000 12.8 1,305,000 18.2 767,000 10.7 18,687,000 7.8 66 11,815,000 7,471,000 1,476,000 12.5 1,340,000 17.9 728,000 9.7 19,813,000 7.5 67 12,231,000 7,924,000 1,495,000 12.2 1,369,000 17.3 988,000 12.5 20,916,000 7.2
Table 86: Selected Corporations Publishing Daily Newspapers With Circulation under 100,000 by Region
Net Profit A
Net Profit B
Net Profit C
Net Profit A
Circulation Size Group
Total Assets Equity Pet Profit A before Int. & Inc. Tax
Total Assets
Net Profit B after Int.
Equity Net Profit C after Inc. & Inc. Tax
Equity Total Revenue
Total Revenue
Dollars Dollars Dollars Per Cent
Dollars Per Cent
Dollars Per Cent Dollars Per Cent
Atlantic 1958 4,221,000 3,617,000 628,000 14.9 591,000 16.3 356,000 9.8 5,081,000 12.4 59 4,663,000 3,554,000 644,000 13.8 607,000 17.1 327,000 9.2 5,368,000 12.0

60 4,760,000 3,822,000 691,000 14.5 651,000 17.0 351,000 9.2 5,895,000 11.7 61 5,145,000 4,023,000 623,000 12.1 592,000 14.7 327,000 8.1 6,245,000 10.0 62 5,523,000 4,250,000 727,000 13.2 697,000 16.4 378,000 8.9 6,576,000 11.1 63 6,516,000 4,116,000 547,000 8.4 464,000 11.3 268,000 6.5 6,783,000 8.1 64 7,072,000 4,222,000 402,000 5.7 293,000 6.9 174,000 4.1 7,167,000 5.6 65 7,189,000 4,482,000 432,000 6.0 348,000 7.8 208,000 4.6 7,693,000 5.6 66 6,921,000 4,572,000 574,000 8.3 491,000 10.7 271,000 5.9 8,295,000 6.9 67 7,033,000 4,804,000 704,000 10.0 603,000 12.6 342,000 7.1 8,661,000 8.1 Quebec 1958 3,403,000 1,469,000 205,000 6.0 135,000 9.2 20,000 1.4 4,320,000 4.8 59 3,669,000 1,627,000 219,000 6.0 142,000 8.7 113,000 7.0 4,543,000 4.8 60 3,920,000 1,712,000 305,000 7.8 213,000 12.4 80,000 4.7 4,845,000 6.3 61 4.061,000 1,784,000 311,000 7.7 220,000 12.3 59,000 3.3 4,745,000 6.6 62 4,228,000 1,836,000 331,000 7.8 245,000 13.3 65,000 3.5 4,931,000 6.7 63 4,518,000 1,957,000 377,000 8.3 303,000 15.5 84,000 4.3 4,953,000 7.6 64 4,805,000 2,242,000 735,000 15.3 654,000 29.2 339,000 15.1 5,147,000 14.3 65 5,090,000 2,704,000 891,000 17.5 800,000 29.6 483,000 17.9 5,706,000 15.6 66 5,625,000 2,880,000 739,000 13.1 665,000 23.1 327,000 11.4 5,995,000 12.3 67 5,324,000 2,822,000 821,000 15.4 760,000 26.9 424,000 15.0 6,098,000 13.5 Ontario 1958 36,995,000 25,443,000 4,925,000 13.3 4,518,000 17.8 2,412,000 9.5 33,286,000 14.8 59 40,045,000 27,084,000 5,573,000 13.9 5,178,000 19.1 2,788,000 10.3 36,038,000 15.5 60 47,533,000 29,665,000 6,102,000 12.8 5,657,000 19.1 2,990,000 10.1 38,973,000 15.7 61 50,668,000 32,516,000 6,026,000 11.9 5,416,000 16.7 2,770,000 8.5 38,716,000 15.6 62 50,294,000 34,396,000 5,644,000 11.2 5,057,000 14.7 2,589,000 7.5 39,631,000 14.2 63 50,919,000 35,023,000 6,021,000 11.8 5,404,000 15.4 2,700,000 7.7 41,086,000 14.7 64 55,787,000 38,512,000 7,402,000 13.3 6,866,000 17.8 3,408,000 8.9 45,791,000 16.2 65 68,710,000 52,624,000 8,649,000 12.6 8,117,000 15.4 4,039,000 7.7 49,088,000 17.6 66 72,677,000 55,046,000 10,173,000 14.0 9,715,000 17.7 4,773,000 8.7 53,631,000 19.0 67 89,774,000 72,551,000 10,830,000 12.1 10,361,000 14.3 5,124,000 7.1 57,921,000 18.7 Prairies 1958 5,461,000 4,372,000 1,236,000 22.8 1,210,000 27.7 671,000 15.4 7,395,000 16.7 59 6,251,000 5,001,000 1,372,000 22.0 1,344,000 26.9 670,000 13.4 7,828,000 17.5 60 6,902,000 5,542,000 1,415,000 20.5 1,384,000 25.0 689,000 12.4 8,043,000 17.6 61 7,103,000 5,924,000 1,475,000 20.8 1,447,000 24.4 751,000 12.7 8,237,000 17.9 62 7,737,000 6,478,000 1,483,000 19.2 1,457,000 22.5 754,000 11.7 8,477,000 17.5
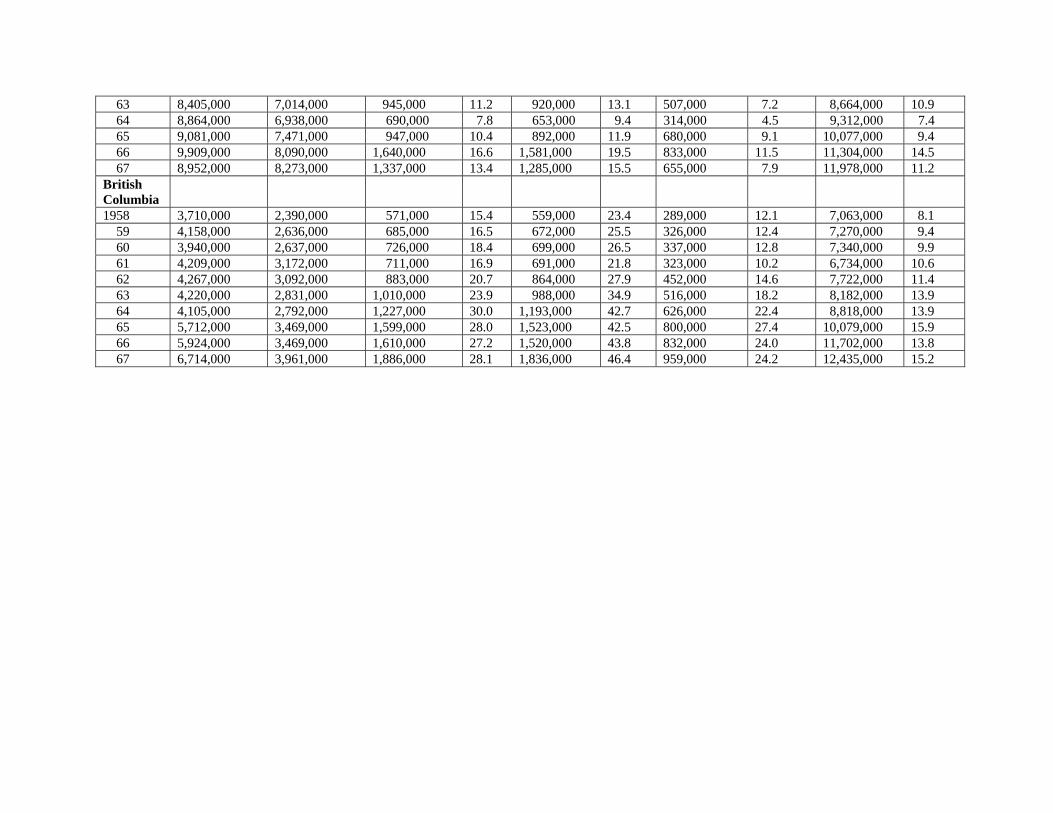
63 8,405,000 7,014,000 945,000 11.2 920,000 13.1 507,000 7.2 8,664,000 10.9 64 8,864,000 6,938,000 690,000 7.8 653,000 9.4 314,000 4.5 9,312,000 7.4 65 9,081,000 7,471,000 947,000 10.4 892,000 11.9 680,000 9.1 10,077,000 9.4 66 9,909,000 8,090,000 1,640,000 16.6 1,581,000 19.5 833,000 11.5 11,304,000 14.5 67 8,952,000 8,273,000 1,337,000 13.4 1,285,000 15.5 655,000 7.9 11,978,000 11.2 British Columbia
1958 3,710,000 2,390,000 571,000 15.4 559,000 23.4 289,000 12.1 7,063,000 8.1 59 4,158,000 2,636,000 685,000 16.5 672,000 25.5 326,000 12.4 7,270,000 9.4 60 3,940,000 2,637,000 726,000 18.4 699,000 26.5 337,000 12.8 7,340,000 9.9 61 4,209,000 3,172,000 711,000 16.9 691,000 21.8 323,000 10.2 6,734,000 10.6 62 4,267,000 3,092,000 883,000 20.7 864,000 27.9 452,000 14.6 7,722,000 11.4 63 4,220,000 2,831,000 1,010,000 23.9 988,000 34.9 516,000 18.2 8,182,000 13.9 64 4,105,000 2,792,000 1,227,000 30.0 1,193,000 42.7 626,000 22.4 8,818,000 13.9 65 5,712,000 3,469,000 1,599,000 28.0 1,523,000 42.5 800,000 27.4 10,079,000 15.9 66 5,924,000 3,469,000 1,610,000 27.2 1,520,000 43.8 832,000 24.0 11,702,000 13.8 67 6,714,000 3,961,000 1,886,000 28.1 1,836,000 46.4 959,000 24.2 12,435,000 15.2

The results found in the tables speak for themselves. However, the following acts as a brief summary of some of the more salient points: 1 Before-tax profits as a percentage of total equity for all newspapers have ranged between 23 per cent and 30 per cent over the ten-year period. This indicates the returns being earned by shareholders on capital they have contributed to the companies. After-tax profits as a percentage of equity amount to slightly over one half of the percentage for before-tax profits. 2 The largest newspapers (over 100,000) and the smallest newspapers (under 10,000) are the most profitable in terms of returns on equity. Companies publishing newspapers with circulations of over 100,000 and under 10,000 consistently earned before-tax profits in excess of 30 per cent from 1965 onward. In both cases, this profit rate has shown a definite increase in the later years of the ten-year period. This increase was most spectacular for the smaller group, where the rate of return on equity in the early 1960s was less than one-half of the rate in the post-1964 period. 3 Companies publishing newspapers in the 10,000 to 50,000 circulation range are the least profitable, with an after-tax rate of profit on equity in recent years of less than one half of the rate for the industry as a whole. Profitability for this group has been also showing a declining trend over the ten-year period covered.
The reason for the pressure on profits of newspapers in this size-range would appear to be explained by costs having grown more rapidly than revenues. Advertising rates have not increased as rapidly as for papers in other size-groups, and costs have generally been growing at a more rapid rate than for other size-groups. 4 Corporations forming part of newspaper groups, and publishing newspapers with a circulation of over 100,000, have been earning a high and growing rate of profit. In 1967, the before-tax rate of return on equity for this group was 57.2 per cent. The rate was approximately 30 per cent in the period 1959-61. The high rate of profit for corporations in this group can be attributed to three factors. First, newspapers in large metropolitan centres generally tend to be very profitable. Second, the large groups tend to purchase the more profitable newspaper companies. Third, many of the cost economies achieved through group ownership have been used to increase profits rather than to reduce advertising and subscription rates. 5 Quebec and British Columbia are the two regions where daily newspaper publishing appears to be most profitable. The Atlantic region has the least profitable newspapers. Newspapers in the Prairies and Ontario have profit rates considerably below those of Quebec and British Columbia but somewhat above those of the Atlantic region.
The profitability of newspaper publishing has shown significant increases in Quebec and British Columbia over the ten-year period covered, while in the Prairies the situation has been the reverse. Profit rates in the Atlantic region and Ontario have been more stable, although the rates in both regions followed a slightly downward trend over the ten-year period.
INPUT-OUTPUT RELATIONSHIPS Table 87 contains data for the most important input-output relationships for corporations publishing daily newspapers in Canada over the ten-year period from 1958 to 1967.
The first section contains total receipts, expenses and profits in millions of dollars. The second section shows the distribution of each category of expenses and profits as a percentage of total receipts. Purchased inputs made up the largest single component of expenses, accounting for from 40 per cent to 45 per cent of total receipts over the 1958 to 1967 period. Wages and salaries were next in importance, accounting for from 38 per cent to 40 per cent of total receipts. Gross returns to capital (including depreciation, interest and taxes) accounted for from 16.7 per cent to 20.9 per cent of receipts over the period. Gross returns to capital showed a greater degree of instability than either purchased inputs or wages and salaries. This is to be expected because returns to capital form a residual after other obligations have been met. Returns to labour in the form of wages and salaries, are approximately twice the gross returns to capital. This indicates the high degree of labour intensity in the daily newspaper publishing industry.
The third section contains indices based on 1958=100, of total receipts, expenses and profits over the ten-year period. Comparisons between such indices provide a measure of trends in costs relative to revenues, and consequently of the types of inflationary pressures, if any, prevailing in the industry.
Total receipts of the corporations included in this data grew by approximately 71 per cent over the ten-year period. Expenditures on purchased inputs grew by 61.4 per cent and expenditures on wages and salaries grew by 71.5 per cent. Gross returns to capital, on the other hand, grew by 95.2 per cent over the period.
The fact that gross returns to capital grew more rapidly than expenditures on purchased inputs and wages and salaries has two possible explanations. First, this could reflect increasing capital intensity in the industry. If this were the case, a definite trend should be developing whereby capital's share of returns is increasing in a clearly discernible way. In fact, such a trend cannot be found in the data. Second, the rapid rate of growth in the gross returns to capital relative to other expense items can reflect the fact that the demand for the product of the industry has been growing at a sufficiently rapid rate to permit higher profits in the industry. This appears to be
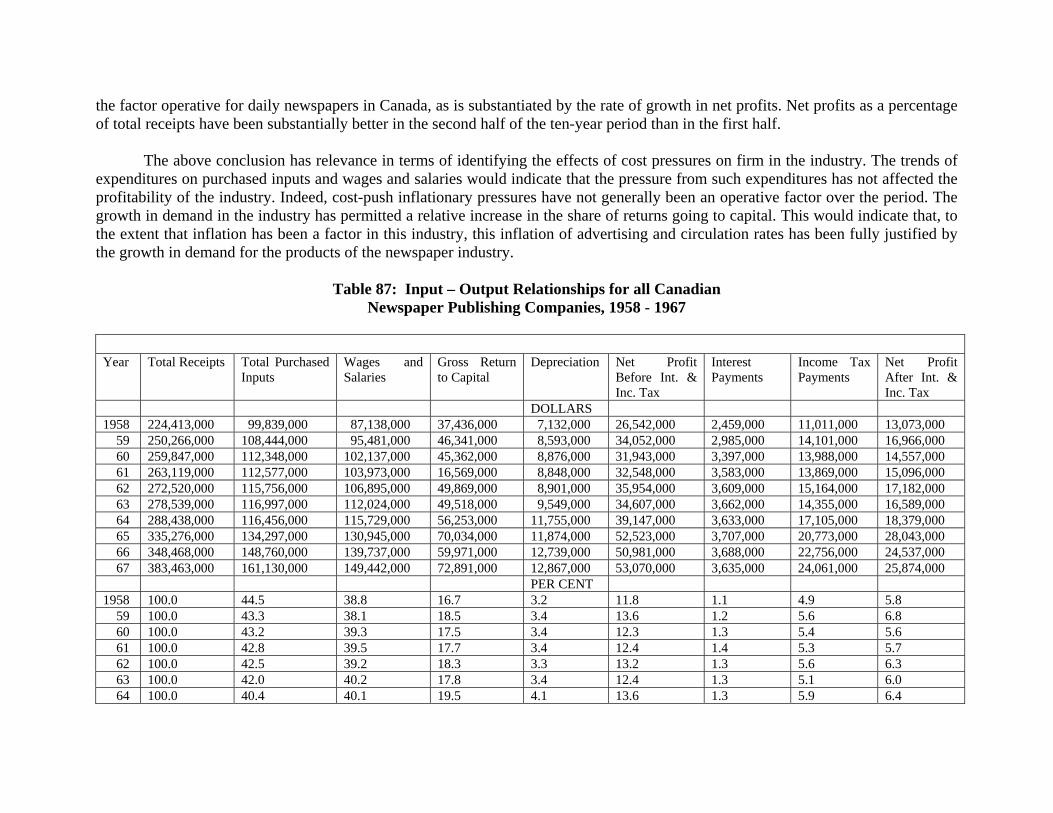
the factor operative for daily newspapers in Canada, as is substantiated by the rate of growth in net profits. Net profits as a percentage of total receipts have been substantially better in the second half of the ten-year period than in the first half.
The above conclusion has relevance in terms of identifying the effects of cost pressures on firm in the industry. The trends of expenditures on purchased inputs and wages and salaries would indicate that the pressure from such expenditures has not affected the profitability of the industry. Indeed, cost-push inflationary pressures have not generally been an operative factor over the period. The growth in demand in the industry has permitted a relative increase in the share of returns going to capital. This would indicate that, to the extent that inflation has been a factor in this industry, this inflation of advertising and circulation rates has been fully justified by the growth in demand for the products of the newspaper industry.
Table 87: Input – Output Relationships for all Canadian
Newspaper Publishing Companies, 1958 - 1967 Year Total Receipts Total Purchased
Inputs Wages and Salaries
Gross Return to Capital
Depreciation Net Profit Before Int. & Inc. Tax
Interest Payments
Income Tax Payments
Net Profit After Int. & Inc. Tax
DOLLARS 1958 224,413,000 99,839,000 87,138,000 37,436,000 7,132,000 26,542,000 2,459,000 11,011,000 13,073,000 59 250,266,000 108,444,000 95,481,000 46,341,000 8,593,000 34,052,000 2,985,000 14,101,000 16,966,000 60 259,847,000 112,348,000 102,137,000 45,362,000 8,876,000 31,943,000 3,397,000 13,988,000 14,557,000 61 263,119,000 112,577,000 103,973,000 16,569,000 8,848,000 32,548,000 3,583,000 13,869,000 15,096,000 62 272,520,000 115,756,000 106,895,000 49,869,000 8,901,000 35,954,000 3,609,000 15,164,000 17,182,000 63 278,539,000 116,997,000 112,024,000 49,518,000 9,549,000 34,607,000 3,662,000 14,355,000 16,589,000 64 288,438,000 116,456,000 115,729,000 56,253,000 11,755,000 39,147,000 3,633,000 17,105,000 18,379,000 65 335,276,000 134,297,000 130,945,000 70,034,000 11,874,000 52,523,000 3,707,000 20,773,000 28,043,000 66 348,468,000 148,760,000 139,737,000 59,971,000 12,739,000 50,981,000 3,688,000 22,756,000 24,537,000 67 383,463,000 161,130,000 149,442,000 72,891,000 12,867,000 53,070,000 3,635,000 24,061,000 25,874,000 PER CENT 1958 100.0 44.5 38.8 16.7 3.2 11.8 1.1 4.9 5.8 59 100.0 43.3 38.1 18.5 3.4 13.6 1.2 5.6 6.8 60 100.0 43.2 39.3 17.5 3.4 12.3 1.3 5.4 5.6 61 100.0 42.8 39.5 17.7 3.4 12.4 1.4 5.3 5.7 62 100.0 42.5 39.2 18.3 3.3 13.2 1.3 5.6 6.3 63 100.0 42.0 40.2 17.8 3.4 12.4 1.3 5.1 6.0 64 100.0 40.4 40.1 19.5 4.1 13.6 1.3 5.9 6.4
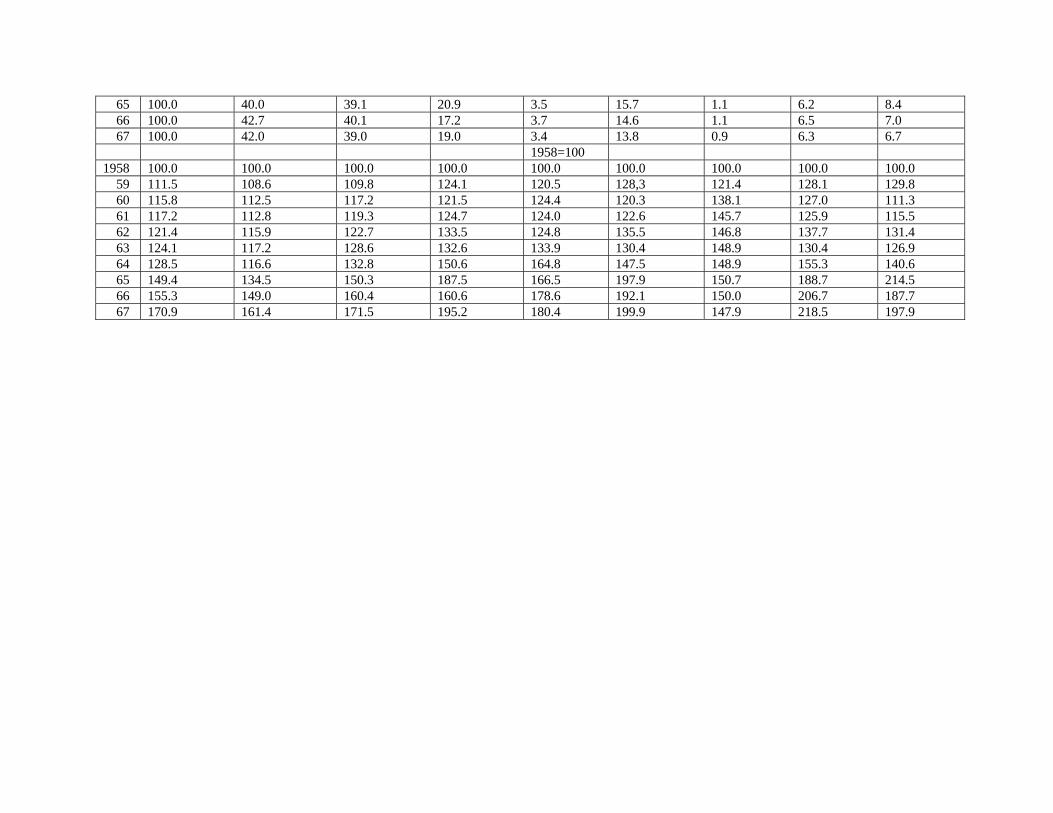
65 100.0 40.0 39.1 20.9 3.5 15.7 1.1 6.2 8.4 66 100.0 42.7 40.1 17.2 3.7 14.6 1.1 6.5 7.0 67 100.0 42.0 39.0 19.0 3.4 13.8 0.9 6.3 6.7 1958=100 1958 100.0 100.0 100.0 100.0 100.0 100.0 100.0 100.0 100.0 59 111.5 108.6 109.8 124.1 120.5 128,3 121.4 128.1 129.8 60 115.8 112.5 117.2 121.5 124.4 120.3 138.1 127.0 111.3 61 117.2 112.8 119.3 124.7 124.0 122.6 145.7 125.9 115.5 62 121.4 115.9 122.7 133.5 124.8 135.5 146.8 137.7 131.4 63 124.1 117.2 128.6 132.6 133.9 130.4 148.9 130.4 126.9 64 128.5 116.6 132.8 150.6 164.8 147.5 148.9 155.3 140.6 65 149.4 134.5 150.3 187.5 166.5 197.9 150.7 188.7 214.5 66 155.3 149.0 160.4 160.6 178.6 192.1 150.0 206.7 187.7 67 170.9 161.4 171.5 195.2 180.4 199.9 147.9 218.5 197.9

If rate increases were forced through increasing costs rather than induced through
growing demand, it would be expected that profit shares would be declining. However, when rates can be set which actually permit an increase in profit shares, it must be the case that demand for the products of the industry is growing sufficiently as to permit rate increases greater than those necessary simply to meet the growth in costs. This would appear to be the situation in daily newspaper publishing over the ten year period covered.
The data in Table 88 provide a basis for comparison of the capital structure and profit rates of the media industries relative to other sectors of the economy. The years 1965 and 1966 have been selected since they cover the most recent two year period for which the data for all industries are available.
The following are the relevant conclusions to be drawn from the results found in Table 88: 1 Current assets constitute slightly less than 30 per cent of all assets in the daily newspaper publishing industry. The data from which these results were calculated indicated that current assets are almost equally divided between cash and securities on the one hand, and accounts receivable on the other.
Newspaper publishing firms have a relatively lower current asset requirement than either the manufacturing or retail trade industries. This is largely a result of lower accounts receivable as a proportion of current assets, and is at least partially explainable by the monopoly structure in the media industries, permitting them to put less emphasis on trade credit as a competitive technique. 2 Buildings and equipment make up a larger proportion of total assets in the daily newspaper publishing industry than the manufacturing and retail trade industries. This is partially a reflection of the fact that current assets assume a proportionately smaller importance in the media industries. 3 Retained earnings constitute a much larger proportion of total liabilities and equity in the daily newspaper publishing industry than in any of the other industries. This has two important implications.
First, a high level of retained earnings in an industry indicates that the industry has been highly profitable in the past. Retained earnings are made up of past profits retained in the company after dividends have been paid. Assuming that corporations must, over the long run, payout some normal return on share capital, higher-than-average retained earnings can generally only be built up through time if profits are higher than the average for other industries.
Second, a high level of retained earnings in an industry indicates a large stock of capital in the industry in search of profitable investments. These funds can be used to finance the purchase of new buildings, equipment, and other fixed assets, to purchase bonds and securities, to purchase shares in companies active in other sectors of the economy, and to purchase shares in

competing companies within the same industry. Which of these alternatives is chosen will depend upon which provide promise of the greatest return on funds so invested. If most firms within a given industry tend to be highly profitable, there is a very strong pressure toward the concentration of more and more of the firms under the

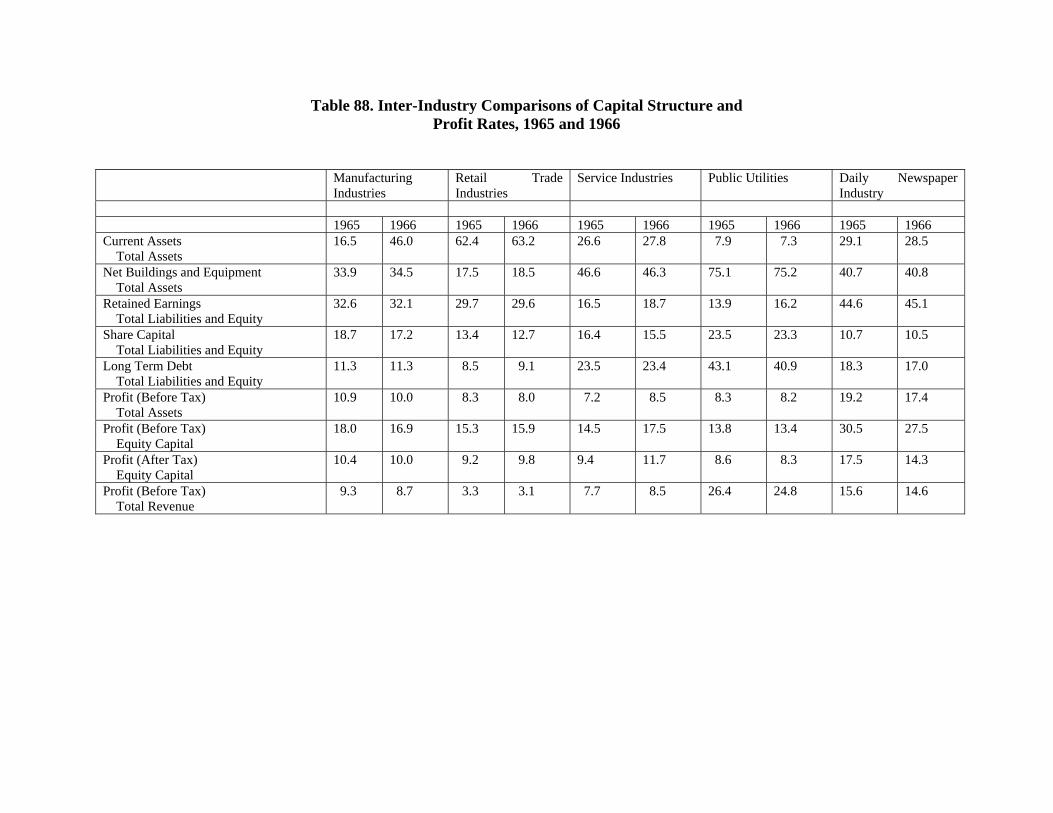
Table 88. Inter-Industry Comparisons of Capital Structure and Profit Rates, 1965 and 1966
Manufacturing Industries
Retail Trade Industries
Service Industries Public Utilities Daily Newspaper Industry
1965 1966 1965 1966 1965 1966 1965 1966 1965 1966 Current Assets Total Assets
16.5 46.0 62.4 63.2 26.6 27.8 7.9 7.3 29.1 28.5
Net Buildings and Equipment Total Assets
33.9 34.5 17.5 18.5 46.6 46.3 75.1 75.2 40.7 40.8
Retained Earnings Total Liabilities and Equity
32.6 32.1 29.7 29.6 16.5 18.7 13.9 16.2 44.6 45.1
Share Capital Total Liabilities and Equity
18.7 17.2 13.4 12.7 16.4 15.5 23.5 23.3 10.7 10.5
Long Term Debt Total Liabilities and Equity
11.3 11.3 8.5 9.1 23.5 23.4 43.1 40.9 18.3 17.0
Profit (Before Tax) Total Assets
10.9 10.0 8.3 8.0 7.2 8.5 8.3 8.2 19.2 17.4
Profit (Before Tax) Equity Capital
18.0 16.9 15.3 15.9 14.5 17.5 13.8 13.4 30.5 27.5
Profit (After Tax) Equity Capital
10.4 10.0 9.2 9.8 9.4 11.7 8.6 8.3 17.5 14.3
Profit (Before Tax) Total Revenue
9.3 8.7 3.3 3.1 7.7 8.5 26.4 24.8 15.6 14.6
ownership of a few larger corporations. The larger, highly profitable corporations tend to build up large stocks of retained earnings. In the search for profitable investments for these funds, these corporations are attracted to independent, highly-profitable firms within the same industry. Investment within the same industry has further added advantages. Certain cost economies can often be achieved by consolidating the operations of firms producing similar products. Managers also generally prefer to extend ownership within the same industry. Thus, if firms in an industry are generally profitable, it is almost inevitable that a pattern of increasing concentration of ownership will develop through time.
This prescription describes the forces which have been, and continue to be, operative in the daily newspaper industry. The larger firms, in particular, have built up substantial retained earnings through time. This accumulation of funds keeps such firms in constant search for an outlet for these funds. Some of the most attractive alternatives in the whole economy exist right within the newspaper industry. As a result, these firms tend to compete very strongly to buy other newspapers. Their success at doing so is indicated by the increasing dominance of group ownership in the industry. 4 Share capital makes up a smaller proportion of total liabilities and equity in the daily newspaper industry than in any of the other industries. This is again largely explainable by the highly profitable nature of the industry. The high profits make it possible to raise much of the capital needed for expansion from current and retained income. Raising the funds through share capital would tend to dilute the shares already issued by spreading the high profits over a larger number of shares. 5 Long-term debt makes up a larger proportion of liabilities and equity for newspapers than for manufacturing and retail trade industries. This is also attributable to the high profits in the newspaper industry. With the extremely high profits prevalent in the industry, long-term debt is generally a much more attractive source of capital than share issues. New share issues result in a spreading of the high profits over a larger number of shareholders, which tends to dilute the shares already outstanding. Long-term debt, on the other hand, raised at a fixed interest rate, permits a larger portion of the profits on new capital to be retained by the current shareholders.
These circumstances have been altered somewhat in recent years for some public companies for which the market price of shares is highly inflated relative to earnings. If new shares can be issued at these inflated prices, new share capital can be raised without seriously diluting returns on shares already outstanding.
The somewhat higher proportion of long-term debt in the service industries can be attributed to the relatively low level of retained earnings in this industry. This is also true of the radio and television industry. A high rate of growth of capital assets, plus a lower rate of profit, has forced these industries to draw more heavily on long-term debt in order to raise the required capital. 6 Before-tax profits as a percentage of total assets in the daily newspaper industry are close to twice those found in other industries. This is a clear indication of the monopoly structure found in this industry. In an industry which is highly competitive, competition between existing
firms and from new interests should result in profit rates which are roughly comparable for various industries. Industries characterized by monopolies are able to restrict the degree of output-expanding capital accumulation such as to maintain prices and rates at a high enough level to yield higher than normal profits. The profit rates for daily newspapers indicate that monopoly power is being used, intentionally or unintentionally, to generate very high profits. 7 Rates of return on equity indicate the profit rates being earned on capital actually contributed by shareholders of the companies involved. Such contributions largely come through share capital and retained earnings.
In 1965, before-tax profits on equity in the daily newspaper industry equalled 30.5 per cent, compared to 18.0 per cent in manufacturing and approximately 15.0 per cent in most other industries. 1965 was somewhat exceptional for daily newspapers, in terms of profitability, while 1966 was more typical. In 1966, profits on equity were 27.5 per cent, which is still a high figure. 8 The profit rates indicated probably tend to underestimate the actual profitability of the corporations involved. Many private corporations, and particularly the highly profitable ones, use various types of management companies to divert a portion of profits out of the accounts of the operative corporations. It has not been possible to include such companies in the media industry groupings because of the difficulties in identifying them. However, if these companies were included, profit rates would almost certainly be higher than indicated.
THE COST-PRICE SQEEZE In the course of interviews conducted by the research team, a number of references were made to a "cost-price squeeze" in the publishing industry, a common complaint in all industries in these days of rapid inflation. However, the phrase "cost-price squeeze" must be conceptually precise if it is to be used to explain the economic fortunes of an industry. In its most simple application, it is used to refer to a situation in which input prices rise at a faster rate than entrepreneurs are able to increase the price of the product. given the nature of-demand for the product. However, this application of the concept implies that the physical input mix remains unchanged over the time period considered. In reality, of course, this is seldom, if ever, the case. In addition, the prices of all inputs do not usually increase at the same rate, making it even more difficult to identify the "cost-price squeeze" solely from data on the prices of inputs and the prices of final products.
The data in table 88, however, permit conclusions regarding the existence of a "cost-price squeeze" in this industry. Because these data are constituted of total dollar revenue and costs figures, they take account of movements in both physical quantity and price of inputs and product. The "cost-price squeeze" concept is still applicable. However, the "squeeze" is now considered to be in play if costs, considered as a group, advance more rapidly than total revenues, leading to a reduction in the share of net profits accruing to the industry. In view of the conclusions drawn about net profits above, it can be concluded that the evidence to support the claim of a "cost-price squeeze" in the publishing industry during the 1960s is very weak indeed. In fact, producers appear to have been able to increase the relative share of net profits over the period considered.

As a corollary to this conclusion, it also follows that "cost-push" inflationary pressures were not dominant over the period. While the results do not permit the drawing of this conclusion with complete certainty, they do indicate that the cost of capital equipment must be the source of this "cost-push" inflation if it did exist. But if capital costs were the source of "cost-push" inflation over the period, this would have to be reflected in an increase in capital intensity in the industry, given the overall movements in other costs. For reasons already mentioned, it has been tentatively concluded that such a shift in capital intensity did not in fact occur. As a result, it is tentatively concluded that to the extent that inflation existed in the industry over the period, it was predominantly of the "demand-induced" type.
This section will outline the nature of the industry cost function for daily newspapers in Canada. The discussion will be extended to include the cost function for individual dailies of different sizes, and for those operating under different types of ownership patterns.
Many of the most important conclusions of the entire study are to be found in this section. One of the primary objectives of this study has been to explain the very strong tendency towards local concentration in the industry. This concentration is manifested in the form of more and more single-newspaper cities. This section contains cost data which suggest that cost conditions are the major contributing factor to the dominance of single-newspaper cities. The Industry Cost Function
The industry cost function shows the relationship of costs-per-unit-of-product for establishments in the industry ranked according to increasing size. One of the first decisions that must be made in constructing such a function is in determining the units to be used to measure the product. A standard time period must also be used, and since standard accounts are kept on an annual basis, all costs are on a per annum basis.
Simple annual costs per establishment cannot be used, because papers differ greatly in circulation and size per issue. Likewise, costs per subscriber are not satisfactory because of differences in number of pages and page size. The decision was made to use cost per column printed and distributed as the basic unit. This gives a standard unit of output that is comparable for all papers.
A further justification for using cost per column is that the cost function so defined will be identical to a revenue function that indicates the revenue per column needed to meet costs. Assuming that any given paper maintains a relatively constant proportion of advertising space to total space, this revenue function could be transposed by the use of appropriate multiples to give the revenue per million lines of advertising needed to meet costs: (i.e., milline rates required to meet cost). Because of the use of fixed multiples, this cost-determined milline rate function would have the same general shape as the cost per column function.
Chart 8 contains the results of plotting costs-per-column against circulation for a number of daily newspapers in Canada. All costs have been included except net profits and interest payments. The most significant feature of this graph is that costs-per-column decrease significantly as the circulation size of the paper increases. Average cost per 1,000 columns in

1968 for a paper of 10,000 circulation was approximately $1.60, while the average cost per 1,000 columns of a paper with 250,000 circulation was approximately 45 cents. This in effect means that for two papers of a standard size per issue and content, one with a 10,000 circulation and one with a 250,000 circulation, the cost of putting the smaller-circulation paper in the hands of a reader is 31/2 times that of the larger.
Consequently, the smaller paper must raise 3 1/2 times as much revenue per reader as the larger paper if it is to meet its production costs. If both papers had the same proportion of advertising content to total content, the revenue per advertising line per subscriber raised through advertising would likewise have to be 31 h times larger for the smaller paper than for the larger paper.
Further, if newspapers generally endeavour to set advertising rates so as to meet production costs and to yield a "normal" or satisfactory profit, milline rates should also bear this proportionate relationship. An examination of the milline rate function derived earlier indicates this to be so. The milline rate for a paper of 10,000 circulation is very close to 3 1/2 times that for a paper with 250,000 circulation.
Thus, as a by-product of this part of the study, an extremely important result has been derived. Generally speaking, larger newspapers do not take advantage of a continuously declining cost function to appropriate monopoly profits greatly in excess of smaller papers. Large papers, for example, could offer competitive rates with smaller papers, but in so doing still accumulate larger monopoly profits because of greatly differing costs. In point of fact, this is not done. By and large, larger papers tend to pass on the greater part of their cost economies to advertisers in the form of lower milline rates.
Returning to the industry cost function, it now becomes obvious why, in the investigation of employment, productivity and wages in an earlier section, the data revealed some similarities to data found in "natural monopoly" industries. Natural monopoly industries are those in which costs-per-unit-of-production tend to decrease as the size of the production unit increases throughout the range of all size combinations of firms which could meet total market needs. In these situations one large firm tends eventually to dominate the market, since that firm can sell its product at a price lower than any other and still meet its costs of production.
It appears that the daily newspaper industry has all of the attributes of a natural monopoly industry. The balance in relative market shares in natural monopoly industries is always unstable as long as more than one firm competes for the available market.
INSTABILITY OF MARKET SHARES IN NATURAL MONOPOLIES
The reasons for the instability of market shares in natural monopolies are fairly simple. The larger the share of the market anyone firm obtains, the lower is its cost of production-per-unit-of-product. If one firm increases its share of the market, it always must do so at the expense of another firm. Thus, the competing firm's relative costs-per-unit-of-product will increase

simultaneously with the decrease in costs of the other as the spread in market shares becomes greater.
The result is that there is a very strong tendency for a larger firm to drive a smaller firm out of business. If the firms are of roughly equal size, the one with the larger capital resources will be the one with the natural advantage. The firm with the larger capital resources can afford to use predatory pricing practices, cutting prices below costs in an effort to increase its share of the market.
If buyers are price-responsive, they will shift some of their purchases to this firm and away from competing firms. This will have a two-fold effect. First, it will allow the firm pricing in a predatory way to expand its production. This expanded production will lower unit cost, bringing .costs into line with the lower price previously set. Second, it will force the firm that has lost some of its share of the market to raise its prices in order to meet costs. The net result is an even greater discrepancy in prices, which will lead to a further shifting on the part of the buyers to the lower-priced firm.
If two or more firms start out with markedly differing shares of the market, the smaller firms can expect, with something close to absolute certainty that they will be left with a smaller and smaller share of the market as time passes. The smaller firms must charge a relatively higher price to meet costs, but this price differential can only have the long-run effect of inducing more and more buyers to switch to the product of the larger firm. As this happens, the discrepancies between prices of the smaller firms and those of the larger firms must become larger, since the larger firms have the opportunity to take advantage of further economies of scale relative to the smaller firms. The situation can only hope to stabilize if the competing firms, through formal or informal collusion, agree to cease the battle for market shares. In so doing, the larger firms must hold their price at a level that yields a profitable return to the smaller firms. As a consequence, the collusion yields a monopoly profit to the larger firms.
In natural-monopoly situations, there is thus a strong pressure toward an ever-increasing market share for the larger firm. Since this also leads to greater and greater discrepancies in costs-per-unit-of-product between competing firms, smaller firms must either accept significant and growing losses, or increase their prices relative to competitors. Whichever alternative they accept, they will be forced to yield larger and larger portions of the market over time. It is almost inevitable that smaller firms are eventually driven out of production by a single large firm. Aside from collusion, a smaller firm has only two real hopes for survival in these natural monopoly situations. One is to differentiate the product it produces sufficiently that it can retain a group of customers who have a definite preference for the product of the smaller firm, and for whom the preference is so strong that they will buy the product of the smaller firm, even if the price is substantially higher than for the competing products. The other is to introduce some controls over production - either technical or legal - so as to restrict the ability of the larger firm to expand.
Newspapers differ somewhat from other types of "natural monopoly" industries, and this introduces some analytical complications. Newspapers really sell two products, advertising space
and circulation. Newspapers also operate in much more restricted markets than many other types of industries.
First, the restricted nature of the market must be considered. The shape of the cost curve shown in Chart 8 would suggest that if newspapers generally had a distribution that covered the whole of the country, there would be a tendency toward one large single-daily newspaper in Canada.
However, the market for any single newspaper is usually concentrated in the area in and surrounding an individual urban centre. Part of this restriction of the market arises out of increased distribution costs. As will be indicated later, newspaper distribution is not characterized by the same economies of scale manifested in the total cost function. In fact, distribution costs tend to increase disproportionately with circulation, since growth in circulation usually involves extending distribution to a much further distance from the production point.
The other major factor giving rise to the restricted size of the market for daily newspapers pertains to the nature of both news and advertising. A significant part of the news presented in a daily newspaper tends to be of relatively local interest. Building up circulation further afield becomes both difficult and costly, since interest in the content of the paper decreases as the distance from the centre of production increases. Second, retail, department store, and classified advertisers are generally only concerned with the retail trading area within and immediately surrounding the urban centre in which they are located. Advertising receipts thus increase less than proportionately to circulation as circulation is added in more distant locations. A point is quickly reached when marginal additions to receipts are less than the marginal additions to costs incurred in extending circulation.
The fact that newspapers concentrate their distribution within a fairly restricted market does not detract from the applicability of the "natural monopoly" hypothesis. It simply means that the pressures are in the direction of localized monopolies.
The second complication in applying the natural monopoly argument to newspapers pertains to the fact that newspapers in effect sell two products, circulation and advertising space. The dynamics of the natural monopoly argument must be examined in more detail for newspapers to take account of this complication. Before doing .so, however, certain adjustments must be made to the industry cost curve as derived to this point.
REMOVAL OF CONTENT BIAS IN COST CURVE
The industry cost function is derived from data that applied in 1968; in most cases competitive adjustments are now virtually complete. Out and out competition with other papers has been eliminated in most areas through competition in the past. This situation has introduced a certain bias into the cost curve for which adjustments must be made.
The major adjustment to the cost function must take account of the differences in quality and content of the papers which make up the function. For instance, the larger dailies usually tend to have larger issues, more syndicated and special features and greater over-all effort and

investment in news gathering. In order to discuss the simple cost dynamics operating between two similar competing papers, we need to have a situation where the competing papers are standardized so that differences in total cost expenditure reflect only the cost differences involved in carrying different circulations, but with roughly equivalent basic products.
The industry cost function in effect contains a bias. Costs per column for larger circulation papers are inflated above what they would be if all papers were of relatively standard length and quality. This arises from the fact that larger papers tend to take advantage of their ability to offer a more competitive rate by inflating rates slightly and offering a larger, higher quality paper.
Adjustments to take account of differences in content give an industry cost curve with the slope of the broken line in Chart 9. The solid line is the cost curve developed from the cost data.
With the modified cost curve, we can see that, as a paper increases in size, it gains even further cost advantages over a competitor if the size and content is standardized. This means that if a larger paper wishes to keep the quality roughly equivalent to a smaller competing paper, if can offer an even more competitive milline rate than is indicated by the current relationships of milline rates in Canada. Hypothetical Milline Rate Curves in an Individual Market
An even further adjustment must be made if the industry-wide curves are to be used to analyze dynamic conditions in an individual market. To illustrate the point to be made here, the milline rate data from the Toronto market will be used.
Milline rate data are used for this analysis because cost data for each of the papers in the Toronto market were not available. However we have already concluded that, if "normal" profits are included as part of costs, the share of the milline rate curve corresponds to the milline cost curve. Thus, the use of the milline rate function for this analysis should not materially alter the results.
Line AA in Chart 10 indicates the projection of milline rates relative to circulation size based on data for the whole industry. Line BB indicates the projection of milline rates relative to circulation size based on data for the Toronto market.
The slope of the milline rate curve for the Toronto market is substantially greater than the projected rate structure based on the total industry-wide curve. Thus, in an individual market with papers in the same general size range it can be concluded that the scale economies are even greater than has been indicated in the industry-wide data.
There are essentially two reasons for this. First, the industry-wide curve does not take adequate account of the fact that many firms in the industry are operating at much less than optimum capacity. Many of the fixed assets, including buildings and equipment are less than completely divisible. Most presses, type-setting machines, building space, etc., can be used to
accommodate a wide range of circulation sizes. As a result, the spreading of these overheads over a larger circulation reduces substantially the per line costs of production.
It is partially for this reason that the Toronto Star is able to charge a much lower milline rate than the other two papers. Its larger circulation permits it to make much more efficient use of its overhead capital. Because they are in the same general quality range as the Star general quality range as the Star, the other papers need very similar kinds and sizes of equipment and plant, so total overhead costs would presumably not differ that markedly. However, because the Star has a much larger circulation, its costs per line actually distributed are much lower. These lower costs per line directly result in a lower milline rate for advertising.
The second reason for the milline rate curve showing a greater slope in an individual market than for the industry as a whole is that papers with relatively larger circulations and lower milline rates tend to draw relatively larger volumes of advertising per line of total content distributed. As a result, the larger papers can meet costs from an even more greatly reduced milline rate. This is not a cost factor as such, but rather relates to differences in demand for advertising space. The lower price simply draws more advertising space.
COMPETITIVE DYNAMICS FOR DAILY NEWSPAPERS Up to this point, it has been concluded that the newspaper publishing industry has declining cost-per-unit-of-output as circulation increases. This factor becomes clear when costs are measured in a way that allows them to be compared with rates that are relevant to the advertiser.
We must now carry this result a step further, and investigate the implications of to inverse relationship between costs and circulation for dynamic adjustments in the industry. The general theme of this investigation has already been set out in the discussion of the adjustment process for traditional natural monopolies. However, since the daily newspaper industry has special characteristics already mentioned, the specific adjustment process for newspapers must now be investigated.
First, because daily newspapers tend to be restricted to local markets, the pressure towards monopolies that does arise out of the cost economies from larger-scale production acts only within the confines of the local market. Second, daily newspapers provide two products, advertising space and editorial content (i.e. news, entertainment, etc.). The thesis respecting natural monopolies suggests that the cost economies that arise from larger-scale production will give rise to instability in the market shares of both of these products.
In the case of advertising space, the argument that this instability exists has already been presented. It has been indicated that when a newspaper increases its share of the circulation, it passes on a large portion of the cost economies to advertisers through lower milline rates. The changes in relative rnilline rates lead to a shifting of advertising linage to the paper that has implemented a relative decrease in rates. If this paper permits the proportion of advertising linage to total linage to increase from the shift, a further decrease in the milline rates is possible because a larger amount of advertising revenue is being spread over roughly the same amount of non-advertising content.

However, it would appear that from the side of advertising the situation will eventually
stabilize with a less equal, but nevertheless stable, division of the advertising market. The changes outlined would only induce further cost economies if the relative decline in the milline rate induced an even larger share of the circulation to switch to the paper with the increased circulation. However the changes in milline rates affect only relative market shares of advertising, and not of circulation. Further cost economies would come only if the changing rates stimulated further increases in circulation for the beneficiary of the initial increase.
It would thus seem that after the air has cleared, the smaller papers will be left with a smaller proportion of the total advertising market, but that they will be in a position to retain a portion of advertising willing to come forward even at a higher rate, because of the need to reach that segment of the market.
However, we must now turn to circulation. A paper that experiences an autonomous increase in circulation should also be in a position to offer the papers to readers at a lower rate. If readers are price conscious, this should induce further circulation increases, further reductions in both the milline rate and the price per paper, further shifts in the share of advertising and circulation, and so on. The dynamic element in this situation should eventually lead to such a wide discrepancy in both advertising rates and price per paper that the smaller papers would find it impossible to draw either advertising or circulation.
In fact, the situation is not this simple. Competing newspapers do not generally adjust the price of the paper to readers as relative shares of circulation change. Those that make gains in circulation find that decreases in price do not have much effect on circulation. Those that experience losses in circulation find that circulation can be badly affected by price increases. Thus, even though two papers in the same market have relatively marked differences in circulation, the price to readers usually does not differ.
It is now natural to question whether the newspaper situation should, in fact, be as unstable as other natural monopoly situations. What would lead to a further magnification of discrepancies in circulation through time if the price to readers is not adjusted to take account of cost economies?
The answer to the question is that generally part of the gains from decreases in cost accompanying circulation gains is used to make qualitative improvements in the paper and part is used to increase the paper's own promotional program. Since future cost economies and gains in advertising receipts depend on a large share of circulation, the larger paper will usually increase its expenditures on factors that tend to add to circulation.
Such circulation-increasing expenditures usually fall into two categories: expenditures on content improvement (e.g., syndicated features, news staff, etc.) and expenditures on promotion.
The smaller paper, on the other hand, is not in a position to match such expenditures without increasing its milline rates. This would only lead to enlarged discrepancies in milline rates. Differences in circulation do tend to generate greater differences in circulation, simply by
virtue of the fact that a smaller paper is under great pressure to keep its milline rate as low as possible so as to minimize the discrepancy between its own milline rates and those of the larger paper. As a result, it must keep expenditures on both content and promotion to a minimum. The larger paper has a great deal more flexibility in its rate-setting policy, since the smaller competitor is in no position to offer a competitive milline rate. As a result, the larger paper can maintain a somewhat higher rate structure and incur extra expenditures on the content and promotion sides. This gives the effect of generating greater and greater discrepancies in circulation shares.
These basic economic facts have led to a situation in which most cities are now served by only one daily newspaper. Most cities of any size in North America started out as multiple newspaper cities. The basic economics of newspaper publishing dictated that it was almost impossible for this situation to be maintained. It was almost inevitable in all of these cases that, for quality, social, political, or management reasons, one paper would at some time gain a larger share of the reading market than another.
Such a development puts the smaller paper under pressure that eventually leads to its collapse. Basic conditions of cost make its virtually impossible for the smaller paper to present a product of comparable quality and a milline rate competitive with the larger paper. The smaller paper will have a higher milline rate even if it cuts costs to the absolute minimum. This causes a shift in advertising volume to the larger paper as advertisers endeavour to obtain the lowest-cost coverage. The smaller paper will get advertising only from those advertisers who want total market coverage even at the expense of some duplication; or who for some special reason want coverage in the specific segment of the market covered by the smaller paper. These pressures on the relatively smaller paper lead to declining profits, heavy pressure to keep rates down in order to remain competitive, sacrifices in quality and content because of declining profits and pressures on rates, declining circulation relative to the larger competitor, further relative changes in milline rates due to increasing discrepancies in circulation, and eventually financial collapse. This pattern "has materialized in city after city across North America. Indeed it is a pattern which must characterize the daily newspaper industry, wherever there is a free-enterprise press, generating its revenue from the sale of advertising space.
There can be no doubt about the facts. A newspaper industry that operates under competitive market rules inevitably becomes an industry characterized by local market monopolies. Of course, defenders of the competitive system will be quick to point out that in fact there are cities in Canada with a competitive press. But each of these situations is a fact that is explained later.
CAUSES OF COST ECONOMIES
The cost economies revealed in the immediately preceding sections of this report are relatively easily explained. The circulation of a daily newspaper can be expanded throughout any relevant size range without incurring directly proportional increases in total costs. It is this basic fact that yields an industry cost curve that slopes monotonously downward to the right.
When costs are broken out for separate departments in a daily newspaper operation, the underlying reasons for this become more obvious. With the exception of circulation, distribution, and material supply costs, all costs in newspaper publishing behave, to varying degrees, as overhead costs. Overhead costs vary relatively little in total within quite wide ranges of possible output.
Over somewhat larger ranges of output, some overheads do increase as output increases, but such increases usually take the form of discrete jumps as a maximum output is reached within any given level of overheads. As a result, some overhead costs per unit of output behave in the following fashion.
Some overhead costs can be spread over a larger volume of output with almost no limitations. If this is true the cost per unit of output declines throughout the whole range of output. The pattern of costs per unit of output for costs of this sort is shown in Chart 12.
In newspaper publishing, both types of overhead costs tend to be extremely important. In addition, the former types of overhead costs also take on characteristics of the latter. This means that some types of capital (e.g. press, buildings) must, at the upper end of a certain range of output, expand in large discrete jumps; but that the expansion on a cost per unit of output basis is not as great as it was at the upper end of the immediately preceding range of output. As a result in newspaper publishing, an industry cost curve with the following form emerges.
NEWSPAPER - THE COST CURVE.
An examination of the data from a number of daily newspapers in Canada shows that outlays in practically every department of a newspaper take on the form of fixed overhead costs, manifested in terms of behavior similar to that outlined here.
The underlying reason for this behaviour of costs is relatively simple. Once the basic format and content for a day's paper is established, and once the type is set and the printing plate made, the number of copies of the paper printed can be increased to an almost indefinite level without generally requiring any significant addition in total outlay on labour and equipment. It takes essentially the same amount of editorial and news staff time to put together a story (given equal quality) for a paper with a circulation of 100 as it does for a paper with a circulation of 100,000. The same is true for the sale of advertising space and the production of the advertising content.
Likewise in the stereotype and composing departments. For a paper of a given size per issue, very close to the same total expenditures on labour and equipment will suffice regardless of the circulation.
In some departments, such as in the business office and press room, periodic increases in total expenditures on labour and equipment must occur as the circulation size increases.

However, there is generally a significant degree of excess capacity prevalent in any operation, particularly in the press room. Even among the larger papers, the press may not actually operate more than four or five hours per day. On average, actual press time is from one to three hours per day. Since staff must be employed on a regular daily basis, there is a corresponding excess capacity in staff. Increases in circulation more fully employ both equipment and staff, reducing costs per column or line actually printed.
In the business office the excess capacity is generally less apparent, but nevertheless it is true that circulation can generally be expanded significantly without markedly increasing total expenditures.
There are only three classes of inputs that do not manifest the type of cost behaviour so far outlined. These are circulation costs, distribution costs, and material inputs. On the circulation and distribution side, some scale economies are possible, but these are not nearly as certain to develop or to be as significant as for the others. On the side of material inputs such as ink and newsprint, very little if any direct cost economies arise from increasing circulation. Increases in expenditures on newsprint and ink generally occur in direct proportion to increases in circulation.
It is possible that larger papers obtain some economies on newsprint and ink through a price advantage resulting from quantity purchases. Indications are, however, that the price of newsprint is tightly controlled in Canada, and that the same price prevails for all buyers. Nevertheless, it is true that in the United States volume discounts to large papers are not unknown. Since the large newsprint companies are the same in the United States and Canada, it would not be surprising if such deals are also available in Canada.
WHY DO CERTAIN CITIES CONTINUE TO HAVE COMPETING NEWSPAPERS?
It has been all but concluded in this report that immutable economic forces in the newspaper publishing industry lead to the development of local market monopolies. In view of this conclusion, some reasons must be offered for the continued existence of two or more daily newspapers in a number of Canadian cities.
It must first of all be recognized that the cost factors unique to this industry lead to local monopolies provided that effective competitive rate setting is permitted to operate. In a number of cities, the use of combination rates has subverted these competitive forces. The use of combination rates is a form of collusion that prevents competitive rate setting. By stifling competitive rate setting, the shifting of advertising market shares due to rate differentials is not a factor.
This stifling of competition helps to maintain the existence of two or more papers in a market, but generally such co-operation can arise only if there is some common interest in keeping both papers operational. In Canada, this common interest without exception arises out of common ownership. One can legitimately raise some questions about the redeeming social value of having two papers in a market if they are both owned by the same entrepreneur.
Setting aside the cases in which combination rates exist, the following cities in Canada
have two or more papers: Calgary, Winnipeg, Ottawa, Toronto, Montreal, Sherbrooke, Quebec City, Moncton, and St. John's.
One of the conditions that can make it possible for a smaller paper to remain operational is the existence of a certain segment of the population to which a paper has gained dominant access in terms of circulation. The most clearly defined factor creating such access is language. It is also necessary that the people who speak that language show a clear preference for a paper published in it.
The language factor explains the existence of one of the papers in each of Ottawa, Toronto, Sherbrooke, Quebec City, and Moncton. Each of these cities contains a large enough, minority language-group for advertisers to continue to support a paper sufficiently for its survival, even if the cost per potential consumer reached is higher than for competing papers in the majority language group.
In terms of cities with competing papers in the same language, only Calgary, Winnipeg, Ottawa, Toronto, Montreal, Quebec City and S1, John's remain. Sherbrooke and Moncton drop out by virtue of having only one paper in each language. Calgary, Winnipeg, and Ottawa These cities stand out as a group for one compelling reason. Each of the cities has two competing papers, and in each case one is owned by Southam and one by F.P. Both of these companies are large and have access to considerable capital resources.
In Calgary and Winnipeg, circulations of the competing papers differ markedly, and the milline rates reflect these differences. In Ottawa, the circulations are very similar as are the milline rates. Thus, in all cases advertising rates appear to be set very much in accordance with costs.
Table 89: Milline Rates and Circulation, July, 1969 Paper Group Circulation Milline Rate Calgary Albertan F.P. 35,502 6.94 Calgary Herald Southam 94,956 3.79 Winnipeg Free Press F.P. 133,846 3.36 Winnipeg Tribune Southam 74,015 4.59 Ottawa Journal F.P. 78,318 3.58 Ottawa Citizen Southam 80,521 3.65
Two questions must be answered regarding this group of papers. First, why has the larger paper in each city not taken advantage of its greater revenue generating power to finance a circulation drive aimed at putting its competitor out of business? Second, why have advertisers in

Calgary and Winnipeg continued to support the paper with the higher milline rate sufficiently to permit continued publication?
The most important factor restraining an all-out battle for circulation is that the papers are group owned, and the same two groups are involved in each of these cities. The fact that the papers are group owned means that each paper is backed by tremendous capital resources and these could be used to withstand a prolonged, costly and ever-escalating circulation battle. Such a battle could become so costly and so prolonged as to make it truly doubtful as to who would be the true winner. As a result, there appears to be agreement that such a circulation battle would be unwise. (It is rumoured that this agreement has at times been formalized in writing to prevent the use of certain types of circulation-generating techniques.)
In addition, if such a battle were initiated, the victorious group in Calgary would probably be Southam, while in Winnipeg it would probably be F.P. No formal understanding is required to make it clear to F.P. that if it decided to undertake an all-out effort to destroy the circulation base of the Tribune in Winnipeg, Southam would be inclined to respond in kind by attacking the circulation base of the Albertan in Calgary, and vice versa. Considering costs and probable consequences, it is no doubt clear to both groups that a policy of "live and let live" is indeed the only enlightened one.
It is also probably true that advertisers in Calgary and Winnipeg have adopted a relatively generous attitude to each of the smaller papers.
In Ottawa, where both milline rates and circulation are close to equal, there is very little pressure toward a spread in market shares of advertising. Costs are comparable, and mass coverage requires advertising in both papers. As a result, as long as no paper gains a significant advantage in circulation, and no paper attempts to do so, both papers are likely to remain strong and viable.
Of these three cities, the most unstable situation would appear to be in Calgary. The continued existence of the Albertan would appear to depend primarily on the goodwill of advertisers. A loyal and isolated circulation helps, but the large discrepancy in milline rates makes it doubtful if the Albertan would remain viable if there was not a great deal of goodwill between advertisers and the Albertan and/or its owner. Toronto and Montreal The situation in the large metropolitan areas of Canada is different to that in other urban areas. A number of factors contribute to this: 1 The very size of the market makes it likely that the adjustment towards a monopoly situation will be slower. Even when fairly large discrepancies arise in shares of both advertising and circulation, it is still possible for the smaller papers to have a sufficiently large revenue base to remain viable over a long period of time. 2 The very size of the individual papers and their access to capital resources probably mutes the forces of competition. For reasons already discussed, circulation battles can be costly,

particularly if each of the competitors has the financial resources to prolong the battle indefinitely. Somewhat related to this, it is possible that the publishers themselves feel no compelling desire to force competitors out of business. As long as the larger papers remain profitable, there is no particular reason why a competitor should become an overriding concern. 3 Each of the papers in these centres appear to have clearly defined and self-contained circulation. Duplication of circulation is not an important factor. Each paper has been clearly differentiated in the eyes of readers, and readers do not show a strong tendency to switch papers or duplicate subscriptions.
There are many reasons for the strong and loyal support that each paper obtains from segments of the community. Part of it is historical, resulting from long traditions of individual and family loyalty to a particular paper. Part of it also lies within the realm of social and political ideals -large urban centres can provide large enough bases of people with like ideals to ensure circulation support of a paper that meets their approval.
In the final analysis, the existence of competitive papers in the large metropolitan centres still rests on size and on absence of significant duplication in circulation. As long as each paper can maintain a relatively large readership with unduplicated circulation coverage, advertisers will still direct business to the smaller papers, even if such advertising is more costly. Advertisers cannot afford to ignore 50,000 to 100,000 potential customers.
However. the one single factor that would destroy a paper like the Toronto Telegram would be to have advertisers begin to believe that the Telegram was a second paper in many homes. If this were to happen, advertisers would refuse to accept this necessity of higher-cost advertising in the Telegram; and the Telegram’s share of advertising would in all likelihood go into a disastrous decline.
This very general discussion of the situation in Montreal and Toronto does not do justice to two of the most interesting newspaper centres, from the point of view of competition, in North America. Unfortunately the scope of this study does not permit a detailed investigation of the forces at work in each of these markets. In addition to purely economic factors, such a study would have to include an historical, social, and political study of the communities, and a content and quality study of the papers. Quebec City and St. John's The continued existence of L 'Action as a French language competitor to le Soleil in Quebec City is relatively easily explained. It is understood that L 'Action is heavily subsidized by the Roman Catholic Church. If the paper had to compete on a free enterprise basis, it probably could not survive. In the case of St. John's, Newfoundland, it is doubtful if the News will continue publication. It would seem to be only a matter of time before the forces of competition prove too strong.
ECONOMIES OF GROUP OWNERSHIP Scale Economies Under Group Ownership Individual market monopolies are not only the concern in respect to concentration in the daily newspaper industry. The growing trend to group ownership has been cited as another.
The discussion of economies of scale in the preceding section does not apply with the same force to different newspapers within the same group. Many of the important scale economies in newspaper publishing are restricted to each individual establishment. They arise largely because the same basic content can be produced at a much lower per unit cost for a paper with a large circulation than for a small circulation. Generally speaking, individual papers within the same group have different content, making it more difficult to take advantage of these economies.
However, the centralization of certain functions among groups has permitted papers that are part of groups to take advantage of certain economies. These functions fall into three categories: news gathering, advertising sales, and management.
Because individual papers within each group are in almost every case located in different urban centres, the centralization of news gathering is possible only for regional, national and international news. There is a great deal of variability in the extent to which each of the groups have centralized such news gathering. By and large, the economies to be gained from such centralization have not been that extensive, although quality or relevance to readership may be enhanced. Most of the economies possible in news gathering have already been developed and made available by the wire services.
Most of the groups operate their own advertising sales division. This permits them to gain some economies in the sale of national advertising.
For most group papers, the greatest economies arise out of the superior management skill that groups can provide. Groups can afford to pay salaries required to retain high-quality management people, since the costs of this skill can be spread over a wider circulation. A group like Thomson's stands the most to gain from this factor, since it has many small papers which could not possibly retain such management skills if each were independent. By bringing top decision makers together within a central business office, the cost per paper required to support this skill is much reduced.
Generally speaking, it appears that most of the economies that group papers obtain are not passed on to advertisers. Rather, these economies are used to increase the general profitability of the papers, making them stronger and more viable units. Access to Capital Generally speaking, papers that are sold to groups existed as independents before the sale. There are very few cases of a paper having been transferred from one group to another.
One of the main factors that gives the large corporate groups an advantage over
independent individuals or small corporations in the purchase of newspapers is their ability to raise capital. Very few daily newspapers in Canada today with a circulation of over 15,000 could be purchased for less than $500,000. The price of most, larger urban papers would be quoted in the millions.
The ability to raise these amounts of capital generally rests only with large corporations. Corporations have access to capital of three types: fixed payment loans; shareholder equity; and retained earnings.
Large corporations have an advantage over small corporations or individuals in terms of fixed payment loans by virtue of both their ability to offer greater collateral, and their ability to carry a higher ratio of debt to assets with less risk. The collateral factor is obvious. Availability and terms are much less restrictive if the borrower has collateral greatly in excess of the amount borrowed.
A greater debt load can generally be carried by large corporations due to their ability to refinance if the burden imposed by repayments becomes too great. An individual, on the other hand would generally be required to repay loans in fairly short order, and would face great difficulty in refinancing the debt if the payments become too burdensome. The main explanation for the greater ability of large corporations to refinance lies in preferential treatment provided them in the capital market. Temporary difficulties for a large, established firm are usually considered to be short run; whereas smaller operations are generally more suspect when difficulties arise.
Large corporations also tend to have an advantage in raising equity capital from shareholders. Public corporations can issue more shares when extra capital is required. Large private corporations have the alternative of going public if they choose. This alternative does not generally exist for small private corporations, simply by virtue of the fact that they are not well enough known or trusted to attract investors at a reasonable price-to-earnings ratio.
Equity capital has two significant advantages. One is that for some types of shares the person who provides the capital also assumes the risk. The second is that it is often a low-cost means of raising capital, particularly if an optimistic stock market inflates share values as a multiple of earnings. In these situations, earnings going to new shareholders will impose less burden on existing shareholders relative to capital raised than payments on fixed debt.
One of the biggest advantages that groups have in raising capital arises out of their access to retained earnings. The structure of the tax system has encouraged profitable corporations to build up larger and larger stocks of retained earnings. By not distributing all of the earnings, the personal income tax charges to shareholders is postponed until such time as the earnings are distributed. Meanwhile, the growth in the value of the retained earnings is reflected in the growth of the value of shares; and in the growth of a fund of capital within the corporation needing profitable employment.
Newspaper publishing groups have been no exception. The result is that large newspaper publishing companies must seek profitable ways of employing their capital reserves. Given that newspaper publishers know how to make an extra dollar in their own business better than in any other, that newspaper publishing is a profitable business generally, and that opportunities to start new papers are limited, it is natural that corporations successfully built around newspapers are constantly looking for established newspapers to purchase. In fact, it would be fair to say that they are forced into doing so. As a result, groups are generally the most anxious and generous bidders when a newspaper comes up for sale.
The accumulation of retained earnings also lends force to the movement in the direction of multi-media ownership, and to the movement of conglomerates into a wide range of business activities, including publishing. The particular aspect of the tax structure which gives rise to this factor means that large and profitable companies have ready and preferential access to a large fund of available capital. Smaller corporations with small retained earnings have no equivalent means of offering capital holders postponement of personal income tax as a result of making their capital available for investment.
Since public companies have an indefinite life, the actual postponement of the income tax on these retained earnings is likewise for an indefinite time. The present value of the future tax payment thus becomes almost negligible, meaning that practically all of the value of the retained earnings can be realized by a shareholder in the form of a capital gain by selling his shares.
If the capital gains tax proposals contained in the White Paper on Taxation are enacted, there could be some change in this situation. The pressure to build up retained earnings might not be as strong with a capital gains tax, and thus neither would the pressure to find profitable outlets for these earnings. Group Ownership as a Countervailing Force Another factor that tends to encourage group ownership is the threat to the existence of smaller papers in a market with two or more papers. The role of groups in these situations arises directly out of their access to large capital resources.
In a competitive situation, the smaller paper always faces the danger of extinction if the larger paper launches an all-out attack on its circulation base. If the smaller paper is independently-owned, the larger paper may feel great temptation to enter into such a circulation battle. Given the limited capital resources of the smaller paper, it might find it extremely difficult to offer any effective defence.
The capital value of smaller papers in these situations is greater under group ownership than it is under independent ownership. This is because a group has the resources to respond to an attack on circulation. As a result, larger papers are often willing to call a formal or informal truce when a group buys up its competitor. This stabilizes the situation, and increases the future potential for continued profitable operation of the smaller paper. For this reason, groups can offer a more attractive price to independent papers that are in competition with other papers.
The ability of groups to raise the capital to finance a strong, prolonged, and costly battle between two competing papers means that a truce is often called when a group enters the battle. This leads to a somewhat perplexing conclusion. In certain situations, if market shares are to be stabilized sufficiently to allow two or more papers to remain viable, groups must own the papers. The tendency to one form of concentration (local monopoly, for example) can be effectively countered only through the power inherent in another form of concentration (group ownership, for example). The Drive for Acquisitions One other factor that tends to give impetus to greater concentration of ownership within groups is the tremendous acquisitive nature of some individuals and corporations. The growth ethic is one which cannot be explained wholly in terms of economics.
Corporations in particular appear to feel a strong urge to grow. Partially it is based on a desire to be able to introduce new human talent; partially it is based on the relationship between growth and profitability; partially it is based on the desire to maintain or increase the power relationship with other corporations; and partially it is respect and attachment to "bigness." The whole growth ethic is one worthy of independent investigation. However the scope of this study permits nothing more than recognition of its presence and power.

Section Three: THE BROADCASTING INDUSTRY
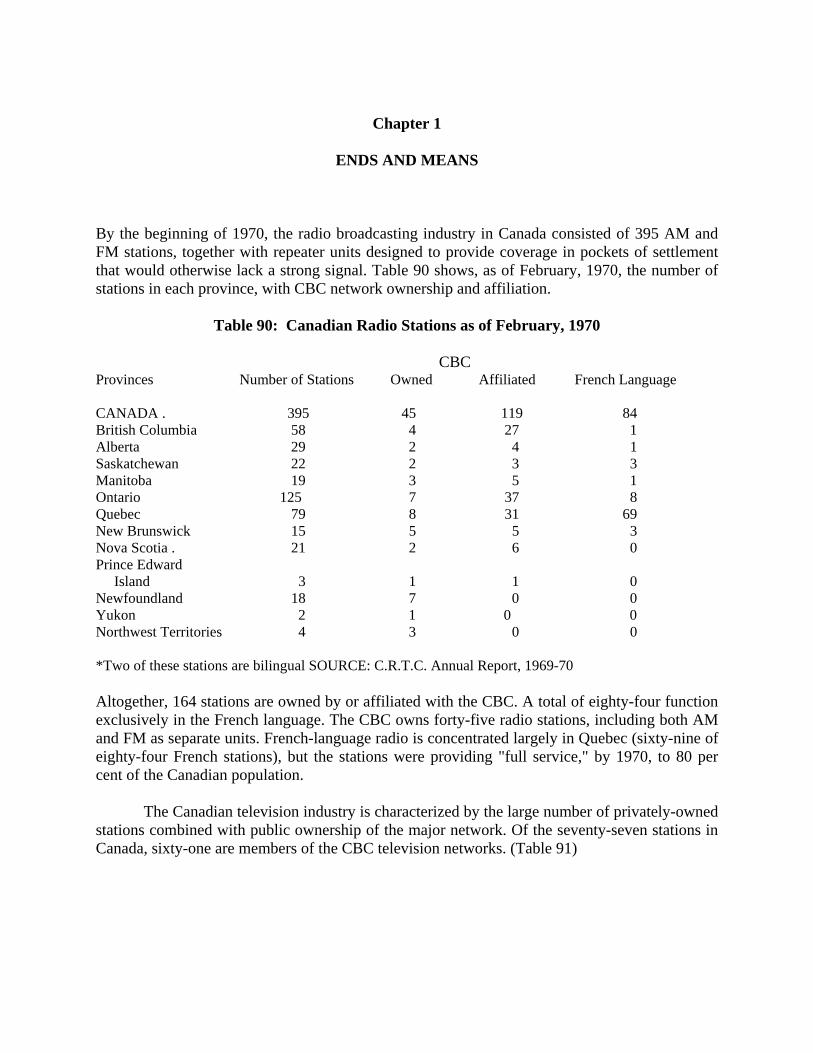
Chapter 1
ENDS AND MEANS
By the beginning of 1970, the radio broadcasting industry in Canada consisted of 395 AM and FM stations, together with repeater units designed to provide coverage in pockets of settlement that would otherwise lack a strong signal. Table 90 shows, as of February, 1970, the number of stations in each province, with CBC network ownership and affiliation.
Table 90: Canadian Radio Stations as of February, 1970 CBC Provinces Number of Stations Owned Affiliated French Language CANADA . 395 45 119 84 British Columbia 58 4 27 1 Alberta 29 2 4 1 Saskatchewan 22 2 3 3 Manitoba 19 3 5 1 Ontario 125 7 37 8 Quebec 79 8 31 69 New Brunswick 15 5 5 3 Nova Scotia . 21 2 6 0 Prince Edward Island 3 1 1 0 Newfoundland 18 7 0 0 Yukon 2 1 0 0 Northwest Territories 4 3 0 0 *Two of these stations are bilingual SOURCE: C.R.T.C. Annual Report, 1969-70 Altogether, 164 stations are owned by or affiliated with the CBC. A total of eighty-four function exclusively in the French language. The CBC owns forty-five radio stations, including both AM and FM as separate units. French-language radio is concentrated largely in Quebec (sixty-nine of eighty-four French stations), but the stations were providing "full service," by 1970, to 80 per cent of the Canadian population.
The Canadian television industry is characterized by the large number of privately-owned stations combined with public ownership of the major network. Of the seventy-seven stations in Canada, sixty-one are members of the CBC television networks. (Table 91)

Table 91: Canadian Basic Television Stations as of March, 1970
Province Total CBC CTV Independent CANADA . 77 61 12 4 British Columbia .. 8 7 1 0 Yukon . 1 1 0 0 Alberta . 7 5 2 0 Saskatchewan 7 6 1 0 Manitoba 5 4 1 0. Ontario . 19 15 3 1 Quebec . 17 13 1 3 New Brunswick 4 3 1 0 Nova Scotia 3 2 1 0 Prince Edward Island 1 1 0 0 Newfoundland 5 4 1 0 The CTV network has only recently purchased an interest in one of its member stations. It includes twelve privately-owned afftliates in the largest urban markets: Vancouver, Calgary, Edmonton, Regina, Winnipeg, Ottawa, Kitchener, Toronto, Montreal, Moncton, Halifax, St. John's. In eleven of these centres, the CTV outlet provides alternate service with the CBC. Fifteen television stations programme entirely in French. Only four - in Edmonton, Winnipeg, Ottawa, and Moncton - are located outside Quebec. Apart from three independent stations, all outlets are affiliated with the CBC French Network. Six. are wholly-owned by the network. There are no French stations in the CTV network. To provide service in remote communities many of the seventy-seven major stations have developed satellite facilities. Over two hundred rebroadcasting stations are now in operation, with as many as twenty-four repeater units linked to a single major transmitter. In the analysis of revenue, costs, and profitability in the broadcasting industry that follows, data relating to radio and television have been aggregated and much greater emphasis has been given to television than to radio for a number of obvious reasons. Television is by far the more important of the two media, economically speaking, and radio has already been studied carefully by various government bodies, the reports of which are in the hands of the Special Senate Committee on Mass Media.
Chapter 2:
REVENUE
NATURE OF TELEVISION ADVERTISING The choice of television as an advertising medium depends basically on two factors: first, the size of the advertising budget available to a firm; and second, the nature of the products sold by the firm.
Television is a costly form of advertising relative to radio and newspapers. For example, the cost of a sixty-second spot announcement during prime time is $475 on CBLT·TV and $550 on CFTO·TV. By comparison, a sixty-second spot announcement, also during prime time, on radio stations CFRB and CHUM, costs $150 and $85 respectively. The high costs of television advertising mean that only companies with very substantial advertising budgets will be able to afford to use this medium effectively. The high costs involved in television advertising may be justified on the grounds of its greater effectiveness in the promotion of products that rely heavily on package identification or that require a visual demonstration of the product and/or product use.
The heaviest users of television advertising are large business firms that sell only slightly differentiated "brand" products. Some typical examples of these firms are manufacturers of breakfast cereals, soaps, and toilet preparations and such household products as detergents, floor waxes, etc. This is illustrated by Table 92 which shows the ten largest television advertisers in Canada in 1967, and the percentage of their total advertising budgets channelled into television advertising. It is significant that all but one of the top ten advertisers produce the types of commodities described above and, also, spent more than two-thirds of their total advertising budgets on television.
SUPPLY OF TELEVISION ADVERTISING
In contrast to a continuously expanding demand, there are a number of limitations on increases in the supply of television advertising. These limitations fall

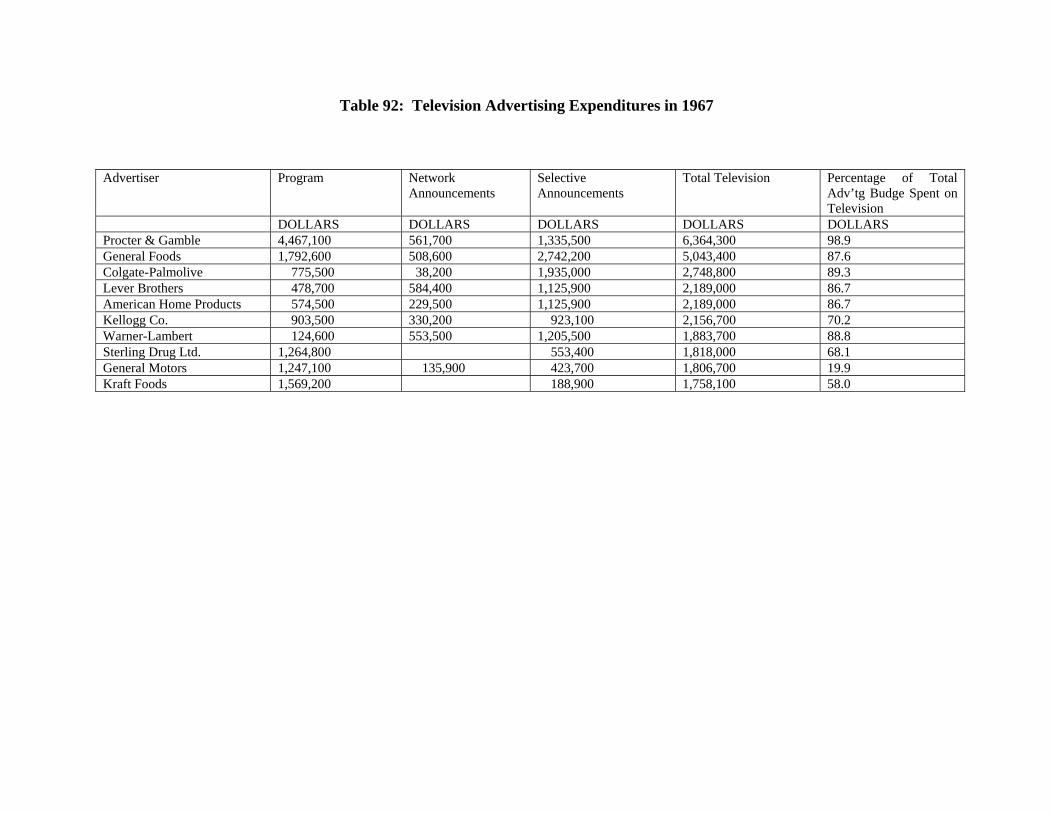
Table 92: Television Advertising Expenditures in 1967
Advertiser Program Network Announcements
Selective Announcements
Total Television Percentage of Total Adv’tg Budge Spent on Television
DOLLARS DOLLARS DOLLARS DOLLARS DOLLARS Procter & Gamble 4,467,100 561,700 1,335,500 6,364,300 98.9 General Foods 1,792,600 508,600 2,742,200 5,043,400 87.6 Colgate-Palmolive 775,500 38,200 1,935,000 2,748,800 89.3 Lever Brothers 478,700 584,400 1,125,900 2,189,000 86.7 American Home Products 574,500 229,500 1,125,900 2,189,000 86.7 Kellogg Co. 903,500 330,200 923,100 2,156,700 70.2 Warner-Lambert 124,600 553,500 1,205,500 1,883,700 88.8 Sterling Drug Ltd. 1,264,800 553,400 1,818,000 68.1 General Motors 1,247,100 135,900 423,700 1,806,700 19.9 Kraft Foods 1,569,200 188,900 1,758,100 58.0
Although the cost-per-minute of television advertising is high, television's ability to attract very large audiences often brings the cost per viewer to an extremely low level. into two broad categories: those imposed by the nature of the medium, and those imposed by legislation and network-policy decisions.
In the first place, the television broadcasting industry is faced with the purely technical constraint of a relatively small number of channels available for television broadcasting. Secondly, the theoretical limit on the maximum amount of time available for broadcasting is twenty-four hours in a day. In fact, most television stations are on the air between one hundred and one hundred and twenty hours a week, since a station will not have a viewing audience for twenty-four hours a day. Furthermore, even in the absence of any regulations, the major proportion of air-time would have to be devoted to "entertainment" in order to attract an audience and only a relatively small proportion of the total broadcasting time could be devoted to advertising.
A major difference between broadcast advertising and newspaper advertising is that in newspapers the amount of space that can be devoted to advertising is theoretically unlimited. It is common for a newspaper to expand substantially the amount of space devoted to advertising when conditions warrant it. Furthermore, the amount of space devoted to advertising can be increased without reducing the amount of space devoted to news stories, feature articles etc. In television broadcasting, on the other hand, if an extra minute per half hour is devoted to commercials, the time available for "entertainment" is reduced by one minute.
Since television broadcasting involves the granting of a limited number of channels to selected interests, regulations have been established, in the public interest, to limit the number of minutes an hour that may be devoted to advertising. The C.R.T.C. currently allows a maximum of twelve minutes of commercials an hour. The CBC's policy with respect to commercials during network programming is even more restrictive than the regulations imposed by the C.R.T.C. The CBC generally allows only four minutes of commercials during a half-hour period, supplemented by a limited amount of selective advertising by CBC-owned and affiliated stations during network breaks. Furthermore it has adopted a policy that certain types of network programmes such as news, weather, and public affairs are not available for sponsorship, although this policy has been stretched increasingly in recent years.
SOURCES OF ADVERTISING REVENUE The television broadcasting industry obtains the major proportion of its revenue from national advertising. Between 1963 and 1968, an average of 80.0 per cent of net total television advertising revenue was obtained from national advertising, compared to 41.5 per cent for radio and 25.5 per cent for daily newspapers. Table 93 presents a breakdown of total television advertising revenue into national advertising and local advertising components.
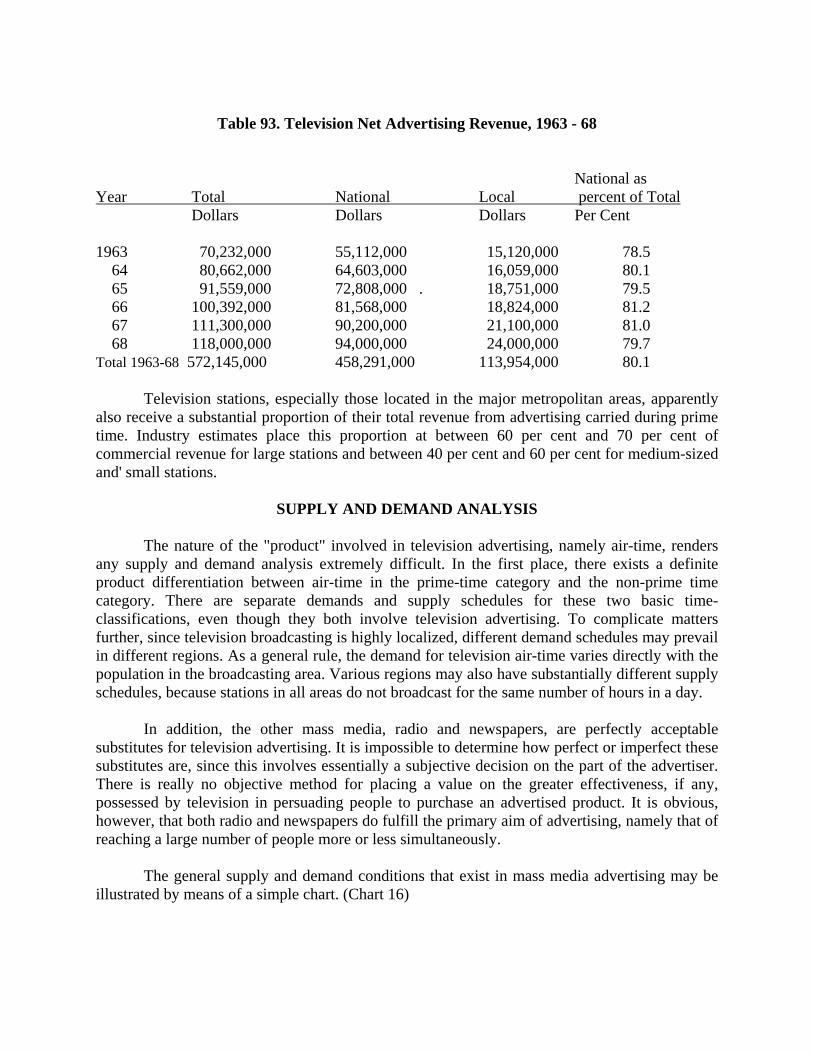
Table 93. Television Net Advertising Revenue, 1963 - 68
National as Year Total National Local percent of Total Dollars Dollars Dollars Per Cent 1963 70,232,000 55,112,000 15,120,000 78.5 64 80,662,000 64,603,000 16,059,000 80.1 65 91,559,000 72,808,000 . 18,751,000 79.5 66 100,392,000 81,568,000 18,824,000 81.2 67 111,300,000 90,200,000 21,100,000 81.0 68 118,000,000 94,000,000 24,000,000 79.7 Total 1963-68 572,145,000 458,291,000 113,954,000 80.1
Television stations, especially those located in the major metropolitan areas, apparently also receive a substantial proportion of their total revenue from advertising carried during prime time. Industry estimates place this proportion at between 60 per cent and 70 per cent of commercial revenue for large stations and between 40 per cent and 60 per cent for medium-sized and' small stations.
SUPPLY AND DEMAND ANALYSIS
The nature of the "product" involved in television advertising, namely air-time, renders any supply and demand analysis extremely difficult. In the first place, there exists a definite product differentiation between air-time in the prime-time category and the non-prime time category. There are separate demands and supply schedules for these two basic time-classifications, even though they both involve television advertising. To complicate matters further, since television broadcasting is highly localized, different demand schedules may prevail in different regions. As a general rule, the demand for television air-time varies directly with the population in the broadcasting area. Various regions may also have substantially different supply schedules, because stations in all areas do not broadcast for the same number of hours in a day.
In addition, the other mass media, radio and newspapers, are perfectly acceptable substitutes for television advertising. It is impossible to determine how perfect or imperfect these substitutes are, since this involves essentially a subjective decision on the part of the advertiser. There is really no objective method for placing a value on the greater effectiveness, if any, possessed by television in persuading people to purchase an advertised product. It is obvious, however, that both radio and newspapers do fulfill the primary aim of advertising, namely that of reaching a large number of people more or less simultaneously.
The general supply and demand conditions that exist in mass media advertising may be illustrated by means of a simple chart. (Chart 16)

In such a situation of rapidly expanding demand and a limited supply, it is inevitable that a considerable amount of pressure will be exerted on prices. This in effect has been the case with respect to television advertising. There has been a considerable increase in station time rates, particularly for prime time and in the larger metropolitan areas. Table 94 shows the increases in station time rates during prime time for selected stations in various size categories.
Similarly, there has been a substantial increase in network advertising rates. In April, 1969, the CBC increased its prime-time advertising rate for the English-language network by 12.9 per cent and the rate for the French-language network by 14.6 per cent. At the same time, the station-time rate for the MetroNet, which consists of ten stations, was increased by 24.4 per cent. The CTV network also increased its prime-time rate by 11.1 per cent on September 1, 1969.
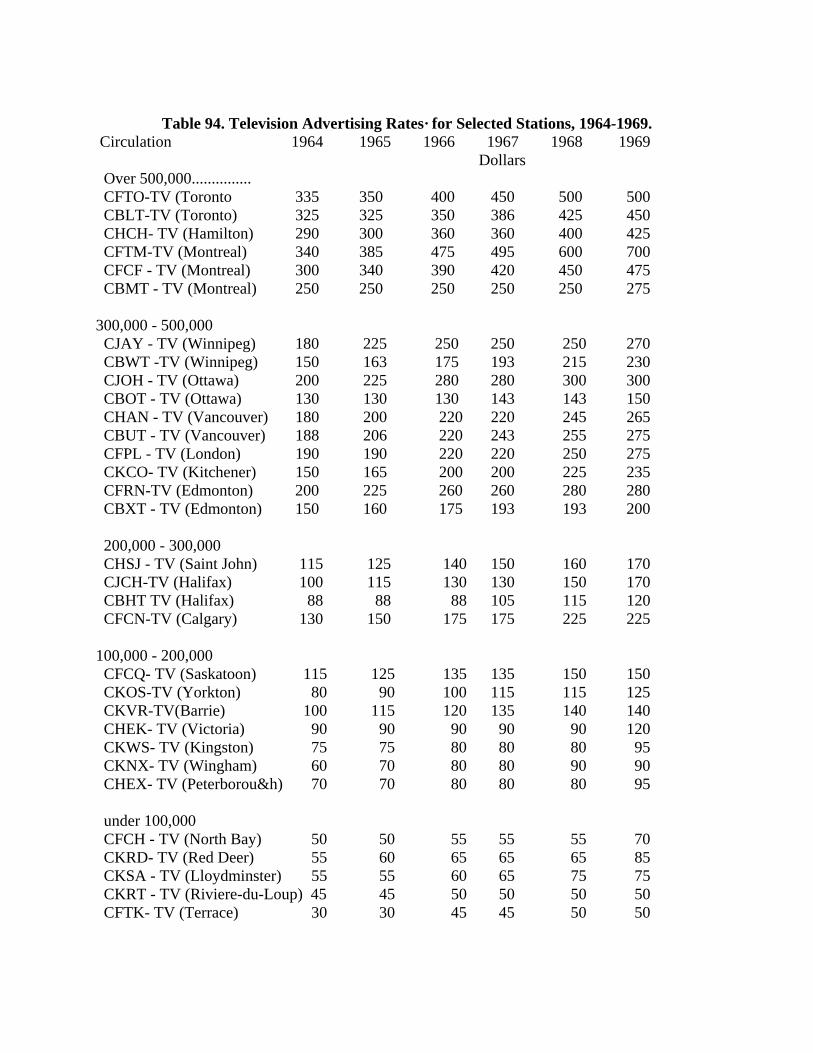
Table 94. Television Advertising Rates· for Selected Stations, 1964-1969.
Circulation 1964 1965 1966 1967 1968 1969 Dollars Over 500,000............... CFTO-TV (Toronto 335 350 400 450 500 500 CBLT-TV (Toronto) 325 325 350 386 425 450 CHCH- TV (Hamilton) 290 300 360 360 400 425 CFTM-TV (Montreal) 340 385 475 495 600 700 CFCF - TV (Montreal) 300 340 390 420 450 475 CBMT - TV (Montreal) 250 250 250 250 250 275 300,000 - 500,000 CJAY - TV (Winnipeg) 180 225 250 250 250 270 CBWT -TV (Winnipeg) 150 163 175 193 215 230 CJOH - TV (Ottawa) 200 225 280 280 300 300 CBOT - TV (Ottawa) 130 130 130 143 143 150 CHAN - TV (Vancouver) 180 200 220 220 245 265 CBUT - TV (Vancouver) 188 206 220 243 255 275 CFPL - TV (London) 190 190 220 220 250 275 CKCO- TV (Kitchener) 150 165 200 200 225 235 CFRN-TV (Edmonton) 200 225 260 260 280 280 CBXT - TV (Edmonton) 150 160 175 193 193 200 200,000 - 300,000 CHSJ - TV (Saint John) 115 125 140 150 160 170 CJCH-TV (Halifax) 100 115 130 130 150 170 CBHT TV (Halifax) 88 88 88 105 115 120 CFCN-TV (Calgary) 130 150 175 175 225 225 100,000 - 200,000 CFCQ- TV (Saskatoon) 115 125 135 135 150 150 CKOS-TV (Yorkton) 80 90 100 115 115 125 CKVR-TV(Barrie) 100 115 120 135 140 140 CHEK- TV (Victoria) 90 90 90 90 90 120 CKWS- TV (Kingston) 75 75 80 80 80 95 CKNX- TV (Wingham) 60 70 80 80 90 90 CHEX- TV (Peterborou&h) 70 70 80 80 80 95 under 100,000 CFCH - TV (North Bay) 50 50 55 55 55 70 CKRD- TV (Red Deer) 55 60 65 65 65 85 CKSA - TV (Lloydminster) 55 55 60 65 75 75 CKRT - TV (Riviere-du-Loup) 45 45 50 50 50 50 CFTK- TV (Terrace) 30 30 45 45 50 50
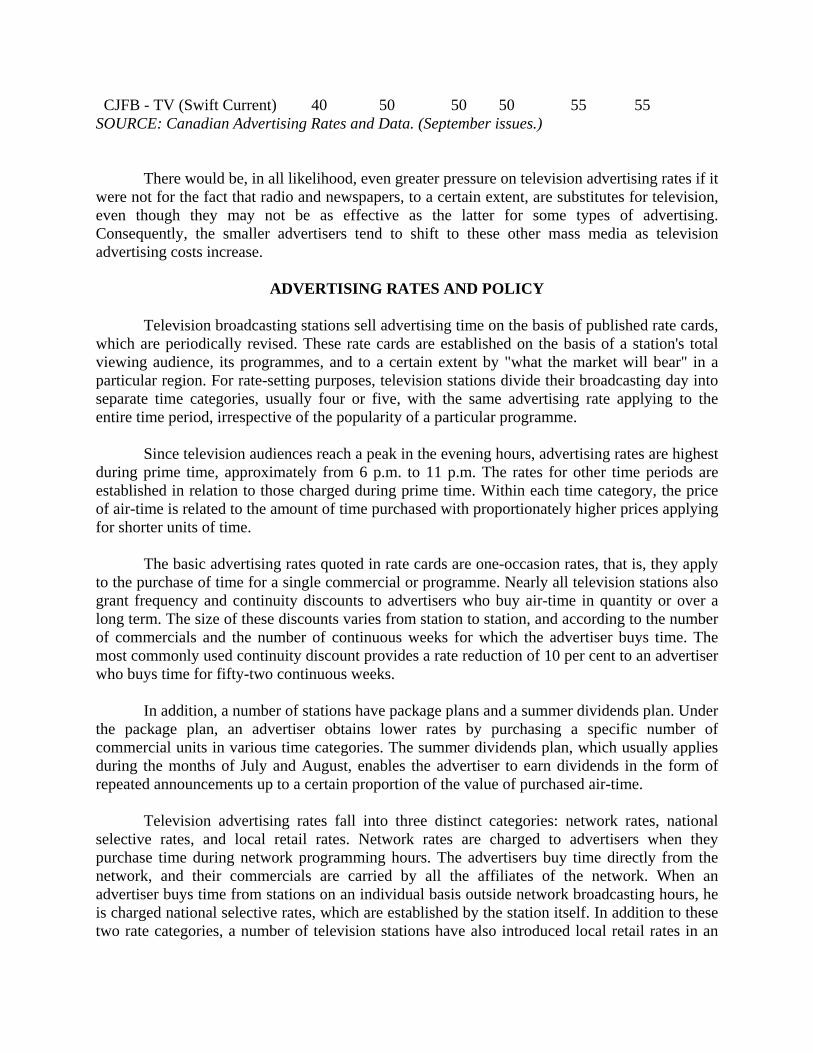
CJFB - TV (Swift Current) 40 50 50 50 55 55 SOURCE: Canadian Advertising Rates and Data. (September issues.) There would be, in all likelihood, even greater pressure on television advertising rates if it were not for the fact that radio and newspapers, to a certain extent, are substitutes for television, even though they may not be as effective as the latter for some types of advertising. Consequently, the smaller advertisers tend to shift to these other mass media as television advertising costs increase.
ADVERTISING RATES AND POLICY
Television broadcasting stations sell advertising time on the basis of published rate cards, which are periodically revised. These rate cards are established on the basis of a station's total viewing audience, its programmes, and to a certain extent by "what the market will bear" in a particular region. For rate-setting purposes, television stations divide their broadcasting day into separate time categories, usually four or five, with the same advertising rate applying to the entire time period, irrespective of the popularity of a particular programme.
Since television audiences reach a peak in the evening hours, advertising rates are highest during prime time, approximately from 6 p.m. to 11 p.m. The rates for other time periods are established in relation to those charged during prime time. Within each time category, the price of air-time is related to the amount of time purchased with proportionately higher prices applying for shorter units of time.
The basic advertising rates quoted in rate cards are one-occasion rates, that is, they apply to the purchase of time for a single commercial or programme. Nearly all television stations also grant frequency and continuity discounts to advertisers who buy air-time in quantity or over a long term. The size of these discounts varies from station to station, and according to the number of commercials and the number of continuous weeks for which the advertiser buys time. The most commonly used continuity discount provides a rate reduction of 10 per cent to an advertiser who buys time for fifty-two continuous weeks.
In addition, a number of stations have package plans and a summer dividends plan. Under the package plan, an advertiser obtains lower rates by purchasing a specific number of commercial units in various time categories. The summer dividends plan, which usually applies during the months of July and August, enables the advertiser to earn dividends in the form of repeated announcements up to a certain proportion of the value of purchased air-time.
Television advertising rates fall into three distinct categories: network rates, national selective rates, and local retail rates. Network rates are charged to advertisers when they purchase time during network programming hours. The advertisers buy time directly from the network, and their commercials are carried by all the affiliates of the network. When an advertiser buys time from stations on an individual basis outside network broadcasting hours, he is charged national selective rates, which are established by the station itself. In addition to these two rate categories, a number of television stations have also introduced local retail rates in an
attempt to attract local retail firms that cannot afford the high rates charged to national advertisers.
The CBC for example, introduced local retail rates on an experimental basis for CBUT-TV (Vancouver) in October 1957. By 1967, retail rates had been established for nine other CBC stations in Toronto, Halifax, Ottawa, Montreal, Quebec, Comer Brook, and St. John's. These local retail rates, however, are not published in Canadian Advertising Rates and Data and have to be obtained from each station individually. Consequently, Table 95 shows national and retail advertising rates only for ten CBC-owned stations and CHCH (Hamilton).
Table 95: National and Local Television Advertising Rates in 1968 National Local Local as Station Rate Rate % of National $ $ % CBUT-TV (Vancouver) 255.00 153.00 60 CBLT-TV (Toronto) 425.00 255.00 60 CBHT-TV (Halifax) 115.00 69.00 60 CBOT-TV (Ottawa) 143.00 100.10 70 CBOFT-TV (Ottawa) 75.00 52.50 70 CBFT-TV (Montreal) 313.00 234.75 75 CBMT-TV (Montreal) 250.00 187.50 75 CBVT-TV (Quebec) 200.00 150.00 75 CBYT-TV (Comer Brook) 20.00 15.00 75 CBNT-TV (St. John's) 85.00 68.00 80 CHCH-TV (Hamilton) 400.00 . 340.00 85 *Prime-time, one-occasion rates. SOURCE: Individual station rate cards.
RATE-PER-THOUSAND
The price of advertising time for spot announcements is usually expressed in terms of dollars-per-minute or portions of a minute. As far as an advertiser is concerned, however, the potential circulation of a station is as important to him as the flat rate charged for one minute of air-time. The rate-per-thousand enables the advertiser to determine the costs involved in reaching 1,000 potential customers and also enables him to compare the relative costs of reaching this audience by purchasing air-time on alternative television stations. The following formula is used to calculate the rate-per-thousand:
Rate-per-sixty -seconds-of -air-time x 1,000 Circulation of Station
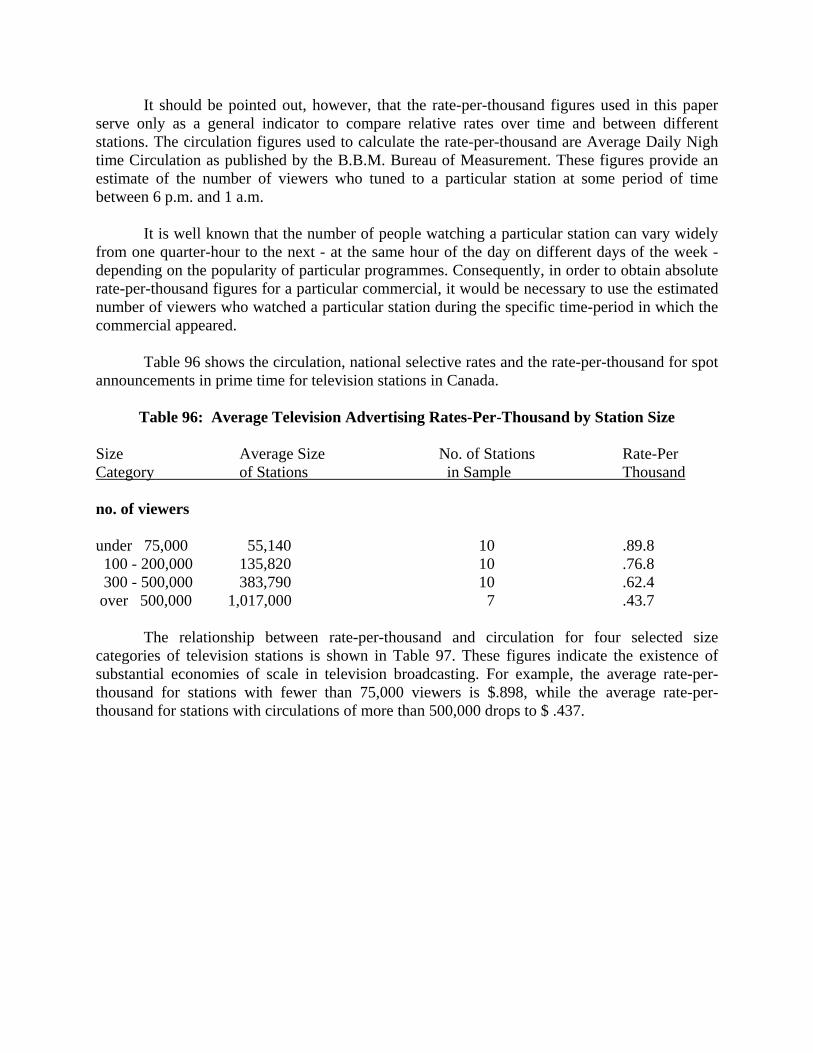
It should be pointed out, however, that the rate-per-thousand figures used in this paper serve only as a general indicator to compare relative rates over time and between different stations. The circulation figures used to calculate the rate-per-thousand are Average Daily Nigh time Circulation as published by the B.B.M. Bureau of Measurement. These figures provide an estimate of the number of viewers who tuned to a particular station at some period of time between 6 p.m. and 1 a.m.
It is well known that the number of people watching a particular station can vary widely from one quarter-hour to the next - at the same hour of the day on different days of the week - depending on the popularity of particular programmes. Consequently, in order to obtain absolute rate-per-thousand figures for a particular commercial, it would be necessary to use the estimated number of viewers who watched a particular station during the specific time-period in which the commercial appeared.
Table 96 shows the circulation, national selective rates and the rate-per-thousand for spot announcements in prime time for television stations in Canada.
Table 96: Average Television Advertising Rates-Per-Thousand by Station Size Size Average Size No. of Stations Rate-Per Category of Stations in Sample Thousand no. of viewers under 75,000 55,140 10 .89.8 100 - 200,000 135,820 10 .76.8 300 - 500,000 383,790 10 .62.4 over 500,000 1,017,000 7 .43.7
The relationship between rate-per-thousand and circulation for four selected size categories of television stations is shown in Table 97. These figures indicate the existence of substantial economies of scale in television broadcasting. For example, the average rate-per-thousand for stations with fewer than 75,000 viewers is $.898, while the average rate-per-thousand for stations with circulations of more than 500,000 drops to $ .437.
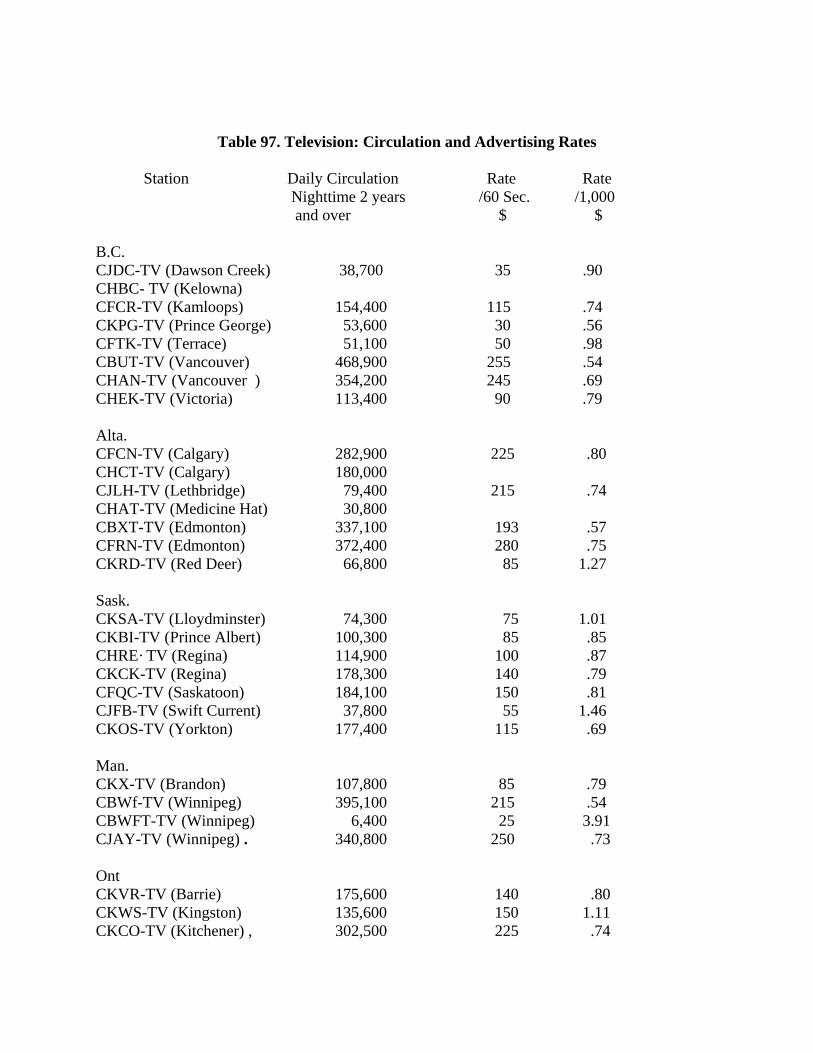
Table 97. Television: Circulation and Advertising Rates Station Daily Circulation Rate Rate Nighttime 2 years /60 Sec. /1,000 and over $ $ B.C. CJDC-TV (Dawson Creek) 38,700 35 .90 CHBC- TV (Kelowna) CFCR-TV (Kamloops) 154,400 115 .74 CKPG-TV (Prince George) 53,600 30 .56 CFTK-TV (Terrace) 51,100 50 .98 CBUT-TV (Vancouver) 468,900 255 .54 CHAN-TV (Vancouver ) 354,200 245 .69 CHEK-TV (Victoria) 113,400 90 .79 Alta. CFCN-TV (Calgary) 282,900 225 .80 CHCT-TV (Calgary) 180,000 CJLH-TV (Lethbridge) 79,400 215 .74 CHAT-TV (Medicine Hat) 30,800 CBXT-TV (Edmonton) 337,100 193 .57 CFRN-TV (Edmonton) 372,400 280 .75 CKRD-TV (Red Deer) 66,800 85 1.27 Sask. CKSA-TV (Lloydminster) 74,300 75 1.01 CKBI-TV (Prince Albert) 100,300 85 .85 CHRE· TV (Regina) 114,900 100 .87 CKCK-TV (Regina) 178,300 140 .79 CFQC-TV (Saskatoon) 184,100 150 .81 CJFB-TV (Swift Current) 37,800 55 1.46 CKOS-TV (Yorkton) 177,400 115 .69 Man. CKX-TV (Brandon) 107,800 85 .79 CBWf-TV (Winnipeg) 395,100 215 .54 CBWFT-TV (Winnipeg) 6,400 25 3.91 CJAY-TV (Winnipeg) . 340,800 250 .73 Ont CKVR-TV (Barrie) 175,600 140 .80 CKWS-TV (Kingston) 135,600 150 1.11 CKCO-TV (Kitchener) , 302,500 225 .74
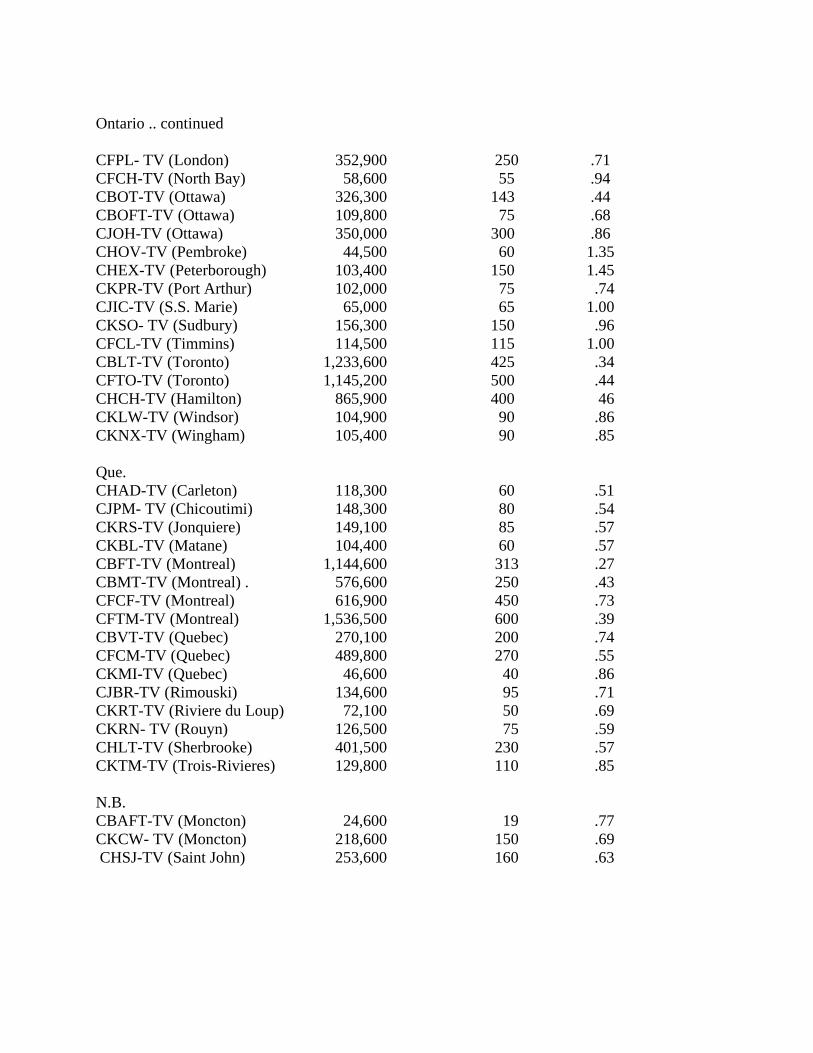
Ontario .. continued CFPL- TV (London) 352,900 250 .71 CFCH-TV (North Bay) 58,600 55 .94 CBOT-TV (Ottawa) 326,300 143 .44 CBOFT-TV (Ottawa) 109,800 75 .68 CJOH-TV (Ottawa) 350,000 300 .86 CHOV-TV (Pembroke) 44,500 60 1.35 CHEX-TV (Peterborough) 103,400 150 1.45 CKPR-TV (Port Arthur) 102,000 75 .74 CJIC-TV (S.S. Marie) 65,000 65 1.00 CKSO- TV (Sudbury) 156,300 150 .96 CFCL-TV (Timmins) 114,500 115 1.00 CBLT-TV (Toronto) 1,233,600 425 .34 CFTO-TV (Toronto) 1,145,200 500 .44 CHCH-TV (Hamilton) 865,900 400 46 CKLW-TV (Windsor) 104,900 90 .86 CKNX-TV (Wingham) 105,400 90 .85 Que. CHAD-TV (Carleton) 118,300 60 .51 CJPM- TV (Chicoutimi) 148,300 80 .54 CKRS-TV (Jonquiere) 149,100 85 .57 CKBL-TV (Matane) 104,400 60 .57 CBFT-TV (Montreal) 1,144,600 313 .27 CBMT-TV (Montreal) . 576,600 250 .43 CFCF-TV (Montreal) 616,900 450 .73 CFTM-TV (Montreal) 1,536,500 600 .39 CBVT-TV (Quebec) 270,100 200 .74 CFCM-TV (Quebec) 489,800 270 .55 CKMI-TV (Quebec) 46,600 40 .86 CJBR-TV (Rimouski) 134,600 95 .71 CKRT-TV (Riviere du Loup) 72,100 50 .69 CKRN- TV (Rouyn) 126,500 75 .59 CHLT-TV (Sherbrooke) 401,500 230 .57 CKTM-TV (Trois-Rivieres) 129,800 110 .85 N.B. CBAFT-TV (Moncton) 24,600 19 .77 CKCW- TV (Moncton) 218,600 150 .69 CHSJ-TV (Saint John) 253,600 160 .63
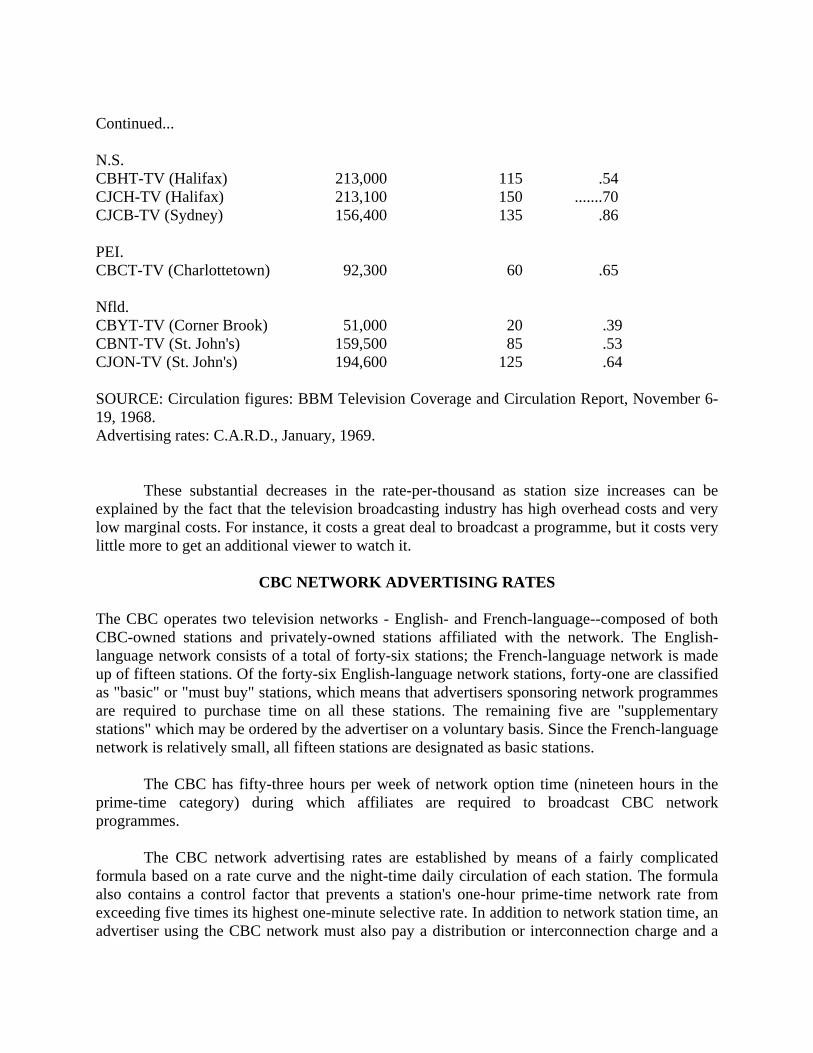
Continued... N.S. CBHT-TV (Halifax) 213,000 115 .54 CJCH-TV (Halifax) 213,100 150 .......70 CJCB-TV (Sydney) 156,400 135 .86 PEI. CBCT-TV (Charlottetown) 92,300 60 .65 Nfld. CBYT-TV (Corner Brook) 51,000 20 .39 CBNT-TV (St. John's) 159,500 85 .53 CJON-TV (St. John's) 194,600 125 .64 SOURCE: Circulation figures: BBM Television Coverage and Circulation Report, November 6-19, 1968. Advertising rates: C.A.R.D., January, 1969.
These substantial decreases in the rate-per-thousand as station size increases can be explained by the fact that the television broadcasting industry has high overhead costs and very low marginal costs. For instance, it costs a great deal to broadcast a programme, but it costs very little more to get an additional viewer to watch it.
CBC NETWORK ADVERTISING RATES The CBC operates two television networks - English- and French-language--composed of both CBC-owned stations and privately-owned stations affiliated with the network. The English-language network consists of a total of forty-six stations; the French-language network is made up of fifteen stations. Of the forty-six English-language network stations, forty-one are classified as "basic" or "must buy" stations, which means that advertisers sponsoring network programmes are required to purchase time on all these stations. The remaining five are "supplementary stations" which may be ordered by the advertiser on a voluntary basis. Since the French-language network is relatively small, all fifteen stations are designated as basic stations.
The CBC has fifty-three hours per week of network option time (nineteen hours in the prime-time category) during which affiliates are required to broadcast CBC network programmes.
The CBC network advertising rates are established by means of a fairly complicated formula based on a rate curve and the night-time daily circulation of each station. The formula also contains a control factor that prevents a station's one-hour prime-time network rate from exceeding five times its highest one-minute selective rate. In addition to network station time, an advertiser using the CBC network must also pay a distribution or interconnection charge and a
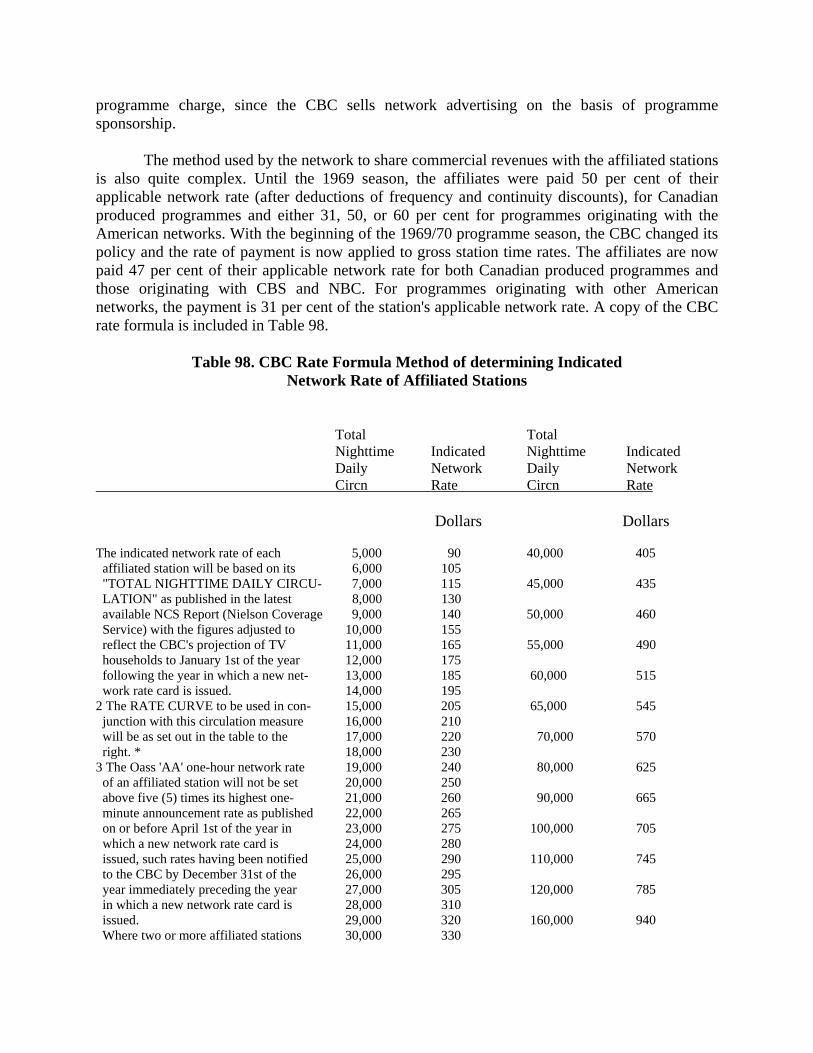
programme charge, since the CBC sells network advertising on the basis of programme sponsorship.
The method used by the network to share commercial revenues with the affiliated stations is also quite complex. Until the 1969 season, the affiliates were paid 50 per cent of their applicable network rate (after deductions of frequency and continuity discounts), for Canadian produced programmes and either 31, 50, or 60 per cent for programmes originating with the American networks. With the beginning of the 1969/70 programme season, the CBC changed its policy and the rate of payment is now applied to gross station time rates. The affiliates are now paid 47 per cent of their applicable network rate for both Canadian produced programmes and those originating with CBS and NBC. For programmes originating with other American networks, the payment is 31 per cent of the station's applicable network rate. A copy of the CBC rate formula is included in Table 98.
Table 98. CBC Rate Formula Method of determining Indicated Network Rate of Affiliated Stations
Total Total Nighttime Indicated Nighttime Indicated Daily Network Daily Network Circn Rate Circn Rate Dollars Dollars The indicated network rate of each 5,000 90 40,000 405 affiliated station will be based on its 6,000 105 "TOTAL NIGHTTIME DAILY CIRCU- 7,000 115 45,000 435 LATION" as published in the latest 8,000 130 available NCS Report (Nielson Coverage 9,000 140 50,000 460 Service) with the figures adjusted to 10,000 155 reflect the CBC's projection of TV 11,000 165 55,000 490 households to January 1st of the year 12,000 175 following the year in which a new net- 13,000 185 60,000 515 work rate card is issued. 14,000 195 2 The RATE CURVE to be used in con- 15,000 205 65,000 545 junction with this circulation measure 16,000 210 will be as set out in the table to the 17,000 220 70,000 570 right. * 18,000 230 3 The Oass 'AA' one-hour network rate 19,000 240 80,000 625 of an affiliated station will not be set 20,000 250 above five (5) times its highest one- 21,000 260 90,000 665 minute announcement rate as published 22,000 265 on or before April 1st of the year in 23,000 275 100,000 705 which a new network rate card is 24,000 280 issued, such rates having been notified 25,000 290 110,000 745 to the CBC by December 31st of the 26,000 295 year immediately preceding the year 27,000 305 120,000 785 in which a new network rate card is 28,000 310 issued. 29,000 320 160,000 940 Where two or more affiliated stations 30,000 330
publish a combination rate card (re- 31,000 335 200,000 1,060 gardless of whether or not these same 32,000 345 stations also publish individual rate 33,000 350 300,000 1,350 cards) the aggregate Class 'AA' one- 34,000 360 hour network rate of such a combina- 35,000 365 400,000 1,585 lion of stations will not be set above 36,000 375 five (5) times the combination's highest 37,000 380 500,000 1,805 one-minute announcement rate as 38,000 390 published on or before April 1st of the 39,000 395 600,000 2,025 year in which a new rate card is issued, such rates having been notified to the CBe by December 31st of the year immediately preceding the year in which a new network rate card is issued. * Effective with the 1969 publication of Rate Card No.2 5 (Subject to usual rate protection).
CTV NETWORK ADVERTISING RATES The CTV network is owned and operated by its twelve affiliated stations, which are located in the major metropolitan areas from coast to coast. The network provides approximately forty-eight hours of programming per week. Of this total, twenty-three and one-half hours consist of network sales time, for which the advertiser must buy time through the network; twenty-four and one-half hours are designated as station or ·selective sales time, during which affiliates sell advertising time individually and pay the network for programmes originated by it. Selective sales time means individual stations are able to choose the time of broadcast for this programming. This option becomes effective with the beginning of the 1970 season.
The network has three very complicated formulae for sharing revenue from network sales time with the affiliates. These formulae are based on numerous factors, such as the highest rate card for a station, its competitive situation, its programming and Canadian content requirements, etc. Detailed information concerning the nature of each of these rate-setting methods has been filed with the Committee.
C.R.T.C. CANADIAN CONTENT REQUIREMENTS As a result of the new C.R.T.C. regulations with respect to Canadian content it is expected that amendments will be required to the present CBC and CTV affiliation agreements.
TRENDS IN ADVERTISING RATES
Table 99 and Chart 17 show station-time rates per-thousand-households for television stations in four size categories from 1964 to 1968. The stations have been grouped on the basis of 1968 circulation figures. The rates per thousand are based on one-occasion rates during prime-time and the circulation figures are average daily night-time circulation as published by B.B.M. Bureau of Measurement.

Although the rates per thousand for all four groups show a fairly steady upward trend over the period, especially in the case of the two largest circulation groups, the accuracy of the figures for 1967 and 1968 is questionable. The difficulty is introduced by a change in B.B.M.'s survey methods. Until 1966, B.B.M. reported circulation figures in terms of households. In 1967, it switched to reporting circulation in terms of the total number of persons watching a station. Consequently, the circulation figures for 1967 and 1968 have been converted to households by using D.B.S. figures for average family size for individual cities, where available, or the provincial average. The figures for average family size were obtained from the 1966 Census.

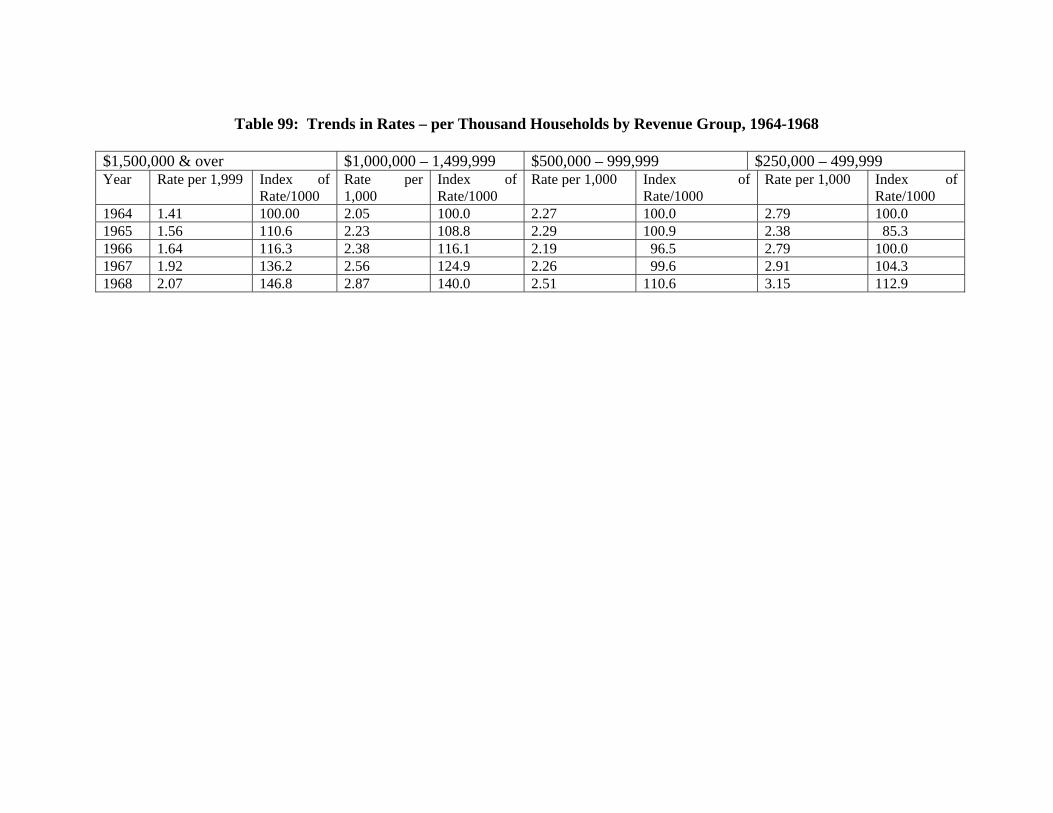
Table 99: Trends in Rates – per Thousand Households by Revenue Group, 1964-1968
$1,500,000 & over $1,000,000 – 1,499,999 $500,000 – 999,999 $250,000 – 499,999 Year Rate per 1,999 Index of
Rate/1000 Rate per 1,000
Index of Rate/1000
Rate per 1,000 Index of Rate/1000
Rate per 1,000 Index of Rate/1000
1964 1.41 100.00 2.05 100.0 2.27 100.0 2.79 100.0 1965 1.56 110.6 2.23 108.8 2.29 100.9 2.38 85.3 1966 1.64 116.3 2.38 116.1 2.19 96.5 2.79 100.0 1967 1.92 136.2 2.56 124.9 2.26 99.6 2.91 104.3 1968 2.07 146.8 2.87 140.0 2.51 110.6 3.15 112.9
This conversion of B.B.M. circulation figures from the total number of individuals to households results in a drop in circulation for a substantial number of stations as indicated in Table 100. It would not seem logical that such a number of stations would all suffer a loss in viewing audience. This is especially the case for such stations as Hamilton, Victoria and Barrie, which showed a steady increase in circulation during the previous three years.
GROWTH OF TELEVISION ADVERTISING
Since 1952, when television was introduced in Canada, demand for television advertising has expanded rapidly. The net advertising revenue received by the television broadcasting industry increased from $8.6 million in 1954 to an estimated $118.0 million in 1968. This represents an increase of 1,272 per cent over a period of fourteen years. During the same period the total net advertising revenue received by all media increased by only 167.9 per cent. Consequently, the television broadcasting industry substantially increased its market share of total advertising revenue from 2.5 per cent in 1954 to 13.0 per cent in 1968. This expansion in television's market share has been almost entirely at the expense of newspapers and magazines. Table 101 indicates the growth of total advertising revenue received by all media, and television advertising· revenue from 1954 to 1968.

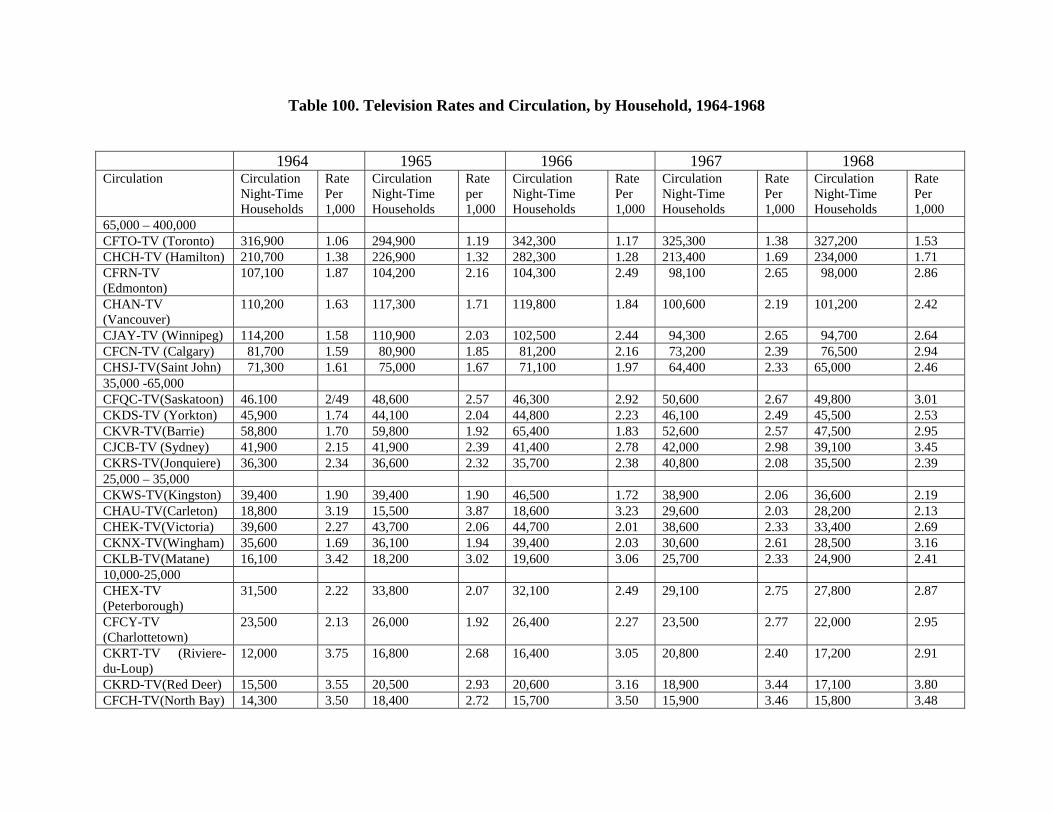
Table 100. Television Rates and Circulation, by Household, 1964-1968 1964 1965 1966 1967 1968 Circulation Circulation
Night-Time Households
Rate Per 1,000
Circulation Night-Time Households
Rate per 1,000
Circulation Night-Time Households
Rate Per 1,000
Circulation Night-Time Households
Rate Per 1,000
Circulation Night-Time Households
Rate Per 1,000
65,000 – 400,000 CFTO-TV (Toronto) 316,900 1.06 294,900 1.19 342,300 1.17 325,300 1.38 327,200 1.53 CHCH-TV (Hamilton) 210,700 1.38 226,900 1.32 282,300 1.28 213,400 1.69 234,000 1.71 CFRN-TV (Edmonton)
107,100 1.87 104,200 2.16 104,300 2.49 98,100 2.65 98,000 2.86
CHAN-TV (Vancouver)
110,200 1.63 117,300 1.71 119,800 1.84 100,600 2.19 101,200 2.42
CJAY-TV (Winnipeg) 114,200 1.58 110,900 2.03 102,500 2.44 94,300 2.65 94,700 2.64 CFCN-TV (Calgary) 81,700 1.59 80,900 1.85 81,200 2.16 73,200 2.39 76,500 2.94 CHSJ-TV(Saint John) 71,300 1.61 75,000 1.67 71,100 1.97 64,400 2.33 65,000 2.46 35,000 -65,000 CFQC-TV(Saskatoon) 46.100 2/49 48,600 2.57 46,300 2.92 50,600 2.67 49,800 3.01 CKDS-TV (Yorkton) 45,900 1.74 44,100 2.04 44,800 2.23 46,100 2.49 45,500 2.53 CKVR-TV(Barrie) 58,800 1.70 59,800 1.92 65,400 1.83 52,600 2.57 47,500 2.95 CJCB-TV (Sydney) 41,900 2.15 41,900 2.39 41,400 2.78 42,000 2.98 39,100 3.45 CKRS-TV(Jonquiere) 36,300 2.34 36,600 2.32 35,700 2.38 40,800 2.08 35,500 2.39 25,000 – 35,000 CKWS-TV(Kingston) 39,400 1.90 39,400 1.90 46,500 1.72 38,900 2.06 36,600 2.19 CHAU-TV(Carleton) 18,800 3.19 15,500 3.87 18,600 3.23 29,600 2.03 28,200 2.13 CHEK-TV(Victoria) 39,600 2.27 43,700 2.06 44,700 2.01 38,600 2.33 33,400 2.69 CKNX-TV(Wingham) 35,600 1.69 36,100 1.94 39,400 2.03 30,600 2.61 28,500 3.16 CKLB-TV(Matane) 16,100 3.42 18,200 3.02 19,600 3.06 25,700 2.33 24,900 2.41 10,000-25,000 CHEX-TV (Peterborough)
31,500 2.22 33,800 2.07 32,100 2.49 29,100 2.75 27,800 2.87
CFCY-TV (Charlottetown)
23,500 2.13 26,000 1.92 26,400 2.27 23,500 2.77 22,000 2.95
CKRT-TV (Riviere-du-Loup)
12,000 3.75 16,800 2.68 16,400 3.05 20,800 2.40 17,200 2.91
CKRD-TV(Red Deer) 15,500 3.55 20,500 2.93 20,600 3.16 18,900 3.44 17,100 3.80 CFCH-TV(North Bay) 14,300 3.50 18,400 2.72 15,700 3.50 15,900 3.46 15,800 3.48
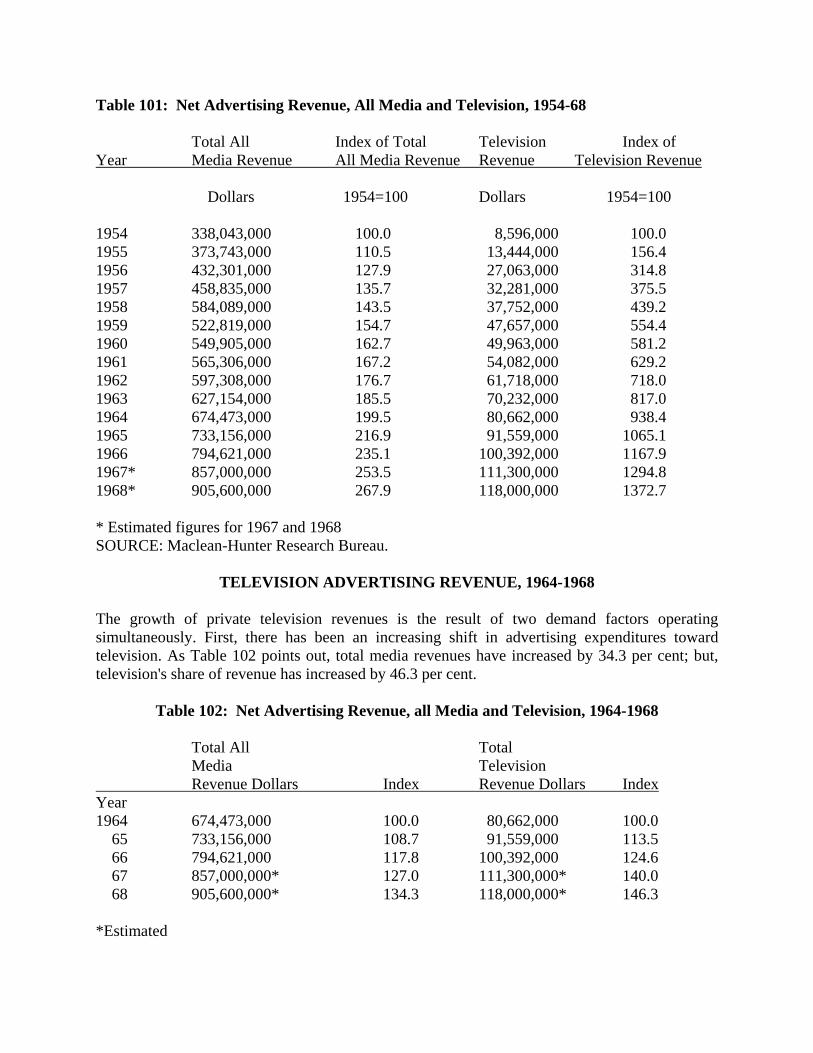
Table 101: Net Advertising Revenue, All Media and Television, 1954-68 Total All Index of Total Television Index of Year Media Revenue All Media Revenue Revenue Television Revenue
Dollars 1954=100 Dollars 1954=100 1954 338,043,000 100.0 8,596,000 100.0 1955 373,743,000 110.5 13,444,000 156.4 1956 432,301,000 127.9 27,063,000 314.8 1957 458,835,000 135.7 32,281,000 375.5 1958 584,089,000 143.5 37,752,000 439.2 1959 522,819,000 154.7 47,657,000 554.4 1960 549,905,000 162.7 49,963,000 581.2 1961 565,306,000 167.2 54,082,000 629.2 1962 597,308,000 176.7 61,718,000 718.0 1963 627,154,000 185.5 70,232,000 817.0 1964 674,473,000 199.5 80,662,000 938.4 1965 733,156,000 216.9 91,559,000 1065.1 1966 794,621,000 235.1 100,392,000 1167.9 1967* 857,000,000 253.5 111,300,000 1294.8 1968* 905,600,000 267.9 118,000,000 1372.7 * Estimated figures for 1967 and 1968 SOURCE: Maclean-Hunter Research Bureau.
TELEVISION ADVERTISING REVENUE, 1964-1968 The growth of private television revenues is the result of two demand factors operating simultaneously. First, there has been an increasing shift in advertising expenditures toward television. As Table 102 points out, total media revenues have increased by 34.3 per cent; but, television's share of revenue has increased by 46.3 per cent.
Table 102: Net Advertising Revenue, all Media and Television, 1964-1968
Total All Total Media Television Revenue Dollars Index Revenue Dollars Index Year 1964 674,473,000 100.0 80,662,000 100.0 65 733,156,000 108.7 91,559,000 113.5 66 794,621,000 117.8 100,392,000 124.6 67 857,000,000* 127.0 111,300,000* 140.0 68 905,600,000* 134.3 118,000,000* 146.3 *Estimated

The second factor leading to the growth of private television revenues is the shift in
television advertising revenues from the CBC towards the private sector of the media. (See Tables 103 and 104). From 1963-1968, the CBC's network revenue grew by 22.1 per cent. During the same time, the private network revenues grew by 74.3 per cent. The introduction of competition from CTV was largely responsible for the slowness in the growth of CBC revenue. The growth of private network advertising revenues is the result of this limited advertising supply and the increasing demand for time.

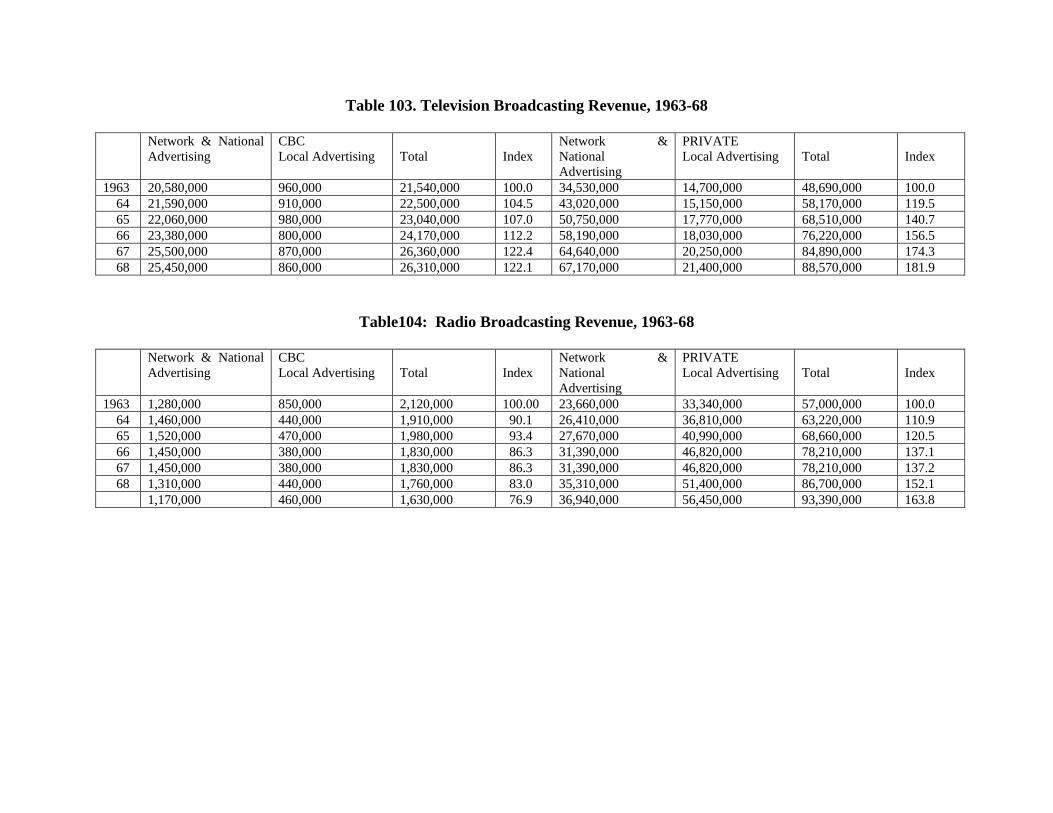
Table 103. Television Broadcasting Revenue, 1963-68
Network & National Advertising
CBC Local Advertising
Total
Index
Network & National Advertising
PRIVATE Local Advertising
Total
Index
1963 20,580,000 960,000 21,540,000 100.0 34,530,000 14,700,000 48,690,000 100.0 64 21,590,000 910,000 22,500,000 104.5 43,020,000 15,150,000 58,170,000 119.5 65 22,060,000 980,000 23,040,000 107.0 50,750,000 17,770,000 68,510,000 140.7 66 23,380,000 800,000 24,170,000 112.2 58,190,000 18,030,000 76,220,000 156.5 67 25,500,000 870,000 26,360,000 122.4 64,640,000 20,250,000 84,890,000 174.3 68 25,450,000 860,000 26,310,000 122.1 67,170,000 21,400,000 88,570,000 181.9
Table104: Radio Broadcasting Revenue, 1963-68
Network & National Advertising
CBC Local Advertising
Total
Index
Network & National Advertising
PRIVATE Local Advertising
Total
Index
1963 1,280,000 850,000 2,120,000 100.00 23,660,000 33,340,000 57,000,000 100.0 64 1,460,000 440,000 1,910,000 90.1 26,410,000 36,810,000 63,220,000 110.9 65 1,520,000 470,000 1,980,000 93.4 27,670,000 40,990,000 68,660,000 120.5 66 1,450,000 380,000 1,830,000 86.3 31,390,000 46,820,000 78,210,000 137.1 67 1,450,000 380,000 1,830,000 86.3 31,390,000 46,820,000 78,210,000 137.2 68 1,310,000 440,000 1,760,000 83.0 35,310,000 51,400,000 86,700,000 152.1 1,170,000 460,000 1,630,000 76.9 36,940,000 56,450,000 93,390,000 163.8

RADIO ADVERTISING THROUGH TIME
In radio broadcasting, the shift towards the private broadcasting stations has been outstanding. Private advertising revenues have increased by 63.8 per cent; CBC's radio advertising revenues have decreased by 23.1 per cent. The great decrease in the CBC's revenues is due largely to their programming policy. The CBC has not competed with the news and music format of the private stations. Also, the CBC sells block advertising time, a difficult thing to do with a decreasing circulation.
Chapter 3:
COSTS
INTRODUCTION To assist understanding of the nature of costs within the broadcasting industry, Tables 105 and 106 break down costs according to purchased inputs, labour, and capital costs.
Purchased inputs are analyzed into costs of representative commissions, fuel, electricity, artist fees, performing rights etc.; these are the material or service inputs acquired from other industries.
The returns to labour are defined as wages, salaries, and fringe benefits.
A more difficult concept is the gross returns to capital. Gross returns to capital includes capital consumption allowances (depreciation and obsolescence), profit, and the return to land (rent); in this sense we give capital the broad definition in order to illustrate the relationship between labour, capital, and purchased inputs in the most general terms.
PURCHASED INPUT COSTS
Purchased inputs for the television industry vary from 35 to 36 per cent of total costs. In radio, this proportion varies from 32 to 34 per cent; this similarity in cost structure between the two industries is not unexpected, since we are dealing with the two slightly different products produced within one general industry.
However, when one examines the particular mix of inputs in each area of broadcasting, one can identify the differences in proportional costs with the differences in the product of each media. The proportion of total costs going to representative commissions is slightly higher in radio than in television (radio, 5.5 per cent, television, 4.5 per cent, on average). The television broadcasting industry will have a larger internal organization which will solicit its own advertising revenues, in comparison with the radio industry. Of particular interest is the purchased input "artist fees." First, in both industries the proportion of total costs allocated to the

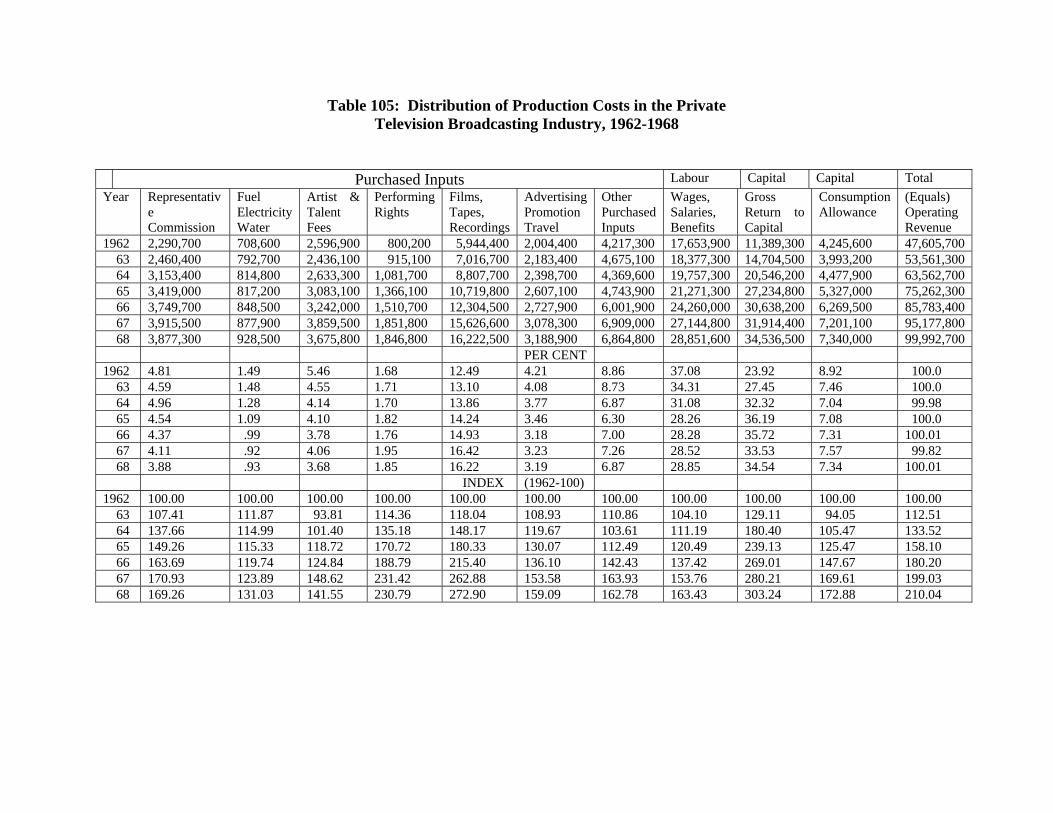
Table 105: Distribution of Production Costs in the Private Television Broadcasting Industry, 1962-1968
Purchased Inputs Labour Capital Capital Total
Year Representative Commission
Fuel Electricity Water
Artist & Talent Fees
Performing Rights
Films, Tapes, Recordings
Advertising Promotion Travel
Other Purchased Inputs
Wages, Salaries, Benefits
Gross Return to Capital
Consumption Allowance
(Equals) Operating Revenue
1962 2,290,700 708,600 2,596,900 800,200 5,944,400 2,004,400 4,217,300 17,653,900 11,389,300 4,245,600 47,605,700 63 2,460,400 792,700 2,436,100 915,100 7,016,700 2,183,400 4,675,100 18,377,300 14,704,500 3,993,200 53,561,300 64 3,153,400 814,800 2,633,300 1,081,700 8,807,700 2,398,700 4,369,600 19,757,300 20,546,200 4,477,900 63,562,700 65 3,419,000 817,200 3,083,100 1,366,100 10,719,800 2,607,100 4,743,900 21,271,300 27,234,800 5,327,000 75,262,300 66 3,749,700 848,500 3,242,000 1,510,700 12,304,500 2,727,900 6,001,900 24,260,000 30,638,200 6,269,500 85,783,400 67 3,915,500 877,900 3,859,500 1,851,800 15,626,600 3,078,300 6,909,000 27,144,800 31,914,400 7,201,100 95,177,800 68 3,877,300 928,500 3,675,800 1,846,800 16,222,500 3,188,900 6,864,800 28,851,600 34,536,500 7,340,000 99,992,700 PER CENT 1962 4.81 1.49 5.46 1.68 12.49 4.21 8.86 37.08 23.92 8.92 100.0 63 4.59 1.48 4.55 1.71 13.10 4.08 8.73 34.31 27.45 7.46 100.0 64 4.96 1.28 4.14 1.70 13.86 3.77 6.87 31.08 32.32 7.04 99.98 65 4.54 1.09 4.10 1.82 14.24 3.46 6.30 28.26 36.19 7.08 100.0 66 4.37 .99 3.78 1.76 14.93 3.18 7.00 28.28 35.72 7.31 100.01 67 4.11 .92 4.06 1.95 16.42 3.23 7.26 28.52 33.53 7.57 99.82 68 3.88 .93 3.68 1.85 16.22 3.19 6.87 28.85 34.54 7.34 100.01 INDEX (1962-100) 1962 100.00 100.00 100.00 100.00 100.00 100.00 100.00 100.00 100.00 100.00 100.00 63 107.41 111.87 93.81 114.36 118.04 108.93 110.86 104.10 129.11 94.05 112.51 64 137.66 114.99 101.40 135.18 148.17 119.67 103.61 111.19 180.40 105.47 133.52 65 149.26 115.33 118.72 170.72 180.33 130.07 112.49 120.49 239.13 125.47 158.10 66 163.69 119.74 124.84 188.79 215.40 136.10 142.43 137.42 269.01 147.67 180.20 67 170.93 123.89 148.62 231.42 262.88 153.58 163.93 153.76 280.21 169.61 199.03 68 169.26 131.03 141.55 230.79 272.90 159.09 162.78 163.43 303.24 172.88 210.04
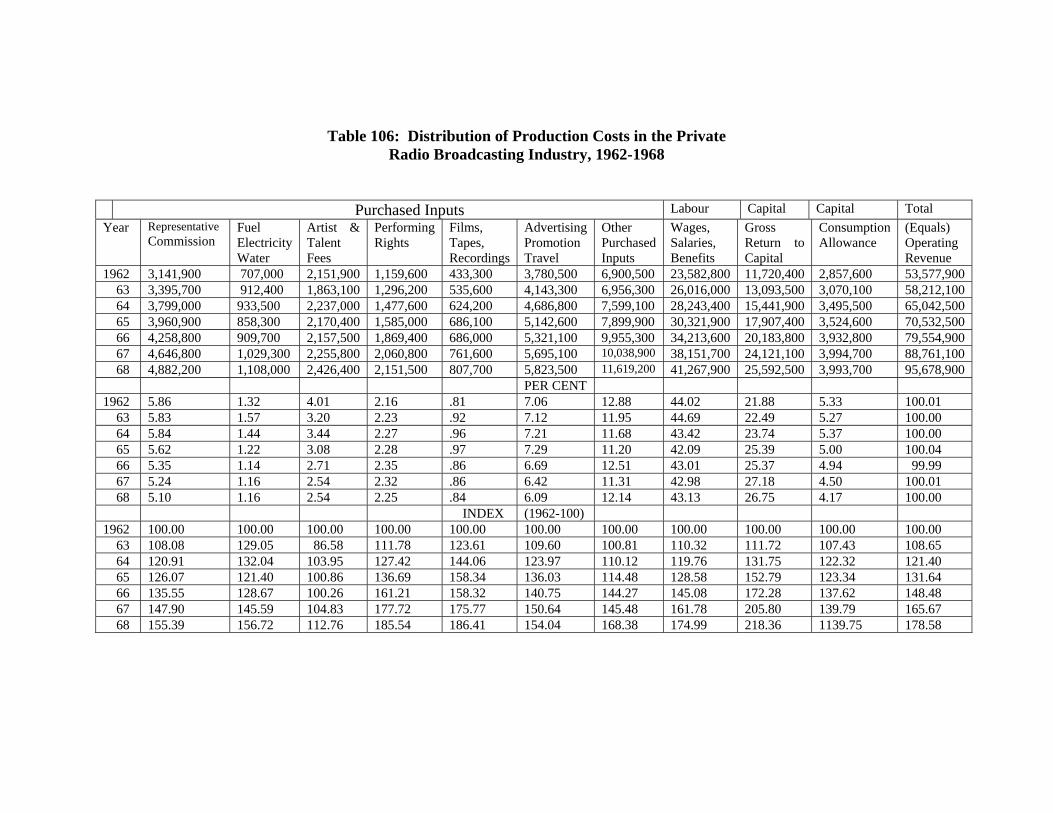
Table 106: Distribution of Production Costs in the Private Radio Broadcasting Industry, 1962-1968
Purchased Inputs Labour Capital Capital Total
Year Representative Commission
Fuel Electricity Water
Artist & Talent Fees
Performing Rights
Films, Tapes, Recordings
Advertising Promotion Travel
Other Purchased Inputs
Wages, Salaries, Benefits
Gross Return to Capital
Consumption Allowance
(Equals) Operating Revenue
1962 3,141,900 707,000 2,151,900 1,159,600 433,300 3,780,500 6,900,500 23,582,800 11,720,400 2,857,600 53,577,900 63 3,395,700 912,400 1,863,100 1,296,200 535,600 4,143,300 6,956,300 26,016,000 13,093,500 3,070,100 58,212,100 64 3,799,000 933,500 2,237,000 1,477,600 624,200 4,686,800 7,599,100 28,243,400 15,441,900 3,495,500 65,042,500 65 3,960,900 858,300 2,170,400 1,585,000 686,100 5,142,600 7,899,900 30,321,900 17,907,400 3,524,600 70,532,500 66 4,258,800 909,700 2,157,500 1,869,400 686,000 5,321,100 9,955,300 34,213,600 20,183,800 3,932,800 79,554,900 67 4,646,800 1,029,300 2,255,800 2,060,800 761,600 5,695,100 10,038,900 38,151,700 24,121,100 3,994,700 88,761,100 68 4,882,200 1,108,000 2,426,400 2,151,500 807,700 5,823,500 11,619,200 41,267,900 25,592,500 3,993,700 95,678,900 PER CENT 1962 5.86 1.32 4.01 2.16 .81 7.06 12.88 44.02 21.88 5.33 100.01 63 5.83 1.57 3.20 2.23 .92 7.12 11.95 44.69 22.49 5.27 100.00 64 5.84 1.44 3.44 2.27 .96 7.21 11.68 43.42 23.74 5.37 100.00 65 5.62 1.22 3.08 2.28 .97 7.29 11.20 42.09 25.39 5.00 100.04 66 5.35 1.14 2.71 2.35 .86 6.69 12.51 43.01 25.37 4.94 99.99 67 5.24 1.16 2.54 2.32 .86 6.42 11.31 42.98 27.18 4.50 100.01 68 5.10 1.16 2.54 2.25 .84 6.09 12.14 43.13 26.75 4.17 100.00 INDEX (1962-100) 1962 100.00 100.00 100.00 100.00 100.00 100.00 100.00 100.00 100.00 100.00 100.00 63 108.08 129.05 86.58 111.78 123.61 109.60 100.81 110.32 111.72 107.43 108.65 64 120.91 132.04 103.95 127.42 144.06 123.97 110.12 119.76 131.75 122.32 121.40 65 126.07 121.40 100.86 136.69 158.34 136.03 114.48 128.58 152.79 123.34 131.64 66 135.55 128.67 100.26 161.21 158.32 140.75 144.27 145.08 172.28 137.62 148.48 67 147.90 145.59 104.83 177.72 175.77 150.64 145.48 161.78 205.80 139.79 165.67 68 155.39 156.72 112.76 185.54 186.41 154.04 168.38 174.99 218.36 1139.75 178.58
payment of artists has decreased; in television, the costs decreased from 5.46 per cent of total costs in 1962 to 3:68 per cent in 1968; for radio, in the same period, the decrease was from 4.02 per cent to 2.54 per cent. Second, much of this change in cost structure can be attributed to the changing technology in the industry. For example, proportionate costs for films, tapes, and recordings have increased significantly in both media. These two phenomena are explained by the difference in the content of broadcasting, especially television.
The increase in the costs of films, tapes, and recordings can be explained from both the supply and demand side. Early in the television industry's history, distribution rights for films and tapes were acquired by a very few organizations, which have since carefully controlled supply. The great increase in demand for non-variety-show type of programming has similarly led to higher costs. For television, it appears that the increased cost for technological inputs is a "demand-induced" type of inflation.
For both broadcast media the proportion of costs attributed to advertising, promotion and travel has decreased by approximately 1 per cent for each medium. In radio this is attributed to the change in the content of broadcasting. For most metropolitan radio stations the general format is news and music; rarely do we hear locally produced programs that are not of the news and music variety. Accordingly, it is no longer necessary to promote individual programs as being unique because all stations have essentially the same broadcasting content. In the case of television, the local stations originally carried a larger proportion of local programming, especially in the early days of the industry. However, more and more network programming is carried by the local stations. Again, the need for advertising and promotion is reduced.
LABOUR COSTS
Turning to labour's share of total costs, we observe a marked difference in the trend of each broadcasting medium. In television, wages and salaries have decreased significantly as a proportion of total expenditures. In 1962, the proportion going to labour was 37.08 per cent; this dropped rapidly during 1962, 1963, 1964 and 1965. Since 1965 the proportion has remained constant at about 28-29 per cent. The higher proportion of labour, in the early 1960s, was reduced in the late 1960s as the industry underwent technological changes (for example, increasing use of films, tapes, etc.) which have reduced the amount of manpower required by the industry.
CAPITAL COSTS
Capital's share increased significantly in both broadcasting media. In radio, capital's share increased from 21.9 per cent to 26.8 per cent. Even more striking evidence is found in television where capital's share has increased from 23.9 per cent to 34.5 per cent in the six-year period. As stated earlier, the return to capital is expressed in gross sums. The great increase in capital's share could be attributable to an increase in capital consumption or in net profit. In a subsequent analysis, it will be shown that this increase in gross returns to capital is the result of an increase in net profitability.
· . Tables 107 and 108 and Charts 18 and 19, break down costs of production by revenue
groups (for example, the under-$1 million revenue group contains the sum of the costs of all individual stations having a total operating revenue of less than $1 million).
In television broadcasting, fixed-cost inputs fall as the station grows in circulation and revenue. Costs that reflect quality improvement compose a larger proportion of total costs as the station's circulation grows. For example, the costs of films, tapes, and recordings increase significantly in proportion from 7.78 per cent for the under-$250,000 group to over 18 per cent for the $l.5 million-and-over group.
Similarly, advertising and promotional costs are a greater proportional expense in the larger-revenue classes; this, again reflects the competition in the larger revenue groups with each station offering a slightly differentiated product. The cost of labour also falls with increased revenue, with the exception of one category, $1,000,000-$1,499,999. Similarly, this pattern is followed with respect to capital consumption. It is worthy of note that the largest revenue group has a significantly high rate of return to capital. The revenue group $1,000,000 - $1,499,999 exhibits a significantly different cost and revenue structure from that of all other revenue groups. This phenomenon is explored in greater detail later.
Table 108 lists production costs for the radio industry by revenue groups. The variation in cost over the revenue group is distinctly different from that of television. In most larger metropolitan areas there is great competition among the large radio stations and usually there are two or more large stations. This competition is reflected in the kinds of increasing costs experienced by radio stations as their circulation grows. Representative commissions become an increasing larger expense, especially for the largest category. Similarly there is a significant increase in advertising and promotional costs for the large stations. For example, in Toronto the largest radio stations go to great expense to report urban traffic conditions during peak hours; there is an added expense in renting or purchasing helicopters; the promotional cost of this service is very significant.
The proportion of total costs due to wages and salaries falls significantly with an increase in circulation. Labour costs drop from 58.18 per cent to 34.10 per cent of total costs as circulation increases. On the other hand, gross return to capital increases with the size of the station.
Later in the study we undertake a more extensive examination of the returns to all factors of production in relation to questions dealing with inflation, profitability, and monopoly profit.
“QUALITY” COST VARIABLES – FILMS, TAPES, ARTISTS’ FEES
In Table 109 and Chart 20 the cost curves for several production costs have been constructed.
Cost curves have been constructed on the assumption that there is a one-to-one relationship between the size of revenue group and the size of circulation. That is, the sixteen

stations with the largest viewing audience fall into the top revenue group of $1.5 million and over. It is very possible that the one-to-one ratio may not be valid in all cases. For example, a

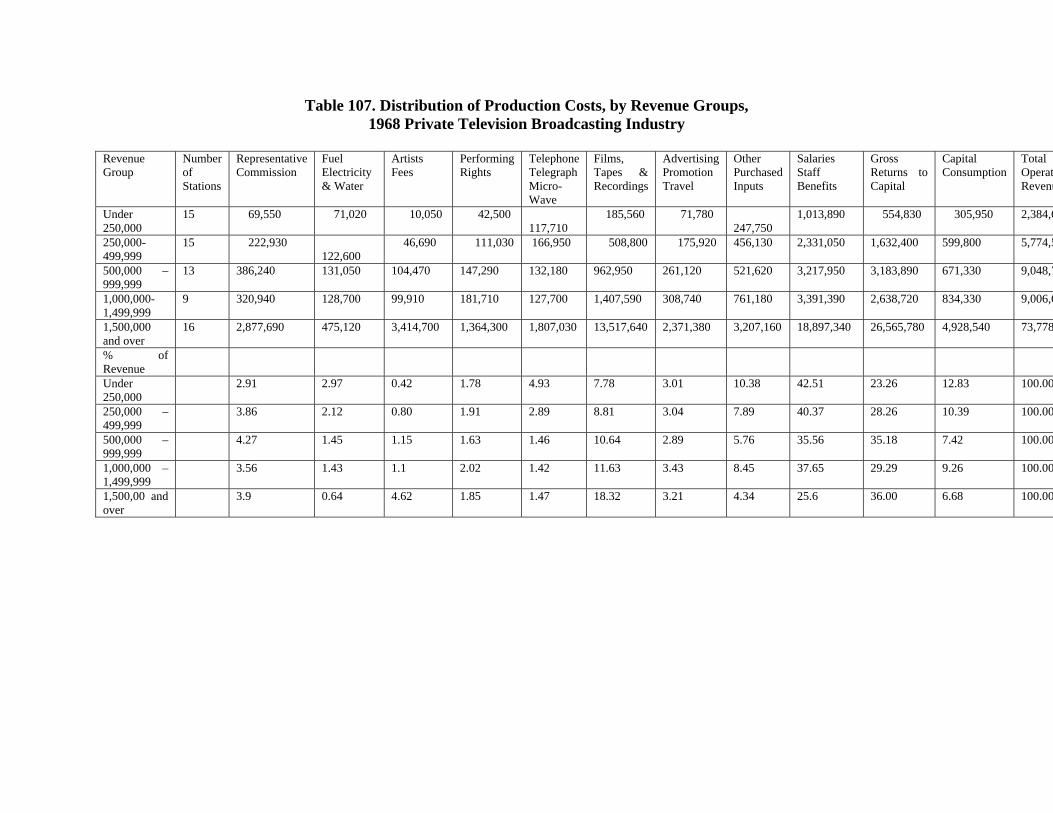
Table 107. Distribution of Production Costs, by Revenue Groups, 1968 Private Television Broadcasting Industry
Revenue Group
Number of Stations
Representative Commission
Fuel Electricity & Water
Artists Fees
Performing Rights
Telephone Telegraph Micro-Wave
Films, Tapes & Recordings
Advertising Promotion Travel
Other Purchased Inputs
Salaries Staff Benefits
Gross Returns to Capital
Capital Consumption
Total OperatRevenu
Under 250,000
15 69,550 71,020 10,050 42,500 117,710
185,560 71,780 247,750
1,013,890 554,830 305,950 2,384,6
250,000-499,999
15 222,930 122,600
46,690 111,030 166,950 508,800 175,920 456,130 2,331,050 1,632,400 599,800 5,774,5
500,000 – 999,999
13 386,240 131,050 104,470 147,290 132,180 962,950 261,120 521,620 3,217,950 3,183,890 671,330 9,048,7
1,000,000-1,499,999
9 320,940 128,700 99,910 181,710 127,700 1,407,590 308,740 761,180 3,391,390 2,638,720 834,330 9,006,6
1,500,000 and over
16 2,877,690 475,120 3,414,700 1,364,300 1,807,030 13,517,640 2,371,380 3,207,160 18,897,340 26,565,780 4,928,540 73,778
% of Revenue
Under 250,000
2.91 2.97 0.42 1.78 4.93 7.78 3.01 10.38 42.51 23.26 12.83 100.00
250,000 – 499,999
3.86 2.12 0.80 1.91 2.89 8.81 3.04 7.89 40.37 28.26 10.39 100.00
500,000 – 999,999
4.27 1.45 1.15 1.63 1.46 10.64 2.89 5.76 35.56 35.18 7.42 100.00
1,000,000 – 1,499,999
3.56 1.43 1.1 2.02 1.42 11.63 3.43 8.45 37.65 29.29 9.26 100.00
1,500,00 and over
3.9 0.64 4.62 1.85 1.47 18.32 3.21 4.34 25.6 36.00 6.68 100.00
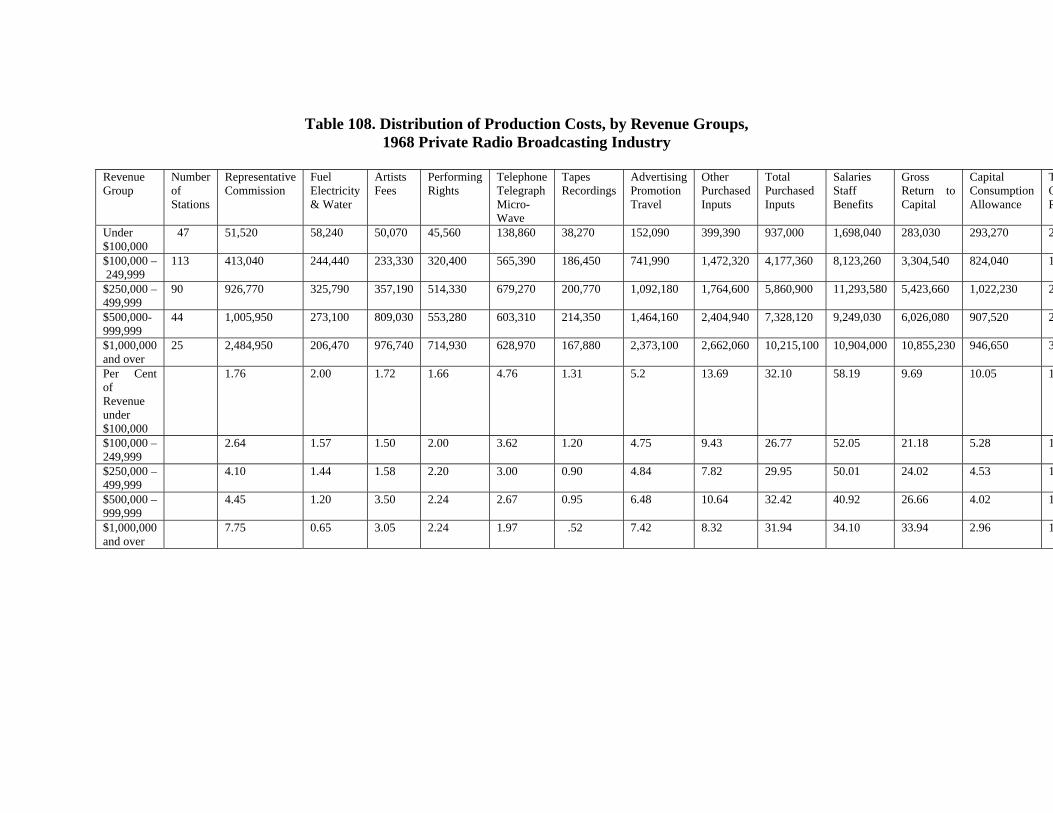
Table 108. Distribution of Production Costs, by Revenue Groups,
1968 Private Radio Broadcasting Industry
Revenue Group
Number of Stations
Representative Commission
Fuel Electricity & Water
Artists Fees
Performing Rights
Telephone Telegraph Micro-Wave
Tapes Recordings
Advertising Promotion Travel
Other Purchased Inputs
Total Purchased Inputs
Salaries Staff Benefits
Gross Return to Capital
Capital Consumption Allowance
TOR
Under $100,000
47 51,520 58,240 50,070 45,560 138,860 38,270 152,090 399,390 937,000 1,698,040 283,030 293,270 2
$100,000 – 249,999
113 413,040 244,440 233,330 320,400 565,390 186,450 741,990 1,472,320 4,177,360 8,123,260 3,304,540 824,040 1
$250,000 – 499,999
90 926,770 325,790 357,190 514,330 679,270 200,770 1,092,180 1,764,600 5,860,900 11,293,580 5,423,660 1,022,230 2
$500,000- 999,999
44 1,005,950 273,100 809,030 553,280 603,310 214,350 1,464,160 2,404,940 7,328,120 9,249,030 6,026,080 907,520 2
$1,000,000 and over
25 2,484,950 206,470 976,740 714,930 628,970 167,880 2,373,100 2,662,060 10,215,100 10,904,000 10,855,230 946,650 3
Per Cent of Revenue under $100,000
1.76 2.00 1.72 1.66 4.76 1.31 5.2 13.69 32.10 58.19 9.69 10.05 1
$100,000 – 249,999
2.64 1.57 1.50 2.00 3.62 1.20 4.75 9.43 26.77 52.05 21.18 5.28 1
$250,000 – 499,999
4.10 1.44 1.58 2.20 3.00 0.90 4.84 7.82 29.95 50.01 24.02 4.53 1
$500,000 – 999,999
4.45 1.20 3.50 2.24 2.67 0.95 6.48 10.64 32.42 40.92 26.66 4.02 1
$1,000,000 and over
7.75 0.65 3.05 2.24 1.97 .52 7.42 8.32 31.94 34.10 33.94 2.96 1
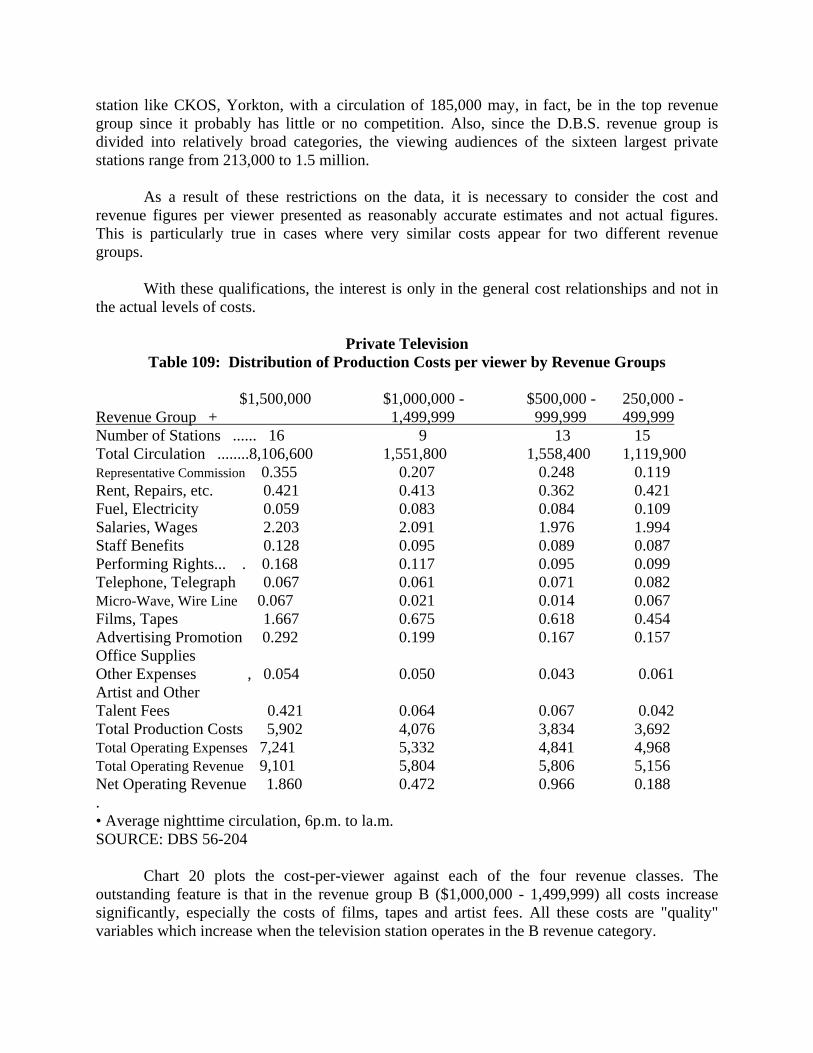
station like CKOS, Yorkton, with a circulation of 185,000 may, in fact, be in the top revenue group since it probably has little or no competition. Also, since the D.B.S. revenue group is divided into relatively broad categories, the viewing audiences of the sixteen largest private stations range from 213,000 to 1.5 million.
As a result of these restrictions on the data, it is necessary to consider the cost and revenue figures per viewer presented as reasonably accurate estimates and not actual figures. This is particularly true in cases where very similar costs appear for two different revenue groups.
With these qualifications, the interest is only in the general cost relationships and not in the actual levels of costs.
Private Television Table 109: Distribution of Production Costs per viewer by Revenue Groups
$1,500,000 $1,000,000 - $500,000 - 250,000 - Revenue Group + 1,499,999 999,999 499,999 Number of Stations ...... 16 9 13 15 Total Circulation ........8,106,600 1,551,800 1,558,400 1,119,900 Representative Commission 0.355 0.207 0.248 0.119 Rent, Repairs, etc. 0.421 0.413 0.362 0.421 Fuel, Electricity 0.059 0.083 0.084 0.109 Salaries, Wages 2.203 2.091 1.976 1.994 Staff Benefits 0.128 0.095 0.089 0.087 Performing Rights... . 0.168 0.117 0.095 0.099 Telephone, Telegraph 0.067 0.061 0.071 0.082 Micro-Wave, Wire Line 0.067 0.021 0.014 0.067 Films, Tapes 1.667 0.675 0.618 0.454 Advertising Promotion 0.292 0.199 0.167 0.157 Office Supplies Other Expenses , 0.054 0.050 0.043 0.061 Artist and Other Talent Fees 0.421 0.064 0.067 0.042 Total Production Costs 5,902 4,076 3,834 3,692 Total Operating Expenses 7,241 5,332 4,841 4,968 Total Operating Revenue 9,101 5,804 5,806 5,156 Net Operating Revenue 1.860 0.472 0.966 0.188 . • Average nighttime circulation, 6p.m. to la.m. SOURCE: DBS 56-204
Chart 20 plots the cost-per-viewer against each of the four revenue classes. The outstanding feature is that in the revenue group B ($1,000,000 - 1,499,999) all costs increase significantly, especially the costs of films, tapes and artist fees. All these costs are "quality" variables which increase when the television station operates in the B revenue category.
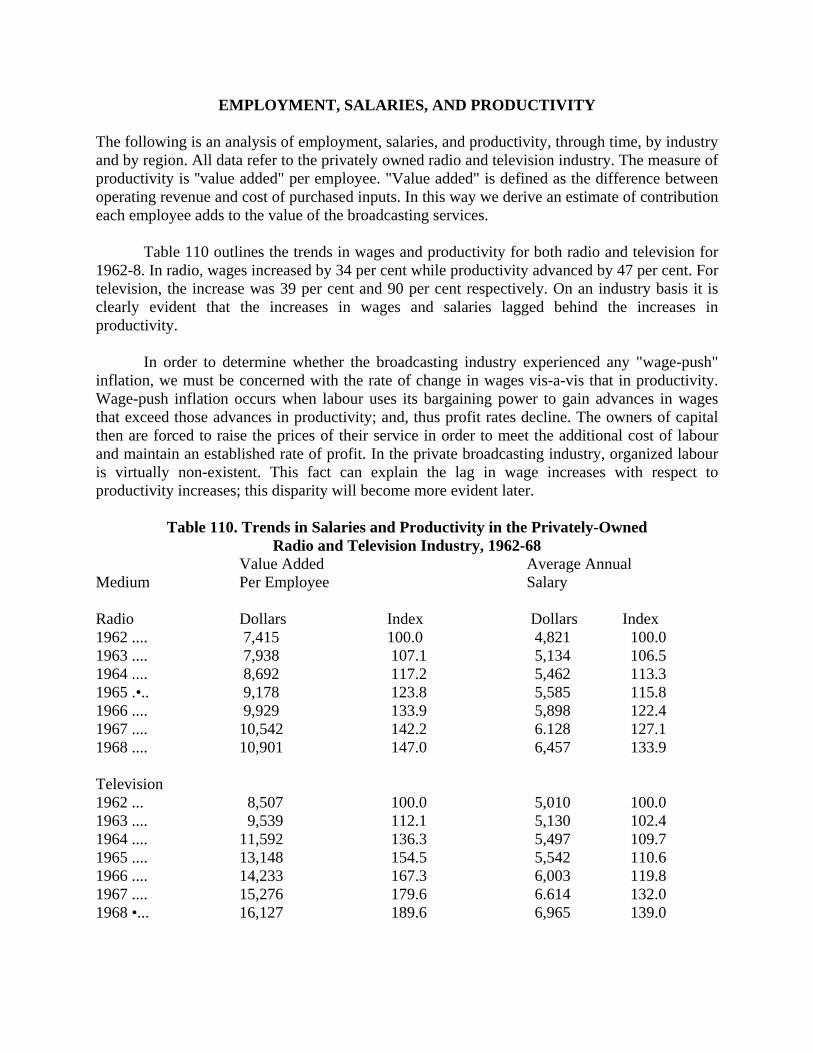
EMPLOYMENT, SALARIES, AND PRODUCTIVITY The following is an analysis of employment, salaries, and productivity, through time, by industry and by region. All data refer to the privately owned radio and television industry. The measure of productivity is ''value added" per employee. "Value added" is defined as the difference between operating revenue and cost of purchased inputs. In this way we derive an estimate of contribution each employee adds to the value of the broadcasting services.
Table 110 outlines the trends in wages and productivity for both radio and television for 1962-8. In radio, wages increased by 34 per cent while productivity advanced by 47 per cent. For television, the increase was 39 per cent and 90 per cent respectively. On an industry basis it is clearly evident that the increases in wages and salaries lagged behind the increases in productivity.
In order to determine whether the broadcasting industry experienced any "wage-push" inflation, we must be concerned with the rate of change in wages vis-a-vis that in productivity. Wage-push inflation occurs when labour uses its bargaining power to gain advances in wages that exceed those advances in productivity; and, thus profit rates decline. The owners of capital then are forced to raise the prices of their service in order to meet the additional cost of labour and maintain an established rate of profit. In the private broadcasting industry, organized labour is virtually non-existent. This fact can explain the lag in wage increases with respect to productivity increases; this disparity will become more evident later.
Table 110. Trends in Salaries and Productivity in the Privately-Owned Radio and Television Industry, 1962-68
Value Added Average Annual Medium Per Employee Salary Radio Dollars Index Dollars Index 1962 .... 7,415 100.0 4,821 100.0 1963 .... 7,938 107.1 5,134 106.5 1964 .... 8,692 117.2 5,462 113.3 1965 .•.. 9,178 123.8 5,585 115.8 1966 .... 9,929 133.9 5,898 122.4 1967 .... 10,542 142.2 6.128 127.1 1968 .... 10,901 147.0 6,457 133.9 Television 1962 ... 8,507 100.0 5,010 100.0 1963 .... 9,539 112.1 5,130 102.4 1964 .... 11,592 136.3 5,497 109.7 1965 .... 13,148 154.5 5,542 110.6 1966 .... 14,233 167.3 6,003 119.8 1967 .... 15,276 179.6 6.614 132.0 1968 •... 16,127 189.6 6,965 139.0
Charts 21 and 22 illustrate these relative rates of change over time. In radio, the rate of change in productivity is clearly greater than the rate of change in wages. For television also, from 1962-1966 productivity increased at a significantly greater rate than wages; this is evident by the widening gaps between the two series.
In 1967, wages increased a little faster than productivity indicating some pressure on profits. But in 1968 productivity outstripped wage increases.
The divergence between productivity and wages has two possible explanations. The price of capital can remain constant or fall relative to the price of labour, thus introducing the possibility of capital substitution for labour, this substitution possibly leading to greater returns to capital. Or, the industry may experience an increase in demand for its service, so that the price of the service can be increased without any loss in total revenue. The latter is called "demand-pull" inflation. A more complete discussion of inflation is undertaken in the section "Profitability."
TRENDS IN EMPLOYMENT AND SALARIES BY OCCUPATION GROUPS Table III outlines the trends in salaries by occupation group for radio and television respectively. In radio broadcasting, salaries have increased by 18 per cent from 1964 to 1968 for all employees. Sales and promotion staff tend to receive higher incomes than any other group. In addition, they have received the largest wage increases over the period. Technical operators earn the lowest salaries. In television broadcasting, salaries for all employees increased by 27 per cent over the time period. Again, sales and promotion staff are the highest paid employees and have experienced the greatest wage gains. Also, technical operators and program staff are the lowest paid employees, as in radio.
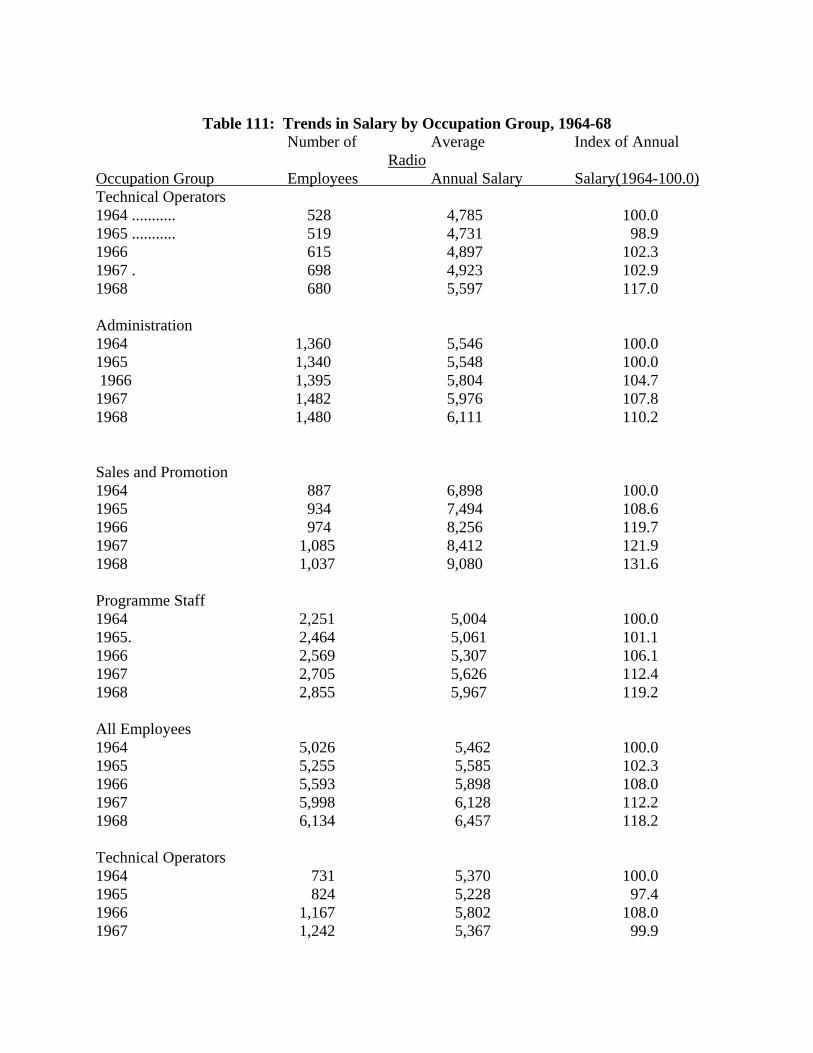
Table 111: Trends in Salary by Occupation Group, 1964-68
Number of Average Index of Annual Radio
Occupation Group Employees Annual Salary Salary(1964-100.0) Technical Operators 1964 ........... 528 4,785 100.0 1965 ........... 519 4,731 98.9 1966 615 4,897 102.3 1967 . 698 4,923 102.9 1968 680 5,597 117.0 Administration 1964 1,360 5,546 100.0 1965 1,340 5,548 100.0 1966 1,395 5,804 104.7 1967 1,482 5,976 107.8 1968 1,480 6,111 110.2 Sales and Promotion 1964 887 6,898 100.0 1965 934 7,494 108.6 1966 974 8,256 119.7 1967 1,085 8,412 121.9 1968 1,037 9,080 131.6 Programme Staff 1964 2,251 5,004 100.0 1965. 2,464 5,061 101.1 1966 2,569 5,307 106.1 1967 2,705 5,626 112.4 1968 2,855 5,967 119.2 All Employees 1964 5,026 5,462 100.0 1965 5,255 5,585 102.3 1966 5,593 5,898 108.0 1967 5,998 6,128 112.2 1968 6,134 6,457 118.2 Technical Operators 1964 731 5,370 100.0 1965 824 5,228 97.4 1966 1,167 5,802 108.0 1967 1,242 5,367 99.9
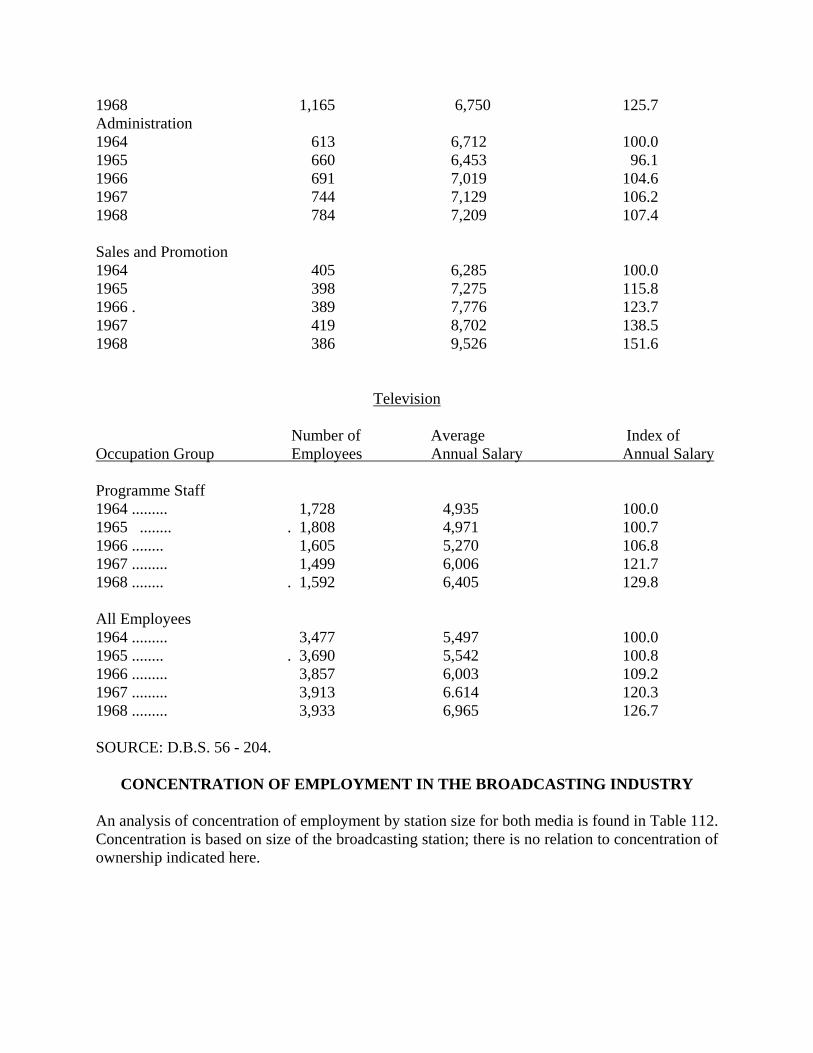
1968 1,165 6,750 125.7 Administration 1964 613 6,712 100.0 1965 660 6,453 96.1 1966 691 7,019 104.6 1967 744 7,129 106.2 1968 784 7,209 107.4 Sales and Promotion 1964 405 6,285 100.0 1965 398 7,275 115.8 1966 . 389 7,776 123.7 1967 419 8,702 138.5 1968 386 9,526 151.6
Television Number of Average Index of Occupation Group Employees Annual Salary Annual Salary Programme Staff 1964 ......... 1,728 4,935 100.0 1965 ........ . 1,808 4,971 100.7 1966 ........ 1,605 5,270 106.8 1967 ......... 1,499 6,006 121.7 1968 ........ . 1,592 6,405 129.8 All Employees 1964 ......... 3,477 5,497 100.0 1965 ........ . 3,690 5,542 100.8 1966 ......... 3,857 6,003 109.2 1967 ......... 3,913 6.614 120.3 1968 ......... 3,933 6,965 126.7 SOURCE: D.B.S. 56 - 204.
CONCENTRATION OF EMPLOYMENT IN THE BROADCASTING INDUSTRY An analysis of concentration of employment by station size for both media is found in Table 112. Concentration is based on size of the broadcasting station; there is no relation to concentration of ownership indicated here.

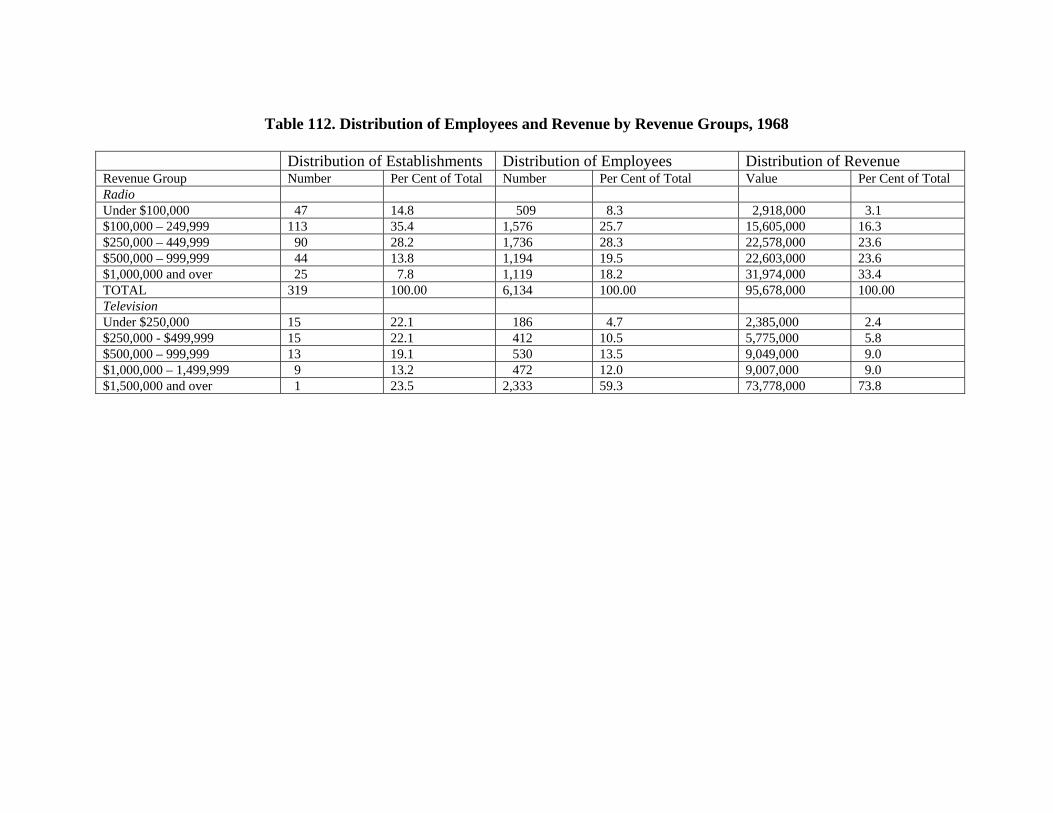
Table 112. Distribution of Employees and Revenue by Revenue Groups, 1968
Distribution of Establishments Distribution of Employees Distribution of Revenue Revenue Group Number Per Cent of Total Number Per Cent of Total Value Per Cent of Total Radio Under $100,000 47 14.8 509 8.3 2,918,000 3.1 $100,000 – 249,999 113 35.4 1,576 25.7 15,605,000 16.3 $250,000 – 449,999 90 28.2 1,736 28.3 22,578,000 23.6 $500,000 – 999,999 44 13.8 1,194 19.5 22,603,000 23.6 $1,000,000 and over 25 7.8 1,119 18.2 31,974,000 33.4 TOTAL 319 100.00 6,134 100.00 95,678,000 100.00 Television Under $250,000 15 22.1 186 4.7 2,385,000 2.4 $250,000 - $499,999 15 22.1 412 10.5 5,775,000 5.8 $500,000 – 999,999 13 19.1 530 13.5 9,049,000 9.0 $1,000,000 – 1,499,999 9 13.2 472 12.0 9,007,000 9.0 $1,500,000 and over 1 23.5 2,333 59.3 73,778,000 73.8
The smallest group, in radio, with 14.8 per cent of the radio stations has 8.3 per cent of the employees and earns 3.1 per cent of the total industry revenue. At the other end of the scale, 7.8 per cent of the total stations earned over $1 million, employed 18.2 per cent of all employees and earned 33.4 per cent of total industry revenues. There is a similar relationship in television broadcasting. Stations with revenues over $1.5 million had 59.3 per cent of employees and 73.8 per cent of total revenue.
If we make a graph of the distribution of employees and the distribution of revenues both against the station size, we come up with evidence indicating the existence of economies of large scale production. This is illustrated in Chart 23. The graph indicates the degree to which circulation (revenue size) leads to differences in employment and revenue. Furthermore, the graph points out the revenue generating potential of an employee as the size of the station's circulation increases. This is evident by the fact that the largest revenue group, which earns 74 per cent of total revenues, requires only 59 per cent of the total number of employees; similarly, in the lowest income groups, 4.7 per cent of total employees accounted for only 2.4 per cent of total industry revenues.
WAGES AND PRODUCTIVITY BY STATION SIZE
Table 113 shows a breakdown of salaries and productivity by revenue groups for 1968.
In both media the larger the station size, the greater the annual salary. Significantly, the spreads in salaries and productivity are higher in radio than in television.
These charts require further explanation. The average for the individual industry is 100.0; and, the average for each revenue group is determined in relationship to the industry average. For example, the revenue groups which have an index below 100.0 have, on average, lower wages and productivity than the industry average.
To interpret the graph it is necessary to consider the rate of change of each curve, not the absolute level. (The fact that the level of wages is above that of productivity in television and the reverse in radio is of no consequence since we are dealing with an index of relative measure.)
In radio, the rate of change of wages equals that of productivity in the lower three categories. However, in the $500,000-$1,000,000 and $l,000,000-plus revenue groups, changes in wages lag behind changes in productivity. This indicates an increasing return to capital as the stations increase their total revenue.
When we look at these trends in television, it is evident that wages and productivity move very closely together. That is, increased productivity is proportionally met by increased wages. It should be noted that this parallel movement in television is for 1968 only. As we pointed out earlier, the increase of productivity in television has significantly exceeded the increase in wages within the industry between 1962 and 1968.

In both media there is an outstanding increase in productivity as the station grows in size. This suggests the existence of economies of scale. The hypothesis that both media exhibit cost economies characteristic of a "natural monopoly" industry is explored in greater detail.

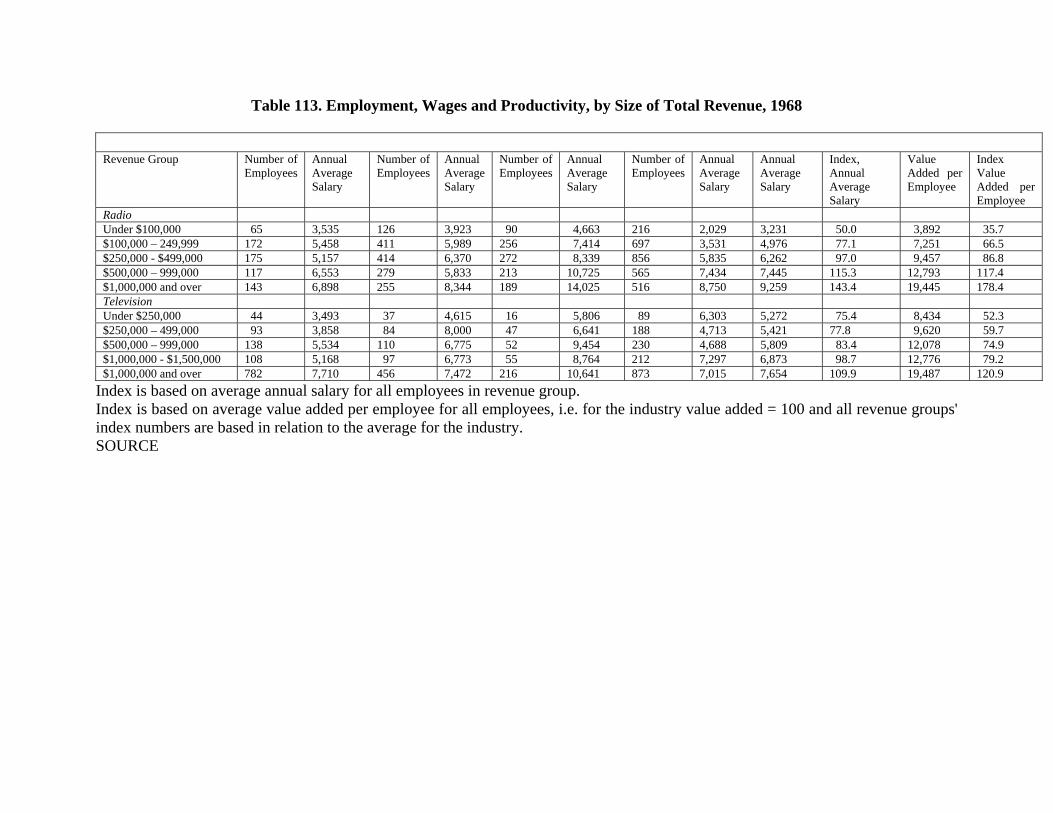
Table 113. Employment, Wages and Productivity, by Size of Total Revenue, 1968
Revenue Group Number of
Employees Annual Average Salary
Number of Employees
Annual Average Salary
Number of Employees
Annual Average Salary
Number of Employees
Annual Average Salary
Annual Average Salary
Index, Annual Average Salary
Value Added per Employee
Index Value Added per Employee
Radio Under $100,000 65 3,535 126 3,923 90 4,663 216 2,029 3,231 50.0 3,892 35.7 $100,000 – 249,999 172 5,458 411 5,989 256 7,414 697 3,531 4,976 77.1 7,251 66.5 $250,000 - $499,000 175 5,157 414 6,370 272 8,339 856 5,835 6,262 97.0 9,457 86.8 $500,000 – 999,000 117 6,553 279 5,833 213 10,725 565 7,434 7,445 115.3 12,793 117.4 $1,000,000 and over 143 6,898 255 8,344 189 14,025 516 8,750 9,259 143.4 19,445 178.4 Television Under $250,000 44 3,493 37 4,615 16 5,806 89 6,303 5,272 75.4 8,434 52.3 $250,000 – 499,000 93 3,858 84 8,000 47 6,641 188 4,713 5,421 77.8 9,620 59.7 $500,000 – 999,000 138 5,534 110 6,775 52 9,454 230 4,688 5,809 83.4 12,078 74.9 $1,000,000 - $1,500,000 108 5,168 97 6,773 55 8,764 212 7,297 6,873 98.7 12,776 79.2 $1,000,000 and over 782 7,710 456 7,472 216 10,641 873 7,015 7,654 109.9 19,487 120.9
Index is based on average annual salary for all employees in revenue group. Index is based on average value added per employee for all employees, i.e. for the industry value added = 100 and all revenue groups' index numbers are based in relation to the average for the industry. SOURCE

S: Radio and Television Broadcasting D.B.S. 56-204, 1968 Unpublished D.B.S. Statistics.
WAGES AND PRODUCTIVITY BY REGION
The data in Table 114 provides a breakdown of wages and productivity by region.
Overall in both media, the Atlantic region had the lowest annual salaries in 1968. In television, only Ontario and British
Columbia have salary levels above the national average. In radio, Quebec Ontario and Manitoba have above-average salaries These patterns are true for most types of occupations.
The regional disparity can be explained by the regional disparity in productivity (see "value added" for all employees in Tables 113 and 114). The productivity is positively correlated with the size of the population in each province. Economies of scale exist in areas with larger population. Thus the variation in productivity can be explained, first, by the variations in economies of scale and, second, by regional disparity in the general wage level throughout the nation.
While the figures are drawn from D.B.S. data, some of those relating to television appear open to some question. For example, the average annual wage for sales and promotion and for program staff in the Atlantic Region are shown as being higher than in other parts of Canada, which appears to be out of line with general wage levels in the Atlantic area and the level of productivity of the industry located there.

Table 114. Employment, Wages and Productivity by Region
Atlantic Region Quebec Ontario Sask., Man. Alberta B.C. Canada TELEVISION Technical Operator Number of Employees 91 416 490 75 51 42 1,165 Annual Average Wage 4,718 6,603 7,373 5,919 6,975 6,905 6,750 Salary Index 69.9 97.8 109.2 87.7 103.3 102.3 100 Administration Number of Employees 89 210 271 79 91 44 784 Annual Average Wage 4,032 6,024 8,862 6,779 8,026 8,379 7,209 Salary Index 55.9 83.6 122.9 94.0 111.3 116.2 100 Sales and Promotion Number of Employees 28 70 159 43 61 25 386 Annual Average Wage 13,335 7,876 9,824 10,519 7,400 11,462 9,526 Salary Index 140 82.7 103.1 110.4 77.7 120.3 100.0 Programme Staff Number of Employees 122 438 521 222 172 117 1,592 Annual Average Wage 7,609 6,880 6,873 5,122 5,074 5,676 6,406 Salary Index 118.8 107.4 107.3 80 79.2 88.6 100.00 All Employees Number of Stations 10 13 17 14 7 7 68 Number of Employees 330 1,134 1,441 425 375 228 3,933 Annual Average Salary 6,308 6,681 7,743 6,020 6,427 7,060 6,965 Index 90.6 95.9 111.2 86.4 92.3 101.4 100.00 Value Added per Employee 12,181 17,204 17,833 12,953 13,907 15,212 16,127 Index 75.5 106.7 110.6 80.3 86.2 94.3 100.00
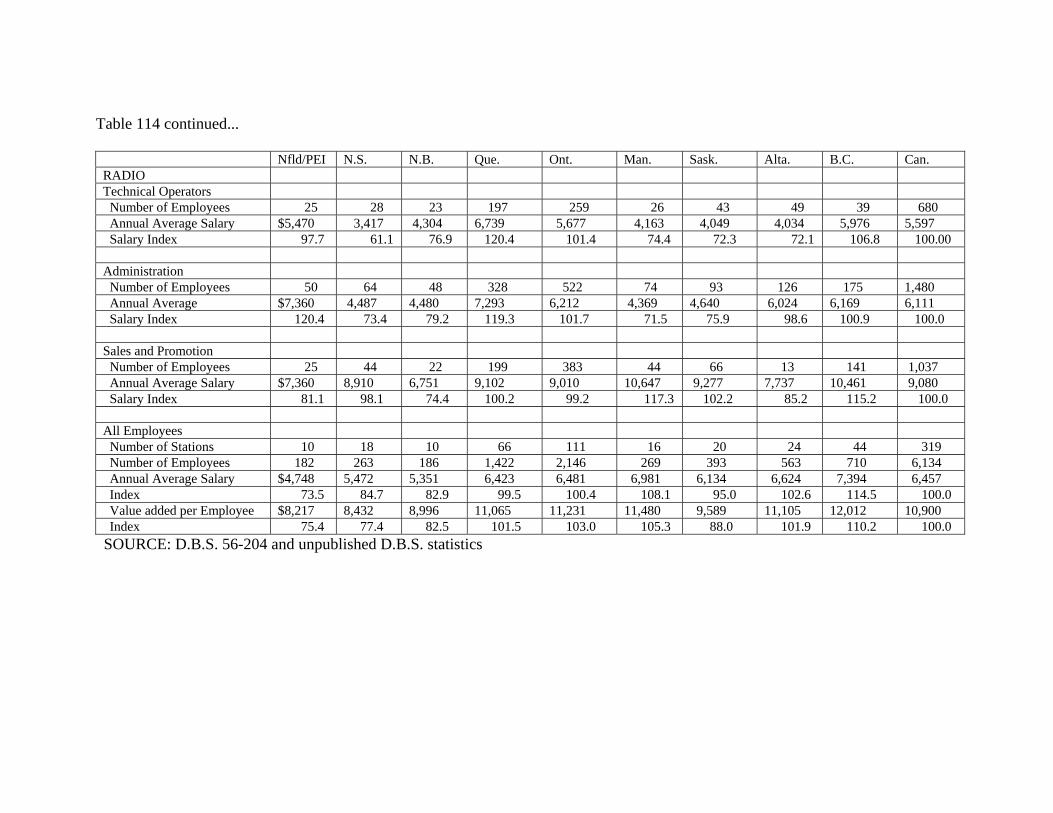
Table 114 continued...
Nfld/PEI N.S. N.B. Que. Ont. Man. Sask. Alta. B.C. Can. RADIO Technical Operators Number of Employees 25 28 23 197 259 26 43 49 39 680 Annual Average Salary $5,470 3,417 4,304 6,739 5,677 4,163 4,049 4,034 5,976 5,597 Salary Index 97.7 61.1 76.9 120.4 101.4 74.4 72.3 72.1 106.8 100.00 Administration Number of Employees 50 64 48 328 522 74 93 126 175 1,480 Annual Average $7,360 4,487 4,480 7,293 6,212 4,369 4,640 6,024 6,169 6,111 Salary Index 120.4 73.4 79.2 119.3 101.7 71.5 75.9 98.6 100.9 100.0 Sales and Promotion Number of Employees 25 44 22 199 383 44 66 13 141 1,037 Annual Average Salary $7,360 8,910 6,751 9,102 9,010 10,647 9,277 7,737 10,461 9,080 Salary Index 81.1 98.1 74.4 100.2 99.2 117.3 102.2 85.2 115.2 100.0 All Employees Number of Stations 10 18 10 66 111 16 20 24 44 319 Number of Employees 182 263 186 1,422 2,146 269 393 563 710 6,134 Annual Average Salary $4,748 5,472 5,351 6,423 6,481 6,981 6,134 6,624 7,394 6,457 Index 73.5 84.7 82.9 99.5 100.4 108.1 95.0 102.6 114.5 100.0 Value added per Employee $8,217 8,432 8,996 11,065 11,231 11,480 9,589 11,105 12,012 10,900 Index 75.4 77.4 82.5 101.5 103.0 105.3 88.0 101.9 110.2 100.0
SOURCE: D.B.S. 56-204 and unpublished D.B.S. statistics
Chapter 4:
PROFITABILITY Tables 115 to 123 contain operating revenue, operating expense and balance sheet data for the Canadian private broadcasting sector for the five year period 1964 to 1968. With the exception of property accounts, the data have been aggregated on the basis of three different types of broadcasting units: first, privately-owned radio stations operated by companies which do not operate television stations; second, privately-owned television stations operated by companies which do not operate radio stations; and, third, privately-owned radio and television stations which are operated jointly by the same company (and which therefore have consolidated balance sheets for the radio and television operations).
The emphasis in this section will be on the profitability of broadcasting operations falling in these three different categories. The tables also contain detailed information on operating revenues and expenses. With the exception of the third type above, the data have been tabulated by revenue groups. It was not possible, in the time available, to assemble the data for radio and television stations operated jointly by the same company on a revenue group basis.
The data contained in these tables are the result of a special tabulation undertaken by the C.R.T.C. and D.B.S.
Table 124 contains calculations of profit rates for broadcasters from 1964 to 1968. Three profit measures have been used. The first is net operating revenue as a percentage of total operating revenue.
This measure is not particularly meaningful in absolute terms, but does act as a useful indicator of year-to-year changes in revenues relative to expenses. The second measure is before-tax profits as a percent of equity. This indicates the percentage return accruing to shareholder equity in broadcasting enterprises. The third measure, before-tax return on assets, gives returns (including interest) as a percentage of total assets in the enterprises.
One of the most striking features of this table is the high degree of year-to-year instability in most of the profit rates. Notable exceptions are the rates for the aggregate of all radio stations operating independently of television stations. All three profit measures for these stations have shown a relatively stable upward trend over the period.

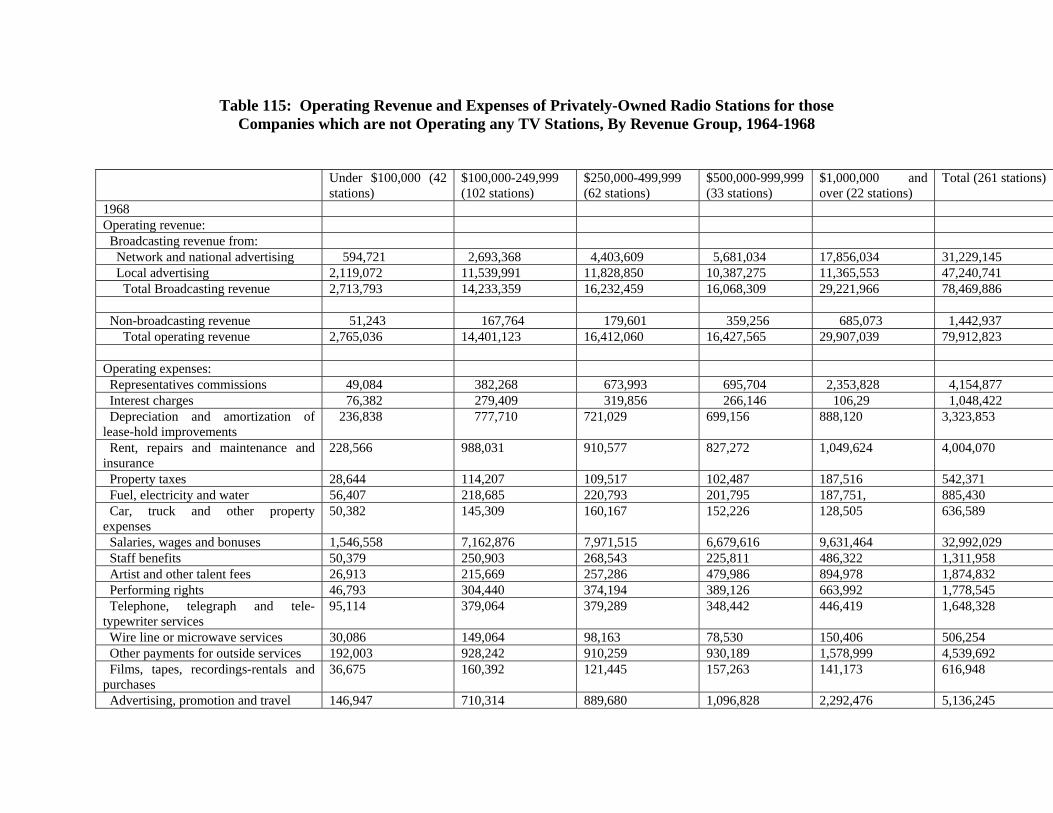
Table 115: Operating Revenue and Expenses of Privately-Owned Radio Stations for those Companies which are not Operating any TV Stations, By Revenue Group, 1964-1968
Under $100,000 (42 stations)
$100,000-249,999 (102 stations)
$250,000-499,999 (62 stations)
$500,000-999,999 (33 stations)
$1,000,000 and over (22 stations)
Total (261 stations)
1968 Operating revenue: Broadcasting revenue from: Network and national advertising 594,721 2,693,368 4,403,609 5,681,034 17,856,034 31,229,145 Local advertising 2,119,072 11,539,991 11,828,850 10,387,275 11,365,553 47,240,741 Total Broadcasting revenue 2,713,793 14,233,359 16,232,459 16,068,309 29,221,966 78,469,886 Non-broadcasting revenue 51,243 167,764 179,601 359,256 685,073 1,442,937 Total operating revenue 2,765,036 14,401,123 16,412,060 16,427,565 29,907,039 79,912,823 Operating expenses: Representatives commissions 49,084 382,268 673,993 695,704 2,353,828 4,154,877 Interest charges 76,382 279,409 319,856 266,146 106,29 1,048,422 Depreciation and amortization of lease-hold improvements
236,838 777,710 721,029 699,156 888,120 3,323,853
Rent, repairs and maintenance and insurance
228,566 988,031 910,577 827,272 1,049,624 4,004,070
Property taxes 28,644 114,207 109,517 102,487 187,516 542,371 Fuel, electricity and water 56,407 218,685 220,793 201,795 187,751, 885,430 Car, truck and other property expenses
50,382 145,309 160,167 152,226 128,505 636,589
Salaries, wages and bonuses 1,546,558 7,162,876 7,971,515 6,679,616 9,631,464 32,992,029 Staff benefits 50,379 250,903 268,543 225,811 486,322 1,311,958 Artist and other talent fees 26,913 215,669 257,286 479,986 894,978 1,874,832 Performing rights 46,793 304,440 374,194 389,126 663,992 1,778,545 Telephone, telegraph and tele-typewriter services
95,114 379,064 379,289 348,442 446,419 1,648,328
Wire line or microwave services 30,086 149,064 98,163 78,530 150,406 506,254 Other payments for outside services 192,003 928,242 910,259 930,189 1,578,999 4,539,692 Films, tapes, recordings-rentals and purchases
36,675 160,392 121,445 157,263 141,173 616,948
Advertising, promotion and travel 146,947 710,314 889,680 1,096,828 2,292,476 5,136,245
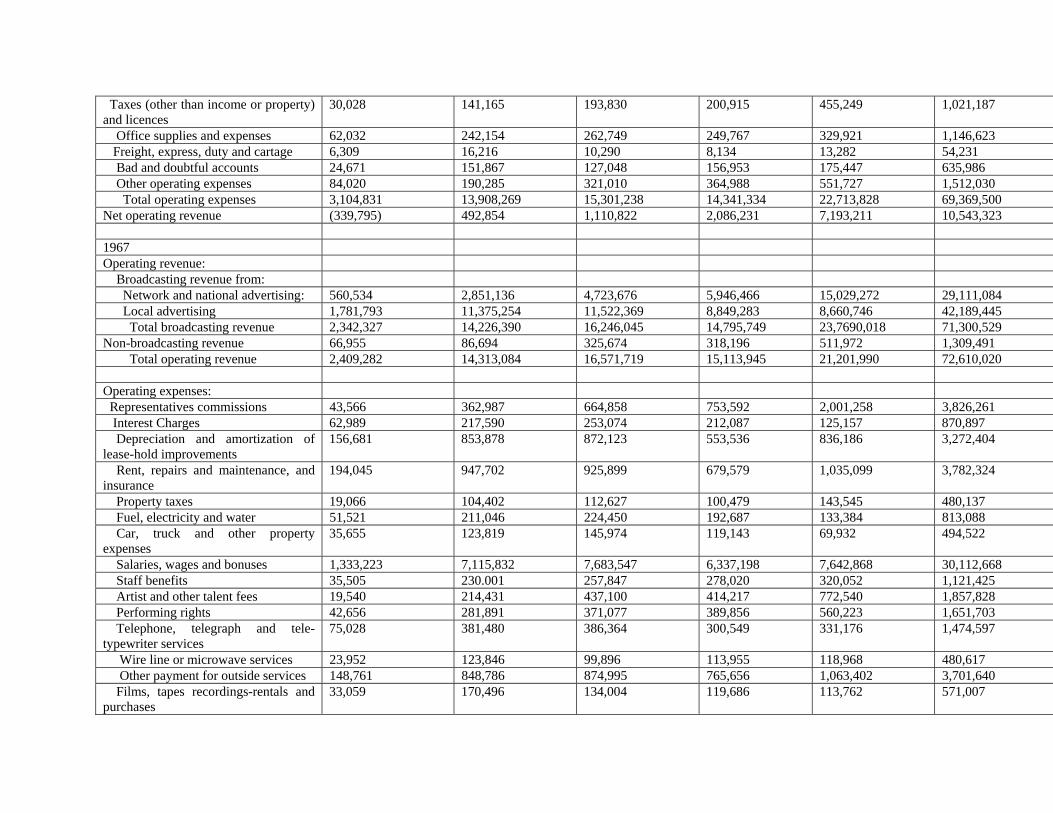
Taxes (other than income or property) and licences
30,028 141,165 193,830 200,915 455,249 1,021,187
Office supplies and expenses 62,032 242,154 262,749 249,767 329,921 1,146,623 Freight, express, duty and cartage 6,309 16,216 10,290 8,134 13,282 54,231 Bad and doubtful accounts 24,671 151,867 127,048 156,953 175,447 635,986 Other operating expenses 84,020 190,285 321,010 364,988 551,727 1,512,030 Total operating expenses 3,104,831 13,908,269 15,301,238 14,341,334 22,713,828 69,369,500 Net operating revenue (339,795) 492,854 1,110,822 2,086,231 7,193,211 10,543,323 1967 Operating revenue: Broadcasting revenue from: Network and national advertising: 560,534 2,851,136 4,723,676 5,946,466 15,029,272 29,111,084 Local advertising 1,781,793 11,375,254 11,522,369 8,849,283 8,660,746 42,189,445 Total broadcasting revenue 2,342,327 14,226,390 16,246,045 14,795,749 23,7690,018 71,300,529 Non-broadcasting revenue 66,955 86,694 325,674 318,196 511,972 1,309,491 Total operating revenue 2,409,282 14,313,084 16,571,719 15,113,945 21,201,990 72,610,020 Operating expenses: Representatives commissions 43,566 362,987 664,858 753,592 2,001,258 3,826,261 Interest Charges 62,989 217,590 253,074 212,087 125,157 870,897 Depreciation and amortization of lease-hold improvements
156,681 853,878 872,123 553,536 836,186 3,272,404
Rent, repairs and maintenance, and insurance
194,045 947,702 925,899 679,579 1,035,099 3,782,324
Property taxes 19,066 104,402 112,627 100,479 143,545 480,137 Fuel, electricity and water 51,521 211,046 224,450 192,687 133,384 813,088 Car, truck and other property expenses
35,655 123,819 145,974 119,143 69,932 494,522
Salaries, wages and bonuses 1,333,223 7,115,832 7,683,547 6,337,198 7,642,868 30,112,668 Staff benefits 35,505 230.001 257,847 278,020 320,052 1,121,425 Artist and other talent fees 19,540 214,431 437,100 414,217 772,540 1,857,828 Performing rights 42,656 281,891 371,077 389,856 560,223 1,651,703 Telephone, telegraph and tele-typewriter services
75,028 381,480 386,364 300,549 331,176 1,474,597
Wire line or microwave services 23,952 123,846 99,896 113,955 118,968 480,617 Other payment for outside services 148,761 848,786 874,995 765,656 1,063,402 3,701,640 Films, tapes recordings-rentals and purchases
33,059 170,496 134,004 119,686 113,762 571,007
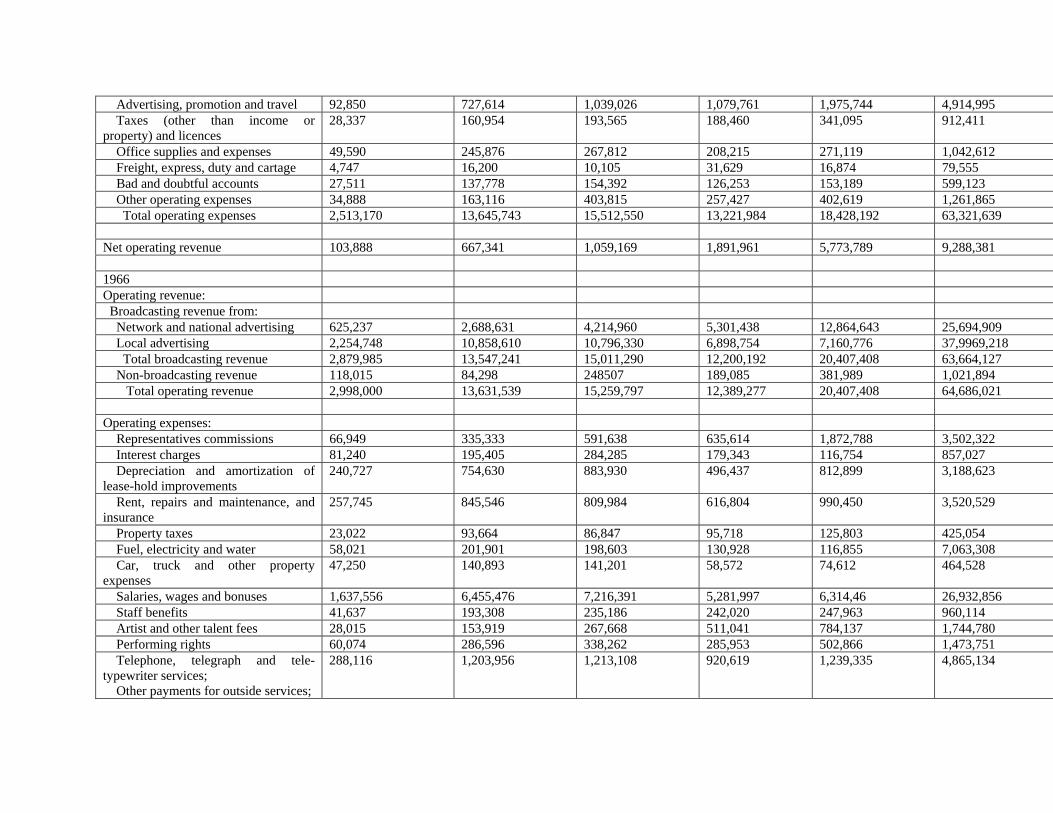
Advertising, promotion and travel 92,850 727,614 1,039,026 1,079,761 1,975,744 4,914,995 Taxes (other than income or property) and licences
28,337 160,954 193,565 188,460 341,095 912,411
Office supplies and expenses 49,590 245,876 267,812 208,215 271,119 1,042,612 Freight, express, duty and cartage 4,747 16,200 10,105 31,629 16,874 79,555 Bad and doubtful accounts 27,511 137,778 154,392 126,253 153,189 599,123 Other operating expenses 34,888 163,116 403,815 257,427 402,619 1,261,865 Total operating expenses 2,513,170 13,645,743 15,512,550 13,221,984 18,428,192 63,321,639 Net operating revenue 103,888 667,341 1,059,169 1,891,961 5,773,789 9,288,381 1966 Operating revenue: Broadcasting revenue from: Network and national advertising 625,237 2,688,631 4,214,960 5,301,438 12,864,643 25,694,909 Local advertising 2,254,748 10,858,610 10,796,330 6,898,754 7,160,776 37,9969,218 Total broadcasting revenue 2,879,985 13,547,241 15,011,290 12,200,192 20,407,408 63,664,127 Non-broadcasting revenue 118,015 84,298 248507 189,085 381,989 1,021,894 Total operating revenue 2,998,000 13,631,539 15,259,797 12,389,277 20,407,408 64,686,021 Operating expenses: Representatives commissions 66,949 335,333 591,638 635,614 1,872,788 3,502,322 Interest charges 81,240 195,405 284,285 179,343 116,754 857,027 Depreciation and amortization of lease-hold improvements
240,727 754,630 883,930 496,437 812,899 3,188,623
Rent, repairs and maintenance, and insurance
257,745 845,546 809,984 616,804 990,450 3,520,529
Property taxes 23,022 93,664 86,847 95,718 125,803 425,054 Fuel, electricity and water 58,021 201,901 198,603 130,928 116,855 7,063,308 Car, truck and other property expenses
47,250 140,893 141,201 58,572 74,612 464,528
Salaries, wages and bonuses 1,637,556 6,455,476 7,216,391 5,281,997 6,314,46 26,932,856 Staff benefits 41,637 193,308 235,186 242,020 247,963 960,114 Artist and other talent fees 28,015 153,919 267,668 511,041 784,137 1,744,780 Performing rights 60,074 286,596 338,262 285,953 502,866 1,473,751 Telephone, telegraph and tele-typewriter services; Other payments for outside services;
288,116 1,203,956 1,213,108 920,619 1,239,335 4,865,134
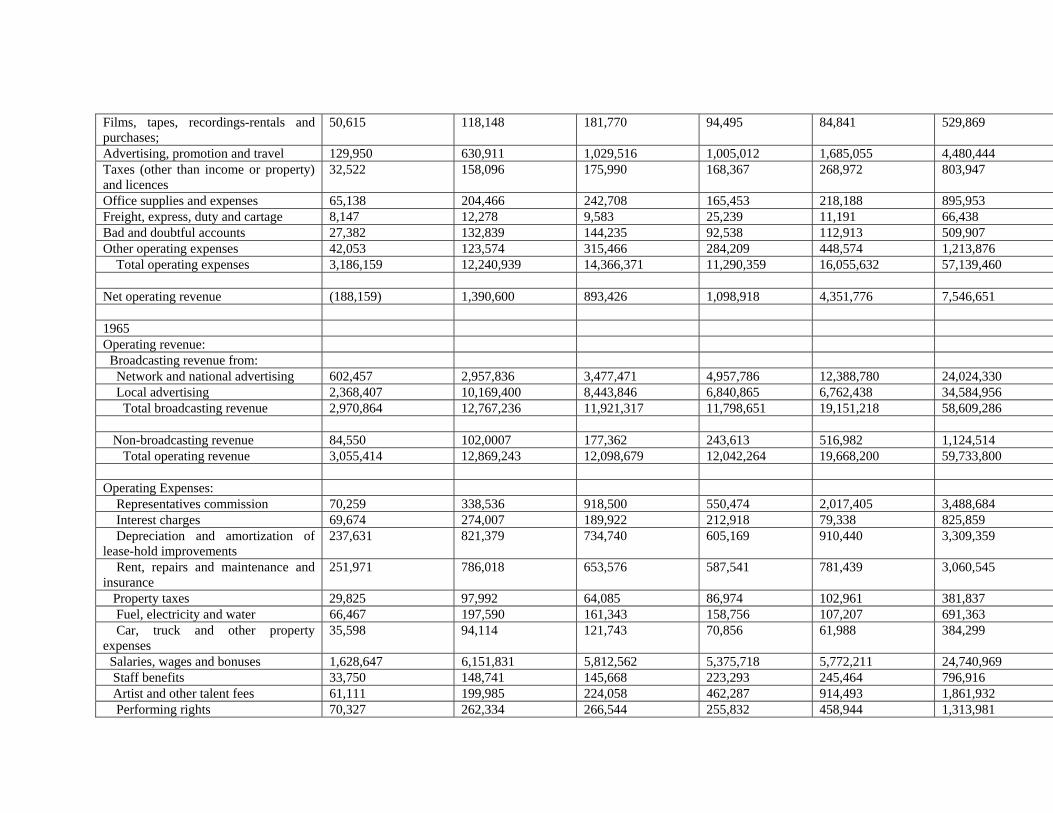
Films, tapes, recordings-rentals and purchases;
50,615 118,148 181,770 94,495 84,841 529,869
Advertising, promotion and travel 129,950 630,911 1,029,516 1,005,012 1,685,055 4,480,444 Taxes (other than income or property) and licences
32,522 158,096 175,990 168,367 268,972 803,947
Office supplies and expenses 65,138 204,466 242,708 165,453 218,188 895,953 Freight, express, duty and cartage 8,147 12,278 9,583 25,239 11,191 66,438 Bad and doubtful accounts 27,382 132,839 144,235 92,538 112,913 509,907 Other operating expenses 42,053 123,574 315,466 284,209 448,574 1,213,876 Total operating expenses 3,186,159 12,240,939 14,366,371 11,290,359 16,055,632 57,139,460 Net operating revenue (188,159) 1,390,600 893,426 1,098,918 4,351,776 7,546,651 1965 Operating revenue: Broadcasting revenue from: Network and national advertising 602,457 2,957,836 3,477,471 4,957,786 12,388,780 24,024,330 Local advertising 2,368,407 10,169,400 8,443,846 6,840,865 6,762,438 34,584,956 Total broadcasting revenue 2,970,864 12,767,236 11,921,317 11,798,651 19,151,218 58,609,286 Non-broadcasting revenue 84,550 102,0007 177,362 243,613 516,982 1,124,514 Total operating revenue 3,055,414 12,869,243 12,098,679 12,042,264 19,668,200 59,733,800 Operating Expenses: Representatives commission 70,259 338,536 918,500 550,474 2,017,405 3,488,684 Interest charges 69,674 274,007 189,922 212,918 79,338 825,859 Depreciation and amortization of lease-hold improvements
237,631 821,379 734,740 605,169 910,440 3,309,359
Rent, repairs and maintenance and insurance
251,971 786,018 653,576 587,541 781,439 3,060,545
Property taxes 29,825 97,992 64,085 86,974 102,961 381,837 Fuel, electricity and water 66,467 197,590 161,343 158,756 107,207 691,363 Car, truck and other property expenses
35,598 94,114 121,743 70,856 61,988 384,299
Salaries, wages and bonuses 1,628,647 6,151,831 5,812,562 5,375,718 5,772,211 24,740,969 Staff benefits 33,750 148,741 145,668 223,293 245,464 796,916 Artist and other talent fees 61,111 199,985 224,058 462,287 914,493 1,861,932 Performing rights 70,327 262,334 266,544 255,832 458,944 1,313,981
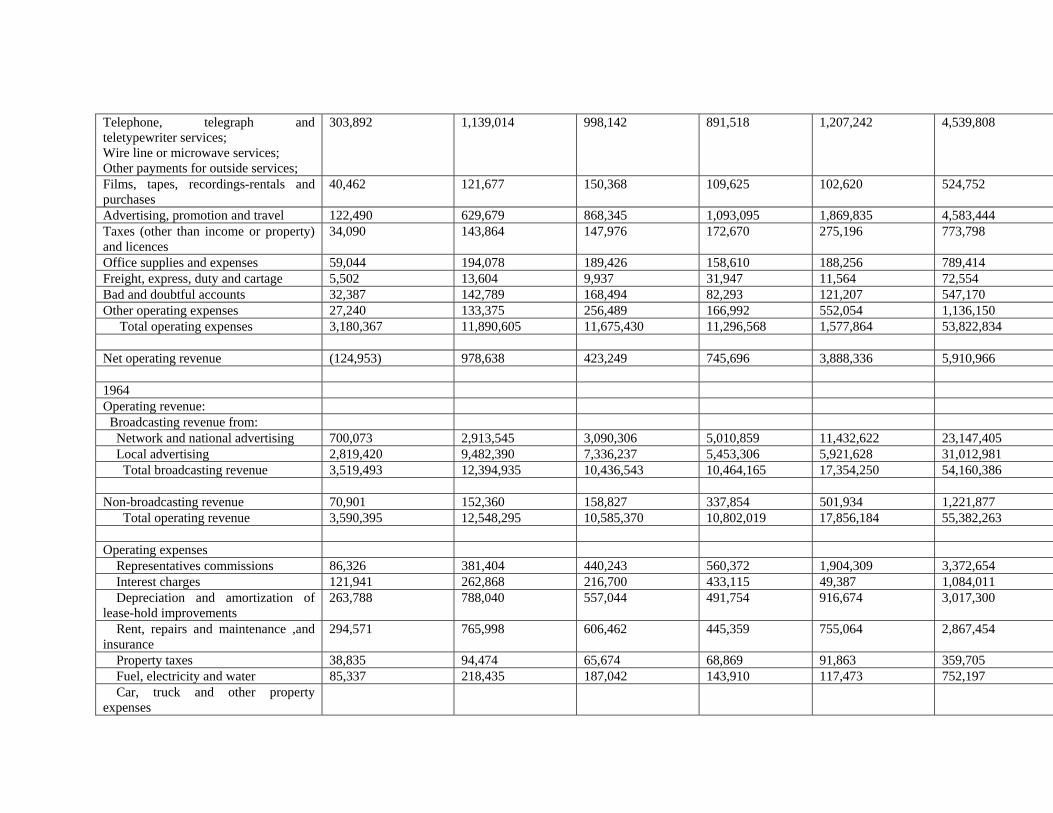
Telephone, telegraph and teletypewriter services; Wire line or microwave services; Other payments for outside services;
303,892 1,139,014 998,142 891,518 1,207,242 4,539,808
Films, tapes, recordings-rentals and purchases
40,462 121,677 150,368 109,625 102,620 524,752
Advertising, promotion and travel 122,490 629,679 868,345 1,093,095 1,869,835 4,583,444 Taxes (other than income or property) and licences
34,090 143,864 147,976 172,670 275,196 773,798
Office supplies and expenses 59,044 194,078 189,426 158,610 188,256 789,414 Freight, express, duty and cartage 5,502 13,604 9,937 31,947 11,564 72,554 Bad and doubtful accounts 32,387 142,789 168,494 82,293 121,207 547,170 Other operating expenses 27,240 133,375 256,489 166,992 552,054 1,136,150 Total operating expenses 3,180,367 11,890,605 11,675,430 11,296,568 1,577,864 53,822,834 Net operating revenue (124,953) 978,638 423,249 745,696 3,888,336 5,910,966 1964 Operating revenue: Broadcasting revenue from: Network and national advertising 700,073 2,913,545 3,090,306 5,010,859 11,432,622 23,147,405 Local advertising 2,819,420 9,482,390 7,336,237 5,453,306 5,921,628 31,012,981 Total broadcasting revenue 3,519,493 12,394,935 10,436,543 10,464,165 17,354,250 54,160,386 Non-broadcasting revenue 70,901 152,360 158,827 337,854 501,934 1,221,877 Total operating revenue 3,590,395 12,548,295 10,585,370 10,802,019 17,856,184 55,382,263 Operating expenses Representatives commissions 86,326 381,404 440,243 560,372 1,904,309 3,372,654 Interest charges 121,941 262,868 216,700 433,115 49,387 1,084,011 Depreciation and amortization of lease-hold improvements
263,788 788,040 557,044 491,754 916,674 3,017,300
Rent, repairs and maintenance ,and insurance
294,571 765,998 606,462 445,359 755,064 2,867,454
Property taxes 38,835 94,474 65,674 68,869 91,863 359,705 Fuel, electricity and water 85,337 218,435 187,042 143,910 117,473 752,197 Car, truck and other property expenses

Salaries, wages and bonuses 1,920,784 6,009,539 5,151,234 4,362,235 5,619,546 23,063,338 Staff Benefits 36681 145,621 121,875 126,703 197,475 628,355 Artist and other talent fees 55,373 219,366 211,910 312,2220 1,111,969 1,910,838 Performing rights 73,388 253,516 262,144 241,519 417,123 1,247,690 Telephone, telegraph and teletypewriter services; Other payments for outside services
348,213 1,079,831 722,614 877,433 1,054,324 4,082,415
Films, tapes, recording-rentals and purchases;
46,603 107,661 111,457 96,527 110,587 472,837
Advertising, promotion and travel 170,455 656,107 782,777 859,630 1,658,068 4,126,947 Taxes (other than income or property) and licences
43,448 171,707 111,648 154,097 239,40 720,309
Office supplies and expenses 109,400 383,648 292,622 202,682 347,985 1,336,337 Freight, express duty and cartage Bad and doubtful accounts Other operating expenses 55,685 232,120 159,317 235,643 404,448 1,087,263 Total operating expenses 3,750,818 11,770,295 10,000,763 9,612,070 14,995,704 50,129,650 Net operating revenue (160,423) 778,000 584,607 1,189,949 2,860,480 5,252,613
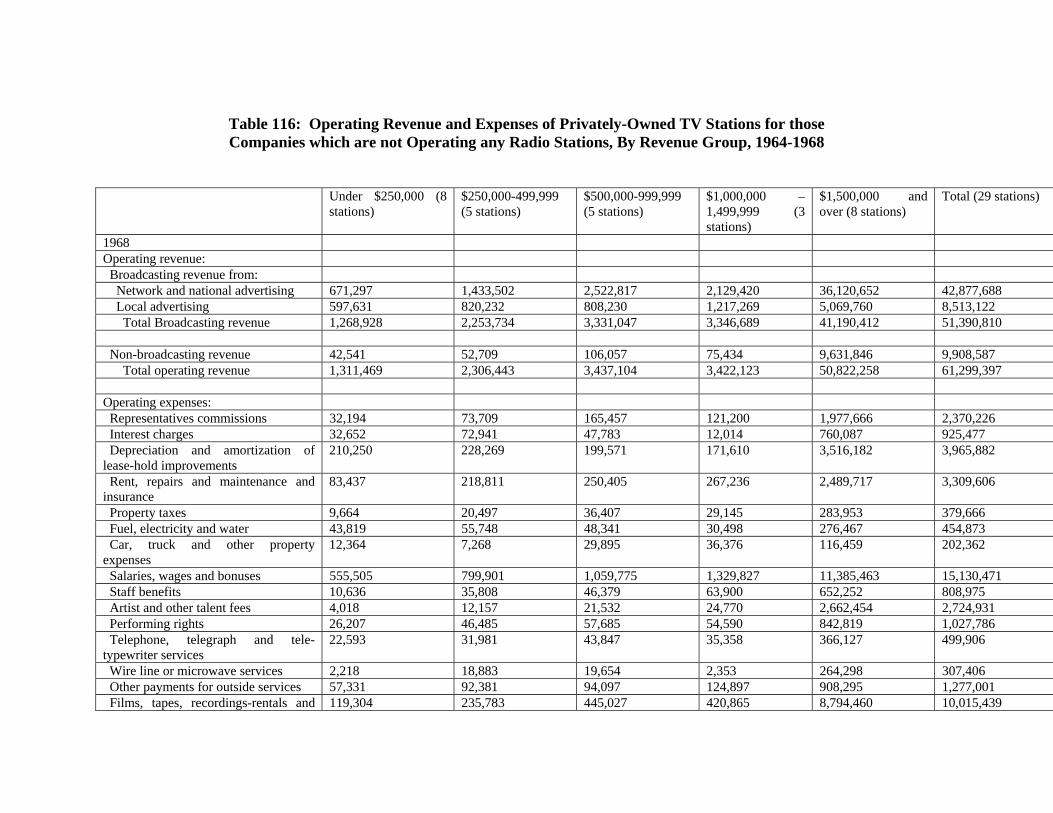
Table 116: Operating Revenue and Expenses of Privately-Owned TV Stations for those Companies which are not Operating any Radio Stations, By Revenue Group, 1964-1968
Under $250,000 (8 stations)
$250,000-499,999 (5 stations)
$500,000-999,999 (5 stations)
$1,000,000 – 1,499,999 (3 stations)
$1,500,000 and over (8 stations)
Total (29 stations)
1968 Operating revenue: Broadcasting revenue from: Network and national advertising 671,297 1,433,502 2,522,817 2,129,420 36,120,652 42,877,688 Local advertising 597,631 820,232 808,230 1,217,269 5,069,760 8,513,122 Total Broadcasting revenue 1,268,928 2,253,734 3,331,047 3,346,689 41,190,412 51,390,810 Non-broadcasting revenue 42,541 52,709 106,057 75,434 9,631,846 9,908,587 Total operating revenue 1,311,469 2,306,443 3,437,104 3,422,123 50,822,258 61,299,397 Operating expenses: Representatives commissions 32,194 73,709 165,457 121,200 1,977,666 2,370,226 Interest charges 32,652 72,941 47,783 12,014 760,087 925,477 Depreciation and amortization of lease-hold improvements
210,250 228,269 199,571 171,610 3,516,182 3,965,882
Rent, repairs and maintenance and insurance
83,437 218,811 250,405 267,236 2,489,717 3,309,606
Property taxes 9,664 20,497 36,407 29,145 283,953 379,666 Fuel, electricity and water 43,819 55,748 48,341 30,498 276,467 454,873 Car, truck and other property expenses
12,364 7,268 29,895 36,376 116,459 202,362
Salaries, wages and bonuses 555,505 799,901 1,059,775 1,329,827 11,385,463 15,130,471 Staff benefits 10,636 35,808 46,379 63,900 652,252 808,975 Artist and other talent fees 4,018 12,157 21,532 24,770 2,662,454 2,724,931 Performing rights 26,207 46,485 57,685 54,590 842,819 1,027,786 Telephone, telegraph and tele-typewriter services
22,593 31,981 43,847 35,358 366,127 499,906
Wire line or microwave services 2,218 18,883 19,654 2,353 264,298 307,406 Other payments for outside services 57,331 92,381 94,097 124,897 908,295 1,277,001 Films, tapes, recordings-rentals and 119,304 235,783 445,027 420,865 8,794,460 10,015,439
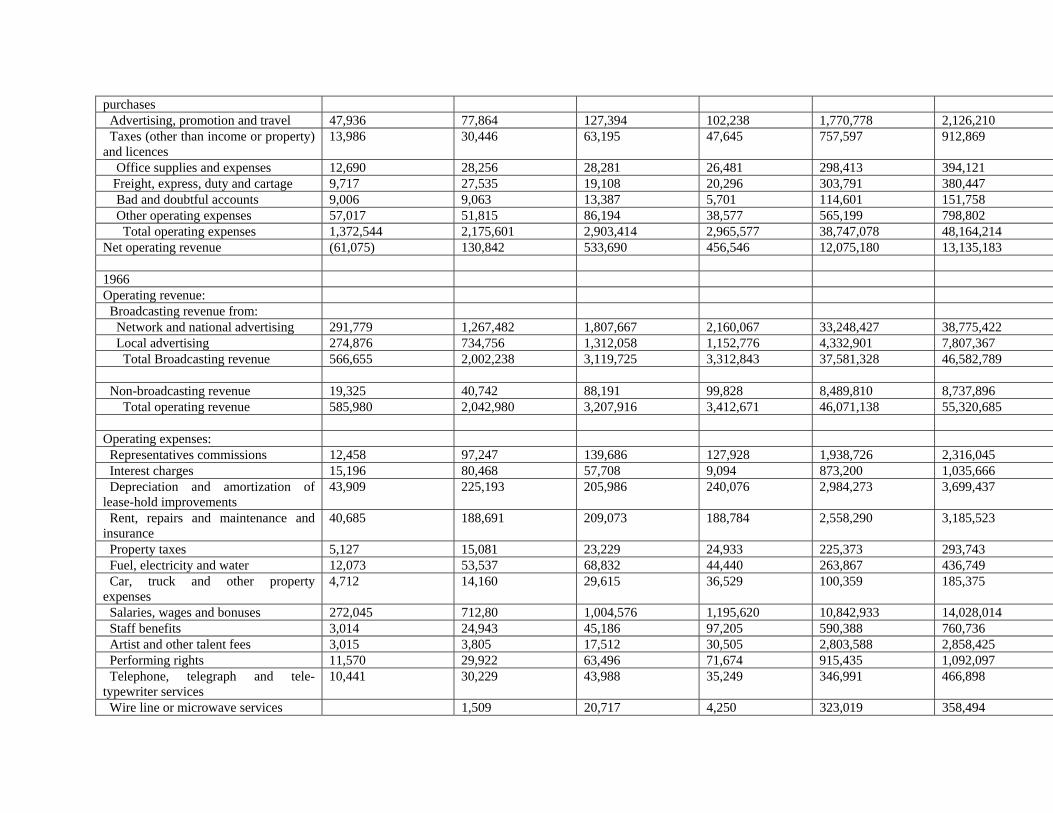
purchases Advertising, promotion and travel 47,936 77,864 127,394 102,238 1,770,778 2,126,210 Taxes (other than income or property) and licences
13,986 30,446 63,195 47,645 757,597 912,869
Office supplies and expenses 12,690 28,256 28,281 26,481 298,413 394,121 Freight, express, duty and cartage 9,717 27,535 19,108 20,296 303,791 380,447 Bad and doubtful accounts 9,006 9,063 13,387 5,701 114,601 151,758 Other operating expenses 57,017 51,815 86,194 38,577 565,199 798,802 Total operating expenses 1,372,544 2,175,601 2,903,414 2,965,577 38,747,078 48,164,214 Net operating revenue (61,075) 130,842 533,690 456,546 12,075,180 13,135,183 1966 Operating revenue: Broadcasting revenue from: Network and national advertising 291,779 1,267,482 1,807,667 2,160,067 33,248,427 38,775,422 Local advertising 274,876 734,756 1,312,058 1,152,776 4,332,901 7,807,367 Total Broadcasting revenue 566,655 2,002,238 3,119,725 3,312,843 37,581,328 46,582,789 Non-broadcasting revenue 19,325 40,742 88,191 99,828 8,489,810 8,737,896 Total operating revenue 585,980 2,042,980 3,207,916 3,412,671 46,071,138 55,320,685 Operating expenses: Representatives commissions 12,458 97,247 139,686 127,928 1,938,726 2,316,045 Interest charges 15,196 80,468 57,708 9,094 873,200 1,035,666 Depreciation and amortization of lease-hold improvements
43,909 225,193 205,986 240,076 2,984,273 3,699,437
Rent, repairs and maintenance and insurance
40,685 188,691 209,073 188,784 2,558,290 3,185,523
Property taxes 5,127 15,081 23,229 24,933 225,373 293,743 Fuel, electricity and water 12,073 53,537 68,832 44,440 263,867 436,749 Car, truck and other property expenses
4,712 14,160 29,615 36,529 100,359 185,375
Salaries, wages and bonuses 272,045 712,80 1,004,576 1,195,620 10,842,933 14,028,014 Staff benefits 3,014 24,943 45,186 97,205 590,388 760,736 Artist and other talent fees 3,015 3,805 17,512 30,505 2,803,588 2,858,425 Performing rights 11,570 29,922 63,496 71,674 915,435 1,092,097 Telephone, telegraph and tele-typewriter services
10,441 30,229 43,988 35,249 346,991 466,898
Wire line or microwave services 1,509 20,717 4,250 323,019 358,494
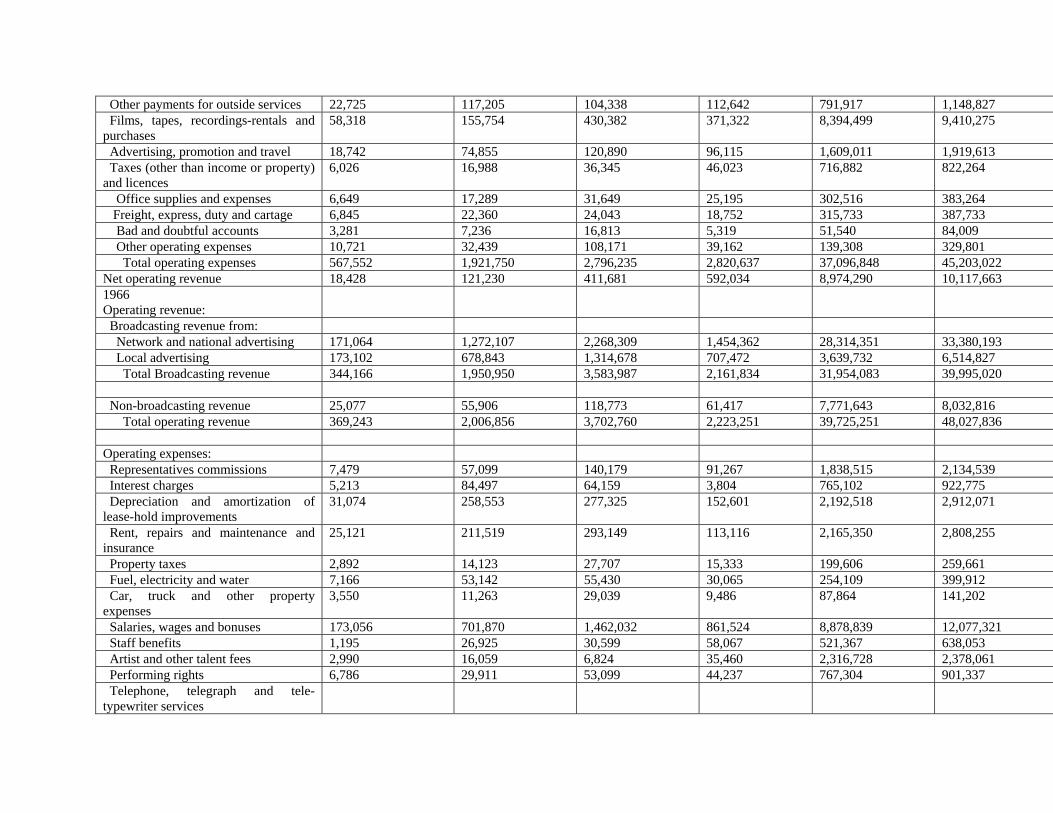
Other payments for outside services 22,725 117,205 104,338 112,642 791,917 1,148,827 Films, tapes, recordings-rentals and purchases
58,318 155,754 430,382 371,322 8,394,499 9,410,275
Advertising, promotion and travel 18,742 74,855 120,890 96,115 1,609,011 1,919,613 Taxes (other than income or property) and licences
6,026 16,988 36,345 46,023 716,882 822,264
Office supplies and expenses 6,649 17,289 31,649 25,195 302,516 383,264 Freight, express, duty and cartage 6,845 22,360 24,043 18,752 315,733 387,733 Bad and doubtful accounts 3,281 7,236 16,813 5,319 51,540 84,009 Other operating expenses 10,721 32,439 108,171 39,162 139,308 329,801 Total operating expenses 567,552 1,921,750 2,796,235 2,820,637 37,096,848 45,203,022 Net operating revenue 18,428 121,230 411,681 592,034 8,974,290 10,117,663 1966 Operating revenue:
Broadcasting revenue from: Network and national advertising 171,064 1,272,107 2,268,309 1,454,362 28,314,351 33,380,193 Local advertising 173,102 678,843 1,314,678 707,472 3,639,732 6,514,827 Total Broadcasting revenue 344,166 1,950,950 3,583,987 2,161,834 31,954,083 39,995,020 Non-broadcasting revenue 25,077 55,906 118,773 61,417 7,771,643 8,032,816 Total operating revenue 369,243 2,006,856 3,702,760 2,223,251 39,725,251 48,027,836 Operating expenses: Representatives commissions 7,479 57,099 140,179 91,267 1,838,515 2,134,539 Interest charges 5,213 84,497 64,159 3,804 765,102 922,775 Depreciation and amortization of lease-hold improvements
31,074 258,553 277,325 152,601 2,192,518 2,912,071
Rent, repairs and maintenance and insurance
25,121 211,519 293,149 113,116 2,165,350 2,808,255
Property taxes 2,892 14,123 27,707 15,333 199,606 259,661 Fuel, electricity and water 7,166 53,142 55,430 30,065 254,109 399,912 Car, truck and other property expenses
3,550 11,263 29,039 9,486 87,864 141,202
Salaries, wages and bonuses 173,056 701,870 1,462,032 861,524 8,878,839 12,077,321 Staff benefits 1,195 26,925 30,599 58,067 521,367 638,053 Artist and other talent fees 2,990 16,059 6,824 35,460 2,316,728 2,378,061 Performing rights 6,786 29,911 53,099 44,237 767,304 901,337 Telephone, telegraph and tele-typewriter services
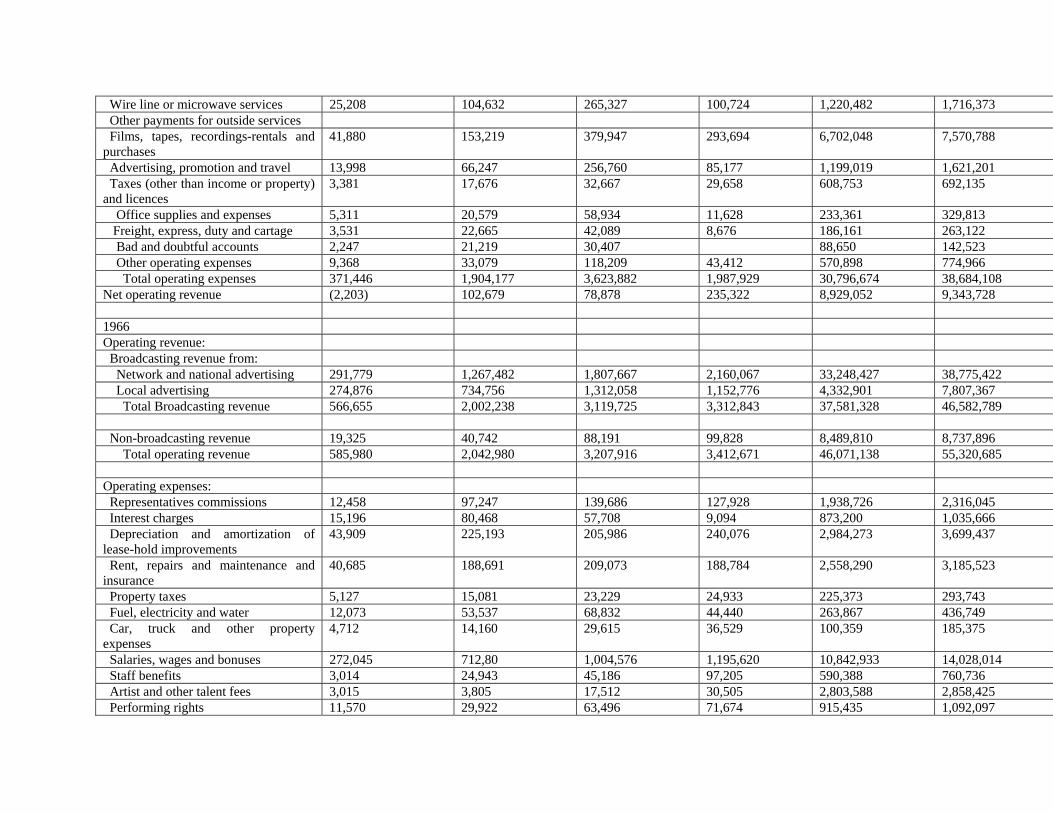
Wire line or microwave services 25,208 104,632 265,327 100,724 1,220,482 1,716,373 Other payments for outside services Films, tapes, recordings-rentals and purchases
41,880 153,219 379,947 293,694 6,702,048 7,570,788
Advertising, promotion and travel 13,998 66,247 256,760 85,177 1,199,019 1,621,201 Taxes (other than income or property) and licences
3,381 17,676 32,667 29,658 608,753 692,135
Office supplies and expenses 5,311 20,579 58,934 11,628 233,361 329,813 Freight, express, duty and cartage 3,531 22,665 42,089 8,676 186,161 263,122 Bad and doubtful accounts 2,247 21,219 30,407 88,650 142,523 Other operating expenses 9,368 33,079 118,209 43,412 570,898 774,966 Total operating expenses 371,446 1,904,177 3,623,882 1,987,929 30,796,674 38,684,108 Net operating revenue (2,203) 102,679 78,878 235,322 8,929,052 9,343,728 1966 Operating revenue: Broadcasting revenue from: Network and national advertising 291,779 1,267,482 1,807,667 2,160,067 33,248,427 38,775,422 Local advertising 274,876 734,756 1,312,058 1,152,776 4,332,901 7,807,367 Total Broadcasting revenue 566,655 2,002,238 3,119,725 3,312,843 37,581,328 46,582,789 Non-broadcasting revenue 19,325 40,742 88,191 99,828 8,489,810 8,737,896 Total operating revenue 585,980 2,042,980 3,207,916 3,412,671 46,071,138 55,320,685 Operating expenses: Representatives commissions 12,458 97,247 139,686 127,928 1,938,726 2,316,045 Interest charges 15,196 80,468 57,708 9,094 873,200 1,035,666 Depreciation and amortization of lease-hold improvements
43,909 225,193 205,986 240,076 2,984,273 3,699,437
Rent, repairs and maintenance and insurance
40,685 188,691 209,073 188,784 2,558,290 3,185,523
Property taxes 5,127 15,081 23,229 24,933 225,373 293,743 Fuel, electricity and water 12,073 53,537 68,832 44,440 263,867 436,749 Car, truck and other property expenses
4,712 14,160 29,615 36,529 100,359 185,375
Salaries, wages and bonuses 272,045 712,80 1,004,576 1,195,620 10,842,933 14,028,014 Staff benefits 3,014 24,943 45,186 97,205 590,388 760,736 Artist and other talent fees 3,015 3,805 17,512 30,505 2,803,588 2,858,425 Performing rights 11,570 29,922 63,496 71,674 915,435 1,092,097
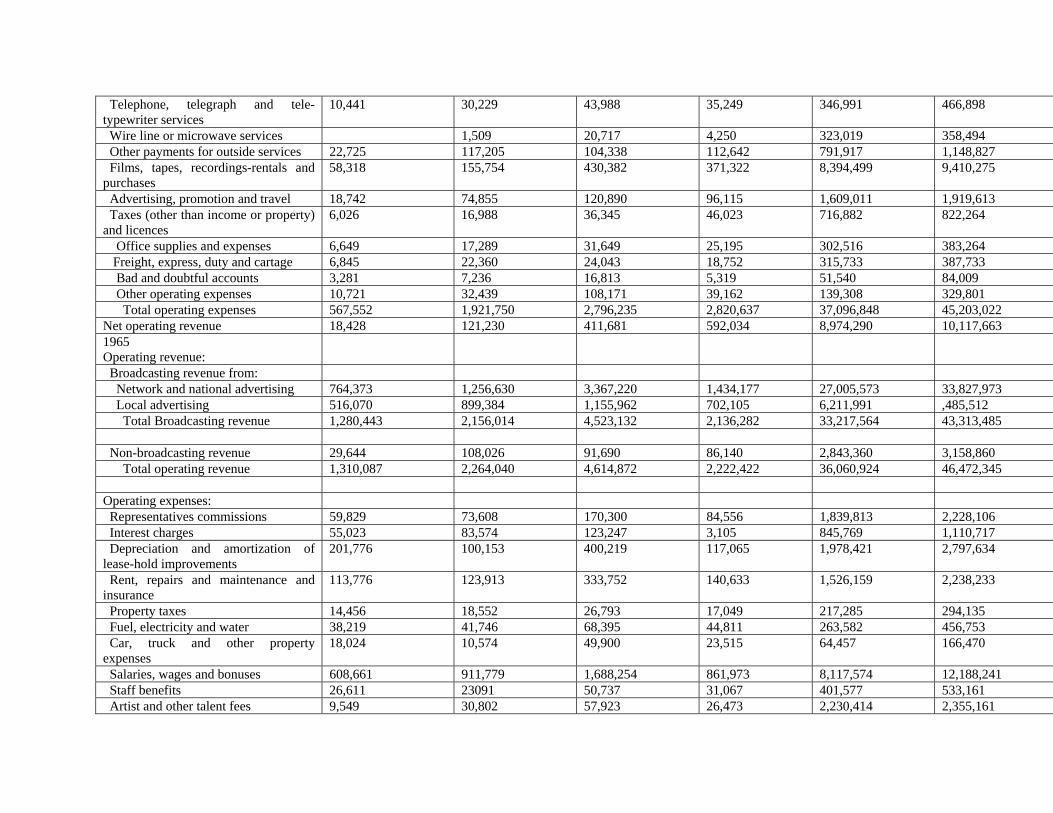
Telephone, telegraph and tele-typewriter services
10,441 30,229 43,988 35,249 346,991 466,898
Wire line or microwave services 1,509 20,717 4,250 323,019 358,494 Other payments for outside services 22,725 117,205 104,338 112,642 791,917 1,148,827 Films, tapes, recordings-rentals and purchases
58,318 155,754 430,382 371,322 8,394,499 9,410,275
Advertising, promotion and travel 18,742 74,855 120,890 96,115 1,609,011 1,919,613 Taxes (other than income or property) and licences
6,026 16,988 36,345 46,023 716,882 822,264
Office supplies and expenses 6,649 17,289 31,649 25,195 302,516 383,264 Freight, express, duty and cartage 6,845 22,360 24,043 18,752 315,733 387,733 Bad and doubtful accounts 3,281 7,236 16,813 5,319 51,540 84,009 Other operating expenses 10,721 32,439 108,171 39,162 139,308 329,801 Total operating expenses 567,552 1,921,750 2,796,235 2,820,637 37,096,848 45,203,022 Net operating revenue 18,428 121,230 411,681 592,034 8,974,290 10,117,663 1965 Operating revenue:
Broadcasting revenue from: Network and national advertising 764,373 1,256,630 3,367,220 1,434,177 27,005,573 33,827,973 Local advertising 516,070 899,384 1,155,962 702,105 6,211,991 ,485,512 Total Broadcasting revenue 1,280,443 2,156,014 4,523,132 2,136,282 33,217,564 43,313,485 Non-broadcasting revenue 29,644 108,026 91,690 86,140 2,843,360 3,158,860 Total operating revenue 1,310,087 2,264,040 4,614,872 2,222,422 36,060,924 46,472,345 Operating expenses: Representatives commissions 59,829 73,608 170,300 84,556 1,839,813 2,228,106 Interest charges 55,023 83,574 123,247 3,105 845,769 1,110,717 Depreciation and amortization of lease-hold improvements
201,776 100,153 400,219 117,065 1,978,421 2,797,634
Rent, repairs and maintenance and insurance
113,776 123,913 333,752 140,633 1,526,159 2,238,233
Property taxes 14,456 18,552 26,793 17,049 217,285 294,135 Fuel, electricity and water 38,219 41,746 68,395 44,811 263,582 456,753 Car, truck and other property expenses
18,024 10,574 49,900 23,515 64,457 166,470
Salaries, wages and bonuses 608,661 911,779 1,688,254 861,973 8,117,574 12,188,241 Staff benefits 26,611 23091 50,737 31,067 401,577 533,161 Artist and other talent fees 9,549 30,802 57,923 26,473 2,230,414 2,355,161

Performing rights 23,526 38,989 63,190 45,898 667,181 838,784 Telephone, telegraph and tele-typewriter services }
Wire line or microwave services } 104,710 98,902 271,147 65,759 1,111,777 1,652,295 Other payments for outside services } Films, tapes, recordings-rentals and purchases
90,872 267,870 337,812 217,426 5,903,514 6,817,494
Advertising, promotion and travel 42,639 67,356 265,282 63,165 1,352,183 1,790,625 Taxes (other than income or property) and licences
13,176 20,631 65,497 29,130 526,137 654,571
Office supplies and expenses 24,430 24,949 61,399 14,216 243,417 368,411 Freight, express, duty and cartage 7,236 23,667 39,678 14,308 181,420 266,309 Bad and doubtful accounts 6,717 21,761 68,237 6,180 82,757 18,652 Other operating expenses 51,553 30,718 101,212 27,744 445,428 656,655 Total operating expenses 1,510,783 2,012,635 4,242,974 1,834,073 27,998,864 37,599,329 Net operating revenue (200,696) 251,405 371,898 388,349 8,062,060 8,873,016 1964 Operating revenue:
Broadcasting revenue from: Network and national advertising 864,957 1,144,880 2,307,533 3,699,303 20,636,879 28,653,552 Local advertising 647,167 908,239 971,161 1,073,074 3,422,178 7,021,819 Total Broadcasting revenue 1,512,124 2,053,119 3,278,694 4,772,377 24,059,057 35,675,371 Non-broadcasting revenue 58,711 144,184 78,230 266,229 4,105,532 4,612,886 Total operating revenue 1,570,835 2,197,303 3,356,924 4,998,606 28,164,589 40,288,257 Operating expenses: Representatives commissions 65,674 58,885 147,916 176,167 1,606,514 2,055,156 Interest charges 66,430 118,133 24,503 75,498 916,290 1,200,854 Depreciation and amortization of lease-hold improvements
211,223 69,254 255,052 344,080 1,804,503 2,684,112
Rent, repairs and maintenance and insurance
184,452 191,910 201,881 349,053 1,445,980 2,373,276
Property taxes 17,587 16,687 28,672 29,856 202,594 295,396 Fuel, electricity and water 52,412 44,866 58,351 49,346 248,711 453,686 Car, truck and other property expenses
Salaries, wages and bonuses 737,038 947,550 1,177,612 1,820,848 7,305,437 11,988,485
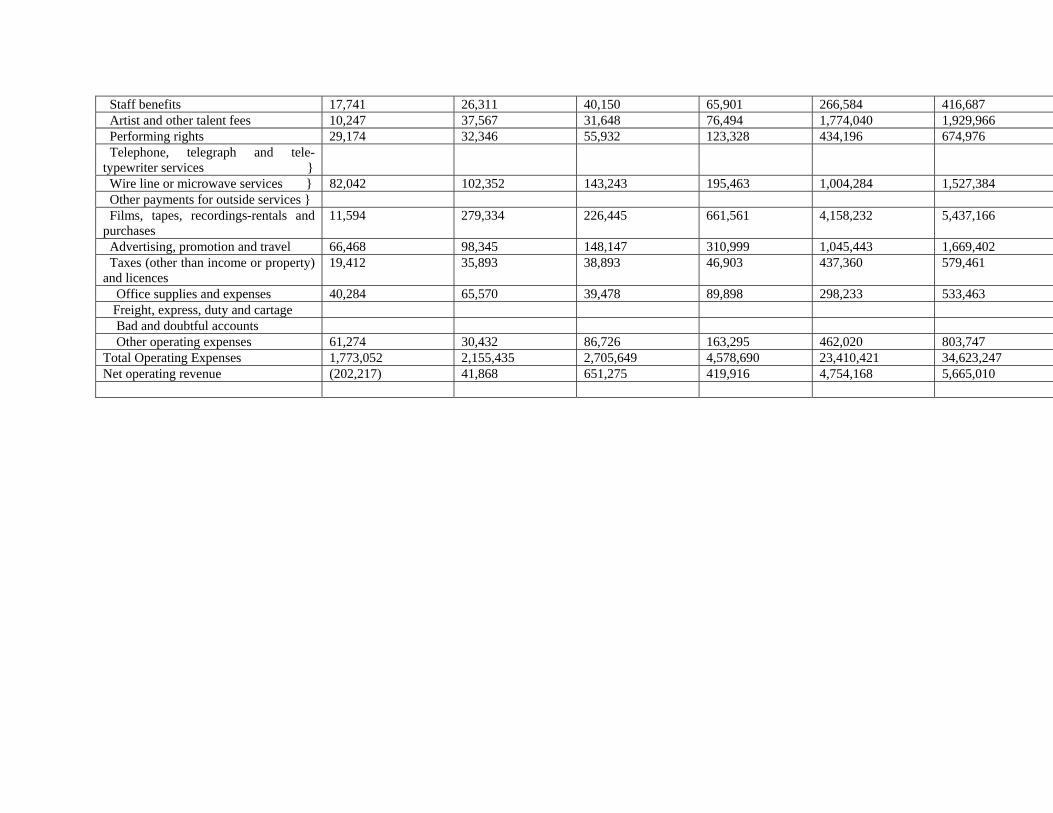
Staff benefits 17,741 26,311 40,150 65,901 266,584 416,687 Artist and other talent fees 10,247 37,567 31,648 76,494 1,774,040 1,929,966 Performing rights 29,174 32,346 55,932 123,328 434,196 674,976 Telephone, telegraph and tele-typewriter services }
Wire line or microwave services } 82,042 102,352 143,243 195,463 1,004,284 1,527,384 Other payments for outside services } Films, tapes, recordings-rentals and purchases
11,594 279,334 226,445 661,561 4,158,232 5,437,166
Advertising, promotion and travel 66,468 98,345 148,147 310,999 1,045,443 1,669,402 Taxes (other than income or property) and licences
19,412 35,893 38,893 46,903 437,360 579,461
Office supplies and expenses 40,284 65,570 39,478 89,898 298,233 533,463 Freight, express, duty and cartage Bad and doubtful accounts Other operating expenses 61,274 30,432 86,726 163,295 462,020 803,747 Total Operating Expenses 1,773,052 2,155,435 2,705,649 4,578,690 23,410,421 34,623,247 Net operating revenue (202,217) 41,868 651,275 419,916 4,754,168 5,665,010
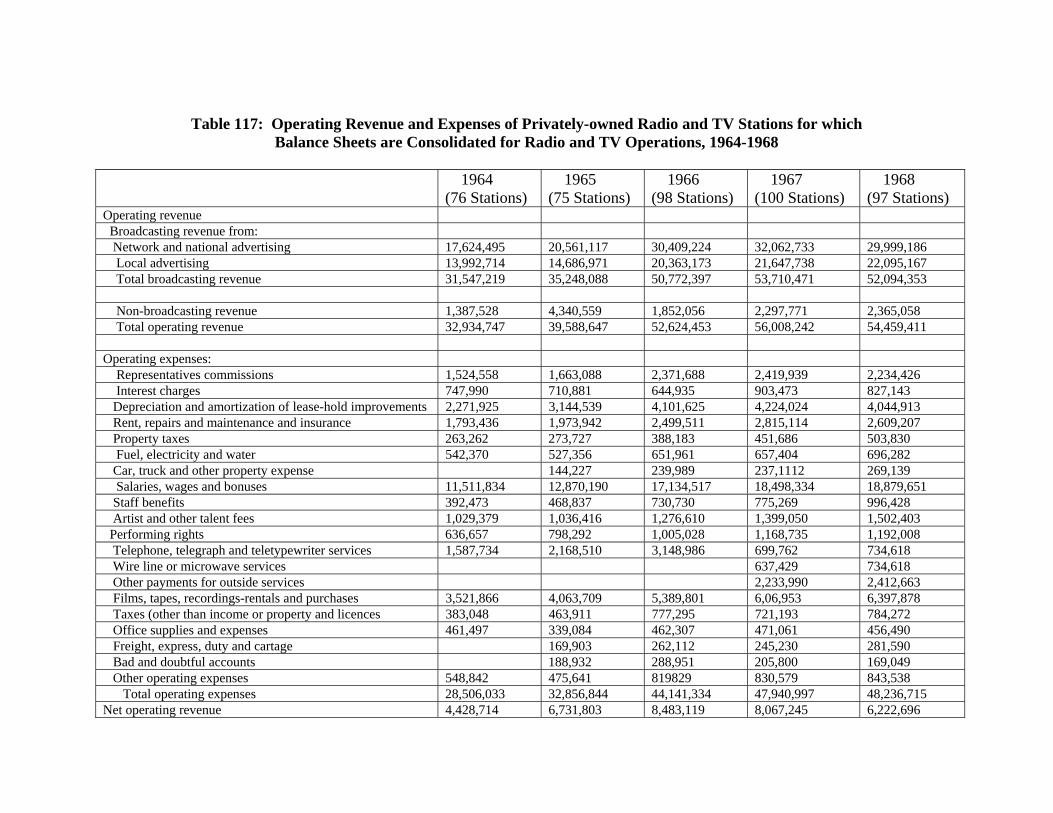
Table 117: Operating Revenue and Expenses of Privately-owned Radio and TV Stations for which
Balance Sheets are Consolidated for Radio and TV Operations, 1964-1968
1964 (76 Stations)
1965 (75 Stations)
1966 (98 Stations)
1967 (100 Stations)
1968 (97 Stations)
Operating revenue Broadcasting revenue from: Network and national advertising 17,624,495 20,561,117 30,409,224 32,062,733 29,999,186 Local advertising 13,992,714 14,686,971 20,363,173 21,647,738 22,095,167 Total broadcasting revenue 31,547,219 35,248,088 50,772,397 53,710,471 52,094,353 Non-broadcasting revenue 1,387,528 4,340,559 1,852,056 2,297,771 2,365,058 Total operating revenue 32,934,747 39,588,647 52,624,453 56,008,242 54,459,411 Operating expenses: Representatives commissions 1,524,558 1,663,088 2,371,688 2,419,939 2,234,426 Interest charges 747,990 710,881 644,935 903,473 827,143 Depreciation and amortization of lease-hold improvements 2,271,925 3,144,539 4,101,625 4,224,024 4,044,913 Rent, repairs and maintenance and insurance 1,793,436 1,973,942 2,499,511 2,815,114 2,609,207 Property taxes 263,262 273,727 388,183 451,686 503,830 Fuel, electricity and water 542,370 527,356 651,961 657,404 696,282 Car, truck and other property expense 144,227 239,989 237,1112 269,139 Salaries, wages and bonuses 11,511,834 12,870,190 17,134,517 18,498,334 18,879,651 Staff benefits 392,473 468,837 730,730 775,269 996,428 Artist and other talent fees 1,029,379 1,036,416 1,276,610 1,399,050 1,502,403 Performing rights 636,657 798,292 1,005,028 1,168,735 1,192,008 Telephone, telegraph and teletypewriter services 1,587,734 2,168,510 3,148,986 699,762 734,618 Wire line or microwave services 637,429 734,618 Other payments for outside services 2,233,990 2,412,663 Films, tapes, recordings-rentals and purchases 3,521,866 4,063,709 5,389,801 6,06,953 6,397,878 Taxes (other than income or property and licences 383,048 463,911 777,295 721,193 784,272 Office supplies and expenses 461,497 339,084 462,307 471,061 456,490 Freight, express, duty and cartage 169,903 262,112 245,230 281,590 Bad and doubtful accounts 188,932 288,951 205,800 169,049 Other operating expenses 548,842 475,641 819829 830,579 843,538 Total operating expenses 28,506,033 32,856,844 44,141,334 47,940,997 48,236,715 Net operating revenue 4,428,714 6,731,803 8,483,119 8,067,245 6,222,696
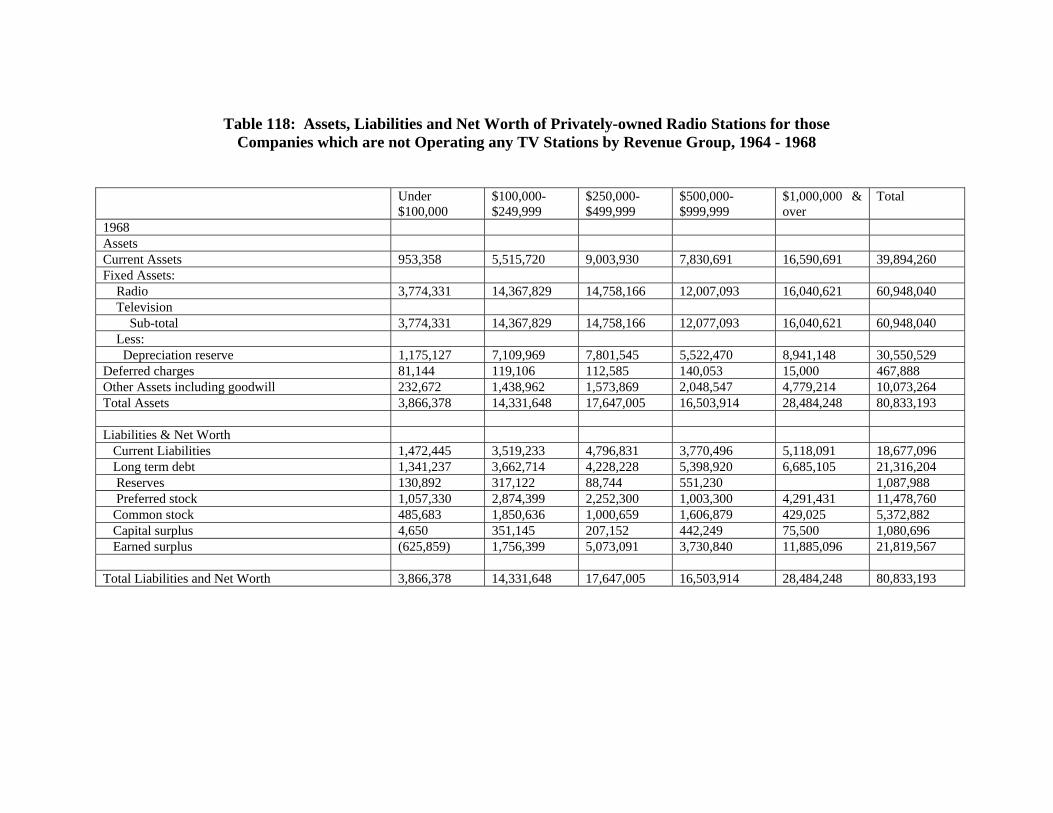
Table 118: Assets, Liabilities and Net Worth of Privately-owned Radio Stations for those
Companies which are not Operating any TV Stations by Revenue Group, 1964 - 1968
Under $100,000
$100,000- $249,999
$250,000- $499,999
$500,000- $999,999
$1,000,000 & over
Total
1968 Assets Current Assets 953,358 5,515,720 9,003,930 7,830,691 16,590,691 39,894,260 Fixed Assets: Radio 3,774,331 14,367,829 14,758,166 12,007,093 16,040,621 60,948,040 Television Sub-total 3,774,331 14,367,829 14,758,166 12,077,093 16,040,621 60,948,040 Less: Depreciation reserve 1,175,127 7,109,969 7,801,545 5,522,470 8,941,148 30,550,529 Deferred charges 81,144 119,106 112,585 140,053 15,000 467,888 Other Assets including goodwill 232,672 1,438,962 1,573,869 2,048,547 4,779,214 10,073,264 Total Assets 3,866,378 14,331,648 17,647,005 16,503,914 28,484,248 80,833,193 Liabilities & Net Worth Current Liabilities 1,472,445 3,519,233 4,796,831 3,770,496 5,118,091 18,677,096 Long term debt 1,341,237 3,662,714 4,228,228 5,398,920 6,685,105 21,316,204 Reserves 130,892 317,122 88,744 551,230 1,087,988 Preferred stock 1,057,330 2,874,399 2,252,300 1,003,300 4,291,431 11,478,760 Common stock 485,683 1,850,636 1,000,659 1,606,879 429,025 5,372,882 Capital surplus 4,650 351,145 207,152 442,249 75,500 1,080,696 Earned surplus (625,859) 1,756,399 5,073,091 3,730,840 11,885,096 21,819,567 Total Liabilities and Net Worth 3,866,378 14,331,648 17,647,005 16,503,914 28,484,248 80,833,193
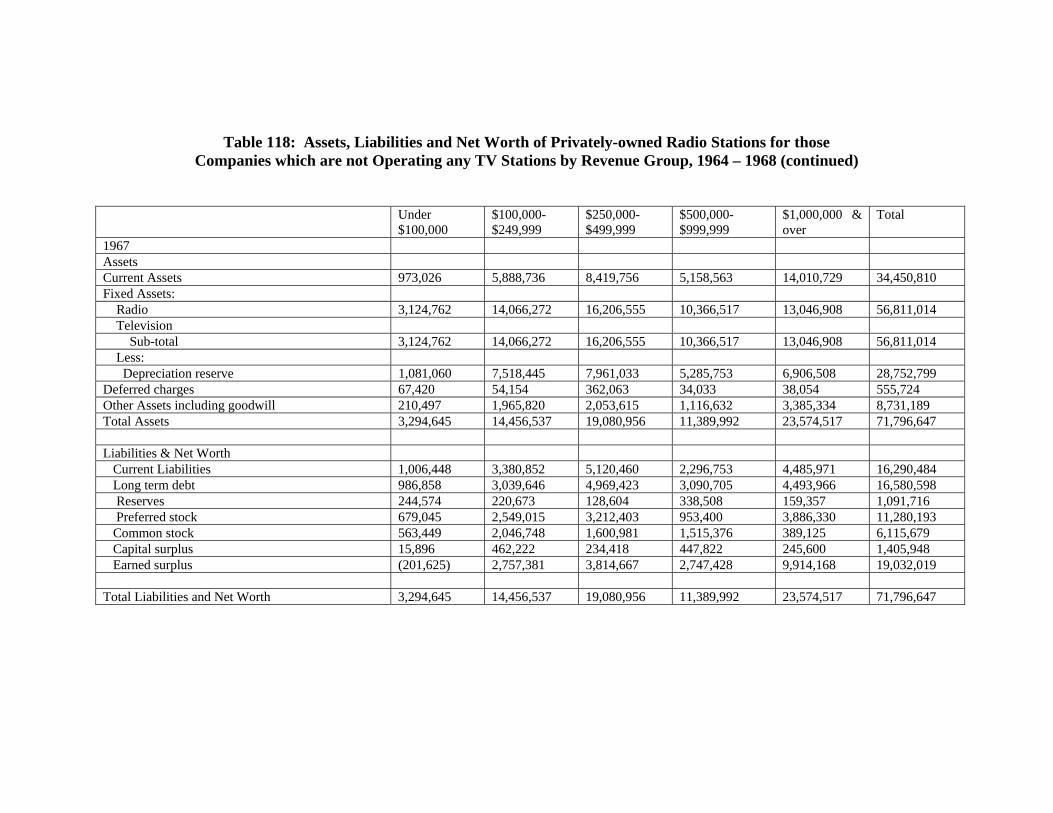
Table 118: Assets, Liabilities and Net Worth of Privately-owned Radio Stations for those Companies which are not Operating any TV Stations by Revenue Group, 1964 – 1968 (continued)
Under $100,000
$100,000- $249,999
$250,000- $499,999
$500,000- $999,999
$1,000,000 & over
Total
1967 Assets Current Assets 973,026 5,888,736 8,419,756 5,158,563 14,010,729 34,450,810 Fixed Assets: Radio 3,124,762 14,066,272 16,206,555 10,366,517 13,046,908 56,811,014 Television Sub-total 3,124,762 14,066,272 16,206,555 10,366,517 13,046,908 56,811,014 Less: Depreciation reserve 1,081,060 7,518,445 7,961,033 5,285,753 6,906,508 28,752,799 Deferred charges 67,420 54,154 362,063 34,033 38,054 555,724 Other Assets including goodwill 210,497 1,965,820 2,053,615 1,116,632 3,385,334 8,731,189 Total Assets 3,294,645 14,456,537 19,080,956 11,389,992 23,574,517 71,796,647 Liabilities & Net Worth Current Liabilities 1,006,448 3,380,852 5,120,460 2,296,753 4,485,971 16,290,484 Long term debt 986,858 3,039,646 4,969,423 3,090,705 4,493,966 16,580,598 Reserves 244,574 220,673 128,604 338,508 159,357 1,091,716 Preferred stock 679,045 2,549,015 3,212,403 953,400 3,886,330 11,280,193 Common stock 563,449 2,046,748 1,600,981 1,515,376 389,125 6,115,679 Capital surplus 15,896 462,222 234,418 447,822 245,600 1,405,948 Earned surplus (201,625) 2,757,381 3,814,667 2,747,428 9,914,168 19,032,019 Total Liabilities and Net Worth 3,294,645 14,456,537 19,080,956 11,389,992 23,574,517 71,796,647
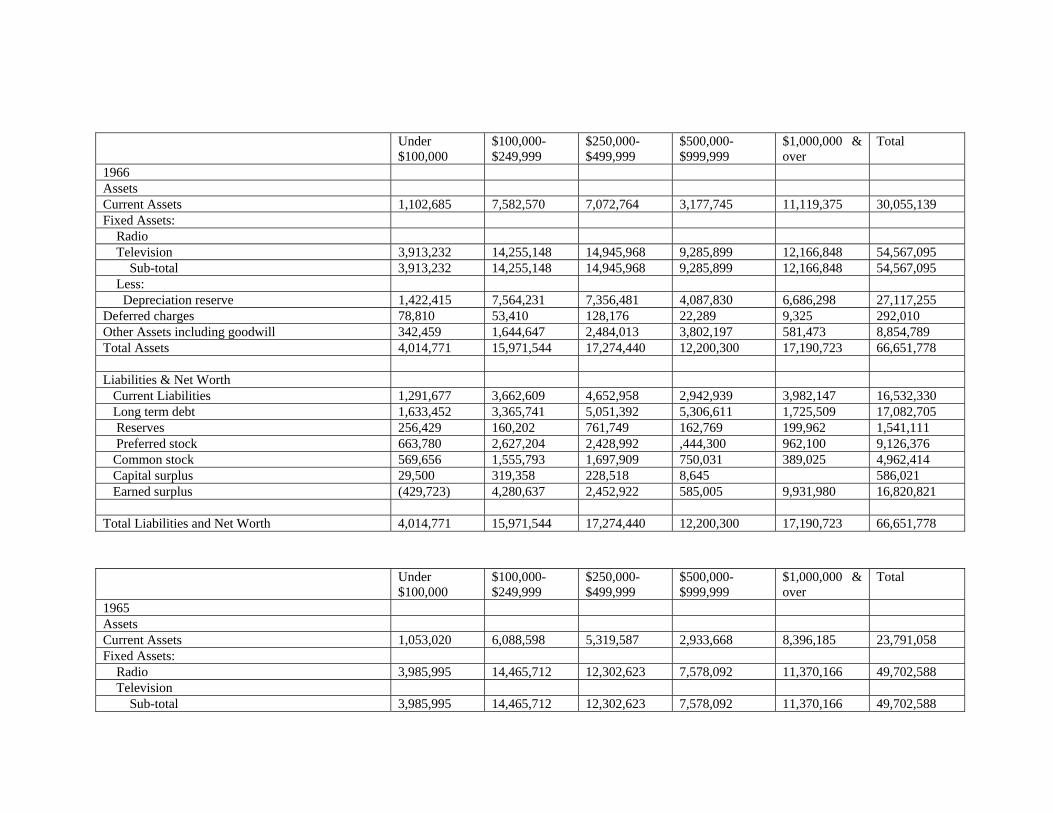
Under $100,000
$100,000- $249,999
$250,000- $499,999
$500,000- $999,999
$1,000,000 & over
Total
1966 Assets Current Assets 1,102,685 7,582,570 7,072,764 3,177,745 11,119,375 30,055,139 Fixed Assets: Radio Television 3,913,232 14,255,148 14,945,968 9,285,899 12,166,848 54,567,095 Sub-total 3,913,232 14,255,148 14,945,968 9,285,899 12,166,848 54,567,095 Less: Depreciation reserve 1,422,415 7,564,231 7,356,481 4,087,830 6,686,298 27,117,255 Deferred charges 78,810 53,410 128,176 22,289 9,325 292,010 Other Assets including goodwill 342,459 1,644,647 2,484,013 3,802,197 581,473 8,854,789 Total Assets 4,014,771 15,971,544 17,274,440 12,200,300 17,190,723 66,651,778 Liabilities & Net Worth Current Liabilities 1,291,677 3,662,609 4,652,958 2,942,939 3,982,147 16,532,330 Long term debt 1,633,452 3,365,741 5,051,392 5,306,611 1,725,509 17,082,705 Reserves 256,429 160,202 761,749 162,769 199,962 1,541,111 Preferred stock 663,780 2,627,204 2,428,992 ,444,300 962,100 9,126,376 Common stock 569,656 1,555,793 1,697,909 750,031 389,025 4,962,414 Capital surplus 29,500 319,358 228,518 8,645 586,021 Earned surplus (429,723) 4,280,637 2,452,922 585,005 9,931,980 16,820,821 Total Liabilities and Net Worth 4,014,771 15,971,544 17,274,440 12,200,300 17,190,723 66,651,778
Under $100,000
$100,000- $249,999
$250,000- $499,999
$500,000- $999,999
$1,000,000 & over
Total
1965 Assets Current Assets 1,053,020 6,088,598 5,319,587 2,933,668 8,396,185 23,791,058 Fixed Assets: Radio 3,985,995 14,465,712 12,302,623 7,578,092 11,370,166 49,702,588 Television Sub-total 3,985,995 14,465,712 12,302,623 7,578,092 11,370,166 49,702,588
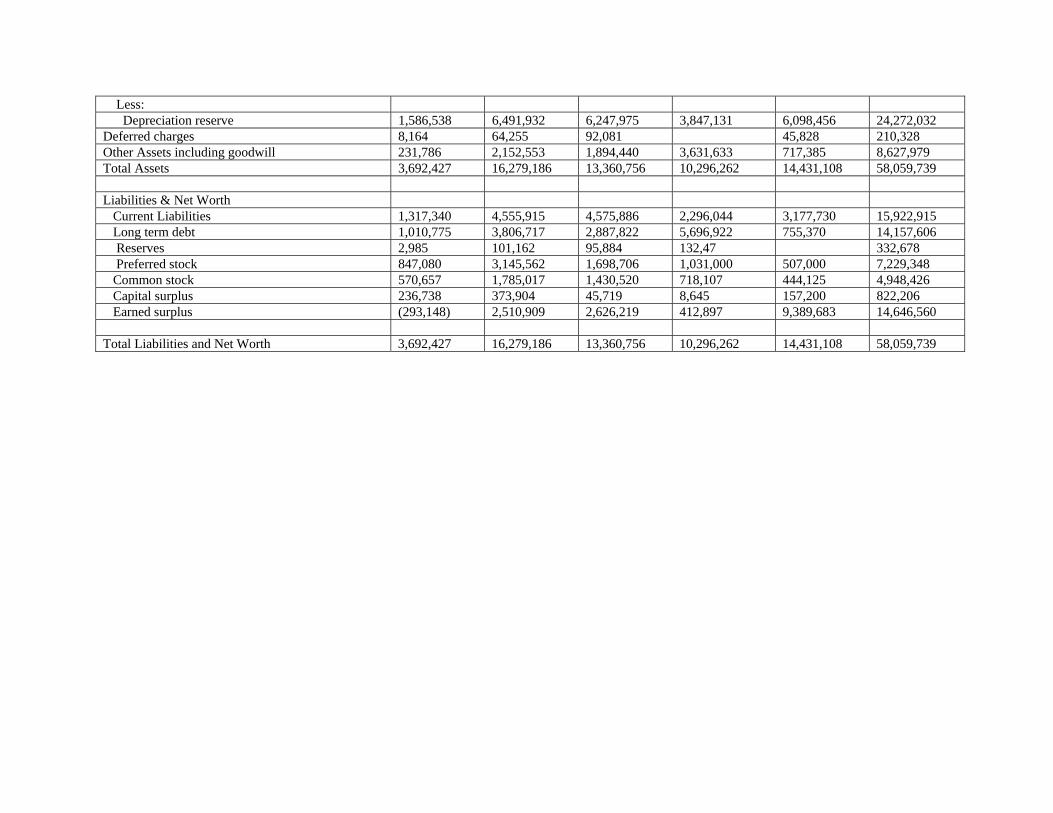
Less: Depreciation reserve 1,586,538 6,491,932 6,247,975 3,847,131 6,098,456 24,272,032 Deferred charges 8,164 64,255 92,081 45,828 210,328 Other Assets including goodwill 231,786 2,152,553 1,894,440 3,631,633 717,385 8,627,979 Total Assets 3,692,427 16,279,186 13,360,756 10,296,262 14,431,108 58,059,739 Liabilities & Net Worth Current Liabilities 1,317,340 4,555,915 4,575,886 2,296,044 3,177,730 15,922,915 Long term debt 1,010,775 3,806,717 2,887,822 5,696,922 755,370 14,157,606 Reserves 2,985 101,162 95,884 132,47 332,678 Preferred stock 847,080 3,145,562 1,698,706 1,031,000 507,000 7,229,348 Common stock 570,657 1,785,017 1,430,520 718,107 444,125 4,948,426 Capital surplus 236,738 373,904 45,719 8,645 157,200 822,206 Earned surplus (293,148) 2,510,909 2,626,219 412,897 9,389,683 14,646,560 Total Liabilities and Net Worth 3,692,427 16,279,186 13,360,756 10,296,262 14,431,108 58,059,739

Under $100,000
$100,000- $249,999
$250,000- $499,999
$500,000- $999,999
$1,000,000 & over
Total
1964 Assets Current Assets 1,750,125 4,861,549 3,856,939 2,720,412 7,706,964 20,895,989 Fixed Assets: Radio 5,477,851 11,794,867 8,830,770 8,227,816 9,854,599 44,185,903 Television Sub-total 5,477,851 11,794,867 8,830,770 8,227,816 9,854,599 44,185,903 Less: Depreciation reserve 1,927,703 5,900,837 4,454,910 4,031,357 4,933,437 21,284,244 Deferred charges 39,931 123,618 130,436 8,212 12,215 314,412 Other Assets including goodwill 223,344 1,847,516 1,733,116 3,972,739 694,530 8,471,245 Total Assets 5,563,548 12,726,713 10,096,351 10,897,822 13,334,871 52,619,305 Liabilities & Net Worth Current Liabilities 1,886,764 3,002,961 2,608,978 3,316,706 3,638,076 14,453,485 Long term debt 2,222,747 2,202,135 3,246,009 5,612,756 1,077,307 14,360,954 Reserves 21,196 349,111 93,533 101,854 96,900 662,594 Preferred stock 726,525 2,499,780 1,684,000 1,024,542 486,500 6,421,347 Common stock 763,359 1,721,422 611,079 971,450 338,525 4,405,835 Capital surplus 236,688 36,491 7,500 280,679 Earned surplus (293,731) 2,914,813 1,852,752 (136,986) 7,697,563 12,034,411 Total Liabilities and Net Worth 5,563,548 12,726,713 10,096,351 10,897,822 13,334,871 52,619,305
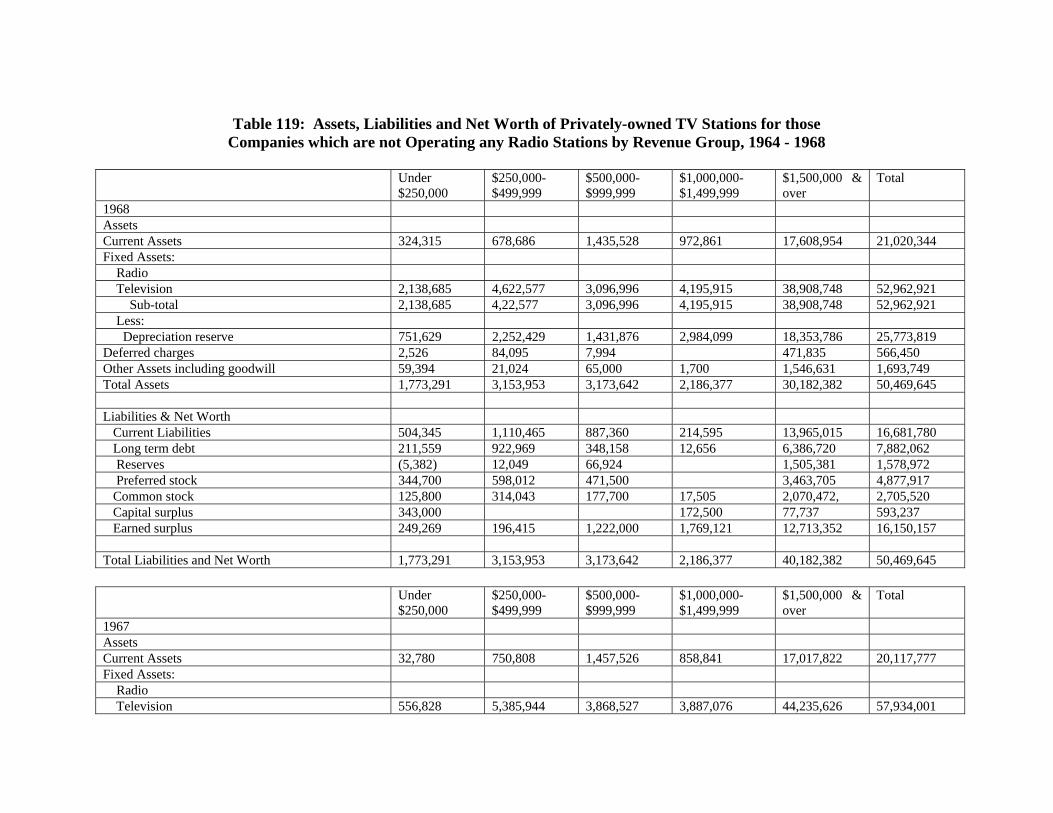
Table 119: Assets, Liabilities and Net Worth of Privately-owned TV Stations for those
Companies which are not Operating any Radio Stations by Revenue Group, 1964 - 1968
Under $250,000
$250,000- $499,999
$500,000- $999,999
$1,000,000- $1,499,999
$1,500,000 & over
Total
1968 Assets Current Assets 324,315 678,686 1,435,528 972,861 17,608,954 21,020,344 Fixed Assets: Radio Television 2,138,685 4,622,577 3,096,996 4,195,915 38,908,748 52,962,921 Sub-total 2,138,685 4,22,577 3,096,996 4,195,915 38,908,748 52,962,921 Less: Depreciation reserve 751,629 2,252,429 1,431,876 2,984,099 18,353,786 25,773,819 Deferred charges 2,526 84,095 7,994 471,835 566,450 Other Assets including goodwill 59,394 21,024 65,000 1,700 1,546,631 1,693,749 Total Assets 1,773,291 3,153,953 3,173,642 2,186,377 30,182,382 50,469,645 Liabilities & Net Worth Current Liabilities 504,345 1,110,465 887,360 214,595 13,965,015 16,681,780 Long term debt 211,559 922,969 348,158 12,656 6,386,720 7,882,062 Reserves (5,382) 12,049 66,924 1,505,381 1,578,972 Preferred stock 344,700 598,012 471,500 3,463,705 4,877,917 Common stock 125,800 314,043 177,700 17,505 2,070,472, 2,705,520 Capital surplus 343,000 172,500 77,737 593,237 Earned surplus 249,269 196,415 1,222,000 1,769,121 12,713,352 16,150,157 Total Liabilities and Net Worth 1,773,291 3,153,953 3,173,642 2,186,377 40,182,382 50,469,645
Under
$250,000 $250,000- $499,999
$500,000- $999,999
$1,000,000- $1,499,999
$1,500,000 & over
Total
1967 Assets Current Assets 32,780 750,808 1,457,526 858,841 17,017,822 20,117,777 Fixed Assets: Radio Television 556,828 5,385,944 3,868,527 3,887,076 44,235,626 57,934,001
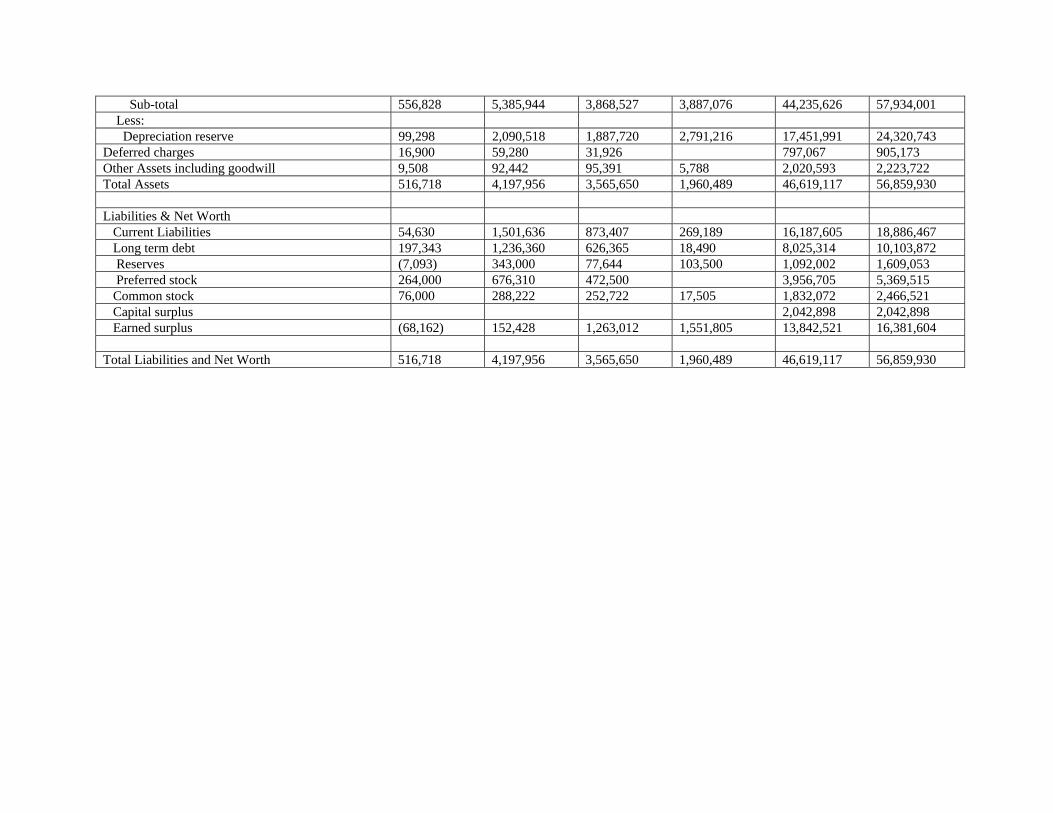
Sub-total 556,828 5,385,944 3,868,527 3,887,076 44,235,626 57,934,001 Less: Depreciation reserve 99,298 2,090,518 1,887,720 2,791,216 17,451,991 24,320,743 Deferred charges 16,900 59,280 31,926 797,067 905,173 Other Assets including goodwill 9,508 92,442 95,391 5,788 2,020,593 2,223,722 Total Assets 516,718 4,197,956 3,565,650 1,960,489 46,619,117 56,859,930 Liabilities & Net Worth Current Liabilities 54,630 1,501,636 873,407 269,189 16,187,605 18,886,467 Long term debt 197,343 1,236,360 626,365 18,490 8,025,314 10,103,872 Reserves (7,093) 343,000 77,644 103,500 1,092,002 1,609,053 Preferred stock 264,000 676,310 472,500 3,956,705 5,369,515 Common stock 76,000 288,222 252,722 17,505 1,832,072 2,466,521 Capital surplus 2,042,898 2,042,898 Earned surplus (68,162) 152,428 1,263,012 1,551,805 13,842,521 16,381,604 Total Liabilities and Net Worth 516,718 4,197,956 3,565,650 1,960,489 46,619,117 56,859,930
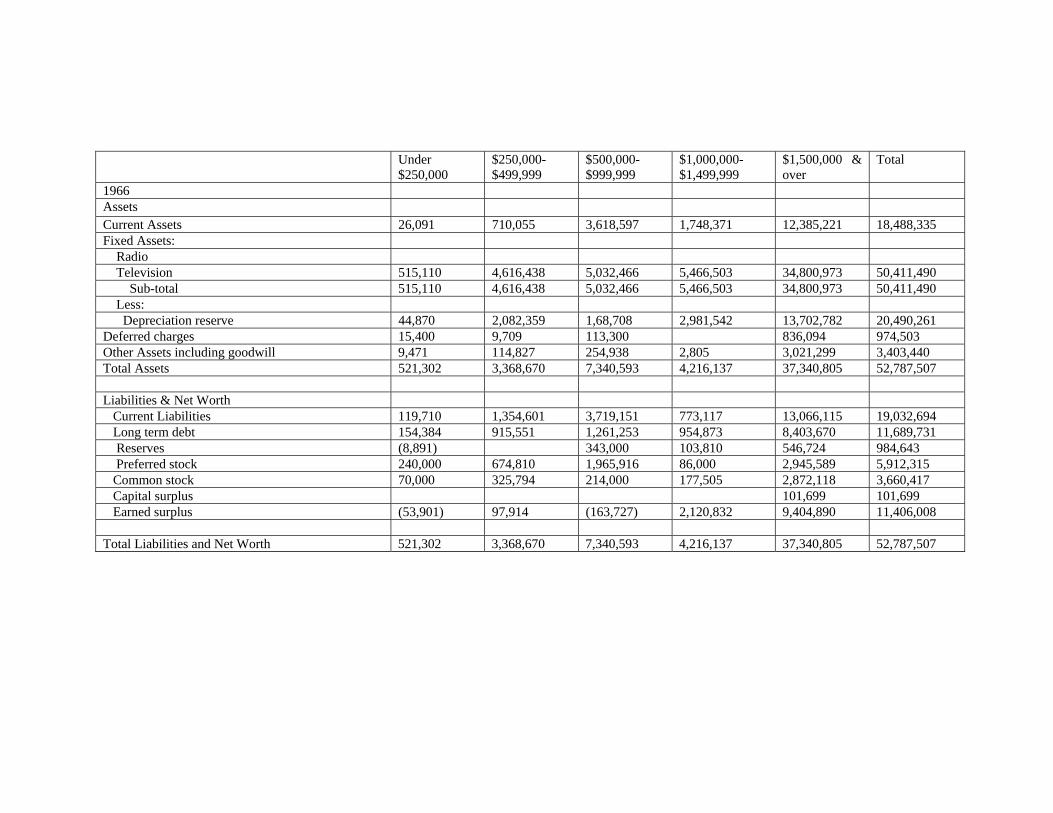
Under $250,000
$250,000- $499,999
$500,000- $999,999
$1,000,000- $1,499,999
$1,500,000 & over
Total
1966 Assets Current Assets 26,091 710,055 3,618,597 1,748,371 12,385,221 18,488,335 Fixed Assets: Radio Television 515,110 4,616,438 5,032,466 5,466,503 34,800,973 50,411,490 Sub-total 515,110 4,616,438 5,032,466 5,466,503 34,800,973 50,411,490 Less: Depreciation reserve 44,870 2,082,359 1,68,708 2,981,542 13,702,782 20,490,261 Deferred charges 15,400 9,709 113,300 836,094 974,503 Other Assets including goodwill 9,471 114,827 254,938 2,805 3,021,299 3,403,440 Total Assets 521,302 3,368,670 7,340,593 4,216,137 37,340,805 52,787,507 Liabilities & Net Worth Current Liabilities 119,710 1,354,601 3,719,151 773,117 13,066,115 19,032,694 Long term debt 154,384 915,551 1,261,253 954,873 8,403,670 11,689,731 Reserves (8,891) 343,000 103,810 546,724 984,643 Preferred stock 240,000 674,810 1,965,916 86,000 2,945,589 5,912,315 Common stock 70,000 325,794 214,000 177,505 2,872,118 3,660,417 Capital surplus 101,699 101,699 Earned surplus (53,901) 97,914 (163,727) 2,120,832 9,404,890 11,406,008 Total Liabilities and Net Worth 521,302 3,368,670 7,340,593 4,216,137 37,340,805 52,787,507
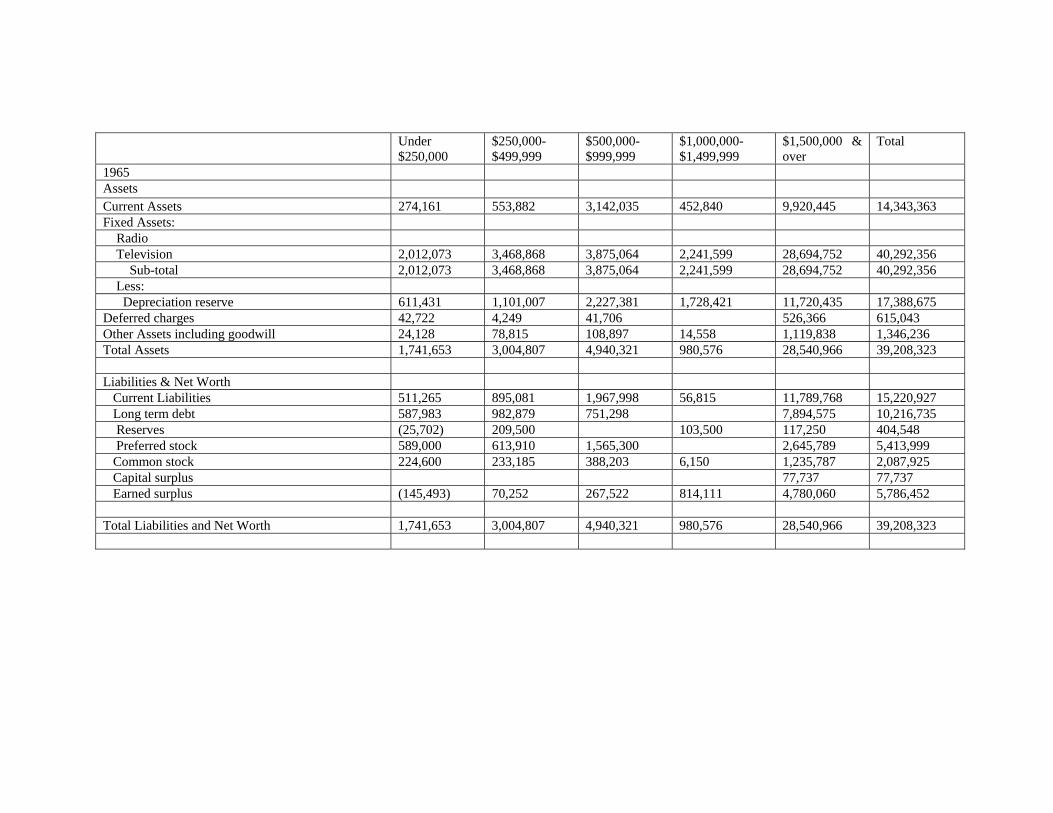
Under $250,000
$250,000- $499,999
$500,000- $999,999
$1,000,000- $1,499,999
$1,500,000 & over
Total
1965 Assets Current Assets 274,161 553,882 3,142,035 452,840 9,920,445 14,343,363 Fixed Assets: Radio Television 2,012,073 3,468,868 3,875,064 2,241,599 28,694,752 40,292,356 Sub-total 2,012,073 3,468,868 3,875,064 2,241,599 28,694,752 40,292,356 Less: Depreciation reserve 611,431 1,101,007 2,227,381 1,728,421 11,720,435 17,388,675 Deferred charges 42,722 4,249 41,706 526,366 615,043 Other Assets including goodwill 24,128 78,815 108,897 14,558 1,119,838 1,346,236 Total Assets 1,741,653 3,004,807 4,940,321 980,576 28,540,966 39,208,323 Liabilities & Net Worth Current Liabilities 511,265 895,081 1,967,998 56,815 11,789,768 15,220,927 Long term debt 587,983 982,879 751,298 7,894,575 10,216,735 Reserves (25,702) 209,500 103,500 117,250 404,548 Preferred stock 589,000 613,910 1,565,300 2,645,789 5,413,999 Common stock 224,600 233,185 388,203 6,150 1,235,787 2,087,925 Capital surplus 77,737 77,737 Earned surplus (145,493) 70,252 267,522 814,111 4,780,060 5,786,452 Total Liabilities and Net Worth 1,741,653 3,004,807 4,940,321 980,576 28,540,966 39,208,323
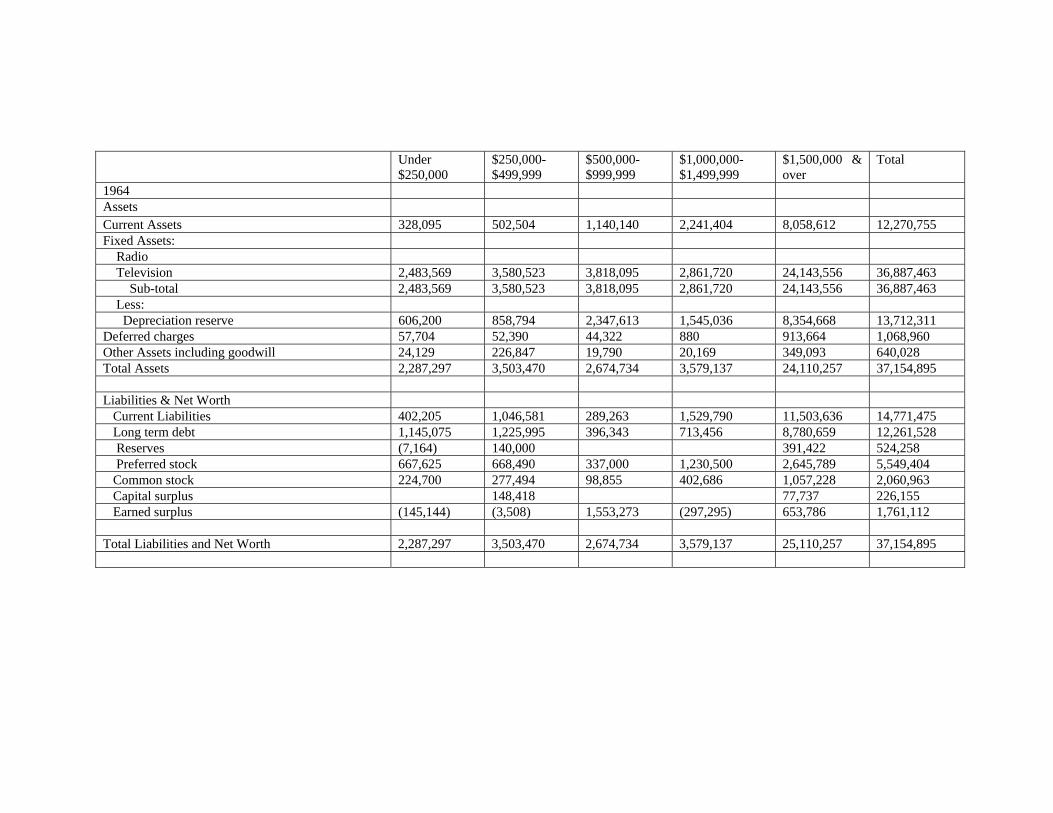
Under $250,000
$250,000- $499,999
$500,000- $999,999
$1,000,000- $1,499,999
$1,500,000 & over
Total
1964 Assets Current Assets 328,095 502,504 1,140,140 2,241,404 8,058,612 12,270,755 Fixed Assets: Radio Television 2,483,569 3,580,523 3,818,095 2,861,720 24,143,556 36,887,463 Sub-total 2,483,569 3,580,523 3,818,095 2,861,720 24,143,556 36,887,463 Less: Depreciation reserve 606,200 858,794 2,347,613 1,545,036 8,354,668 13,712,311 Deferred charges 57,704 52,390 44,322 880 913,664 1,068,960 Other Assets including goodwill 24,129 226,847 19,790 20,169 349,093 640,028 Total Assets 2,287,297 3,503,470 2,674,734 3,579,137 24,110,257 37,154,895 Liabilities & Net Worth Current Liabilities 402,205 1,046,581 289,263 1,529,790 11,503,636 14,771,475 Long term debt 1,145,075 1,225,995 396,343 713,456 8,780,659 12,261,528 Reserves (7,164) 140,000 391,422 524,258 Preferred stock 667,625 668,490 337,000 1,230,500 2,645,789 5,549,404 Common stock 224,700 277,494 98,855 402,686 1,057,228 2,060,963 Capital surplus 148,418 77,737 226,155 Earned surplus (145,144) (3,508) 1,553,273 (297,295) 653,786 1,761,112 Total Liabilities and Net Worth 2,287,297 3,503,470 2,674,734 3,579,137 25,110,257 37,154,895
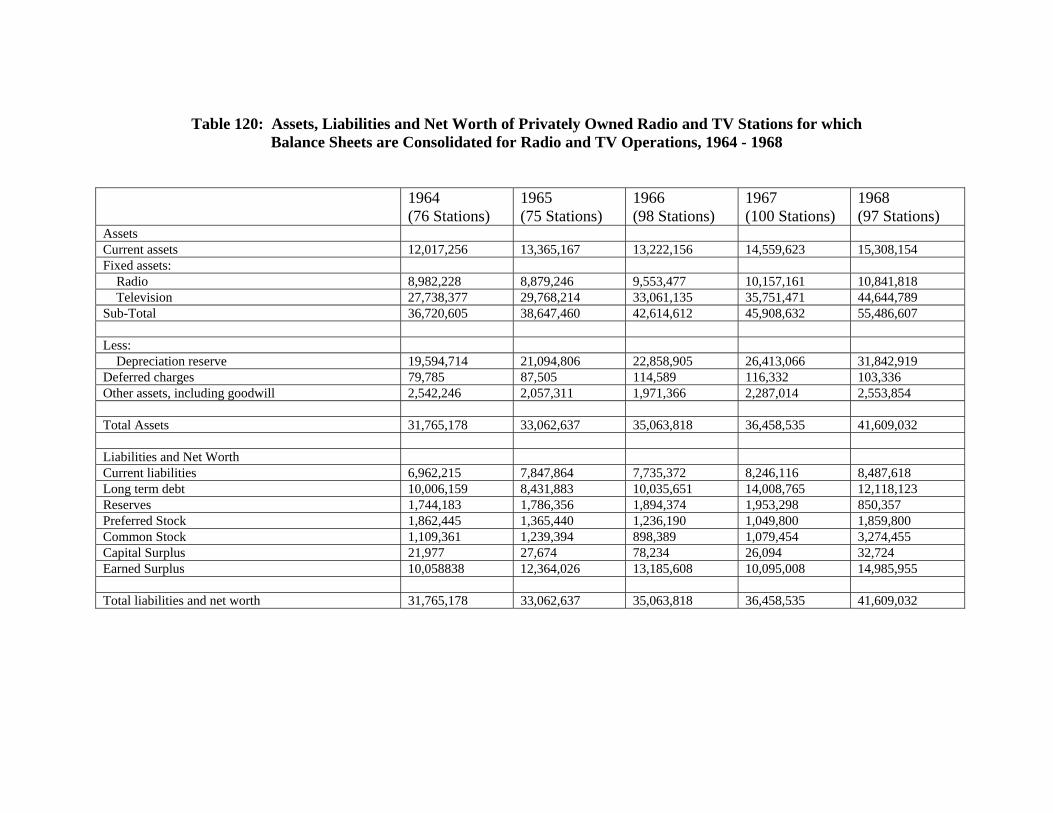
Table 120: Assets, Liabilities and Net Worth of Privately Owned Radio and TV Stations for which
Balance Sheets are Consolidated for Radio and TV Operations, 1964 - 1968
1964
(76 Stations) 1965 (75 Stations)
1966 (98 Stations)
1967 (100 Stations)
1968 (97 Stations)
Assets Current assets 12,017,256 13,365,167 13,222,156 14,559,623 15,308,154 Fixed assets: Radio 8,982,228 8,879,246 9,553,477 10,157,161 10,841,818 Television 27,738,377 29,768,214 33,061,135 35,751,471 44,644,789 Sub-Total 36,720,605 38,647,460 42,614,612 45,908,632 55,486,607 Less: Depreciation reserve 19,594,714 21,094,806 22,858,905 26,413,066 31,842,919 Deferred charges 79,785 87,505 114,589 116,332 103,336 Other assets, including goodwill 2,542,246 2,057,311 1,971,366 2,287,014 2,553,854 Total Assets 31,765,178 33,062,637 35,063,818 36,458,535 41,609,032 Liabilities and Net Worth Current liabilities 6,962,215 7,847,864 7,735,372 8,246,116 8,487,618 Long term debt 10,006,159 8,431,883 10,035,651 14,008,765 12,118,123 Reserves 1,744,183 1,786,356 1,894,374 1,953,298 850,357 Preferred Stock 1,862,445 1,365,440 1,236,190 1,049,800 1,859,800 Common Stock 1,109,361 1,239,394 898,389 1,079,454 3,274,455 Capital Surplus 21,977 27,674 78,234 26,094 32,724 Earned Surplus 10,058838 12,364,026 13,185,608 10,095,008 14,985,955 Total liabilities and net worth 31,765,178 33,062,637 35,063,818 36,458,535 41,609,032
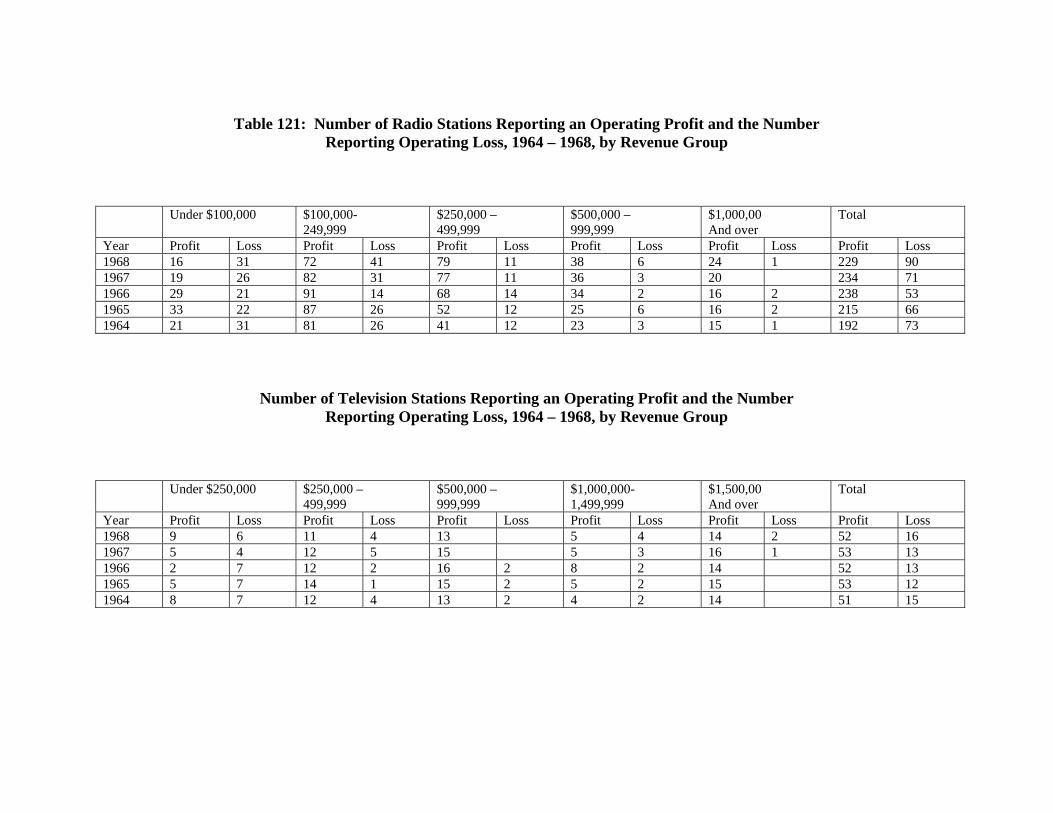
Table 121: Number of Radio Stations Reporting an Operating Profit and the Number
Reporting Operating Loss, 1964 – 1968, by Revenue Group
Under $100,000 $100,000-
249,999 $250,000 – 499,999
$500,000 – 999,999
$1,000,00 And over
Total
Year Profit Loss Profit Loss Profit Loss Profit Loss Profit Loss Profit Loss 1968 16 31 72 41 79 11 38 6 24 1 229 90 1967 19 26 82 31 77 11 36 3 20 234 71 1966 29 21 91 14 68 14 34 2 16 2 238 53 1965 33 22 87 26 52 12 25 6 16 2 215 66 1964 21 31 81 26 41 12 23 3 15 1 192 73
Number of Television Stations Reporting an Operating Profit and the Number Reporting Operating Loss, 1964 – 1968, by Revenue Group
Under $250,000 $250,000 –
499,999 $500,000 – 999,999
$1,000,000- 1,499,999
$1,500,00 And over
Total
Year Profit Loss Profit Loss Profit Loss Profit Loss Profit Loss Profit Loss 1968 9 6 11 4 13 5 4 14 2 52 16 1967 5 4 12 5 15 5 3 16 1 53 13 1966 2 7 12 2 16 2 8 2 14 52 13 1965 5 7 14 1 15 2 5 2 15 53 12 1964 8 7 12 4 13 2 4 2 14 51 15

Table 122: Property Account of Privately-owned Radio Stations
By Revenue Group, 1964 - 1968
Year Under $100,000 $100,000 – 249,999
$250,000 – 499,999
$500,000 – 999,999
$1,000,000 And over
Total
1968 Land 169,460 971,725 1,537,709 923,202 1,612,073 5,214,169 Buildings 624,889 2,430,431 3,946,097 2,160,816 3,415,096 12,613,329 Technical & Studio Equipment 2,814,452 9,482,491 12,554,329 8,918,414 8,482,600 42,252,296 Motorized Vehicles &Equipment 69,105 338,687 1,022,296 534,978 301,719 2,266,785 Furniture & Fixtures 196,757 901,114 1,395,233 940,651 1,158,844 4,592,599 Unamortized Portion of Leasehold Improvements
164,476 465,403 325,332 508,708 456,192 1,920,111
Other 46,922 977,686 282,347 552,897 1,070,717 2,930,569 Total Fixed Assets 4,086,071 15,567,537 21,063,343 14,539,666 16,533,241 71,789,858 Depreciation 1,299,256 7,887,817 11,314,450 7,696,435 8,642,107 36,840,065 Net Fixed Assets 2,786,815 7,679,720 9,748,893 6,843,231 7,891,134 34,949,793 1967
Land 158,912 902,511 1,311,624 700,461 1,011,360 4,084,868 Buildings 589,425 2,854,429 3,608,827 2,771,251 2,550,046 12,373,978 Technical & Studio Equipment 2,229,450 ,622,692 14,267,357 8,415,134 6,997,338 40,531,971 Motorized Vehicles &Equipment 69,514 333,720 691,971 246,915 230,157 1,572,277 Furniture & Fixtures 170,269 856,261 1,520,948 925,820 982,650 4,455,948 Unamortized Portion of Leasehold Improvements
101,752 174,699 473,784 159,205 465,665 1,375,105
Other 47,115 1,001,390 623,699 92,132 809,692 2,574,028 Total Fixed Assets 3,366,437 14,745,702 22,498,210 13,310,918 13,046,908 66,968,175 Depreciation 1,220,057 8,023,605 11,097,887 7,845,612 6,906,508 35,093,669 Net Fixed Assets 2,146,380 6,722,097 11,400,323 5,465,306 6,140,400 31,874,506

1966
Land 173,764 820,582 1,094,448 590,455 1,076,421 3,755,670 Buildings 735,699 2,402,524 3,381,392 2,138,107 1,953,305 10,611,027 Technical & Studio Equipment 2,732,220 8,770,697 13,450,096 7,705,216 7,434,848 40,093,077 Motorized Vehicles &Equipment 77,327 370,822 661,696 241,950 200,131 1,551,926 Furniture & Fixtures 173,519 900,400 1,320,107 844,658 953,726 4,192,410 Unamortized Portion of Leasehold Improvements
85,416 217,857 274,712 233,132 520,790 1,331,907
Other 45,123 1,024,282 146,538 1,340,985 27,627 2,584,555 Total Fixed Assets 4,023,068 14,507,164 20,328,989 13,094,503 12,166,848 64,120,572 Depreciation 1,471,982 7,790,090 10,219,721 6,607,238 6,686,298 32,775,329 Net Fixed Assets 2,551,086 6,717,074 10,109,268 6,487,265 5,480,550 31,345,243 1965
Land 191,507 1,439,432 1,201,827 508,174 1,402,616 4,743,556 Buildings 924,342 2,542,048 2,141,015 2,872,456 1,511,136 9,990,997 Technical & Studio Equipment 3,293,940 10,229,732 8,051,296 7,338,709 6,592,340 35,506,017 Motorized Vehicles &Equipment 90,118 410,300 440,697 221,143 206,663 1,368,921 Furniture & Fixtures 253,150 1,033,203 945,215 757,355 783,160 3,772,083 Unamortized Portion of Leasehold Improvements
88,199 273,986 144,411 168,190 211,638 986,424
Other 91,839 1,276,373 334,298 493,217 18,109 2,213,836 Total Fixed Assets 4,933,095 17,205,074 13,258,759 12,335,244 10,825,662 58,581,834 Depreciation 2,094,959 7,862,584 7,352,666 6,501,470 5,747,157 29,558,836 Net Fixed Assets 2,838,136 9,342,490 5,906,093 5,857,774 5,078,505 29,022,998
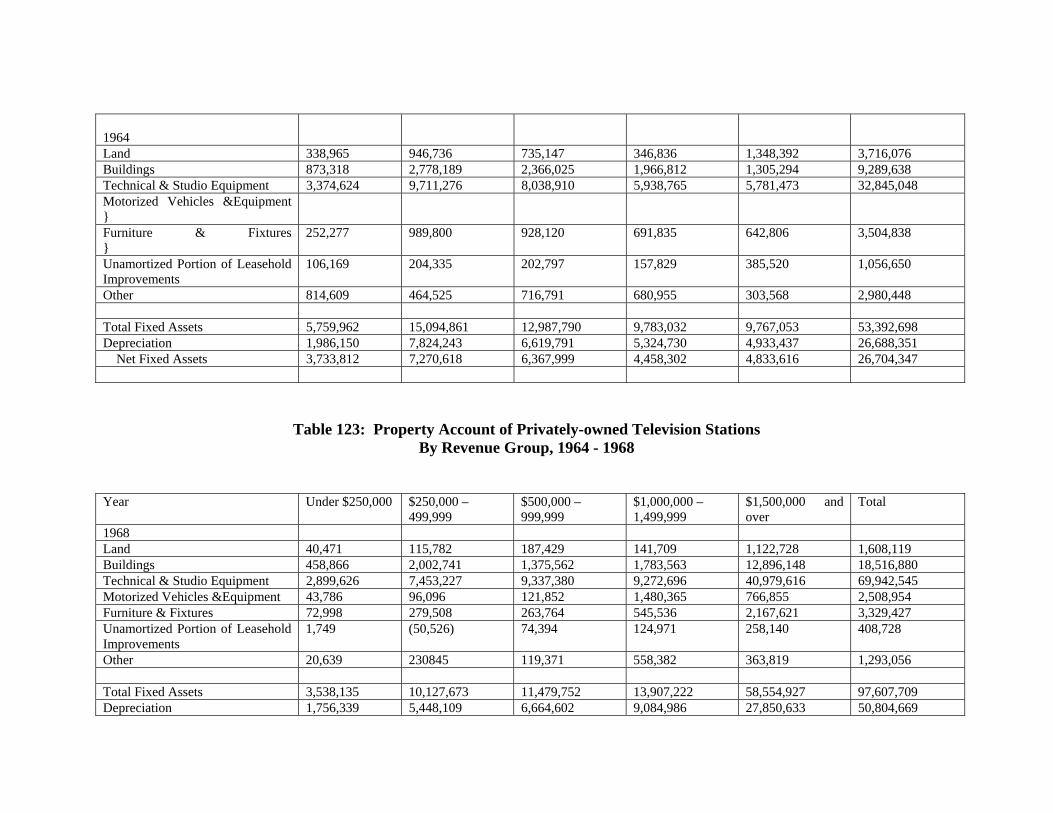
1964
Land 338,965 946,736 735,147 346,836 1,348,392 3,716,076 Buildings 873,318 2,778,189 2,366,025 1,966,812 1,305,294 9,289,638 Technical & Studio Equipment 3,374,624 9,711,276 8,038,910 5,938,765 5,781,473 32,845,048 Motorized Vehicles &Equipment }
Furniture & Fixtures }
252,277 989,800 928,120 691,835 642,806 3,504,838
Unamortized Portion of Leasehold Improvements
106,169 204,335 202,797 157,829 385,520 1,056,650
Other 814,609 464,525 716,791 680,955 303,568 2,980,448 Total Fixed Assets 5,759,962 15,094,861 12,987,790 9,783,032 9,767,053 53,392,698 Depreciation 1,986,150 7,824,243 6,619,791 5,324,730 4,933,437 26,688,351 Net Fixed Assets 3,733,812 7,270,618 6,367,999 4,458,302 4,833,616 26,704,347
Table 123: Property Account of Privately-owned Television Stations By Revenue Group, 1964 - 1968
Year Under $250,000 $250,000 – 499,999
$500,000 – 999,999
$1,000,000 – 1,499,999
$1,500,000 and over
Total
1968 Land 40,471 115,782 187,429 141,709 1,122,728 1,608,119 Buildings 458,866 2,002,741 1,375,562 1,783,563 12,896,148 18,516,880 Technical & Studio Equipment 2,899,626 7,453,227 9,337,380 9,272,696 40,979,616 69,942,545 Motorized Vehicles &Equipment 43,786 96,096 121,852 1,480,365 766,855 2,508,954 Furniture & Fixtures 72,998 279,508 263,764 545,536 2,167,621 3,329,427 Unamortized Portion of Leasehold Improvements
1,749 (50,526) 74,394 124,971 258,140 408,728
Other 20,639 230845 119,371 558,382 363,819 1,293,056 Total Fixed Assets 3,538,135 10,127,673 11,479,752 13,907,222 58,554,927 97,607,709 Depreciation 1,756,339 5,448,109 6,664,602 9,084,986 27,850,633 50,804,669

Net Fixed Assets 1,781,796 4,679,564 4,815,150 4,822,236 30,704,294 46,803,040
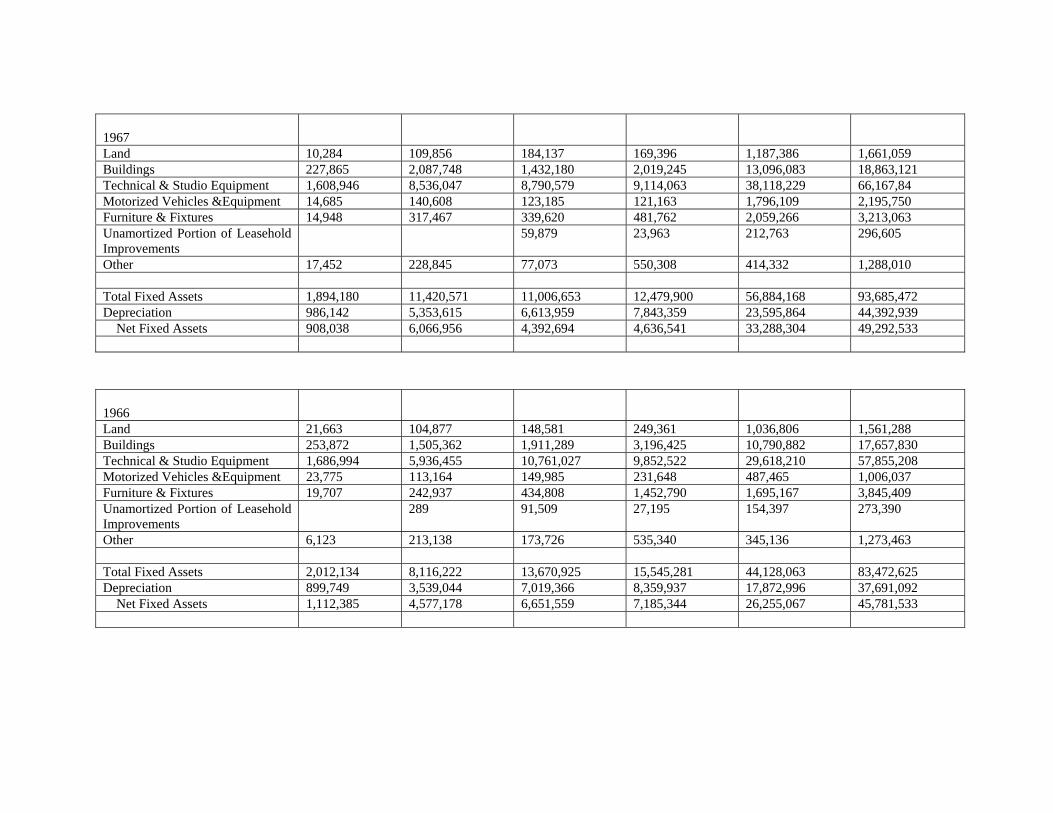
1967
Land 10,284 109,856 184,137 169,396 1,187,386 1,661,059 Buildings 227,865 2,087,748 1,432,180 2,019,245 13,096,083 18,863,121 Technical & Studio Equipment 1,608,946 8,536,047 8,790,579 9,114,063 38,118,229 66,167,84 Motorized Vehicles &Equipment 14,685 140,608 123,185 121,163 1,796,109 2,195,750 Furniture & Fixtures 14,948 317,467 339,620 481,762 2,059,266 3,213,063 Unamortized Portion of Leasehold Improvements
59,879 23,963 212,763 296,605
Other 17,452 228,845 77,073 550,308 414,332 1,288,010 Total Fixed Assets 1,894,180 11,420,571 11,006,653 12,479,900 56,884,168 93,685,472 Depreciation 986,142 5,353,615 6,613,959 7,843,359 23,595,864 44,392,939 Net Fixed Assets 908,038 6,066,956 4,392,694 4,636,541 33,288,304 49,292,533
1966
Land 21,663 104,877 148,581 249,361 1,036,806 1,561,288 Buildings 253,872 1,505,362 1,911,289 3,196,425 10,790,882 17,657,830 Technical & Studio Equipment 1,686,994 5,936,455 10,761,027 9,852,522 29,618,210 57,855,208 Motorized Vehicles &Equipment 23,775 113,164 149,985 231,648 487,465 1,006,037 Furniture & Fixtures 19,707 242,937 434,808 1,452,790 1,695,167 3,845,409 Unamortized Portion of Leasehold Improvements
289 91,509 27,195 154,397 273,390
Other 6,123 213,138 173,726 535,340 345,136 1,273,463 Total Fixed Assets 2,012,134 8,116,222 13,670,925 15,545,281 44,128,063 83,472,625 Depreciation 899,749 3,539,044 7,019,366 8,359,937 17,872,996 37,691,092 Net Fixed Assets 1,112,385 4,577,178 6,651,559 7,185,344 26,255,067 45,781,533
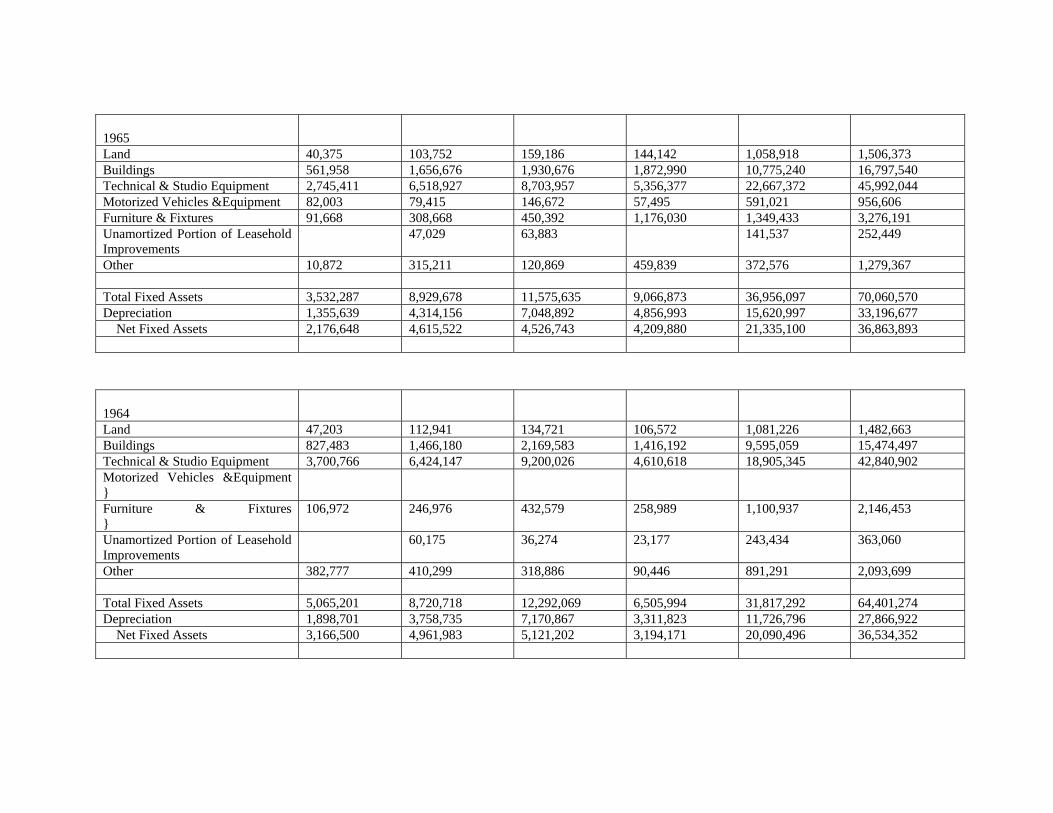
1965
Land 40,375 103,752 159,186 144,142 1,058,918 1,506,373 Buildings 561,958 1,656,676 1,930,676 1,872,990 10,775,240 16,797,540 Technical & Studio Equipment 2,745,411 6,518,927 8,703,957 5,356,377 22,667,372 45,992,044 Motorized Vehicles &Equipment 82,003 79,415 146,672 57,495 591,021 956,606 Furniture & Fixtures 91,668 308,668 450,392 1,176,030 1,349,433 3,276,191 Unamortized Portion of Leasehold Improvements
47,029 63,883 141,537 252,449
Other 10,872 315,211 120,869 459,839 372,576 1,279,367 Total Fixed Assets 3,532,287 8,929,678 11,575,635 9,066,873 36,956,097 70,060,570 Depreciation 1,355,639 4,314,156 7,048,892 4,856,993 15,620,997 33,196,677 Net Fixed Assets 2,176,648 4,615,522 4,526,743 4,209,880 21,335,100 36,863,893
1964
Land 47,203 112,941 134,721 106,572 1,081,226 1,482,663 Buildings 827,483 1,466,180 2,169,583 1,416,192 9,595,059 15,474,497 Technical & Studio Equipment 3,700,766 6,424,147 9,200,026 4,610,618 18,905,345 42,840,902 Motorized Vehicles &Equipment }
Furniture & Fixtures }
106,972 246,976 432,579 258,989 1,100,937 2,146,453
Unamortized Portion of Leasehold Improvements
60,175 36,274 23,177 243,434 363,060
Other 382,777 410,299 318,886 90,446 891,291 2,093,699 Total Fixed Assets 5,065,201 8,720,718 12,292,069 6,505,994 31,817,292 64,401,274 Depreciation 1,898,701 3,758,735 7,170,867 3,311,823 11,726,796 27,866,922 Net Fixed Assets 3,166,500 4,961,983 5,121,202 3,194,171 20,090,496 36,534,352


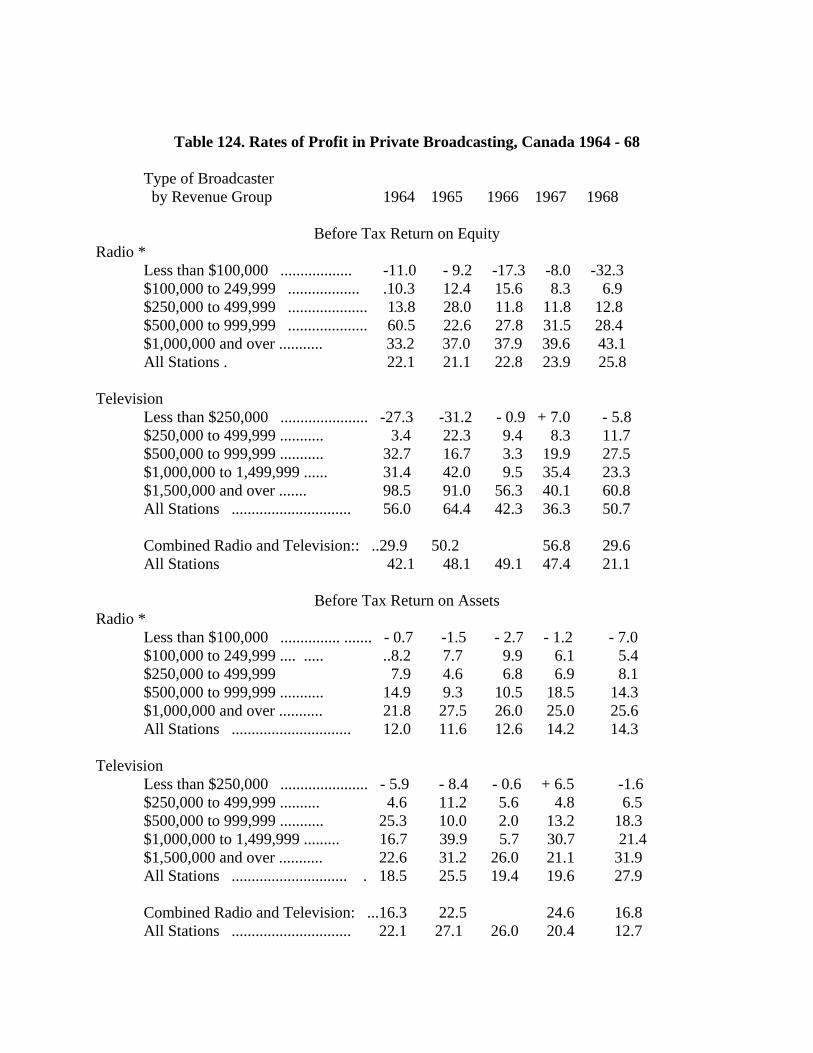
Table 124. Rates of Profit in Private Broadcasting, Canada 1964 - 68
Type of Broadcaster by Revenue Group 1964 1965 1966 1967 1968
Before Tax Return on Equity
Radio * Less than $100,000 .................. -11.0 - 9.2 -17.3 -8.0 -32.3 $100,000 to 249,999 .................. .10.3 12.4 15.6 8.3 6.9 $250,000 to 499,999 .................... 13.8 28.0 11.8 11.8 12.8 $500,000 to 999,999 .................... 60.5 22.6 27.8 31.5 28.4 $1,000,000 and over ........... 33.2 37.0 37.9 39.6 43.1 All Stations . 22.1 21.1 22.8 23.9 25.8
Television
Less than $250,000 ...................... -27.3 -31.2 - 0.9 + 7.0 - 5.8 $250,000 to 499,999 ........... 3.4 22.3 9.4 8.3 11.7 $500,000 to 999,999 ........... 32.7 16.7 3.3 19.9 27.5 $1,000,000 to 1,499,999 ...... 31.4 42.0 9.5 35.4 23.3 $1,500,000 and over ....... 98.5 91.0 56.3 40.1 60.8 All Stations .............................. 56.0 64.4 42.3 36.3 50.7 Combined Radio and Television:: ..29.9 50.2 56.8 29.6 All Stations 42.1 48.1 49.1 47.4 21.1
Before Tax Return on Assets
Radio * Less than $100,000 ............... ....... - 0.7 -1.5 - 2.7 - 1.2 - 7.0 $100,000 to 249,999 .... ..... ..8.2 7.7 9.9 6.1 5.4 $250,000 to 499,999 7.9 4.6 6.8 6.9 8.1 $500,000 to 999,999 ........... 14.9 9.3 10.5 18.5 14.3 $1,000,000 and over ........... 21.8 27.5 26.0 25.0 25.6 All Stations .............................. 12.0 11.6 12.6 14.2 14.3
Television
Less than $250,000 ...................... - 5.9 - 8.4 - 0.6 + 6.5 -1.6 $250,000 to 499,999 .......... 4.6 11.2 5.6 4.8 6.5 $500,000 to 999,999 ........... 25.3 10.0 2.0 13.2 18.3 $1,000,000 to 1,499,999 ......... 16.7 39.9 5.7 30.7 21.4 $1,500,000 and over ........... 22.6 31.2 26.0 21.1 31.9 All Stations ............................. . 18.5 25.5 19.4 19.6 27.9 Combined Radio and Television: ...16.3 22.5 24.6 16.8 All Stations .............................. 22.1 27.1 26.0 20.4 12.7
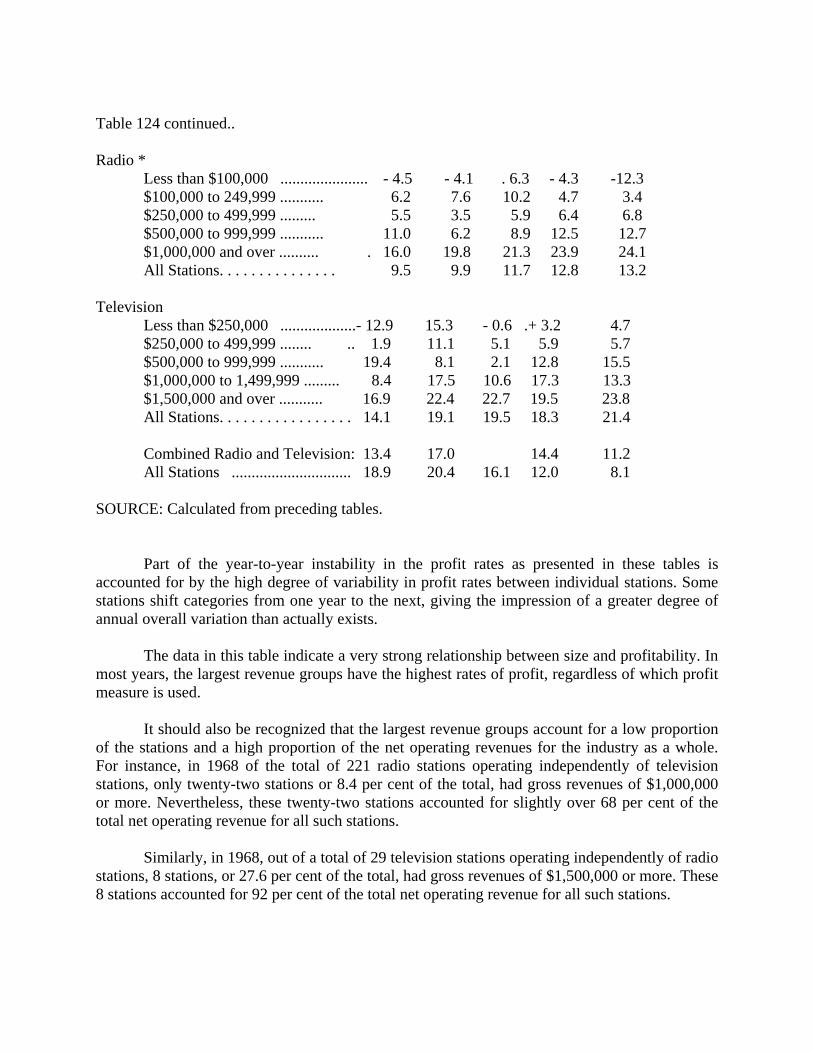
Table 124 continued.. Radio *
Less than $100,000 ...................... - 4.5 - 4.1 . 6.3 - 4.3 -12.3 $100,000 to 249,999 ........... 6.2 7.6 10.2 4.7 3.4 $250,000 to 499,999 ......... 5.5 3.5 5.9 6.4 6.8 $500,000 to 999,999 ........... 11.0 6.2 8.9 12.5 12.7 $1,000,000 and over .......... . 16.0 19.8 21.3 23.9 24.1 All Stations. . . . . . . . . . . . . . . 9.5 9.9 11.7 12.8 13.2
Television
Less than $250,000 ...................- 12.9 15.3 - 0.6 .+ 3.2 4.7 $250,000 to 499,999 ........ .. 1.9 11.1 5.1 5.9 5.7 $500,000 to 999,999 ........... 19.4 8.1 2.1 12.8 15.5 $1,000,000 to 1,499,999 ......... 8.4 17.5 10.6 17.3 13.3 $1,500,000 and over ........... 16.9 22.4 22.7 19.5 23.8 All Stations. . . . . . . . . . . . . . . . . 14.1 19.1 19.5 18.3 21.4 Combined Radio and Television: 13.4 17.0 14.4 11.2 All Stations .............................. 18.9 20.4 16.1 12.0 8.1
SOURCE: Calculated from preceding tables.
Part of the year-to-year instability in the profit rates as presented in these tables is accounted for by the high degree of variability in profit rates between individual stations. Some stations shift categories from one year to the next, giving the impression of a greater degree of annual overall variation than actually exists.
The data in this table indicate a very strong relationship between size and profitability. In most years, the largest revenue groups have the highest rates of profit, regardless of which profit measure is used.
It should also be recognized that the largest revenue groups account for a low proportion of the stations and a high proportion of the net operating revenues for the industry as a whole. For instance, in 1968 of the total of 221 radio stations operating independently of television stations, only twenty-two stations or 8.4 per cent of the total, had gross revenues of $1,000,000 or more. Nevertheless, these twenty-two stations accounted for slightly over 68 per cent of the total net operating revenue for all such stations.
Similarly, in 1968, out of a total of 29 television stations operating independently of radio stations, 8 stations, or 27.6 per cent of the total, had gross revenues of $1,500,000 or more. These 8 stations accounted for 92 per cent of the total net operating revenue for all such stations.
Two reasons may be advanced for the greater profitability of larger stations. First, such stations are generally located in larger urban centres, where there is a much greater absolute demand for advertising than in smaller centres. Second, the larger audiences in the larger urban centres permit stations to maintain high advertising rates while still offering advertisers a relatively low rate when rates are converted to a per viewer or listener basis. As a consequence, advertising rates which would be so high as to discourage advertising on small stations have no corresponding effect on large stations. Costs may not increase as rapidly as it is possible to increase rates with progressively larger size operations, with the result that profits are generally higher for larger size operations.
The data indicate that broadcasting operations are generally more profitable than manufacturing companies taken as a group. The before tax rates of return on equity for manufacturing industries in 1965 and 1966 were 18.9 per cent and 16.9 per cent respectively, and the before tax rates of return on assets were 10.9 per cent and 10.0 per cent.
The trend in profitability for combined radio and television broadcasters has been generally downward since 1966. The decline is particularly noticeable in 1968. However, companies submitting returns to D.B.S. for 1968 were required to adjust their fiscal year, for reporting purposes, to end on August 31. These figures were adjusted by D.B.S. to account for a twelve month period. As may be seen in Appendix E, the 1968 data are not in line with 1967 and 1969 information. While this may be due to inaccuracy caused by adjustment, there were other factors in 1968 which may have affected cash flow:
(a) a decline in the rate of growth of total advertising expenditures in broadcasting in 1968,
(b) stations forming part of combined radio-television operations are generally located in smaller urban centres where the downward trend in advertising revenues in 1968 was most apparent.
It is interesting to note that the revenue of radio stations in Canada increased by 21.7 per
cent from 1967 to 1969 while expenses increased by 21.1 per cent. In 1969 profit ($14.7 million) as a per cent of revenue ($108.1 million) was 13.6 per cent as compared to 13.1 per cent in 1967. In the same period, television revenue rose by 12.0 per cent while expenses grew only 6.7 per cent. In 1969 profit ($21.9 million) as a percent of revenue ($106.6 million) was 20.6 per cent as compared to 16.7 per cent in 1967.
THE COST -PRICE SQUEEZE No financial analysis is complete without a detailed examination of the trends of all costs in relation to the trend in revenues.
"Cost-price squeeze" occurs when input prices rise at a faster rate than the owners of capital are able to increase the price of their product. Turning this idea around we get the so-called "profit-squeeze" in which the rate of profit declines as the rate of increase in costs exceeds the rate of increase in the price of the final product. There is an inherent weakness in any attempt
to measure this "squeeze" because the quality of inputs and the input mix itself, does change over time; in a sense we are not measuring exactly the same input at every point in time.
TELEVISION BROADCASTING INDUSTRY In Chart 26 we have outlined the growth pattern of all costs in the industry; labour, capital, and purchased inputs.
The return to capital increased significantly between 1962-68, by approximately 303 per cent. Increases in wages and salaries and the cost of purchased inputs during the same period were 63 per cent and 97 per cent respectively. (See Chart 27.)
From 1963 to 1966, the rate of growth of gross returns to capital exceeded the rates of changes in the cost of purchased inputs and in the cost of labour (gross returns to labour).
This is illustrated in the chart by the widening of the gaps between the "gross returns to capital" curve and all other curves, over time. In this same period the rate of growth in depreciation allowances was less than the rate of growth of gross returns to capital; thus, we can conclude that during the period 1963-66 the television industry did not experience a "profit-squeeze," but rather, a growth in the rate of profits.
The year 1967 was a year of profit-squeeze as the cost of purchased inputs, of wages and salaries, and of capital all grew at faster rates than did the return to capital. If any inflation in the advertising rates structure occurred during 1967, the inflation could justifiably be of the "cost-push" variety.
In 1968, the return to capital grew at a significantly high rate while the growth of all other costs levelled off.
RADIO BROADCASTING INDUSTRY The radio broadcasting industry, during 1962-1968 did not experience a "profit-squeeze." The growth of gross returns to capital consistently grew faster than the gross returns to labour and the cost of purchased input; this is illustrated in Chart 28.
In Chart 28 we observe that the gross returns to capital and growth of capitalization essentially grew at the same rates between 1964 and 1966. Since the cost of capital consumption, of labour and of purchased inputs did not grow at any faster rate during 1968, the slight decline in the growth of capital returns is attributed to a fall in revenues, i.e., a slight decrease in the demand for radio advertising.
Chart 29 illustrates the distribution of production costs by size of station. The cost of labour and the cost of capital decrease in proportion to the size of the station , indicating that there is no possible "cost-squeeze" from these two factors auction as the stations grow in size. The cost of purchased inputs does increase in proportion in the latter two categories. In our discussion of production costs we explained the change in the nature of purchased inputs in these size in comparison to the other groups. If there were any cost-squeeze as the station grows in size, the change in the mix of purchased inputs would be the cause.
COST ECONOMIES AND THE PROBLEM OF MARKET INSTABILITY
As we noted in connection with newspapers economies of large-scale production occur in broadcasting, when a station can increase its circulation without any increase in cost-per-unit-of-output (circulation). The cost function would theoretically be a downward sloping curve as indicated in Chart 30.
The argument for a "natural monopoly" is based on this declining cost curve. That is, whenever costs decline with output, one firm tends to dominate the industry because it can sell its product at the lowest price-per-unit and still cover all production costs.
We hypothesize that the broadcasting industry exhibits a decreasing cost function and thus has the attributes of a natural monopoly. Natural monopoly industries are characterized by unstable shares of the market. The instability of shares exists as-long as one or more of the firms in the industry compete for the existing market. Competition for a greater share of the existing market is explained by the fact that as each firm increases its output, the costs-per-unit fall. As one firm is increasing its share of" the market, its competitor's share is decreasing. Thus the larger firm's competitive position improves on two accounts: its· cost-per-unit-of-output falls as it expands, and the competitor's cost-per-unit increases as its share of the market decreases. As a result, the larger firms tend to drive the smaller firms out of the market.
The broadcasting industries differ somewhat from the true "natural monopoly" industry. In the main, each broadcasting station operates within a restricted market. The industry cost curve indicates that the optimal market for any station would be all of Canada. However, each station is confined to a specific market. When a station is established, its frequency, in the case of radio, or channel in the case of television, and its area of broadcasting are well established. In fact, the C.R.T.C. will not issue broadcasting licenses if it deems that the particular market will not support an additional station. All these regulating restrictions explicitly confine each broadcasting station to a specific market.
Therefore, in hypothesizing that the broadcasting industry is a "natural monopoly," we are explicitly referring to a local "natural monopoly," however one wishes to define the size of the local market.
In large metropolitan areas, the community is so diverse that, given the large revenue base, the adjustment towards a monopoly is slow or perhaps non-existent. The diversity in the listening greatly accounts for the stability of these markets. For example, with the CBC, CTV and independent CHCH (Hamilton) sharing the Toronto market, the individual has the choice of different types of programming, especially between CBC and cry.
COST ECONOMIES, CONCENTRATION AND MONOPOLY PROFITS In the study of daily newspapers, found in the first section of this report, significant cost economies were found to be associated with increasing circulation size. The evidence for this was largely empirical, although theoretical framework was provided which was in accordance with the data. Many of the theoretical arguments applicable to daily newspapers are also applicable to broadcasters. On the other hand, a number of important differences arise, and these must be taken into account.
In order to clarify some of the economic issues relating to broadcasting enterprises, a hypothetical situation will be presented first. In this situation, two -television stations are compared, one located in a small urban centre, the other in a major metropolitan area. It is supposed that both these stations have a monopoly, both have the same size transmitters, both broadcast for the same number of hours, and both carry the same proportion of network to non-network programming. It is further supposed that both make the same dollar-expenditures on non-network programming, and both carry the same number of advertising minutes per hour.
The point of making these many assumptions is to create a hypothetical situation in which two stations are as alike as possible in all respects except audience size. As a result, it is possible to assume that both would require the same amount of gross income to meet all costs and to earn an acceptable or normal rate of profit.
However, suppose that one station had a listening audience of 500,000, and the other a listening audience of 100,000. Under the above assumptions, if both stations were to meet all
costs and earn the same profit, their rates per minute for advertising would have to be exactly the same. Let us arbitrarily assume that this rate is $200 per minute.
The advertising rate per thousand viewers in the case of the larger station would be forty cents, while in the case of the smaller station it would be two dollars. As a consequence, advertisers would have to pay five times as much per potential customer on the smaller station as on the larger station.
As a corollary to this, broadcaster expenditures per viewer would also be significantly lower for the larger station than for the smaller station. This suggests that the potential exists for achieving considerable cost economies in broadcast through expanded audience size.
Now suppose that two stations broadcast within the same geographical area, as a result, compete for the same viewing audience and for the same advertising dollars. If one station gains this type of advantage over another in terms of preferences, and is able to do so without undertaking expenditures greatly in excess of its competitor, it will have a competitive edge in attracting advertiser dollars to its lower advertising cost per viewer. Advertisers would be expected to prefer lower cost medium, thus shifting revenue away from the smaller station and to the larger station. It might be expected that, in this way, larger stations would generally have such an advantage over smaller competitors as to make it impossible for the latter to remain competitive.
A number of factors tend to retard this type of adjustment, particularly at points with a large viewing audience which is confined within a relatively geographical area. First, regulations exist which limit the amount of time may be used for advertising. In a large market, a single station would not be a command all of the available advertising revenue, no matter how attractive it be able to make its rates. A "spill-over" of advertising would take place, providing a . source of revenue to a competing station.
Second, it is not generally possible for a station to gain a large advantage in viewing audience without expenditures on programming and promotion substantially greater than its competitor. As a consequence, any improvement advertising rate per viewer which might be achieved through larger numbers of viewers could be offset by increases in the advertising rate per minute necessitated by the larger expenditures.
Third, advertisers are not attracted, in a completely indiscriminate manner to stations with the lowest rate-per-viewer. Many advertisers are interested in a select sector of the community, and the important consideration to these advertisers is the cost of reaching these particular members of the audience. For instance, a station with a very large total audience may have a much smaller number of viewers or listeners than a competitor with a much smaller total audience. As a consequence, advertisers wishing to reach the teenage market might actually find it more economical to use the broadcasters with the smaller total audience.
The limitation on the amount of advertising on a station would appear to be most important in the television sector, where, in most large centres, advertising dollars have generally been sufficient to maintain more than one station operative. In addition, with a strong demand for
advertising time, and with the largest and most popular station able to provide only a limited number of minutes per day to advertisers, there is an incentive for such a station to maintain its advertising rate per viewer at a relatively high level, even though the large size reduces operating costs per viewer. The reason for this is simply that any reduction in the rate would decrease the station's revenue, since there is no room to accept extra advertising time which might be induced to come forward as a result of the rate reduction. As a direct consequence, it is possible for relatively large stations to generate significantly in excess of rates generally prevailing in other parts of the economy. This explains the relatively high profit rates found to prevail among the large television stations in Canada.
Table 125 indicates prime-time rates per 60 second spot. These rates are calculated on the basis of the charge per thousand viewers for selected Canadian television stations. Rates per thousand do tend to decline as circulation size creases, although there is considerable variation depending upon the station. This indicates that a part, at least, of the economies from larger circulation are passed on advertisers through lower rates per thousand. However, it can also be seen that, for example, CFTO (Toronto) has utilized its larger circulation size to maintain its per sixty second rate 25 per cent higher than its competitor, CHCH (Hamilton), thus creating a rate per thousand only slightly below that of CHCH. CFTO is, no doubt, able to set its rate at this level because its available time for advertising is fully utilized, and a lower rate per thousand would be of no benefit to
Table 125: Rate per Thousand for Selected television stations, 1968
Daily Circulation * Rate per Rate per Station Night-time 60 Seconds Thousand
Dollars Dollars CFTO (Toronto) 1,222,200 500 .41 CHCH (Hamilton) 819,800 425 .52 CHAN (Vancouver) 375,900 265 .70 CJAY (Winnipeg) 325,000 270 .83 CFRN (Edmonton) 385,700 280 .73 CFCN (Calgary) 314,300 225 .72 CHSJ (St. John) 296,200 170 .57 CFQC (Saskatoon) 188,400 150 .80 CKRS (Jonquiere) 151,800 85 .56 CJCB (Sydney) 160,600 150 .93 CKVR (Barrie) 219,200 140 .64 CKOS (Yorkton) 185,300 125 .68 CHEK (Victoria) 101,000 120 1.19 CKNX (Wingham) 109,400 90 .82 CKWS (Kingston) 139,600 95 .68 CHAU (Carleton) 122,500 60 .49

CKBL (Matane) 104,700 70 .67 Table 125 continued.. CFCY (Charlottetown) 96,400 60 .62 CKRT (Riv. Du Loup) 82,700 50 .60 CHEX (Peterborough) 119,800 95 .79 CKRD (Red Deer) 56,800 85 1.50 CFCH (North Bay) 60,400 70 1.16 Total number of viewers above two years of age. SOURCE: Canadian Advertising Rates and Data, December 1969. BBM Circulation Report, Oct. 27 to Nov. 9, 1969. Radio broadcasting in Canada is characterized by a large number of stations offering a diverse content and by a large number of competitive situations. This can attributed to the success which radio broadcasters have had in devising programming that appeals to a select portion of the total audience technically in of any given station. As a consequence, many small stations are successfully competing against larger stations with lower rates per thousand simply by being able to guarantee delivery of advertising messages to the select clientele served by the smaller stations.
CONCLUSIONS Profitability of broadcasting in Canada is, as a general rule, a direct function of size: the larger the station, the higher the rates of profitability, whichever profit measure is used.
In 1968 for example of the total of 221 radio stations operating independently of television stations only twenty-two radio stations, or 8.4 per cent of the total, had gross revenues of $1,000,000 or more. But these twenty-two stations accounted for just over 68 per cent of the total net operating revenue for all such stations.
The size-profitability relationship is even more striking in television. In 1968, out of a total of twenty-nine television stations operating independently of radio stations, eight stations, or 27.6 per cent of the total, had gross revenues of $1.5 million or more. These eight stations accounted for 92 per cent total net operating revenue of the twenty-nine stations in the group.
Profitability in both radio and television broadcasting showed wide fluctuation in the years studied. This is accounted for primarily by the high degree of variability in profit rates among individual stations.
Levels of profitability vary significantly depending on the nature of the broadcast organization. For example, general profit trends for combined radio and television operations were downward in the period 1964-1968. For television operations alone, there is no consistent trend and profitability varies widely among individual stations. For radio stations operating

independently of television stations, profitability showed a relatively stable upward trend over the period.
The evident trend toward local monopolies found in the daily newspaper industry is not so apparent in broadcasting. This is due primarily to the fact that time available for advertising in television and radio is limited by regulation, and to the fact that relatively small radio and television stations can compete with large operations in the major metropolitan areas by developing programming that appeals to selective audiences, thus enabling the smaller stations to attract advertising that might otherwise go to the larger broadcast outlets with lower viewer rates per thousand.

Section Four: CABLE TELEVISION

Chapter 1:
THE CABLE REVOLUTION
INTRODUCTION Canadian cable television had its beginning in London, Ontario in 1952. For a number of years it grew only slowly and fitfully. But it is now showing distinct signs of growing into a lusty giant that is likely to revolutionize the broadcasting industry and many other facets of our life.
It was not .until 1967 that the Dominion Bureau of Statistics considered cable television of sufficient importance to measure its dimensions. It reported 314 systems operating in Canada that year with 408,853 individual subscribers and 107,631 other outlets, such as apartment buildings making a total of 516,484.
In a speech to the Canadian Cable Television Association in Quebec City on May 14, 1969, Pierre Juneau, the Chairman of the C.R.T.C., calculated the industry was growing at the rate of 25 per cent a year. Today, there are over 400 systems operating in Canada. The best available estimate is that some 900,000 household units have cable television; this represents about 17 per cent of all homes with television in Canada. There are, in fact, indications that the number of Canadians viewing television by cable is increasing more swiftly than the 25 per cent annual rate foreseen by the C.R.T.C. chairman. A CBC study of the March, 1969, audience analysis by the Bureau of Broadcast Measurement concluded that an estimated 3.1 million people watched some television via cable in an average week during that month. This amounted to around 15.3 per cent of the total Canadian population two years of age and over, and about 15.9 per cent of those who watched television during the week. "This 3.1 million represents about a 59 percent increase over the number of people using cable TV in an average week 16 months earlier, in November, 1967. That is, over these sixteen months, the extent of usage of cable TV facilities has grown at an average rate of between 3 1/2 per cent and 4 per cent per month nationally." 1. On that basis, it appears that cable has been growing over the past several months at an annual rate of as much as 48 per cent. 1 The results of this study by the CBC research department, kindly made available by the corpo. ration, are reproduced in full at the end of this section because they provide the most compre· hensive and detailed picture of the extent of cable television development in Canada ever portrayed publicly.
In relative terms, the growth of cable television in Canada has out-paced that in the United States. The Television Factbook estimates that at the beginning of 1969 there were 3.6 million subscribers to cable systems in the United States, which represents only 6.29 per cent of the number of homes with television. The largest Canadian cable television system that in Vancouver, has some 85,000 subscribers and is more than twice the size of the biggest system south of the border.
At the outset, cable systems were established to provide reception of television signals in areas where little or no off-the-air reception was available by ordinary household antennas. The
greatest impetus for the swift spread of cable systems today has come from a desire to obtain better-quality reception, particularly in the case of colour, for signals that may be distorted by off-the-air pickup because of distance or of interference caused by high-rise buildings, or both.
To many in television broadcasting, this swiftly spreading web of coaxial cable through the country has become a matter of mounting concern. In its first annual report, the C.R.T.C. described it as the single most complex area of its concern. In the growing years of its own new technology, television broadcasting caused grave concern throughout the newspaper and radio industries because of its hold on audience attention and its concomitant ability to attract advertising dollars. Now, ironically, television owners find themselves confronted by a still newer technology, making use of their own programming product, that threatens to splinter the mass audiences 'from which their revenues are derived.
There are, undoubtedly, many reasons for the much swifter growth of cable television in Canada than in the United States. Probably the most important is the limited or non-existent choice of programmes from Canadian television stations and the desire on the part of many Canadian viewers to obtain good quality reception of popular American television stations. By contrast, viewers in most larger American centres have a multiple choice of programmes that can be received clearly without cable.
The approach of government authorities to cable television has also differed markedly in the two countries, which in turn has had a bearing on the rate of growth on both sides of the border. In Canada, cable television has been allowed to develop almost willy-nilly. Until the new Broadcasting Act came into effect and transferred the authority to the Canadian Radio-Television Commission, cable systems were licensed by the Department of Transport, usually on the advice of the B.B.G. While the B.B.G. occasionally recommended the rejection of certain applications for fear of the impact they would have on existing television stations or in the development of new ones, neither D.O.T. nor B.B.G. appeared to have had much awareness of the economics of cable systems as such, nor much knowledge based on fact of the impact of cable on existing television stations.
In the United States, the Federal Communications Commission generally has been far more apprehensive about the impact of cable television and far more restrictive in the policies established. For example, the F.C.C. has not only required cable systems to carry the signals of local stations on request, but also on request to avoid duplicating programmes to be carried the same day by a local broadcaster. Cable systems are prohibited from bringing distant stations into the primary broadcast area (within the grade A contour) of a local television station in any of the 100 largest markets in the United States. The only exception is if a cable system can demonstrate that such a course “will be consistent with the public interest and, particularly, with the establishment and healthy maintenance of television – especially UHF – broadcast service in the area.”
In December, 1968 the F.C.C. proposed a new rule under which cable systems located in the top 100 markets would be permitted to import distant signals only with the permission of the originating station. The commission also raised for consideration a proposal that cable systems
be required to originate programming and asked for views on the regulation that should apply to commercials, political broadcasts and fairness.
As Mr. Juneau told the Canadian Cable Television Association in his address, cable systems were regulated in the past by the Department of Transport “largely on the basis of technical aspects.” Under the Broadcast Act, he pointed out, “CATV becomes a part of the Canadian broadcasting system and decisions, policies and regulations which concern it must take into account the effects they may have on other aspects of the system.”
As the chairman noted, the commission has had little in the way of precedent established in other countries to go by, since Canada is a pioneer in the development of cable systems. While the commission has been rapidly assembling much background information on the nature of cable and its impact on the country generally, and broadcasting in particular, its approach must inevitably be inhibited by the tremendous growth that has already taken place
At its hearing in Vancouver in October, 1969, the C.R.T.C. considered the general policy it had inherited from the Department of Transport of prohibiting more than one microwave relay hop from the head-end receiver to connect with the cable system itself, an issue that will be discussed at greater length later. During the course of this hearing, the commissioners indicated some considerable concern about the economic impact of cable systems on television broadcasters and about its effect in bringing a still greater infusion of American programmes into the country.
A question that arises at the outset is whether the commission’s concern is rather belated. In its report of 1965, the Fowler Committee estimated that some 54 per cent of Canadian television homes could receive broadcasts directly from American television stations. In his testimony before the October, 1969 hearing of the C.R.T.C., Hon. Raymond Reierson, Alberta’s Minister of Telephones, contended that some 80 per cent of the Canadian people were within reach of American television signals. A more conservative and more widely accepted estimate is approximately 68 per cent. 2 Testimony of Rosel H. Hyde, then Chairman of the F.C.C., to Sub-Committee on Communications of the Senate Committee on Commerce, March 4, 1969, page 47. Some authorities within the broadcasting industry estimate that approximately 60 per cent of the Canadian population may receive American television broadcasts off-the-air and perhaps as many as an additional 5 per cent by cable, making a total of only 65 per cent. Much of the present development of cable television is taking place in areas where there is already substantial access to American stations through off-the-air reception, Toronto being a prime example. By making available additional American channels or offering improved reception of those already received off-the-air, cable television may well increase the amount of Canadian Viewing of American ·stations.
This increase in the proportion of Canadian audiences with direct access to American television is the result of a number of factors, including the increased concentration of audiences in cities close to the border, improved off-the-air reception, and cable television. Even if the further spread of cable television is limited by continuing restrictions on the use of microwave to relay signals of distant American stations, the extent of viewing of American stations is certain to
increase as more and more Canadians become subscribers of the hundreds of cable systems already licensed by the C.R.T.C. (It might be noted that these new or renewed licences have been issued during a period when the commission has still been searching for an understanding of the economics of cable systems and of their economic impact - actual or potential - on television stations.)
The Dominion Bureau of Statistics has estimated that 3.6 million potential subscribers reside in areas already licensed for cable television operation in 1967; this represents 75 per cent of the actual number of television homes fu Canada that year.
AUTHORITY OF THE C.R.T.C. OVER CABLE TELEVISION
For a number of years, the federal government has assumed some authority to regulate community antenna television systems. Until 1968, this regulation was undertaken by the Department of Transport. As Mr. Juneau has suggested, the Department was primarily concerned with technical matters, but its decisions also at times took into account such issues as the economic impact of a cable system on television broadcasting. The limitation on the use of microwave relays clearly reflected a government policy aimed primarily at restricting the influx of American television broadcasting via cable television in areas not located close to American stations.
The Broadcasting Act, which handed over regulatory authority to the C.R.T.C., defined cable systems as broadcasting undertakings and makes it clear that they should be controlled as an integral part of the whole broadcast system in Canada.
On the strength of that authority, the C.R.T.C. has assumed a right to regulate two distinct and separate aspects of cable operation. In an announcement on May 13, 1969, the Commission laid down a number of rules governing the role of cable systems as a relayer of broadcasts by television stations. This included the priority to be given to the stations that were to be carried the availability of community antenna service throughout the franchise area and a prohibition against the formation of cable television networks.
In addition to picking up the signals of television stations from the airwaves and relaying them to television receivers by coaxial cable, cable systems also have a capacity to originate their own programming, which is transmitted solely by cable. In its May announcement, the C.R.T.C. presumed a right to regulate this function as well. The Commission not only indicated the type of programming that it favoured, and, in fact, encouraged, but further declared that it would not permit cable systems to carry commercials during such programming except under special circumstances or for experimental purposes.
The Commission also laid down a condition that the rate structure stipulated in the licence could be changed only with approval of the regulatory authority. This provision affects both functions of a cable system more particularly since the Commission's prohibition of commercials during programming originated by a cable company largely restricts its revenue to the monthly rental charges.

Past declarations by senior federal officials appear to raise a possibility that the Commission's attempt to exercise jurisdiction over the programming operation of a cable system may be subject to challenge in the courts. The issue was discussed at some length on November 21, 1967, before the Standing Committee of the House of Commons on Broadcasting, Films, and Assistance to the Arts by J.R. Baldwin, then Deputy Minister of Transport, F.C. Nixon, Director of the Department's Telecommunication and Electronics Branch and Fred Gibson, Senior Advisory Counsel of the Department of Justice. All of the officials acknowledged that the federal government lacked authority, at least under any existing or proposed legislation to regulate closed circuit television programming undertaken entirely by wire and making no use of any over-the-air broadcast facility at any point. Mr. Nixon, in fact, went so far as to suggest that neither the Radio Act nor the Broadcasting Act would give the federal government authority to regulate the transmission entirely by wire of an American television station's signal to Canadian outlets. "If it is a cable operation throughout, I do not believe it would be subject to any legislation now or any that is proposed at this time," Mr. Nixon conceded.
The specific question of the federal government's right to regulate the programming originated by cable companies was raised during this hearing, but elicited no clear answer:
The undertaking as a whole would be subject to licence. I presume that the Canadian Radio Commission, in licensing it, would attach certain conditions to its licence. It is not inconceivable that those conditions could affect the terms on which it entered into direct cable transmissions to supplement its broadcasting receiving function.
Subsequently, however, a member of the committee suggested that it might be strongly
argued that the regulatory authority lacked any jurisdiction over the direct programming of cable systems. Mr. Gibson's reply did nothing to diminish this possibility:
Yes, Sir, it could be argued; but I believe it would have to be argued on the specific terminology of any condition that the C.R.C. proposed to improve on a CATV system. The C.R.C.'s jurisdiction is limited of course by the terms of the Bill - referring to clause 17 (1) (a) (i) on page 8 of the new Bill - and to the extent that any condition is appropriate for the implementation of the broadcasting policy enunciated in section 2, it would be my view that it was within the powers of the Commission to provide such a condition. On the other hand, if a condition was clearly aimed not at implementing broadcasting policy but at some other element of the undertaking's activity which is unrelated to its broadcasting receiving activity, then in my view there would be a good chance that that condition would be invalid.
The government’s White Paper on Broadcasting itself noted on page 14 that While these problems of jurisdiction remain, the C.R.T.C. has, in effect assumed the right to regulate the closed-circuit operations of a cable system by virtue of its unchallenged power to regulate their quite separate function as a community antenna system. Should the former exercise of power by the Commission ever be successfully challenged in the courts, it could conceivably mean the loss of regulatory control not only over programming but also over commercials that might be carried on closed-circuit basis. By the

same token, the prohibition of the C.R.T.C. of cable systems forming networks might also be wiped out, at least so far as closed-circuit programming carried over a group of cable systems.
Chapter 2:
THE ECONOMICS OF CABLE TELEVISION
INTRODUCTION In a public announcement on July, 10, 9, touching on some of the considerations it took into account in licensing community antenna television systems, the C.R.T.C. observed that following the public hearings, begun in September the previous year, the importance of cable television became more apparent: "Many persons or companies with the resources to provide a service became actively interested." This massive upsurge in interest in cable television is related in a direct way, as the Commission seemed to imply, to the disclosure that came out of hearing of the very large profit potential offered by the cable- television business. While the outlook for future profits from cable television may, infact, be considerably less bright today because of the thrust of C.R.T.C. policy, the scramble to enter the field has not diminished. On the Commission's schedule for hearings in Ottawa beginning November 25, 1969, there were ten different applications for cable television licences in Sudbury and district alone. .
This section of our report seeks only to indicate in a general way some of the economic dimensions of the cable television industry. There are, of course, wide variations between systems, depending on a number of factors affecting costs and revenues; the size and density of the market; the extent to which a multiple choice of programming is available off-the-air in any given area; the nature of the terrain and the proximity of stations whose signal is to be relayed over the cable system and the related cost of the head-end antenna; the distance the signal must be carried from the head-end antenna to the market area· the cost of installing or leasing the main trunk cable, distribution cables to serve each area and the cables running to the television sets in each household, together with all the associated electronic equipment. The amount of time any system has been in operation and the extent to which it has been able to take advantage of its market potential are equally vital elements in the whole economic picture.
The 1967 examination of the cable industry by D.B.S. only partially revealed its earnings potential. The Bureau estimated that there were 406 licensed systems in that year, of which 314 were in operation. Operating revenues amounted to $22,114,690 and operating expenditures came to $20,463,027- leaving a net operating profit of $1,651,663. After including other revenues and expenses, the net income before tax amounted to $1,605,061. An apparently exceptionally high income tax payment, not explained by D.B.S., of $1,131,380 reduced net income to $473,681. On the face of it, this net return appears far from high. It represents only 2.14 per cent of operating revenue, 1.8 per cent of fixed assets and. 0.87 per cent of total assets. That return amounts 03.81 per cent of invested equity in the form of common and preferred stocks.
Despite this apparently low return, the industry added $1,292,6 9 to its surplus, offset by
a deduction of $33,54 during the period, representing funds acquired from such items as profit on the ales of capital assets, adjustment for prior years' income tax, depreciation, connection costs, the writing off of goodwill, incorporation expenses, etc. On balance, the industry succeeded in adding $977,417 to its surplus during the year, despite the fact that dividend payments exceeded after-tax income by $311,707.
Of the 314 systems in operation during 1967, 231 were relatively small, with operating revenue of less than $100,000 and a total loss of more than $350,000. Cable systems with operating revenues of more than $100,000 made some profit as a group. A total of 19 systems with operating revenues exceeding 400,000, which implies a system of at least some 6,000 subscribers, had an average operating profit of $81,283, which represented an average profit on operating revenues of 15.7 per cent.
If the D.B.S. report did not pint an overly bright earnings picture for 1967, it pointed to the possibility of substantially greater returns in the future. The bureau calculated that the number of· individual subscribers and the number of outlets under commercial and bulk contracts came to around 515,000 at year. But it estimated that the number of potential subscribers in areas already wired with cable amounted to 1.2 million while there was a total of 3.6 million potential subscribers in the franchise area the companies were licensed to serve.
A brief preliminary report by D.B.S. on the financial results of the industry for 1968 - issued November 10, 1969 - appeared to confirm the high profit potential hinted at in the survey of the previous year. The bureau estimate total operating revenue in the industry rose by 41 5 per cent in 1968 to a total of 31.3 million, an increase of $9.2 million.
Operating expenses rose by only $5.9 million to a total of $2 .4 million. The result was that operating profits climbed to $4.9 million, an increase of $3.2 million over 1967.
In 1967, the Advertising Research Foundation estimated as a result of a study reported in the 1968 annual issue of Broadcasting Magazine at "virtually all CATV systems earn a high rate of return on invested capital." As of 1966, only four out of a total of 1,600 systems were known to have failed, the study added.
A similar picture was painted in the Canadian Telephone and Cable Television Journal by David R. Graham and James D. Meekison, two Canadians who have been actively involved in the financing of major Canadian cable television systems following extensive experience· the United States. "The average system has a 'pay-back' period of six to eight ears" they wrote. "That is, after this time period, the system has generated sufficient cash after paying all expenditures to pay back to the original investors all of their advances and equity investment." The authors appeared to confirm the impression of the C.R.T.C. announcement in July 1969, that until recently there was relatively little appreciation among Canadian financial interests of the profit potential offered by cable television.
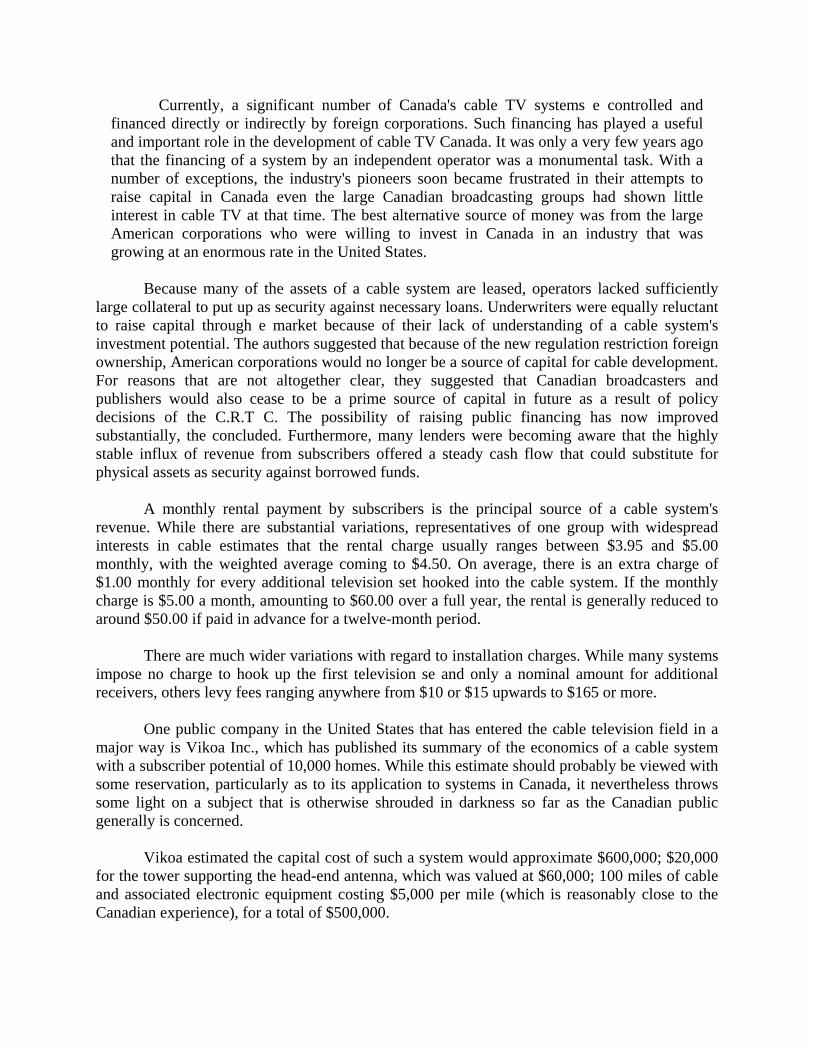
Currently, a significant number of Canada's cable TV systems e controlled and financed directly or indirectly by foreign corporations. Such financing has played a useful and important role in the development of cable TV Canada. It was only a very few years ago that the financing of a system by an independent operator was a monumental task. With a number of exceptions, the industry's pioneers soon became frustrated in their attempts to raise capital in Canada even the large Canadian broadcasting groups had shown little interest in cable TV at that time. The best alternative source of money was from the large American corporations who were willing to invest in Canada in an industry that was growing at an enormous rate in the United States.
Because many of the assets of a cable system are leased, operators lacked sufficiently
large collateral to put up as security against necessary loans. Underwriters were equally reluctant to raise capital through e market because of their lack of understanding of a cable system's investment potential. The authors suggested that because of the new regulation restriction foreign ownership, American corporations would no longer be a source of capital for cable development. For reasons that are not altogether clear, they suggested that Canadian broadcasters and publishers would also cease to be a prime source of capital in future as a result of policy decisions of the C.R.T C. The possibility of raising public financing has now improved substantially, the concluded. Furthermore, many lenders were becoming aware that the highly stable influx of revenue from subscribers offered a steady cash flow that could substitute for physical assets as security against borrowed funds.
A monthly rental payment by subscribers is the principal source of a cable system's revenue. While there are substantial variations, representatives of one group with widespread interests in cable estimates that the rental charge usually ranges between $3.95 and $5.00 monthly, with the weighted average coming to $4.50. On average, there is an extra charge of $1.00 monthly for every additional television set hooked into the cable system. If the monthly charge is $5.00 a month, amounting to $60.00 over a full year, the rental is generally reduced to around $50.00 if paid in advance for a twelve-month period.
There are much wider variations with regard to installation charges. While many systems impose no charge to hook up the first television se and only a nominal amount for additional receivers, others levy fees ranging anywhere from $10 or $15 upwards to $165 or more.
One public company in the United States that has entered the cable television field in a major way is Vikoa Inc., which has published its summary of the economics of a cable system with a subscriber potential of 10,000 homes. While this estimate should probably be viewed with some reservation, particularly as to its application to systems in Canada, it nevertheless throws some light on a subject that is otherwise shrouded in darkness so far as the Canadian public generally is concerned.
Vikoa estimated the capital cost of such a system would approximate $600,000; $20,000 for the tower supporting the head-end antenna, which was valued at $60,000; 100 miles of cable and associated electronic equipment costing $5,000 per mile (which is reasonably close to the Canadian experience), for a total of $500,000.
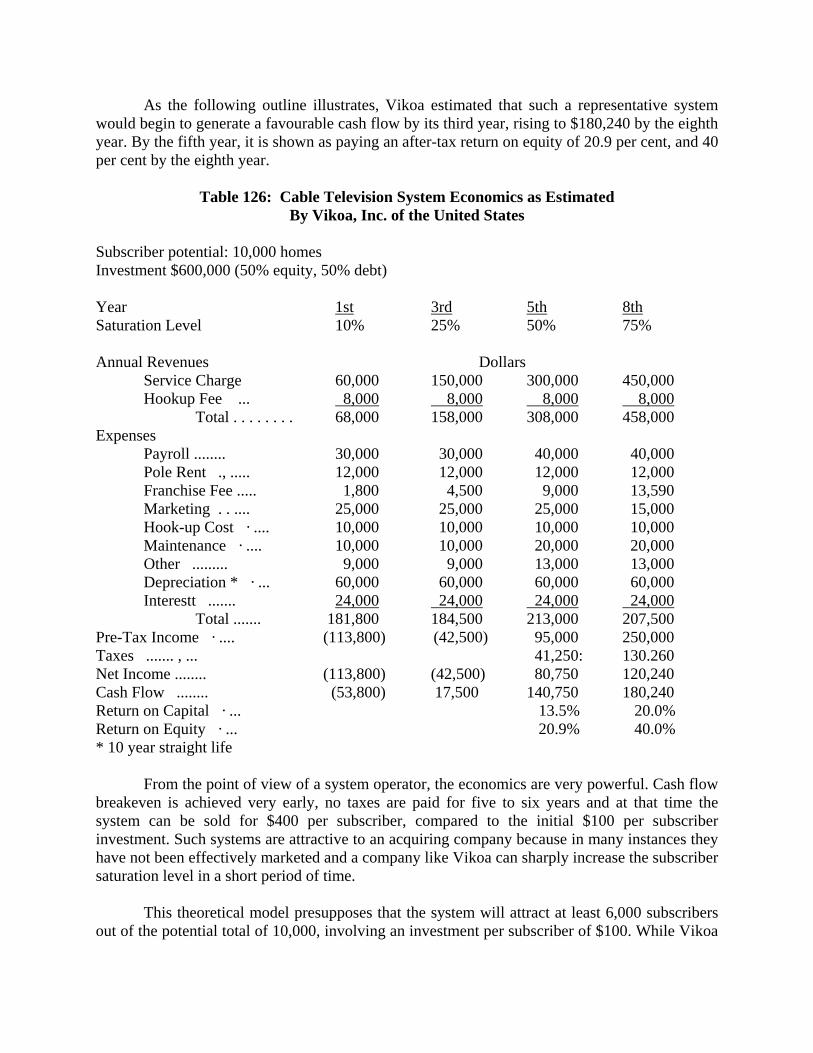
As the following outline illustrates, Vikoa estimated that such a representative system would begin to generate a favourable cash flow by its third year, rising to $180,240 by the eighth year. By the fifth year, it is shown as paying an after-tax return on equity of 20.9 per cent, and 40 per cent by the eighth year.
Table 126: Cable Television System Economics as Estimated By Vikoa, Inc. of the United States
Subscriber potential: 10,000 homes Investment $600,000 (50% equity, 50% debt) Year 1st 3rd 5th 8th Saturation Level 10% 25% 50% 75% Annual Revenues Dollars
Service Charge 60,000 150,000 300,000 450,000 Hookup Fee ... 8,000 8,000 8,000 8,000
Total . . . . . . . . 68,000 158,000 308,000 458,000 Expenses
Payroll ........ 30,000 30,000 40,000 40,000 Pole Rent ., ..... 12,000 12,000 12,000 12,000 Franchise Fee ..... 1,800 4,500 9,000 13,590 Marketing . . .... 25,000 25,000 25,000 15,000 Hook-up Cost · .... 10,000 10,000 10,000 10,000 Maintenance · .... 10,000 10,000 20,000 20,000 Other ......... 9,000 9,000 13,000 13,000 Depreciation * · ... 60,000 60,000 60,000 60,000 Interestt ....... 24,000 24,000 24,000 24,000
Total ....... 181,800 184,500 213,000 207,500 Pre-Tax Income · .... (113,800) (42,500) 95,000 250,000 Taxes ....... , ... 41,250: 130.260 Net Income ........ (113,800) (42,500) 80,750 120,240 Cash Flow ........ (53,800) 17,500 140,750 180,240 Return on Capital · ... 13.5% 20.0% Return on Equity · ... 20.9% 40.0% * 10 year straight life
From the point of view of a system operator, the economics are very powerful. Cash flow breakeven is achieved very early, no taxes are paid for five to six years and at that time the system can be sold for $400 per subscriber, compared to the initial $100 per subscriber investment. Such systems are attractive to an acquiring company because in many instances they have not been effectively marketed and a company like Vikoa can sharply increase the subscriber saturation level in a short period of time.
This theoretical model presupposes that the system will attract at least 6,000 subscribers out of the potential total of 10,000, involving an investment per subscriber of $100. While Vikoa
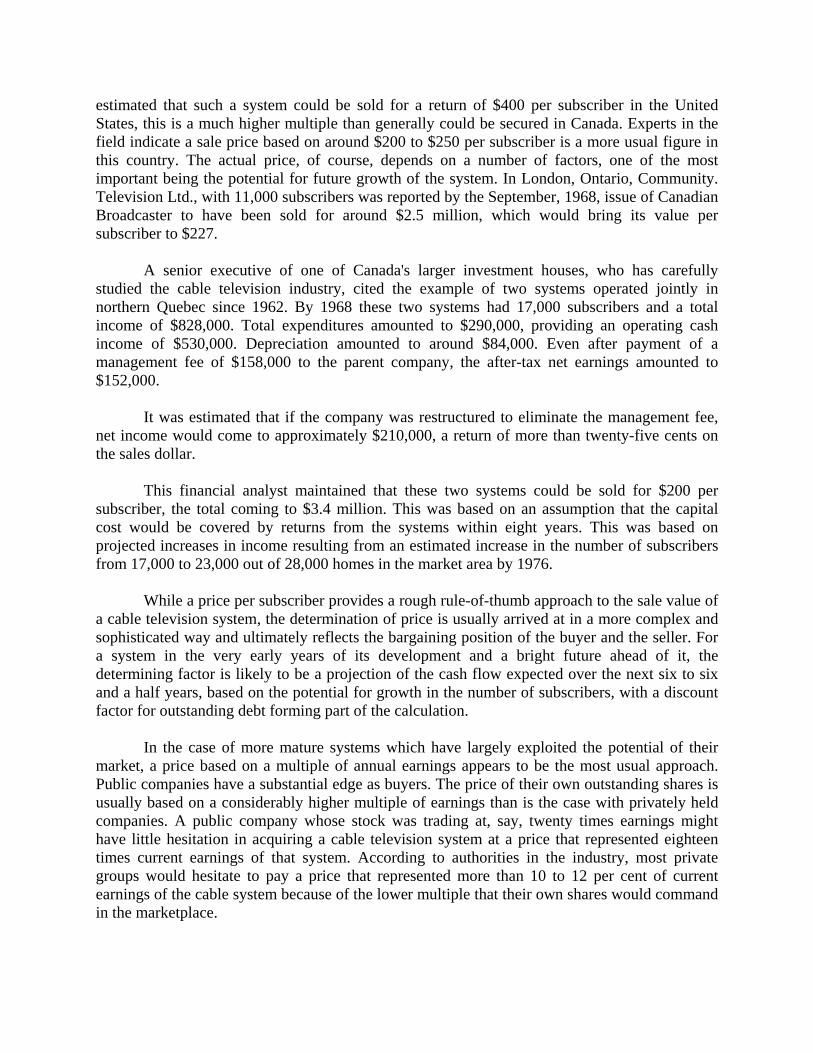
estimated that such a system could be sold for a return of $400 per subscriber in the United States, this is a much higher multiple than generally could be secured in Canada. Experts in the field indicate a sale price based on around $200 to $250 per subscriber is a more usual figure in this country. The actual price, of course, depends on a number of factors, one of the most important being the potential for future growth of the system. In London, Ontario, Community. Television Ltd., with 11,000 subscribers was reported by the September, 1968, issue of Canadian Broadcaster to have been sold for around $2.5 million, which would bring its value per subscriber to $227.
A senior executive of one of Canada's larger investment houses, who has carefully studied the cable television industry, cited the example of two systems operated jointly in northern Quebec since 1962. By 1968 these two systems had 17,000 subscribers and a total income of $828,000. Total expenditures amounted to $290,000, providing an operating cash income of $530,000. Depreciation amounted to around $84,000. Even after payment of a management fee of $158,000 to the parent company, the after-tax net earnings amounted to $152,000.
It was estimated that if the company was restructured to eliminate the management fee, net income would come to approximately $210,000, a return of more than twenty-five cents on the sales dollar.
This financial analyst maintained that these two systems could be sold for $200 per subscriber, the total coming to $3.4 million. This was based on an assumption that the capital cost would be covered by returns from the systems within eight years. This was based on projected increases in income resulting from an estimated increase in the number of subscribers from 17,000 to 23,000 out of 28,000 homes in the market area by 1976.
While a price per subscriber provides a rough rule-of-thumb approach to the sale value of a cable television system, the determination of price is usually arrived at in a more complex and sophisticated way and ultimately reflects the bargaining position of the buyer and the seller. For a system in the very early years of its development and a bright future ahead of it, the determining factor is likely to be a projection of the cash flow expected over the next six to six and a half years, based on the potential for growth in the number of subscribers, with a discount factor for outstanding debt forming part of the calculation.
In the case of more mature systems which have largely exploited the potential of their market, a price based on a multiple of annual earnings appears to be the most usual approach. Public companies have a substantial edge as buyers. The price of their own outstanding shares is usually based on a considerably higher multiple of earnings than is the case with privately held companies. A public company whose stock was trading at, say, twenty times earnings might have little hesitation in acquiring a cable television system at a price that represented eighteen times current earnings of that system. According to authorities in the industry, most private groups would hesitate to pay a price that represented more than 10 to 12 per cent of current earnings of the cable system because of the lower multiple that their own shares would command in the marketplace.

Something of a profile of the economics of cable television in Canada is provided by the following outlines of a number of reasonably representative systems currently operating in various parts of Canada. These outlines were prepared by a group with extensive cable interests and made available on the understanding that the names of the individual systems would not be identified.
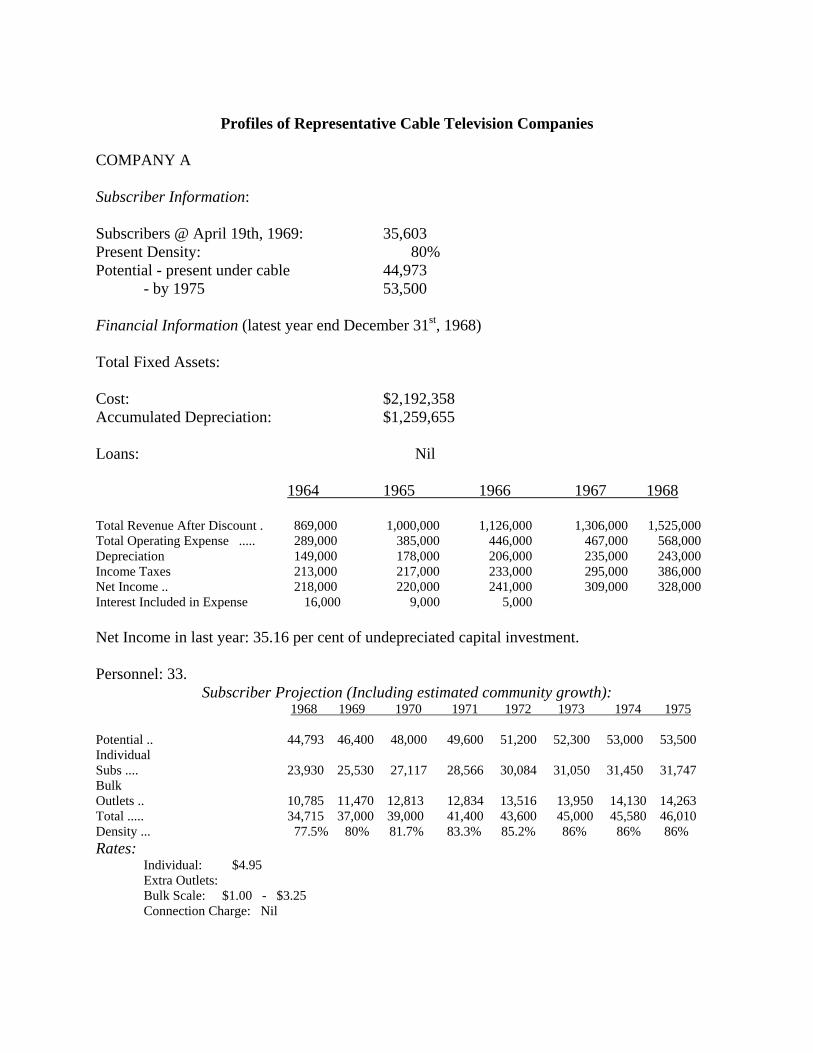
Profiles of Representative Cable Television Companies
COMPANY A Subscriber Information: Subscribers @ April 19th, 1969: 35,603 Present Density: 80% Potential - present under cable 44,973
- by 1975 53,500 Financial Information (latest year end December 31st, 1968) Total Fixed Assets: Cost: $2,192,358 Accumulated Depreciation: $1,259,655 Loans: Nil 1964 1965 1966 1967 1968 Total Revenue After Discount . 869,000 1,000,000 1,126,000 1,306,000 1,525,000 Total Operating Expense ..... 289,000 385,000 446,000 467,000 568,000 Depreciation 149,000 178,000 206,000 235,000 243,000 Income Taxes 213,000 217,000 233,000 295,000 386,000 Net Income .. 218,000 220,000 241,000 309,000 328,000 Interest Included in Expense 16,000 9,000 5,000 Net Income in last year: 35.16 per cent of undepreciated capital investment. Personnel: 33.
Subscriber Projection (Including estimated community growth): 1968 1969 1970 1971 1972 1973 1974 1975 Potential .. 44,793 46,400 48,000 49,600 51,200 52,300 53,000 53,500 Individual Subs .... 23,930 25,530 27,117 28,566 30,084 31,050 31,450 31,747 Bulk Outlets .. 10,785 11,470 12,813 12,834 13,516 13,950 14,130 14,263 Total ..... 34,715 37,000 39,000 41,400 43,600 45,000 45,580 46,010 Density ... 77.5% 80% 81.7% 83.3% 85.2% 86% 86% 86% Rates:
Individual: $4.95 Extra Outlets: Bulk Scale: $1.00 - $3.25 Connection Charge: Nil
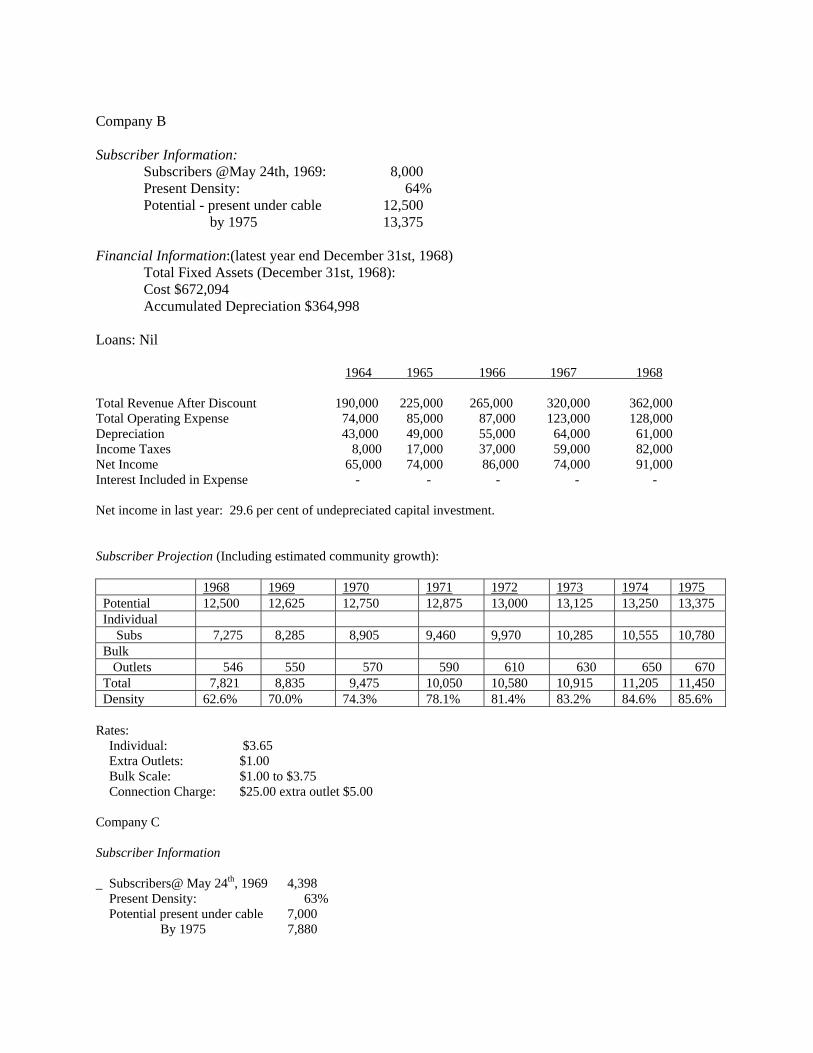
Company B Subscriber Information:
Subscribers @May 24th, 1969: 8,000 Present Density: 64% Potential - present under cable 12,500
by 1975 13,375 Financial Information:(latest year end December 31st, 1968)
Total Fixed Assets (December 31st, 1968): Cost $672,094 Accumulated Depreciation $364,998
Loans: Nil 1964 1965 1966 1967 1968 Total Revenue After Discount 190,000 225,000 265,000 320,000 362,000 Total Operating Expense 74,000 85,000 87,000 123,000 128,000 Depreciation 43,000 49,000 55,000 64,000 61,000 Income Taxes 8,000 17,000 37,000 59,000 82,000 Net Income 65,000 74,000 86,000 74,000 91,000 Interest Included in Expense - - - - - Net income in last year: 29.6 per cent of undepreciated capital investment. Subscriber Projection (Including estimated community growth):
1968 1969 1970 1971 1972 1973 1974 1975 Potential 12,500 12,625 12,750 12,875 13,000 13,125 13,250 13,375 Individual Subs 7,275 8,285 8,905 9,460 9,970 10,285 10,555 10,780 Bulk Outlets 546 550 570 590 610 630 650 670 Total 7,821 8,835 9,475 10,050 10,580 10,915 11,205 11,450 Density 62.6% 70.0% 74.3% 78.1% 81.4% 83.2% 84.6% 85.6%
Rates: Individual: $3.65 Extra Outlets: $1.00 Bulk Scale: $1.00 to $3.75 Connection Charge: $25.00 extra outlet $5.00 Company C Subscriber Information Subscribers@ May 24th, 1969 4,398 Present Density: 63% Potential present under cable 7,000 By 1975 7,880
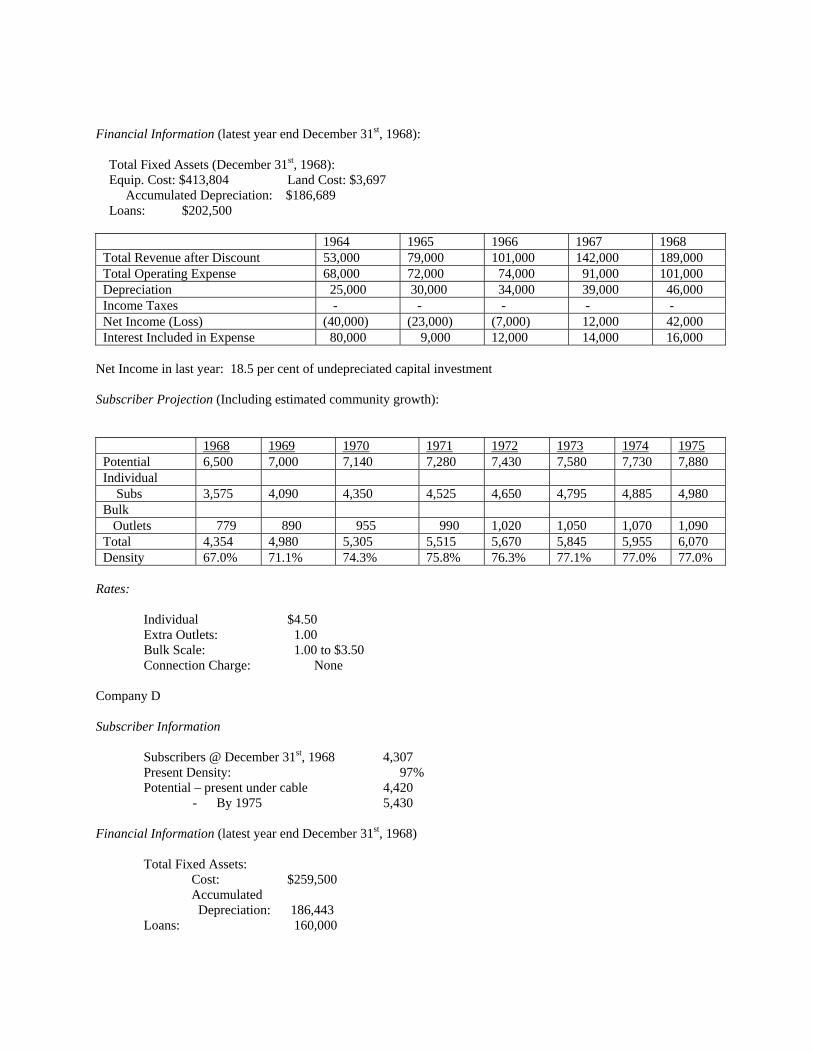
Financial Information (latest year end December 31st, 1968): Total Fixed Assets (December 31st, 1968): Equip. Cost: $413,804 Land Cost: $3,697 Accumulated Depreciation: $186,689 Loans: $202,500
1964 1965 1966 1967 1968 Total Revenue after Discount 53,000 79,000 101,000 142,000 189,000 Total Operating Expense 68,000 72,000 74,000 91,000 101,000 Depreciation 25,000 30,000 34,000 39,000 46,000 Income Taxes - - - - - Net Income (Loss) (40,000) (23,000) (7,000) 12,000 42,000 Interest Included in Expense 80,000 9,000 12,000 14,000 16,000
Net Income in last year: 18.5 per cent of undepreciated capital investment Subscriber Projection (Including estimated community growth):
1968 1969 1970 1971 1972 1973 1974 1975 Potential 6,500 7,000 7,140 7,280 7,430 7,580 7,730 7,880 Individual Subs 3,575 4,090 4,350 4,525 4,650 4,795 4,885 4,980 Bulk Outlets 779 890 955 990 1,020 1,050 1,070 1,090 Total 4,354 4,980 5,305 5,515 5,670 5,845 5,955 6,070 Density 67.0% 71.1% 74.3% 75.8% 76.3% 77.1% 77.0% 77.0%
Rates: Individual $4.50 Extra Outlets: 1.00 Bulk Scale: 1.00 to $3.50 Connection Charge: None Company D Subscriber Information Subscribers @ December 31st, 1968 4,307 Present Density: 97% Potential – present under cable 4,420
- By 1975 5,430 Financial Information (latest year end December 31st, 1968) Total Fixed Assets: Cost: $259,500 Accumulated Depreciation: 186,443 Loans: 160,000
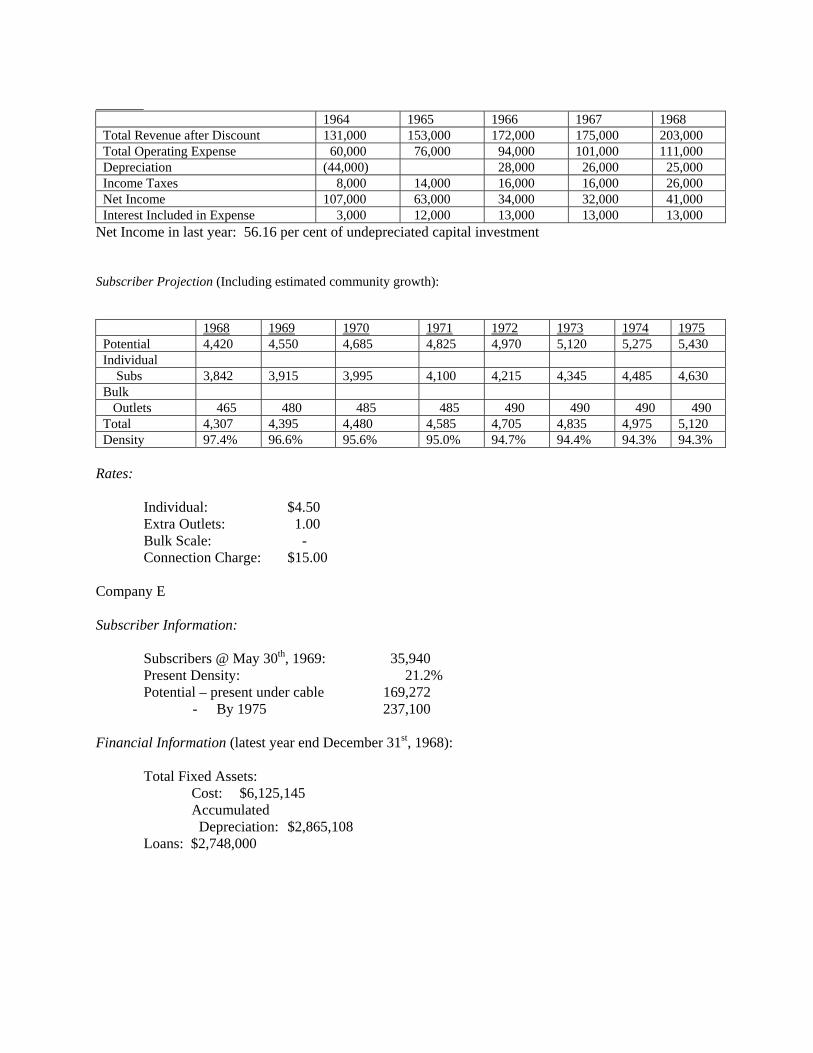
1964 1965 1966 1967 1968 Total Revenue after Discount 131,000 153,000 172,000 175,000 203,000 Total Operating Expense 60,000 76,000 94,000 101,000 111,000 Depreciation (44,000) 28,000 26,000 25,000 Income Taxes 8,000 14,000 16,000 16,000 26,000 Net Income 107,000 63,000 34,000 32,000 41,000 Interest Included in Expense 3,000 12,000 13,000 13,000 13,000
Net Income in last year: 56.16 per cent of undepreciated capital investment Subscriber Projection (Including estimated community growth):
1968 1969 1970 1971 1972 1973 1974 1975 Potential 4,420 4,550 4,685 4,825 4,970 5,120 5,275 5,430 Individual Subs 3,842 3,915 3,995 4,100 4,215 4,345 4,485 4,630 Bulk Outlets 465 480 485 485 490 490 490 490 Total 4,307 4,395 4,480 4,585 4,705 4,835 4,975 5,120 Density 97.4% 96.6% 95.6% 95.0% 94.7% 94.4% 94.3% 94.3%
Rates: Individual: $4.50 Extra Outlets: 1.00 Bulk Scale: - Connection Charge: $15.00 Company E Subscriber Information: Subscribers @ May 30th, 1969: 35,940 Present Density: 21.2% Potential – present under cable 169,272
- By 1975 237,100 Financial Information (latest year end December 31st, 1968): Total Fixed Assets: Cost: $6,125,145 Accumulated Depreciation: $2,865,108 Loans: $2,748,000
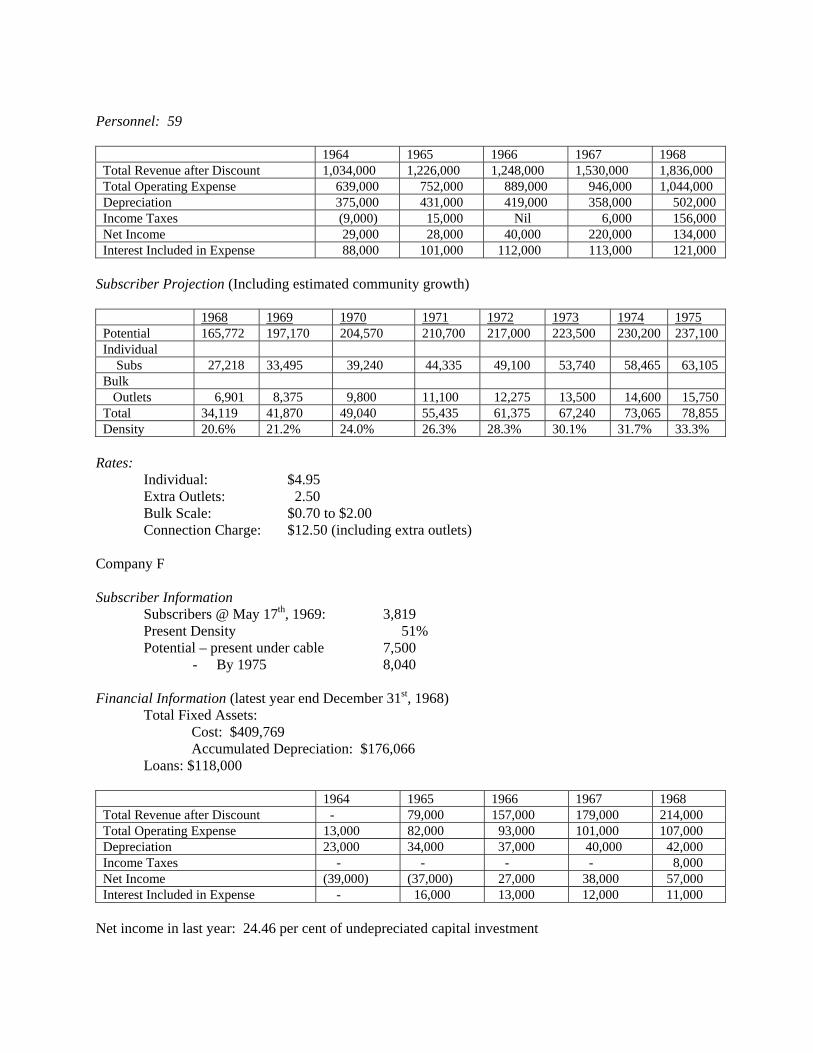
Personnel: 59
1964 1965 1966 1967 1968 Total Revenue after Discount 1,034,000 1,226,000 1,248,000 1,530,000 1,836,000 Total Operating Expense 639,000 752,000 889,000 946,000 1,044,000 Depreciation 375,000 431,000 419,000 358,000 502,000 Income Taxes (9,000) 15,000 Nil 6,000 156,000 Net Income 29,000 28,000 40,000 220,000 134,000 Interest Included in Expense 88,000 101,000 112,000 113,000 121,000
Subscriber Projection (Including estimated community growth)
1968 1969 1970 1971 1972 1973 1974 1975 Potential 165,772 197,170 204,570 210,700 217,000 223,500 230,200 237,100 Individual Subs 27,218 33,495 39,240 44,335 49,100 53,740 58,465 63,105 Bulk Outlets 6,901 8,375 9,800 11,100 12,275 13,500 14,600 15,750 Total 34,119 41,870 49,040 55,435 61,375 67,240 73,065 78,855 Density 20.6% 21.2% 24.0% 26.3% 28.3% 30.1% 31.7% 33.3%
Rates: Individual: $4.95 Extra Outlets: 2.50 Bulk Scale: $0.70 to $2.00 Connection Charge: $12.50 (including extra outlets) Company F Subscriber Information Subscribers @ May 17th, 1969: 3,819 Present Density 51% Potential – present under cable 7,500
- By 1975 8,040 Financial Information (latest year end December 31st, 1968) Total Fixed Assets: Cost: $409,769 Accumulated Depreciation: $176,066 Loans: $118,000
1964 1965 1966 1967 1968 Total Revenue after Discount - 79,000 157,000 179,000 214,000 Total Operating Expense 13,000 82,000 93,000 101,000 107,000 Depreciation 23,000 34,000 37,000 40,000 42,000 Income Taxes - - - - 8,000 Net Income (39,000) (37,000) 27,000 38,000 57,000 Interest Included in Expense - 16,000 13,000 12,000 11,000
Net income in last year: 24.46 per cent of undepreciated capital investment
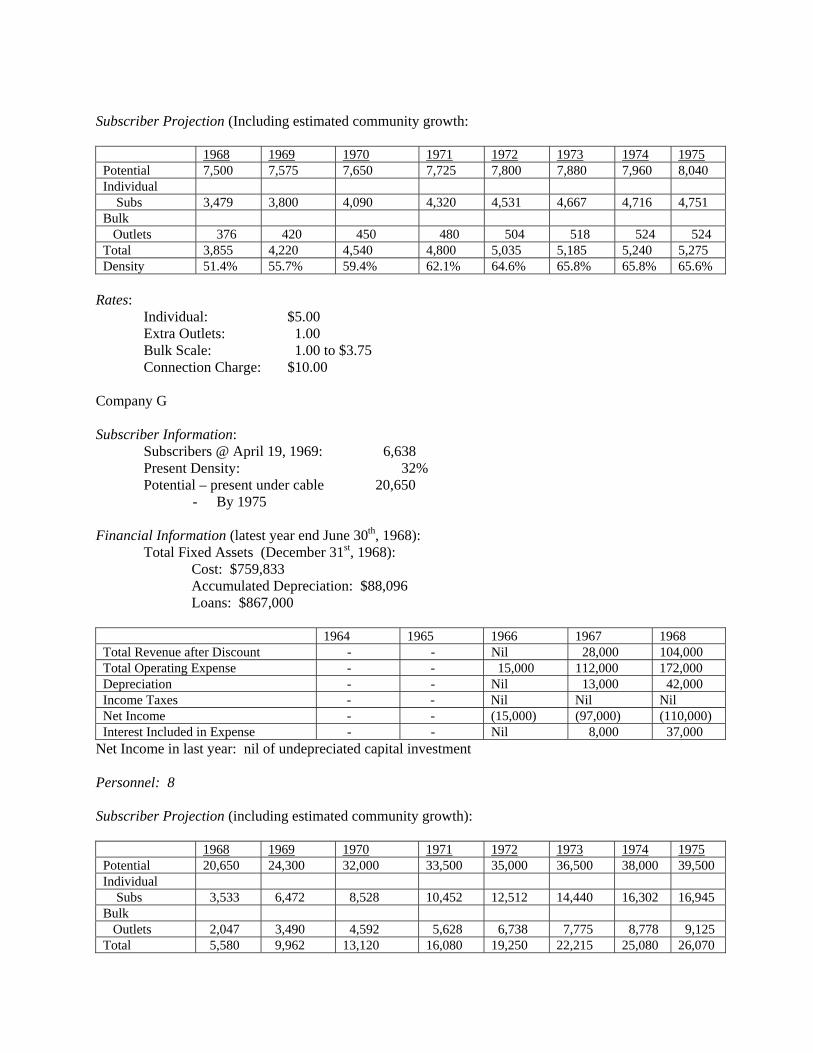
Subscriber Projection (Including estimated community growth:
1968 1969 1970 1971 1972 1973 1974 1975 Potential 7,500 7,575 7,650 7,725 7,800 7,880 7,960 8,040 Individual Subs 3,479 3,800 4,090 4,320 4,531 4,667 4,716 4,751 Bulk Outlets 376 420 450 480 504 518 524 524 Total 3,855 4,220 4,540 4,800 5,035 5,185 5,240 5,275 Density 51.4% 55.7% 59.4% 62.1% 64.6% 65.8% 65.8% 65.6%
Rates: Individual: $5.00 Extra Outlets: 1.00 Bulk Scale: 1.00 to $3.75 Connection Charge: $10.00 Company G Subscriber Information: Subscribers @ April 19, 1969: 6,638 Present Density: 32% Potential – present under cable 20,650
- By 1975 Financial Information (latest year end June 30th, 1968): Total Fixed Assets (December 31st, 1968): Cost: $759,833 Accumulated Depreciation: $88,096 Loans: $867,000
1964 1965 1966 1967 1968 Total Revenue after Discount - - Nil 28,000 104,000 Total Operating Expense - - 15,000 112,000 172,000 Depreciation - - Nil 13,000 42,000 Income Taxes - - Nil Nil Nil Net Income - - (15,000) (97,000) (110,000) Interest Included in Expense - - Nil 8,000 37,000
Net Income in last year: nil of undepreciated capital investment Personnel: 8 Subscriber Projection (including estimated community growth):
1968 1969 1970 1971 1972 1973 1974 1975 Potential 20,650 24,300 32,000 33,500 35,000 36,500 38,000 39,500 Individual Subs 3,533 6,472 8,528 10,452 12,512 14,440 16,302 16,945 Bulk Outlets 2,047 3,490 4,592 5,628 6,738 7,775 8,778 9,125 Total 5,580 9,962 13,120 16,080 19,250 22,215 25,080 26,070
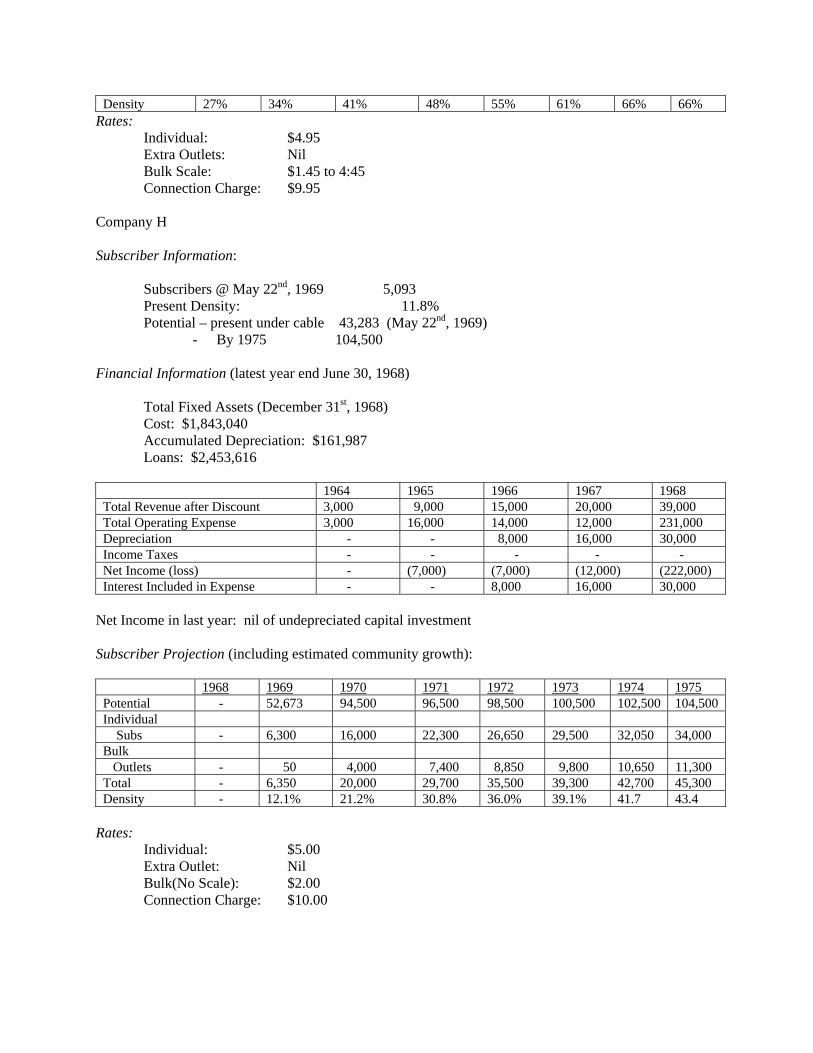
Density 27% 34% 41% 48% 55% 61% 66% 66% Rates: Individual: $4.95 Extra Outlets: Nil Bulk Scale: $1.45 to 4:45 Connection Charge: $9.95 Company H Subscriber Information: Subscribers @ May 22nd, 1969 5,093 Present Density: 11.8% Potential – present under cable 43,283 (May 22nd, 1969)
- By 1975 104,500 Financial Information (latest year end June 30, 1968) Total Fixed Assets (December 31st, 1968) Cost: $1,843,040 Accumulated Depreciation: $161,987 Loans: $2,453,616
1964 1965 1966 1967 1968 Total Revenue after Discount 3,000 9,000 15,000 20,000 39,000 Total Operating Expense 3,000 16,000 14,000 12,000 231,000 Depreciation - - 8,000 16,000 30,000 Income Taxes - - - - - Net Income (loss) - (7,000) (7,000) (12,000) (222,000) Interest Included in Expense - - 8,000 16,000 30,000
Net Income in last year: nil of undepreciated capital investment Subscriber Projection (including estimated community growth):
1968 1969 1970 1971 1972 1973 1974 1975 Potential - 52,673 94,500 96,500 98,500 100,500 102,500 104,500 Individual Subs - 6,300 16,000 22,300 26,650 29,500 32,050 34,000 Bulk Outlets - 50 4,000 7,400 8,850 9,800 10,650 11,300 Total - 6,350 20,000 29,700 35,500 39,300 42,700 45,300 Density - 12.1% 21.2% 30.8% 36.0% 39.1% 41.7 43.4
Rates: Individual: $5.00 Extra Outlet: Nil Bulk(No Scale): $2.00 Connection Charge: $10.00
ECONOMIC OUTLOOK FOR CABLE TV: CLOUDY Although many cable television systems have earned substantial profits up to now, a number of new factors affecting both the cost and revenue side suggest that the industry may be facing some troubled times ahead.
As noted earlier, the C.R.T.C. in its announcement of May 13, 1969, indicated that it would take a close look at the structure of rates charged subscribers in considering new licence applications and would not permit these rates to be increased without its approval. In another related announcement on July 10, 1969, the Commission declared that it "will not entertain applications for changes in the conditions of CATV licences as regards customer charges solely to adjust to capital valuation or terms of payment arrived at in the bargaining between the seller and the buyer." In addition, the Commission has also, at least for the present, denied cable systems the possibility of obtaining additional revenue by running their own commercials over closed-circuit channels.
At the same time, however, operators of cable television systems face the possibility of a substantial increase in their expenses. The cost of acquiring cable facilities, particularly those leased from the common carriers, has been rising sharply. The cable companies are also under increasing pressure to provide more extensive service, which will force some systems into a heavy investment at an early date to switch over from cable with a capacity of up to twelve channels to twenty channels or more.
That cable systems will be expected in future to undertake increasingly extensive programming of their own, without the promise of any offsetting increase in rates or ability to seek commercial revenue, is already evident.
CATV can assist in the development of community identity through locally produced programmes; they can also assist provincial and local authorities in the development of educational services. They can participate in the enrichment of the community's cultural life through the distribution of Canadian produced films, educational information and other films of particular interest produced for public showing but not normally available in that area. CATV local programming should complement rather than compete with programming already available to the community through television and commercial movie houses.
To many in the industry the message that comes through is that if the operators of a particular system fail to develop adequate programming of their own, the licence may be granted to other interests that will.
Despite the restriction indicated by the Commission on rates and on advertising revenue, at least some cable operators believe that the cost of closed-circuit programming cannot only be covered but converted into a profitable operation by attracting additional subscribers to the system. "Local programme origination is clearly in the public interest and it is our responsibility and obligation to provide it - because it will not come from any other source," declared Udo Salewsky, General Manager of Grand River Cable TV Ltd., in the September-October 1968 issue
of the Canadian Telephone and Cable Television Journal. "Why cablecast when it means a sizeable investment in expensive origination equipment plus increased operating costs when you have already achieved a high saturation percentage for your system without it? ," he asked.
Many operators were satisfied to sign up 70 to 75 per cent of the potential customers in their area. If all they had to offer was 'a relay system for other television stations, they had good reason to be satisfied with this percentage. However, actual facts and figures obtainable from cablecasting systems south of the border prove that cablecasting can be rewarding in terms of extra revenues from new subscribers attracted by it. With cablecasting, you are able to offer programmes unavailable to people not on cable; with cablecasting you have a selling tool of proven power and appeal and you are offering something extra people in your community will want to receive. With a cable channel in your community and imaginative programming there is 110 reason why you shouldn't be able to attain a 90 per cent saturation figure or better, with the revenue obtained from subscribers you had originally written off as unobtainable actually paying for your cablecasting equipment costs and your increased operating costs.
To support his case, Mr. Salewsky cited the hypothetical example of a system with 9,000 subscribers, 70 per cent of a potential 14,000. He estimated that equipment for black-and-white programming could be acquired for $25,000, with an additional investment of $10,000 for time and weather dials, background music, and a slide projector with an audio tape-recorder to carry pre-recorded announcements.
Operating expenses to provide forty-two hours of programming per week were estimated at $43,000. Another $26,950 would be added in the first year, diminishing slightly in succeeding years, to cover interest, depreciation and additional sales and installation costs, for a total of $69,950. Assuming that programming would add another 700 subscribers in each of the first two years at a charge of $4.50 per month to bring saturation of the market up to 80 per cent, Mr. Salewsky estimated the cost, revenue and profit picture for cablecasting alone would take the shape outlined in Table 127. "It follows," the author observed, "that after five years you would have recovered the full cost of your equipment, met your increased operating expenses out of increased revenues and realized a satisfactory profit from your cablecasting operation."
He maintained that substantially higher profits could be obtained by larger systems that would face very much the same costs but expect to gain a sharper increase in revenues. Table 128 shows Mr. Salewsky's estimate of the picture for a system with 28,000 subscribers and a potential of 40,000.

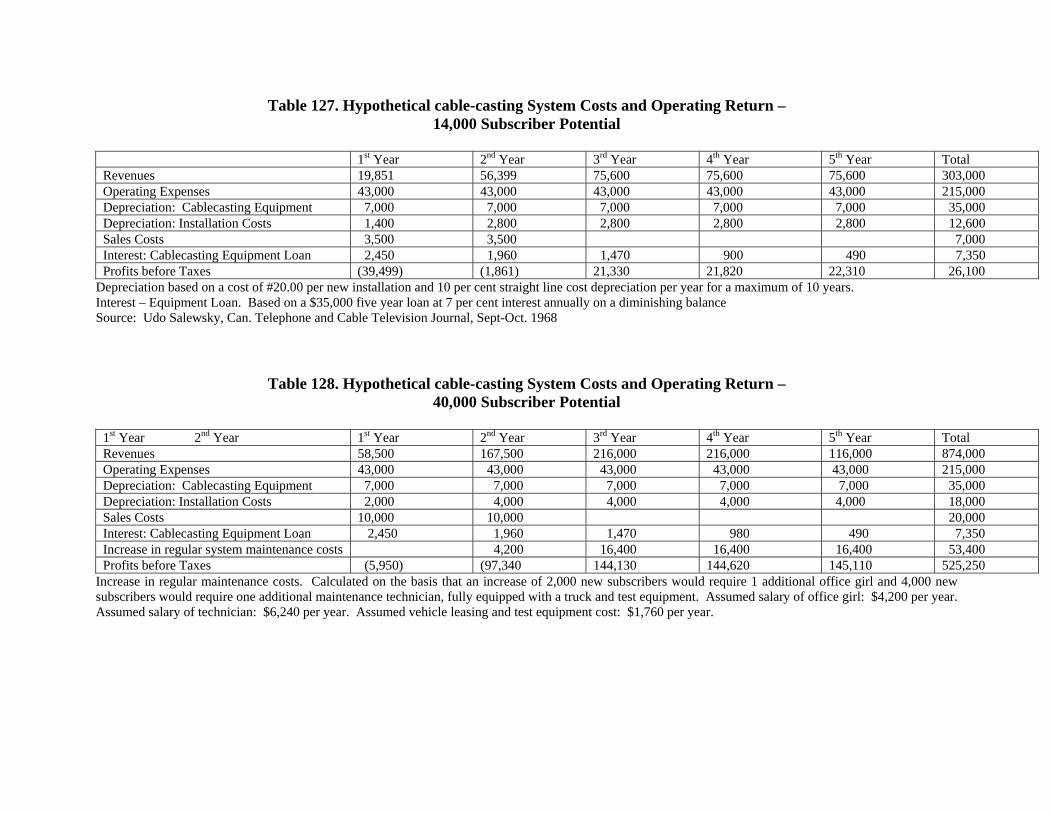
Table 127. Hypothetical cable-casting System Costs and Operating Return – 14,000 Subscriber Potential
1st Year 2nd Year 3rd Year 4th Year 5th Year Total Revenues 19,851 56,399 75,600 75,600 75,600 303,000 Operating Expenses 43,000 43,000 43,000 43,000 43,000 215,000 Depreciation: Cablecasting Equipment 7,000 7,000 7,000 7,000 7,000 35,000 Depreciation: Installation Costs 1,400 2,800 2,800 2,800 2,800 12,600 Sales Costs 3,500 3,500 7,000 Interest: Cablecasting Equipment Loan 2,450 1,960 1,470 900 490 7,350 Profits before Taxes (39,499) (1,861) 21,330 21,820 22,310 26,100
Depreciation based on a cost of #20.00 per new installation and 10 per cent straight line cost depreciation per year for a maximum of 10 years. Interest – Equipment Loan. Based on a $35,000 five year loan at 7 per cent interest annually on a diminishing balance Source: Udo Salewsky, Can. Telephone and Cable Television Journal, Sept-Oct. 1968
Table 128. Hypothetical cable-casting System Costs and Operating Return – 40,000 Subscriber Potential
1st Year 2nd Year 1st Year 2nd Year 3rd Year 4th Year 5th Year Total Revenues 58,500 167,500 216,000 216,000 116,000 874,000 Operating Expenses 43,000 43,000 43,000 43,000 43,000 215,000 Depreciation: Cablecasting Equipment 7,000 7,000 7,000 7,000 7,000 35,000 Depreciation: Installation Costs 2,000 4,000 4,000 4,000 4,000 18,000 Sales Costs 10,000 10,000 20,000 Interest: Cablecasting Equipment Loan 2,450 1,960 1,470 980 490 7,350 Increase in regular system maintenance costs 4,200 16,400 16,400 16,400 53,400 Profits before Taxes (5,950) (97,340 144,130 144,620 145,110 525,250
Increase in regular maintenance costs. Calculated on the basis that an increase of 2,000 new subscribers would require 1 additional office girl and 4,000 new subscribers would require one additional maintenance technician, fully equipped with a truck and test equipment. Assumed salary of office girl: $4,200 per year. Assumed salary of technician: $6,240 per year. Assumed vehicle leasing and test equipment cost: $1,760 per year.
While the use of colour would sharply increase capital costs, the general manager of the Grand River system maintained that it could well enable a company to realize 90 per cent of its potential market. Taking the hypothetical example of the system shown in Table 129 the economics of colour programming were calculated.
As mentioned previously, systems in some areas with a capacity of only twelve channels are confronted by imminent pressures to expand their system to twenty channels. In a city such as Toronto, an estimate of the cost of making this conversion on one system is estimated at approximately $100 per subscriber, roughly two-thirds as much as the original cost of installation. Included in this figure is the cost of equipment that must be added to a television set to make possible reception of the added channels.
In the case of one Toronto system that was examined as an example, only ten of the existing twelve channels are usable. Both channel 6 (CBLT -TV) and channel 9 (CFTO -TV) must be converted to other channels in the system to avoid the distorted image that results from the time lag in the signal received over-the-air and by cable from transmitters within ten to fifteen miles. The system carries four other Ontario television stations in Hamilton, Barrie, Kitchener, and Peterborough, bringing the total to six. In addition, four stations are relayed from Buffalo, three of them VHF and one, an educational television station, that is converted from UHF to VHF before being distributed through the cable system, raising the total to 10.
There is a prospective requirement on the system to employ an additional four channels to provide for: a provincial educational television station; a CBC French-language station and another commercial television station, all broadcasting on UHF; local programming by the cable system.
Unless the capacity of the system were increased, it is probable that the stations in Barrie, Kitchener, and Peterborough would be eliminated from the system (Hamilton must be carried under existing C.R.T.C. rules). The fourth station to go would likely be the ETV outlet in Buffalo, which is highly popular with a relatively small minority of cable subscribers. The three Buffalo VHF stations would be retained at virtually any cost, since their reception is regarded as the prime motivating force to subscribe to cable.
Obviously, the elimination of the three Canadian channels from the cable system would not be well received by the station operators and their displeasure could conceivably be reflected in new rules by the C.R.T.C. regarding priority of programme distribution. These rules might leave a cable operator in this situation, with virtually no other choice but to install a system with a greater channel capacity. If the current dreams of the visionaries are ever realized, this tendency could be reinforced by the eventual development of a multiplicity of other services that might be provided by cable systems.
Reference was made earlier to the higher costs of installing cable systems being faced by operating companies, particularly because of higher leasing charges levied by the common carriers. This question will be touched on in the following section dealing with the relationship

of cable systems and television broadcasting with the common carriers and the closely related inquiry being conducted at present by the Department of Communications.

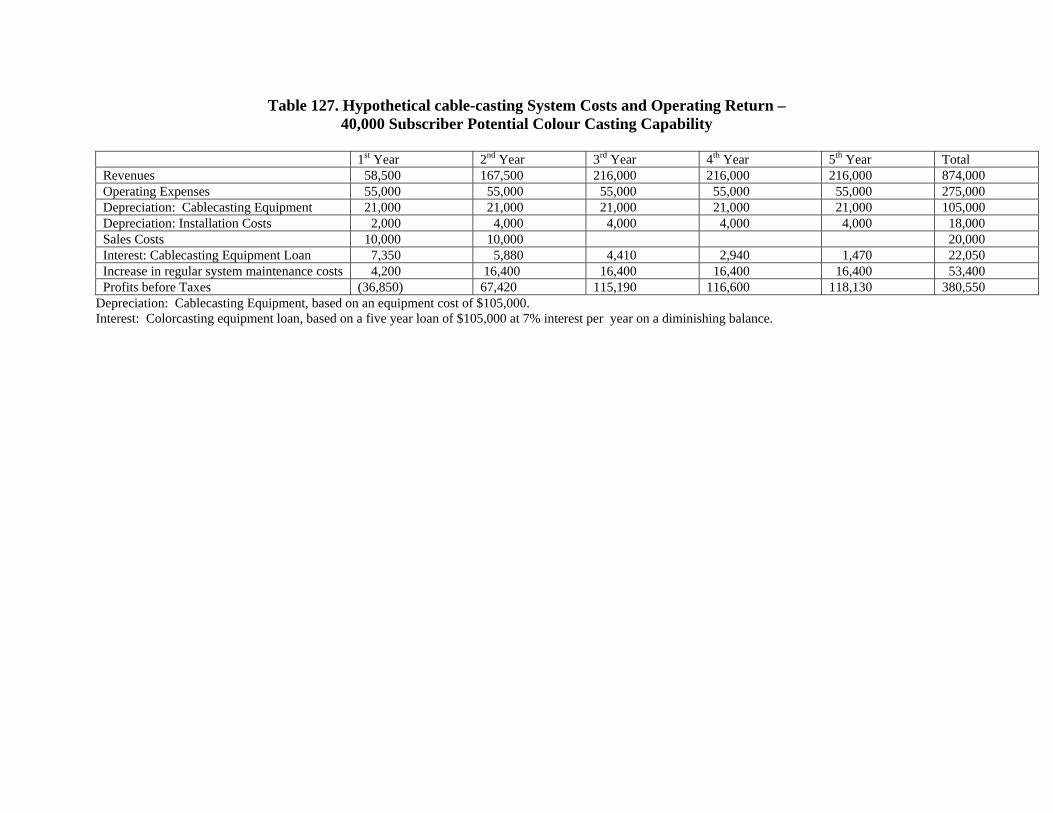
Table 127. Hypothetical cable-casting System Costs and Operating Return – 40,000 Subscriber Potential Colour Casting Capability
1st Year 2nd Year 3rd Year 4th Year 5th Year Total Revenues 58,500 167,500 216,000 216,000 216,000 874,000 Operating Expenses 55,000 55,000 55,000 55,000 55,000 275,000 Depreciation: Cablecasting Equipment 21,000 21,000 21,000 21,000 21,000 105,000 Depreciation: Installation Costs 2,000 4,000 4,000 4,000 4,000 18,000 Sales Costs 10,000 10,000 20,000 Interest: Cablecasting Equipment Loan 7,350 5,880 4,410 2,940 1,470 22,050 Increase in regular system maintenance costs 4,200 16,400 16,400 16,400 16,400 53,400 Profits before Taxes (36,850) 67,420 115,190 116,600 118,130 380,550
Depreciation: Cablecasting Equipment, based on an equipment cost of $105,000. Interest: Colorcasting equipment loan, based on a five year loan of $105,000 at 7% interest per year on a diminishing balance.

CABLE TELEVISION AND THE TELEVISION
BROADCASTING INDUSTRY In no area involving the mass media are there so many claims, counter-claims, conflicts and contradictions as that involving the impact - actual and potential of cable television on the television broadcasting industry. Seldom has so much controversy been supported by so few facts.
The Canadian Association of Broadcasters, in a brief to the C.R.T.C. on the whole question of cable television, said it would come as no surprise that broadcasters "have not developed a unanimous view on either possibilities or policy." That is a major understatement.
C.A.B. President Raymond Crepault told the Commission that the extension of cable coverage through the use of long-distance microwave relay facilities - the immediate issue before the C.R.T.C. - involved, "a basic question of survival" for Canadian broadcasting as it was conceived by the Federal Government.
If we are to maintain our Canadian identity and to safeguard, enrich and strengthen the cultural, political social and economic fabric of Canada, we must look to extension of the second Canadian service to all Canadians before considering microwave delivery of American cable signals to those Canadians in the heavily populated urban areas,
insisted the British Columbia Television Broadcasting System.
Clearly, further fragmentation of the audience will affect the economic viability of a privately owned operation such as CTV and any damage will necessarily limit our capacity to serve the objects of the Broadcasting Act with respect to Canadian program service,
submitted Murray Chercover, President of the CTV network.
In sharp contrast, Maclean-Hunter, which has substantial television and cable interest, told the Commission that the use of microwave to allow the extension of cable television to urban centres now un-served was a "pre-requisite to solving our national communications problems."
Canada, the company said, must "make use of every advance in technology if we are to achieve even our minimum television service goal of giving all Canadians a choice of programs in either language."
The eventual establishment of a cable distribution network would help to "enhance the Canadian way of life. We view microwave as the only practical technological means by which distant Canadian and U.S. signals can be placed on cable systems in many of Canada's communities," declared Selkirk Holdings, another major owner of both television and cable interests. "We see microwave as a means to an end - but not as an end in itself. If it can enhance

cablevision's growth, the development of Canadian productions using Canadian talent will ultimately outweigh the use of U.S. originated programs."
These sharply conflicting views reflect widely different opinions about the impact cable television is having, will have and should have, on television broadcasting as we know it today.
The extent of the disagreement over the impact of cable systems is further illustrated on the question of UHF television stations. In its submission to the C.R.T.C., the Canadian Association of Broadcasters contended that the extension of cable systems would inhibit the development of UHF stations, if not rule them out completely.
A diametrically opposite view has been argued by cable operators, who maintain that their systems offer the only method of introducing UHF broadcasting on a viable basis for a number of years to come.
They maintain that it will be at least four to five years before 50 per cent of the television sets in use are equipped to receive UHF broadcasts, in line with the requirement that went into effect in mid-1969, and some eight years before the greater proportion of sets are UHF-equipped. Under these circumstances, they insist, the only way in which UHF television stations could reach audiences of any appreciable size is to distribute their signal over cable systems, which convert it to the standard VHF frequencies.
In part, the issue must be considered in relation to a time factor, as Mr. Juneau implied in his May, 1969, address to the Canadian Cable Television Association in Quebec City. "We have been developing both a long-term and immediate view of what cable television could and should become," he said.
Some of these goals are so radically different from what applies today that their immediate application might bring chaos to the communications industry of this country. And yet, within the framework of our responsibility, it is our overall aim to help bring the maximum advantage of communication technology to the people of Canada within the shortest period of time compatible with ordered growth.
Although the ramifications are complex, and to a considerable extent remain a matter of
conjecture, the nature of the problem, real or potential, presented to television broadcasters by the widespread installation of cable television is reasonably simple. At issue is whether or not cable does, or will, result in Canadian audiences spending more of their viewing time watching a multiplicity of American and Canadian television stations and less time watching local stations, causing the advertising revenue of the latter either to decline or at least to grow more slowly than in the past.
The advertising revenue of Canadian stations could be affected in four different ways. The fragmentation of audiences caused by cable and the resulting decline in the relative amount of man-hours spent viewing a Canadian station could lead to a decline or at least slower growth of advertising rates that the station could charge. It could also induce some companies to put a greater proportion of their advertising dollars in other mediums.
Increased Canadian viewing of American stations might persuade manufacturers of North American brand-name products to rely more heavily on their American television advertising "spilling over" into Canada, making it less necessary to place advertising of these brands on Canadian stations.
Increased viewing of American television could lead to an increase in the present volume of advertising by Canadian companies on American stations aimed primarily at Canadian audiences. One source within the industry estimates this amounts to about $6 million a year at present, but another has calculated that up to this amount is spent on advertising over KV08-TV in Bellingham, Washington alone.
It might be observed in passing that some Canadian companies with markets on both sides of the border already place advertising on American stations that is aimed at both American and Canadian viewers.
While the advertising revenue of Canadian television stations could be affected in all four of the ways outlined above, the vital question obviously concerns the degree to which they may be affected individually and collectively. There is a natural tendency for any industry faced with an impediment to its growth to exaggerate the extent of its difficulties in the hope of retaining or being granted a measure of protection against its competitors. During the past year, there has been a growing demand within the broadcasting industry for protection through some form of restriction on the spread of cable television or on the number of alternate channels it makes available, or through ownership of community cable systems ry the interests that control the local station or stations.
Those seeking to justify continuation of the protection now enjoyed, or the provision of protection in some amended form, frequently have done so on the grounds, among others, that it is necessary either to maintain or improve the present level of programming or to make possible the extension of alternate Canadian television service across the country. "Wide-ranging extension of signal importation could siphon the program fare of existing television services, erode its economic base, force reduction in its news and public affairs programming, stifle the growth of UHF and result in less, rather than more diversity," the Canadian Association of Broadcasters maintained in a brief to the C.R.T.C. "In smaller markets, regardless of present viability, such developments could produce adverse consequences for radio broadcasting stations and seriously vitiate the possible development of frequency modulation broadcasting."
If there is one thing that everyone agrees on, it is the fact that the improved reception and multi-channel viewing offered by cable television is becoming immensely popular with Canadians. Any protection granted to television broadcasters therefore, is bound to be at the expense of Canadian viewers.
In these circumstances, it is obviously important to form some judgment about the real extent to which Canadian television broadcasters are being hurt or are likely to be hurt by cable facilities and of its probable effect on Canadian television service.

Given the sharply rising profitability of the industry as a whole in recent years, some slowing down in the rate of future growth is hardly likely to be viewed by the majority of Canadians as sufficient justification for protecting the industry against the impact of technological and economic change. Even if it is accepted that cable is likely to have a major adverse impact on television broadcasting, crucial questions remain to be answered as to whether protection is justified and, if so, to what extent and for how long.
The fact is of course, that in some parts of the country - those that are many miles away from the nearest American stations - Canadian television broadcasters have for some years enjoyed a substantial degree of protection from cable television. This protection has taken the form of a policy first instituted by the Department of Transport prohibiting cable operators from employing more than a single microwave hop to relay signals picked up by the head-end receiver to the beginning of the trunk cable. Since up to now microwave has been the only economic method of relaying signals over long distances, the policy has effectively prevented the importation of American signals into such communities as Calgary, Edmonton, Red Deer, Saskatoon, Sudbury, Moncton, Halifax, and St. John's.
This policy clearly discriminates against certain parts of the country solely on the basis of geography, since in recent years few impediments have been put in the way of the establishment of cable systems in areas where American signals could be received either without benefit of microwave or with a one-hop relay facility. It was the growing outcry of the public in these areas against this kind of arbitrary discrimination that led the C.R.T.C. to re-examine at its public hearing in Vancouver in October 1969 the microwave policy it inherited from the Transport Department. The Hon. Raymond Reierson, Alberta's Minister of Telephones, spoke for a large number of Canadians when he told the Commission in his brief: "All residents of Alberta should have the same opportunity to receive Canadian and American television via community antenna television systems as do Canadians living in close proximity to the Canada-United States border."
It is important to maintain some perspective about the dimensions of the issue at hand. As noted earlier, some 17 per cent of all television homes in Canada are now equipped with cable. In its March 1969 report, the Bureau of Broadcast Measurement indicated, according to a CBC analysis, that 15.9 per cent of all those who watched some television during the survey week made use of a cable-equipped set.
From an analysis of its previous survey, that for November, 1968, B.B.M. estimated that some 37 per cent of Canadians who watched television during the week tuned at least once to an American station. It is also estimated by a C.R.T.C. study that Canadians spent about 17 per cent of total viewing hours watching American television stations in that week. This compares with the estimate that some 68 per cent of all Canadian television homes are capable of receiving American stations either directly or by cable.
While only some 17 per cent of Canadian television homes are now wired, it will be recalled that D.B.S. estimated that as of 1967, 75 per cent of Canadian television homes lay within areas for which cable licences have been granted .
It needs to be borne in mind that the great bulk of the estimated 68 per cent of Canadian television homes within reach of American stations can and do receive these signals off-the-air with their own antennae. For the great majority of these people, cable only brought in more American stations, usually with a better quality of reception. The claim of the Canadian Association of Broadcasters that "the bulk of cable systems, especially in more populous areas, are bringing one or more United States' signals into homes which could not otherwise have access to them," appears disputable on the basis of the extent of cable viewing estimated by the CBC in communities within reach of American stations by off-the-air pickup.
It seems unlikely that the C.R.T.C. would be prepared to close down the cable systems now in operation or to restrict the extension of their service to new customers in the licensed area. On the contrary, the Commission has already decreed that cable companies must stand ready to provide service to all of those in the franchise area who request it. There would seem to be an only slightly less remote possibility that the C.R.T.C. would order some cutback in the range of service now being provided by these companies, although it was urged to do so by the Canadian Association of Broadcasters. If these assumptions are correct, what may be really at issue is the nature of the cable service, if any, to be made available to approximately one-quarter of Canadian homes with television that are beyond cable service, or at least were as of 1967. "The public is demonstrably interested in multi-service television and in many areas this can only be provided in a practical way by CATV systems," the CBC pointed out in its own submission to the C.R.T.C.
To do a proper job in the provision of multi-service television, cable systems need microwave. It seems to the corporation that the principle of authorizing cable systems to use microwave has already been taken. The question involved is whether Canadians should have single television service, alternative service, or multi-service. The principle that multi-service should be made available to the public (on which the use of microwave by cable should presumably rest) was first established when cable systems were allowed to bring the signals of "outside" stations into areas already served by one or more "local" stations. In most cases, cable was permitted to make additional television program service available in cities where broadcasters were not permitted to establish additional broadcasting transmitters because of limited market resources.
The licensing of CATV systems by Canadian authorities indicated a belief that Canadian broadcasting has grown and matured to the point where it should be able to hold its own in head-to-head competition with American stations and networks and at the same time be capable of meeting the objectives of the Broadcasting Act and the requirements of the commission. The wish of the public for multi-service is shared by urban and rural dwellers alike, wherever domiciled. This wish can and is being met by CATV systems in all areas where "distant" stations (especially American) can be received through CATV antennae and these areas embrace some 60 to 70 per cent of the total Canadian population. It is, therefore, difficult to argue that similar service should not be made available to the remaining 30-40 per cent of the population when all that is needed to achieve it is the will of the people to pay and the granting of authority to CATV systems to use microwave.

CABLE’S IMPACT ON CANADIAN TELEVISION STATIONS
The present controversy grows out of fundamental differences of opinion on a question that lies at the very root of the entire issue - whether any significant proportion of Canadian television stations is being or will be substantially hurt financially by cable systems because of the fragmentation, loss or )slow growth of audiences, and resulting pressure on advertising revenue.
In its brief to the C.R.T.C. on microwave policy, Maclean-Hunter Cable TV Ltd. acknowledged that the availability of additional channels would cause some fragmentation of audiences. "It is questionable that in so doing it will have an appreciable effect on the [Canadian broadcaster's] revenue and hence his ability to pay for local programming," the company added.
The continuing growth of advertising revenue should make up the difference, providing that a significant amount does not go to the American stations which are being microwaved into the market. This very real problem could be overcome by the same method of non-deductible expenses for income tax as has been used for Canadian magazines.
Ironically enough, a very different view was taken by a cable television company seeking
a licence to establish a system in Calgary, Microwave Cablevision Ltd., in which Maclean-Hunter and Selkirk Holdings each have a 23 per cent interest, the remaining 54 per cent being in the hands of the public. "From the engineering and economic information available to us, we are satisfied that the only practical way to provide cablevision in Calgary is by microwave," the company said.
We are aware that the provision of U.S. television programs would be welcomed by the viewers in Calgary. We are, however, equally aware that this additional service brings a number of attendant obligations to existing broadcast stations which, if not protected, will result in a grave deterioration of those particular services which they are presently providing to the community. It is quite obvious that if these U.S. programs are provided to the viewing audiences in Calgary, it will result in a serious loss of advertising revenue to the established television stations which will result in reduction of services that are presently being extended to the community by those television stations. However, we feel cablevision is inevitable in a city the size of Calgary at some point of time, and therefore, we feel it essential that the T. V. stations be a part of cablevision in Calgary.
Mr. Reierson, the Alberta Minister of Telephones, provided the C.R.T.C. with a
contrasting assessment of the economic impact of cable. "We feel the day has arrived when our stations are capable of meeting this competition," he told the commissioners. Studies he had made, the minister added, "have not indicated this type of competition is going to cripple our stations in any way."

It should be noted that both Maclean-Hunter and Selkirk own television stations in Calgary and Lethbridge. Maclean-Hunter maintained in its own brief that local broadcasters should be permitted to be minority participants in cable systems using long-haul microwave and that co-operation between local broadcasters and cable companies was "both desirable and necessary." The company did not explain why this was so, nor did it deal with the question of public policy raised by the common ownership of potentially competitive companies. (In the United States, the F.C.C.- supported by the Justice Department - has proposed that broadcasters should not be permitted to acquire an interest in a cable system in the same community. The Justice Department went further and argued that it should also be denied to local newspaper interests, as well.)
On this same point, the Canadian Association of Broadcasters suggested that dual ownership of broadcasting and cable facilities should not be considered to amount to excessive concentration.
Other factors being equal, we feel that the licensing of broadcasting transmitting undertakings does not, on the face of it, usually fall within the framework of excessive concentration. In doing this, we submit the C.R.T.C. is simply assisting licensees of broadcasting transmitting undertakings to extend their service for the purposes of further assisting the objectives of Section 2 (b) of the Broadcasting Act.
This argument ignored the potential competition that may and perhaps should develop
between conventional broadcasters and the programming function of cable systems. Furthermore, the suggestion that it was in the national interest for television station interests also to control cable systems within the same community appeared to conflict rather sharply with the contention of C.A.B. President, Raymond Crepault, that the whole issue of cable raised "a basic question of survival" of the national broadcasting policy.
Microwave Cablevision Ltd., in effect, argued that the participation of MacLean-Hunter and Selkirk, owners of competing stations in Calgary and Lethbridge, was justified because of the serious loss of revenue each of their stations would suffer from the introduction of American stations via cable.
This assessment of the economic probabilities was in obvious contrast to Maclean-Hunter's general view about the economic impact of cable television on broadcasting stations. It is notable, also, that in its own brief Selkirk Holdings called for abandonment of restrictions on the use of microwave in conjunction with cable and made no reference to any adverse effect such a policy might have on its own stations or any others.
Many of the fears expressed about the adverse impact of cable television are based on conjecture about the future, rather than on the past or present situation confronting Canadian television stations already heavily exposed to the effects of competition for audiences from American stations, either directly or via cable.
The Toronto-Hamilton market in particular has long been fragmented. The fall 1968 Survey of B.B.M., for example, indicated that audiences on the Canadian side of the border spent

nearly thirty-four million hours watching the three Buffalo stations as a group compared to approximately fifteen million hours for CBLT -TV and sixteen million for CFTO-TV in Toronto, the CBC and CTV affiliated station respectively, and 11.7 million for the independent station in Hamilton, CHCH-TV. Not only have the Toronto-Hamilton stations faced competition from the three Buffalo stations for audiences, but they have also been forced to compete directly for advertising dollars.
While the CBC station is in a special situation, there is no indication that either of the two private stations in the Toronto-Hamilton area have suffered unduly from this competition, although undoubtedly they would be more prosperous without it.
Of the three Toronto-Hamilton stations, CHCH-TV has the smallest circulation and total hours of tuning. Late in October, 1969, it was announced that Selkirk Holdings, which already had a 15 per cent interest in CHCH-TV through Niagara Television Ltd., had bought out the other shareholders to acquire full ownership subject to C.R.T.C. approval. Selkirk paid $4.5 million in cash, plus 721,280 class A shares. Based on the price of the shares at the time, the total amount involved in acquisition of the other 85 per cent of the shares was estimated at approximately $16 million.
On the basis of the offering price by Selkirk, that suggests a total value for the property of nearly $19 million. If it is assumed, for the purpose of illustration, that this price represents around 20 times current earnings, the profits of the station would amount to around $950,000. Reporting in the Toronto Star on the transaction October 25, 1969, correspondent Jeremy Brown wrote:
Quietly, a license to make money changed hands yesterday and Canada's only independent, English non-network television station vanished into the bland bosom of a communications conglomerate. And in the transaction, which saw Hamilton's Channel 11 sold to Selkirk Holdings Ltd. for something over $16 million, died the visions of its founder, the late Kenneth D. Soble.
It was the end to an era that saw a textbook rise from rags interrupted before the ultimate grand vision was realized. The rise involved some of the famous communications families in Canada, highly placed politicians, enormous sums of money, and the tale of a little television station which set itself up against three American and two Canadian networks and emerged with recent grosses in excess of $7 million a year.
Carrying the conjecture a step further, if revenues amount to around $7 million and
profits of around $950,000, this would suggest that the station was making in the neighbourhood of thirteen cents on the sales dollar.

THE EXPERIENCE IN BRITISH COLUMBIA
The most outspoken opposition to cable television has come from the British Columbia Television Broadcasting System Ltd., in which Western Broadcasting, Selkirk and Famous Players each hold substantial minority interests. Each company also has interests in cable television, those of Selkirk and Famous Players being very extensive. Western Broadcasting recently is reported to have acquired an interest of 38 per cent in a cable system in the Metropolitan Vancouver area, subject to C.R.T.C. approval.
In his submission to the commission regarding the issue of microwave relay use in conjunction with cable, J.R. Peters, president of British Columbia Television, contended that the extended employment of microwave by cable systems to import broadcasts from the three American networks "is not in the public interest in Canada at this time." Mr. Peters said he reached this conclusion on the basis of the experience with one of the largest cable enterprises in the world faced by his company, which operates CHAN-TV in Vancouver and CHEK-TV in Victoria. "The CATV systems in our viewing areas are most successful systems indeed," he told the commission.
They are able to take advantage of the terrain, which is not conducive to good television reception because of the multipath signals which are reflected from the surrounding mountains. Also they are able to offer reception of several stations in the Seattle-Tacoma area of Washington State, which is too far away for good reception by most of the homes using a conventional antenna. As a result of these factors, nearly 200,000 homes subscribe to these CATV systems. [Although British Columbia has the highest per capita cable coverage in Canada, it is estimated that only 45 per cent of all homes receive television via cable. This is significantly lower than the number of cable homes within the broadcasting area of CFPL- TV in London.]
Mr. Peters told the commission that British Columbia Television has become increasingly
concerned about the growth of Canadian audiences for television stations in the Seattle-Tacoma area.
In the Vancouver and Lower Mainland area of British Columbia, non-cable households have a choice of four stations: CHAN -TV and CHEK-TV, both owned by British Columbia Television; CBUT-TV, the CBC station in Vancouver, and KVOS-TV, the American station in Bellingham, Washington, which exists primarily to serve the Canadian, market. Cable viewers, however, have a choice of nine stations, the additions being: KIRO-TV, KOMO-TV, KING-TV and KTNT-TV, from the Seattle-Tacoma area; and an education television station, also in Seattle; programming originated by the largest cable system in the Vancouver area.
To support his contention about the adverse impact of cable on the British Columbia Television stations, Mr. Peters appended to his brief an extract from an analysis of viewing patterns prepared by the A.C. Nielsen Company of Canada Ltd.
Commenting on the Nielsen study in his brief, Mr. Peters noted that the viewing of distant American stations was four times greater in cable households than it is in non-cable households. "Put another way, it shows that 10 per cent of total hours viewed is directed towards the Seattle-Tacoma area in non-cable homes, whereas in cable households this increases to 40 per cent of the total hours viewed." The chart prepared by Nielsen indicates that the station that has been most drastically affected by the introduction of cable is KVOS in Bellingham. Its proportion of total viewing hours over the whole week falls from 36 per cent for non-cable households to 20 per cent, a decline of sixteen percentage points. This compares with a drop for all three Canadian stations of a total of fourteen percentage points, eight for CHAN and six for CBUT, with CHEK unchanged. "Speculation as to why this viewing pattern emerges can cover many possible explanations," the president of British Columbia Television wrote in his brief.
Programming might be examined, but one quickly realizes that the better programs offered by the U.S. stations are also offered by either the CBC or CTV network stations Canada on a pre-lease schedule. Our view is that it is a simple case of audience fragmentation caused by a larger selection of channels available,
Mr. Peters contended.
While the clear implication of his submission was that cable had adversely affected British Columbia Television, Mr. Peters acknowledged that in major market areas such as Vancouver and Victoria "The effect of pronounced audience fragmentation has been absorbed - it has not been a crippling blow at this point in time."
Mr. Peters did not explain to the commission how the company had been able to absorb the impact of cable television. But he warned that the use of microwave to make possible the extended importation of American stations and the extension of the alternative Canadian television service were "mutually incompatible." It should be noted that such problems as British Columbia Television may face from U.S. competition are rather different than those confronting other Canadian stations, such as those in Toronto. While some Canadian advertising dollars are spent on the Buffalo stations by Canadian companies for messages directed primarily at Canadian audiences and some Canadian and American companies undoubtedly depend on advertising over Buffalo stations to serve their markets on both sides of the border, the total dollar amount is probably not excessively high.
In British Columbia, however, the Vancouver and Victoria stations face direct competition for Canadian advertising dollars from an American station just south of the border that is not required to observe the rules laid down in Canada. It is not required to provide Canadian-content programming, which often drives Canadian viewers away unless it is a popular sports event. It may accept beer and wine commercials, which are prohibited under British Columbia law, and it does not face the same strictures on advertising of foods and drugs. It may also carry a considerably higher proportion of advertising content, although perhaps at the expense of viewing audience.
The table below, based on the D.B.S. report on radio and television broadcasting for 1967 and on household television sets, indicates that the amount of advertising revenue received by
private television stations per television household is substantially lower in British Columbia than other parts of Canada.
Table 130: D.B.S. Report on Broadcasting and Television Sets Total Privately Average Annual Number of Owned Television Privately Owned Television Broadcasting Television Broadcasting Area Homes (OOO's) Revenue Revenue per TV Home B. C. 538 $ 4,805,738 $ 8.93 Alta. . 377 7,532,926 19.98 Man. & Sask. 480 8,017,881 16.70 Ont. 1,917 36,532,112 19.06 Que. 1,408 22,120,812 15.71 Atlantic Area . 413 5,881,481 14.24 TOTAL 5,135 84,890,950 16.53
The per household revenue of the private stations in British Columbia is only slightly more than half the national average and much less than received in the other wealthy provinces of Ontario and Alberta.
It is persuasively argued that this sharp differential is explained by the fact that the revenue drained off from the province by KVOS-TV is excluded from the D.B.S. figures. It has been estimated that if the advertising revenue of private stations per household were calculated on the basis of the national average, British Columbia's total would be some $4 million higher and if based on the Alberta average, it would be nearly $6 million higher.
It has been suggested that, in fact, close to $6 million represents the actual amount of advertising revenue obtained by KVOS-TV in Bellingham. This assumption is open to question. Given the fact that both the reach and the number of viewing hours of KVOS are only moderately higher than that of CHAN-TV (according to the B.B.M. survey for November, 1968) it seems to be a long leap to the conclusion that the advertising revenue of K VO S alone is equal to or greater than the revenue of all the private stations in the province combined.
In its brief, Microwave Cablevision Ltd. of Calgary contended that Alberta television stations might face the same problem of direct advertising competition from the three television stations in Spokane, Washington, if they developed substantial Canadian audiences through their importation by cable. Of various alternatives discussed to avoid this possibility, the company favoured an amendment to the Income Tax Act to make Canadian advertising on American stations a non-deductible expense for tax purposes, as it is now for American publications. This course has been advocated by a number of broadcasters and appears to deserve consideration as a means of providing a degree of protection for Canadian stations faced with direct competition for advertising revenue from American stations, without having a significantly adverse effect on Canadian viewers.

As one Canadian broadcasting executive has pointed out, however, this may provide only a "50 per cent answer" to the problem. He estimated that in the case of KVOS-TV, about half of the advertising carried on the station was by companies that could readily switch payment to an American entity and continue to claim the full deduction from American income tax.
THE EXPERIENCE OF LONDON, ONTARIO In trying to assess the impact of cable television on broadcasting, London, Ontario is Exhibit A. Two cable systems have been operating in the city since 1952, longer than any other community in Canada. Exactly 37.4 per cent of all the households reached by CFPL-TV, the only station in London, are served by cable, according to the report submitted to the Special Senate Committee on Mass Media by the broadcasting company. In Middlesex County, which embraces London, 87.1 per cent of the households are receiving cable television. According to the CBC estimate, 71.5 per cent of London viewers watched some television via cable during the March survey period of the B.B.M., the highest proportion of any city in Canada.
Cable systems operate in ten out of the eleven counties reached by CFPT-TV. The station itself was instrumental in starting one of the systems, that in Chatham, in order to extend its reach. Of the two systems operating in Middlesex County, London TV Cable Service - the largest, with 34,988 subscribers - brings in seven American stations, CHCH-TV in Hamilton, CKCO-TV in Kitchener, the local station, CFPL-TV, and five FM radio stations.
The smaller system, recently taken over by Maclean-Hunter, has 11,000 subscribers and brings in eight American stations, the same three Canadian stations and four FM stations.
London became an early market for cable because many of the homes in the city were located in a valley and could not receive American stations that would normally be available by off-the-air pickup because of their proximity to the area.
From all the available evidence, there is little room to doubt that the widespread installation of cable has had a marked effect in restricting the audience that otherwise almost certainly would have been attracted by CFPL-TV.
The following table, prepared on behalf of the station, shows an almost steady decline in the number of households (as opposed to individuals) tuned to CFPL-TV on average throughout the prime night time period during the fall from 1961 to 1967 and in January, 1968.
Table 131: Average Homes Viewing in Prime Time (CFPL-TV, London), 1961-1969 Fall, 1961 7 - 10 P.M. 55,100 Fall, 1962 7 - 10 P.M. 51,800 Fall, 1963 7 - 10 P.M. 49,700 Fall, 1964 8 - 10 P.M. 51,600 Fall, 1965 8 - 10 P.M. 49,600 Fall, 1966 7 - 10 P.M. 47,100 Fall, 1967 7 - 10 P.M. 46,200
January, 1968 7 - 11 P.M. 47,800
Table 132 provides a rather startling insight into the effect of cable in diverting audience viewing from the local station to other channels. The figures under each column marked (00) indicate the number of people in hundreds included in the survey sample. The percentage figure indicates the proportion of the sample tuned to each station on average during each quarter-hour during the designated time period according to whether they viewed television by off-the-air pickup or via either the· London or Community cable systems.
In all cases, the proportion of the audience viewing CFPL-TV off-the-air is substantially higher than that by cable. It should be noted that the proportion of cable viewers subscribing to the community (now Maclean-Hunter) cable system who watch CFPL is significantly lower than in the case of the London cable system. In the view of the station management, this discrepancy is explained by the fact that the quality of the CFPL-TV signal has been inferior to that of the London company, which for seven years has received transmissions from the stations directly by cable. (London TV Cable Service Ltd. also has its head-end receivers for other stations erected on CFPL's transmitting tower. The broadcasting company agreed to this arrangement on the theory that since the antennae were going to be erected somewhere, it was better to accept installation on their own tower in exchange for a direct feed from CFPL to the cable system, thus ensuring transmission of the highest quality signal possible.)
It is estimated by the Bureau of Broadcast Measurement that the amount of viewing hours devoted to the main Canadian stations received in the London area ÐCFPL-TV and CKCO-TV in Kitchener - declined from 66.6 per cent of the total in March, 1967, to 63.9 per cent in February, 1968, and to 62.9 per cent by March of 1969.
A study of the impact of cable in terms of the audience reach and proportion of viewing hours for each station received in London was prepared by the Committee's research staff. Included in the study was a projection of the total number of viewing hours that might be expected to be devoted to each station by the London audience if there was no such thing as cable television.

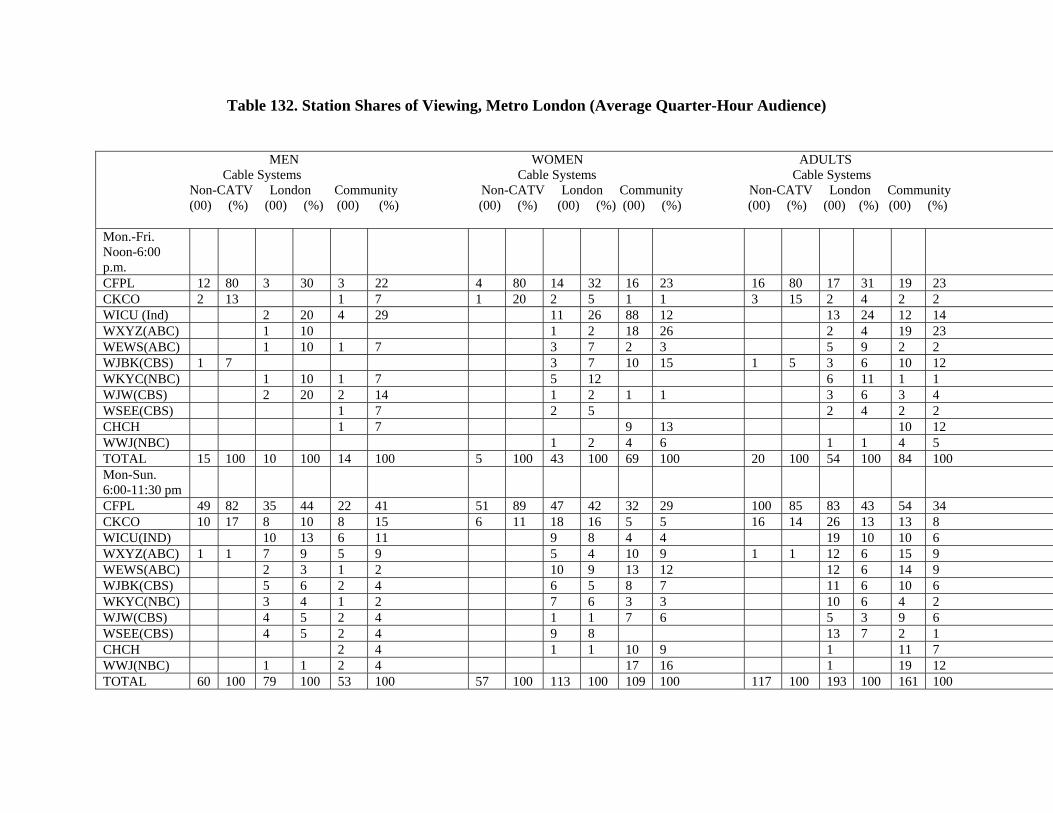
Table 132. Station Shares of Viewing, Metro London (Average Quarter-Hour Audience)
MEN WOMEN ADULTS Cable Systems Cable Systems Cable Systems Non-CATV London Community Non-CATV London Community Non-CATV London Community (00) (%) (00) (%) (00) (%) (00) (%) (00) (%) (00) (%) (00) (%) (00) (%) (00) (%)
Mon.-Fri. Noon-6:00 p.m.
CFPL 12 80 3 30 3 22 4 80 14 32 16 23 16 80 17 31 19 23 CKCO 2 13 1 7 1 20 2 5 1 1 3 15 2 4 2 2 WICU (Ind) 2 20 4 29 11 26 88 12 13 24 12 14 WXYZ(ABC) 1 10 1 2 18 26 2 4 19 23 WEWS(ABC) 1 10 1 7 3 7 2 3 5 9 2 2 WJBK(CBS) 1 7 3 7 10 15 1 5 3 6 10 12 WKYC(NBC) 1 10 1 7 5 12 6 11 1 1 WJW(CBS) 2 20 2 14 1 2 1 1 3 6 3 4 WSEE(CBS) 1 7 2 5 2 4 2 2 CHCH 1 7 9 13 10 12 WWJ(NBC) 1 2 4 6 1 1 4 5 TOTAL 15 100 10 100 14 100 5 100 43 100 69 100 20 100 54 100 84 100 Mon-Sun. 6:00-11:30 pm
CFPL 49 82 35 44 22 41 51 89 47 42 32 29 100 85 83 43 54 34 CKCO 10 17 8 10 8 15 6 11 18 16 5 5 16 14 26 13 13 8 WICU(IND) 10 13 6 11 9 8 4 4 19 10 10 6 WXYZ(ABC) 1 1 7 9 5 9 5 4 10 9 1 1 12 6 15 9 WEWS(ABC) 2 3 1 2 10 9 13 12 12 6 14 9 WJBK(CBS) 5 6 2 4 6 5 8 7 11 6 10 6 WKYC(NBC) 3 4 1 2 7 6 3 3 10 6 4 2 WJW(CBS) 4 5 2 4 1 1 7 6 5 3 9 6 WSEE(CBS) 4 5 2 4 9 8 13 7 2 1 CHCH 2 4 1 1 10 9 1 11 7 WWJ(NBC) 1 1 2 4 17 16 1 19 12 TOTAL 60 100 79 100 53 100 57 100 113 100 109 100 117 100 193 100 161 100
As part of our own inquiry, we took a similar approach in an effort to determine the
impact of cable on two stations - CFPL-TV in London and CHCH-TV in Hamilton - in each of the counties which they reach.
Based on this approach, the figures indicate that in every county CFPL-TV could expect to gain viewing hours, in some cases very substantially. In a number of counties, CHCH-TV would lose viewing hours if there were no cable, which means, conversely, that it has gained an advantage from cable in those counties.
In all, the number of viewing hours devoted to CFPL-TV would increase by 1,803,563 hours to 10,573,863, an increase of 20.6 per cent. In the case of CHCH-TV, however, the projection indicates that after weighing losses against gains, the number of viewing hours would increase by only 470,208, to a total of 21,630,294, a rise of 2.2 per cent.
Given heavy impact on audiences over an extended period of time, the question that arises is what effect this has had on the rates, revenues, and profits of the station. There appears to be little room for doubt that in the absence of cable, CFPL-TV would obtain a significantly higher total of viewing hours, more advertising revenue and higher profits. On the other hand, there is also a strong likelihood that in the absence of cable, CFPL-TV would have found itself confronted by direct competition for audiences and advertising dollars from a second Canadian television station. Just such a development has taken place in other centres with a similar potential audience. From a financial point of view, therefore, the present London station might be no better off under these circumstances and, in fact, might well be worse off.
It has been suggested that the erosion of audiences for CFPL-TV resulting from cable has had the effect of increasing significantly the cost of advertising over the station in terms of viewers reached. The advertising rate per 1,000 viewers for London, based on the B.B.M. daily night time circulation for November and the sixty-second advertising rate in effect at the time amounted to seventy-one cents. This rate does not appear to be out-of-line with other private stations of similar size and, if anything, is rather low. The rate per thousand for the Vancouver station, for example, was sixty-nine cents, for Edmonton seventy-five cents, for Winnipeg ninety-one cents, and for Ottawa eighty-six cents.
While the management of CFPL-TV can foresee the possibility that its profit position may begin to face a squeeze as a result of revenues hitting a plateau and costs continuing to rise, it is frank to admit that it has no cause for complaint about its present financial position - even if it finds cause for concern about the future. "We are not crying; we are doing very well," one official acknowledged.
Unquestionably, however, both the present and the future would be less bright if CFPL·TV were confronted by competition not only from cable, but from another Canadian station operating in its own backyard. The fact that London viewers do not have the benefit of a second local station probably has to be counted as one of the costs of the cable television invasion of the area.
THE DEMAND FOR PROTECTION
A number of proposals have been advanced to provide a degree of protection for Canadian television broadcasters against the reputed ill-effects of cable systems. operators that the right to carry commercials was essential to cover programming costs.
In Canada, the C.R.T.C. has actively encouraged cable systems to develop their own programming. While the commission has suggested this should complement, rather than compete with the programming of broadcasting stations, it is obviously difficult - if not impossible - to lay down any hard-and-fast lines. For the present, the commission has prohibited cable systems from carrying their own commercials. But this policy is obviously always subject to change. Furthermore, as suggested earlier, there is also a reasonable possibility that the C.R.T.C.'s jurisdiction over the programming of cable systems, including commercials, could be successfully challenged in the courts.
However and whenever it comes about, extensive programming and advertising by cable systems could present new problems in providing for some degree of orderly transition to radically new technologies.
CABLE TELEVISION AND THE FUTURE Even if it is assumed that cable television will in time have a seriously adverse impact on television broadcasters, the question that remains is whether Canadian stations should be granted protection and, if so, to what degree and for what period. Even if they want to, for how long can public authorities stand against the public's demand for the benefits of a new technology, no matter what the consequences for established corporate interests? "Burgeoning CATV and cable systems are already making it quite clear that the customers are looking for maximum station-program choice and good signal quality," Eugene S. Hallman, Vice-President and General Manager of the C.B.C.'s English broadcasting network told the Association of Canadian Advertisers in Toronto in May, 1969. "Television is, of course, more than a delivery system of receivers and station networks and satellites, collecting and distributing services," he continued.
But the economics of television is so closely related to the profitability of the delivery system that technological change of a significant character, for example, direct home satellite reception or massive cable multiplication or EVR availability could affect television profoundly. We in television are in for a big shake-up.
Mr. Hallman suggested that during the coming decade, today's great broadcasting
networks might well become obsolete. His prediction was reinforced by Stuart Griffiths, President of Bushnell Communications, who was reported in the October, 1969, issue of Broadcaster Magazine to have maintained that a national cable television network would be established in Canada within the next ten years. Within that period he forecast that the CBC and CTV networks would disappear, along with a number of private stations "and we will have a new beast."

Apparently acting on this premise, Bushnell Communications is understood to have acquired interests in a large number of cable television systems, in addition to buying the Canadian Marconi broadcasting stations in Montreal and all the broadcasting properties owned jointly or separately by the Davies and Thomson families, subject to C.R.T.C. approval, in North Bay, Kingston, Peterborough, Timmins, and Kirkland Lake.
In its own submission to the C.R.T.C., the CBC envisaged the possibility that cable television might well revolutionize the present broadcast delivery system, the method of broadcast financing and programming itself. R.C. Fraser, the CBC's Vice-President for Corporate Affairs, raised the possibility that private broadcasters might close down their transmitters and rely on cable for transmission of their programming if some 80 per cent of the homes in their receiving area became wired. Advertising, he suggested, might be reduced or eliminated completely if the public was prepared to pay up to $100 a year for program service. Present television stations might become only originators of programming, which they sold to cable systems for distribution, the latter covering their costs through direct payments or commercials of their own.
The potential future of cable television as a means of shopping, banking, obtaining selective programming, information retrieval and a myriad of other purposes have become subjects of common speculation among broadcasters in recent years. Much of this speculation has revolved around the possible introduction of cable systems with many times the present capacity. While twelve channels is the usual limit, some systems have already been built with twenty channels and systems with forty or more channels are in the advanced stage of experimentation.
It is equally conceivable, however, that the system of the future will consist not of an infinite number of channels in a coaxial cable, but only a single channel with a capacity for infinite choice. Such a system would be based on the same approach as the telephone, which through a single wire to an exchange permits the user to direct a call to the four corners of the earth. Through the use of a single cable and a dial, this "program exchange" system would permit the user to link his television set with an endless number of channels serving an endless number of purposes.
The development of such a system within the foreseeable future appears to be well within the limits of reality. The necessary equipment has already been developed and employed experimentally. Some authorities have estimated that with as many as 5,000 subscribers a programme exchange system providing access to some eighteen channels would be economically feasible if the necessary regulating provisions - including permission to carry commercials and impose special charges for special services - were made. While the future, as always, remains unclear, one thing that seems certain is that neither vested private interests nor governments are likely to be successful for long in keeping it waiting.
Chapter 3:
CBC RESEARCH REPORT: EXTENT OF USE OF CABLE TV IN CANADA
See earlier report: A Measure of the Impact of Cable TV in Canada (TV /68/43) which described the audience situation in November 1967. The present situation, as of March 1969, is summarized below. The attached tables provide the detailed statistics. The source of audience data on which this analysis is based is again the BBM Bureau of Measurement national survey, in this case the survey for March 1969: * Throughout the country as a whole, in an average week, about 3.1 million people
watched some television via cable TV. This is approximately 15.3 per cent of the total Canadian population aged 2 years and over, or about 15.9 per cent of those who watched any television, by cable or by direct means, in an average week in mid-March.
* This 3.1 million represents about a 59 per cent increase over the number of people using
cable TV in an average week 16 months earlier, in November 1967. That is, over these 16 months, the extent of usage of cable TV facilities has grown at an average rate of between 3 1/2 and 4 per cent per month nationally.
* This analysis of March 1969 data confirms the findings of the earlier study that those
who watch television via cable tend to spend only very slightly more time viewing than those who do not have cable. Throughout the country as a whole, in March 1969, the per capita difference amounted to no more than an average 6 minutes per week: the average cable TV user spent 23 hours 36 minutes a week watching television, the average non-cable TV user 23 hours 30 minutes.
* As in November 1967, the greatest numbers of cable TV subscribers in March 1969 were
located in the two most heavily-populated provinces, Ontario and. Quebec. With a growth rate of about 67 per cent in cable TV usage over the 16 months November 1967 to March 1969, British Columbia continues, however, to be proportionately the most heavily saturated province with just under 38 per cent of its population watching television via cable in an average week, to Ontario's 18 per cent and Quebec's 15 per cent.
* As noted in the report on the November 1967 situation, while there are in general more
cable TV sets per capita in the major population centres than elsewhere in the country, the expansion of cable TV in Canada is by no means confirmed to the big cities. The main factors contributing to the growth of cable continue to be the amount and variety of available on-air television, the proximity of on-air signals that can be "taped" by cable (particularly the signals of American stations along the U.S. border) and of course the commercial acumen of the local cable TV operator.
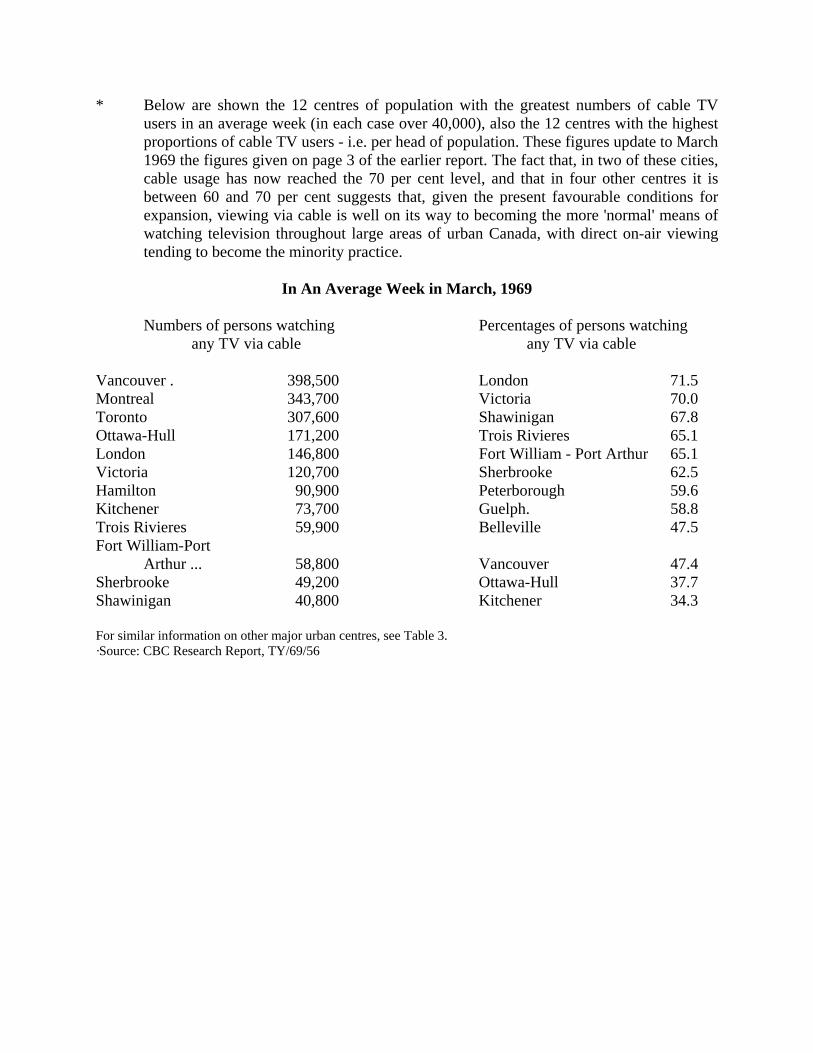
* Below are shown the 12 centres of population with the greatest numbers of cable TV users in an average week (in each case over 40,000), also the 12 centres with the highest proportions of cable TV users - i.e. per head of population. These figures update to March 1969 the figures given on page 3 of the earlier report. The fact that, in two of these cities, cable usage has now reached the 70 per cent level, and that in four other centres it is between 60 and 70 per cent suggests that, given the present favourable conditions for expansion, viewing via cable is well on its way to becoming the more 'normal' means of watching television throughout large areas of urban Canada, with direct on-air viewing tending to become the minority practice.
In An Average Week in March, 1969
Numbers of persons watching Percentages of persons watching
any TV via cable any TV via cable Vancouver . 398,500 London 71.5 Montreal 343,700 Victoria 70.0 Toronto 307,600 Shawinigan 67.8 Ottawa-Hull 171,200 Trois Rivieres 65.1 London 146,800 Fort William - Port Arthur 65.1 Victoria 120,700 Sherbrooke 62.5 Hamilton 90,900 Peterborough 59.6 Kitchener 73,700 Guelph. 58.8 Trois Rivieres 59,900 Belleville 47.5 Fort William-Port
Arthur ... 58,800 Vancouver 47.4 Sherbrooke 49,200 Ottawa-Hull 37.7 Shawinigan 40,800 Kitchener 34.3 For similar information on other major urban centres, see Table 3. ·Source: CBC Research Report, TY/69/56
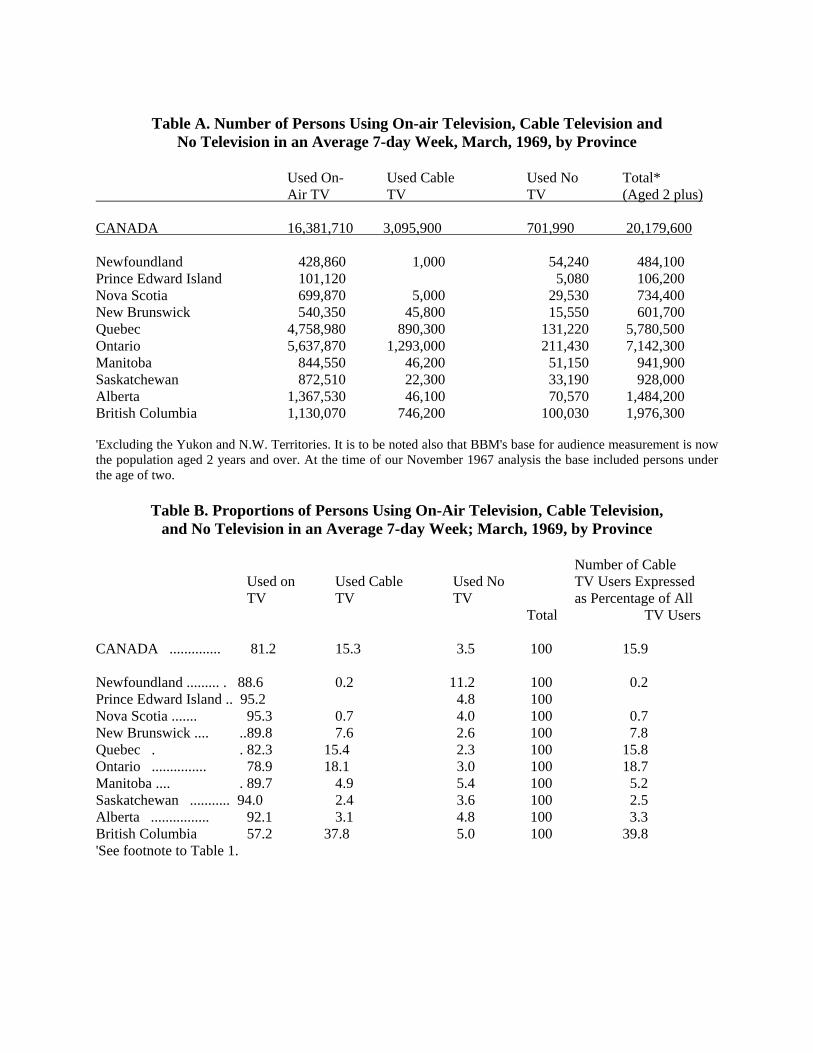
Table A. Number of Persons Using On-air Television, Cable Television and
No Television in an Average 7-day Week, March, 1969, by Province
Used On- Used Cable Used No Total* Air TV TV TV (Aged 2 plus) CANADA 16,381,710 3,095,900 701,990 20,179,600 Newfoundland 428,860 1,000 54,240 484,100 Prince Edward Island 101,120 5,080 106,200 Nova Scotia 699,870 5,000 29,530 734,400 New Brunswick 540,350 45,800 15,550 601,700 Quebec 4,758,980 890,300 131,220 5,780,500 Ontario 5,637,870 1,293,000 211,430 7,142,300 Manitoba 844,550 46,200 51,150 941,900 Saskatchewan 872,510 22,300 33,190 928,000 Alberta 1,367,530 46,100 70,570 1,484,200 British Columbia 1,130,070 746,200 100,030 1,976,300 'Excluding the Yukon and N.W. Territories. It is to be noted also that BBM's base for audience measurement is now the population aged 2 years and over. At the time of our November 1967 analysis the base included persons under the age of two.
Table B. Proportions of Persons Using On-Air Television, Cable Television, and No Television in an Average 7-day Week; March, 1969, by Province
Number of Cable
Used on Used Cable Used No TV Users Expressed TV TV TV as Percentage of All
Total TV Users CANADA .............. 81.2 15.3 3.5 100 15.9 Newfoundland ......... . 88.6 0.2 11.2 100 0.2 Prince Edward Island .. 95.2 4.8 100 Nova Scotia ....... 95.3 0.7 4.0 100 0.7 New Brunswick .... ..89.8 7.6 2.6 100 7.8 Quebec . . 82.3 15.4 2.3 100 15.8 Ontario ............... 78.9 18.1 3.0 100 18.7 Manitoba .... . 89.7 4.9 5.4 100 5.2 Saskatchewan ........... 94.0 2.4 3.6 100 2.5 Alberta ................ 92.1 3.1 4.8 100 3.3 British Columbia 57.2 37.8 5.0 100 39.8 'See footnote to Table 1.

Table C. Number and Proportion or Persons Watching Cable Television in an Average 7-
day Week in Each of 46 Major Urban Centres with Age 2-plus Populations of Over 32,000, March, 1969
Persons Using Cable TV
Population Number Per Cent of Population Area (Aged 2 plus) (Aged 2 plus)
CANADA......................... 20,179,600 3,095,900 15.3 Newfoundland St. John's 100,990 -- -- Nova Scotia Sydney-Glace Bay 101,770 Halifax 195,280 New Brunswick Moncton 59,580 Saint John 99,940 Quebec Chicoutimi-Jonquiere . 106,710 Quebec . 420,320 27,600 6.6 Sherbrooke 80,190 49,200 61.4 Granby City 34,270 No information Drummondville 42,780 St. Jean . 42,570 Montreal 2,476,300 343,700 13.9 Trois Rivieres 93,790 59,900 63.9 Shawinigan .. 63,040 40,800 64.7 Ontario Cornwall 45,430 No information Ottawa-Hull 511,680 171,200 33.5 Kingston 74,010 Belleville 32,970 14,800 44.9 Peterborough . 56,850 32,900 57.9 Oshawa .. 107,340 15,000 14.0 Toronto 2,278,930 307,600 13.5 Brampton . 57,420 13,900 24.2 Hamilton 464,740 90,900 19.6 St. Catharines 113,710 4,800 4.2 Niagara Fails 61,200 Weiland 60,150 Brantford 63,250 18,600 29.4 Kitchener . 206,410 73,700 35.7 Guelph . 53,740 28,300 52.7 London 215,590 146,800 68.1
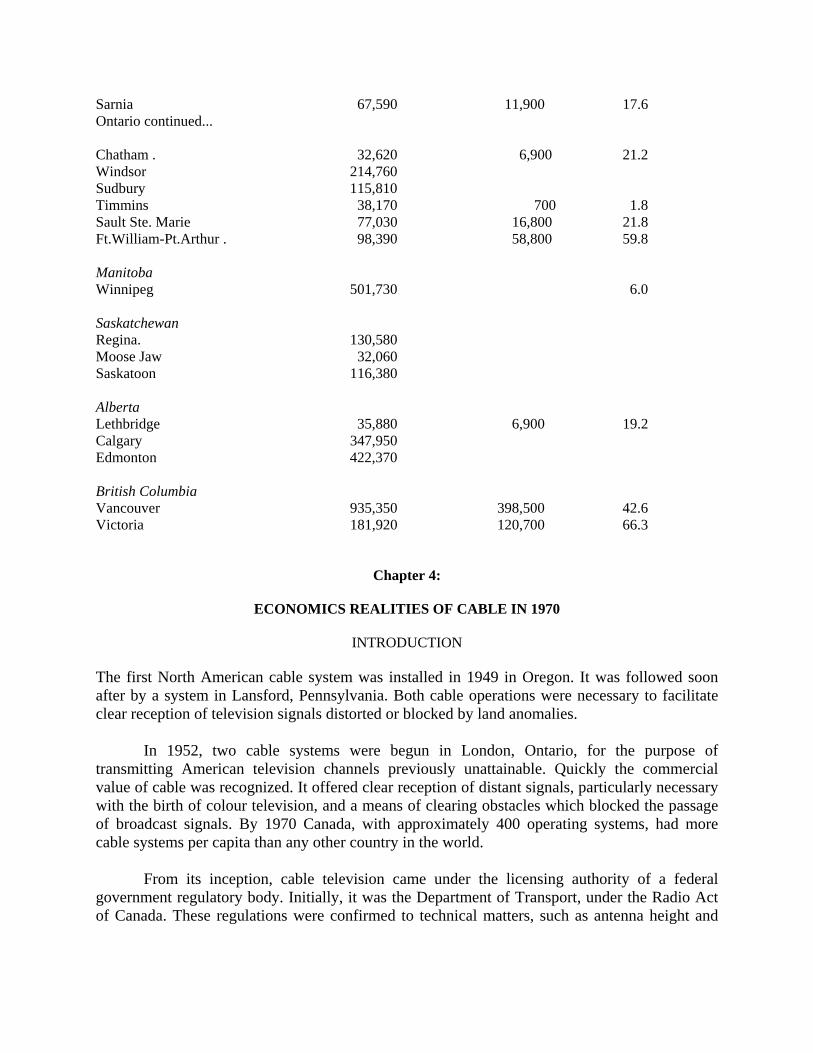
Sarnia 67,590 11,900 17.6 Ontario continued... Chatham . 32,620 6,900 21.2 Windsor 214,760 Sudbury 115,810 Timmins 38,170 700 1.8 Sault Ste. Marie 77,030 16,800 21.8 Ft.William-Pt.Arthur . 98,390 58,800 59.8 Manitoba Winnipeg 501,730 6.0 Saskatchewan Regina. 130,580 Moose Jaw 32,060 Saskatoon 116,380 Alberta Lethbridge 35,880 6,900 19.2 Calgary 347,950 Edmonton 422,370 British Columbia Vancouver 935,350 398,500 42.6 Victoria 181,920 120,700 66.3
Chapter 4:
ECONOMICS REALITIES OF CABLE IN 1970
INTRODUCTION The first North American cable system was installed in 1949 in Oregon. It was followed soon after by a system in Lansford, Pennsylvania. Both cable operations were necessary to facilitate clear reception of television signals distorted or blocked by land anomalies.
In 1952, two cable systems were begun in London, Ontario, for the purpose of transmitting American television channels previously unattainable. Quickly the commercial value of cable was recognized. It offered clear reception of distant signals, particularly necessary with the birth of colour television, and a means of clearing obstacles which blocked the passage of broadcast signals. By 1970 Canada, with approximately 400 operating systems, had more cable systems per capita than any other country in the world.
From its inception, cable television came under the licensing authority of a federal government regulatory body. Initially, it was the Department of Transport, under the Radio Act of Canada. These regulations were confirmed to technical matters, such as antenna height and
site and radiation characteristics of the cable. They prohibited the use of more than one microwave relay connection to extend the possible reception distance of a cable system.
By the 1968 Broadcasting Act, authority was given to the C.R.T.C. to establish a number of other policies which affect or could potentially affect the operations of cable. The key aspects of these regulations are:
1. a priority list of channels to be carried, which proposes a limitation to one commercial and one non-commercial American channel, except at the discretion of the Commission. (Proposed.)
2. a blackout of American programmes appearing simultaneously with, or one week before or after, the same programme on a Canadian channel. (Proposed.)
3. encouragement to cable operators to produce local programmes of particular interest to the area which they serve and to assist in the development of educational programming. (Approved.)
4. refusal to permit advertising on local programme channels, meaning their source of revenue should be monthly subscriptions to the system. (Approved.)
5. licensing of only one operator per license area, preventing competition for potential subscribers. (Approved.)
The components of a cable system - head end receiver, coaxial cable, amplifiers and drop
wires - may be owned by the cable operator or rented, in part or in whole, from a common carrier or public utility. If a microwave system is required to transmit signals to the head end, the microwave equipment is owned by the common carrier. The rental charges for poles on which to hang the coaxial cable and for rental of other equipment from the common carrier or public utility have been a matter of considerable public discussion. It has been claimed that the rental charges are excessive. Whether rented or owned, the cost outlay on equipment may be written off as a business expense in the form of rent or depreciation.
The cable systems of the future are capable of more than transmitting broadcast signals or producing local programmes. The concept of the wired city includes plans for data retrieval systems, facsimile in-home print-out, computerized programme requests, and in-home shopping. The technical equipment necessary for these developments is currently feasible in theory. In time they will become economically feasible. Both common carriers and cable operators have given thought to expanding into these new fields. It has not yet been resolved with whom this responsibility will lie.
CURRENT SUBSCRIPTION The rapid expansion of cable systems throughout Canada defies accurate maintenance of records regarding the number of cable subscribers. Further, the records of the C.R.T.C. and D.B.S. do not correspond since the two organizations define cable operations differently. To the C.R.T.C., a cable operation is a "broadcast receiving undertaking" which distributes audio-video programming via wired systems to subscribers. The D.B.S. definition includes those systems as defined by the C.R.T.C., but also includes closed-circuit television systems which receive no off-
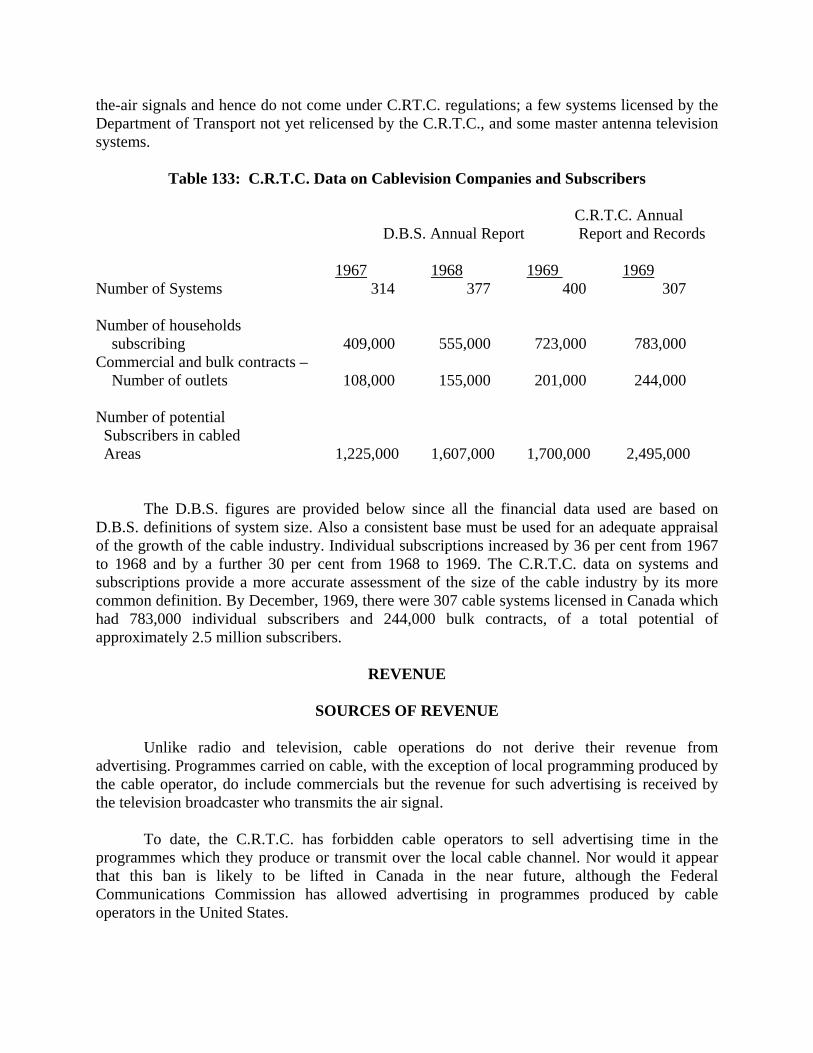
the-air signals and hence do not come under C.RT.C. regulations; a few systems licensed by the Department of Transport not yet relicensed by the C.R.T.C., and some master antenna television systems.
Table 133: C.R.T.C. Data on Cablevision Companies and Subscribers
C.R.T.C. Annual D.B.S. Annual Report Report and Records
1967 1968 1969 1969
Number of Systems 314 377 400 307 Number of households subscribing 409,000 555,000 723,000 783,000 Commercial and bulk contracts – Number of outlets 108,000 155,000 201,000 244,000 Number of potential Subscribers in cabled Areas 1,225,000 1,607,000 1,700,000 2,495,000
The D.B.S. figures are provided below since all the financial data used are based on D.B.S. definitions of system size. Also a consistent base must be used for an adequate appraisal of the growth of the cable industry. Individual subscriptions increased by 36 per cent from 1967 to 1968 and by a further 30 per cent from 1968 to 1969. The C.R.T.C. data on systems and subscriptions provide a more accurate assessment of the size of the cable industry by its more common definition. By December, 1969, there were 307 cable systems licensed in Canada which had 783,000 individual subscribers and 244,000 bulk contracts, of a total potential of approximately 2.5 million subscribers.
REVENUE
SOURCES OF REVENUE Unlike radio and television, cable operations do not derive their revenue from
advertising. Programmes carried on cable, with the exception of local programming produced by the cable operator, do include commercials but the revenue for such advertising is received by the television broadcaster who transmits the air signal.
To date, the C.R.T.C. has forbidden cable operators to sell advertising time in the programmes which they produce or transmit over the local cable channel. Nor would it appear that this ban is likely to be lifted in Canada in the near future, although the Federal Communications Commission has allowed advertising in programmes produced by cable operators in the United States.
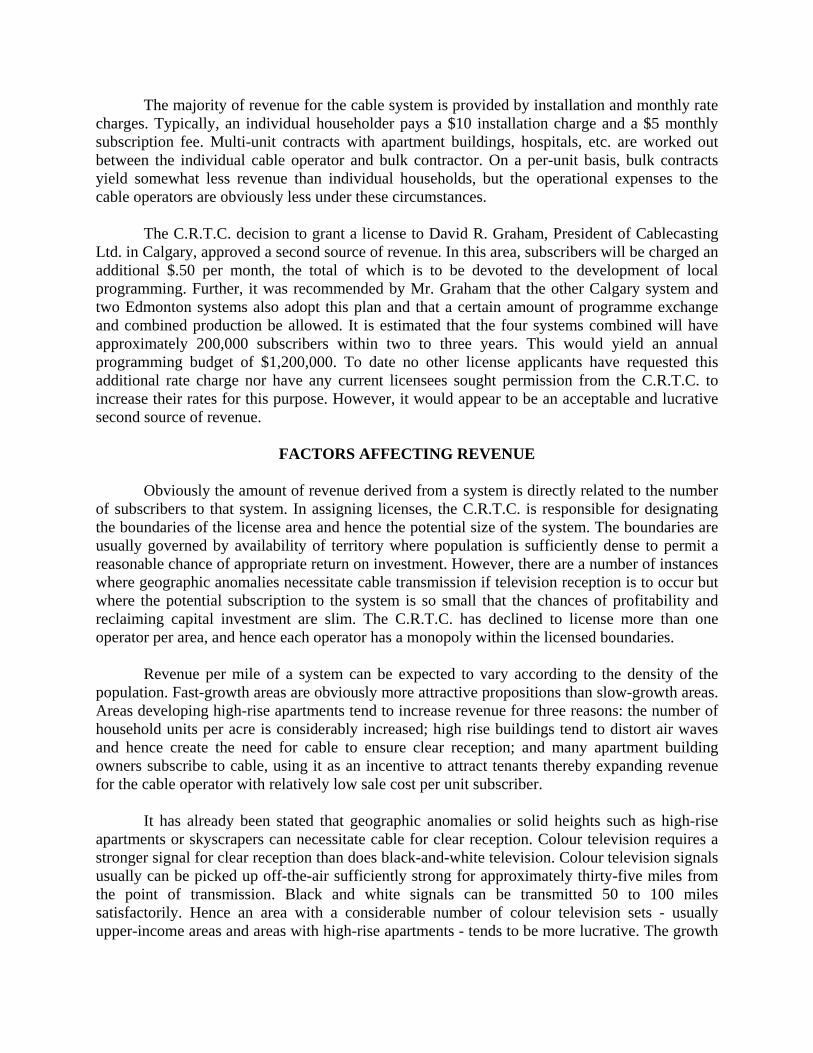
The majority of revenue for the cable system is provided by installation and monthly rate charges. Typically, an individual householder pays a $10 installation charge and a $5 monthly subscription fee. Multi-unit contracts with apartment buildings, hospitals, etc. are worked out between the individual cable operator and bulk contractor. On a per-unit basis, bulk contracts yield somewhat less revenue than individual households, but the operational expenses to the cable operators are obviously less under these circumstances.
The C.R.T.C. decision to grant a license to David R. Graham, President of Cablecasting Ltd. in Calgary, approved a second source of revenue. In this area, subscribers will be charged an additional $.50 per month, the total of which is to be devoted to the development of local programming. Further, it was recommended by Mr. Graham that the other Calgary system and two Edmonton systems also adopt this plan and that a certain amount of programme exchange and combined production be allowed. It is estimated that the four systems combined will have approximately 200,000 subscribers within two to three years. This would yield an annual programming budget of $1,200,000. To date no other license applicants have requested this additional rate charge nor have any current licensees sought permission from the C.R.T.C. to increase their rates for this purpose. However, it would appear to be an acceptable and lucrative second source of revenue.
FACTORS AFFECTING REVENUE
Obviously the amount of revenue derived from a system is directly related to the number of subscribers to that system. In assigning licenses, the C.R.T.C. is responsible for designating the boundaries of the license area and hence the potential size of the system. The boundaries are usually governed by availability of territory where population is sufficiently dense to permit a reasonable chance of appropriate return on investment. However, there are a number of instances where geographic anomalies necessitate cable transmission if television reception is to occur but where the potential subscription to the system is so small that the chances of profitability and reclaiming capital investment are slim. The C.R.T.C. has declined to license more than one operator per area, and hence each operator has a monopoly within the licensed boundaries.
Revenue per mile of a system can be expected to vary according to the density of the population. Fast-growth areas are obviously more attractive propositions than slow-growth areas. Areas developing high-rise apartments tend to increase revenue for three reasons: the number of household units per acre is considerably increased; high rise buildings tend to distort air waves and hence create the need for cable to ensure clear reception; and many apartment building owners subscribe to cable, using it as an incentive to attract tenants thereby expanding revenue for the cable operator with relatively low sale cost per unit subscriber.
It has already been stated that geographic anomalies or solid heights such as high-rise apartments or skyscrapers can necessitate cable for clear reception. Colour television requires a stronger signal for clear reception than does black-and-white television. Colour television signals usually can be picked up off-the-air sufficiently strong for approximately thirty-five miles from the point of transmission. Black and white signals can be transmitted 50 to 100 miles satisfactorily. Hence an area with a considerable number of colour television sets - usually upper-income areas and areas with high-rise apartments - tends to be more lucrative. The growth
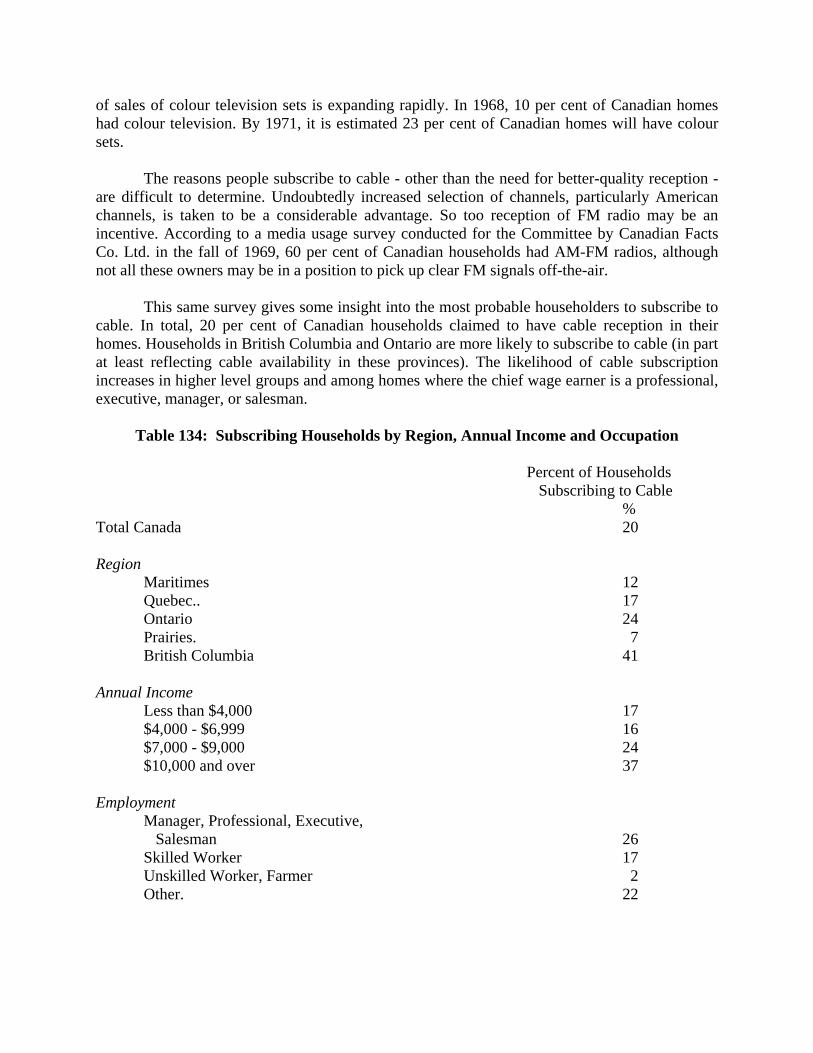
of sales of colour television sets is expanding rapidly. In 1968, 10 per cent of Canadian homes had colour television. By 1971, it is estimated 23 per cent of Canadian homes will have colour sets.
The reasons people subscribe to cable - other than the need for better-quality reception - are difficult to determine. Undoubtedly increased selection of channels, particularly American channels, is taken to be a considerable advantage. So too reception of FM radio may be an incentive. According to a media usage survey conducted for the Committee by Canadian Facts Co. Ltd. in the fall of 1969, 60 per cent of Canadian households had AM-FM radios, although not all these owners may be in a position to pick up clear FM signals off-the-air.
This same survey gives some insight into the most probable householders to subscribe to cable. In total, 20 per cent of Canadian households claimed to have cable reception in their homes. Households in British Columbia and Ontario are more likely to subscribe to cable (in part at least reflecting cable availability in these provinces). The likelihood of cable subscription increases in higher level groups and among homes where the chief wage earner is a professional, executive, manager, or salesman.
Table 134: Subscribing Households by Region, Annual Income and Occupation
Percent of Households Subscribing to Cable
% Total Canada 20 Region
Maritimes 12 Quebec.. 17 Ontario 24 Prairies. 7 British Columbia 41
Annual Income
Less than $4,000 17 $4,000 - $6,999 16 $7,000 - $9,000 24 $10,000 and over 37
Employment
Manager, Professional, Executive, Salesman 26 Skilled Worker 17 Unskilled Worker, Farmer 2 Other. 22
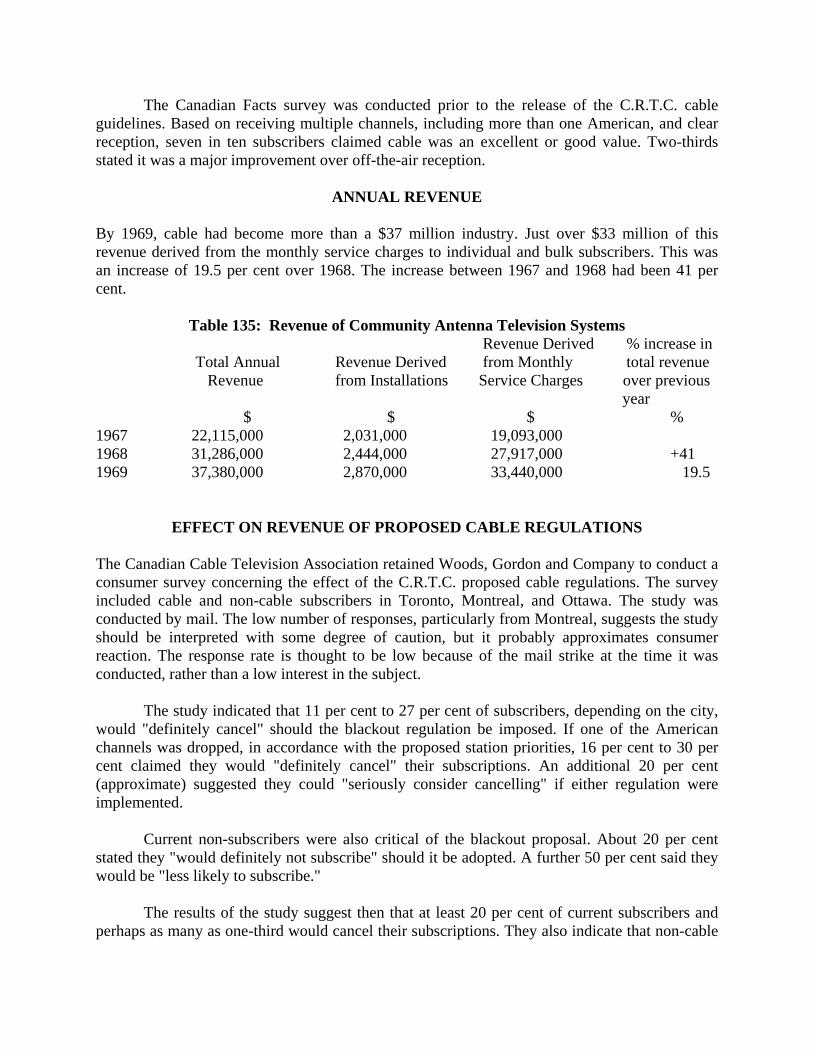
The Canadian Facts survey was conducted prior to the release of the C.R.T.C. cable guidelines. Based on receiving multiple channels, including more than one American, and clear reception, seven in ten subscribers claimed cable was an excellent or good value. Two-thirds stated it was a major improvement over off-the-air reception.
ANNUAL REVENUE By 1969, cable had become more than a $37 million industry. Just over $33 million of this revenue derived from the monthly service charges to individual and bulk subscribers. This was an increase of 19.5 per cent over 1968. The increase between 1967 and 1968 had been 41 per cent.
Table 135: Revenue of Community Antenna Television Systems Revenue Derived % increase in
Total Annual Revenue Derived from Monthly total revenue Revenue from Installations Service Charges over previous
year $ $ $ % 1967 22,115,000 2,031,000 19,093,000 1968 31,286,000 2,444,000 27,917,000 +41 1969 37,380,000 2,870,000 33,440,000 19.5
EFFECT ON REVENUE OF PROPOSED CABLE REGULATIONS
The Canadian Cable Television Association retained Woods, Gordon and Company to conduct a consumer survey concerning the effect of the C.R.T.C. proposed cable regulations. The survey included cable and non-cable subscribers in Toronto, Montreal, and Ottawa. The study was conducted by mail. The low number of responses, particularly from Montreal, suggests the study should be interpreted with some degree of caution, but it probably approximates consumer reaction. The response rate is thought to be low because of the mail strike at the time it was conducted, rather than a low interest in the subject.
The study indicated that 11 per cent to 27 per cent of subscribers, depending on the city, would "definitely cancel" should the blackout regulation be imposed. If one of the American channels was dropped, in accordance with the proposed station priorities, 16 per cent to 30 per cent claimed they would "definitely cancel" their subscriptions. An additional 20 per cent (approximate) suggested they could "seriously consider cancelling" if either regulation were implemented.
Current non-subscribers were also critical of the blackout proposal. About 20 per cent stated they "would definitely not subscribe" should it be adopted. A further 50 per cent said they would be "less likely to subscribe."
The results of the study suggest then that at least 20 per cent of current subscribers and perhaps as many as one-third would cancel their subscriptions. They also indicate that non-cable

householders would be less likely to subscribe. Probably about one in five who might subscribe without the blackout ruling would refuse. It is not likely to be higher than this since most of these non-subscribers presumably have access to cable at this time but have not yet taken advantage of it despite the availability of more than one American channel and no blackout. Nevertheless, the study indicates that cable revenue would probably be reduced by 20 per cent under these conditions.
The study did not assess the positive advantages of local programming or other service extensions which could in time be undertaken by cable operators. It must, however, be realized that many cable operations are not yet sufficiently profitable to expand into local programming or other services to counteract the effect of the proposed regulations on blackout and reduction of American channels.
Nor did the study determine whether the positive advantage of clear reception in colour would assist in counteracting loss of .subscribers. However, as it is estimated that only 23 per cent of homes in Canada will have colour television sets by 1971, this factor can only affect the decision of a portion of the subscribers.
COST FACTOR ANALYSIS Since cable is still very much in the developmental stages, unlike radio and even unlike television which is already established, it is difficult to assess cost factors on an industry-wide basis. As long as a cable system is a signal transmission service as opposed to a signal producing unit (through programme production), its main costs are in equipment, financing, and installation, maintenance, and repairmen salaries.
Unless an operator is expanding into local programming, once a system is installed fully, capital expenditure and labour costs are reduced considerably, although loan payments and interest on loans continue for some time. The condition of new licenses, that the entire area be cabled within the first two years, creates the need for considerable financing in this period.
We now examine cost of equipment, labour costs, cost of financing, and finally estimated cost of local programming. The considerable variance in costs from province to province according to the common carrier or public utility policy, differences in labour costs and staffing policies, and escalating equipment costs make it extremely difficult to generalize on any cost factors.
The financial information provided in these sections derives from financial returns of individual systems and group owned systems filed directly with the Committee and from public information released in the D.B.S. Community Antenna Television Systems annual reports. The information referred to has been averaged or is shown in aggregate form to protect its confidentiality. Any relationship between the figures shown and those of an individual system is purely coincidental.

TRANSMISSION EQUIPMENT
A cable system consists of a head end antenna, which receives off-the-air signals and filters and re-amplifies the channels to be re-transmitted, a coaxial cable or trunk line, which carries the multi-channels, and which is equipped with amplifiers at intervals to retain uniform signal strength, and tap units at each point where a subscriber's own drop wire is to be attached to the trunk line. The coaxial cable is strung on poles or laid through underground conduits belonging to the common carrier or public utility. The cable operator is charged approximately $3 per pole annually or charged similarly on a footage basis for use of a conduit. In some instances it is necessary to dig trenches in which to lay the cable, for which a higher rental fee is accorded.
There is neither a consistent policy regarding ownership of the equipment comprising a cable system nor a consistent rate structure for rental of such equipment from common carrier to common carrier. Alberta Government Telephones, for example, insists it must own all the equipment and rent to the cable operator, whereas Bell Telephone (which operates in Ontario, Quebec, Newfoundland and New Brunswick) gives the cable operator the option of owning or renting all or part of the system. Typically, the common carrier or public utility owns the coaxial cable and the cable operator owns the remainder of the system.
A study conducted by David J. Workman of the Institutional Securities Commission in Montreal in April, 1970, suggests the cost which must be allotted for installing a coaxial cable and amplifiers is $4,000 per mile of the system. It has been suggested by cable operators that this figure is somewhat low and, due to escalating costs, already out of date. Probably $5,000 per mile on the average would be more realistic.
These figures include labour costs. In Toronto, where labour costs are particularly high, cable laying averages closer to $7,000 per mile .of system which is an increase of approximately 2S per cent over the past two years. This increase in costs is typical of most regions in Canada. Approximately 25 per cent of cable operations are less than two years old and hence have been subject to considerably increased costs of getting into business.
The number of potential subscribers per mile varies between 100 and 200 households according to population density. Assuming then that about 50 per cent of the potential households subscribe, the cost of installing coaxial cable and amplifiers can be estimated at $50 to $100 per subscriber.
On the whole, smaller cable systems are in the less densely populated areas and larger cable systems in the more densely populated urban centres. Hence, the smallest systems which generate the least cash flow pay proportionately more per subscriber to lay the cable than do the larger systems.
INSTALLATION OF TAP UNITS AND DROP WIRES In the past, cable operators have contracted with a subscriber before installing tap units and drop wires to connect the household to the trunk line. Some cable operators now insert tap units

outside each potential subscriber's home at the same time as laying the coaxial cable. This latter system obviously results in a number of unused tap units due to non-subscription but permits greater assurance of correct insertion of the taps which otherwise can result in the loss of signal strength. It is felt the cost of the extra tap units is more than offset by the saving in maintenance and repairs. The cost for one tap unit, one drop wire, and their installation is generally estimated at approximately $10 per household. Installation of drops may be carried out by cable or common carrier staff. In either situation the cost per installation does not vary significantly.
OBSOLENSCENCE/TECHNOLOGY ADVANCEMENT With the speed of advancement in technology and the desire to offer more diversified services, already some cable operators are considering changing portions of their equipment. The coaxial cable is capable of two-way signal transmission. However, this requires two-way amplification. To date, the majority of systems are equipped with only one-way amplifiers. Although the sophistication of in-home programme request, home shopping, away-from-home control over electronic appliances, and a multitude of other services is some distance in the future, the simple problem of sending signals from the local cable studio to the head end for transmission through the system requires this two-way amplification facility. One cable operator has estimated it would cost $350 per mile of system to replace his current amplifiers with the more advanced two-way variety.
MICROWAVE Not all cable systems require microwave transmission of signals to their head end antenna. However, this facility is necessary for those operations in the Maritimes and the Prairies.
Department of Communications regulations state that the microwave systems of Canada must be owned by the common carrier who will rent such services to those in need of them. The specifications for such equipment require that all systems include an alternate service for transmission in case of faulting in one route. They also require a very high standard of signal delivery. In addition, the common carrier built system is usually designed with additional capacity to serve its own needs or the needs of others who may in time require a transmission service. As a result, the common carrier has been accused of unnecessarily increasing the cost of the microwave service. Further, it is claimed by cable operators (and by broadcasters for whom the same regulations apply) that the rental fee charged is excessive given that they use only a portion of one of the duplicated transmission services. It is also said by broadcasters that this cost has delayed extension of service to outlying areas.
The Special Senate Committee on Mass Media has been supplied with data by the common carriers and by broadcasters regarding CJCH-TV in Halifax, exchange of services between Saint John and Moncton, and a number of cases in British Columbia to illustrate the problem.
LABOUR COSTS
During the first two years, labour costs include executive salaries, salesmen's commission and/or salaries, wages for technicians employed to install, maintain, or repair equipment. The costs of the last group have been computed into the costs of equipment since some companies choose to hire their own staff while others pay the common carrier or public utility to install, maintain and repair equipment, including the final into-the-home taps and drop wires. Regardless of this fact, cable systems must retain one technician per 1,000 to 1,500 subscribers responsible for repair work. According to the location of the system, the salary varies between $6,500 and $9,000 annually. In addition, a repair truck for each repair man valued at approximately $3,000 must be purchased.
Typically cable operations retain few executives, many of whom own and operate the system. Cable operators, owning their systems, report that they claim little salary during the formative years.
Salesmen at least in urban areas usually work on a commission basis. The commission per subscription sale averages $25 to $30. In smaller centres where the smaller systems exist, salaries and/or commissions are somewhat less or the owner-operator may sell himself.
TOTAL SYSTEM COST AND FINANCING The cost of building a new cable system and/or the cost of purchasing the license and a partially or completely built system is substantial. For a new area, the successful applicant pays $10 for the license, the conditions of which state that the area must be fully cabled within the next two years. Failure to comply with this condition can result in loss of the license.
Estimates suggest that a system with 1,000 potential subscribers will incur costs of approximately $75,000 through laying cables and attaching drop wires and other sundry expenses during the first two years. Revenue in this period could be expected to total no more than $20,000. A system with 15,000 potential subscribers would incur nearly $800,000 in expenses and receive about $300,000 in revenue. A system with 50,000 potential subscribers would have expenses of over $2 million with revenue of about $1,000,000.
It is obvious from this that the smaller the system the slower the return on investment. Approximately one-third of the expenditure is used to purchase capital assets, the remainder is expended on labour costs and other expenses. Part of these expenses occur because the cable operator pays a common carrier or public utility for part of the system and then has to pay additional rent for use of that system. Loss of license after two years would then result in substantial financial loss to the owner. While it is true that the installed system can be sold as a unit, the operator is unlikely to recover anything close to his investment.
As a result, cable operators have experienced considerable difficulty in locating reasonable finance which could be paid off over six to ten year periods. This length of payoff was too long for the demand loans of chartered banks and too short for loans from insurance companies or pension plans. Financiers like to lend funds equivalent only to half the value of tangible assets. RoyNat have been willing to finance cable operations with ten-year paybacks but at a price - in some instances 12.5 per cent interest and a 10 per cent share in the company of

stock issued free. According to David R. Graham and James D. Meekison in their article "Today's Challenge of Financing Cable Television," appearing in the 1968-69 winter edition of Canadian Telephone and Cable Television, "institutional lenders are beginning to accept a pledge of cash flow rather than a pledge of physical assets as security for loans. "
It is thought that banks would be more willing to invest if they could be equity shareholders. To date the C.R.T.C. has rejected them as suitable partners. However, bank participation is under review by the C.R.T.C.
When the cost of interest on such loans is added to other expenses, most cable operations cannot hope to break even in less than three to four years.
PROGRAMMING The Special Senate Committee on Mass Media staff conducted research to attempt to assess the interest in and cost of local programming. Since few cable operations have as yet started local programme production, and since the C.R.T.C. guidelines for such programming are not clear, it was difficult to make any accurate assessment of this cost factor. However, since it is obvious that the C.R.T.C. is in favour of such a development, the following estimates are provided.
Obviously the larger systems have more revenue with which to expand into programming. It is thought that it will cost systems with revenues of $400,000 or more annually between $200,000 and $250,000 to purchase the necessary equipment. This equipment would include such things as black and VTR cameras, studios, modulators, lights, monitors, etc. The middle-sized systems of $200,000 to $400,000 annual revenue estimate expenditures of about $90,000. Some of the smaller systems suggested they might expend $10,000 in equipment, but the majority of this size did not feel local programming could be feasible for them.
Annual salaries for programme creative and production staff were estimated to be comparable annually to the investment costs in equipment - for the largest groups $200,000 to $250,000 with approximately 40 employees, for the middle group $70,000 with ten to twelve employees, and for the smallest operators who thought they might do some programming, $10,000 for two to three people; but here, it was suggested, current employees would have to double up their responsibilities if local programming were to be feasible.
Cable operators owning more than one system plan to exchange programmes of suitable subject matter from one system to another. This will permit, it is argued, higher quality production and/or would increase the number of hours of programming per week. These multi-system owners tend to be in the higher revenue groups. It is likely that if programme exchange were forbidden, the estimates for purchase of equipment and the quality of that equipment would change considerably to something affordable by an individual system rather than by the group as a whole.
PROFITABILITY
The potential profitability of cable has been generally recognized. Stock brokers have not been slow to recommend investment in cable companies to their clients. Despite rising costs and the heavy expenditure necessary in the first two years of operation, there seems to be little reason to question this supposition.
Table 136 provides data on itemized revenue and expense items and a net operating profit for the community antenna television industry as shown in D.B.S. Annual Reports 1967 to 1969. In examining these figures, the reader is cautioned that the information includes closed-circuit television as well as cable systems licensed by the C.R.T.C.
During the years 1967 to 1969, revenue increased proportionately faster than expenses broadening the profit margin of cable systems. In 1967 operating profit as a per cent of revenue was 8.7; in 1968, 14.6 per cent; and in 1969, 19.5 per cent. In 1968 the profit margin on sales for radio was 13.2 per cent and for television was 21.4 per cent. Cable's profit as a per cent of revenue at 14.6 per cent and higher again in 1969 compares very favourably, and there seems little doubt then when fully established cable will generate even higher profit margins.
Regionally in 1969 cable systems in British Columbia were considerably more profitable than those in other provinces. On the average a cable system in this province showed a profit of $37,900, more than twice the average for Canada as a whole. The average is undoubtedly affected by the fact that one British Columbia system is the largest in the world. British Columbia is followed by Manitoba and Saskatchewan at $12,400 on the average. Atlantic province systems are the least profitable averaging only $5,000 in 1969 (See Table 137.)
Table 138 examines profitability by revenue group. As in the case of television and radio stations, those operations with less than $100,000 in sales, show an overall loss for the year. Like broadcast too, the largest revenue group with annual sales in excess of $400,000 account for the majority of the overall industry's profit. Although in 1969 only 11 per cent of the cable systems generated more than $400,000 in revenue, they accounted for 91 per cent of the total industry's profit.
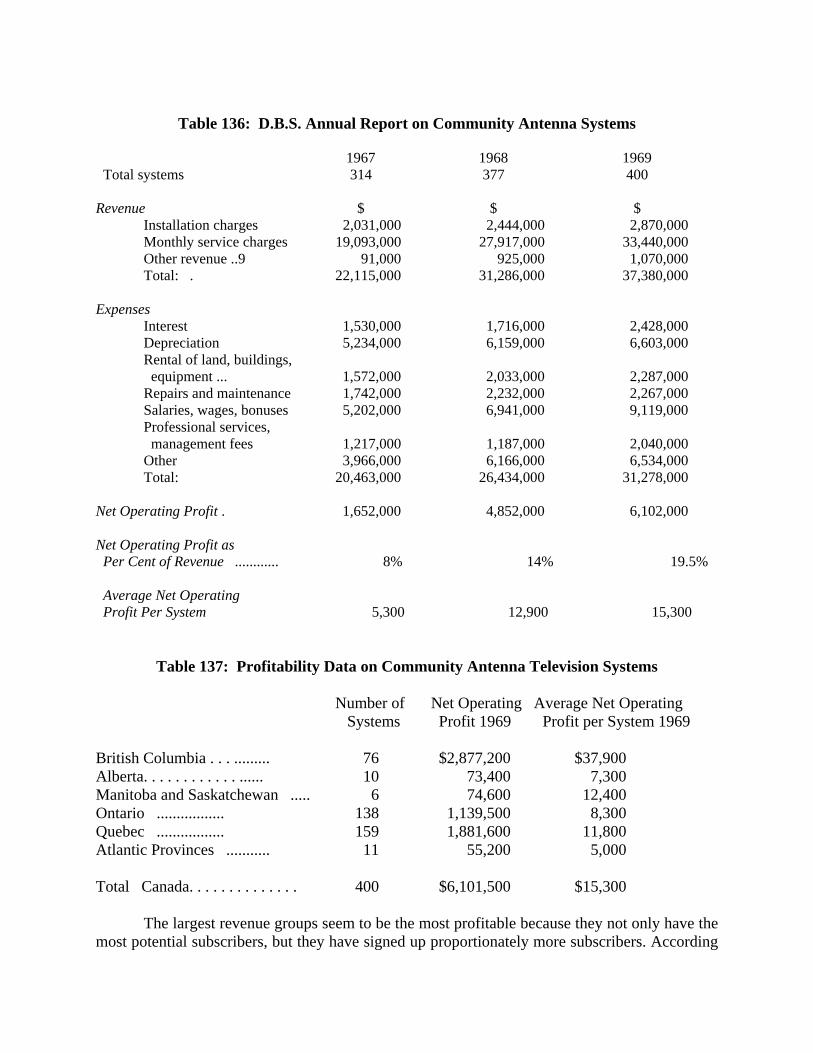
Table 136: D.B.S. Annual Report on Community Antenna Systems
1967 1968 1969
Total systems 314 377 400 Revenue $ $ $ Installation charges 2,031,000 2,444,000 2,870,000 Monthly service charges 19,093,000 27,917,000 33,440,000 Other revenue ..9 91,000 925,000 1,070,000 Total: . 22,115,000 31,286,000 37,380,000 Expenses Interest 1,530,000 1,716,000 2,428,000
Depreciation 5,234,000 6,159,000 6,603,000 Rental of land, buildings,
equipment ... 1,572,000 2,033,000 2,287,000 Repairs and maintenance 1,742,000 2,232,000 2,267,000 Salaries, wages, bonuses 5,202,000 6,941,000 9,119,000 Professional services, management fees 1,217,000 1,187,000 2,040,000 Other 3,966,000 6,166,000 6,534,000 Total: 20,463,000 26,434,000 31,278,000 Net Operating Profit . 1,652,000 4,852,000 6,102,000 Net Operating Profit as Per Cent of Revenue ............ 8% 14% 19.5% Average Net Operating Profit Per System 5,300 12,900 15,300
Table 137: Profitability Data on Community Antenna Television Systems Number of Net Operating Average Net Operating Systems Profit 1969 Profit per System 1969 British Columbia . . . ......... 76 $2,877,200 $37,900 Alberta. . . . . . . . . . . . ...... 10 73,400 7,300 Manitoba and Saskatchewan ..... 6 74,600 12,400 Ontario ................. 138 1,139,500 8,300 Quebec ................. 159 1,881,600 11,800 Atlantic Provinces ........... 11 55,200 5,000 Total Canada. . . . . . . . . . . . . . 400 $6,101,500 $15,300
The largest revenue groups seem to be the most profitable because they not only have the most potential subscribers, but they have signed up proportionately more subscribers. According

to a study conducted by the Special Senate Committee on Mass Media staff, on the average systems with over $400,000 revenue have achieved a 66 per cent penetration whereas those between $50,000 and $399,999 have reached only about 35 per cent. These latter systems would almost double their

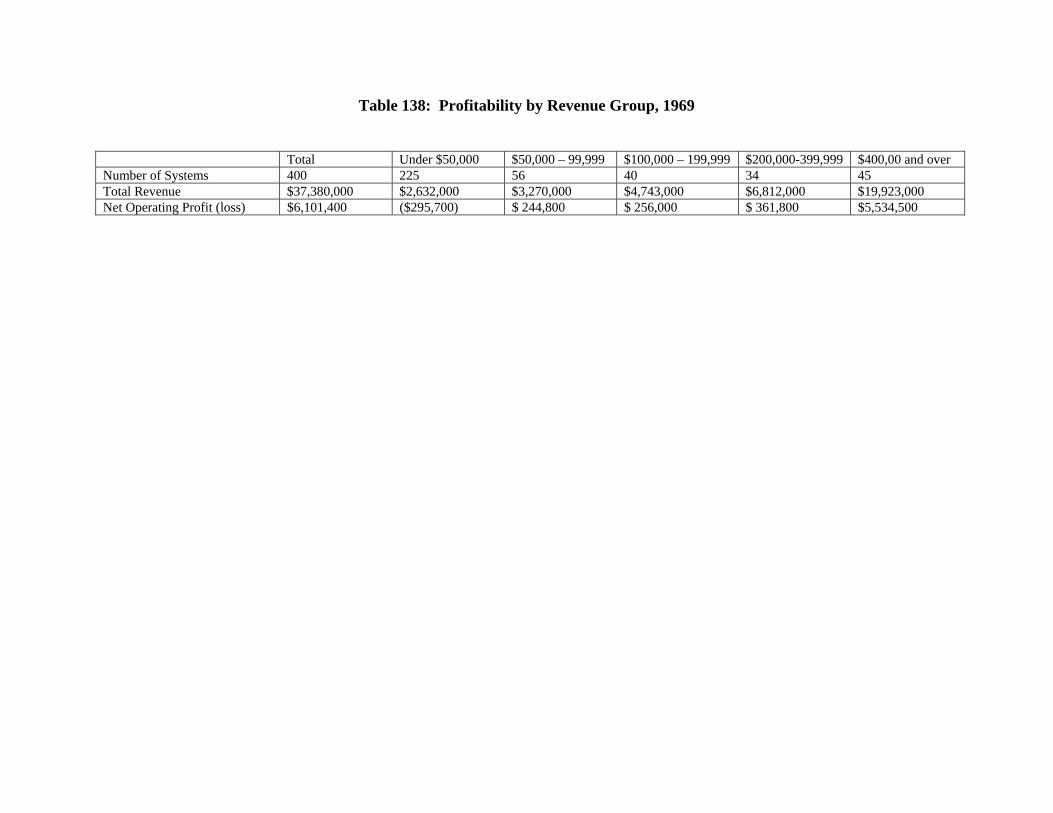
Table 138: Profitability by Revenue Group, 1969
Total Under $50,000 $50,000 – 99,999 $100,000 – 199,999 $200,000-399,999 $400,00 and over Number of Systems 400 225 56 40 34 45 Total Revenue $37,380,000 $2,632,000 $3,270,000 $4,743,000 $6,812,000 $19,923,000 Net Operating Profit (loss) $6,101,400 ($295,700) $ 244,800 $ 256,000 $ 361,800 $5,534,500
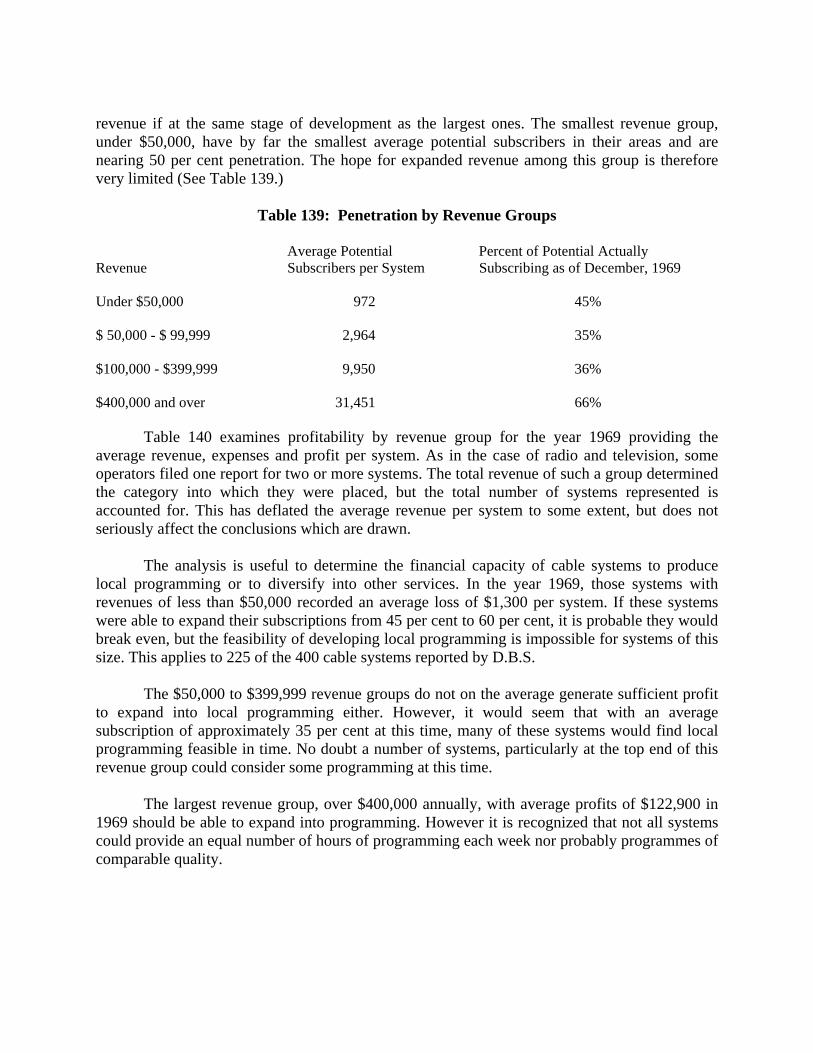
revenue if at the same stage of development as the largest ones. The smallest revenue group, under $50,000, have by far the smallest average potential subscribers in their areas and are nearing 50 per cent penetration. The hope for expanded revenue among this group is therefore very limited (See Table 139.)
Table 139: Penetration by Revenue Groups Average Potential Percent of Potential Actually Revenue Subscribers per System Subscribing as of December, 1969 Under $50,000 972 45% $ 50,000 - $ 99,999 2,964 35% $100,000 - $399,999 9,950 36% $400,000 and over 31,451 66%
Table 140 examines profitability by revenue group for the year 1969 providing the average revenue, expenses and profit per system. As in the case of radio and television, some operators filed one report for two or more systems. The total revenue of such a group determined the category into which they were placed, but the total number of systems represented is accounted for. This has deflated the average revenue per system to some extent, but does not seriously affect the conclusions which are drawn.
The analysis is useful to determine the financial capacity of cable systems to produce local programming or to diversify into other services. In the year 1969, those systems with revenues of less than $50,000 recorded an average loss of $1,300 per system. If these systems were able to expand their subscriptions from 45 per cent to 60 per cent, it is probable they would break even, but the feasibility of developing local programming is impossible for systems of this size. This applies to 225 of the 400 cable systems reported by D.B.S.
The $50,000 to $399,999 revenue groups do not on the average generate sufficient profit to expand into local programming either. However, it would seem that with an average subscription of approximately 35 per cent at this time, many of these systems would find local programming feasible in time. No doubt a number of systems, particularly at the top end of this revenue group could consider some programming at this time.
The largest revenue group, over $400,000 annually, with average profits of $122,900 in 1969 should be able to expand into programming. However it is recognized that not all systems could provide an equal number of hours of programming each week nor probably programmes of comparable quality.
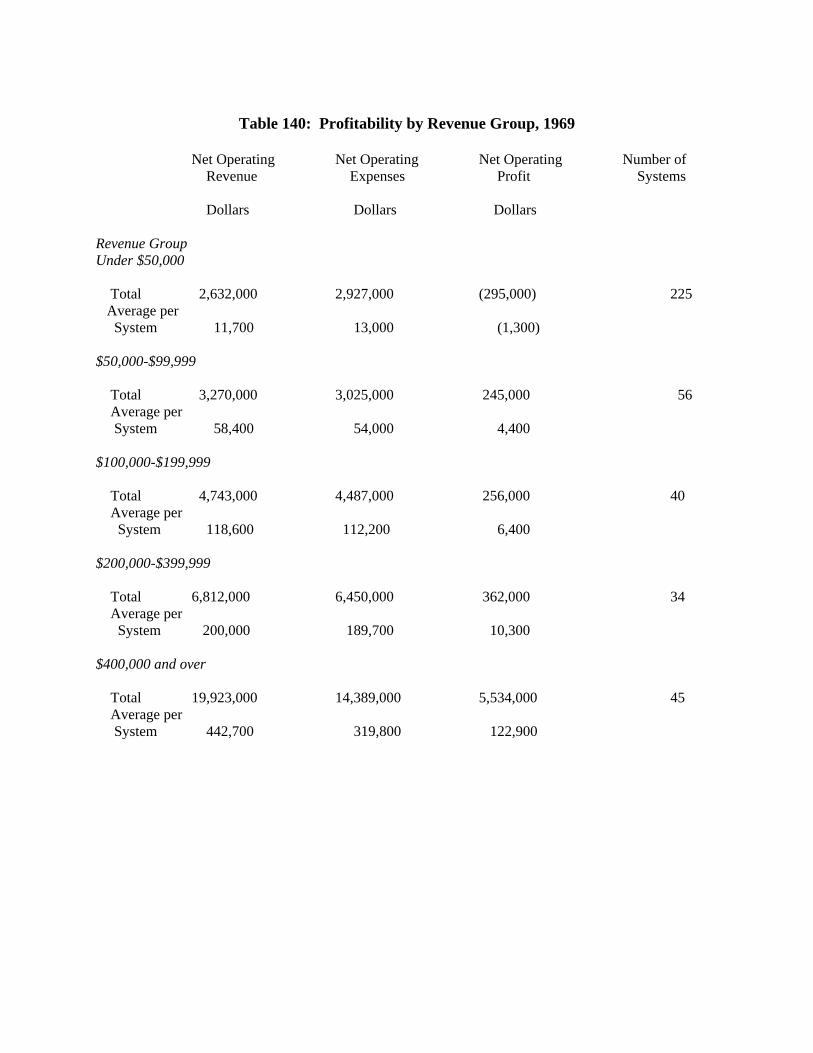
Table 140: Profitability by Revenue Group, 1969
Net Operating Net Operating Net Operating Number of Revenue Expenses Profit Systems Dollars Dollars Dollars Revenue Group Under $50,000 Total 2,632,000 2,927,000 (295,000) 225 Average per System 11,700 13,000 (1,300) $50,000-$99,999 Total 3,270,000 3,025,000 245,000 56 Average per System 58,400 54,000 4,400 $100,000-$199,999 Total 4,743,000 4,487,000 256,000 40 Average per System 118,600 112,200 6,400 $200,000-$399,999 Total 6,812,000 6,450,000 362,000 34 Average per System 200,000 189,700 10,300 $400,000 and over Total 19,923,000 14,389,000 5,534,000 45 Average per System 442,700 319,800 122,900
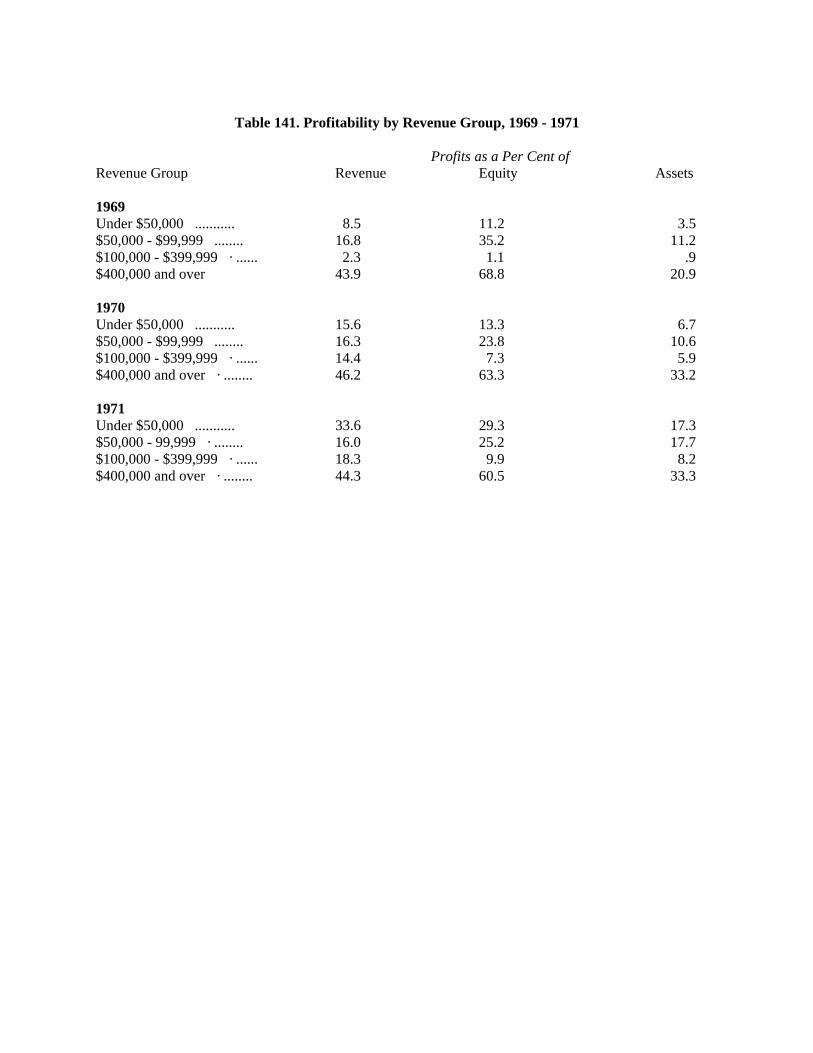
Table 141. Profitability by Revenue Group, 1969 - 1971
Profits as a Per Cent of Revenue Group Revenue Equity Assets 1969 Under $50,000 ........... 8.5 11.2 3.5 $50,000 - $99,999 ........ 16.8 35.2 11.2 $100,000 - $399,999 · ...... 2.3 1.1 .9 $400,000 and over 43.9 68.8 20.9 1970 Under $50,000 ........... 15.6 13.3 6.7 $50,000 - $99,999 ........ 16.3 23.8 10.6 $100,000 - $399,999 · ...... 14.4 7.3 5.9 $400,000 and over · ........ 46.2 63.3 33.2 1971 Under $50,000 ........... 33.6 29.3 17.3 $50,000 - 99,999 · ........ 16.0 25.2 17.7 $100,000 - $399,999 · ...... 18.3 9.9 8.2 $400,000 and over · ........ 44.3 60.5 33.3
Part III
VARIOUS FACTORS AFFECTING CONCENTRATION AND ECONOMICS IN THE MASS MEDIA
Chapter 1:
SOME OBSERVATIONS ON THE RELATIONSHIP
BETWEEN INCOME TAXES, ESTATE AND SUCCESSION DUTIES, ANTI-COMBINES LEGISLATION, AND
CONCENTRATION OF NEWSPAPER OWNERSHIP
INTRODUCTION This section is concerned primarily with the effect of tax and combines policy upon newspaper ownership. Obviously these are equally applicable to the broadcast media. But the existence of the Canadian Radio-Television Commission introduces an entirely different factor in the transfer of ownership of radio and television stations. To the extent that the C.R.T.C. chooses to make it, the broadcast marketplace is a controlled one, rather than a true free-enterprise market.
In the newspaper field, the laws of supply and demand operate to a larger extent, although the marketplace is not "natural" in the classic sense. It is limited by two important factors:
1. Tax regulation effectively prevents non-Canadian interests from controlling a Canadian newspaper; the cost of advertising in a foreign-owned newspaper would not be a deductible expense for income tax purposes by the advertiser, thus rendering advertising impractical in that newspaper.
2. The economics of daily newspaper publishing during the past quarter-century clearly indicate that the most advantageous way of entering a market is to acquire an existing property rather than originating a new one, especially in a market where newspaper competition exists.
COMBINES LEGISLATION The Interim Report on Competition Policy, Economic Council of Canada, July, 1969, has great potential for impact on this industry, just as it has in others. It is hoped within the Department of Consumer and Corporate Affairs that new combines legislation can be devised and passed by Parliament in 1971. Accordingly, this section is in two parts: "Past and Present" and "The Future?"
PAST AND PRESENT On no known occasion in Canada have the joint resources of the Combines and Investigation Branch and the Restrictive Trade Practices Commission prevented a newspaper sale, consolidation or merger. As a result, it is often said that anti-combines legislation in this country has had no bearing whatsoever on concentration of newspaper ownership.

In a positive sense the statement is true. But there must remain room for conjecture that
certain newspaper sales or purchases have not taken place because the principals were aware of the continuing concern of the Branch and its willingness to investigate in this area. However, unless newspaper executives themselves care to offer disinterested testimony on the point, there is no way of attaching weight to the conjecture.
Since 1960 three major studies in the newspaper field have been conducted by the Restrictive Trade Practices Commission. They concerned Pacific Press, Vancouver; the Fort William Times-Journal and the operation of certain weekly newspapers in the Sudbury-Copper Cliff area.
In its approach to concentration of media ownership the Branch has been hampered by staff shortages; the reliance of the Act on marketplace conditions; the exclusion of social policy considerations; and the reliance of the Act on commodities to the exclusion of services. To amplify in order: 1. Staff in July was only 49 officers and 10 research senior personnel with 117 supporting personnel. By fiscal 1974-75 these totals will rise respectively to 109, 20 and 212 under plans now approved, but additional responsibilities have recently devolved upon the branch which will engage a considerable percentage of this staff increase. The Branch still feels it will be short of staff in overall terms, even with the increases planned.
Staff limitations have prevented a long-desired overall research project into media concentration; a study that would embrace the whole field. With as many as 80 different investigations in progress at any one time it has proven impossible to allocate staff for so major a project in this and other important areas.
The Branch notes, however, that the three studies mentioned above, in that each relates to newspapers, constitute more activity in this field than has been produced in any other field. (It should be noted, though, that the Sudbury-Copper Cliff study was initiated through the provision in the Act which makes a study mandatory upon application by six citizens of Canada. It should be added that despite often-voiced concern over concentration of ownership this is the only case wherein six citizens have so applied in the newspaper consolidation field.) 2. In the view of its administrators, the Act gives no scope whatever for social policy considerations in the media field. The whole presumption of the legislation is that it shall be used in the field of the manufacture and sale of articles for ultimate public consumption and such newspaper studies as have been launched so far hang on the slender thread that a newspaper is indeed a commodity that is sold for 10 or 15 cents. There is no legislative basis for concern and action in the field of contraction of sources of information, ideas, vehicles of communications, etc. 3. Branch officials have spent some time trying to find a plausible way to stretch the existing Act to cover broadcast advertising and public information as commodities, but have decided that they simply cannot do so. Advertising and information are services and
arrangements for joint, combined or packaged advertising rates, could, in the view of the Branch, only fall within the purview of the Act in the event that these were overtly used to drive a competitor out of business or to prevent a competitor from entering business.
In a static situation wherein competition has long been absent and no potential but incapacitated competitor can be defined, advertising is considered clearly a service not covered by the commodity orientation of the existing Act.
Of the three studies, the Branch was most disappointed by the outcome of the Fort William investigation; this may have dampened the enthusiasm of the Branch for further forays into the newspaper concentration field.
In that case, the sale of the privately held Fort William Times-Journal to the Thomson organization, which also owned the only daily in adjacent Port Arthur, went to the heart of the Branch's conception of the Act, but the Restrictive Trade Practices Commission found no cause for interference.
A main Branch contention was that the two communities would eventually consolidate and that common ownership of both newspapers would lead to almost automatic merger instead of the more prolonged competition that might have resulted if separate owners were unprepared to yield.
(The municipal consolidation of the two cities into one - named Thunder Bay has now taken place.)
The Branch professes to be deeply concerned by such situations as London, Ontario,
where newspaper, radio and television interests are under common ownership, but says that in view of the restrictions in (2) and (3) the chances of a successful investigation would be slim. In a more relaxed staff situation, it was stated that the Branch would have instituted a study for at least the peripheral benefits of public information of the situation, but this was impossible because of the limitations of (l).
Given this situation the Branch considers a more fruitful approach its close relationship to the C.R.T.C., which consults the Combines Investigations Branch in all sale transactions which appear remotely connected with its sphere of interest. The C.R.T.C. is closely guided by Branch advice. It was suggested inferentially, although not directly, that Branch advice was a factor in recent C.R.T.C. decisions to remove the Bassett interests from the cable television field in Toronto.
THE FUTURE? The Economic Council's Interim Report on Competition Policy would appear upon first reading to satisfy most of the deficiencies the Branch considers to exist in the present legislation.
For instance, advertising in all its implications and consequences would be covered under the proposed new legislation. However, much can happen between the publication of an interim report and its eventual translation into legislation.
Assuming that advertising will probably be covered by the new Act, it is also probable that the process of newspaper consolidation will be largely stabilized by the time the Act passes. However, further speculation is of little point.
ESTATE AND SUCCESSION DUTIES It is difficult to imagine an area of more profound contradiction.
On one hand it is widely held by reasonable, intelligent men with access to the best possible professional advice, that these duties have contributed materially to concentration of newspaper ownership because the necessity of paying duties has forced the sale of newspapers; and group or conglomerate owners are the most ready buyers.
It is further contended that the very presence of the conglomerate owners aggravates the estate duty problem considerably because the Department of Finance tends to value a newspaper estate on its value in a marketplace where these conglomerates are dominant.
Conversely, men of equal reason and intelligence, with access to the same calibre of technical advice, hold that the contrary is true - that estate and succession duties are no more than a predictable difficulty under a certain form of ownership; a difficulty that can be resolved in a variety of ways.
They contend further that the market is in fact artificial because no interplay of foreign competition is allowed, which has a depressing effect on potential prices.
In this area, emotions can become intertwined with fact and may assume an independent reality of their own. A man convinced that a certain proposition is true will govern his actions accordingly.
The assumption that estate taxes (most people interviewed regarded provincial succession duties as a relatively minor factor) lead to the sale of businesses to foreign interests has often been made in Canada. If it is true in that area, it must perforce be true in the newspaper field, even though foreign ownership is not a factor. Here, again, agreement is scarce.
The Royal Commission on Taxation (Carter) could not (Volume 3, Pages 476-477) find satisfactory evidence that estate duties were anything other than a minor factor in most sales - and added that if a forced sale were really mandatory for this purpose, the sale "may in economic terms be good or bad depending on whether or not it advances the future prospects of the company."
The Report on Transfer Taxes, Ontario Economic Council, September, 1968, takes a sharply contrary view and in strong language condemns the estate tax as a major ingredient in the sale of family-owned companies to American and other foreign control. I

In this field, too, a past and present situation exists. Much criticism was previously
attached to the requirement that succession duties be paid forthwith. However, the 1968-69 Gift and Estate Tax amendments now permit an executor or
successor to make payments in six annual installments. This applies to deaths on or after October 23, 1968, and is held by family owners of newspapers to be a highly useful change. Also, complications are reduced by the provision that allows the property to be left to the widow without taxation.
ATTITUDES During the course of interviews, a number of attitudes were discovered. These are summarized below. More complete accounts of three interviews obtained under the Confidentiality Guidelines of the Committee have been filed as a separate memo with the Committee's research director. Attitude 1
This is held in common by persons now connected with conglomerate companies; by senior officials of the departments of revenue and finance; and a distinct minority of owners, or previous owners, of family newspapers. Briefly summarized it is that estate and succession duties are but one ingredient, and not a particularly large one, in the very complex process of deciding whether to sell, or not to sell a property. Attitude 2 This is exemplified by the publisher of a large, family-owned paper.
The estate tax has been a-central part of this man's thinking for more than thirty years. For several years he carefully gathered up shareholdings that had been diffused throughout his by then scattered family.
Then he spent several more years carefully consolidating the position of the newspaper, completely re-equipping it, and placing it upon the soundest possible footing.
Then he spent the final decade carefully vesting his equity control in his children and grooming a successor from within his family.
He feels, in a story which is at times poignant, that this whole process has come to dominate if not obsess his thinking and he admits to bitterness over what he regards as the complicity of the federal government in the decline and fall of the family business, which he feels is one of the central institutions upon which all Canadian values were founded ..

He adds that the transfer of equity (he retains voting control) has robbed him of a chance to be a wealthy man in his own right and that the whole operation was possible only because he. Was able to remain down through the years as chief executive officer and therefore..pay himself a substantial salary from the company. It is his belief that although he has largely solved the transfer of farms and fishing equipment from generation to generation as a model for protection of the independent newspaper from the acquisitive chains. This and related ideas are examined more closely below.
THE OPTION OF GOING PUBLIC With very few exceptions, publishers of independent newspapers contacted in the course of the study described their operations as being conducted against a background of continually increasing financial pressures.
There was also a commonality in the major causes cited for these pressures: estate taxes, increased capital investment necessitated by modernization programs and competitive factors, and rapidly increasing costs in all areas of operations.
And while there were wide philosophical differences as to its desirability, many publishers saw the only practical solution to these financial pressures for many independent newspapers in access to the financial resources of the large publishing chains.
In short, strong doubts were expressed as to the economic viability of independently owned newspapers operating under traditional ownership structures. Moreover, a change in ownership through sale to a chain was seen as the inevitable way out of the present owners' financial dilemma.
To accept this proposition in total, however, implies acceptance also of the premise that a newspaper is a unique business organization, subject to different strictures than companies in other industries.
There are perhaps important differences in the social and political implications of the product, and society has generally accepted the need for mechanisms to safeguard the public trust in the newspaper product. But it is equally true that at the business level, a newspaper enterprise is essentially an entrepreneurial activity, operated to yield a satisfactory level of profit to its proprietors.
It thus follows that the newspaper enterprise should have recourse to the same sources of finance as enterprises in other industries facing similar financial or tax questions. The evidence suggests that independent newspaper operators have utilized sources of conventional debt financing consistent with their size and earnings in much the same way as any other business.
The other traditional Canadian source of new capital - sale of equity to the public - has not been used to any great extent by independent newspaper enterprises in Canada. In fact, equity transactions have generally been restricted to sale of total or controlling interest to a larger
organization. In view of the role played by equity financing across Canadian industry - and the repeated reference to the problems arising from financial pressures - the question must be asked whether managers of independent newspapers have fully explored this source of new capital.
Moreover, since many seem to regard the financial resources of the publishing chains as a strong incentive for merger, could not this same objective be reached by drawing on the financial resources of the investing public? In effect, is offering the public an opportunity to invest in an independent newspaper company a viable alternative to selling the company to a chain organization?
Before attempting to answer these questions it is necessary to point out that no general principles can be enunciated that will apply equally to all independent newspaper companies. Some, by virtue of their financial stability and earning power, have no operational need for public financing; shares in these companies would undoubtedly find ready purchasers were they to be placed on the market. Others with less economic strength would be considered poor investment risks.
Any discussion of the merits or demerits of public financing is further complicated by the lack of empirical evidence - only one independent company is known to have gone public and its interests in other newspaper operations are so wide that it exhibits many of the characteristics of a chain operation.
Two independent companies are, however, in the process of offering shares for public subscription. The reasons underlying their decision to take this step, together with the opinions of other publishers who have considered and discarded the option of going public, will serve to provide at least some insight into the factors involved.
In both cases, the companies planning to offer shares have the same principal motivation: to obtain capital for expansion purposes.
The first, a long established and influential daily, is wholly owned by family interests and occupies a dominant role in its community and the surrounding region. During the past six years more than $7 million has been spent on plant modernization and new equipment; 80 per cent of the physical plant has been changed within the last ten years. From a technological standpoint, the operation is one of the most advanced in Canada.
Despite the efficient operation implied by this investment in technology and a good earnings record, the present management considers the company to be in an exposed position with the total resources directed toward one product. As the president and a major stockholder of the company explained:
The labour situation is developing new trends which are impossible to predict. We could be closed down by a strike at any time and since the newspaper represents the major part of the family holdings, a shutdown directly affects those members of the family who depend on it for their income.
The solution, as he sees it, is to diversify corporate activities into areas where income can be generated independently of the newspaper operation. With capital expenditures already planned for the newspaper plant, family resources are not sufficient to provide the needed funds for diversification and a public subscription offered the best and most advantages. Additional debt financing was discounted because it would "in effect, boil down to asking the family for the money because they would be guaranteeing it."
The decision to go public took two years for this company to reach. Expert advice was sought on tax and legal questions, both in a corporate sense and the possible ramifications for individual family shareholders. The opinions of other publishers in Canada and abroad were also sought out. As the president put it:
Our prime motivation was financial - but finances must not run the mind of a person. If I had not been convinced that the advantages would be gained at the philosophical level, we would not have taken this step.
A major preoccupation in this context was how the editorial integrity of the newspaper
might be affected should a sizeable block of shares be acquired by a particular interest or pressure group. This was resolved by deciding to place only 25 per cent of the shares on the market initially and placing an upper limit of 45 per cent of shares to be held at any one time outside the family. Shareholder agreements require all family-held shares to be offered first to other members before sale outside.
By these measures we will ensure continuity of the present management philosophies. In addition, by being able to participate in the affairs of the company the community at large will obtain a more accurate view of how we acquit our responsibilities and thus can base its ·confidence in us accordingly.
Not inconsequentially, the family shareholders will reap significant advantages from
going public. The shares to be distributed for public subscription represent a mixture of individual holdings and treasury shares. The two principal shareholders, for example, will receive a cash consideration that will reduce their personal indebtedness resulting from acquiring their holdings but still leave them in a controlling position.
The age of some of the family shareholders also poses potential cash problems arising from estate taxes. Reducing the individual holdings and at the same time providing each estate with cash from the proceeds of sale enhances the ability to meet estate taxes without a forced sale of the newspaper stock. This also provides against the contingency· of other family shareholders having to commit cash to buy a deceased shareholder's interests because of estate tax difficulties.
Another advantage seen in estate tax matters to be gained from going public is elimination of any arbitrary evaluation of holdings. Current practice is to value the enterprise on the basis of what a purchaser would reasonably be willing to pay for it. With a market created for the company's shares, the value of an estate's holdings can be readily ascertained without the intervention of a third-party arbitrator.

In the case of the second company in the process of going public, the circumstances are
much more clear-cut. A relatively new publishing enterprise producing daily newspapers and special interest weekly publications, the company has enjoyed rapid growth almost from its inception. The opportunities it sees for further growth, however, are beyond the present financial resources of the company and its outside debt financing sources.
Ownership is almost wholly held by the founder and president of the company and his ambitions for the organization psychologically rule out the option of raising capital through a partnership arrangement or sale to a chain.
In this particular case, going public will hopefully result in needed new capital without yielding control. And if expansion plans meet with success, it is entirely possible that the dollar value of the principal's holdings will be enhanced. In effect, he will hold a somewhat diluted but substantial interest in a potentially much larger organization.
Present plans call for 10 per cent of the shares to be offered for public subscription during the first year, with a possibility of a second 10 per cent to be sold the following year.
Estate taxes and other considerations played little or no part in the decision, taxes being separately provided for by insurance. .
It should be emphasized that both these organizations are in the process of offering their shares to the public. Both exhibit a natural optimism that their views will be confirmed by experience. Only time will tell if their objectives can be realized by the method they have chosen.
One of the questions put to officers of the two companies was how would they respond to the potential situation of a chain achieving a significant minority interest through open market purchases. (Both had stated categorically that they were not interested in selling to a chain.) Both seemed unconvinced that such an eventuality would arise. Moreover, they were of the opinion that should it happen there would be no harmful effects.
A third publisher disagreed strongly with this view and cited his own experience of the type of situation that can result from significant minority chain holdings. While a private company with 74 per cent of the shares held by the principal, some 25 per cent of the shares were acquired by the predecessors of one of the large chains in the early days of the company. The chain has resisted all attempts to buy its holdings and has made counter-offers to acquire the principal's shares.
This particular publisher expressed a strong desire to rationalize his holdings to guard against foreseeable estate tax difficulties but feels his flexibility has been considerably eroded by the chain's minority holdings. To go public, in his opinion, would mean to enable the chain to increase its holdings, bringing it closer to its stated goal of ultimately achieving control.
Before drawing any conclusions from this experience, however, it should be noted that the minority interest was acquired at a time when the company's assets were considerably less than their present level. Whether a chain would deem it a good investment to tie up the kind of funds needed today to obtain a minority position in the hope that it can be ultimately expanded to a controlling position is a matter of some conjecture.
When control is securely vested in a particular family or group and is backed by sufficient financial resources to resist outside pressures, minority holdings must be regarded as little more than portfolio investments. And the chains have shown no propensity to employ their resources in that way.
One final point that bears examination is the potential effect on the overall financial operation of an independent company when its shares are publicly traded. Under private ownership the question of financing is a matter between the operator and his bankers. When the company's investment potential, its earning power, its strengths and weaknesses, become matters of wider public discussion - as they inevitably must when the stock is publicly traded - a new element enters the equation.
To what extent would financing decisions now be conditioned by the market's evaluation of the company? Would credit lines be harder to justify by a bank manager to his head office in the event of negative market attitude toward the company?
These are unanswerable questions, of course. But by the same token it must be recognized that the relationship between the independent publisher and his sources of finance is often a highly personal one built over many years. In the case of some independent companies at least, there is a distinct possibility that a purely technical evaluation of the company may yield different risk results.
In this respect, the value of the owner's personal holdings may also suffer. In the absence of publicly traded shares, a chain evaluating a newspaper property for possible purchase will consider many factors in addition to physical assets in determining its offer. As a number of publishers have pointed out, chains are often prepared to pay a substantial premium for a property based on the corporate benefits they anticipate through acquisition.
Would such an offer still be made if publicly traded shares of the company were at a depressed level? Again, the question is unanswerable but a matter of some consequence to a publisher who may be contemplating relinquishing his holdings at some future time.
It is not possible at this point in time to provide a definitive answer on whether going public is a viable alternative for an independent publisher to selling to a chain. The question cannot be answered with any certitude until some empirical evidence is available.
One conclusion has emerged however. Equity financing is widely used among Canadian companies in most industries to good effect. Public participation has also been a strong factor in the capitalization of the Canadian broadcast industry.

Of the 116 daily newspapers published in Canada, seventy-seven are controlled by chains or companies with multiple media holdings. Operated in much the same way as other businesses and making full use of appropriate financing options, many of these organizations have made shares available" to the public.
The remaining thirty-nine independently-published newspapers are for the most part closely-held family interests. Strong traditions of family ownership predominate, often to the point where undiluted ownership is seen as a trust. To this point, no independently owned and operated newspaper has obtained financing through public subscription for shares.
It is from this latter group, however, that most of the comments concerning financial pressures came. There is an element of inconsistency in the apparent reluctance to use equity financing when, by normal business practices, the option is available.
Those now planning to go public are confident they have found the correct solution to their particular financial and operating situations. Interestingly, they emphasize their decisions were reached as businessmen, not publishers. As one president said: "The intellectual approach to running a newspaper no longer works. If you can't make a profit, you're out of business. There's no place for dreams when you're talking to bankers."
Others are less convinced that the philosophies or economics inherent in this position are sound.
Such divergent opinions are not surprising. Companies are subject to a wide number of conditions and influences and their decisions must reflect the realities of their particular circumstances. And other factors than personal and corporate economics enter the picture. In any given situation, therefore, a course of action that offers discernible advantages for one may be entirely unacceptable to another.
On the opinions expressed during this research, it would seem that offering shares for public subscription fits into this category. To some independent newspaper managements it is a viable financing option with distinct advantages; to others it has no validity in the newspaper industry.
Only practical experience will provide the perspective.
INCOME TAX The argument is frequently heard that federal income and corporation taxes are weighted in favour of the large, expansion-minded company and thus, in the newspaper context, place the smaller company at a disadvantage that hastens concentration of ownership.
Once again, there exists a past, present and future situation. The Proposals for Taxation tabled in Parliament by the Minister of Finance, November 7, 1969, will create, if enacted in part or in full, a situation different than that which exists today.
PAST AND PRESENT
Senior federal officials in the finance and revenue fields argue that the tax system is neutral in that it does not specifically encourage the large to devour the small.
It is conceded that one provision might be of specific benefit to large newspaper companies, - that of a rate of depreciation on capital equipment more accelerated for tax purposes than the rate at which business might otherwise depreciate equipment on its own books.
This might enable a large company to buy a newspaper and provide it with needed equipment - and newspapers are capital equipment-intensive - and obtain thereby a relatively beneficial tax situation for the next five years.
In general, however, it is argued that it is the natural predisposition of all business to grow, and that in general terms it is not the business of tax policy to impede such growth (although other legislation, such as anti-combines may come into play in certain growth situations.) Indeed, it is the view of many taxation experts and of parts of the Carter Report, that consolidation of small and inefficient industry in larger and more competitive units is in general beneficial to the broader Canadian interest, particularly in the export field. (The contradiction this poses for the internal, non-exporting newspaper industry is outlined below).
Businesses cannot grow unless they first make profits, as a general rule. Insofar as it has an opinion, it is clearly the view of Canadian tax policy that it is desirable that lawful business should generate lawful profits. Our entire economy is based upon this premise.
Taxation officials, while professing individual concern over the concentration of newspaper ownership, are fairly unanimous in their belief that tax policy does not cause such concentration, and are reluctant to concede that their policies should be used to prevent it.
THE FUTURE? A preliminary study of the Proposals for Taxation (and it is a document with complicated ramifications), indicates that takeovers of remaining independent newspapers by large chains or groups would be facilitated by the proposed new system.
One important provision in the White Paper would permit the interest on monies borrowed for the purpose of merger, purchase or takeover to be deducted for income tax purposes. This could be useful for chains that are public companies and are reluctant to issue additional shares for further acquisitions. It could be even more useful for private companies because their shares are often valued at a lower price to earnings ratio than are shares traded in the public market place.
The interest-deductibility feature would appear to be designed at least in part to place Canadian companies on a more equal footing with American and other foreign firms in the matter of acquisitions. The complaint has often been heard that an American company bidding
for a Canadian property can pay more because it can deduct interest against American tax while the Canadian competitor could not do likewise.
The provision would correct that imbalance. But the Canadian newspaper market is for all practical purposes closed to the American investor. In this one field, the provision provides a remedy for a problem of foreign competition that did not exist in the first place.
On the other side of the equation, of course, is the proposal to institute a capital gains tax at marginal rates of income taxation. Will it slow or otherwise inhibit sales of various properties, including newspapers? Certainly, at the rates of taxation proposed, a potent new consideration would enter any decision to sell. But it is possible that given the dwindling number of properties available for purchase, combined with the profitability of the major potential purchasers, a capital gains tax might simply force up sales prices to accommodate part of the new tax ingredient. Also, even with a capital gains tax, a substantial profit is still a substantial profit, and the person seeking to make a profit is not likely to be deterred by the recollection that before 1970 the profit would have been even greater.
DISCUSSION SUMMARY This discussion must of necessity be relatively subjective.
In brief, the central problem of concentration of newspaper ownership is easy to state in terms of its potential danger in respect to the flow of information and ideas and in its mercantile, advertising, connotation. It is a great deal less easy to solve, at least in terms of a market place that is free in any sense of the word. There are three initial points, based on the foregoing sections: 1. If the Combines policy envisioned in the Interim Report had been in effect twenty years ago the patterns of concentration today might be different. But had concentration been effectively halted, other problems of a similarly grave complexion in the newspaper field might well have arisen. 2. Estate and succession duties do not appear to be a pivotal factor in the concentration process, although they do constitute one factor. 3. The use of tax policy as a direct tool to retard concentration might not, in social terms, be either equitable or just.
In the newspaper field today, Canada has four or five large, expanding companies, making substantial profits, and seemingly intent on acquiring the dwindling remainder of independent newspapers.
Yet, these companies are acting within the law. To hamper their growth by curtailing their profits would be to, first, treat them on a basis unequal to other corporations engaged in
lawful business, and second, run the risk of inhibiting the freedom of the press, because it is only with advertising profits that newspapers can provide news and comment.
In most businesses, the natural instinct of the proprietor with money to invest is to continue to do on a larger scale that which he has already done successfully; that which he knows how to do. But individual newspapers are finite, limited in size by the markets they serve. New ones are in most circumstances vastly expensive to start up, and the chances of success on the basis of past experience are extremely low. Simple logic, for this proprietor, suggests the acquisition of additional newspapers - or entry into allied fields for which his experience has at least in part equipped him.
Accordingly, newspaper proprietors have constantly nibbled at the radio and television industries, there to be met by widespread, and understandable, public concern over the implications of multi-media concentration in the same hands.
Therefore, broadcast investments from this source, while substantial in Canada today, have been limited at levels well below that which would have resulted had newspaper owners felt they enjoyed full access to this market place.
Suppose, for sake of argument, that a combination of tax and competition policy were to bar these large companies from further newspaper acquisitions, and from further entry into the broadcast field. This would be considered desirable by many people in the public interest.
But they would still be in business with what they have, and what they have is a demonstrated ability to make substantial profits. These profits would still have to go somewhere. Any reasonable businessman, denied access to ownership of the related· technology which might help his primary business to survive in future, uncertain years, would probably feel bound to diversify; to enter fields not related to the newspaper business but which promised future growth and therefore corporate survival.
This could create another, potentially socially undesirable problem. If a newspaper, or a group of them, is merely part of an overall business package, the temptation to use the newspapers to further, or protect, the interests of the rest of the package must surely arise, and will less surely be fought down. It is in recognition of this danger that a group as large as Southam Press Limited has specifically eschewed participation in fields unrelated to media communications.
Suppose instead of specifically limiting the larger companies, Canada takes steps to preserve the existing independent papers by a variety of means? Theoretical possibilities exist. 1. Community, non-chain control could conceivably be guaranteed by protecting some sort of community co-operative ownership, closely enough held to avoid outside takeover. But it is important to remember that Canadian newspapers are very much community affairs. The logical investors and participants in such community arrangements would be those already in positions of mercantile dominance.

4 Although newspapers customarily pay salaries weekly, every two weeks, or twice monthly and industry salaries are almost always calculated or negotiated on a weekly basis, this paper expresses salaries annually, rounded to the highest dollar. 5 The Parliamentary Press Gallery was not directly included in this paper because a separate survey, including salaries, was conducted by the Committee's research staff. However, the general range of Gallery base pay would appear to be from $8,000 to $13,000 per annum, 'star' columnists excepted.
AMERICAN NEWSPAPER GUILD CONTRACTS During the past twenty years the Guild, which also bargains in many cases for employees in the advertising, circulation, business and other departments of newspapers (mechanical usually excepted) has had a major impact on salaries.
Even today, although the growth of the Guild appears to have levelled off in terms of new contracts and bargaining units, the union scales tend to set the pace elsewhere.
Once signed, copies of Guild contracts fan out across the country for interested perusal by management elsewhere. The degree of interest is often dictated by the geographical proximity of one's newspaper to the union shop.
Thus, a good many non-union employers adjust their basic rates in almost automatic reflex to new Guild contracts, or to the periodic escalations in two and three year contracts. The base rates might be lower, but the proportion is maintained.
The Guild's entrenchment in all three Toronto dailies heightens its bellwether effect because this, the most competitive newspaper market in the country, would almost automatically set the pace for the nation even if the union did not exist. Employment in Toronto is still the goal of countless young newspapermen, rewarded in terms of both professional standing and money. Only direct assignment to the Parliamentary Press Gallery has equal or greater lustre for the aspiring reporter.
Toronto salaries may occasionally be exceeded elsewhere under special circumstances
(particularly at executive levels) but as a general proposition the working newspaperman in Toronto is the highest paid in the country.
It is important to bear in mind that all Guild contracts are expressed in terms of minimums. The individual may strike a better bargain.
The Toronto contracts vary by a few dollars per week in most categories but the differences do not seriously affect the overall economic status of the individual. For purposes of giving expression to this concept the contracts at the Star, Telegram, and Globe and Mail have

been averaged, with the result that as of January 1, 1970, the following categories as seen in Table 142 can be said to receive the following minimum average remuneration:
Table 142. Minimum Annual Wage For Employees, Toronto Guild, 1970
Senior Deskman, Political Writer, Editorial Writer (the highestlevels of Guild Coverage) . $11,433 per annum Columnists $10,757 Deskmen, 5 years experience $10,157 Reporters, 5 years experience $ 9,620 Reporter, 1st year $ 6,100
These are, if the phrase can be endured, the maximum minimums payable in Canada. When one recalls that all other base newspaper scales flow downward from this representative level, the economic status of the Canadian journalist as defined by negotiations between his representatives and his employers becomes more clear.
Other Guild contracts are lower. Some samples are given in Table 143 (in Vancouver and Victoria both papers are covered and are averaged).
Table 143: Minimum Annual Wage for Selected Guild Members Outside Toronto 1969-1970
Vancouver Victoria New Ottawa (Province- (Times. Westminster (Citizen) Sun) Colonist) (Columbian) Senior Deskman, Writer (highest level) $10,140 $11,175 $9,016 $9,360 Columnists 9,620 n.a. n.a . 9,100 Deskmen 9,360 10,907 8,736 8,320 Reporters . 8,996 10,907 8,680 8,320 Reporter 1st Year 5,668 6,424 4,487 4,888
Ottawa and New Westminster based on rates payable in early 1970; Vancouver to be effective in November, 1970; Victoria, November, 1969. At the time of writing, a new contract

had been tentatively settled in Victoria that provided increases in the area of $30 per week for senior reporters and deskmen.
The Guild also holds contracts in Oshawa (Times) and Brantford (Expositor). In each of the senior categories remuneration is $2,000 or more per year less than above. In the Reporter, first year category, the difference is about $700.
The Guild also has contracts with the non-newspaper McMurray Publishing Company and with editorial employees of Baton Broadcasting Limited, CFTO-TV.
Until 1968 the Guild had a contract in force with the Peterborough Examiner. During that year an unsuccessful strike terminated the relationship. At that time the top classification, editorial writer, was making $7,280; senior reporters and deskmen between $5,720 and $5,830.
These are, if the phrase can be endured, the maximum minimums payable in Canada. When one recalls that all other base newspaper scales flow downward from this representative level, the economic status of the Canadian journalist as defined by negotiations between his representatives and his employers becomes more clear.
Other Guild contracts are lower. Some samples are given in Table 143 (in Vancouver and Victoria both papers are covered and are averaged).
NON-GUILD NEWSPAPERS
As a general proposition the overall influence of Guild rates, while real, is tempered by regional considerations, except for the few papers directly competitive with Guild papers (e.g., the Hamilton Spectator and the Ottawa Journal are known to match closely Toronto Guild and Ottawa Citizen Guild base rates respectively).
On the Prairies Edmonton Calgary, Regina and Winnipeg, although there are fluctuations among them, by and large set the base Prairie rate.
It is reliably estimated to be, on average, 10% lower than the prevailing Vancouver Guild rates.
These newspapers, in turn, recruit staff and help set the rates for all the smaller dailies in Manitoba, Saskatchewan, Alberta and, to a considerable extent, interior British Columbia.
These rates in the various categories can vary between 10 and 20 percent below the Prairie "big city" average.
In Ontario the base rates work down from the Toronto plateau in ratio to newspaper circulation. Very small dailies might be as much as 40 percent below the higher categories, 25 percent below in the lower categories.
In Quebec Montreal sets the pace with the French-language press on a rough par with Toronto Guild level. From there the same downward variation appears to be operative throughout the province - 40 percent to 25 percent.
Insofar as Quebec is concerned the English language Montreal press constitutes a finite minority factor. Up until recent months the Star would have been estimated at approximately 5 percent below Toronto Guild rates; the Gazette as much as 10 percent in some areas. Recent editorial changes within the Star may have contributed to closing that gap. In the Maritimes the major cities are estimated at 25 percent below Toronto Guild, with the newspapers in smaller cities running 10 to 30 percent below the major cities in the higher categories.
The foregoing makes possible the general statement that in Canada the great majority of working newspapermen and women earn from their direct employers less than $9,000 per annum.
Another major general factor influences these rates of pay, in addition to the Guild and regional considerations. This is the negotiated salary progress of the internal mechanical unions.
It is estimated that on papers from 5,000 to 50,000 circulation editorial employees tend to earn less than mechanical union employees; from 50,000 to 150,000 an unacknowledged rough parity tends to exist, with the editorial employee sometimes following the mechanical employee by about a year in annual increments; past 150,000 the relationship tends to reverse, although not in great degree. This is a rough rule of thumb only and there are exceptions.
Another influence may be starting to come into force - that of salaries for comparable work in the broadcast industry. While remuneration for newsmen in local, regional, radio and television stations would not appear to differ significantly from newspapers in the same locale (individual "star" newscasters excepted), the unionized newsroom employees of network television, public and private, are now tending to earn as much as $1,000 or $2,000 per annum more than counter parts in newspapers. This may have an effect on Toronto Guild levels, which in turn would radiate throughout the country.
A final influence, difficult to quantify, but believed to exist in relation to the larger regional newspapers, is that of the Canadian Press. No detailed inquiries were made in relation to this agency in the knowledge that an additional, separate study was being conducted of its operations.
However, it is understood in the industry that CP staffers in centres other than Toronto, Ottawa and Vancouver tend to be more highly paid than the resident locals - a situation which leads to comparisons, and presumably, some local pressure.

ADDITIONAL INCOME
It is stressed again that all the foregoing salary levels are, in the case of Guilds,
minimums, and in the case of everyone exclusive of outside earnings. The fact is that a significant proportion of Canadian newspapermen augment their incomes in large or small degree. The source can be either inside the newspaper or, perhaps more frequently, outside.
INSIDE ADDITIONAL REMUNERATION On Guild newspapers the minimums are just that. The individual can negotiate his own terms at a higher level, although it is difficult to estimate how many succeed in this. It is reasonable to suppose, for instance, that columnists with large followings succeed in making more lucrative arrangements in a competitive market such as Toronto. The same would apply in that market to reporters and deskmen' of acknowledged professional standing.
By the same token, however, this bargaining factor tends to be greatly diminished outside Toronto. Relatively speaking, there appears to be much less movement of personnel between papers in Ottawa, Vancouver, Winnipeg, Victoria and Montreal. Only when one paper is indisputably dominant and the other traditionally marginal, e.g., Calgary Herald and Calgary Albertan respectively, is there a predictably steady flow, and that is in large part (although not entirely) one-way.
Even in the Toronto situation there is some evidence to suggest that trade gossip tends to magnify the number of persons receiving salaries in excess of Guild minimums.
However, the Guild does provide another potent income factor - that of paid overtime at rates varying between time and a half and double time depending on time of work and contract provision.
This is known to be a substantial factor in the income of many Guild newspapermen, particularly in the case of reporters whose work often does not or cannot fall into a seven-hour or eight-hour time span and which is not always of an easily shared nature.
It is also fairly common for reporters or deskmen assigned to one primary function to possess skills, such as theatre or music reviewing, or specialized columns of one sort or another, which are performed for the newspaper on off hours on a fee basis.
Very occasionally, perquisites of office can affect the standard of living of a working newspaperman. These can include full time use of a company car, or a mileage allowance for a personal car large enough to remove this form of transportation from the family budget. In a very few cases, on certain types of assignments, (Parliamentary Press Gallery, provincial legislative press galleries, sports), travel allowances, and expense accounts may be sufficiently generous to have a bearing on net personal income.
Some newspapers permit selected employees to "turn out" advertising supplements of the type which surround advertising with so-called "editorial" matter (gardening, travel pages) on a fee for column basis, the work often consisting of processing press release material derived from the advertiser.
Finally, a small number of papers include home produced "magazines" or supplements, the material for which is largely staff produced, but on a separate fee basis.
This section cannot hope to touch all internal sources (for instance, book and record review editors have been known to turn tidy profits on the wares presented to them free by the issuing companies) but most principal sources of direct cash are included. (For others see Paternalism, below).
OUTSIDE ADDITIONAL REMUNERATION
This falls into two broad categories: 1 Radio and television broadcasting. While the influence of newspapermen on national network news and public affairs appears to be stabilizing and even declining (and thereby affecting the incomes of the people involved, largely members of the Parliamentary Press Gallery) a considerable number can still be heard and seen. It is possible for a newspaper correspondent of stature in Ottawa to augment his income in this manner by several thousand dollars a year.
At the same time there are signs that regional and local use of resident newspapermen on television and radio is actually increasing as newspaper publishers gradually discard a previous marked antipathy to their people associating with a "competing" medium. While the rates of pay are not comparable to network broadcasting it is possible to augment one's income by $100 to $150 a month in this manner without undue strain. 2 Writing for other publications etc. This activity is of great significance to people on the larger regional newspapers. Upwards of 200 Canadian periodicals of one sort or another are estimated to buy material from non-staff freelancers or stringers. Many of these revolve around a core staff in Toronto or Montreal and depend for much of their editorial matter upon moonlighting newspapermen across the country.
The rates are not high individually, but the work is not usually difficult or time consuming for a competent newspaperman who can, with a small string of trade magazines to his name, add $100 to $200 a month to his income fairly easily.
The Toronto newspapers also maintain stringers in various regional centres, and such groups as the Southam newspapers exchange articles written by staffers on a fee basis.
In larger cities one, and sometimes two or three newspapermen can make considerable sums of money working for Time Magazine. This work is more strenuous but is also more lucrative.

(By way of personal illustration this researcher was able to count on $3,600 annual
income above his base salary in Calgary nearly ten years ago - from Time Magazine and the Globe and Mail only.)
Also, there are numerous local projects with which the newspaperman can busy himself - such as producing newsletters and annual yearbooks for organizations, writing advertising copy for advertisers in his own newspaper (this last is often rewarded in kind, not cash) or turning his hand to radio continuity.
The practice of writing speeches for politicians and others is declining but not yet dead.
Sportswriters are often asked to contribute articles to programs, at a fee, for professional sports. Those less senior, doomed to coverage of intermediate and junior sports, sometimes act as time keepers or perform other official functions for a fee, on the theory that they have to be there anyway.
Political writers receive a variety of state emolument ranging from use of subsidized Parliamentary facilities in Ottawa, to the outright payment of $100 granted per session by the Saskatchewan legislature to its attendant reporters, to the Ontario system of permitting reporters to act as secretaries to committees at a fee.
Many newspapers have arrangements whereby photographers share the proceeds of the sale of reprints of pictures used in the paper.
Editorial cartoonists are often bombarded with requests for extra work at a fee. Taken together, these two diverse categories constitute a large but incalculable pool of
extra income for the newspaperman.
PATERNALISM It should be noted that the concept of employer as protector is by no means dead in Canadian journalism, including group and chain proprietors and even some newspapers which negotiate with Guilds.
Stories of Christmas Eve firings and the jocular savageries of The Front Page notwithstanding, Canadian reality abounds with cases wherein the physically ill, alcoholics, persons in deep personal, emotional or financial difficulty, the elderly or partially disabled, have been maintained by their newspaper employers far beyond any requirement of law or any moral standard applicable to industry in general.
Apart from this aspect, which is difficult to quantify but which is more widespread than is commonly supposed, some newspapers strive on a calculated basis to retain a nucleus of key non-management personnel.

Thus, longterm reporters might be found to have low-interest loans from their employers for the purpose of house-buying or various perquisites such as club memberships which are denied the rank-and-file.
Other people's money can sometimes be employed to this end with good effect. The entire travel industry, and a considerable sprinkling of foreign governments, regularly ask editors of papers of medium-size and larger to despatch personnel on expense-paid trips to all manner of interesting places.
Distributed judiciously among the staff these trips can make for excellent employee-employer relations on one hand - and confer upon the individual a substantial benefit on the other. He makes trips to places he could never afford on his basic salary.
Most newspapermen appear to actively enjoy travel, and the amount of travelling one does is still a barometer of one's success in the field.
Most newspapers of any size pay for a good many "out of town assignments" on their own, of course. These, too, are much prized by staff. People earning $7,000 to $10,000 a year are permitted to live for a few days on a scale usually enjoyed only by affluent businessmen or wealthy private citizens.
EXECITIVE OR MANAGEMENT STATUS A substantial number of non-union papers extend the umbrella of this status farther down the ladder than might be the case in many industries, to the assistant city editor level and even below.
Some papers make a very conscious differentiation between management and staff, according the former generous expense accounts, and other perquisites, which are denied the general run of staff.
CONCLUSION It has been demonstrated that the newspaperman is not highly paid in basic terms, but he does have access to additional income by virtue of being a newspaperman, and he does have frequent opportunities to live briefly on a scale enjoyed only by a minority of Canadians. However, it is still a business with a heavy turnover of personnel. The linkage of salaries to circulation size is superficially supported by logic and economics, but it denies the fact that a properly written story, or a properly edited story, demands similar competence whether the readership is 25,000 or 225,000. The effect of this imbalance is to keep newspapermen on the move to ever bigger papers if they wish to secure bigger salaries. Yet the turnover is large on bigger papers, too. Reporters have a discernible tendency to desert the business when they approach forty. There is a high rate of turnover among the university graduates who have entered newspapers in increasing number dUring recent years. It is impossible to measure the effect of salary levels on these personal decisions, but it is true to state that editorial departments in Canada, by and large, lack the stability that accrues to most other organizations.
One final point, not immediately germane to this paper but mentioned as a matter of interest - discrimination against women in both financial and job-opportunity terms appears to be a marked feature of newspaper editorial departments.
Chapter 3:
TECHNOLOGYAND RESEARCH
BROADCASTING
Few industries are undergoing such rapid technological innovation as the television and radio broadcast industry. To quote one industry spokesman: "Things are moving so fast the equipment you order today will be obsolete by the time it's installed." As might be expected in such an environment, research and development is vital to manufacturers of broadcast equipment and there is no shortage of funds allocated for the purpose. The broadcast field seems to have adapted extremely well to this technology. The competitive nature of the broadcast business is probably the largest single influence underlying the industry's willingness to embrace and adjust to new technology. As a relatively new and essentially innovative field, broadcasting has not been hampered by long-held traditions and practices, and the technological orientation of broadcast employees has encouraged adoption of new techniques and equipment. Much of the equipment used in broadcasting has a relatively short usable life, which has also aided the process of technological change.
Technological research is mostly confined to manufacturers and is largely aimed at gaining a competitive sales advantage. As a result, manufacturers are extremely conscious of the need to determine where technical deficiencies lie, and thus, potential for equipment sales. From the user's standpoint this has provided an extremely wide choice of equipment and an ability to match operating requirements with equipment specifically designed for his purposes.
Larger stations have engineering staff to assist management in evaluating and selecting new equipment. Smaller operations are also well-served through technical advice from the Canadian Association of Broadcasters, professional consultants, and through informal exchanges with non-competing stations.
Relatively little technological research in this field is initiated in Canada. Much of the manufacture of broadcast equipment in this country is based on American-parent-company research or is produced under licence. C.A.B. sponsors no ongoing research programs and sees no real need for such activities in light of the massive investment in research by American and other interests, most of which is applicable to Canadian conditions. The CBC development department undertakes original research into technology required to meet unique Canadian conditions, particularly with respect to providing broadcast service to thinly populated areas. Two notable results of this research are the non-connected television package - a videotape-fed remote station that can be operated by relatively unskilled hands - and the low-power repeater
transmitter used to bring radio service to remote communities. Because of the extremely high cost and low financial return of such facilities, private broadcasters have displayed no interest in developing northern service.
Two other research-oriented bodies operate at the industry level, the Canadian Telecasting Practices Committee, and the broadcast industry Technical Advisory Committee. The former is largely interested in establishing broadcast industry technical standards; it is, for example, working with color mm manufacturers to arrive at specifications for color mm intended for television use. The T.A.C. represents the CBC, private interests, and consultants and has as its primary aim the determination of ways to make broader use of the broadcast spectrum. One T.A.C. project involved research into the use of adjacent television channels in the same community. The project was abandoned when no private sponsors could be found to carry the cost of practical tests, estimated at $250,000. Preliminary research in this case was financed by a private station.
AUDIENCE RESEARCH One area where research funds are amply available is audience research. Large sums are expended each year to find out what Canadians are watching and listening to by such organizations as the Bureau of Broadcast Measurement, Neilsen Ratings, the CBC Research Department, trade associations, and ad hoc audience studies sponsored by advertising agencies and individual stations.
Quantitative measurement of broadcast audiences has thus been well-served, but Canadian research into the qualitative aspect of programming has been minimal. It appears that very little money is being spent to determine why Canadians tune in to a particular program or to study the sociological implications of programme content.
The situation in the United States is sharply different. Most major American universities have ongoing research programs, many financed by grants from the national networks.
Studies of this nature have had a significant effect on program content, particularly in the recent move to de-emphasize violence on television. The lead in the United States was taken by academics who initiated original research on an unsponsored basis. The networks subsequently saw the value of this work and in addition to providing funds for further research, applied many of the findings to their programming. The greater emphasis on news and information programming is attributed in part to a wider appreciation of television's potential as revealed by sociological and communications research.
According to John E. Twomey, director of communications at Ryerson Poly technical Institute in Toronto and a former CBC staff member, Canadian academicians have not displayed a similar interest in communications research and few universities have adequate facilities for such studies. He points out, however, that Canadian broadcasters do not seem to have made any strenuous effort to encourage the academic community to undertake research in the field. No formal system of research grants is maintained by either private or public broadcasting interests on an individual or a collective basis.

A spokesman for C.A.B. commented that the association co-operates, whenever it is approached, in studies of Canadian broadcasting but that most enquiries come from American sources. Both Mr. Twomey and the C.A.B. spokesman indicated that the last few years have produced signs that the academic community is becoming more aware of the research potential in communications.
The relatively small number of research papers available and the absence of any industry sponsored activities would suggest that both industry and the academic community have been less than aggressive in their approach to the question of program content and its sociological implications.
Canadian Radio - Television Commission Chairman Pierre Juneau was quoted recently as saying that C.R.T.C. will be developing program policies during the present year. The commission has authority to conduct research under the Broadcasting Act of 1968, which directs C.R.T.C. to "undertake, sponsor, promote or assist in research relating to any aspect of broadcasting." In the absence of qualitative research into the social and cultural effects of program content originating from academic or broadcast industry sources, C.R.T.C. may in future play an enlarged role in this important area.
THE NEWSPAPER INDUSTRY Lord Thomson of Fleet had this to say about newspaper industry attitudes toward technological change:
The newspaper industry has been remarkable in the past for its lack of any radical technological innovations over a long period. Much of this has been due to the cautious attitude of management, with its vast investments in heavy, conventional equipment, backed by the conservatism of the trade unions which have been suspicious of the effects of new methods on security of employment. 1
A contributing factor to the pervasiveness of these attitudes through the industry has been the limited competition between newspapers serving individual markets. This essentially non-competitive environment has not produced the needed incentive for ongoing development programs of the type seen in many other industries. Several publishers in reply to our questionnaire commented that their competitive position has not forced them to seek faster and cheaper ways of production. The publisher of a leading daily in Ontario noted that lack of competition among newspapers in most major markets has helped to impede technological improvement in the industry.
While there have been few compelling pressures from within the industry for innovation over the years, recent developments outside the industry - such as television, rising wages, and the conglomerate corporation - have produced the necessary stimuli for technological change. As a result, the last fifteen years and less have seen significant changes in newspaper technology and a discernible shift in management approach.

Put another way: the Canadian newspaper - at least in its non-editorial functions - seems firmly set on the road to becoming more identifiable as a modern business, motivated by the same considerations of corporate growth and profitability as other business organizations. One result has been a continuing rationalization of the industry into larger and more viable corporate units, recruitment of professional business managers, and a seeming willingness to embrace new technology and new business techniques.
It is difficult to determine cause and effect. For example, did the emergence of groups owned by individuals and organizations not previously associated with newspapers provide the catalyst for proprietors to become acquisition minded, or were outside interests attracted to the opportunities revealed by the formation of larger units within the industry? Similar questions can be asked about other developments in the industry. Is the increasing use of professional business managers an underlying reason for the greater emphasis on technological innovation in newspaper operations and administration, or are they being recruited because of the growing complexity of the business? To what extent are decisions to modernize plant and equipment influenced by the availability of new and more efficient machinery, by the need to replace present equipment at the end of its usable life, or by the need to automate because of rising labour costs?
These and other questions bear importantly on the direction future development will take.
At present, the main thrust would seem to be aimed at upgrading the technological and administrative efficiency of the industry - and thus its ability to cope with prevailing social and economic forces. There seems little doubt that the industry is undergoing a period of intense self-examination so far as its operations are concerned, which will undoubtedly have implications for further technological change over the short-term.
Rising costs are frequently cited as one of the major problems faced by publishers and industry attention is clearly focussed on finding solutions. Frank G. Swanson, publisher of the Calgary Herald had this to say on the subject:
There seems no doubt that the over-riding problem that will face the Canadian newspaper industry and individual newspapers in the months and years ahead is in doing something to overtake the fantastic cost spiral which has beset all of us. Labour charges, material costs and the cost of just about everything that go into the production of a daily newspaper have risen or will be rising sharply. The answer, apart from making every possible economy, lies in the direction of raising further revenues?
John Bassett, publisher of the Toronto Telegram, echoed these sentiments, but added
another dimension to the introduction of technological change: "The problem of rising labour costs can be met through reasonable negotiations with unions which will provide publishers with the right to avail themselves of new processes while protecting existing jobs." 3
Union resistance was cited by most publishers approached as the greatest impediment to technological change in the industry. The strongest statements concerning union reluctance to go along with a greater degree of automation came from Ontario and British Columbia, but whether
this indicates a higher rate of technological innovation in those areas or a lower content of unionized labour elsewhere is not known.
Craft trades attitude to automated operations is a predictable one. Unlike their counterparts in other industries, tradesmen in the printing and allied newspaper trades have skills which are for the most part non-transferable. When the requirement for their particular skill in the newspaper industry ceases to exist, therefore, their status and job security are threatened. Consequently, technological change thus far has been regarded with deep suspicion and often, hostility on the part of unionized crafts. The result has been what publishers term "restrictive" union practices built into labour agreements providing for duplicate staffing of jobs replaced by automation, high journeyman wage rates for comparatively simple jobs on new processes and in some cases, refusal by unions to go along with planned technological change. A complicating factor has been the number of craft guilds representing employees in a particular organization. Problems of union jurisdiction frequently arise when jobs are reorganized because of new technology.
The major technological changes affecting craft trades have been made by the large newspapers. Data elsewhere in this report would suggest that neither corporate nor union interests have been unduly harmed in the process.
The problem takes on a somewhat different dimension when applied to smaller newspapers, however. For some, the decision to automate may be the only route to financial survival or to continued independent operation. Union resistance to such change could endanger the operation. By the same token, while craft tradesmen see their job security threatened, they may find themselves in an inferior bargaining position to their counterparts on the large newspapers.
It is worth noting that while some organizations - notably the large metropolitan dailies - have faced hard bargaining with unions when introducing certain new equipment, the craft trades generally have taken a realistic approach in their demands on smaller and economically less viable operations. As a result, a number of changes have been accepted in some newspapers without the same concessions demanded elsewhere. Whether this is union policy or is at the discretion of individual locals has not been determined.
Introduction of new technology is an expensive proposition requiring heavy capital investment. While all publishers point to the high cost of new and improved equipment as an impediment to plant modernization, for many Canadian newspapers it is a financial impossibility. The following comment summarizes the position many newspapers find themselves in:
It should be recognized that many new developments in the industry are as yet beyond the reach of newspapers of the limited resources of the smaller· city newspaper. Such developments as photocomposition and the use of sophisticated computers should be reported on by larger city newspapers which already are using them. Much of this equipment is still beyond our reach.

Another publisher stated his position more bluntly:
At 54 years of age, you are loth to make a capital expenditure of $200,000 or more (compared with the present estimated worth of the business of $300,000) even if the required capital could be raised in the current tight money period.
This publisher saw selling to a younger man or to a group as the only hope of introducing
new technology into his operations. But even with the financial resources of a group to draw from, the problem still remains for many, as the following comment from the publisher of a western daily partly owned by a national group indicates:
There is one major impediment in the way of technological advancement: the extremely heavy capital costs of traditional printing equipment. A newspaper of this size requires seven or eight linotype machines worth approximately $30,000 each; and a 24-page press with a replacement value of close to a quarter of a million dollars. The weight and size of this equipment is such that even when replacement occurs, it usually is necessary to house them in specially constructed plant additions which, of course, increase still further the capital cost outlay. To make a full recovery of capital, presses are operated over scores of years and this length of time mitigates against easy acceptance of new techniques when they are developed.
While the financial considerations pose a formidable barrier to technological change,
there are indications this may not be the only factor influencing the rate of plant modernization. Newspapers of all sizes referred to such sophisticated equipment as computer typesetting when asked about significant developments in the industry, but generally with the rider that these were feasible for the large dailies. Very few mentioned technological advances they considered applicable to their own scale of operations, suggesting either there have been no developments of significance to the smaller plant, or that dissemination of information in this area is inadequate. In light of the strides made in the development of small, relatively inexpensive computer type-setters, photo composition, offset printing, computer time-sharing for administrative functions - all with significance to the smaller enterprise - the latter would seem to be the case.
A number of publishers referred to the lack of research in Canada on matters related to newspaper technology; others commented that too little money is available for research purposes. Both views would seem to be substantiated, but it is debatable whether the deficiency of research or research funds has been particularly detrimental to the industry.
In view of the limited market and the wide range of equipment needs of the different-sized newspaper operations, Canada has been unable to develop a printing equipment industry that could compete with manufacturers in the United States, France, Germany, and the United Kingdom - the principal suppliers of machinery to the newspaper industry. The international market is extremely competitive and manufacturers have turned increasingly to research and technological innovation to build product acceptance. Canadian users have benefited from research on a scale that would not have been possible on a national basis, with the added advantage of being able to draw on the experience of users around the world.
The American Daily Newspaper Association maintains an extensive research centre to conduct original research and testing of new technology. Many Canadian daily newspapers are members of the association and thus have access to information from the centre. The Canadian Daily Newspaper Publishers Association also maintains a continuing liaison with the centre through its research committee and has a full-time research director on staff. Some original research work is done in Canada under the auspices of the C.D.N.P.A. and cooperating newspapers, particularly in the fields of graphic arts and inks. Individual engraving and allied companies conduct limited research programs, mostly oriented to product improvement rather than original research.
From the foregoing, it would seem that technological improvement has not been hindered by the relative lack of research in Canada. Indeed, it could be argued that Canadian newspapers have been very fortunate in having access to the benefits of technological research without carrying the full burden of its financial costs.
The dissemination of technological information within the industry, however, is at best uneven and informally organized. Manufacturers' representatives appear to be the chief source of information on new products and processes - a source that may not provide wholly objective comparisons of performance and other data.
Other sources of technological information are trade journals and periodic bulletins issued by the C.D.N.P.A. The Canadian Weekly Newspapers Association has no system for providing technical information for its members.
In the case of the large daily newspapers, this situation poses no major problems. Most have specialist technical staffs capable of analyzing and evaluating the potential application of new technology. Even here, however, there are indications that co-operative sharing of technical information is not widely practised. Offset printing, for example, is regarded by many publishers as a major and significant development for daily newspapers. Many others question the economics of offset, while still others maintain that letterpress is a superior process. No organized industry activity is evident to collect and evaluate operating experience of companies using offset equipment.
The seemingly low priority assigned to the dissemination of technical information may indicate lack of recognition by the industry of the potential self-interest value of such activities. In other areas, notably measurement of the effectiveness of newspaper advertising, the industry has been in the forefront in initiating research and has pioneered new research concepts in audience evaluation. In what is believed to be the first undertaking of its kind anywhere, in 1967 C.D.N.P.A. introduced a continuing research program aimed at measuring the cumulative effect of newspaper editorial and advertising content on a community. Studies have been conducted in centres in Ontario, Quebec, and Manitoba. Certain elements of study findings are confidential to individual newspapers but most of the information collected is made available through C.D.N.P.A. for use by the industry as a whole.

One publisher had this comment:
More rapid advances in new equipment and techniques might have been accomplished if top management had had a broader understanding of how new technology could be utilized. The chief impediment to the future of the newspaper industry will be a reluctance to accept the necessity within the trade itself.
To what extent a freer flow of technical information within the industry would aid
management in decisions related to technological change cannot be determined. But it would undoubtedly be beneficial to the smaller components of the daily and weekly newspaper industry.
The weekly segment of the newspaper industry is at present the poorest served by information of this type, yet the benefits to be gained from a wider use of new technology or new methods of production might well have greater significance in their overall economic position. Co-operative use of printing and computer facilities by independent weeklies within a geographic region, for example, could permit proprietors to employ technology now outside their financial reach.
Chapter 4:
POSTAL RATES AND THE POST OFFICE
POST OFFICE FINANCIAL SITUATION When the Honourable Eric Kierans took office in 1968 as postmaster-general, he noted that the single largest contributing factor to the deficit of the Post Office was second-class mail. About half as large a deficit was incurred through each of first and third-class mail.
The postmaster-general is permitted to adjust third- and fourth-class rates without parliamentary approval. However, first and second class rate changes require Parliament's assent. Hence, Mr. Kierans reviewed the old Post Office Act establishing rates and introduced Bill C-116. According to a notice to publishers from the deputy postmaster-general on November 27,1968, Bill C-116 aimed:
"to take a long step towards assuring that second class mail pay its fair share of postal costs by substantially increasing the relevant postage rates"
and
"to modify and clarify the terms and conditions under which the statutory second class rates apply and thereby establish a more logical basis for determining the entitlement to second class privileges."
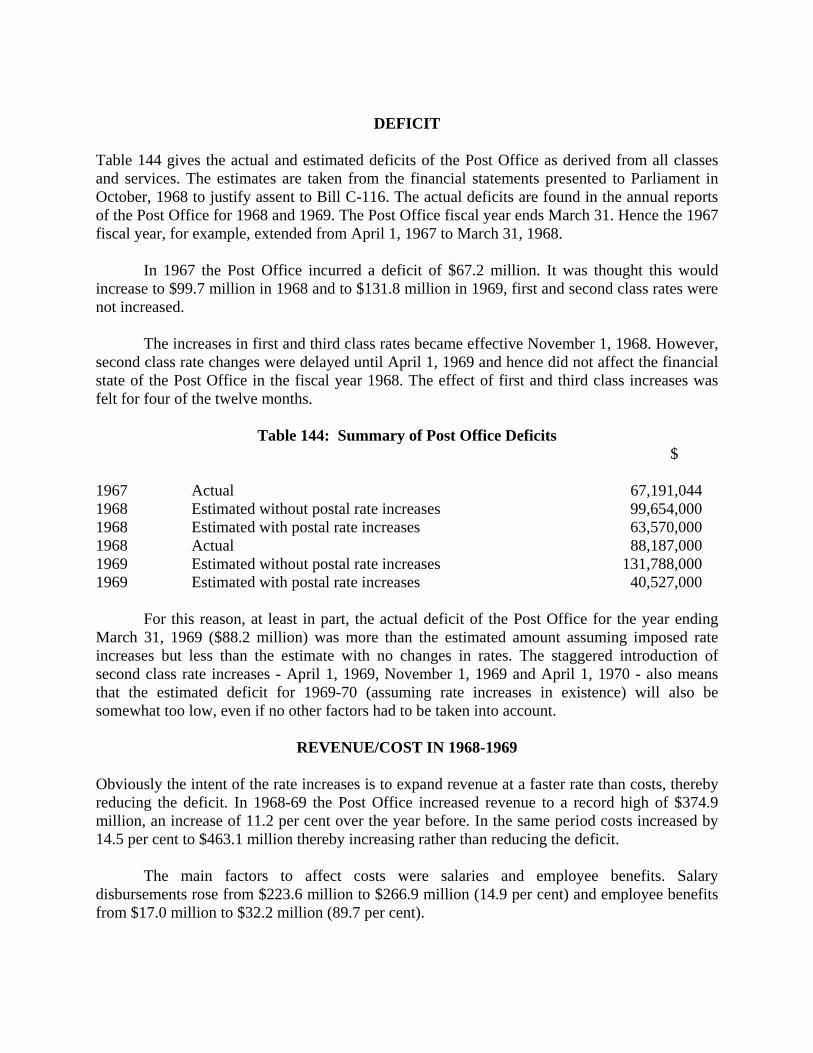
DEFICIT
Table 144 gives the actual and estimated deficits of the Post Office as derived from all classes and services. The estimates are taken from the financial statements presented to Parliament in October, 1968 to justify assent to Bill C-116. The actual deficits are found in the annual reports of the Post Office for 1968 and 1969. The Post Office fiscal year ends March 31. Hence the 1967 fiscal year, for example, extended from April 1, 1967 to March 31, 1968.
In 1967 the Post Office incurred a deficit of $67.2 million. It was thought this would increase to $99.7 million in 1968 and to $131.8 million in 1969, first and second class rates were not increased.
The increases in first and third class rates became effective November 1, 1968. However, second class rate changes were delayed until April 1, 1969 and hence did not affect the financial state of the Post Office in the fiscal year 1968. The effect of first and third class increases was felt for four of the twelve months.
Table 144: Summary of Post Office Deficits $ 1967 Actual 67,191,044 1968 Estimated without postal rate increases 99,654,000 1968 Estimated with postal rate increases 63,570,000 1968 Actual 88,187,000 1969 Estimated without postal rate increases 131,788,000 1969 Estimated with postal rate increases 40,527,000
For this reason, at least in part, the actual deficit of the Post Office for the year ending March 31, 1969 ($88.2 million) was more than the estimated amount assuming imposed rate increases but less than the estimate with no changes in rates. The staggered introduction of second class rate increases - April 1, 1969, November 1, 1969 and April 1, 1970 - also means that the estimated deficit for 1969-70 (assuming rate increases in existence) will also be somewhat too low, even if no other factors had to be taken into account.
REVENUE/COST IN 1968-1969 Obviously the intent of the rate increases is to expand revenue at a faster rate than costs, thereby reducing the deficit. In 1968-69 the Post Office increased revenue to a record high of $374.9 million, an increase of 11.2 per cent over the year before. In the same period costs increased by 14.5 per cent to $463.1 million thereby increasing rather than reducing the deficit.
The main factors to affect costs were salaries and employee benefits. Salary disbursements rose from $223.6 million to $266.9 million (14.9 per cent) and employee benefits from $17.0 million to $32.2 million (89.7 per cent).
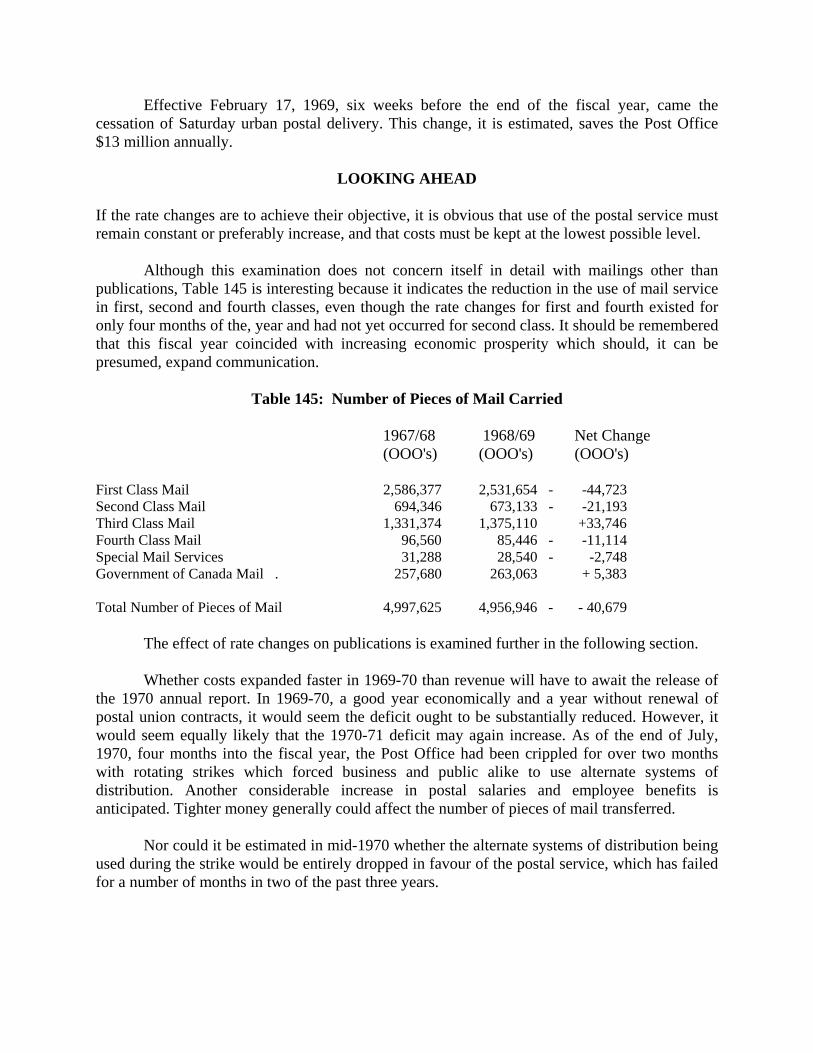
Effective February 17, 1969, six weeks before the end of the fiscal year, came the cessation of Saturday urban postal delivery. This change, it is estimated, saves the Post Office $13 million annually.
LOOKING AHEAD
If the rate changes are to achieve their objective, it is obvious that use of the postal service must remain constant or preferably increase, and that costs must be kept at the lowest possible level.
Although this examination does not concern itself in detail with mailings other than publications, Table 145 is interesting because it indicates the reduction in the use of mail service in first, second and fourth classes, even though the rate changes for first and fourth existed for only four months of the, year and had not yet occurred for second class. It should be remembered that this fiscal year coincided with increasing economic prosperity which should, it can be presumed, expand communication.
Table 145: Number of Pieces of Mail Carried 1967/68 1968/69 Net Change (OOO's) (OOO's) (OOO's) First Class Mail 2,586,377 2,531,654 - -44,723 Second Class Mail 694,346 673,133 - -21,193 Third Class Mail 1,331,374 1,375,110 +33,746 Fourth Class Mail 96,560 85,446 - -11,114 Special Mail Services 31,288 28,540 - -2,748 Government of Canada Mail . 257,680 263,063 + 5,383 Total Number of Pieces of Mail 4,997,625 4,956,946 - - 40,679
The effect of rate changes on publications is examined further in the following section.
Whether costs expanded faster in 1969-70 than revenue will have to await the release of the 1970 annual report. In 1969-70, a good year economically and a year without renewal of postal union contracts, it would seem the deficit ought to be substantially reduced. However, it would seem equally likely that the 1970-71 deficit may again increase. As of the end of July, 1970, four months into the fiscal year, the Post Office had been crippled for over two months with rotating strikes which forced business and public alike to use alternate systems of distribution. Another considerable increase in postal salaries and employee benefits is anticipated. Tighter money generally could affect the number of pieces of mail transferred.
Nor could it be estimated in mid-1970 whether the alternate systems of distribution being used during the strike would be entirely dropped in favour of the postal service, which has failed for a number of months in two of the past three years.

EFFECT OF BILL C-116 ON PUBLICATIONS
Almost without exception, publishers of all types of printed matter testifying before or submitting briefs to the Special Senate Committee on Mass Media were critical of the Post Office. If daily newspaper publishers have been less vehement in their criticism, it is because they rely on the Post Office less as a means of distribution. However, some of the complaints came from those dailies with exceptionally high proportions of mail circulation as will be illustrated later.
QUALIFICATIONS AND RATES Before the assent to Bill C-116 almost every commercial and non-commercial publication qualified for second class rates. Following it, publications found themselves reclassified to higher and different rate structures within second class or shifted to third class with even higher rates. Bill C-1l6 excluded from second-class statutory privileges unpaid-circulation publications, periodicals published by associations, unions, co-operatives or local church congregations, and house organs. addition, semi-weeklies were reclassified as dailies at the highest of the second class: statutory rates. Table 146 summarizes the rates applying to different types of publications pri to and after the changes. Only the final of three rate increases is shown.

Table 146: Postal Rates Before and After Bill C-166
Categories of Publications Previous Rates Revised Rates (Max.)
(2nd class statutory unless otherwise stated PAID-CIRCULATION COMMERCIAL Daily Newspapers – Circulation: 10,000 or more
2 ½ cents/lb. Non-adv. 4 cents/lb. Advertising
5 cents/lb. Non-adv. 15 cents/lb. Advertising 2 cents/piece minimum
Less than 10,000 2 ½ cents/lb. Semi-Weeklies Circulation 10,000 or more
3 cents/lb.
Less than 10,000 2 cents/lb. Weekly Publications Newspapers and Magazines Circulation: 50,000 or more 10,000 – 49,999 Less than 10,000
3 cents/lb. 2 ½ cents/lb 1 ½ cents/lb. Plus free Zone privileges
Newspapers: 1 cents/lb. 2 cents/piece minimum plus free zone privileges for those under 10,000 circulation Magazines: 5 cents/lb. 2 cents piece minimum
Monthly Publications General Interest Circulation: 10,000 or more Less than 10,000
1 ¾ cents/lb. 1 ½ cents lb. Plus free zone privileges
5 cents/lb. 2 cents/piece minimum
Special-Interest Publications (agriculture, science, religion)
1 ½ cents/lb.
5 cents lb. 2 cents/piece minimum
Quarterly Publications
2 cents/lb.
5 cents/lb. 2 cents/piece minimum unless a catalogue or directory thereof (4th class with variable rates)
Categories of Publications Previous Rates Revised Rates (Max) (2nd class statutory unless otherwise stated)
UNPAID-CIRCULATION COMMERCIAL Same as above according to frequency and circulation
3 cents first 2 oz. 2 cents each additional oz. Or part thereof (2nd class regulatory)
UNPAID CIRCULATION ASSOCIATION Same as above according to frequency and circulation
5 cents first 2 oz. 3 cents each additional oz. Or part thereof

(3rd class)
It is obvious from this table that circulation size privileges, whether for daily, weekly or monthly publications, have been lost. Hence the increases for smaller publications (which tend to be less profitable) have been relatively more than for larger publications.
Unpaid circulation publications which in July, 1970 paid a rate equivalent to 31 cent per pound (3 cents first 2 ounces and 2 cents each additional ounce or part thereof) are severely taxed in relation to paid circulation publications at Sri per pound, but not as severely as association publications at 47 cents per pound (5 cents first 2 ounces and 3 cents each additional ounce or part thereof).
Previously for a one-piece mailing, the postage was computed at a fraction of the per pound rate. Now there is a 2 cent per piece minimum. It was not uncommon for a weekly to be paying 1/2 cent per piece. These particular weeklies have experienced a 400 per cent increase in postage.
EXAMPLES OF EFFECT OF RATES Daily Newspapers
Because of their need for fast delivery, daily newspapers are seldom distributed by mail. In total less than 10 per cent of their circulation is by mail. The exceptions occur mostly in Quebec where the number of newspapers per capita is less than in most other provinces and where production is concentrated primarily in Montreal and Quebec City. Also relying on mail are the daily papers circulated nationally such as the Globe and Mail Report on Business and the Daily Oil Bulletin.
Table 147 shows the average number of copies distributed by mail for a select number of dailies in 1968 and as estimated for 1971. It lists average weekly circulation for eight dailies and two special cases - the St. John's Evening Telegram weekend edition and Globe and Mail Report on Business.

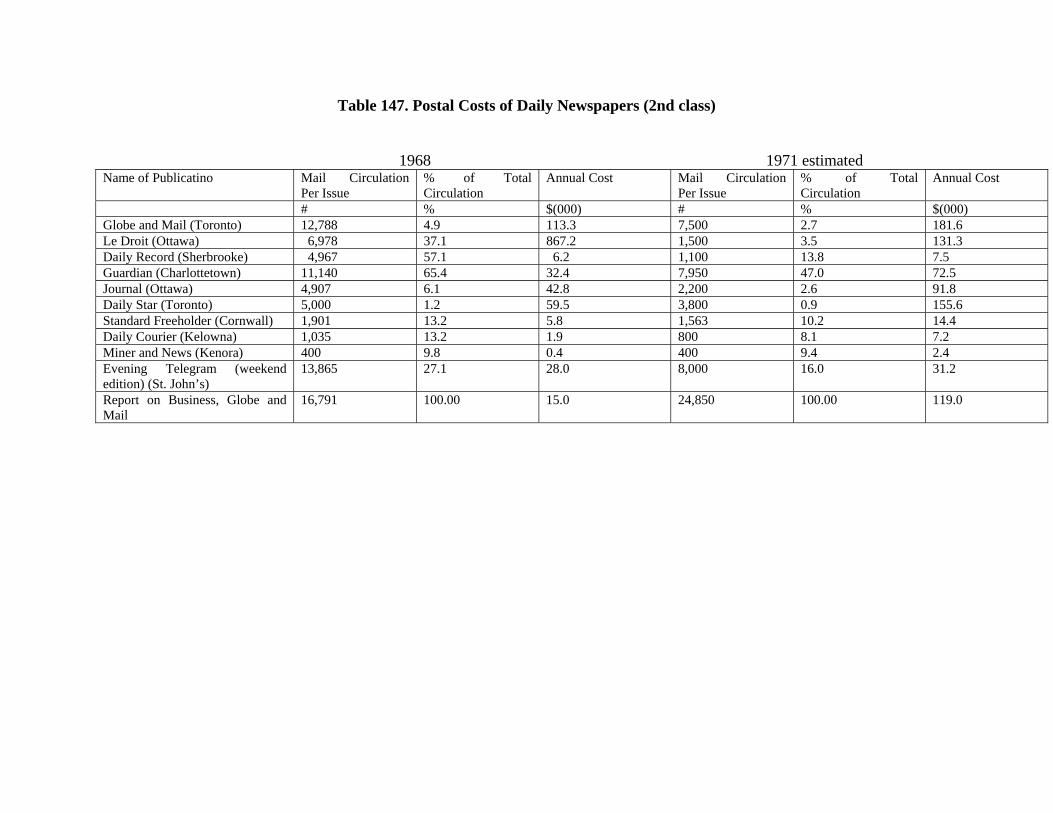
Table 147. Postal Costs of Daily Newspapers (2nd class) 1968 1971 estimated
Name of Publicatino Mail Circulation Per Issue
% of Total Circulation
Annual Cost Mail Circulation Per Issue
% of Total Circulation
Annual Cost
# % $(000) # % $(000) Globe and Mail (Toronto) 12,788 4.9 113.3 7,500 2.7 181.6 Le Droit (Ottawa) 6,978 37.1 867.2 1,500 3.5 131.3 Daily Record (Sherbrooke) 4,967 57.1 6.2 1,100 13.8 7.5 Guardian (Charlottetown) 11,140 65.4 32.4 7,950 47.0 72.5 Journal (Ottawa) 4,907 6.1 42.8 2,200 2.6 91.8 Daily Star (Toronto) 5,000 1.2 59.5 3,800 0.9 155.6 Standard Freeholder (Cornwall) 1,901 13.2 5.8 1,563 10.2 14.4 Daily Courier (Kelowna) 1,035 13.2 1.9 800 8.1 7.2 Miner and News (Kenora) 400 9.8 0.4 400 9.4 2.4 Evening Telegram (weekend edition) (St. John’s)
13,865 27.1 28.0 8,000 16.0 31.2
Report on Business, Globe and Mail
16,791 100.00 15.0 24,850 100.00 119.0
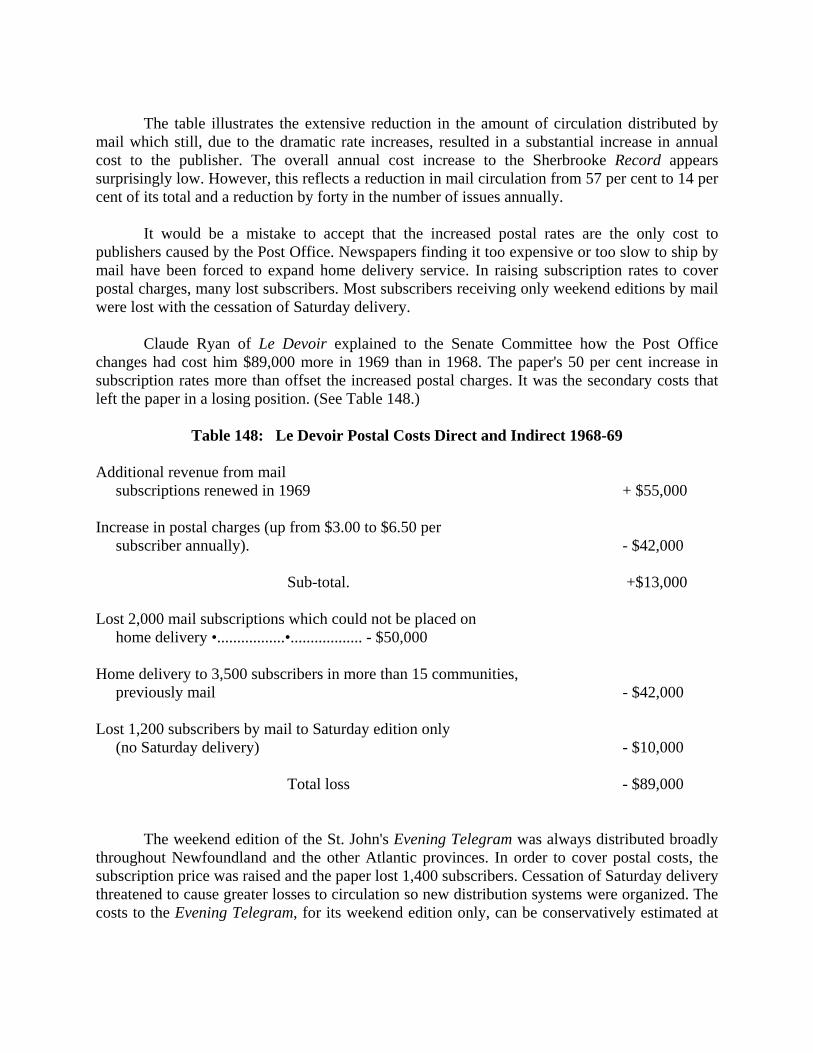
The table illustrates the extensive reduction in the amount of circulation distributed by
mail which still, due to the dramatic rate increases, resulted in a substantial increase in annual cost to the publisher. The overall annual cost increase to the Sherbrooke Record appears surprisingly low. However, this reflects a reduction in mail circulation from 57 per cent to 14 per cent of its total and a reduction by forty in the number of issues annually.
It would be a mistake to accept that the increased postal rates are the only cost to publishers caused by the Post Office. Newspapers finding it too expensive or too slow to ship by mail have been forced to expand home delivery service. In raising subscription rates to cover postal charges, many lost subscribers. Most subscribers receiving only weekend editions by mail were lost with the cessation of Saturday delivery.
Claude Ryan of Le Devoir explained to the Senate Committee how the Post Office changes had cost him $89,000 more in 1969 than in 1968. The paper's 50 per cent increase in subscription rates more than offset the increased postal charges. It was the secondary costs that left the paper in a losing position. (See Table 148.)
Table 148: Le Devoir Postal Costs Direct and Indirect 1968-69 Additional revenue from mail subscriptions renewed in 1969 + $55,000 Increase in postal charges (up from $3.00 to $6.50 per subscriber annually). - $42,000
Sub-total. +$13,000 Lost 2,000 mail subscriptions which could not be placed on home delivery •.................•.................. - $50,000 Home delivery to 3,500 subscribers in more than 15 communities, previously mail - $42,000 Lost 1,200 subscribers by mail to Saturday edition only (no Saturday delivery) - $10,000
Total loss - $89,000
The weekend edition of the St. John's Evening Telegram was always distributed broadly throughout Newfoundland and the other Atlantic provinces. In order to cover postal costs, the subscription price was raised and the paper lost 1,400 subscribers. Cessation of Saturday delivery threatened to cause greater losses to circulation so new distribution systems were organized. The costs to the Evening Telegram, for its weekend edition only, can be conservatively estimated at

$3,200 annually for increased postage costs, loss of 1,400 subscribers at $10,900, plus cost of setting up home delivery to 3,000 subscribers previously receiving copies by mail. The Globe and Mail Report on Business relies entirely on the Post Office for coast-to-coast distribution. Between 1968 and 1971, circulation will have increased by one and a half times while mailing costs have multiplied by eight. This amounts to an increase in postage costs of $114,000 in three years. Weekly Newspapers
Weekly newspapers with circulations under 10,000 published in town populations of less than 10,000 are allowed to mail 2,500 copies free w forty-mile radius of the town. Weeklies are subject now to a rate of 5d per po a 2d per piece minimum. Few weeklies weigh more than 3 ounces. If permil compute postage rate per piece on a fraction of the per-pound rate, a 3 weekly would mail at just less than Id per copy. A one and a half ounce would cost only 1/2 e per copy. The 5d per pound rate i$ considerably highe the previous poundage rate, but the 2¢ per piece minimum has been the key j affecting increases in postal rates for weeklies. Table 149 illustrates costs to weeklies. It indicates with an asterisk those enjoying free-zone privileges.
Table 149. Weekly Newspaper Postal Costs 1961 - 71
1968 1971 Name of Publication Circulation by Mail Annual Cost Circulation by Mail Annual Cost *Renfrew Advance ......... 2,190 1,100 2,000 1,560 *Bradford Witness . 800 500 1,600 1,560 *Didsbury Pioneer 890 37 750 300 *Carstairs News 550 25 675 26 Aurora Banner . 1,136 638 1,260 1,560 Mississauga News 676 588 400 921 Richmond Hill Liberal 2,372 2,023 2,059 2,601 Bathurst Northern Light 1,405 1,136 1,335 1,920 Free Press Weekly 461,622 100,000 402,555 416,160 Weeklies have not made the same effort as dailies to reduce their reliance on I circulation. It should be noted that the small scale of many weekly operati makes this incremental cost, although it may not in fact appear great proportionately more important disbursement. The Free Press Weekly is a national farm newspaper published by F. Publications in Winnipeg and almost 100 per cent carried by mail. In his appearance before the Senate Committee on February 11, 1970, Mr. Kierans said that in 1 year 1970, the postal bill to the Free Press Weekly would total $530,000, but 1 cost to the Post Office of carrying it would be $2,275,000, representing a loss $1,745,000, the largest for any single Canadian publication. Mr. Shelford, appearing on behalf of the Free Press Weekly six days later, agreed with the estimate of the postal bill but not with the estimated cost to the Post Office. The estimate of cost by the Post Office is an average of 8.5J per copy. T Free Press Weekly claims it should be 3.0¢ per copy. The reason for the difference, it is claimed by the company, is
that the Free Press Weekly performs considerably more of the post office handling, sorting and weighing functions than, does the average publication. The Free Press Weekly undertakes a high degree of pre-mailing sorting and the physical placing of bundles on railroad cars to be shipped. This reduces substantially the handling by the Winnipeg post office and make it easier to handle at destination post offices. Also as essentially a rural publication, the Free Press Weekly notes that only 11 per cent of its circulation is delivered by letter carrier while the remainder is picked up by the subscriber at the wicket. The Free Press Weekly management contend that the Post Office establishes rates based on the average cost of carrying publications, which are excessive in individual cases.
Although the postal costs have become severe for some weeklies, their chief criticism of the Post Office appears to be inefficient delivery service. One of the prime reasons for maintaining Saturday delivery in rural areas was to allow distribution of local newspapers. However, registered post offices, at which publications must be mailed, tend to be in urban areas and are closed on Saturdays. These post offices cannot always sort all the mail before the weekend and hence weeklies, which receive second priority in handling, often are not moved through until Monday or Tuesday.
Because slow delivery was resulting in loss of subscribers, many publishers started to print and mail their papers one day earlier in the week - usually Tuesday or Wednesday. This means that by Saturday the news is already four or five days old and has lost a considerable amount of its value as news. Magazines
All but 10.7 per cent of paid-circulation consumer magazines are distributed by mail, the remainder being sold as single copies on newsstands. Business and association periodicals rely even more extensively on the Post Office. A few magazines, all with unpaid circulation, such as Homemaker's Digest, Toronto Calendar and en Ville in Montreal, have elected to set up their own door-to-door delivery systems.
To put this volume into some perspective, paid-circulation consumer magazines have a total circulation of approximately sixty million annually and unpaid· circulation consumer magazines add a further eighteen million copies annually, of which 8.3 million are Homemaker's Digest and Toronto Calendar. Approximately 55 million copies of business publications are circulated of which 40 per cent are paid circulation periodicals. The largest contributor to this circulation is Financial Post which distributes over seven million copies annually. In total, then, 133 million copies are distributed of which over 120 million are mailed.
In examining the 1970 postal rates for magazines, it is important to remember the discrepancies between paid-circulation commercial, unpaid-circulation commercial and unpaid-circulation association publications. It is not necessary to distinguish between consumer and business magazines, among subject matter within these categories, nor between circulation sizes, although these factors had a bearing on rates prior to the adoption of Bill C-116.

Proponents of controlled (unpaid) circulation claim that the cost of obtaining a subscriber is not offset by the subscription price and hence that paid circulation cannot be justified. Special·interest publishers sometimes state that publications with a small maximum potential subscription must use controlled circulation to ensure reaching all qualifiers, thereby making the periodical a viable advertising medium. The Post Office, on the other hand, takes the position that if a reader is willing to pay a price for a publication, the social value of that publication is demonstrated and it should be carried by a public service at a lower rate. In the case of association publications, the Post Office feels more editorial content is free and hence operating costs are lower. Further, associations are not subject to corporate taxation. For this reason, it is said, the higher rate is justified.
Table 150 lists postal charges for a select number of magazines which participated in the Post Office study conducted by the Special Senate Committee on Mass Media staff.
Because of the variations in weight, frequency and circulation, the average cost for mailing one ounce of copy has been computed for each magazine in order that comparisons may be made. These averages are not consistent between the groups of magazines examined - paid commercial, unpaid commercial and unpaid association because the proportion of copies mailed in bulk (at a lesser rate than if by single copy mailing) varies from publication to publication.
The United Church Observer has been particularly hard hit in relation to other paid consumer magazines since it lost its extra-special second-class privileges for being religious in content and was assigned the same rate as other paid-circulation magazines. The Observer has reduced circulation by about 10,000 but increased its weight by half an ounce per copy. Its additional postal cost per issue is $4,500. The Observer in 1968 was published 22 times, in 1970 sixteen and will be published only 12 times in 1971.
The table shows that in 1970 paid commercial magazines average about 2/3 ¢ for each ounce of copy, while unpaid commercial pay 1.6¢ to 1.7 ¢ on the average and unpaid association between 1.8¢ and 2.5¢.
While it is obvious that some of these listed publications and others have reduced their weight per copy or number of issues annually since 1968, it would be unfair to attribute these changes entirely to the Post Office rate increases. It is known, however, that some publications have adopted lighter weight paper to affect reduced postal charges. A few others, subject to postal rates based on ounces rather than pounds, have occasionally deleted a page or two to reduce the weight per issue. For example, an unpaid-circulation commercial magazine weighing 5.1 ounces will have a per piece mail cost of 7 ¢ (3¢ + 2¢ + 2¢) while a 5.0 ounce magazine would cost only 5¢.
Some publications did not feel they could afford the higher cost of postal service and so set up their own distribution service. Homemaker's Digest, an unpaid-circulation publication for above-average-income housewives, blankets suitable areas coast-to-coast with a total circulation of 1.2 million. The new postal rates meant an increased annual postal bill from $66,000 to $462,000. (This change was caused partially by an increase in the publication's weight from 2 to 2~ ounces. However, at 21/2 ounces the previous bill would have been only $132,000 leaving a

real increase of $330,000.) The magazine at first was folded. However, in 1970 it was refinanced by new Canadian owners and initiated a self-distributing system. This system, involving bulk transport in railway cars to central points with door-to-door drop off thereafter, costs about half what the Post Office would charge. In addition, it has a greater guarantee of quick delivery. Toronto Calendar, also faced with 600-700 per cent increases in postal costs, went to door-to-door personal delivery. Toronto Calendar is delivered by hand to

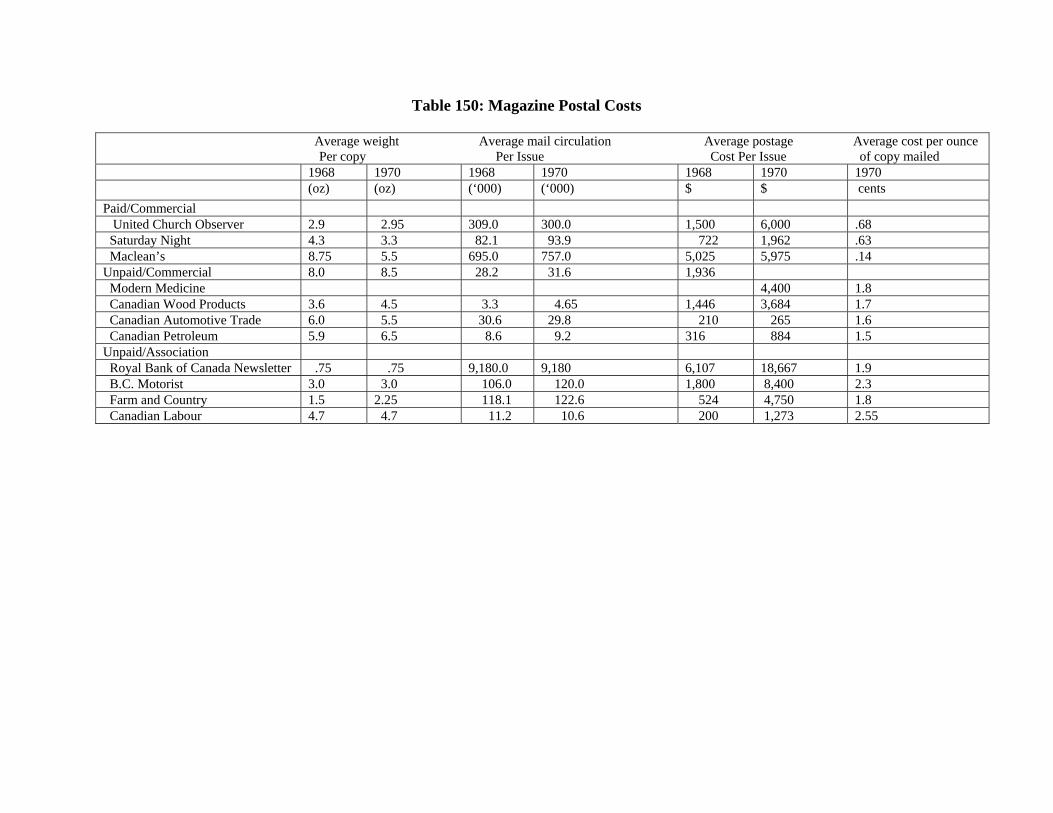
Table 150: Magazine Postal Costs Average weight Average mail circulation Average postage Average cost per ounce Per copy Per Issue Cost Per Issue of copy mailed 1968 1970 1968 1970 1968 1970 1970 (oz) (oz) (‘000) (‘000) $ $ cents
Paid/Commercial United Church Observer 2.9 2.95 309.0 300.0 1,500 6,000 .68 Saturday Night 4.3 3.3 82.1 93.9 722 1,962 .63 Maclean’s 8.75 5.5 695.0 757.0 5,025 5,975 .14 Unpaid/Commercial 8.0 8.5 28.2 31.6 1,936 Modern Medicine 4,400 1.8 Canadian Wood Products 3.6 4.5 3.3 4.65 1,446 3,684 1.7 Canadian Automotive Trade 6.0 5.5 30.6 29.8 210 265 1.6 Canadian Petroleum 5.9 6.5 8.6 9.2 316 884 1.5 Unpaid/Association Royal Bank of Canada Newsletter .75 .75 9,180.0 9,180 6,107 18,667 1.9 B.C. Motorist 3.0 3.0 106.0 120.0 1,800 8,400 2.3 Farm and Country 1.5 2.25 118.1 122.6 524 4,750 1.8 Canadian Labour 4.7 4.7 11.2 10.6 200 1,273 2.55

120,000 households. The nature of the magazine requires that it arrive at its destination no later than three days after publishing. Distribution by third class took an average of nine days. Although the time schedule could be met by first class mailing, this cost $21,600 per issue or just over $2.2 million annually or 18¢ per copy.
En Ville, a small business publication distributed in downtown Montreal, hires university students at $1.50 an hour and packages the magazine in plastic together with direct mail inserts sold to offset the cost of distribution. Thus its cost of distribution increase has been minimal whereas it too faced destruction through a 600 per cent increase.
It has been suggested that a number of publications in Canada expired because of the postal increases. Although this may be true, it is just as likely that this incremental cost was simply the straw that broke the camel's back; they might have died in any case for any number of marketing or product reasons. The concern would seem to be the discrepancy in rates between paid commercial, unpaid commercial and unpaid association publications. Undoubtedly, to the unpaid circulation publications, particularly those published by associations, postage has become a major cost factor.
It should be noted that distribution costs in 1970 for the Homemaker's Digest, Toronto Calendar and En Ville are less than if they used the postal service. This suggests that the postal service is too costly for the service performed. While it is probably true that a number of efficiencies could be introduced in the Post Office, it should be recognized that these three publications differ from others in having localized concentrated distribution areas and hence lend themselves more easily to door-to-door distribution. Self-distribution for Chatelaine or Chemistry in Canada or other scattered subscriber publications would probably be more costly than by mail.
THE VIEW FROM THE POST OFFICE It was considered desirable to interview senior postal officials, touching on points which
have been of concern within the industry, in the hope that this might assist the Committee. Accordingly, F. Pageau and G.S. McLachlan, Director and Assistant Director respectively of the Postal Rates and Classifications Branch were interviewed on July 4, 1969. Three questions were discussed:
1. The effect of postal rate increases, and delivery contractions, upon daily newspapers.
2. The effect on Canadian magazines of solicitation by the Canada Post Office of business from U.S. magazines.
3. The "import-export" imbalance that Canada Post Office encounters in the publications field.

QUESTION 1
It was immediately clear that, from the standpoint of the Civil Service, the main impact
upon daily newspapers of changes in postal rates and regulations in the 1968-69 period stemmed not from the additional costs of mailing newspapers, but of the contraction of daily deliveries from six to five per week.
The effect of this loss of a delivery day, causing papers to pile up and lag yet another day from publication delivery, has resulted in determined efforts on the part of a number of newspapers with a fairly substantial mail circulation to bypass the post office as much as possible by extending their carrier and truck delivery routes.
The Post Office certainly conceived this as a major problem from the standpoint of the publishers. But it was subjectively obvious from the tone of the interview that the Post Office feels the other considerations involved in the five-day decision outweigh this factor and that the department would be happy to be relieved of the newspaper distribution burden altogether.
In the matter of postage rate increases the Post Office, to its regret, feels it is still heavily subsidizing weekly newspapers, general-interest farm papers, consumer magazines, and the religious press. Under the postal rates effective April 1, 1969, for instance, weekly newspapers still pay only 12 per cent of the actual cost of mailing their product, compared to 9 per cent under the old schedule, according to Post Office figures.
So far as daily newspapers alone are concerned the Post Office is of the view that a great deal of the complaint has ranged from the irrelevant to the dishonest. It maintains a list compiled in late 1968, containing the total circulation of each paper, the percentage of circulation distributed by mail, the prices to subscribers for home delivery vs. mail delivery, and the cost of mail delivery increase and impact upon mail subscribers of the increases. The Post Office view in every case is that non-punitive upward rate adjustments in the mail subscriber category could completely recover the additional postal cost without causing any serious problems.
For instance, Le Devoir and L'Evangeline, Moncton, are the two Canadian papers hardest hit ("We tried hard to find comparative English papers but it wasn't possible"). Of a circulation of 8,405 L'Evangeline distributes 6,262 by mail. Its subscription price to mail subscribers is $15.00 per annum, by carrier $26.00. The full impact, according to postal calculation, is $5.00 per mail subscription. Le Devoir distributes 18,000 of a circulation of 42,000 by mail and subscription rates vary from $20.00 for mail to $31.00 for carrier. The postal cost impact would be $3.57 per mail subscriber. These two cases are regarded as unique.
One of the most adversely affected English language newspapers is the Orillia Packet and Times, which distributes 2,500 of a total circulation of 8,000 by mail. Its subscription prices are $10.00 by mail and $31.00 by carrier boy and it is calculated that an increase of $4.81 in the mail subscription would accommodate the additional postal burden and still leave the mail subscriber buying at half the carrier boy rate.

A far more typical case is that of the Edmonton Journal which distributes only 10,000 of a total circulation of 150,000 by mail and which charges $32.50 for home delivery as compared to $15.00 for mail subscribers. In general, then, the official attitude of the Post Office to the problems of daily newspapers is not sympathetic insofar as the rate increases are concerned, even in such extreme cases as Le Devoir and L 'Evangeline. There did appear to be genuine sympathy for the problems engendered by the five-day as opposed to the-six-day delivery.
QUESTION 2
One complaint levelled against the Canadian postal service has been its effort during the past several years to encourage magazine publishers in the United States to truck their products across the U.S.-Canadian border and mail them in Canada. This has brought accusations from Canadian publishers that the Government of Canada through its Post Office is subsidising foreign competitors.
The Post Office takes an entirely contrary view. Although the Canadian rates are cheaper once an initial distance has been covered by truck, the Post office points out that under international convention it is honour-bound to deliver for nothing articles of mail which originate in foreign countries and destined for Canadian receivers. In other words, if the American publishers involved (Life is an example) mailed their product in the United States the delivery costs in Canada would be a net loss to the Canadian postal system.
For instance, in the last fiscal year, the Canada Post Office earned $3 million in this way which, it contends, would otherwise have been lost revenue. It contends that the rates are no lower or no higher for American magazines compared to Canadian magazines and that no element of unfair competition exists.
QUESTION 3 One concrete by-product of the foreign publications that enter Canada in large numbers is that the Post Office loses a good deal of money delivering them, because the international postal agreements simply call for reciprocity of delivery and do not take an imbalance of quantity into account.
Thus, Canada exports relatively few of her publications, and practically none of them in quantity. Yet it is, in the words of postal officials, inundated "by carload lots" by publications from the United States, Britain, France, Germany and Italy, in that approximate order.
After complaining ineffectually about this for a number of years Canada has found common cause in its grievance with a number of African and Asian countries, and such smaller European countries as Belgium, which suffer from the same imbalance.
Accordingly, at the sessions of the world Postal Congress in Tokyo last fall, Canada, in conjunction with a number of other small countries, set in motion steps which it is hoped will lead eventually (it apparently takes several years to get a change through this body) to an

arrangement which compensates countries that are net importers of publications, at the expense of the exporters.

APPENDICES
Appendix 1
OWNERSHIP AND INDICATED CONTROL OF MEDIAOUTLETS
IN 103 SURVEYED COMMUNITIES AT JULY 31, 1970
INTRODUCTION The following table lists all the daily newspapers, radio and television stations, and cable television systems for each community, by province, covered in this survey. Not every community served by the mass media in Canada is included. The study has been confined to those communities in which a daily newspaper is published or in which a primary television station is located. Some additional communities, in which major group companies have an interest in one or more radio stations, have also been included. The table shows the population of each community, the company or individual owning each of the media, and, where ascertainable, the indicated source of control.
Population figures have been taken from the Financial Post's Survey of Markets (1969), projected population as at April 1, 1969. Where a listing for a community at this date was not available, the 1966 census figure was used. The census figures are denoted by the symbol "c" and metropolitan populations are denoted by the symbol "M". Circulation figures for newspapers have been taken, in most cases, from the December, 1969, issue of Canadian Advertising Rates and Data and represent average daily total paid circulation, excluding bulk Monday through Saturday. Circulation figures for radio and television are taken from the October 7 - November 9, 1969 Coverage and Circulation Report of the Bureau of Broadcast Measurement. Radio data are based on the average daily circulation, in day-time hours, for all persons, two years old and over. For cable television systems there are no call letters; therefore, under the heading "Media Name" only the symbol CATV is used. Cable television circulation data have been provided by individual operators; the un-bracketed figure is the actual number of subscribing households as of December 31, 1969, including apartment and bulk units; the bracketed figure represents the maximum potential on the same basis.
Where applicable, the network affiliation of each of the listed radio and television stations is indicated. CBC stations are listed as CBCO (CBC-owned) and CBCA (CBC affiliated).
The column headed "Media Owner" indicates only those media outlets which are owned by groups. All others are independently owned. The words "See Group Profile" in the column headed "Remarks" refer to profiles of major ownership groups in Part I of this volume.

Appendix II
THE CANADIAN BROADCASTING CORPORATION
INTRODUCTION
Over the past decade, the Canadian Broadcasting Corporation has been the subject of exhaustive and often highly controversial inquiries and debates by the Royal Commission on Government Organization, the Committee on Broadcasting, innumerable committees of Parliament and Parliament itself.
It is not the intention of this study to probe further into the policies and operations of the CBC as such. Our concern is only with those aspects of the Corporation's policies and operations that may have a significant bearing on the private sector of the broadcasting industry.
Although it is heavily financed by public funds, the CBC can have a marked impact on private stations - both its own network affiliates and those of the competing CTV affiliates - through the commercial policies it pursues.
During the mid-1960s, the CBC management of the day took the position that it was required to rely too heavily on commercial revenue to finance its operations, even though the proportion it earned from this source was modest in comparison to the total it received in grants from the public treasury. It pressed the argument on both the Federal Government and the Committee on Broadcasting that it should be permitted to dispense altogether with advertising on radio after a five-year period and to limit its net commercial revenue from television to $25 million.
In its report of 1965, the Fowler Committee strongly recommended against approval of this course. It maintained that the CBC should be required to seek to maintain at least the 4 per cent share of the radio advertising market and 25 per cent share of the television advertising market that it was then obtaining. If television and radio sales can be increased to capture, say, 30 per cent and 6 per cent of the respective advertising markets, so much the better; for the additional revenue so obtained could be devoted to further improvements in programming quality.
The committee contended that the CBC could increase its commercial revenue substantially through more intensive market research and the development of a better organized and more aggressive advertising sales force.
The committee's report recommended that the corporation be given an annual statutory grant of $25 for every television household in Canada to cover both its operating and capital costs. While acknowledging that this would probably provide the corporation with lean fare from the public purse, the committee suggested it would make out satisfactorily if it pared certain excessive costs and actively sought more commercial revenue.

In its White Paper on broadcasting in 1966, the federal government indicated general agreement with this approach:
The Government accepts the recommendation of the Advisory Committee that the Corporation should be financed by means of a statutory five-year grant based on a formula related to television households, with a suitable borrowing authority for capital requirements. The details of the actual amounts, which will require the exercise of a tight financial discipline by the Directors of the Corporation but will be adequate for reasonable requirements, will be submitted to Parliament by the Minister of Finance later in the year, when financial requirements of all kinds for the next and ensuing fiscal years are under consideration.
The government said it had concluded that the recommendations of the Committee on
Broadcasting regarding commercial operations of the CBC should be implemented. Unlike the committee, however, the White Paper proposed a ceiling.
It is important both to the Corporation and to private broadcasters that definite limits be set to the amount of revenue to be derived from its commercial activities. The Corporation should not seek to increase its present volume of commercial programming.
Parliament will accordingly be asked to make financial provision for the Corporation on the basis that, while improving its programming, it should seek to retain but not to increase its present 25 per cent share of the television advertising market and 4 per cent of the corresponding market.
Throughout the debate in Parliament revolving around the Fowler Committee's report, the
White Paper and the broadcasting bill subsequently introduced by the government, a strong consensus developed in support of this general position on the financing of the CBC.
There appears to be little room for doubt that this evident consensus, together with a change in the senior officers of the corporation, have led to a marked change in CBC policy. Like it or not, the CBC management has been left by force of circumstances with little choice but to pursue a far more aggressive commercial policy than in the past, while at the same time exercising far more rigid control over costs.
The statutory financing provisions which the Fowler Committee recommended and the government proposed, in the White Paper, to introduce later in 1966 are still awaited. In the meantime, however, the corporation has found itself a prime victim of a government economy drive and is under heavy pressure to hold down costs and to seek additional commercial revenue. This pressure comes at the end of an extended period of rapidly rising CBC expenditures. Between the fiscal year ending March 31, 1960, to 1969, total CBC expenditures rose from $94,040,000 to $196,487,000, an increase of 109 per cent. During the same period, CBC's net advertising revenue rose only from $27,236,000 to $29,645,000, an increase of 8.8 per cent. An
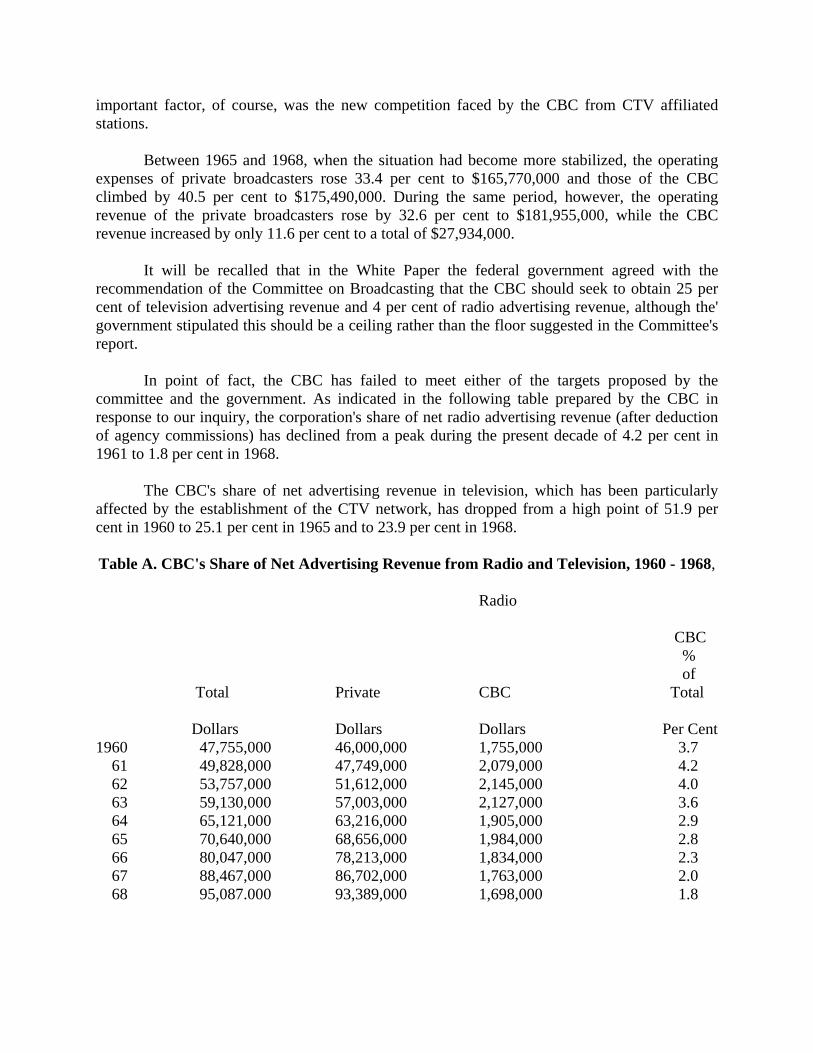
important factor, of course, was the new competition faced by the CBC from CTV affiliated stations.
Between 1965 and 1968, when the situation had become more stabilized, the operating expenses of private broadcasters rose 33.4 per cent to $165,770,000 and those of the CBC climbed by 40.5 per cent to $175,490,000. During the same period, however, the operating revenue of the private broadcasters rose by 32.6 per cent to $181,955,000, while the CBC revenue increased by only 11.6 per cent to a total of $27,934,000.
It will be recalled that in the White Paper the federal government agreed with the recommendation of the Committee on Broadcasting that the CBC should seek to obtain 25 per cent of television advertising revenue and 4 per cent of radio advertising revenue, although the' government stipulated this should be a ceiling rather than the floor suggested in the Committee's report.
In point of fact, the CBC has failed to meet either of the targets proposed by the committee and the government. As indicated in the following table prepared by the CBC in response to our inquiry, the corporation's share of net radio advertising revenue (after deduction of agency commissions) has declined from a peak during the present decade of 4.2 per cent in 1961 to 1.8 per cent in 1968.
The CBC's share of net advertising revenue in television, which has been particularly affected by the establishment of the CTV network, has dropped from a high point of 51.9 per cent in 1960 to 25.1 per cent in 1965 and to 23.9 per cent in 1968. Table A. CBC's Share of Net Advertising Revenue from Radio and Television, 1960 - 1968,
Radio CBC % of Total Private CBC Total
Dollars Dollars Dollars Per Cent 1960 47,755,000 46,000,000 1,755,000 3.7 61 49,828,000 47,749,000 2,079,000 4.2 62 53,757,000 51,612,000 2,145,000 4.0 63 59,130,000 57,003,000 2,127,000 3.6 64 65,121,000 63,216,000 1,905,000 2.9 65 70,640,000 68,656,000 1,984,000 2.8 66 80,047,000 78,213,000 1,834,000 2.3 67 88,467,000 86,702,000 1,763,000 2.0 68 95,087.000 93,389,000 1,698,000 1.8
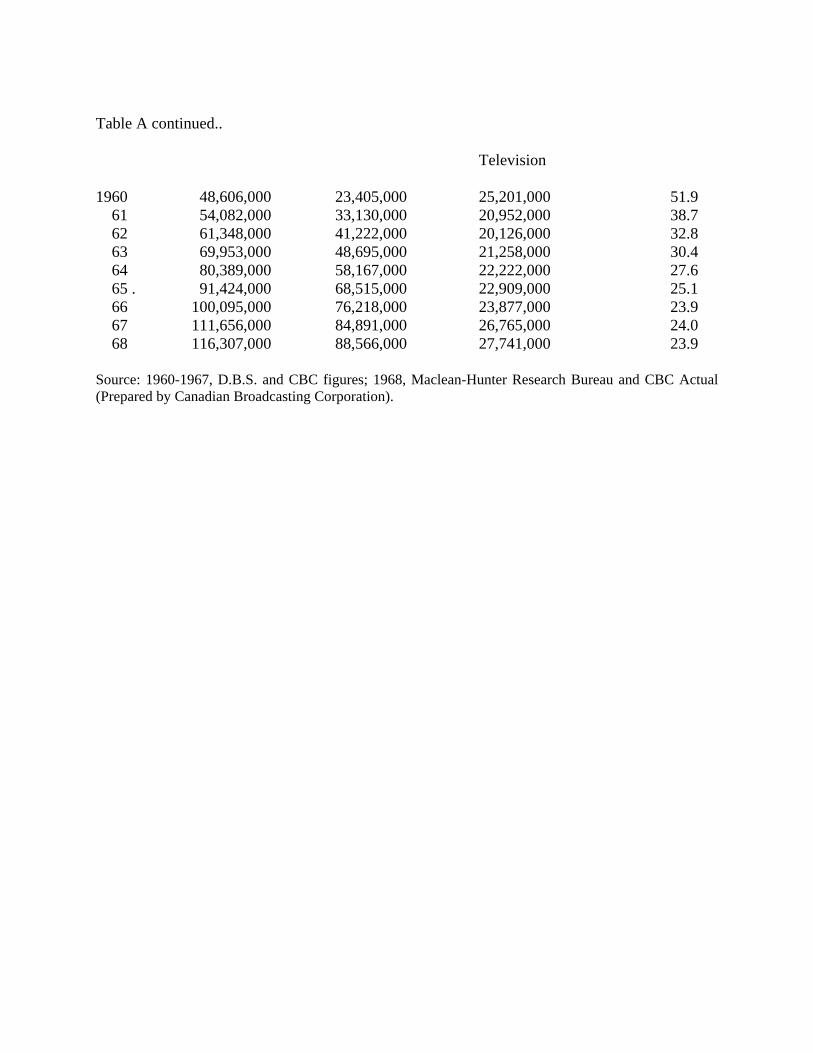
Table A continued.. Television 1960 48,606,000 23,405,000 25,201,000 51.9 61 54,082,000 33,130,000 20,952,000 38.7 62 61,348,000 41,222,000 20,126,000 32.8 63 69,953,000 48,695,000 21,258,000 30.4 64 80,389,000 58,167,000 22,222,000 27.6 65 . 91,424,000 68,515,000 22,909,000 25.1 66 100,095,000 76,218,000 23,877,000 23.9 67 111,656,000 84,891,000 26,765,000 24.0 68 116,307,000 88,566,000 27,741,000 23.9 Source: 1960-1967, D.B.S. and CBC figures; 1968, Maclean-Hunter Research Bureau and CBC Actual (Prepared by Canadian Broadcasting Corporation).