Embed Size (px)
Citation preview
1
The State of U.S. Health Care: Opportunities for CoBA in Health
Information Technology
Presentation to CSUSM MIS SocietyMarch 9, 2010
George Diehr CSUSM CoBA Professor of Management Science
Member, CalPERS Board of Administration
2
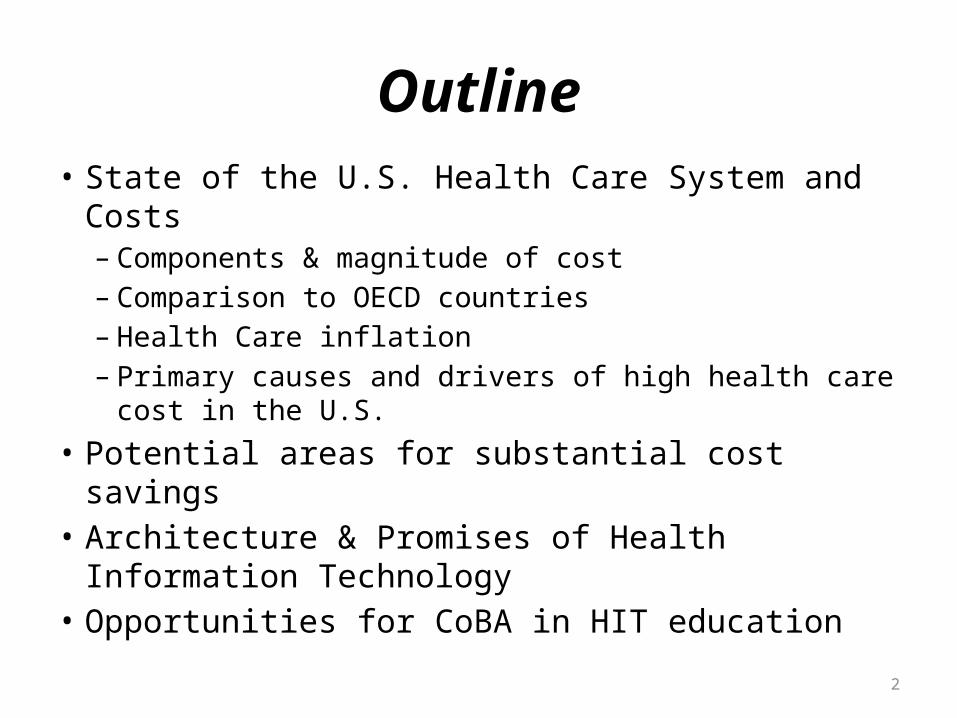
Outline• State of the U.S. Health Care System and Costs– Components & magnitude of cost– Comparison to OECD countries– Health Care inflation– Primary causes and drivers of high health care cost in
the U.S.• Potential areas for substantial cost savings• Architecture & Promises of Health Information
Technology• Opportunities for CoBA in HIT education
3
Questions, Issues
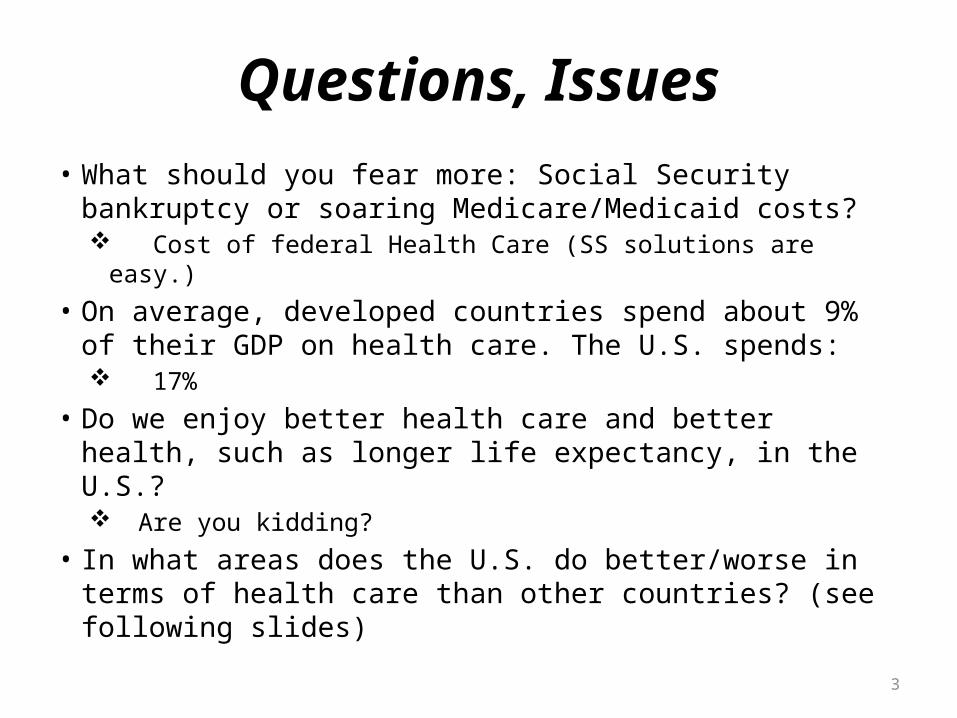
• What should you fear more: Social Security bankruptcy or soaring Medicare/Medicaid costs? Cost of federal Health Care (SS solutions are easy.)
• On average, developed countries spend about 9% of their GDP on health care. The U.S. spends: 17%
• Do we enjoy better health care and better health, such as longer life expectancy, in the U.S.? Are you kidding?
• In what areas does the U.S. do better/worse in terms of health care than other countries? (see following slides)
4
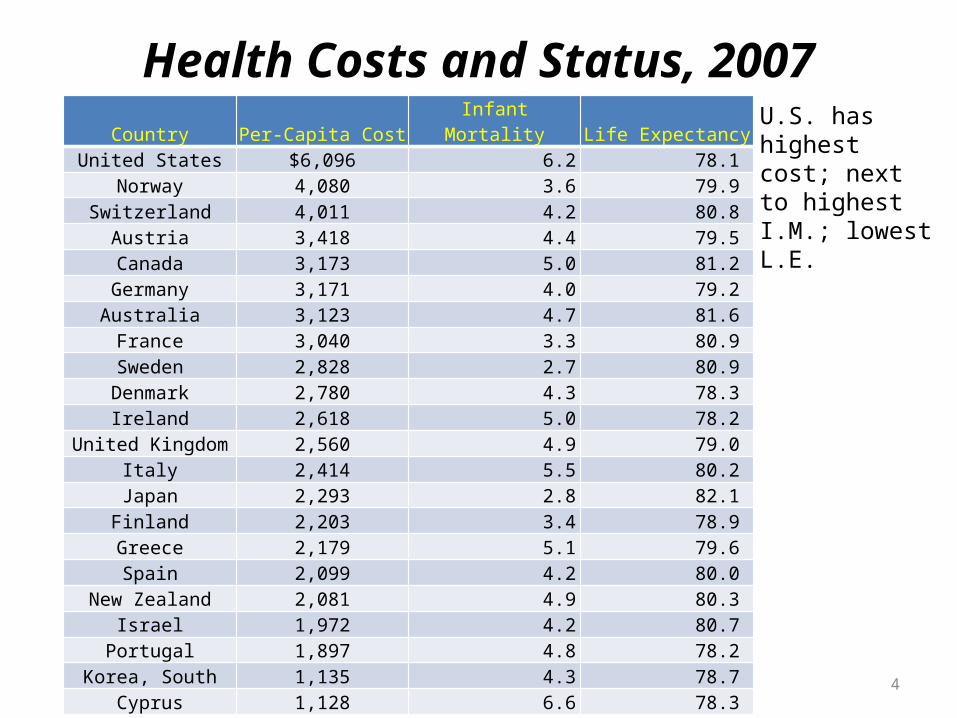
Health Costs and Status, 2007Country Per-Capita Cost Infant Mortality Life Expectancy
United States $6,096 6.2 78.1 Norway 4,080 3.6 79.9
Switzerland 4,011 4.2 80.8 Austria 3,418 4.4 79.5 Canada 3,173 5.0 81.2
Germany 3,171 4.0 79.2 Australia 3,123 4.7 81.6 France 3,040 3.3 80.9
Sweden 2,828 2.7 80.9 Denmark 2,780 4.3 78.3 Ireland 2,618 5.0 78.2
United Kingdom 2,560 4.9 79.0 Italy 2,414 5.5 80.2
Japan 2,293 2.8 82.1 Finland 2,203 3.4 78.9 Greece 2,179 5.1 79.6 Spain 2,099 4.2 80.0
New Zealand 2,081 4.9 80.3 Israel 1,972 4.2 80.7
Portugal 1,897 4.8 78.2 Korea, South 1,135 4.3 78.7
Cyprus 1,128 6.6 78.3
U.S. has highest cost; next to highest I.M.; lowest L.E.
7
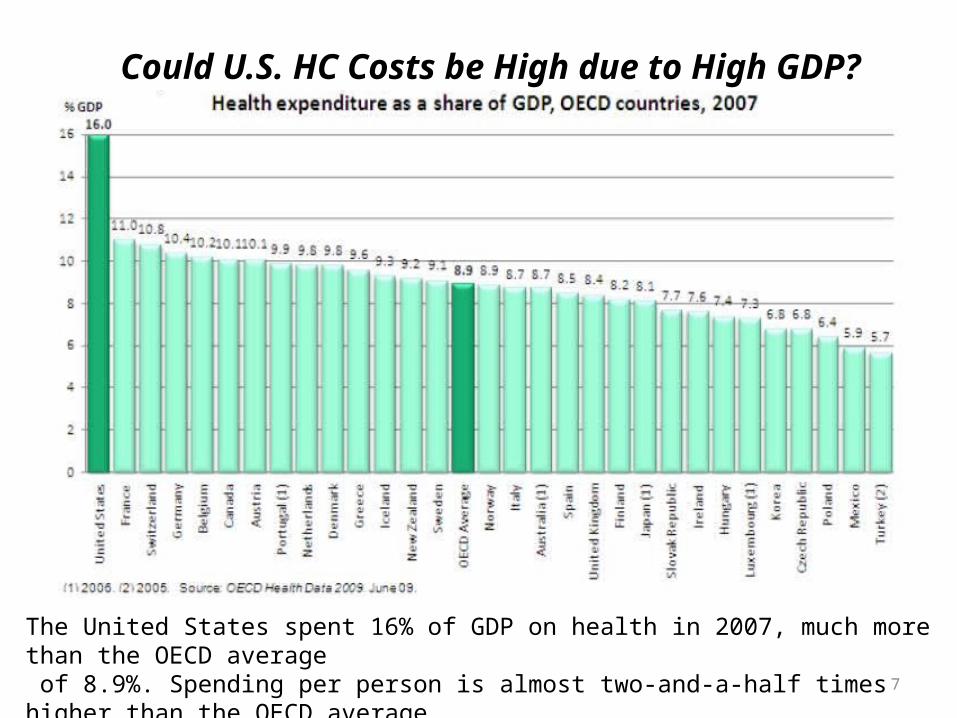
The United States spent 16% of GDP on health in 2007, much more than the OECD average of 8.9%. Spending per person is almost two-and-a-half times higher than the OECD average.
Could U.S. HC Costs be High due to High GDP?
9
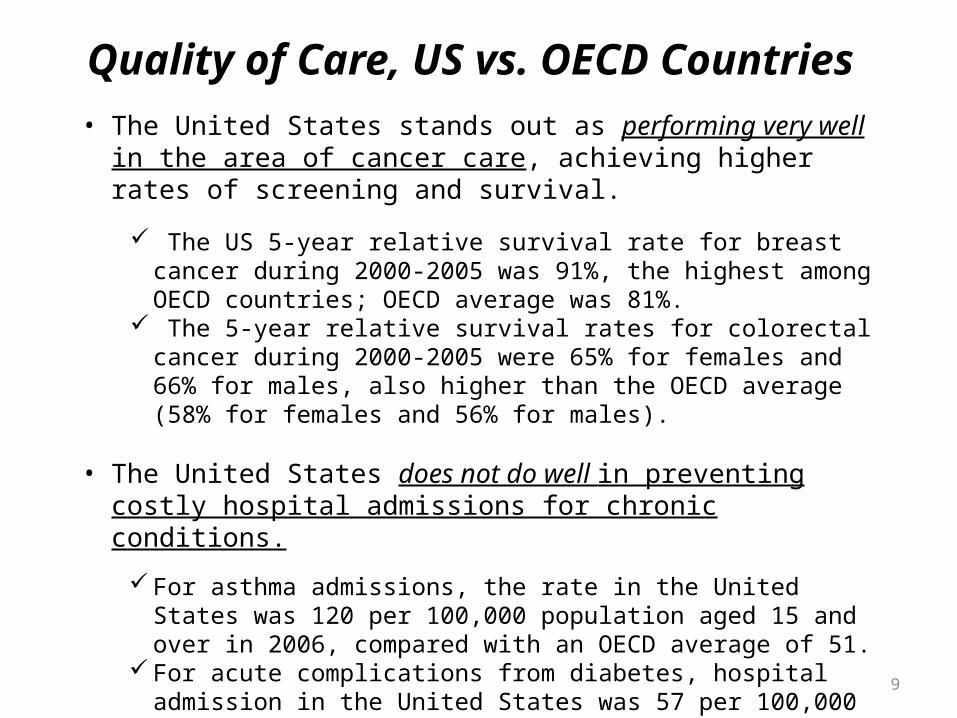
Quality of Care, US vs. OECD Countries
• The United States stands out as performing very well in the area of cancer care, achieving higher rates of screening and survival.
The US 5-year relative survival rate for breast cancer during 2000-2005 was 91%, the highest among OECD countries; OECD average was 81%.
The 5-year relative survival rates for colorectal cancer during 2000-2005 were 65% for females and 66% for males, also higher than the OECD average (58% for females and 56% for males).
• The United States does not do well in preventing costly hospital admissions for chronic conditions.
For asthma admissions, the rate in the United States was 120 per 100,000
population aged 15 and over in 2006, compared with an OECD average of 51.
For acute complications from diabetes, hospital admission in the United States was 57 per 100,000 population aged 15 and over, compared with an OECD average of 21.

12
Growth in Health Care Spending
Total increase, 1970 to 2007, as share of GDP: US 125%; Germany 72%; Canada 43%; UK 85%. Annualized rate of growth as percent of GDP for US: 0.32%.
15
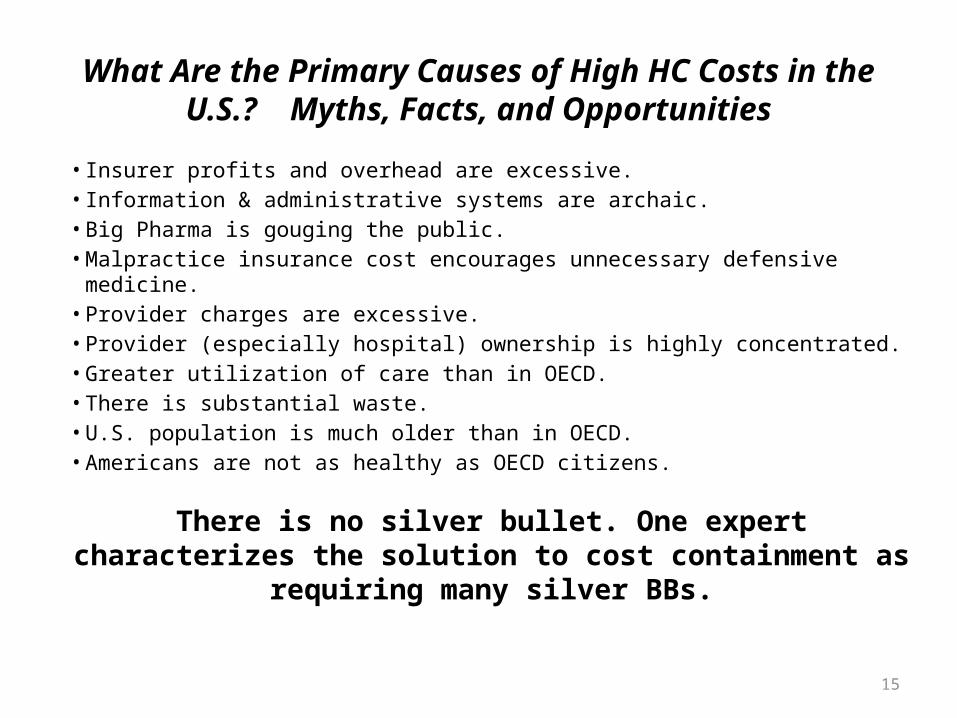
What Are the Primary Causes of High HC Costs in the U.S.? Myths, Facts, and
Opportunities• Insurer profits and overhead are excessive.• Information & administrative systems are archaic.• Big Pharma is gouging the public.• Malpractice insurance cost encourages unnecessary defensive medicine.• Provider charges are excessive.• Provider (especially hospital) ownership is highly concentrated.• Greater utilization of care than in OECD.• There is substantial waste.• U.S. population is much older than in OECD.• Americans are not as healthy as OECD citizens.
There is no silver bullet. One expert characterizes the solution to cost
containment as requiring many silver BBs.
16
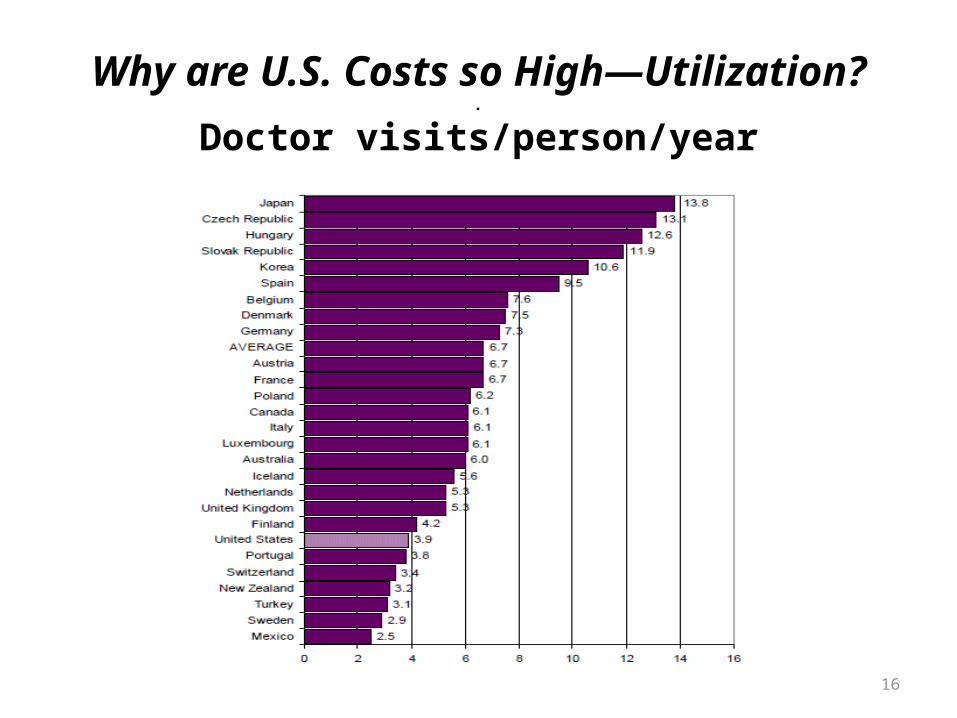
Why are U.S. Costs so High—Utilization?.
Doctor visits/person/year
17
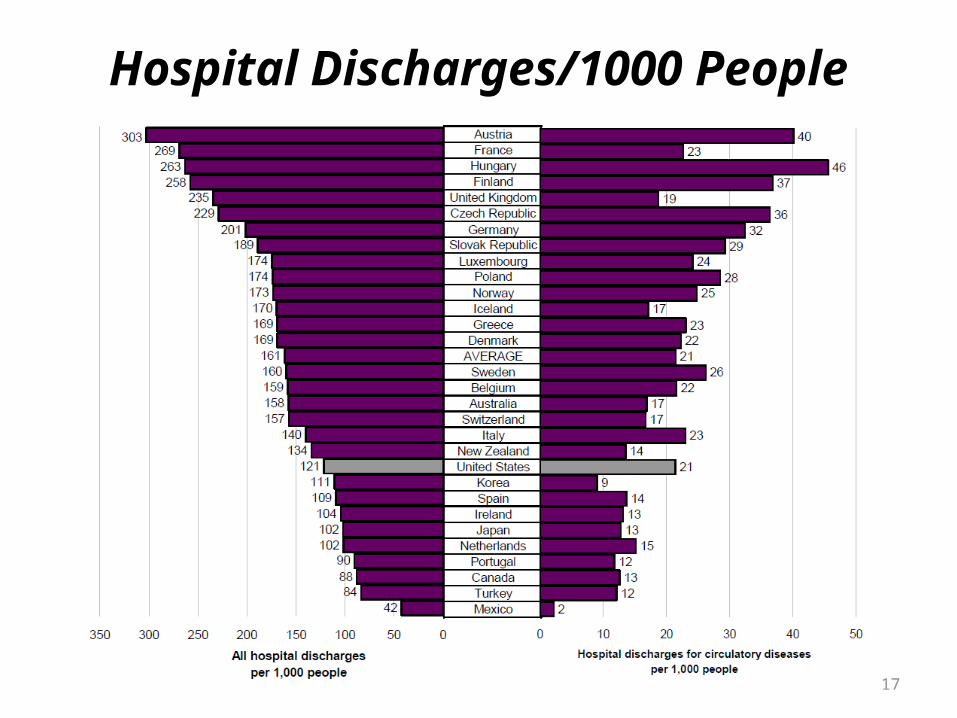
Hospital Discharges/1000 People
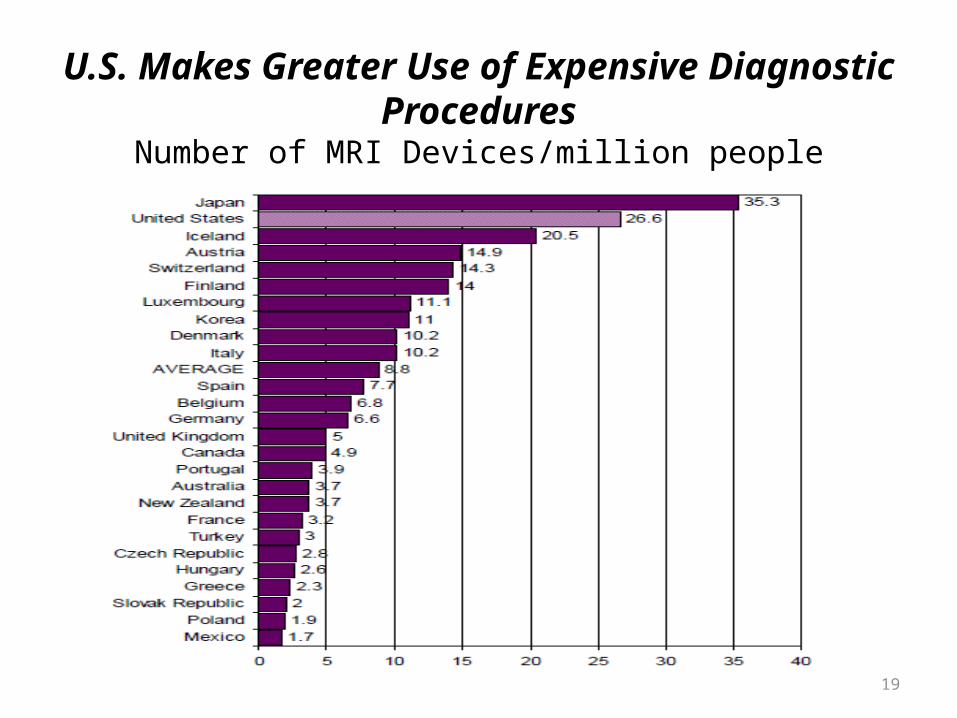
19
U.S. Makes Greater Use of Expensive Diagnostic Procedures
Number of MRI Devices/million people
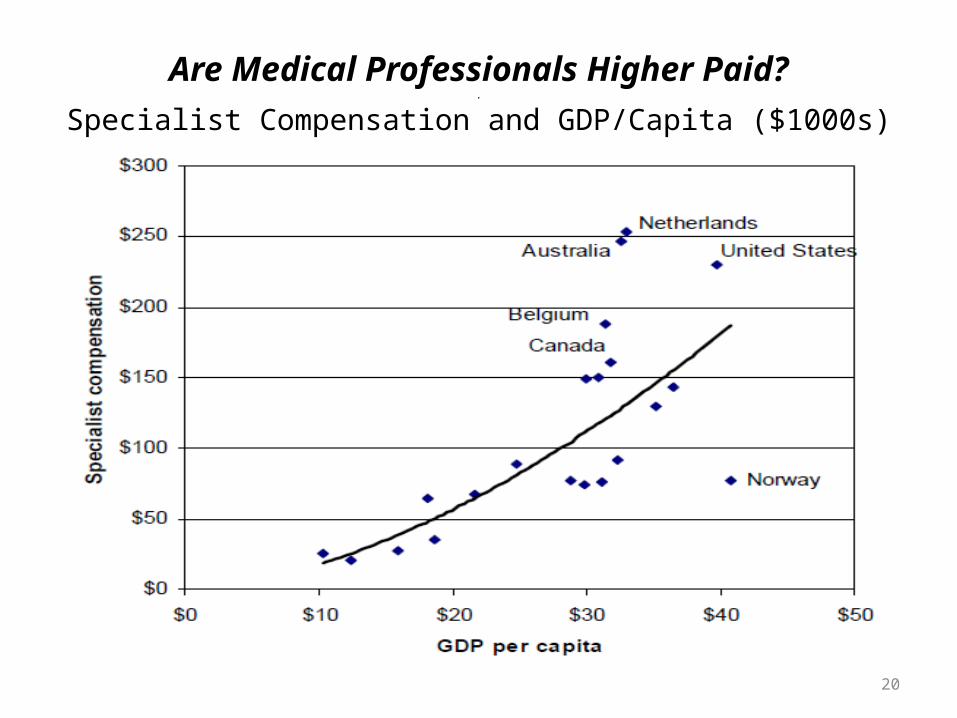
20
Are Medical Professionals Higher Paid?.
Specialist Compensation and GDP/Capita ($1000s)
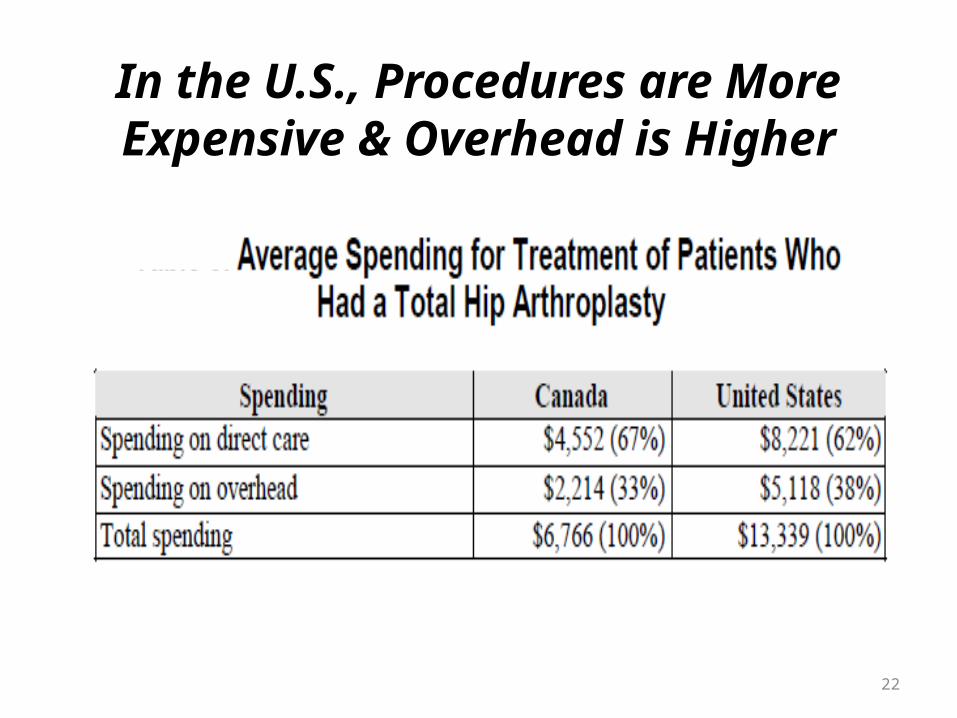
22
In the U.S., Procedures are More Expensive & Overhead is
Higher
23
Are Drugs More Expensive in the U.S.?
• Patent drugs in the U.S. cost more, about 60% more than in Italy.
• Costs of generics in the U.S. are generally cheaper than in other countries: in Italy, generic cost is about double the U.S.
• Overall, pharmaceutical spending/person in the U.S. is about double the OECD average.
• Nonetheless, spending more on drugs can reduce other costs & total pharmaceutical cost is a modest component of total HC cost.
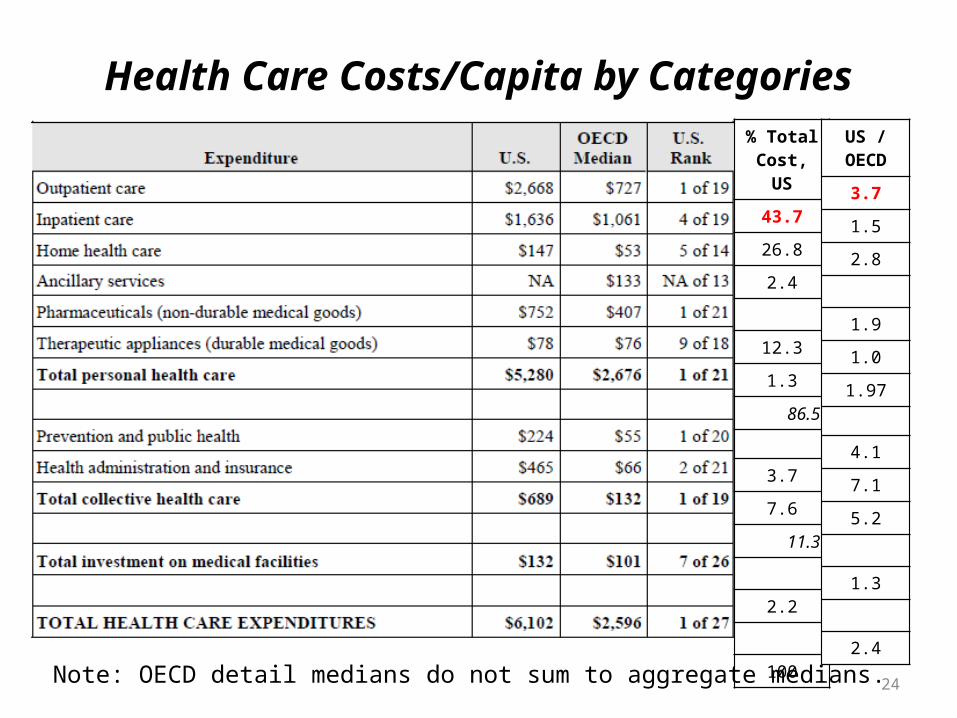
24
Health Care Costs/Capita by Categories% Total Cost, US
43.7
26.8
2.4
12.3
1.3
86.5
3.7
7.6
11.3
2.2
100
US / OECD
3.7
1.5
2.8
1.9
1.0
1.97
4.1
7.1
5.2
1.3
2.4
Note: OECD detail medians do not sum to aggregate medians.
25
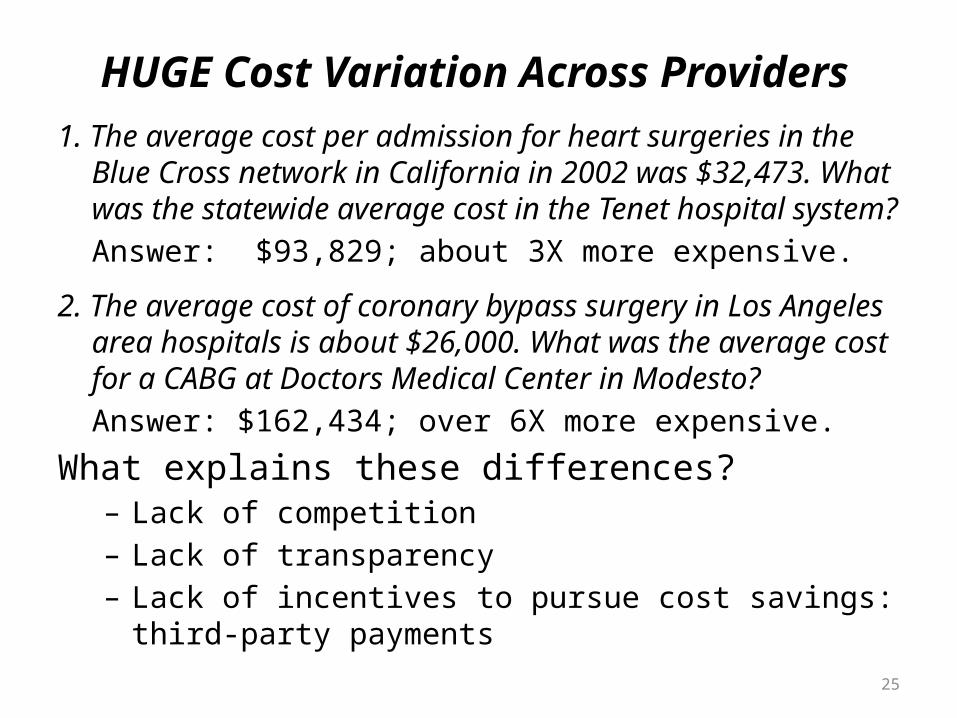
HUGE Cost Variation Across Providers
1. The average cost per admission for heart surgeries in the Blue Cross network in California in 2002 was $32,473. What was the statewide average cost in the Tenet hospital system?
Answer: $93,829; about 3X more expensive.
2. The average cost of coronary bypass surgery in Los Angeles area hospitals is about $26,000. What was the average cost for a CABG at Doctors Medical Center in Modesto?
Answer: $162,434; over 6X more expensive.
What explains these differences?– Lack of competition– Lack of transparency– Lack of incentives to pursue cost savings: third-party
payments
28
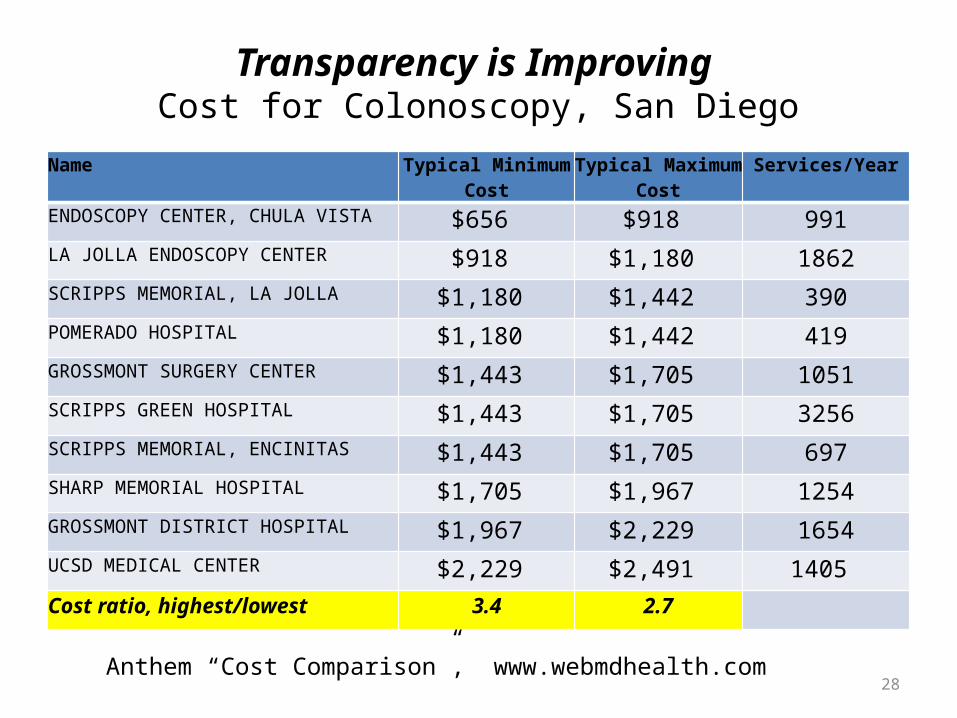
Transparency is Improving Cost for Colonoscopy, San Diego
Name Typical Minimum Cost
Typical Maximum Cost
Services/Year
ENDOSCOPY CENTER, CHULA VISTA $656 $918 991LA JOLLA ENDOSCOPY CENTER $918 $1,180 1862SCRIPPS MEMORIAL, LA JOLLA $1,180 $1,442 390POMERADO HOSPITAL $1,180 $1,442 419GROSSMONT SURGERY CENTER $1,443 $1,705 1051SCRIPPS GREEN HOSPITAL $1,443 $1,705 3256SCRIPPS MEMORIAL, ENCINITAS $1,443 $1,705 697SHARP MEMORIAL HOSPITAL $1,705 $1,967 1254GROSSMONT DISTRICT HOSPITAL $1,967 $2,229 1654UCSD MEDICAL CENTER $2,229 $2,491 1405
Cost ratio, highest/lowest 3.4 2.7
Anthem “Cost Comparison”, www.webmdhealth.com

29
Does Higher Cost Provide Higher Quality?
“Cost” vs. “Quality”, California Hospitals
0%
50%
100%
150%
200%
250%
300%
0% 50% 100% 150% 200% 250% 300%
Rela
tive
Cost
Inde
x
Relative Quality Index
30
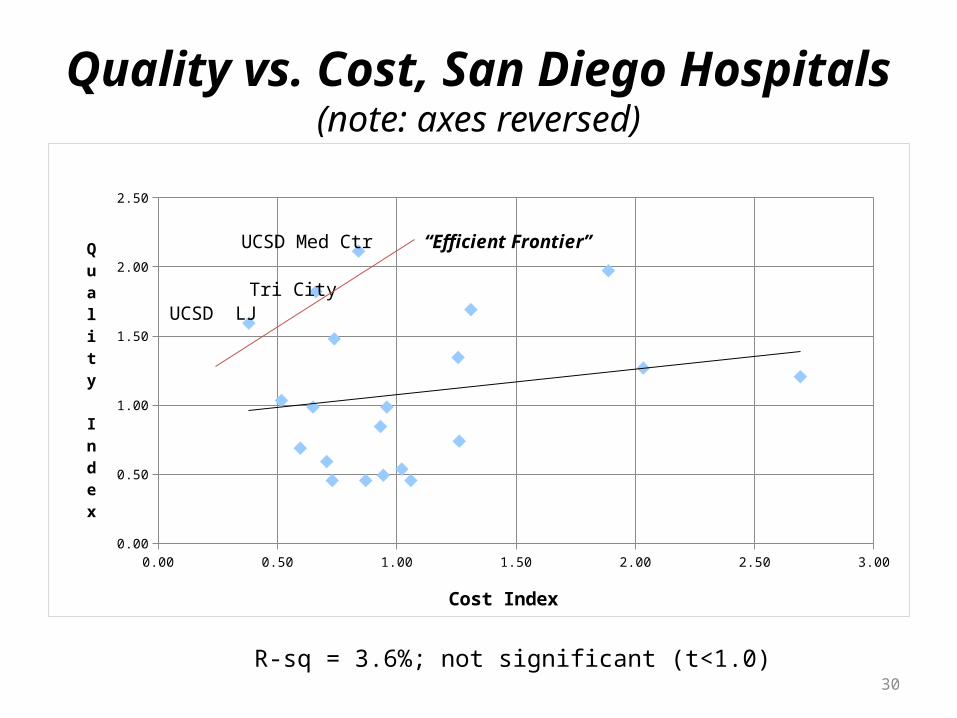
Quality vs. Cost, San Diego Hospitals(note: axes reversed)
0.00 0.50 1.00 1.50 2.00 2.50 3.000.00
0.50
1.00
1.50
2.00
2.50
Cost Index
Quality Index
UCSD Med Ctr
UCSD LJTri City
“Efficient Frontier”
R-sq = 3.6%; not significant (t<1.0)
31
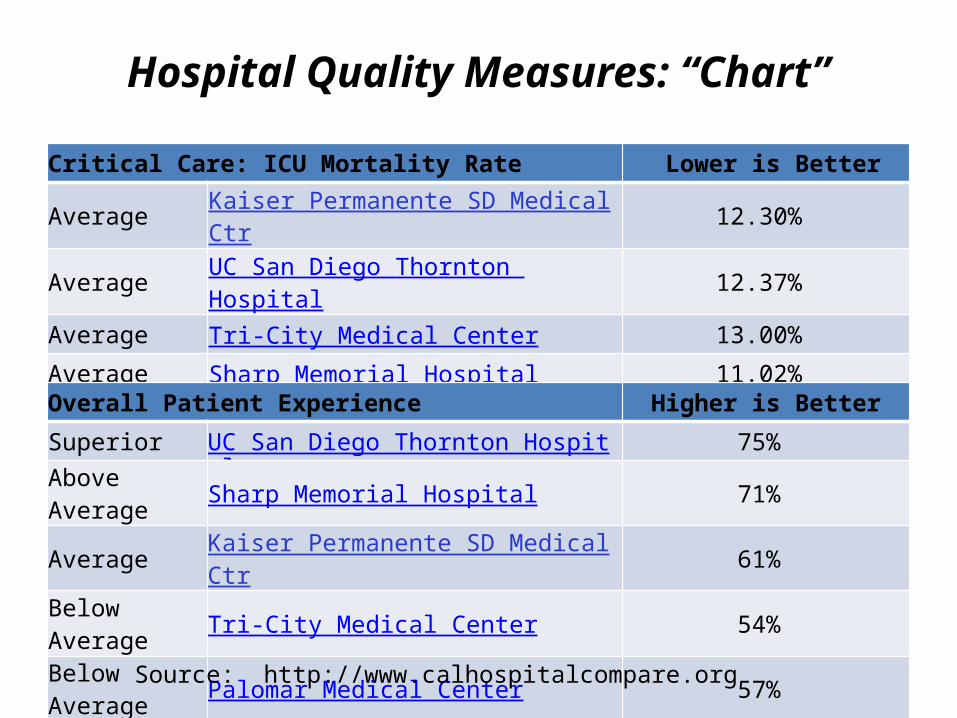
Hospital Quality Measures: “Chart”
Critical Care: ICU Mortality Rate Lower is Better
Average Kaiser Permanente SD Medical Ctr 12.30%
Average UC San Diego Thornton Hospital 12.37%
Average Tri-City Medical Center 13.00%
Average Sharp Memorial Hospital 11.02%
Overall Patient Experience Higher is Better
Superior UC San Diego Thornton Hospital 75%
Above Average Sharp Memorial Hospital 71%
Average Kaiser Permanente SD Medical Ctr 61%
Below Average Tri-City Medical Center 54%
Below Average Palomar Medical Center 57%
Source: http://www.calhospitalcompare.org
33
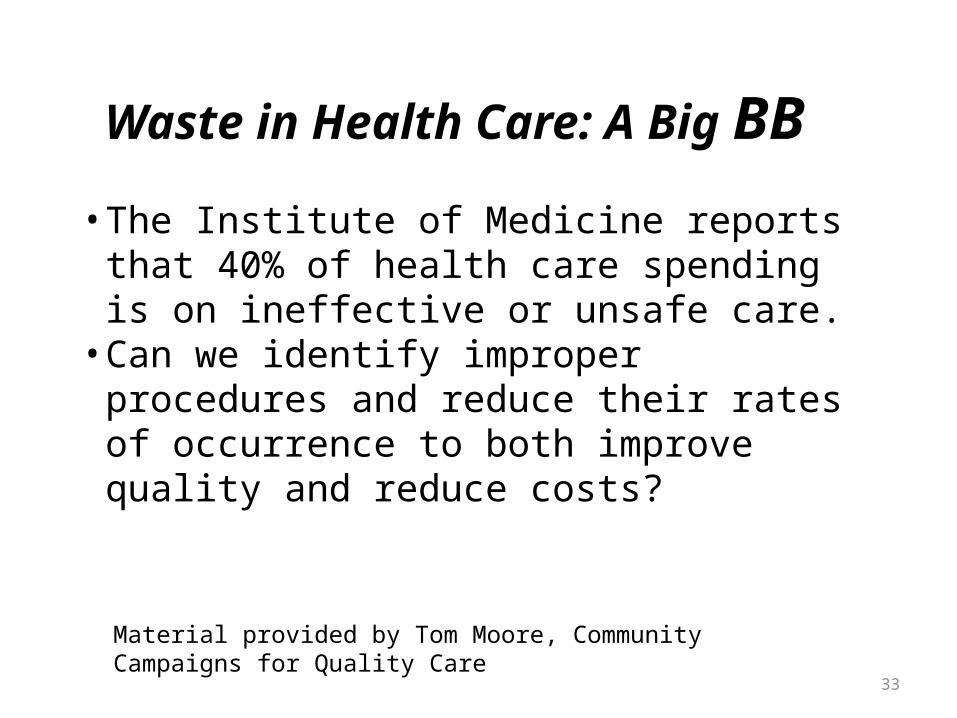
Waste in Health Care: A Big BB
Material provided by Tom Moore, Community Campaigns for Quality Care
• The Institute of Medicine reports that 40% of health care spending is on ineffective or unsafe care.• Can we identify improper procedures and reduce
their rates of occurrence to both improve quality and reduce costs?

34
Potentially Avoidable Complications Analysis
• PAC analysis identifies potentially avoidable complications for common chronic conditions and acute procedures.
• Relies on evidence-based medicine.• PAC identifies under-, over-, and misuse.• Requires fee-for-service claims data.• PAC enables clinical interventions to improve
outcomes and lower costs.• Behavior/practice improvements may necessitate
changes in incentives.
35
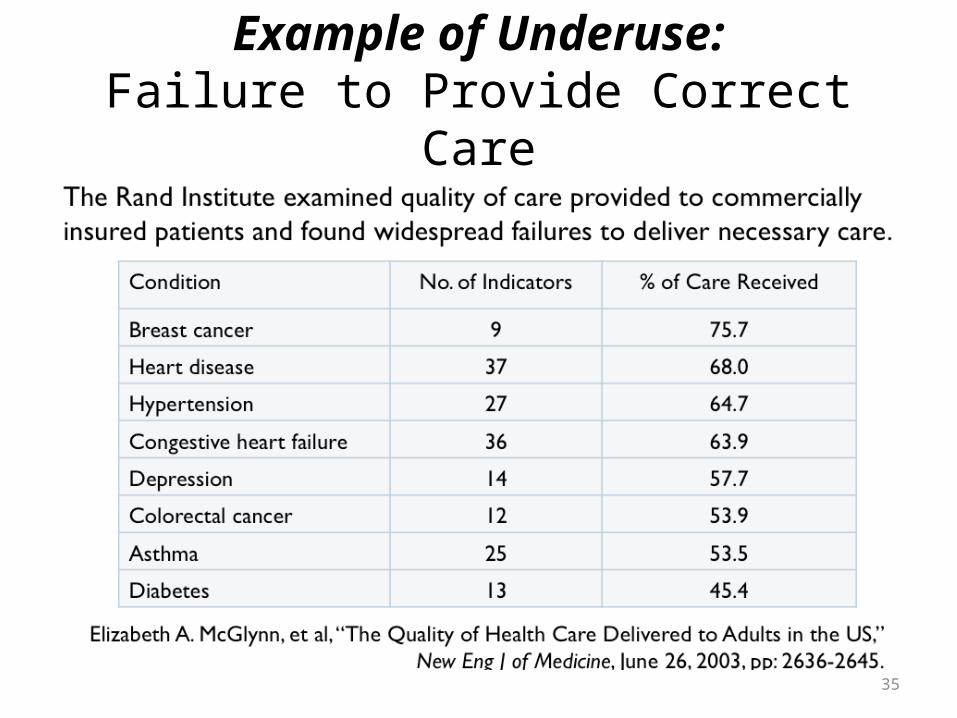
Example of Underuse:Failure to Provide Correct Care
37
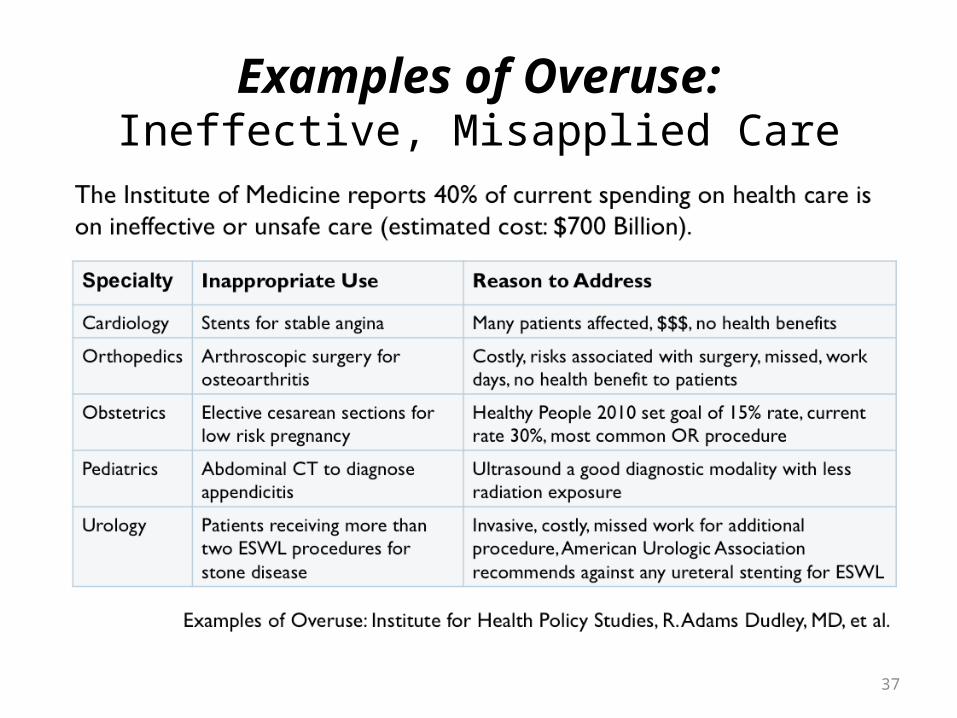
Examples of Overuse:Ineffective, Misapplied Care
38
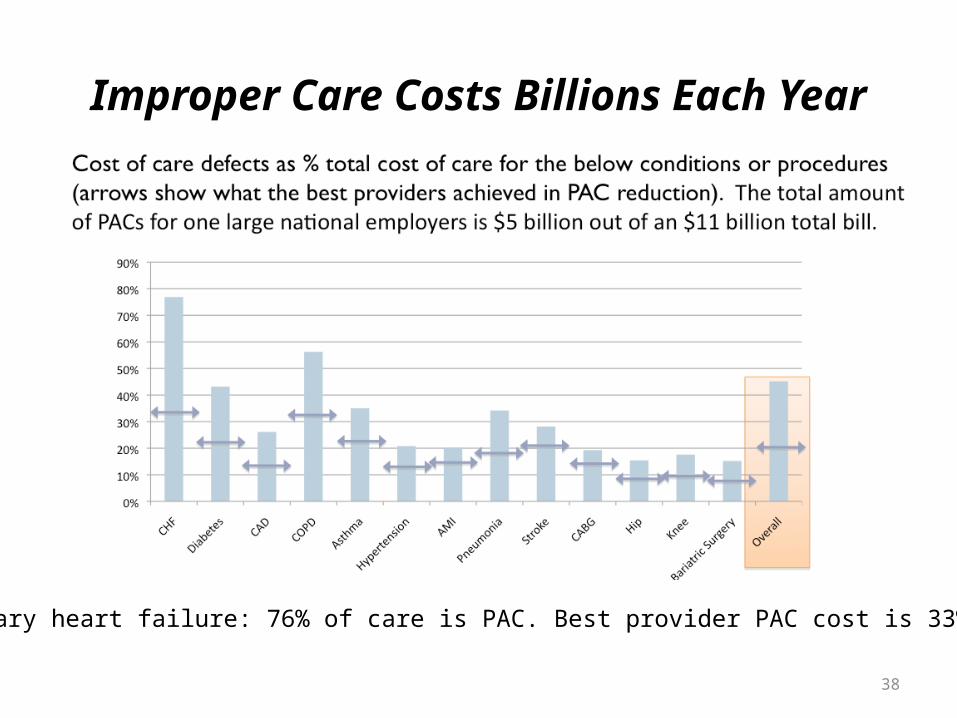
Improper Care Costs Billions Each Year
Coronary heart failure: 76% of care is PAC. Best provider PAC cost is 33%.
39
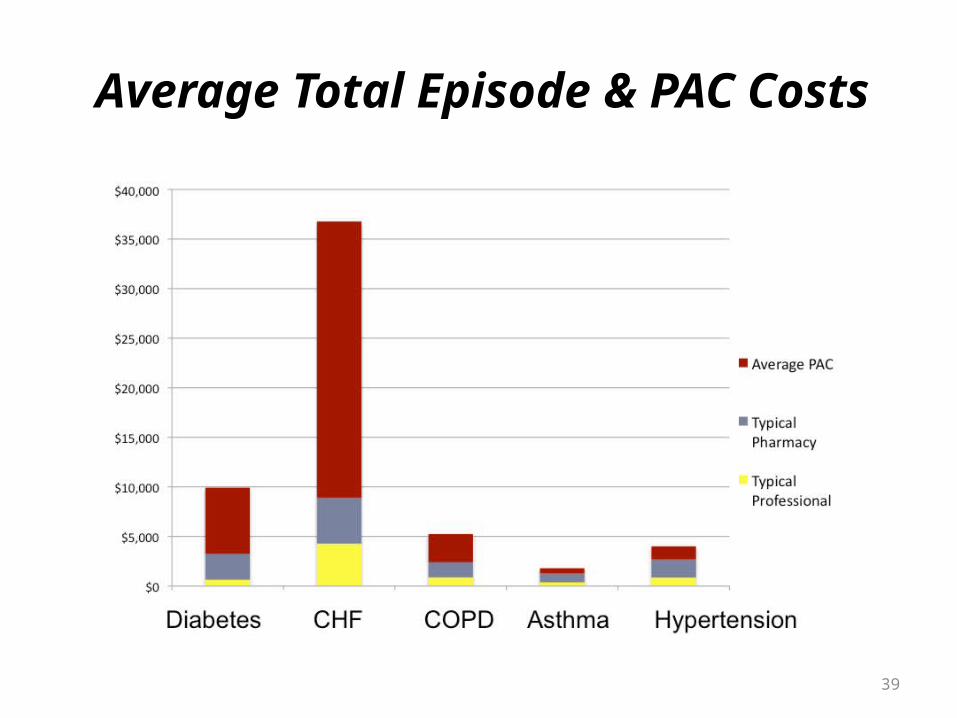
Average Total Episode & PAC Costs

41
Summary• Current U.S. health care system is not sustainable.• Huge variations in quality and cost across providers.• Lack of transparency, understanding, incentives, & competition
contribute substantially to cost.Information on quality & cost difficult to obtain.Patients, and even PCPs, often don’t know best practices.Fee-for-service payment schemes and standard insurance plans discourage
seeking most cost-effective care.Some regions are dominated by a very few providers.
• Waste & errors contribute substantially to unnecessary costs and poor outcomes.
• Care “silos” (as opposed to integrated systems) increase costs and errors, and decrease quality.
• Administrative overhead is unreasonable.
42
What is Needed?
Following are some of the elements needed to reform the U.S. health care system so that it will become sustainable.
• Better transparency of HC cost and quality.• More “skin in the game” by providers & consumers.• Better informed consumers and primary care
physicians.• Modern information, communication, and decision
systems: “Health Information Technology”.
43
Health Information Technology: What is it?
• HIT is “the application of information processing involving both computer hardware and software that deals with the storage, retrieval, sharing, and use of health care information, data, and knowledge for communication and decision making” (Brailer & Thompson, 2004).
• HIT components include:– Electronic medical and health records– E-prescribing and drug interaction knowledge– Communication systems and user interfaces– Decision-support capabilities– Patient education information– Subsystems include nursing, pharmacy, and bio-informatics

44
Benefits & Examples of HIT Systems• Broad and consistent utilization of HIT will:
– Improve health care quality; – Prevent medical errors;– Reduce health care costs; – Increase administrative efficiencies; – Decrease paperwork;
• Interoperable HIT will also provide public health benefits including:– Early detection of infectious disease outbreaks;– Improve tracking of chronic disease mgmt;– Early identification of dangerous drugs and procedures;– Facilitate determination of effective medicine.
• Example systems: Kaiser Health Connect, VA
46
Opportunities for CoBA in HIT
• There is a substantial market for individuals with training in HIT.
• ISOM at CSUSM/CoBA is developing proposals for both certificate & degree programs in HIT.
• Successful HIT systems require professionals with both technical and managerial skills.
• Programs will exploit strengths of CoBA faculty in business and management: HIT applications, data analysis, operations analysis, economics, and HIT system development, implementation, management.