Embed Size (px)
Citation preview
Available online at www.sciencedirect.com
www.elsevier.com/locate/gca
Geochimica et Cosmochimica Acta 73 (2009) 5975–5988
The structure of monomeric and dimeric uranyl adsorptioncomplexes on gibbsite: A combined DFT and EXAFS study
Tatsuya Hattori a,*, Takumi Saito b, Keisuke Ishida a, Andreas C. Scheinost c,Takao Tsuneda d, Shinya Nagasaki b, Satoru Tanaka b
a Department of Quantum Engineering and Systems Science, School of Engineering, The University of Tokyo, 7-3-1 Hongo, Bunkyo-ku,
Tokyo 113-8656, Japanb Nuclear Profession School, School of Engineering, The University of Tokyo, 7-3-1 Hongo, Bunkyo-ku, Tokyo 113-8656, Japan
c Institute of Radiochemistry, Forschungszentrum Dresden-Rossendorf (FZD), Bautzner Landstrabe 400, D-01328 Dresden, Germanyd Department of Applied Chemistry, School of Engineering, The University of Tokyo, 7-3-1 Hongo, Bunkyo-ku, Tokyo 113-8656, Japan
Received 19 November 2008; accepted in revised form 6 July 2009; available online 14 July 2009
Abstract
We investigated the structure of uranyl sorption complexes on gibbsite (pH 5.6–9.7) by two independent methods, densityfunctional theory (DFT) calculations and extended X-ray absorption fine structure (EXAFS) spectroscopy at the U-LIII edge.To model the gibbsite surface with DFT, we tested two Al (hydr)oxide clusters, a dimer and a hexamer. Based on polarization,structure, and relaxation energies during geometry optimization, the hexamer cluster was found to be the more appropriatemodel. An additional advantage of the hexamer model is that it represents both edges and basal faces of gibbsite. The DFTcalculations of (monomeric) uranyl sorption complexes show an energetic preference for the corner-sharing versus the edge-sharing configuration on gibbsite edges. The energy difference is so small, however, that possibly both surface species maycoexist. In contrast to the edge sites, sorption to basal sites was energetically not favorable. EXAFS spectroscopy revealedin all investigated samples the same interatomic distances of the uranyl coordination environment (RU–Oax � 1.80 A,RU–Oeq � 2.40 A), and towards the gibbsite surface (RU–O � 2.87 A, RU–Al � 3.38 A). In addition, two U–U distances wereobserved, 3.92 A at pH 9.7 and 4.30 A at pH 5.6, both with coordination numbers of �1. The short U–U distance is closeto that of the aqueous uranyl hydroxo dimer, UO2(OH)2, reported as 3.875 A in the literature, but significantly longer thanthat of aqueous trimers (3.81–3.82 A), suggesting sorption of uranyl dimers at alkaline pH. The longer U–U distance (4.30 A)at acidic pH, however, is not in line with known aqueous uranyl polymer complexes. Based on the EXAFS findings we furtherrefined dimeric surface complexes with DFT. We propose two structural models: in the acidic region, the observed long U–Udistance can be explained with a distortion of the uranyl dimer to form both a corner-sharing and an edge-sharing linkage toneighboring Al octahedra, leading to RU–U = 4.150 A. In the alkaline region, a corner-sharing uranyl dimer complex is themost favorable. The U–O path at �2.87 A in the EXAFS spectra arises from the oxygen atom linking two Al cations in cor-ner-sharing arrangement. The adsorption structures obtained by DFT calculations are in good agreement with the structuralparameters from EXAFS analysis: U–Al (3.394 A), U–U (3.949 A), and U–O (2.823 A) for the alkaline pH model, and U–Al(3.279 A), U–U (4.150 A), and U–O (2.743 A) for the acidic pH model. This work shows that by combining EXAFS andDFT, consistent structural models for uranyl sorption complexes can be obtained, which are relevant to predict the migrationbehavior of uranium at nuclear facilities.� 2009 Elsevier Ltd. All rights reserved.
0016-7037/$ - see front matter � 2009 Elsevier Ltd. All rights reserved.
doi:10.1016/j.gca.2009.07.004
* Corresponding author. Tel.: +81 3 5841 6970.E-mail address: [email protected] (T. Hattori).
5976 T. Hattori et al. / Geochimica et Cosmochimica Acta 73 (2009) 5975–5988
1. INTRODUCTION
Environmental behavior and mobility of radionuclidesis of great concern for society. Among these radionuclides,uranium constitutes the largest fraction in nuclear waste. Adetailed understanding of the interactions of uranium withvarious geological and biological components is hence nec-essary, in order to assess the long-term safety of nuclearwaste disposals. This knowledge is also important to devel-op effective environmental restoration techniques for areascontaminated by extensive uranium mining and process-ing. A large body of research work exists already on thesorption of the prevalent form of uranium under oxidizingconditions, the hexavalent uranyl U(VI)O2
2+, to a range ofmineral surfaces including silicates, aluminates and iron(hydr)oxide (Turner et al., 1996; Kowal-Fouchard et al.,2004; Baumann et al., 2005; Catalano and Brown, 2005;Ulrich et al., 2006), since these reactions are expected tocontrol the retardation of uranium migration in the envi-ronment. Gibbsite, Al(OH)3, is one of the most abundantnaturally occurring weathering products of aluminum con-taining minerals. Gibbsite is constructed from octahedrallycoordinated Al ions bridged by OH groups, which formlayers where every third cation center remains vacant.The layers are stacked and connected by hydrogen bonds.Gibbsite has distinct surfaces with different OH groups:the basal surface (0 0 1) consists of doubly coordinatedOH groups, l-OH, while the edge surfaces ((1 0 0) andequivalents) have singly coordinated OH groups. Basedon bond valence analysis and multi site ion complexation(MUSIC) modeling, Hiemstra et al. (1996, 1999) suggestedthat adsorption of ions by gibbsite occurs only at the edgesurfaces. Baumann et al. (2005) performed time-resolvedlaser-induced fluorescence spectroscopy (TRLFS) com-bined with batch adsorption experiments to identify twoadsorption species of uranyl with different fluorescence de-cay lifetimes on gibbsite in the presence of atmosphericCO2. Since detailed structural information on the adsorp-tion species cannot be derived by TRLFS, the authorsused previously published extended X-ray absorption finestructure (EXAFS) spectroscopy data of uranyl on c-alu-mina (Al2O3) (Moskaleva et al., 2006; Sylwester et al.,2000) to interpret the two sorption complexes detectedby TRLFS as a bidentate mononuclear inner-sphere sur-face complex at the edge faces predominant at acidic pH,and a polynuclear uranyl surface species predominant atalkaline pH. Chang et al. (2006) extracted even four differ-ent adsorption species of uranyl on gibbsite from theirTRLFS results by using factor analysis and a multivariatecurve resolution technique: two mononuclear inner-sphereadsorption complexes with different degree of hydrolysis,one outer-sphere complex, and a schoepite-like solidphase. Polynuclear uranyl surface complexes at circum-neutral pH values have been observed only rarely, forinstance on amorphous silica (SiO2), c-alumina (Al2O3)(Moskaleva et al., 2006; Sylwester et al., 2000), andhematite (Fe2O3) (Bargar et al., 2000). Although polymericsurface complexes may have a profound influence on sorp-tion and retardation of uranyl, there are almost no reportson the structure of such species.
X-ray absorption spectroscopy (XAS), and particularlyits EXAFS region, is one of the most widely used tech-niques to study sorption complexes, because this techniqueis applicable to systems without long range order. Uranylsorption complexes studied with EXAFS include those onclays (Sylwester et al., 2000; Hennig et al., 2002), calcite (El-zinga et al., 2004), zircon (Lomenech et al., 2003), iron (hy-dr)oxides (Reich et al., 1998; Bargar et al., 2000; Walteret al., 2003; Ulrich et al., 2006), silicate (Reich et al.,1996, 1998; Sylwester et al., 2000), and aluminate (Sylwesteret al., 2000; Froideval et al., 2006). While EXAFS probesinteratomic distances, coordination numbers, and Debye–Waller factors around an absorber atom, one should notforget that the obtained information is only one dimen-sional, i.e. does not contain angular information on the po-sition of the neighboring atoms. Although multiplescattering paths would reveal angular information, theyare with few exceptions too weak to be analyzed. Further-more, the collected EXAFS spectrum may represent a sta-tistical mixture of several species present in the sample.Therefore, it is often not possible to achieve a unique struc-tural solution only by EXAFS spectroscopy, especially insystems containing ternary surface complexes, polymericsorption complexes or even mixtures of sorption complexesand surface precipitates (Bargar et al., 2000; Sylwesteret al., 2000; Arai et al., 2006; Sherman et al., 2008). Thisdisadvantage of EXAFS may be compensated for by quan-tum chemical calculations, which in principle can providemolecular-scale three-dimensional structures. With the re-cent advent of faster computers and more sophisticated the-oretical methods, heavy metal complexes and manyelectron systems in solution and even on surfaces can nowbe treated. More and more theoretical studies have beenused to identify the structure of surface complexes by mod-eling mineral surfaces with molecular dynamics (MD)(Greathouse et al., 2002; Greathouse and Cygan, 2005),periodic boundary condition (PBC) (Steele et al., 2002;Moskaleva et al., 2004), and cluster model calculations(Kubicki and Apitz, 1998; Ladeira et al., 2001; Oliveiraet al., 2006; Sherman et al., 2008). The combination of the-oretical calculations with EXAFS has two main advanta-ges. First, calculated complexes can be verified bycomparing the obtained radial distances and coordinationnumbers with those measured by EXAFS. Second, consid-ering the fact that energy comparison between optimizedstructures is still less accurate, especially for surface reac-tions, EXAFS can provide structural constraints for thequantum chemical calculations. Only a few works havedemonstrated up to now the potential of this combinationof methods for elucidating the structures of surface com-plexes (Ladeira et al., 2001; Sherman et al., 2008).
In the present study, the structures of uranyl(VI) surfacecomplexes on gibbsite were investigated by DFT calcula-tions in parallel with EXAFS spectroscopy. The gibbsitesurface was modeled with Al clusters representing differentsurface sites for uranyl sorption. EXAFS measurementswere performed for sorption samples at pH 5.6 and 9.7.The general objective of this approach was to obtain reli-able structures for the sorption complexes of uranyl ongibbsite.
Uranyl adsorption structures on gibbsite by DFT and EXAFS 5977
2. METHODS
2.1. Theoretical calculations
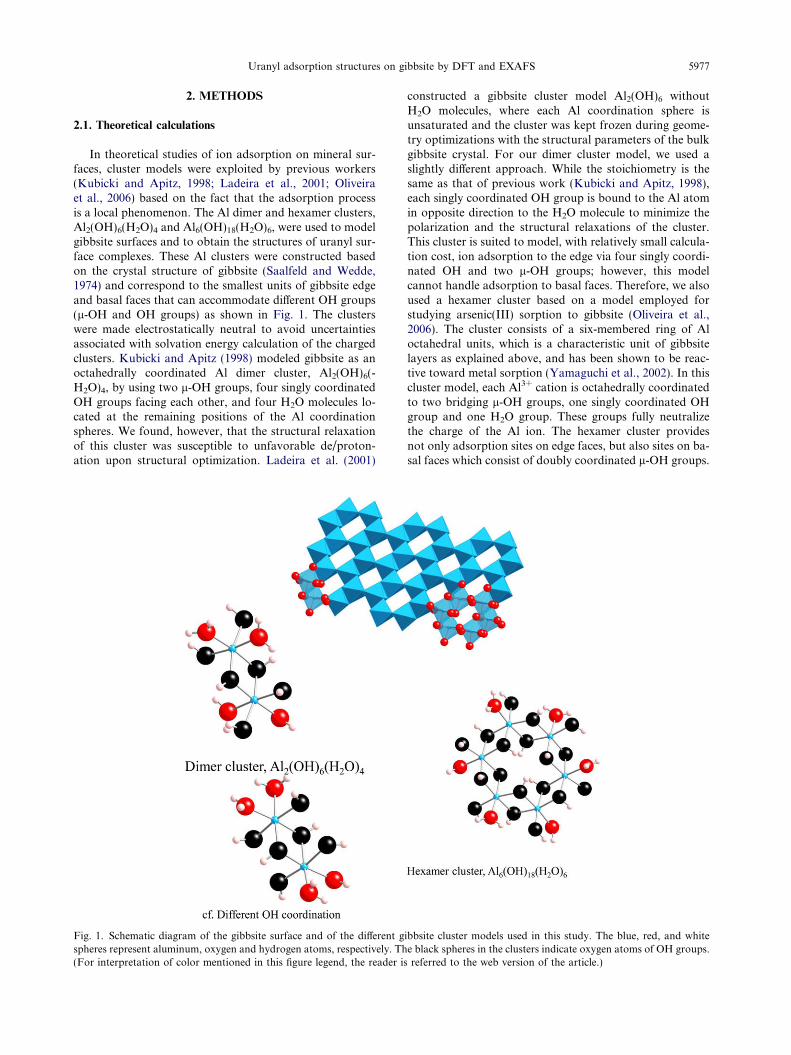
In theoretical studies of ion adsorption on mineral sur-faces, cluster models were exploited by previous workers(Kubicki and Apitz, 1998; Ladeira et al., 2001; Oliveiraet al., 2006) based on the fact that the adsorption processis a local phenomenon. The Al dimer and hexamer clusters,Al2(OH)6(H2O)4 and Al6(OH)18(H2O)6, were used to modelgibbsite surfaces and to obtain the structures of uranyl sur-face complexes. These Al clusters were constructed basedon the crystal structure of gibbsite (Saalfeld and Wedde,1974) and correspond to the smallest units of gibbsite edgeand basal faces that can accommodate different OH groups(l-OH and OH groups) as shown in Fig. 1. The clusterswere made electrostatically neutral to avoid uncertaintiesassociated with solvation energy calculation of the chargedclusters. Kubicki and Apitz (1998) modeled gibbsite as anoctahedrally coordinated Al dimer cluster, Al2(OH)6(-H2O)4, by using two l-OH groups, four singly coordinatedOH groups facing each other, and four H2O molecules lo-cated at the remaining positions of the Al coordinationspheres. We found, however, that the structural relaxationof this cluster was susceptible to unfavorable de/proton-ation upon structural optimization. Ladeira et al. (2001)
Fig. 1. Schematic diagram of the gibbsite surface and of the different gspheres represent aluminum, oxygen and hydrogen atoms, respectively. Th(For interpretation of color mentioned in this figure legend, the reader i
constructed a gibbsite cluster model Al2(OH)6 withoutH2O molecules, where each Al coordination sphere isunsaturated and the cluster was kept frozen during geome-try optimizations with the structural parameters of the bulkgibbsite crystal. For our dimer cluster model, we used aslightly different approach. While the stoichiometry is thesame as that of previous work (Kubicki and Apitz, 1998),each singly coordinated OH group is bound to the Al atomin opposite direction to the H2O molecule to minimize thepolarization and the structural relaxations of the cluster.This cluster is suited to model, with relatively small calcula-tion cost, ion adsorption to the edge via four singly coordi-nated OH and two l-OH groups; however, this modelcannot handle adsorption to basal faces. Therefore, we alsoused a hexamer cluster based on a model employed forstudying arsenic(III) sorption to gibbsite (Oliveira et al.,2006). The cluster consists of a six-membered ring of Aloctahedral units, which is a characteristic unit of gibbsitelayers as explained above, and has been shown to be reac-tive toward metal sorption (Yamaguchi et al., 2002). In thiscluster model, each Al3+ cation is octahedrally coordinatedto two bridging l-OH groups, one singly coordinated OHgroup and one H2O group. These groups fully neutralizethe charge of the Al ion. The hexamer cluster providesnot only adsorption sites on edge faces, but also sites on ba-sal faces which consist of doubly coordinated l-OH groups.
ibbsite cluster models used in this study. The blue, red, and whitee black spheres in the clusters indicate oxygen atoms of OH groups.
s referred to the web version of the article.)
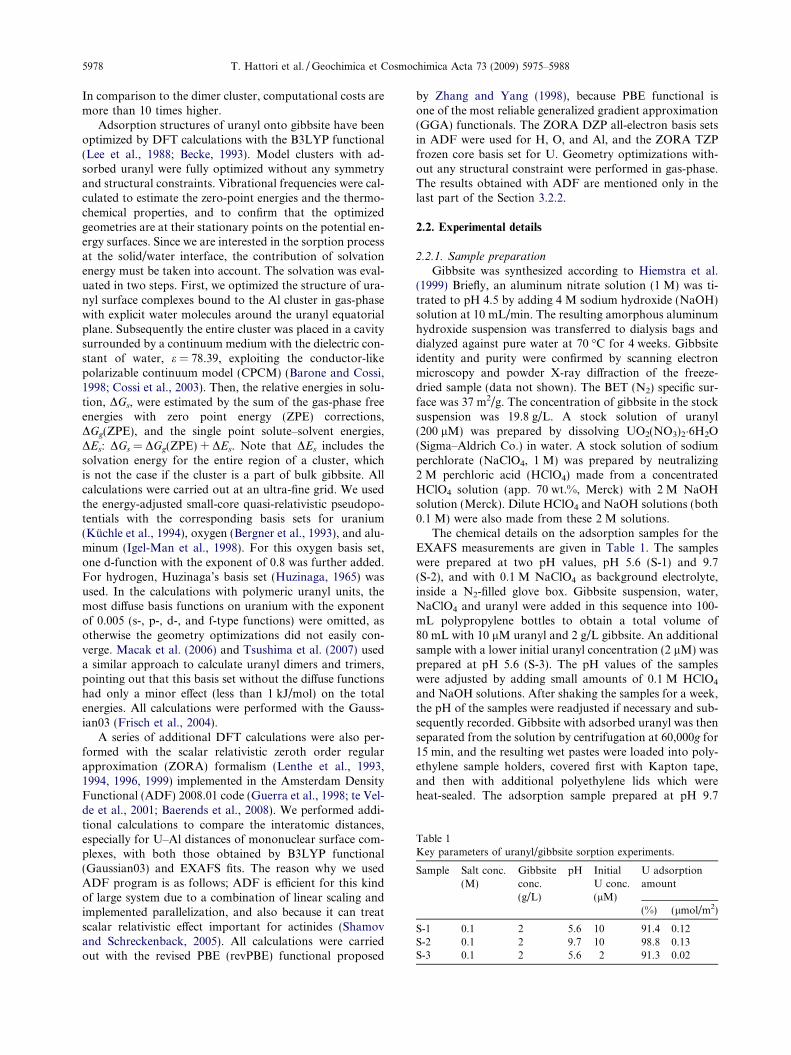
Table 1Key parameters of uranyl/gibbsite sorption experiments.
Sample Salt conc.(M)
Gibbsiteconc.(g/L)
pH InitialU conc.(lM)
U adsorptionamount
(%) (lmol/m2)
S-1 0.1 2 5.6 10 91.4 0.12S-2 0.1 2 9.7 10 98.8 0.13S-3 0.1 2 5.6 2 91.3 0.02
5978 T. Hattori et al. / Geochimica et Cosmochimica Acta 73 (2009) 5975–5988
In comparison to the dimer cluster, computational costs aremore than 10 times higher.
Adsorption structures of uranyl onto gibbsite have beenoptimized by DFT calculations with the B3LYP functional(Lee et al., 1988; Becke, 1993). Model clusters with ad-sorbed uranyl were fully optimized without any symmetryand structural constraints. Vibrational frequencies were cal-culated to estimate the zero-point energies and the thermo-chemical properties, and to confirm that the optimizedgeometries are at their stationary points on the potential en-ergy surfaces. Since we are interested in the sorption processat the solid/water interface, the contribution of solvationenergy must be taken into account. The solvation was eval-uated in two steps. First, we optimized the structure of ura-nyl surface complexes bound to the Al cluster in gas-phasewith explicit water molecules around the uranyl equatorialplane. Subsequently the entire cluster was placed in a cavitysurrounded by a continuum medium with the dielectric con-stant of water, e = 78.39, exploiting the conductor-likepolarizable continuum model (CPCM) (Barone and Cossi,1998; Cossi et al., 2003). Then, the relative energies in solu-tion, DGs, were estimated by the sum of the gas-phase freeenergies with zero point energy (ZPE) corrections,DGg(ZPE), and the single point solute–solvent energies,DEs: DGs = DGg(ZPE) + DEs. Note that DEs includes thesolvation energy for the entire region of a cluster, whichis not the case if the cluster is a part of bulk gibbsite. Allcalculations were carried out at an ultra-fine grid. We usedthe energy-adjusted small-core quasi-relativistic pseudopo-tentials with the corresponding basis sets for uranium(Kuchle et al., 1994), oxygen (Bergner et al., 1993), and alu-minum (Igel-Man et al., 1998). For this oxygen basis set,one d-function with the exponent of 0.8 was further added.For hydrogen, Huzinaga’s basis set (Huzinaga, 1965) wasused. In the calculations with polymeric uranyl units, themost diffuse basis functions on uranium with the exponentof 0.005 (s-, p-, d-, and f-type functions) were omitted, asotherwise the geometry optimizations did not easily con-verge. Macak et al. (2006) and Tsushima et al. (2007) useda similar approach to calculate uranyl dimers and trimers,pointing out that this basis set without the diffuse functionshad only a minor effect (less than 1 kJ/mol) on the totalenergies. All calculations were performed with the Gauss-ian03 (Frisch et al., 2004).
A series of additional DFT calculations were also per-formed with the scalar relativistic zeroth order regularapproximation (ZORA) formalism (Lenthe et al., 1993,1994, 1996, 1999) implemented in the Amsterdam DensityFunctional (ADF) 2008.01 code (Guerra et al., 1998; te Vel-de et al., 2001; Baerends et al., 2008). We performed addi-tional calculations to compare the interatomic distances,especially for U–Al distances of mononuclear surface com-plexes, with both those obtained by B3LYP functional(Gaussian03) and EXAFS fits. The reason why we usedADF program is as follows; ADF is efficient for this kindof large system due to a combination of linear scaling andimplemented parallelization, and also because it can treatscalar relativistic effect important for actinides (Shamovand Schreckenback, 2005). All calculations were carriedout with the revised PBE (revPBE) functional proposed
by Zhang and Yang (1998), because PBE functional isone of the most reliable generalized gradient approximation(GGA) functionals. The ZORA DZP all-electron basis setsin ADF were used for H, O, and Al, and the ZORA TZPfrozen core basis set for U. Geometry optimizations with-out any structural constraint were performed in gas-phase.The results obtained with ADF are mentioned only in thelast part of the Section 3.2.2.
2.2. Experimental details
2.2.1. Sample preparation
Gibbsite was synthesized according to Hiemstra et al.(1999) Briefly, an aluminum nitrate solution (1 M) was ti-trated to pH 4.5 by adding 4 M sodium hydroxide (NaOH)solution at 10 mL/min. The resulting amorphous aluminumhydroxide suspension was transferred to dialysis bags anddialyzed against pure water at 70 �C for 4 weeks. Gibbsiteidentity and purity were confirmed by scanning electronmicroscopy and powder X-ray diffraction of the freeze-dried sample (data not shown). The BET (N2) specific sur-face was 37 m2/g. The concentration of gibbsite in the stocksuspension was 19.8 g/L. A stock solution of uranyl(200 lM) was prepared by dissolving UO2(NO3)2�6H2O(Sigma–Aldrich Co.) in water. A stock solution of sodiumperchlorate (NaClO4, 1 M) was prepared by neutralizing2 M perchloric acid (HClO4) made from a concentratedHClO4 solution (app. 70 wt.%, Merck) with 2 M NaOHsolution (Merck). Dilute HClO4 and NaOH solutions (both0.1 M) were also made from these 2 M solutions.
The chemical details on the adsorption samples for theEXAFS measurements are given in Table 1. The sampleswere prepared at two pH values, pH 5.6 (S-1) and 9.7(S-2), and with 0.1 M NaClO4 as background electrolyte,inside a N2-filled glove box. Gibbsite suspension, water,NaClO4 and uranyl were added in this sequence into 100-mL polypropylene bottles to obtain a total volume of80 mL with 10 lM uranyl and 2 g/L gibbsite. An additionalsample with a lower initial uranyl concentration (2 lM) wasprepared at pH 5.6 (S-3). The pH values of the sampleswere adjusted by adding small amounts of 0.1 M HClO4
and NaOH solutions. After shaking the samples for a week,the pH of the samples were readjusted if necessary and sub-sequently recorded. Gibbsite with adsorbed uranyl was thenseparated from the solution by centrifugation at 60,000g for15 min, and the resulting wet pastes were loaded into poly-ethylene sample holders, covered first with Kapton tape,and then with additional polyethylene lids which wereheat-sealed. The adsorption sample prepared at pH 9.7
Uranyl adsorption structures on gibbsite by DFT and EXAFS 5979
(S-2) was transported to the synchrotron facility using aspecial container filled with N2 gas to inhibit carbonate dif-fusion. The concentration of uranyl in the supernatants wasmeasured by ICP-MS (ELAN 9000, PerkinElmer Inc.), andthe uranyl adsorption amounts were calculated from thedifference between initial and final solution concentrations(Table 1).
2.2.2. EXAFS measurements
The EXAFS measurements were carried out on the Ros-sendorf Beamline (BM20) at the European SynchrotronRadiation Facility (ESRF) in Grenoble (France), using aSi(1 1 1) double monochromator and two Pt-coated mirrorsbefore and after the monochromator for collimation andrejection of higher harmonics. Photon flux on the sampleswas about 1011 ph/s. Uranium LIII-edge spectra were col-lected in fluorescence mode using a solid-state 13-elementGe fluorescence detector (Canberra Corp.) with digital sig-nal processing (XIA, Hayward, CA). For energy calibrationthe adsorption edge of a Y metal foil was simultaneouslymeasured using Ar-filled ionization chambers (the firstinflection point assigned to 17,038 eV). For conversion intok-space, the threshold energy of the uranium LIII-edge wasdefined as the first inflection point of the edge. The sampleswere measured at 15 K using a helium-filled closed-cyclecryostat (CryoVac, Troisdorf) to reduce thermal contribu-tions to the Debye–Waller factors (r2) and to improve thesignal-to-noise (S/N) ratio. Eight to 24 scans were accumu-lated for each sample, and then averaged. Fluorescence
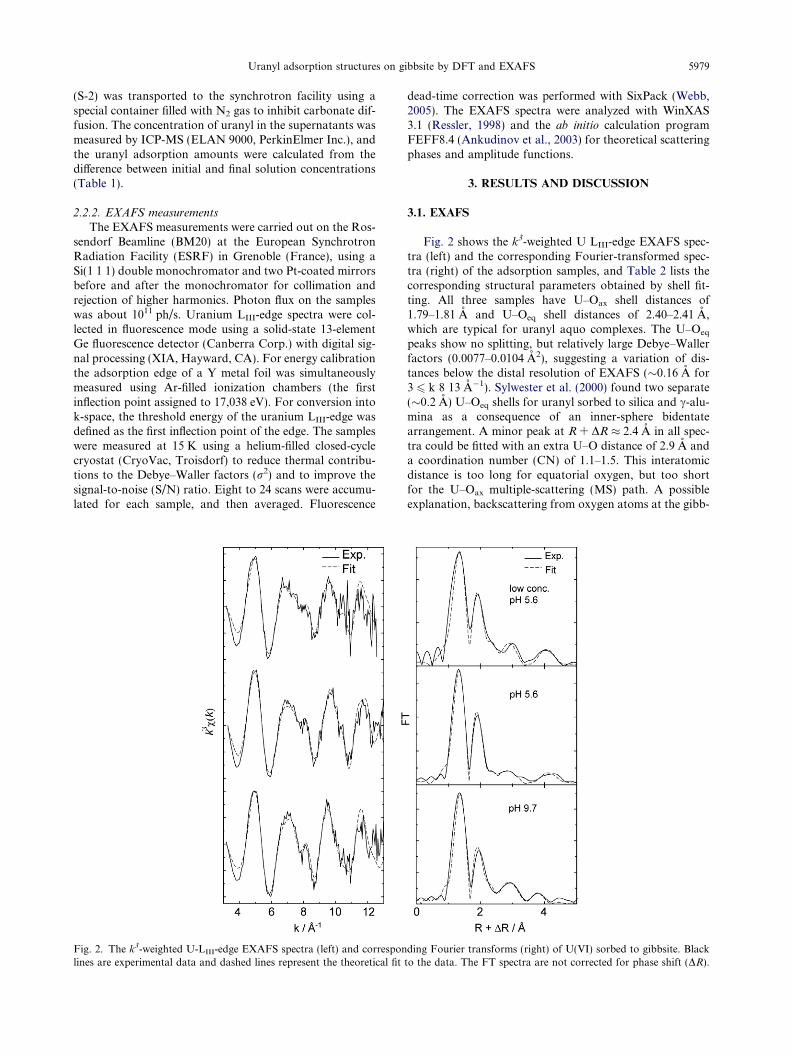
Fig. 2. The k3-weighted U-LIII-edge EXAFS spectra (left) and corresponlines are experimental data and dashed lines represent the theoretical fit
dead-time correction was performed with SixPack (Webb,2005). The EXAFS spectra were analyzed with WinXAS3.1 (Ressler, 1998) and the ab initio calculation programFEFF8.4 (Ankudinov et al., 2003) for theoretical scatteringphases and amplitude functions.
3. RESULTS AND DISCUSSION
3.1. EXAFS
Fig. 2 shows the k3-weighted U LIII-edge EXAFS spec-tra (left) and the corresponding Fourier-transformed spec-tra (right) of the adsorption samples, and Table 2 lists thecorresponding structural parameters obtained by shell fit-ting. All three samples have U–Oax shell distances of1.79–1.81 A and U–Oeq shell distances of 2.40–2.41 A,which are typical for uranyl aquo complexes. The U–Oeq
peaks show no splitting, but relatively large Debye–Wallerfactors (0.0077–0.0104 A2), suggesting a variation of dis-tances below the distal resolution of EXAFS (�0.16 A for3 6 k 8 13 A�1). Sylwester et al. (2000) found two separate(�0.2 A) U–Oeq shells for uranyl sorbed to silica and c-alu-mina as a consequence of an inner-sphere bidentatearrangement. A minor peak at R + DR � 2.4 A in all spec-tra could be fitted with an extra U–O distance of 2.9 A anda coordination number (CN) of 1.1–1.5. This interatomicdistance is too long for equatorial oxygen, but too shortfor the U–Oax multiple-scattering (MS) path. A possibleexplanation, backscattering from oxygen atoms at the gibb-
ding Fourier transforms (right) of U(VI) sorbed to gibbsite. Blackto the data. The FT spectra are not corrected for phase shift (DR).
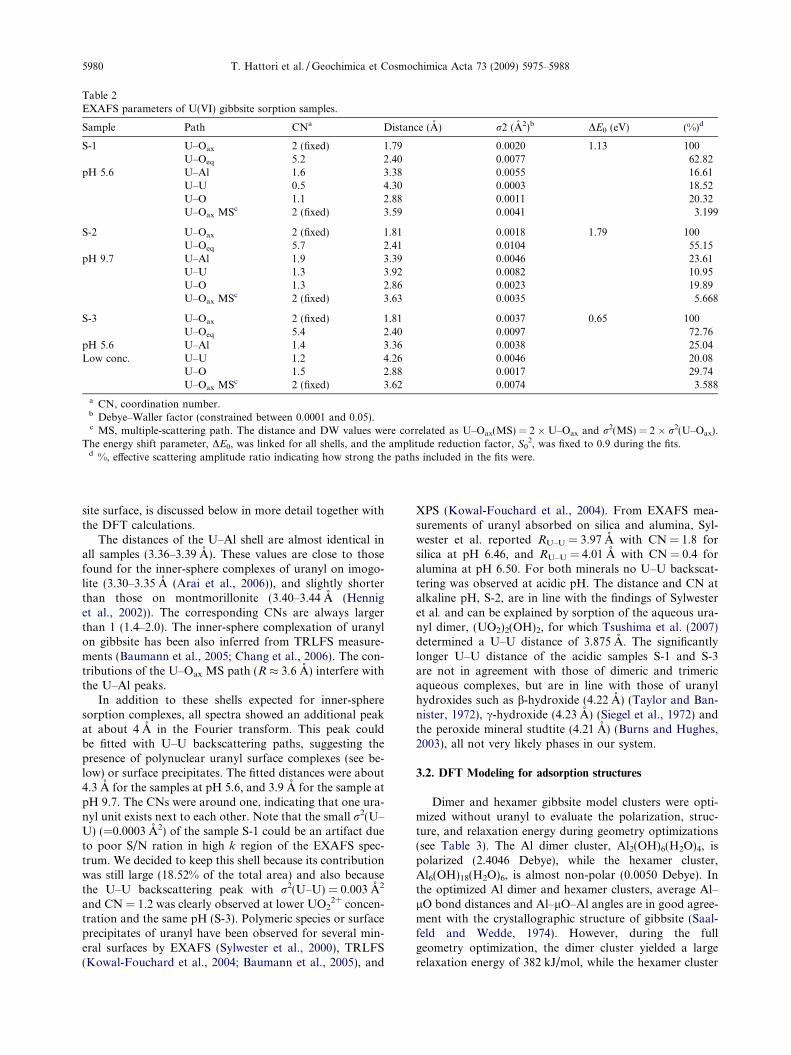
Table 2EXAFS parameters of U(VI) gibbsite sorption samples.
Sample Path CNa Distance (A) r2 (A2)b DE0 (eV) (%)d
S-1 U–Oax 2 (fixed) 1.79 0.0020 1.13 100U–Oeq 5.2 2.40 0.0077 62.82
pH 5.6 U–Al 1.6 3.38 0.0055 16.61U–U 0.5 4.30 0.0003 18.52U–O 1.1 2.88 0.0011 20.32U–Oax MSc 2 (fixed) 3.59 0.0041 3.199
S-2 U–Oax 2 (fixed) 1.81 0.0018 1.79 100U–Oeq 5.7 2.41 0.0104 55.15
pH 9.7 U–Al 1.9 3.39 0.0046 23.61U–U 1.3 3.92 0.0082 10.95U–O 1.3 2.86 0.0023 19.89U–Oax MSc 2 (fixed) 3.63 0.0035 5.668
S-3 U–Oax 2 (fixed) 1.81 0.0037 0.65 100U–Oeq 5.4 2.40 0.0097 72.76
pH 5.6 U–Al 1.4 3.36 0.0038 25.04Low conc. U–U 1.2 4.26 0.0046 20.08
U–O 1.5 2.88 0.0017 29.74U–Oax MSc 2 (fixed) 3.62 0.0074 3.588
a CN, coordination number.b Debye–Waller factor (constrained between 0.0001 and 0.05).c MS, multiple-scattering path. The distance and DW values were correlated as U–Oax(MS) = 2 � U–Oax and r2(MS) = 2 � r2(U–Oax).
The energy shift parameter, DE0, was linked for all shells, and the amplitude reduction factor, S02, was fixed to 0.9 during the fits.
d %, effective scattering amplitude ratio indicating how strong the paths included in the fits were.
5980 T. Hattori et al. / Geochimica et Cosmochimica Acta 73 (2009) 5975–5988
site surface, is discussed below in more detail together withthe DFT calculations.
The distances of the U–Al shell are almost identical inall samples (3.36–3.39 A). These values are close to thosefound for the inner-sphere complexes of uranyl on imogo-lite (3.30–3.35 A (Arai et al., 2006)), and slightly shorterthan those on montmorillonite (3.40–3.44 A (Henniget al., 2002)). The corresponding CNs are always largerthan 1 (1.4–2.0). The inner-sphere complexation of uranylon gibbsite has been also inferred from TRLFS measure-ments (Baumann et al., 2005; Chang et al., 2006). The con-tributions of the U–Oax MS path (R � 3.6 A) interfere withthe U–Al peaks.
In addition to these shells expected for inner-spheresorption complexes, all spectra showed an additional peakat about 4 A in the Fourier transform. This peak couldbe fitted with U–U backscattering paths, suggesting thepresence of polynuclear uranyl surface complexes (see be-low) or surface precipitates. The fitted distances were about4.3 A for the samples at pH 5.6, and 3.9 A for the sample atpH 9.7. The CNs were around one, indicating that one ura-nyl unit exists next to each other. Note that the small r2(U–U) (=0.0003 A2) of the sample S-1 could be an artifact dueto poor S/N ration in high k region of the EXAFS spec-trum. We decided to keep this shell because its contributionwas still large (18.52% of the total area) and also becausethe U–U backscattering peak with r2(U–U) = 0.003 A2
and CN = 1.2 was clearly observed at lower UO22+ concen-
tration and the same pH (S-3). Polymeric species or surfaceprecipitates of uranyl have been observed for several min-eral surfaces by EXAFS (Sylwester et al., 2000), TRLFS(Kowal-Fouchard et al., 2004; Baumann et al., 2005), and
XPS (Kowal-Fouchard et al., 2004). From EXAFS mea-surements of uranyl absorbed on silica and alumina, Syl-wester et al. reported RU–U = 3.97 A with CN = 1.8 forsilica at pH 6.46, and RU–U = 4.01 A with CN = 0.4 foralumina at pH 6.50. For both minerals no U–U backscat-tering was observed at acidic pH. The distance and CN atalkaline pH, S-2, are in line with the findings of Sylwesteret al. and can be explained by sorption of the aqueous ura-nyl dimer, (UO2)2(OH)2, for which Tsushima et al. (2007)determined a U–U distance of 3.875 A. The significantlylonger U–U distance of the acidic samples S-1 and S-3are not in agreement with those of dimeric and trimericaqueous complexes, but are in line with those of uranylhydroxides such as b-hydroxide (4.22 A) (Taylor and Ban-nister, 1972), c-hydroxide (4.23 A) (Siegel et al., 1972) andthe peroxide mineral studtite (4.21 A) (Burns and Hughes,2003), all not very likely phases in our system.
3.2. DFT Modeling for adsorption structures
Dimer and hexamer gibbsite model clusters were opti-mized without uranyl to evaluate the polarization, struc-ture, and relaxation energy during geometry optimizations(see Table 3). The Al dimer cluster, Al2(OH)6(H2O)4, ispolarized (2.4046 Debye), while the hexamer cluster,Al6(OH)18(H2O)6, is almost non-polar (0.0050 Debye). Inthe optimized Al dimer and hexamer clusters, average Al–lO bond distances and Al–lO–Al angles are in good agree-ment with the crystallographic structure of gibbsite (Saal-feld and Wedde, 1974). However, during the fullgeometry optimization, the dimer cluster yielded a largerelaxation energy of 382 kJ/mol, while the hexamer cluster
Table 3The DFT optimized parameters for the Al dimer and hexamerclusters without uranyl.
Dimer cluster Hexamer cluster
Stoichiometry Al2(OH)6(H2O)4 Al6(OH)18(H2O)6
Dipole moment (Debye) 2.4046 0.0050Relaxation energy (kJ/mol) �383 �35Bond distance: dAl–O (A)a 1.91 1.93Bond angle: Al–lO–Al (�)a 98.9 99.8Adsorption face Edge Edge, basal
a Average experimental crystal values (Saalfeld and Wedde, 1974)of the bond distance and angle are 1.92 A, 99.2�, respectively.
Fig. 3. Optimized structures of mononuclear uranyl adsorbed tothe basal plane of the Al hexamer cluster.
Uranyl adsorption structures on gibbsite by DFT and EXAFS 5981
had only about one tenth of that value (35 kJ/mol). Thisindicates that OH and H2O groups coordinated to Al3+
are structurally flexible in the dimer cluster, while the hex-amer cluster is more rigid and therefore more appropriateas model for the gibbsite surface. Since the dimer clusteris also restricted to representing solely edge sites, only re-sults using the hexamer cluster are presented from here on.
3.2.1. Mononuclear surface complexes on basal faces
The adsorption of uranyl to gibbsite was modeled withthe Al hexamer cluster by keeping a five-fold coordinationaround the uranyl moiety (Thompson et al., 1997; Farkaset al., 2000; Hay et al., 2000; Tsushima and Suzuki, 2000;Moskaleva et al., 2004). We first considered mononuclearuranyl adsorption on basal faces. In this case, the l-OHgroups inevitably have to release their protons to interactwith the uranyl cation. Fig. 3 shows the optimized basaladsorption model with two deprotonated l-OH groups.
Table 4Optimized bond distances in A, and angle in degrees. The subscripts of Ooxygen of the gibbsite model cluster coordinated to uranyl, respectivelcomparison.
U–Oax U–Ow
Basal adsorption 1.838, 1.846 2.649, 2.759, 2.736EXAFS (S-1) 1.79 2.40
The optimized structural parameters for this basal adsorp-tion model are presented in Table 4. The uranyl moiety isbent in comparison to the linear free aquo complex.Although the uranyl ion is characterized with its lineargeometry and strong chemical bond, there are some exper-imental indications that the uranyl is bent due to complex-ation: by single-crystal X-ray methods Alcock and Esperas(1977) showed that uranyl bond angle, Oax–U–Oax, in ura-nyl diperchlorate heptahydrate, UO2[ClO4]2�7H2O, was161�, and by Raman spectroscopy Fujii et al. (2001) men-tioned that the bending angle of unrayl in (UO2)2(OH2)2+
changed according to Raman activity. Because the symmet-ric stretch of the uranyl linear ion should be only one in Ra-man spectra if the uranyl ion is linear. By theoreticalcalculations, Tsushima et al. (2007) confirmed that uranylions were bent at around 170� in hydrolysis products suchas (UO2)2(OH)2
2+ and (UO2)3(OH)5+. The Oax–U–Oax an-
gle of 144.2� indicates a more drastic bent geometry, sug-gesting a large steric hindrance around the adsorptionsites. The calculated U–Al distance in this basal adsorptionmodel is much shorter than the distance obtained by EX-AFS, and would increase the cation–cation electrostaticrepulsion unreasonably. The DFT calculations hence sug-gest that the adsorption of uranyl on basal faces is unlikely,even if the inactive l-OH groups would deprotonate at highpH (Hiemstra et al., 1999). This result is in line with previ-ous experimental evidence (Hiemstra et al., 1989, 1996,1999; Baumann et al., 2005).
3.2.2. Mononuclear surface complexes on edge faces
We next evaluated mononuclear uranyl adsorption onedge faces. We considered both corner-sharing (CS) andedge-sharing (ES) arrangements. For the edge-sharingarrangement, two different adsorption geometries have tobe considered, one with two singly coordinated OH groups(ES1 in Fig. 4) and the other with one singly coordinatedOH group and one deprotonated l-OH group (ES2 inFig. 4). Fig. 4 and Table 5 show the optimized structuresand relative energies of the edge adsorption models. Theuranyl moieties for all models are bent (�165�), but notas strong as with the basal adsorption model. In the caseof the CS model, one equatorial H2O molecule was releasedduring geometry optimizations into the hydration sphere.The angle of Ogi–U–Ogi in this model is 112.5�, which is sig-nificantly larger than the ES1 model (60.9�). Due to thishigh chelate angle, one of the equatorial H2O molecules dis-sociated to form hydrogen bonds. In fact, the CS modelwith 4 equatorial coordination was 11.5 kJ/mol more stablethan its corresponding model with 5 equatorial coordina-tion, a value close to the typical hydrogen bonding energy.Based on the relative energies of the three adsorption mod-
ax, Ow and Ogi denote axial oxygen, oxygen of water molecules, andy. The values from EXAFS analysis at pH 5.6 are also listed for
U–Ogi U–Al Oax–U–Oax
2.207, 2.145 3.061 144.2– 3.38
CS
ES1
ES2
2.929 Å
42.3 kJ/mol
15.8 kJ/mol
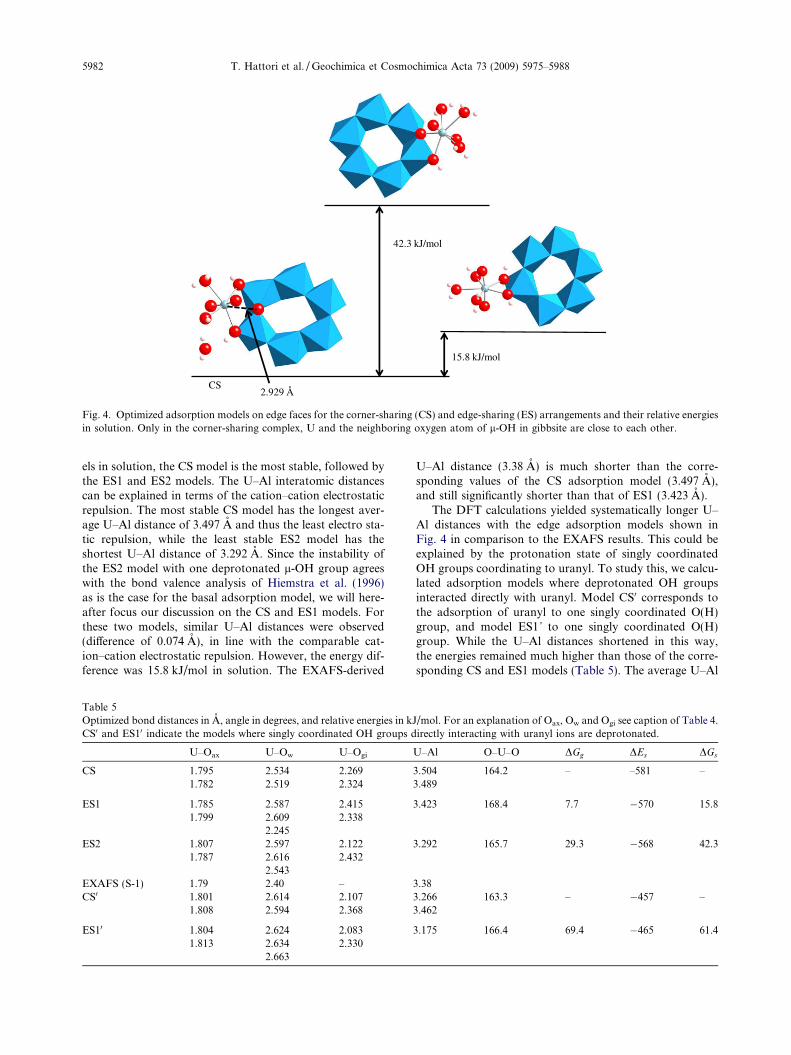
Fig. 4. Optimized adsorption models on edge faces for the corner-sharing (CS) and edge-sharing (ES) arrangements and their relative energiesin solution. Only in the corner-sharing complex, U and the neighboring oxygen atom of l-OH in gibbsite are close to each other.
5982 T. Hattori et al. / Geochimica et Cosmochimica Acta 73 (2009) 5975–5988
els in solution, the CS model is the most stable, followed bythe ES1 and ES2 models. The U–Al interatomic distancescan be explained in terms of the cation–cation electrostaticrepulsion. The most stable CS model has the longest aver-age U–Al distance of 3.497 A and thus the least electro sta-tic repulsion, while the least stable ES2 model has theshortest U–Al distance of 3.292 A. Since the instability ofthe ES2 model with one deprotonated l-OH group agreeswith the bond valence analysis of Hiemstra et al. (1996)as is the case for the basal adsorption model, we will here-after focus our discussion on the CS and ES1 models. Forthese two models, similar U–Al distances were observed(difference of 0.074 A), in line with the comparable cat-ion–cation electrostatic repulsion. However, the energy dif-ference was 15.8 kJ/mol in solution. The EXAFS-derived
Table 5Optimized bond distances in A, angle in degrees, and relative energies in kJCS0 and ES10 indicate the models where singly coordinated OH groups d
U–Oax U–Ow U–Ogi
CS 1.795 2.534 2.2691.782 2.519 2.324
ES1 1.785 2.587 2.4151.799 2.609 2.338
2.245ES2 1.807 2.597 2.122
1.787 2.616 2.4322.543
EXAFS (S-1) 1.79 2.40 –CS0 1.801 2.614 2.107
1.808 2.594 2.368
ES10 1.804 2.624 2.0831.813 2.634 2.330
2.663
U–Al distance (3.38 A) is much shorter than the corre-sponding values of the CS adsorption model (3.497 A),and still significantly shorter than that of ES1 (3.423 A).
The DFT calculations yielded systematically longer U–Al distances with the edge adsorption models shown inFig. 4 in comparison to the EXAFS results. This could beexplained by the protonation state of singly coordinatedOH groups coordinating to uranyl. To study this, we calcu-lated adsorption models where deprotonated OH groupsinteracted directly with uranyl. Model CS0 corresponds tothe adsorption of uranyl to one singly coordinated O(H)group, and model ES1’ to one singly coordinated O(H)group. While the U–Al distances shortened in this way,the energies remained much higher than those of the corre-sponding CS and ES1 models (Table 5). The average U–Al
/mol. For an explanation of Oax, Ow and Ogi see caption of Table 4.irectly interacting with uranyl ions are deprotonated.
U–Al O–U–O DGg DEs DGs
3.504 164.2 – –581 –3.489
3.423 168.4 7.7 �570 15.8
3.292 165.7 29.3 �568 42.3
3.383.266 163.3 – �457 –3.462
3.175 166.4 69.4 �465 61.4
Uranyl adsorption structures on gibbsite by DFT and EXAFS 5983
distance of the energetically more stable CS0 model(3.364 A) is in line with that from EXAFS (3.38 A). Thenearest neighbor Al, the CN of U–Al shell, of the corner-sharing model is 2, and furthermore uranyl in the corner-sharing model lies close to the oxygen of l-OH group(U–lO = 2.929 A) which probably corresponds to the extraU–O shell of the EXAFS peaks (2.88 A), as mentionedabove.
We mention here the comparison between corner- andedge-sharing models in different formalism and consider-ation. The protonation states of OH groups directly coor-dinated to uranyl were varied from non-deprotonated todoubly deprotonated states both for the corner- andedge-sharing models. The number of water moleculesother than first coordination sphere around uranyl wasalso changed up to 6 molecules by 2. The resulting mod-els hereafter will be denoted as CS(x)yH2O and ES(x)y-
H2O, where CS and ES indicates corner- and edge-sharing, and the number of deprotonated OH groupsand water molecules corresponds to x and y, respectively.Note that in CS models the total coordination number ofuranyl is 4 because the 4 coordination models were foundto be more stable as mentioned above (Section 3.2.2). Inthe end we optimized totally 24 models to evaluate theeffect of protonation states and hydration on interatomicdistances of U–Al.
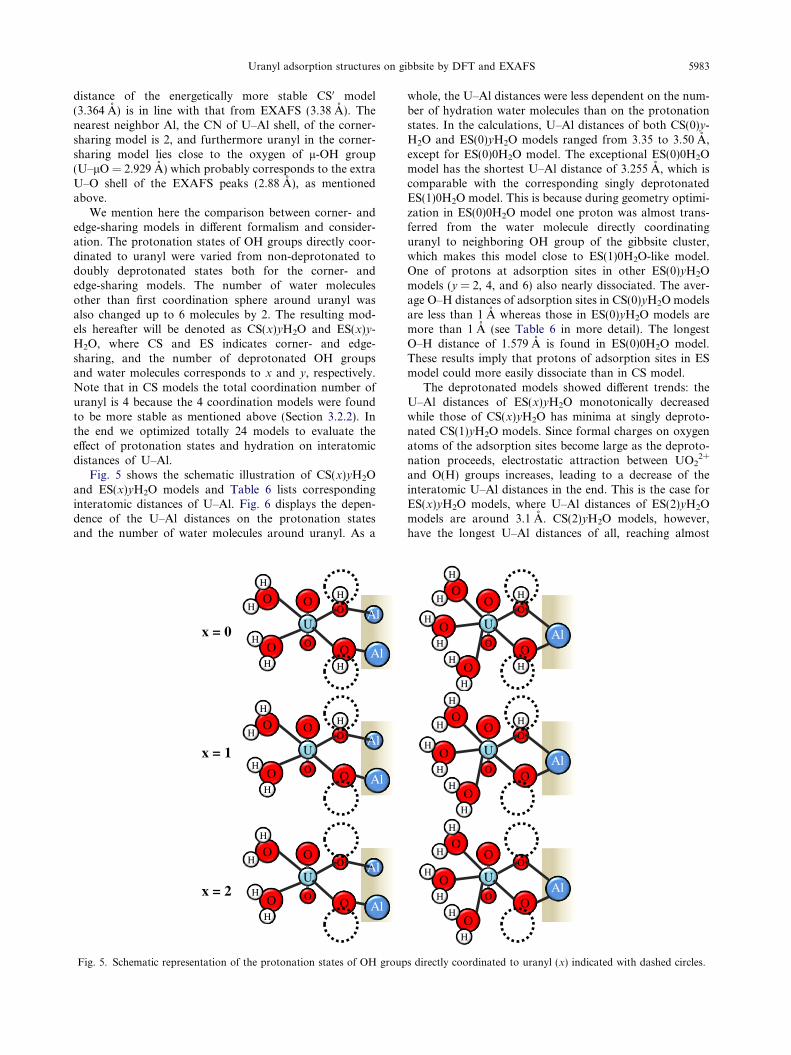
Fig. 5 shows the schematic illustration of CS(x)yH2Oand ES(x)yH2O models and Table 6 lists correspondinginteratomic distances of U–Al. Fig. 6 displays the depen-dence of the U–Al distances on the protonation statesand the number of water molecules around uranyl. As a
U
O
OO
O Al
Al
H
H
OH
H
OH
H
x = 0
x = 1
x = 2
U
O
OO
O Al
Al
H
OH
H
OH
H
U
O
OO
O Al
Al
OH
H
OH
H
Fig. 5. Schematic representation of the protonation states of OH group
whole, the U–Al distances were less dependent on the num-ber of hydration water molecules than on the protonationstates. In the calculations, U–Al distances of both CS(0)y-
H2O and ES(0)yH2O models ranged from 3.35 to 3.50 A,except for ES(0)0H2O model. The exceptional ES(0)0H2Omodel has the shortest U–Al distance of 3.255 A, which iscomparable with the corresponding singly deprotonatedES(1)0H2O model. This is because during geometry optimi-zation in ES(0)0H2O model one proton was almost trans-ferred from the water molecule directly coordinatinguranyl to neighboring OH group of the gibbsite cluster,which makes this model close to ES(1)0H2O-like model.One of protons at adsorption sites in other ES(0)yH2Omodels (y = 2, 4, and 6) also nearly dissociated. The aver-age O–H distances of adsorption sites in CS(0)yH2O modelsare less than 1 A whereas those in ES(0)yH2O models aremore than 1 A (see Table 6 in more detail). The longestO–H distance of 1.579 A is found in ES(0)0H2O model.These results imply that protons of adsorption sites in ESmodel could more easily dissociate than in CS model.
The deprotonated models showed different trends: theU–Al distances of ES(x)yH2O monotonically decreasedwhile those of CS(x)yH2O has minima at singly deproto-nated CS(1)yH2O models. Since formal charges on oxygenatoms of the adsorption sites become large as the deproto-nation proceeds, electrostatic attraction between UO2
2+
and O(H) groups increases, leading to a decrease of theinteratomic U–Al distances in the end. This is the case forES(x)yH2O models, where U–Al distances of ES(2)yH2Omodels are around 3.1 A. CS(2)yH2O models, however,have the longest U–Al distances of all, reaching almost
U
O
OO
OAl
H
H
OH
H
OH
H
OH
H
U
O
OO
OAl
H
OH
H
OH
H
OH
H
U
O
OO
OAl
OH
H
OH
H
OH
H
s directly coordinated to uranyl (x) indicated with dashed circles.
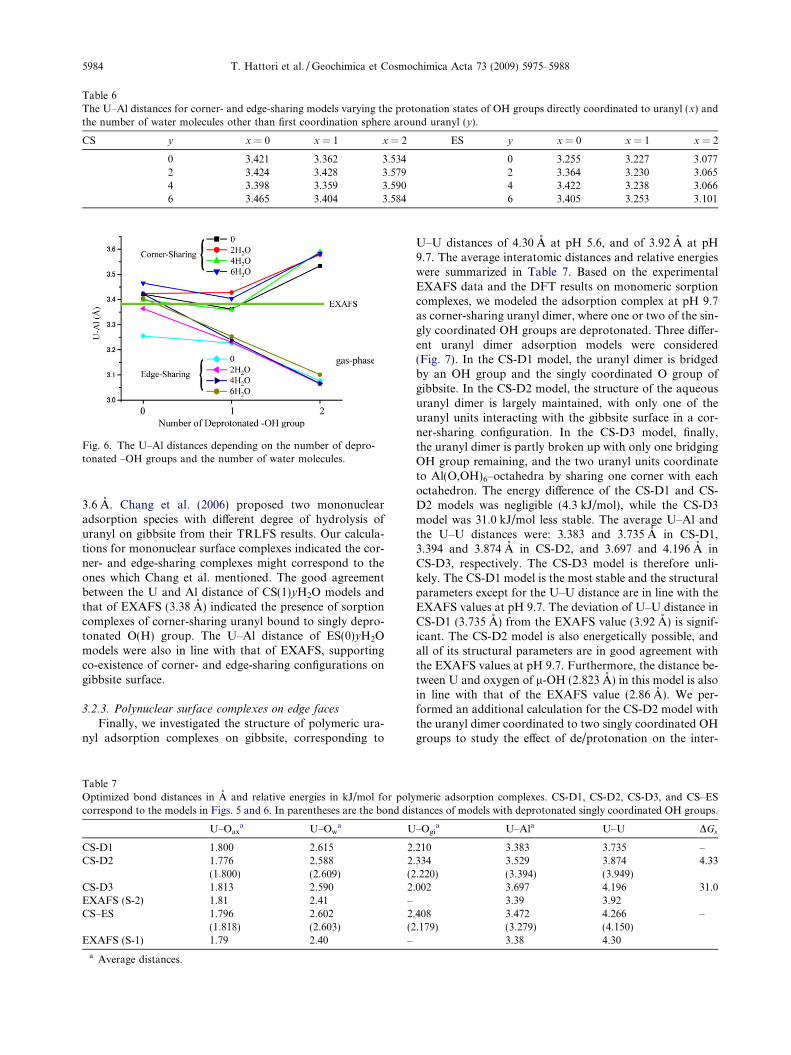
Table 6The U–Al distances for corner- and edge-sharing models varying the protonation states of OH groups directly coordinated to uranyl (x) andthe number of water molecules other than first coordination sphere around uranyl (y).
CS y x = 0 x = 1 x = 2 ES y x = 0 x = 1 x = 2
0 3.421 3.362 3.534 0 3.255 3.227 3.0772 3.424 3.428 3.579 2 3.364 3.230 3.0654 3.398 3.359 3.590 4 3.422 3.238 3.0666 3.465 3.404 3.584 6 3.405 3.253 3.101
Fig. 6. The U–Al distances depending on the number of depro-tonated –OH groups and the number of water molecules.
5984 T. Hattori et al. / Geochimica et Cosmochimica Acta 73 (2009) 5975–5988
3.6 A. Chang et al. (2006) proposed two mononuclearadsorption species with different degree of hydrolysis ofuranyl on gibbsite from their TRLFS results. Our calcula-tions for mononuclear surface complexes indicated the cor-ner- and edge-sharing complexes might correspond to theones which Chang et al. mentioned. The good agreementbetween the U and Al distance of CS(1)yH2O models andthat of EXAFS (3.38 A) indicated the presence of sorptioncomplexes of corner-sharing uranyl bound to singly depro-tonated O(H) group. The U–Al distance of ES(0)yH2Omodels were also in line with that of EXAFS, supportingco-existence of corner- and edge-sharing configurations ongibbsite surface.
3.2.3. Polynuclear surface complexes on edge faces
Finally, we investigated the structure of polymeric ura-nyl adsorption complexes on gibbsite, corresponding to
Table 7Optimized bond distances in A and relative energies in kJ/mol for polycorrespond to the models in Figs. 5 and 6. In parentheses are the bond dis
U–Oaxa U–Ow
a U
CS-D1 1.800 2.615 2CS-D2 1.776 2.588 2
(1.800) (2.609) (2CS-D3 1.813 2.590 2EXAFS (S-2) 1.81 2.41 –CS–ES 1.796 2.602 2
(1.818) (2.603) (2EXAFS (S-1) 1.79 2.40 –
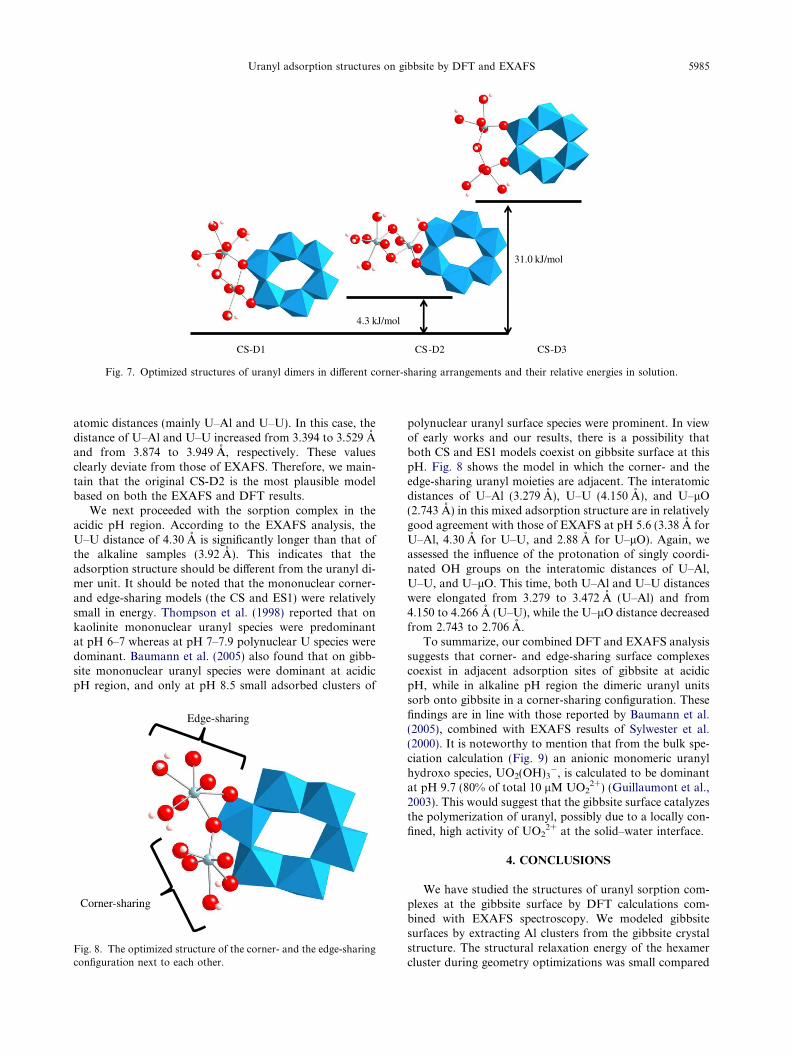
a Average distances.
U–U distances of 4.30 A at pH 5.6, and of 3.92 A at pH9.7. The average interatomic distances and relative energieswere summarized in Table 7. Based on the experimentalEXAFS data and the DFT results on monomeric sorptioncomplexes, we modeled the adsorption complex at pH 9.7as corner-sharing uranyl dimer, where one or two of the sin-gly coordinated OH groups are deprotonated. Three differ-ent uranyl dimer adsorption models were considered(Fig. 7). In the CS-D1 model, the uranyl dimer is bridgedby an OH group and the singly coordinated O group ofgibbsite. In the CS-D2 model, the structure of the aqueousuranyl dimer is largely maintained, with only one of theuranyl units interacting with the gibbsite surface in a cor-ner-sharing configuration. In the CS-D3 model, finally,the uranyl dimer is partly broken up with only one bridgingOH group remaining, and the two uranyl units coordinateto Al(O,OH)6–octahedra by sharing one corner with eachoctahedron. The energy difference of the CS-D1 and CS-D2 models was negligible (4.3 kJ/mol), while the CS-D3model was 31.0 kJ/mol less stable. The average U–Al andthe U–U distances were: 3.383 and 3.735 A in CS-D1,3.394 and 3.874 A in CS-D2, and 3.697 and 4.196 A inCS-D3, respectively. The CS-D3 model is therefore unli-kely. The CS-D1 model is the most stable and the structuralparameters except for the U–U distance are in line with theEXAFS values at pH 9.7. The deviation of U–U distance inCS-D1 (3.735 A) from the EXAFS value (3.92 A) is signif-icant. The CS-D2 model is also energetically possible, andall of its structural parameters are in good agreement withthe EXAFS values at pH 9.7. Furthermore, the distance be-tween U and oxygen of l-OH (2.823 A) in this model is alsoin line with that of the EXAFS value (2.86 A). We per-formed an additional calculation for the CS-D2 model withthe uranyl dimer coordinated to two singly coordinated OHgroups to study the effect of de/protonation on the inter-
meric adsorption complexes. CS-D1, CS-D2, CS-D3, and CS–EStances of models with deprotonated singly coordinated OH groups.
–Ogia U–Ala U–U DGs
.210 3.383 3.735 –
.334 3.529 3.874 4.33.220) (3.394) (3.949)
.002 3.697 4.196 31.03.39 3.92
.408 3.472 4.266 –.179) (3.279) (4.150)
3.38 4.30
CS-D1 CS-D2 CS-D3
31.0 kJ/mol
4.3 kJ/mol
Fig. 7. Optimized structures of uranyl dimers in different corner-sharing arrangements and their relative energies in solution.
Uranyl adsorption structures on gibbsite by DFT and EXAFS 5985
atomic distances (mainly U–Al and U–U). In this case, thedistance of U–Al and U–U increased from 3.394 to 3.529 Aand from 3.874 to 3.949 A, respectively. These valuesclearly deviate from those of EXAFS. Therefore, we main-tain that the original CS-D2 is the most plausible modelbased on both the EXAFS and DFT results.
We next proceeded with the sorption complex in theacidic pH region. According to the EXAFS analysis, theU–U distance of 4.30 A is significantly longer than that ofthe alkaline samples (3.92 A). This indicates that theadsorption structure should be different from the uranyl di-mer unit. It should be noted that the mononuclear corner-and edge-sharing models (the CS and ES1) were relativelysmall in energy. Thompson et al. (1998) reported that onkaolinite mononuclear uranyl species were predominantat pH 6–7 whereas at pH 7–7.9 polynuclear U species weredominant. Baumann et al. (2005) also found that on gibb-site mononuclear uranyl species were dominant at acidicpH region, and only at pH 8.5 small adsorbed clusters of
Corner-sharing
Edge-sharing
Fig. 8. The optimized structure of the corner- and the edge-sharingconfiguration next to each other.
polynuclear uranyl surface species were prominent. In viewof early works and our results, there is a possibility thatboth CS and ES1 models coexist on gibbsite surface at thispH. Fig. 8 shows the model in which the corner- and theedge-sharing uranyl moieties are adjacent. The interatomicdistances of U–Al (3.279 A), U–U (4.150 A), and U–lO(2.743 A) in this mixed adsorption structure are in relativelygood agreement with those of EXAFS at pH 5.6 (3.38 A forU–Al, 4.30 A for U–U, and 2.88 A for U–lO). Again, weassessed the influence of the protonation of singly coordi-nated OH groups on the interatomic distances of U–Al,U–U, and U–lO. This time, both U–Al and U–U distanceswere elongated from 3.279 to 3.472 A (U–Al) and from4.150 to 4.266 A (U–U), while the U–lO distance decreasedfrom 2.743 to 2.706 A.
To summarize, our combined DFT and EXAFS analysissuggests that corner- and edge-sharing surface complexescoexist in adjacent adsorption sites of gibbsite at acidicpH, while in alkaline pH region the dimeric uranyl unitssorb onto gibbsite in a corner-sharing configuration. Thesefindings are in line with those reported by Baumann et al.(2005), combined with EXAFS results of Sylwester et al.(2000). It is noteworthy to mention that from the bulk spe-ciation calculation (Fig. 9) an anionic monomeric uranylhydroxo species, UO2(OH)3
�, is calculated to be dominantat pH 9.7 (80% of total 10 lM UO2
2+) (Guillaumont et al.,2003). This would suggest that the gibbsite surface catalyzesthe polymerization of uranyl, possibly due to a locally con-fined, high activity of UO2
2+ at the solid–water interface.
4. CONCLUSIONS
We have studied the structures of uranyl sorption com-plexes at the gibbsite surface by DFT calculations com-bined with EXAFS spectroscopy. We modeled gibbsitesurfaces by extracting Al clusters from the gibbsite crystalstructure. The structural relaxation energy of the hexamercluster during geometry optimizations was small compared
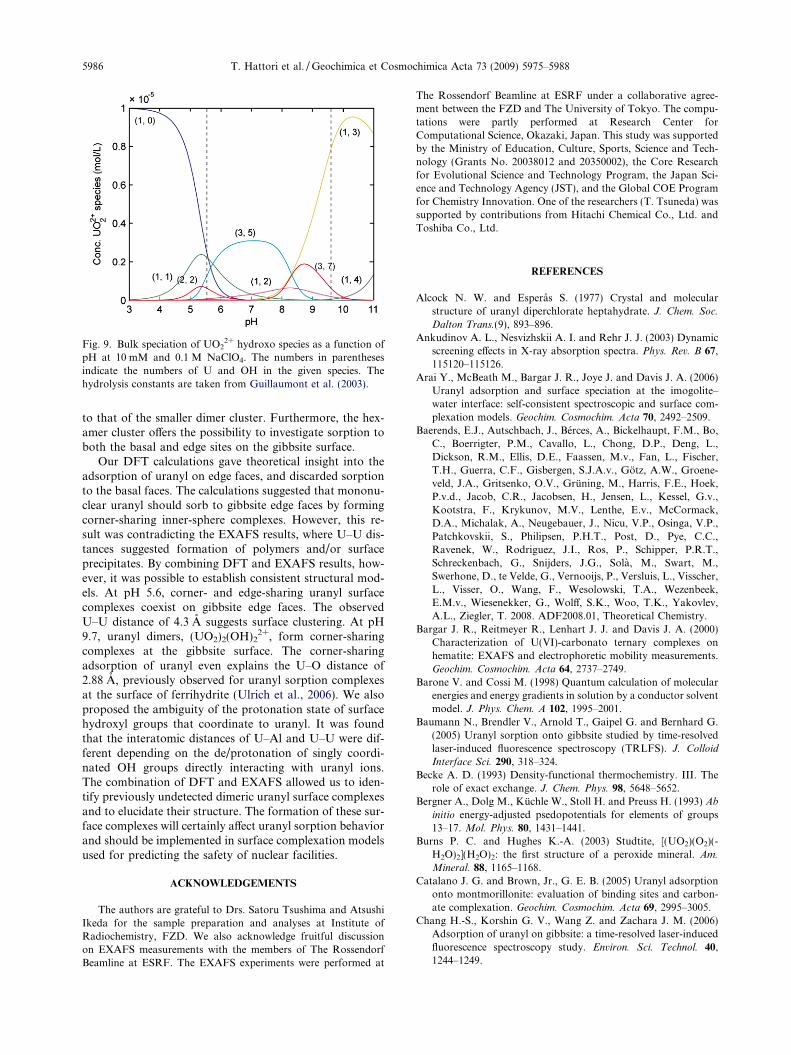
Fig. 9. Bulk speciation of UO22+ hydroxo species as a function of
pH at 10 mM and 0.1 M NaClO4. The numbers in parenthesesindicate the numbers of U and OH in the given species. Thehydrolysis constants are taken from Guillaumont et al. (2003).
5986 T. Hattori et al. / Geochimica et Cosmochimica Acta 73 (2009) 5975–5988
to that of the smaller dimer cluster. Furthermore, the hex-amer cluster offers the possibility to investigate sorption toboth the basal and edge sites on the gibbsite surface.
Our DFT calculations gave theoretical insight into theadsorption of uranyl on edge faces, and discarded sorptionto the basal faces. The calculations suggested that mononu-clear uranyl should sorb to gibbsite edge faces by formingcorner-sharing inner-sphere complexes. However, this re-sult was contradicting the EXAFS results, where U–U dis-tances suggested formation of polymers and/or surfaceprecipitates. By combining DFT and EXAFS results, how-ever, it was possible to establish consistent structural mod-els. At pH 5.6, corner- and edge-sharing uranyl surfacecomplexes coexist on gibbsite edge faces. The observedU–U distance of 4.3 A suggests surface clustering. At pH9.7, uranyl dimers, (UO2)2(OH)2
2+, form corner-sharingcomplexes at the gibbsite surface. The corner-sharingadsorption of uranyl even explains the U–O distance of2.88 A, previously observed for uranyl sorption complexesat the surface of ferrihydrite (Ulrich et al., 2006). We alsoproposed the ambiguity of the protonation state of surfacehydroxyl groups that coordinate to uranyl. It was foundthat the interatomic distances of U–Al and U–U were dif-ferent depending on the de/protonation of singly coordi-nated OH groups directly interacting with uranyl ions.The combination of DFT and EXAFS allowed us to iden-tify previously undetected dimeric uranyl surface complexesand to elucidate their structure. The formation of these sur-face complexes will certainly affect uranyl sorption behaviorand should be implemented in surface complexation modelsused for predicting the safety of nuclear facilities.
ACKNOWLEDGEMENTS
The authors are grateful to Drs. Satoru Tsushima and AtsushiIkeda for the sample preparation and analyses at Institute ofRadiochemistry, FZD. We also acknowledge fruitful discussionon EXAFS measurements with the members of The RossendorfBeamline at ESRF. The EXAFS experiments were performed at
The Rossendorf Beamline at ESRF under a collaborative agree-ment between the FZD and The University of Tokyo. The compu-tations were partly performed at Research Center forComputational Science, Okazaki, Japan. This study was supportedby the Ministry of Education, Culture, Sports, Science and Tech-nology (Grants No. 20038012 and 20350002), the Core Researchfor Evolutional Science and Technology Program, the Japan Sci-ence and Technology Agency (JST), and the Global COE Programfor Chemistry Innovation. One of the researchers (T. Tsuneda) wassupported by contributions from Hitachi Chemical Co., Ltd. andToshiba Co., Ltd.
REFERENCES
Alcock N. W. and Esperas S. (1977) Crystal and molecularstructure of uranyl diperchlorate heptahydrate. J. Chem. Soc.
Dalton Trans.(9), 893–896.Ankudinov A. L., Nesvizhskii A. I. and Rehr J. J. (2003) Dynamic
screening effects in X-ray absorption spectra. Phys. Rev. B 67,
115120–115126.
Arai Y., McBeath M., Bargar J. R., Joye J. and Davis J. A. (2006)Uranyl adsorption and surface speciation at the imogolite–water interface: self-consistent spectroscopic and surface com-plexation models. Geochim. Cosmochim. Acta 70, 2492–2509.
Baerends, E.J., Autschbach, J., Berces, A., Bickelhaupt, F.M., Bo,C., Boerrigter, P.M., Cavallo, L., Chong, D.P., Deng, L.,Dickson, R.M., Ellis, D.E., Faassen, M.v., Fan, L., Fischer,T.H., Guerra, C.F., Gisbergen, S.J.A.v., Gotz, A.W., Groene-veld, J.A., Gritsenko, O.V., Gruning, M., Harris, F.E., Hoek,P.v.d., Jacob, C.R., Jacobsen, H., Jensen, L., Kessel, G.v.,Kootstra, F., Krykunov, M.V., Lenthe, E.v., McCormack,D.A., Michalak, A., Neugebauer, J., Nicu, V.P., Osinga, V.P.,Patchkovskii, S., Philipsen, P.H.T., Post, D., Pye, C.C.,Ravenek, W., Rodriguez, J.I., Ros, P., Schipper, P.R.T.,Schreckenbach, G., Snijders, J.G., Sola, M., Swart, M.,Swerhone, D., te Velde, G., Vernooijs, P., Versluis, L., Visscher,L., Visser, O., Wang, F., Wesolowski, T.A., Wezenbeek,E.M.v., Wiesenekker, G., Wolff, S.K., Woo, T.K., Yakovlev,A.L., Ziegler, T. 2008. ADF2008.01, Theoretical Chemistry.
Bargar J. R., Reitmeyer R., Lenhart J. J. and Davis J. A. (2000)Characterization of U(VI)-carbonato ternary complexes onhematite: EXAFS and electrophoretic mobility measurements.Geochim. Cosmochim. Acta 64, 2737–2749.
Barone V. and Cossi M. (1998) Quantum calculation of molecularenergies and energy gradients in solution by a conductor solventmodel. J. Phys. Chem. A 102, 1995–2001.
Baumann N., Brendler V., Arnold T., Gaipel G. and Bernhard G.(2005) Uranyl sorption onto gibbsite studied by time-resolvedlaser-induced fluorescence spectroscopy (TRLFS). J. Colloid
Interface Sci. 290, 318–324.
Becke A. D. (1993) Density-functional thermochemistry. III. Therole of exact exchange. J. Chem. Phys. 98, 5648–5652.
Bergner A., Dolg M., Kuchle W., Stoll H. and Preuss H. (1993) Ab
initio energy-adjusted psedopotentials for elements of groups13–17. Mol. Phys. 80, 1431–1441.
Burns P. C. and Hughes K.-A. (2003) Studtite, [(UO2)(O2)(-H2O)2](H2O)2: the first structure of a peroxide mineral. Am.
Mineral. 88, 1165–1168.
Catalano J. G. and Brown, Jr., G. E. B. (2005) Uranyl adsorptiononto montmorillonite: evaluation of binding sites and carbon-ate complexation. Geochim. Cosmochim. Acta 69, 2995–3005.
Chang H.-S., Korshin G. V., Wang Z. and Zachara J. M. (2006)Adsorption of uranyl on gibbsite: a time-resolved laser-inducedfluorescence spectroscopy study. Environ. Sci. Technol. 40,
1244–1249.
Uranyl adsorption structures on gibbsite by DFT and EXAFS 5987
Cossi M., Rega N., Scalmani G. and Barone V. (2003) Energies,structures, and electronic properties of molecules in solution withthe C-PCM solvation model. J. Comput. Chem. 24, 669–796.
Elzinga E. J., Tait C. D., Reeder R. J., Rector K. D., Donohoe R.J. and Morris D. E. (2004) Spectroscopic investigation of U(VI)sorption at the calcite–water interface. Geochim. Cosmochim.
Acta 68, 2437–2448.
Farkas I., Banyai I., Szabo Z., Wahlgren U. and Grenthe I. (2000)Rates and mechanisms of water exchange of UO2
2+(aq) andUO2(oxalate)F(H2O)2
�: a variable-temperature 17O and 19FNMR study. Inorg. Chem. 39, 799–805.
Frisch, M.J., Trucks, G.W., Schlegel, H.B., Scuseria, G.E., Robb,M.A., Cheeseman, J.R., Montgomery, J.A., Vreven, T., Kudin,K.N., Burant, J.C., Millam, J.M., Iyengar, S.S., Tomasi, J.,Barone, V., Mennucci, B., Cossi, M., Scalmani, G., Rega, N.,Petersson, G.A., Nakatsuji, H., Hada, M., Ehara, M., Toyota,K., Fukuda, R., Hasegawa, J., Ishida, M., Nakajima, T., Honda,Y., Kitao, O., Nakai, H., Klene, M., Li, X., Knox, J.E.,Hratchian, H.P., Cross, J.B., Bakken, V., Adamo, C., Jaramillo,J., Gomperts, R., Stratmann, R.E., Yazyev, O., Austin, A.J.,Cammi, R., Pomelli, C., Ochterski, J.W., Ayala, P.Y., Moro-kuma, K., Voth, G.A., Salvador, P., Dannenberg, J.J., Zakrzew-ski, V.G., Dapprich, S., Daniels, A.D., Strain, M.C., Farkas, O.,Malick, D.K., Rabuck, A.D., Raghavachari, K., Foresman, J.B.,Ortiz, J.V., Cui, Q., Baboul, A.G., Clifford, S., Cioslowski, J.,Stefanov, B.B., Liu, G., Liashenko, A., Piskorz, P., Komaromi,I., Martin, R.L., Fox, D.J., Keith, T., Al-Laham, M.A., Peng,C.Y., Nanayakkara, A., Challacombe, M., Gill, P.M.W., John-son, B., Chen, W., Wong, M.W., Gonzalez, C., Pople, J.A. 2004.Gaussian 03, Revision D.02 Gaussian, Inc., Wallingford CT.
Froideval A., Nero M. D., Gaillard C., Barillon R., Rossini I. andHazemann J. L. (2006) Uranyl sorption species at low coverageon Al-hydroxide: TRLFS and XAFS studies. Geochim. Cos-
mochim. Acta 70, 5270–5284.
Fujii T., Fujiwara K., Yamana H. and Moriyama H. (2001) Ramanspectroscopic determination of formation constant of uranylhydrolysis species (UO2)2(OH)2
2+. J. Alloys Comp. 323–324,
859–863.
Greathouse J. A., O’Brien R. J., Bemis G. and Pabalan R. T. (2002)Molecular dynamics study of aqueous uranyl interactions withquartz (0 1 0). J. Phys. Chem. B 106, 1646–1655.
Greathouse J. A. and Cygan R. T. (2005) Molecular dynamicssimulation of uranyl(VI) adsorption equilibria onto an externalmontmorillonite surface. Phys. Chem. Chem. Phys. 7, 3580–
3586.
Guerra C. F., Snijders J. G., te Velde G. and Baerends E. J. (1998)Towards an order-N DFT method. Theor. Chem. Acc. 99, 391.
Guillaumont R., Fanghanel T., Neck V., Fuger J., Palmer D. A.,Grenthe I. and Rand M. H. (2003) Update on the ChemicalThermodynamics of Uranium, Neptunium, Plutonium, Amer-icium and Technetium. vol. 5. Elsevier, Amsterdam.
Hiemstra T., Wit J. C. M. D. and Riemsdijk W. H. V. (1989)Multisite proton adsorption modeling at the solid/solutioninterface of (hydr)oxides: a new approach: II. Application tovarious important (hydr)oxides. J. Colloid Interface Sci. 133,
105–117.
Hiemstra T., Venema P. and Riemsdijk W. H. V. (1996) Intrinsicproton affinity of reactive surface groups of metal (hydr)oxides:the bond valence principle. J. Colloid Interface Sci. 184, 680–
692.
Hiemstra T., Yong H. and Riemsdijk W. H. V. (1999) Interfacialcharging phenomena of aluminum (hydr)oxides. Langmuir 15,
5942–5955.
Hennig C., Reich T., Dahn R. and Scheidegger M. (2002) Structureof uranium sorption complexes at montmorillonite edge sites.Radiochim. Acta 90, 653–657.
Huzinaga S. (1965) Gaussian – type functions for polyatomicsystems I. J. Chem. Phys. 42, 1293–1302.
Igel-Man G., Stoll H. and Preuss H. (1998) Pseudopotentials formain group elements (IIIa through VIIa). Mol. Phys. 65, 1321–
1328.
Kowal-Fouchard A., Drot R., Simoni E. and Ehrhardt J. J. (2004)Use of spectroscopic techniques for uranium(VI)/montmoril-lonite interaction modeling. Environ. Sci. Technol. 38, 1399–
1407.
Kubicki J. D. and Apitz S. E. (1998) Molecular cluster models ofaluminum oxide and aluminum hydroxide surfaces. Am.
Mineral. 83, 1054–1066.
Kuchle W., Dolg M. and Preuss H. (1994) Energy-adjustedpseudopotentials for the actinides. Parameter sets and testcalculations for thorium and thorium monoxide. J. Chem. Phys.
100, 7535–7542.
Ladeira A. C. Q., Ciminelli V. S. T., Duarte H. A., Alves M. C. M.and Ramos A. Y. (2001) Mechanism of anion retention fromEXAFS and density functional calculations: arsenic(V)adsorbed on gibbsite. Geochim. Cosmochim. Acta 65, 1211–
1217.
Lee C., Yang W. and Parr R. G. (1988) Development of the Colle–Salvetti correlation-energy formula into a functional of theelectron density. Phys. Rev. B 37, 785–789.
Lenthe E. v., Baerends E. J. and Snijders J. G. (1993) Relativisticregular two-component Hamiltonians. J. Chem. Phys. 99, 4597–
4610.
Lenthe E. v., Baerends E. J. and Snijders J. G. (1994) Relativistictotal energy using regular approximations. J. Chem. Phys. 101,
9783–9792.
Lenthe E. v., Ehlers A. and Baerends E.-J. (1999) Geometryoptimizations in the zero order regular approximation forrelativistic effects. J. Chem. Phys. 110, 8943–8953.
Lenthe E. v., Leeuwen R. v., Baerends E. J. and Snijders J. G.(1996) Relativistic regular two-component Hamiltonians. Int. J.
Quantum Chem. 57, 281–293.
Lomenech C., Simoni E., Drot R., Ehrhardt J.-J. and MielczarskiJ. (2003) Sorption of uranium(VI) species on zircon: structuralinvestigation of the solid/solution interface. J. Colloid Interface
Sci. 261, 221–232.
Macak P., Tsushima S., Wahlgren U. and Grenthe I. (2006) Atheoretical study of the fluoride exchange between UO2F+(aq)and UO2
2+(aq). Dalton Trans.(30), 3638–3646.Moskaleva L. V., Kruger S., Sporl A. and Rosch N. (2004)
Role of solvation in the reduction of the uranyl dication bywater: a density functional study. Inorg. Chem. 43, 4080–
4090.
Moskaleva L. V., Nasluzov V. A. and Rosch N. (2006) Modelingadsorption of the uranyl dication on the hydroxylated a-Al2O3(0 0 0 1) surface in an aqueous medium. Density func-tional study. Langmuir 22, 2141–2145.
Oliveira A. F., Ladeira A. C. Q., Ciminelli V. S. T., Heine T. andDuarte H. A. (2006) Structural model of arsenic(III) adsorbedon gibbsite based on DFT calculations. J. Mol. Struct.
THEOCHEM 762, 17–23.
Reich T., Moll H., Denecke M. A., Geipel G., Bernhard G. andNitsche H. (1996) Characterization of hydrous uranyl silicateby EXAFS. Radiochim. Acta 74, 219–223.
Reich T., Moll H., Arnold T., Denecke M. A., Hennig C., GeipelG., Bernhard G., Nitsche H., Allen P. G., Bucher J. J.,Edelstein N. M. and Shuh D. K. (1998) An EXAFS study ofuranium(VI) sorption onto silica gel and ferrihydrite. J.
Electron Spectrosc. Relat. Phenom. 96, 237–243.
Ressler T. (1998) WinXAS: a program for X-ray absorptionspectroscopy data analysis under MS-Windows. J. Synchrotron
Radiat. 5, 118–122.
5988 T. Hattori et al. / Geochimica et Cosmochimica Acta 73 (2009) 5975–5988
Saalfeld H. and Wedde M. (1974) Refinement of the crystalstructure of gibbsite, Al(OH)3. Z. Kristallogr. 139, 129–
135.
Shamov G. A. and Schreckenback G. (2005) Density functionalstudies of actinyl aquo complexes studied using small-coreeffective core potentials and a scalar four-component relativisticmethod. J. Phys. Chem. A 109, 10961–10974.
Sherman D. M., Peacock C. L. and Hubbard C. G. (2008) Surfacecomplexation of U(VI) on goethite (a-FeOOH). Geochim.
Cosmochim. Acta 72, 298–310.
Siegel S., Hoekstra H. R. and Gebert E. (1972) The structureof c-uranyl dihydroxide, UO2(OH)2. Acta Cryst. B28, 3469–
3473.
Steele H. M., Wright K. and Hillier I. H. (2002) Modelling theadsorption of uranyl on the surface of goethite. Geochim.
Cosmochim. Acta 66, 1305–1310.
Sylwester E. R., Hudson E. A. and Allen P. G. (2000) Thestructure of uranium(VI) sorption complexes on silica,alumina, and montmorillonite. Geochim. Cosmochim. Acta
64, 2431–2438.
Taylor J. C. and Bannister M. J. (1972) A neutron diffraction studyof the anisotropic thermal expansion of b-uranyl dihydroxide.Acta Cryst. B28, 2995–2999.
te Velde G., Bickelhaupt F. M., Gisbergen S. J. A. v., Guerra C. F.,Baerends E. J., Snijders J. G. and Ziegler T. (2001) Chemistrywith ADF. J. Comput. Chem. 22, 931–967.
Thompson H. A., Brown, Jr., G. E. and Parks G. A. (1997) XAFSspectroscopic study of uranyl coordination in solids andaqueous solution. Am. Mineral. 82, 483–496.
Thompson H. A., Parks G. A. and Brown, Jr., G. E. (1998)Adsorption of Metals by Geomedia. Academic Press, San Diego.pp. 349.
Tsushima S. and Suzuki A. (2000) Hydration numbers of penta-valent and hexavalent uranyl, neptunyl, and plutonyl. J. Mol.
Struct. THEOCHEM 529, 21–25.
Tsushima S., Rossberg A., Ikeda A., Muller K. and Scheinost A. C.(2007) Stoichiometry and structure of uranyl(VI) hydroxodimer and trimer complexes in aqueous solution. Inorg. Chem.
46, 10819–10826.
Turner G. D., Zachara J. M., Mckinley J. P. and Smith S. C. (1996)Surface-charge properties and UO2
2+ adsorption of a subsur-face smectite. Geochim. Cosmochim. Acta 60, 3399–3414.
Ulrich K.-U., Rossberg A., Foerstendorf H., Zanker H. andScheinost A. C. (2006) Molecular characterization of ura-nium(VI) sorption complexes on iron(III)-rich acid mine watercolloids. Geochim. Cosmochim. Acta 70, 5469–5487.
Walter M., Arnold T., Reich T. and Bernhard G. (2003) Sorptionof uranium(VI) onto ferric oxides in sulfate-rich acid waters.Environ. Sci. Technol. 37, 2898–2904.
Webb S. M. (2005) SIXPack: a graphical user interface for XASanalysis using IFEFFIT. Phys. Scr. T115, 1011–1014.
Yamaguchi N. U., Scheinost A. C. and Sparks D. L. (2002)Influence of gibbsite surface area and citrte on Ni sorptionmechanisms at pH 7.5. Clays Clay Miner. 50, 784–790.
Zhang Y. and Yang W. (1998) Comment on ‘‘GeneralizedGradient Made Simple”. Phys. Rev. Lett. 80, 890.
Associate editor: Donald L. Sparks