Embed Size (px)
Citation preview
Air Force Institute of TechnologyAir Force Institute of Technology
The Supplier Relationship The Supplier Relationship Management ProcessManagement Process
“There is a common denominator for item prices, reliability, order quantities, and lead times: suppliers. How DoD works with suppliers and how suppliers perform affect these four factors. This leads to supplier performance, management, and integration with DoD as the biggest potential opportunity to cut costs.”
Peltz et al., 2012. “Integrating the Department of Defense Supply Chain”, RAND technical report
Expected Benefits of SRMExpected Benefits of SRM
• Lower Price
• Shortened Lead Time
• Just-In-Time Resupply/Reduced Inventory
• Improved Quality/Reliability
• Access to Innovation
• Brand Recognition
• Others?
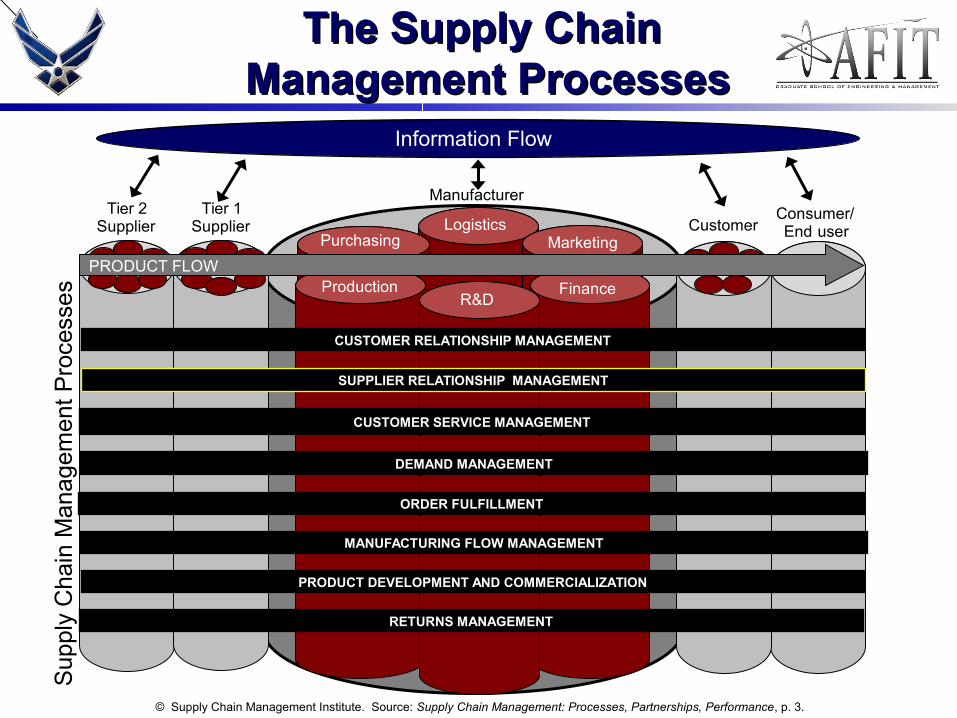
The Supply Chain The Supply Chain Management ProcessesManagement Processes
© Supply Chain Management Institute. Source: Supply Chain Management: Processes, Partnerships, Performance, p. 3.
Sup
ply
Cha
in M
anag
emen
t P
roce
sses
LogisticsMarketing
Finance
Tier 2Supplier
Consumer/End user
Manufacturer
Information Flow
Purchasing
Production
Tier 1Supplier Customer
R&D
PRODUCT FLOW
CUSTOMER RELATIONSHIP MANAGEMENT
PRODUCT DEVELOPMENT AND COMMERCIALIZATION
RETURNS MANAGEMENT
ORDER FULFILLMENT
DEMAND MANAGEMENT
CUSTOMER SERVICE MANAGEMENT
SUPPLIER RELATIONSHIP MANAGEMENT
MANUFACTURING FLOW MANAGEMENT
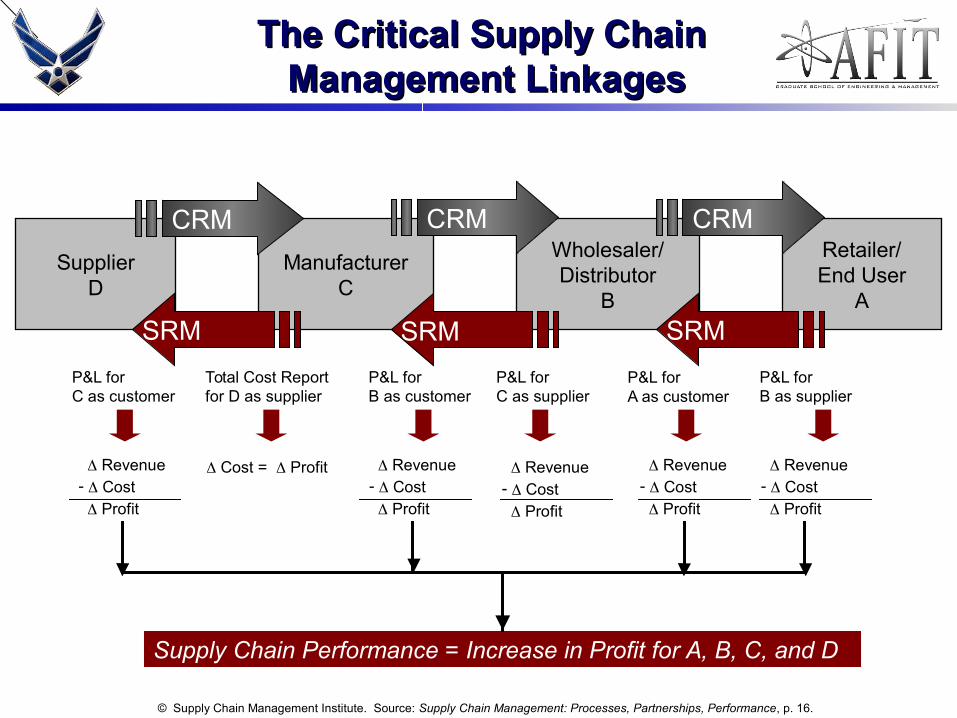
The Critical Supply Chain The Critical Supply Chain Management LinkagesManagement Linkages
Supply Chain Performance = Increase in Profit for A, B, C, and D
ManufacturerC
Retailer/End User
A
Wholesaler/Distributor
B
P&L forC as supplier
P&L forB as supplier
Revenue- Cost Profit
Revenue- Cost Profit
SupplierD
P&L forA as customer
Revenue- Cost Profit
P&L forB as customer
Revenue- Cost Profit
P&L forC as customer
Revenue- Cost Profit
Total Cost Reportfor D as supplier
Cost = Profit
CRM
SRMSRMSRM
CRMCRM
© Supply Chain Management Institute. Source: Supply Chain Management: Processes, Partnerships, Performance, p. 16.
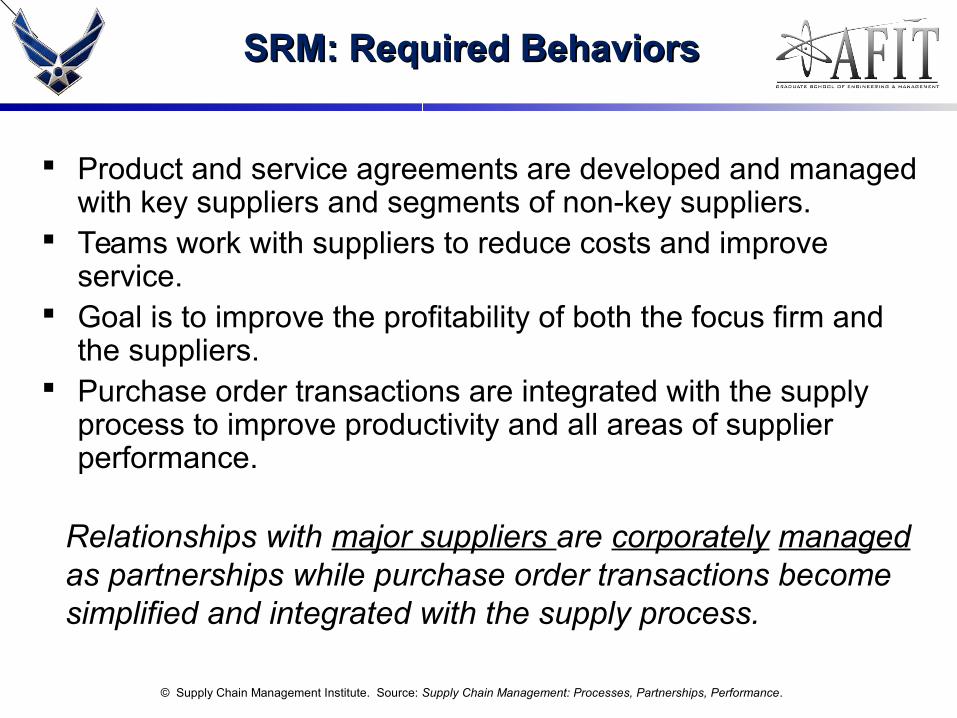
Relationships with major suppliers are corporately managed as partnerships while purchase order transactions become simplified and integrated with the supply process.
SRM: Required BehaviorsSRM: Required Behaviors
Product and service agreements are developed and managed with key suppliers and segments of non-key suppliers.
Teams work with suppliers to reduce costs and improve service.
Goal is to improve the profitability of both the focus firm and the suppliers.
Purchase order transactions are integrated with the supply process to improve productivity and all areas of supplier performance.
© Supply Chain Management Institute. Source: Supply Chain Management: Processes, Partnerships, Performance.
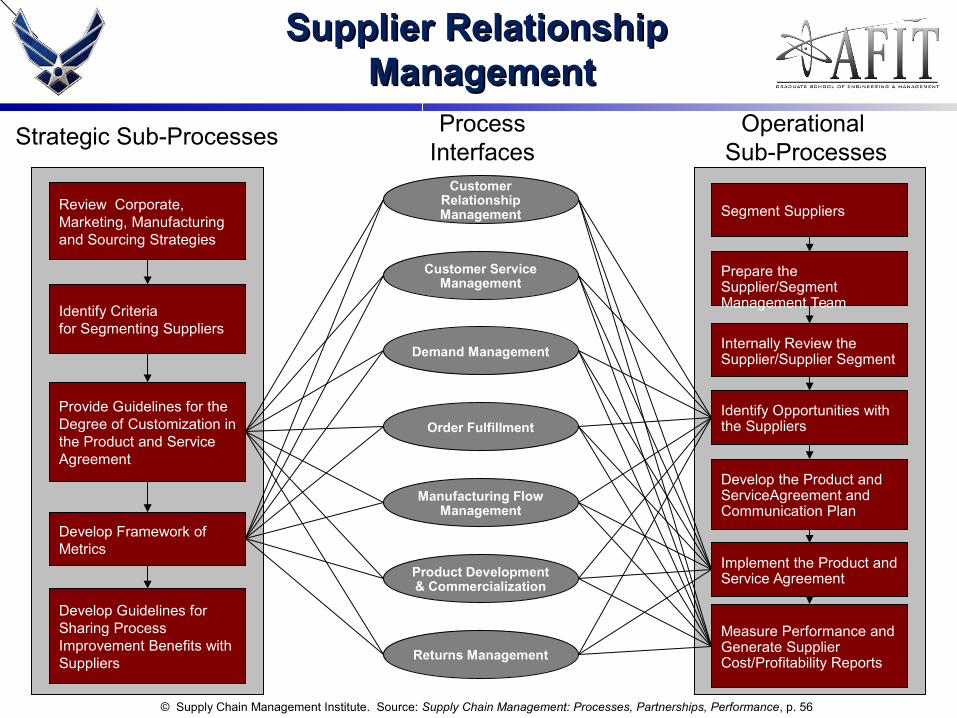
Process Interfaces
Strategic Sub-Processes Operational Sub-Processes
Supplier Relationship Supplier Relationship ManagementManagement
Customer Relationship Management
Customer Service Management
Demand Management
Order Fulfillment
Manufacturing Flow Management
Product Development & Commercialization
Returns Management
Review Corporate, Marketing, Manufacturing and Sourcing Strategies
Identify Criteriafor Segmenting Suppliers
Provide Guidelines for the Degree of Customization in the Product and Service Agreement
Develop Framework of Metrics
Develop Guidelines for Sharing Process Improvement Benefits with Suppliers
Segment Suppliers
Prepare the Supplier/Segment Management Team
Internally Review the Supplier/Supplier Segment
Identify Opportunities with the Suppliers
Develop the Product and ServiceAgreement and Communication Plan
Measure Performance and Generate Supplier Cost/Profitability Reports
Implement the Product and Service Agreement
© Supply Chain Management Institute. Source: Supply Chain Management: Processes, Partnerships, Performance, p. 56
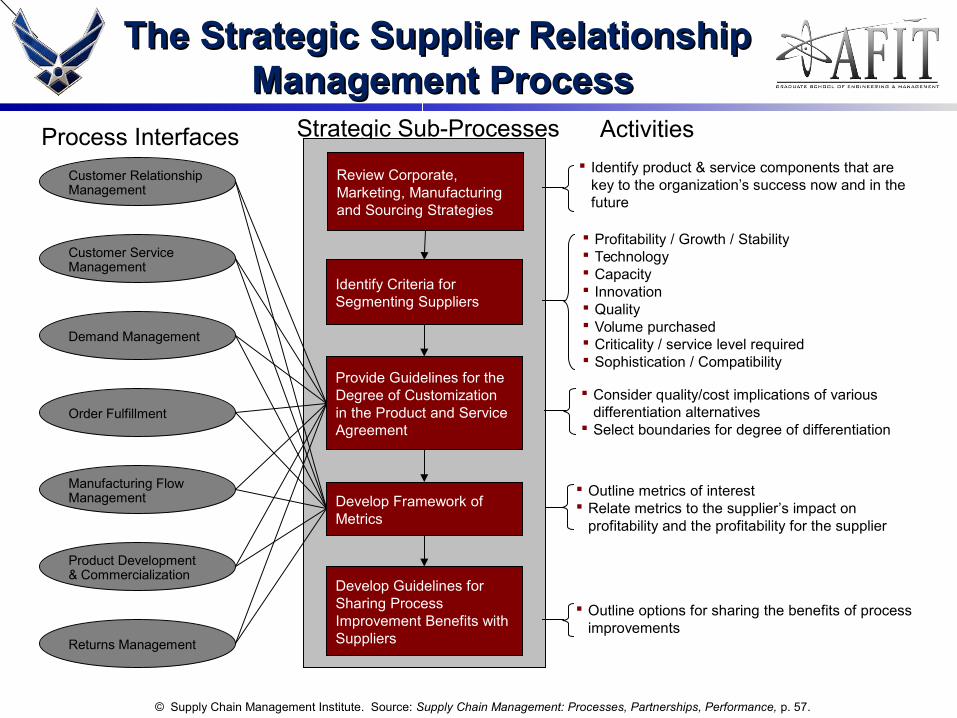
The Strategic Supplier Relationship The Strategic Supplier Relationship Management ProcessManagement Process
Customer Relationship Management
Strategic Sub-ProcessesProcess Interfaces Activities
Customer Service Management
Demand Management
Order Fulfillment
Manufacturing Flow Management
Product Development & Commercialization
Returns Management
Review Corporate, Marketing, Manufacturing and Sourcing Strategies
Identify Criteria for Segmenting Suppliers
Provide Guidelines for the Degree of Customization in the Product and Service Agreement
Develop Framework of Metrics
Develop Guidelines for Sharing Process Improvement Benefits with Suppliers
Outline metrics of interest Relate metrics to the supplier’s impact on
profitability and the profitability for the supplier
Identify product & service components that are key to the organization’s success now and in the future
Profitability / Growth / Stability Technology Capacity Innovation Quality Volume purchased Criticality / service level required Sophistication / Compatibility
Consider quality/cost implications of various differentiation alternatives
Select boundaries for degree of differentiation
Outline options for sharing the benefits of process improvements
© Supply Chain Management Institute. Source: Supply Chain Management: Processes, Partnerships, Performance, p. 57.
Strategic Sub-Process #1Strategic Sub-Process #1
Review Corporate, Marketing, Manufacturing Review Corporate, Marketing, Manufacturing and Sourcing Strategiesand Sourcing Strategies
• Identify product and service components that are key to the organization’s success now and in the future.
© Supply Chain Management Institute. Source: Supply Chain Management: Processes, Partnerships, Performance.
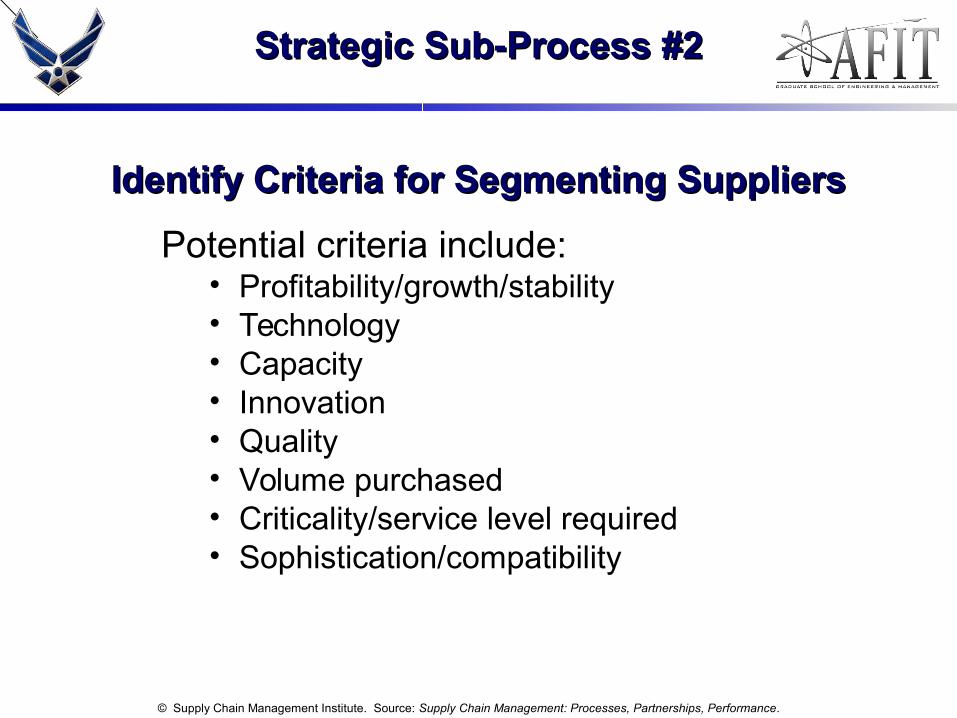
Strategic Sub-Process #2Strategic Sub-Process #2
Identify Criteria for Segmenting SuppliersIdentify Criteria for Segmenting Suppliers
Potential criteria include:• Profitability/growth/stability• Technology• Capacity• Innovation • Quality• Volume purchased • Criticality/service level required • Sophistication/compatibility
© Supply Chain Management Institute. Source: Supply Chain Management: Processes, Partnerships, Performance.
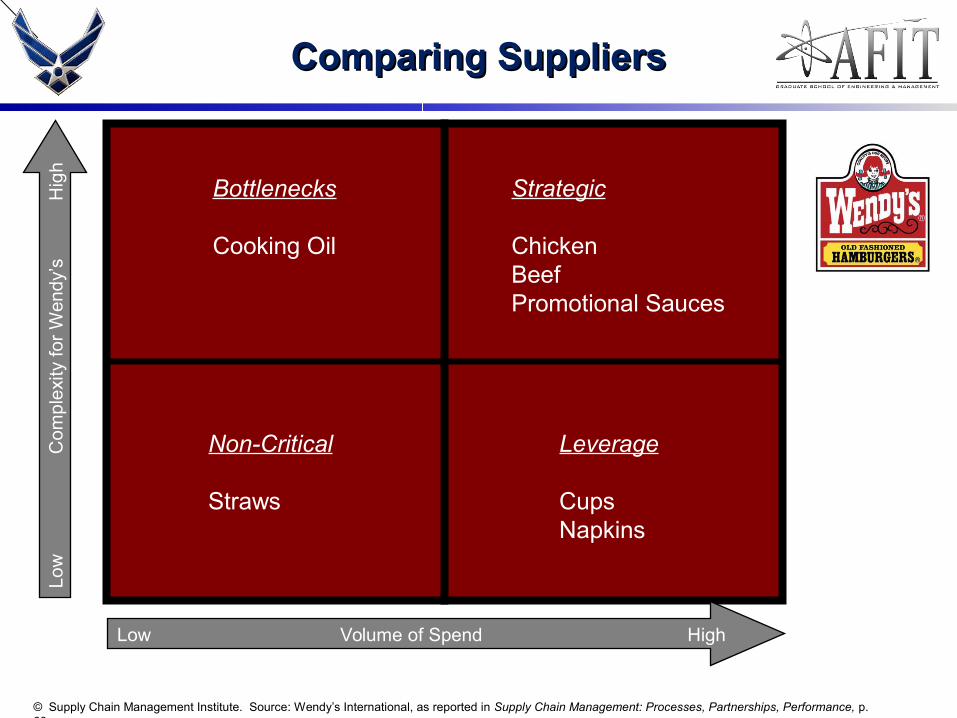
Comparing SuppliersComparing Suppliers
Bottlenecks
Cooking Oil
Strategic
ChickenBeefPromotional Sauces
Non-Critical
Straws
Leverage
CupsNapkins
Low Volume of Spend High
Low
C
ompl
exity
for
Wen
dy’s
H
igh
© Supply Chain Management Institute. Source: Wendy’s International, as reported in Supply Chain Management: Processes, Partnerships, Performance, p. 60.
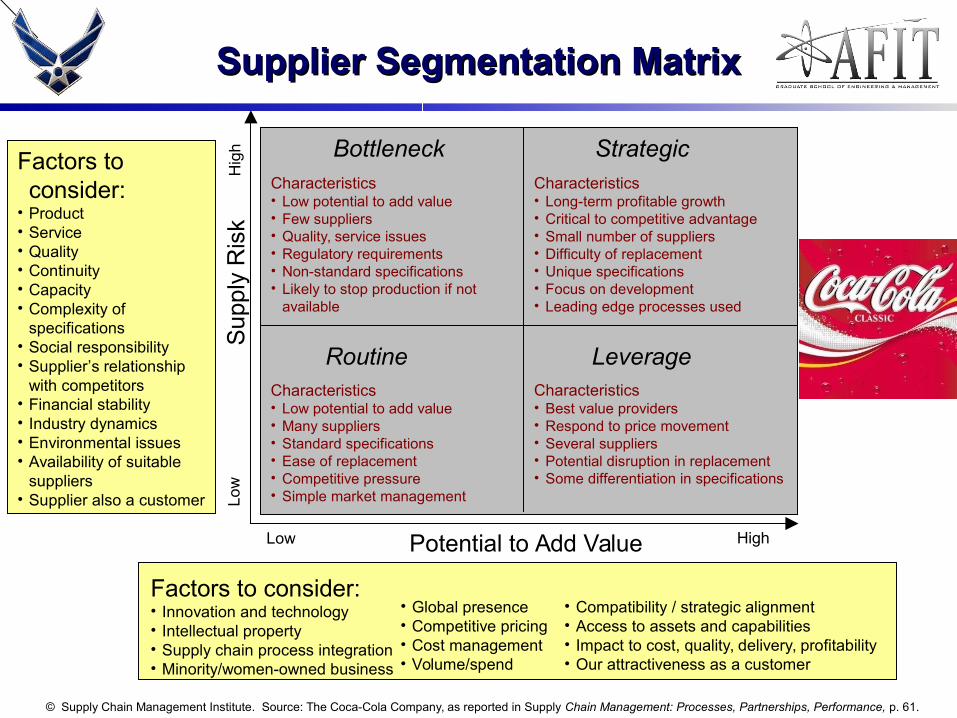
Supplier Segmentation MatrixSupplier Segmentation Matrix
Factors to consider:
• Product• Service• Quality• Continuity• Capacity• Complexity of
specifications• Social responsibility• Supplier’s relationship
with competitors• Financial stability• Industry dynamics• Environmental issues• Availability of suitable
suppliers• Supplier also a customer
Factors to consider:• Innovation and technology• Intellectual property• Supply chain process integration• Minority/women-owned business
• Global presence• Competitive pricing• Cost management• Volume/spend
• Compatibility / strategic alignment• Access to assets and capabilities• Impact to cost, quality, delivery, profitability• Our attractiveness as a customer
Sup
ply
Ris
k
Potential to Add Value
Lo
w
Low High
Hig
h StrategicBottleneck
LeverageRoutineCharacteristics• Best value providers• Respond to price movement• Several suppliers• Potential disruption in replacement• Some differentiation in specifications
Characteristics• Low potential to add value• Many suppliers• Standard specifications• Ease of replacement• Competitive pressure• Simple market management
Characteristics• Low potential to add value• Few suppliers• Quality, service issues• Regulatory requirements• Non-standard specifications• Likely to stop production if not
available
Characteristics• Long-term profitable growth• Critical to competitive advantage• Small number of suppliers• Difficulty of replacement• Unique specifications• Focus on development• Leading edge processes used
© Supply Chain Management Institute. Source: The Coca-Cola Company, as reported in Supply Chain Management: Processes, Partnerships, Performance, p. 61.
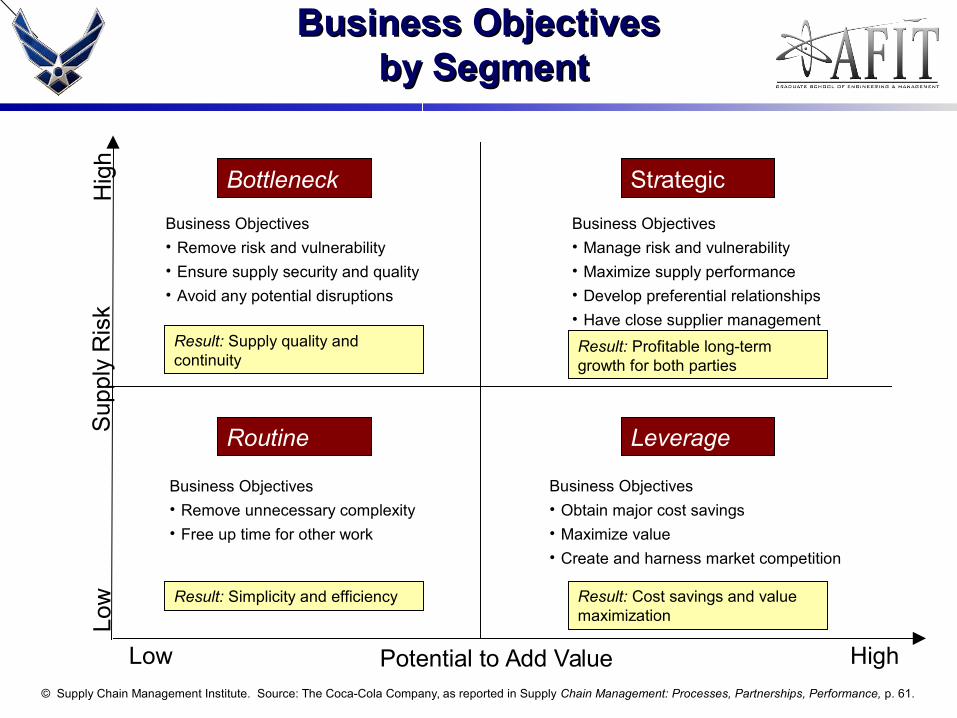
Business ObjectivesBusiness Objectives by Segment by Segment
StrategicBottleneck
LeverageRoutine
Potential to Add ValueLow High
Sup
ply
Ris
kLo
wH
igh
Business Objectives
• Remove risk and vulnerability
• Ensure supply security and quality
• Avoid any potential disruptions
Business Objectives
• Manage risk and vulnerability
• Maximize supply performance
• Develop preferential relationships
• Have close supplier management
Business Objectives
• Remove unnecessary complexity
• Free up time for other work
Business Objectives
• Obtain major cost savings
• Maximize value
• Create and harness market competition
Result: Supply quality and continuity
Result: Profitable long-term growth for both parties
Result: Simplicity and efficiency Result: Cost savings and value maximization
© Supply Chain Management Institute. Source: The Coca-Cola Company, as reported in Supply Chain Management: Processes, Partnerships, Performance, p. 61.
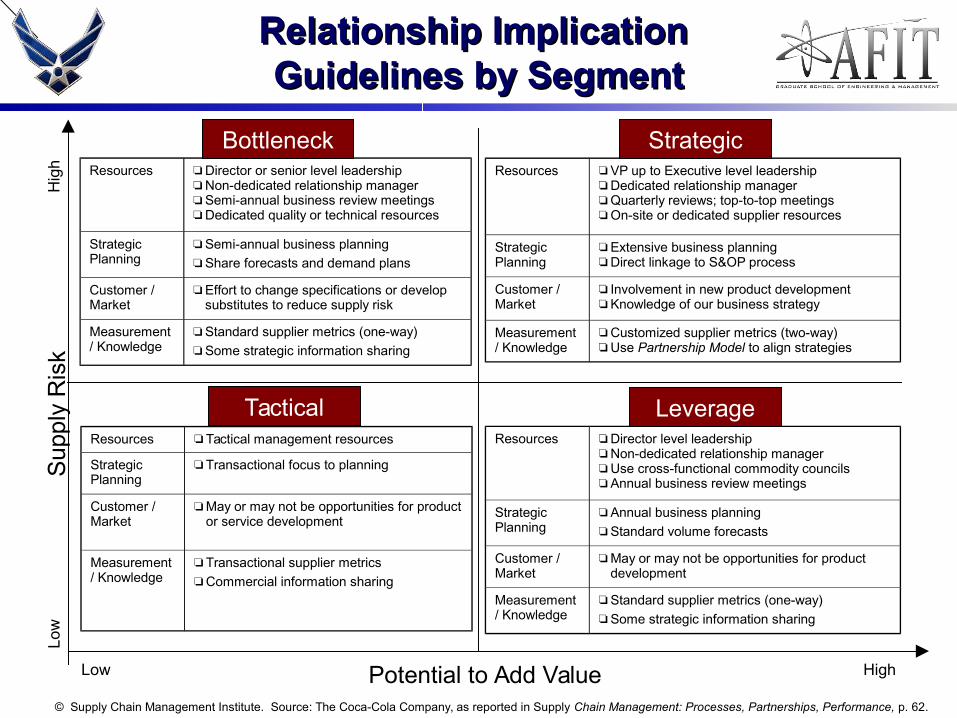
Relationship Implication Relationship Implication Guidelines by SegmentGuidelines by Segment
Resources Director or senior level leadership Non-dedicated relationship manager Semi-annual business review meetings Dedicated quality or technical resources
Strategic Planning
Semi-annual business planning Share forecasts and demand plans
Customer / Market
Effort to change specifications or develop substitutes to reduce supply risk
Measurement / Knowledge
Standard supplier metrics (one-way)
Some strategic information sharing
Resources Tactical management resources
Strategic Planning
Transactional focus to planning
Customer / Market
May or may not be opportunities for product or service development
Measurement / Knowledge
Transactional supplier metrics Commercial information sharing
Resources VP up to Executive level leadership Dedicated relationship manager Quarterly reviews; top-to-top meetings On-site or dedicated supplier resources
Strategic Planning
Extensive business planning Direct linkage to S&OP process
Customer / Market
Involvement in new product development Knowledge of our business strategy
Measurement / Knowledge
Customized supplier metrics (two-way) Use Partnership Model to align strategies
Resources Director level leadership Non-dedicated relationship manager Use cross-functional commodity councils Annual business review meetings
Strategic Planning
Annual business planning Standard volume forecasts
Customer / Market
May or may not be opportunities for product development
Measurement / Knowledge
Standard supplier metrics (one-way) Some strategic information sharing
StrategicBottleneck
LeverageTactical
Potential to Add ValueLow High
Sup
ply
Ris
kL
ow
Hig
h
© Supply Chain Management Institute. Source: The Coca-Cola Company, as reported in Supply Chain Management: Processes, Partnerships, Performance, p. 62.
Strategic Sub-Process #3Strategic Sub-Process #3
Provide Guidelines for the DegreeProvide Guidelines for the Degree of Customization in of Customization in
the Product and Service Agreementthe Product and Service Agreement
• Consider quality/cost implications of various differentiation alternatives.
• Select boundaries for degree of differentiation.
© Supply Chain Management Institute. Source: Supply Chain Management: Processes, Partnerships, Performance.
Strategic Sub-Process #4Strategic Sub-Process #4
Develop Framework of Metrics Develop Framework of Metrics
• Outline metrics of interest.
• Relate metrics to the supplier’s impact on profitability and the profitability for the supplier.
© Supply Chain Management Institute. Source: Supply Chain Management: Processes, Partnerships, Performance.
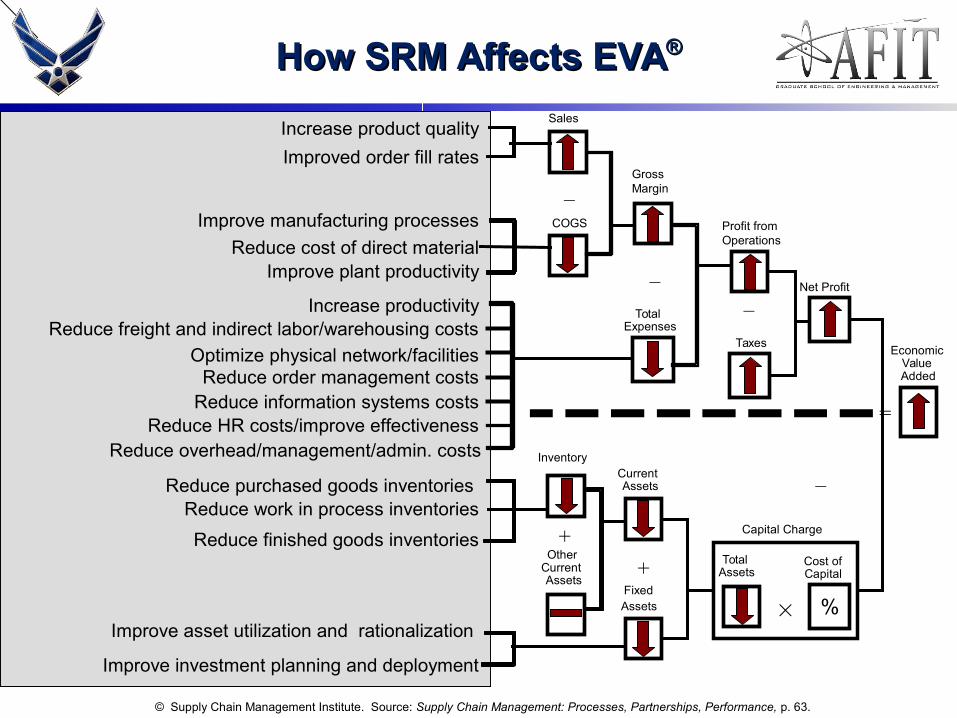
Improve manufacturing processes
%
Net Profit
Profit from Operations
Taxes
TotalExpenses
Gross Margin
Cost ofCapital
Inventory
TotalAssets
CurrentAssets
FixedAssets
OtherCurrent Assets
–
–
+
+
Sales
EconomicValueAdded
=
COGS
–
–
Capital Charge
© Supply Chain Management Institute. Source: Supply Chain Management: Processes, Partnerships, Performance, p. 63.
How SRM Affects EVAHow SRM Affects EVA®®
Increase product quality
Improved order fill rates
Reduce cost of direct materialImprove plant productivity
Reduce purchased goods inventories Reduce work in process inventories
Reduce finished goods inventories
Improve asset utilization and rationalization
Improve investment planning and deployment
Increase productivityReduce freight and indirect labor/warehousing costs
Optimize physical network/facilitiesReduce order management costs
Reduce overhead/management/admin. costsReduce HR costs/improve effectiveness
Reduce information systems costs
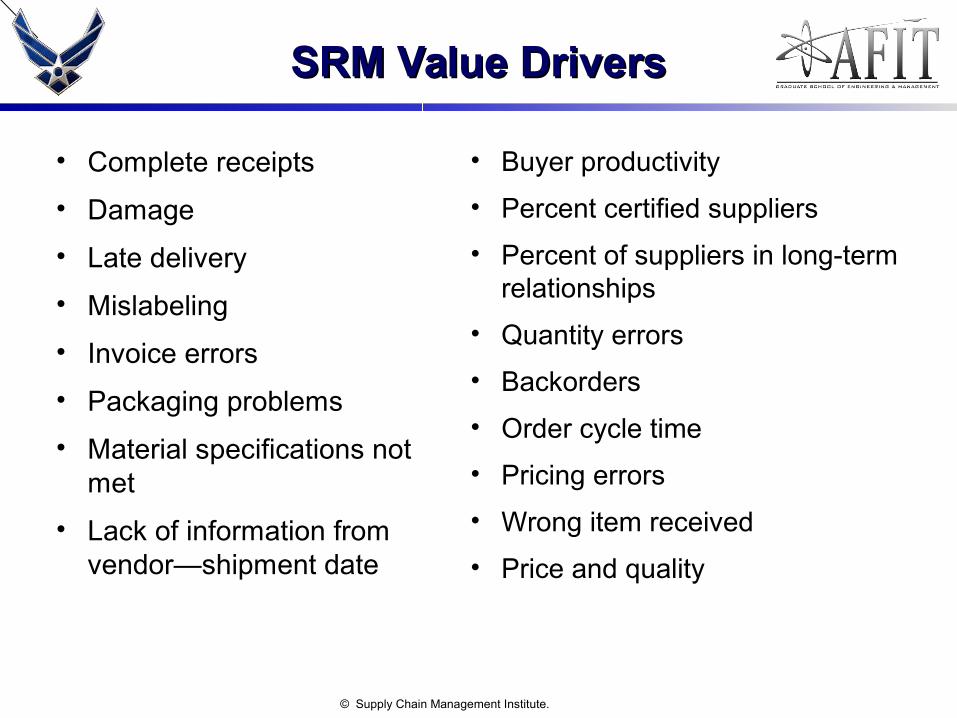
SRM Value DriversSRM Value Drivers
• Complete receipts
• Damage
• Late delivery
• Mislabeling
• Invoice errors
• Packaging problems
• Material specifications not met
• Lack of information from vendor—shipment date
• Buyer productivity
• Percent certified suppliers
• Percent of suppliers in long-term relationships
• Quantity errors
• Backorders
• Order cycle time
• Pricing errors
• Wrong item received
• Price and quality
© Supply Chain Management Institute.
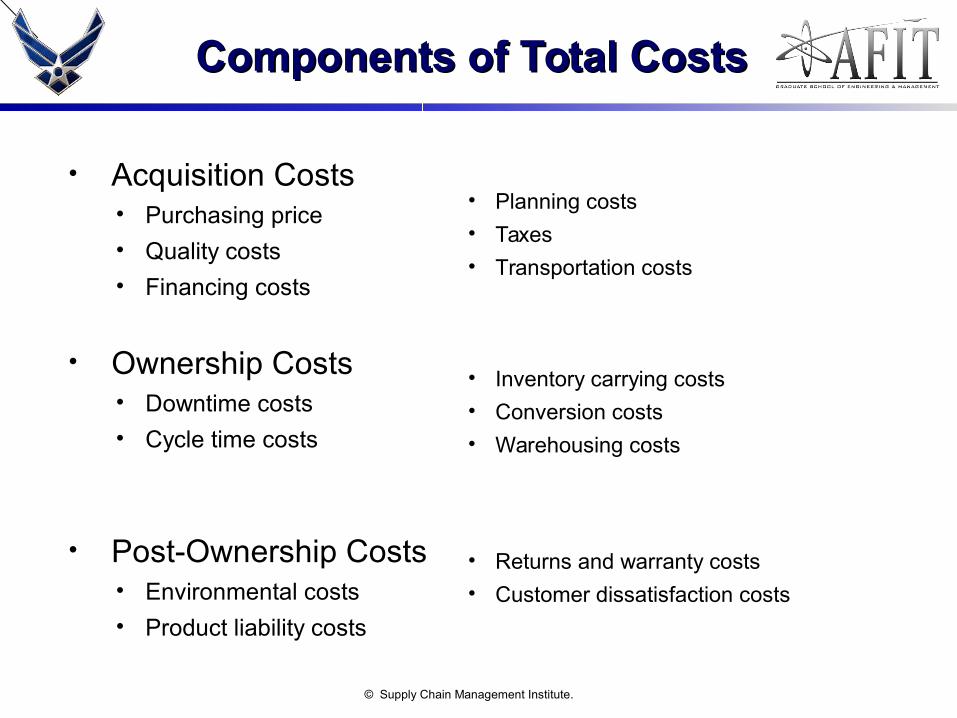
Components of Total CostsComponents of Total Costs
• Acquisition Costs• Purchasing price
• Quality costs
• Financing costs
• Ownership Costs• Downtime costs
• Cycle time costs
• Post-Ownership Costs• Environmental costs
• Product liability costs
• Planning costs
• Taxes
• Transportation costs
• Inventory carrying costs
• Conversion costs
• Warehousing costs
• Returns and warranty costs
• Customer dissatisfaction costs
© Supply Chain Management Institute.
Strategic Sub-Process #5Strategic Sub-Process #5
Develop Guidelines for Sharing Process Develop Guidelines for Sharing Process Improvement Benefits with SuppliersImprovement Benefits with Suppliers
• Outline options for sharing the benefits of process improvements.
© Supply Chain Management Institute. Source: Supply Chain Management: Processes, Partnerships, Performance.
ConclusionsConclusions
• SRM provides the structure for how relationships with suppliers are developed and maintained.
• The PSA provides the “rules of engagement” and sets expectations for both sides of the relationship.
• Relationship performance should be measured by the impact it has on each firm’s profitability.
© Supply Chain Management Institute. Source: Supply Chain Management: Processes, Partnerships, Performance.