Embed Size (px)
Citation preview
1
Regional Economic Prospects in
EBRD Countries of Operations: May 20141
EBRD Office of the Chief Economist
Overview
The Ukraine/Russia crisis weighs on transition region's growth
Since our forecast in January 2014, events in Ukraine/Russia have significantly
increased geopolitical and economic uncertainty, with direct negative effects on the
economies of Ukraine and Russia and potentially wider implications for the region as
a whole. Turkey's outlook has also worsened due to domestic political risks and
persistent macroeconomic imbalances. A more positive outlook for the Eurozone,
which is benefiting central and south-eastern European countries in particular, will
be more than outweighed by increased geopolitical uncertainty for the whole region.
The outlook for growth in the transition region has thus materially deteriorated
compared with the January 2014 forecast, dashing hopes that the continuous decline
in the region's growth rate since 2011 would be reversed in 2014. Our central
scenario foresees growth in the transition region to slow further to 1.4 per cent in
2014 from 2.3 per cent in 2013, and compared with 2.7 per cent in our January
forecast. The negative spillovers are expected to be largely contained to the
neighbourhood of Russia and Ukraine under our central scenario, though several
central and south-eastern European economies will also see some impact. A modest
pickup to 1.9 per cent is possible in 2015 provided that the Ukraine/Russia crisis does
not escalate.
However, unusually high uncertainty surrounds this forecast with major risks on the
downside. Under a less benign scenario including the imposition of financial
sanctions in particular, Russia would slip into recession and average growth in the
region would grind to a halt in 2014-15.
Regional overview
Since our January forecast, three major developments have reshaped the
economic outlook for the transition region. First, events in Ukraine have markedly
increased geopolitical uncertainty and economic risks for the region, though these
risks have thus far been contained to a few neighbouring countries. Russia’s already
weak growth outlook has suffered a blow as a result of the tensions. Second, pressures
from the tapering of the quantitative easing (QE) in the United States on market
interest rates and capital flows into the emerging markets have eased at least for now.
Third, recovery in the Eurozone has gained some momentum and even crisis-hit
periphery countries have managed to issue new debt in international markets. On
1 This document is provided as a companion to the EBRD’s growth forecasts for its countries of
operations, which are released four times a year. For more comprehensive coverage of economic
policies and structural changes, the reader is referred to the EBRD’s Transition Report 2013 as well as
country strategies and updates and statistical series on economic and structural reform variables, which
are all available on the EBRD’s website (www.ebrd.com).
2
balance, however, for the region as a whole the positive impact of the latter two
developments will likely be overshadowed by the unfolding crisis in Ukraine.
Events in Ukraine have raised uncertainty in the region and increased
market volatility. As the situation in Crimea escalated in late February/early
March, Russian equity markets plunged by 10 per cent in a single day and
downward pressure on the rouble intensified, despite a 150 basis point interest
rate hike by the Central Bank of Russia (CBR) on 3 March 2014. In the first
quarter of 2014 growth in Russia is estimated to have decelerated to below one
per cent year-on-year and net private capital outflows reached the amount of
total outflows of the whole year of 2013. The Ministry of Finance has had to
cancel three government bond auctions in a row due to lack of demand and the
CBR hiked rates again in late April. Syndicated loans were 70 percent lower
for Russia (year-on-year, adjusting for Rosneft’s acquisition loan in the first
quarter of last year) and major global banks started deleveraging. In Ukraine,
the currency plunged by 28 per cent between January and early May and CDS
spreads have widened by around 400 basis points. The announcement of a
staff-level agreement on an IMF programme lifted market sentiment in late
March but subsequent news from eastern Ukraine has unsettled markets again,
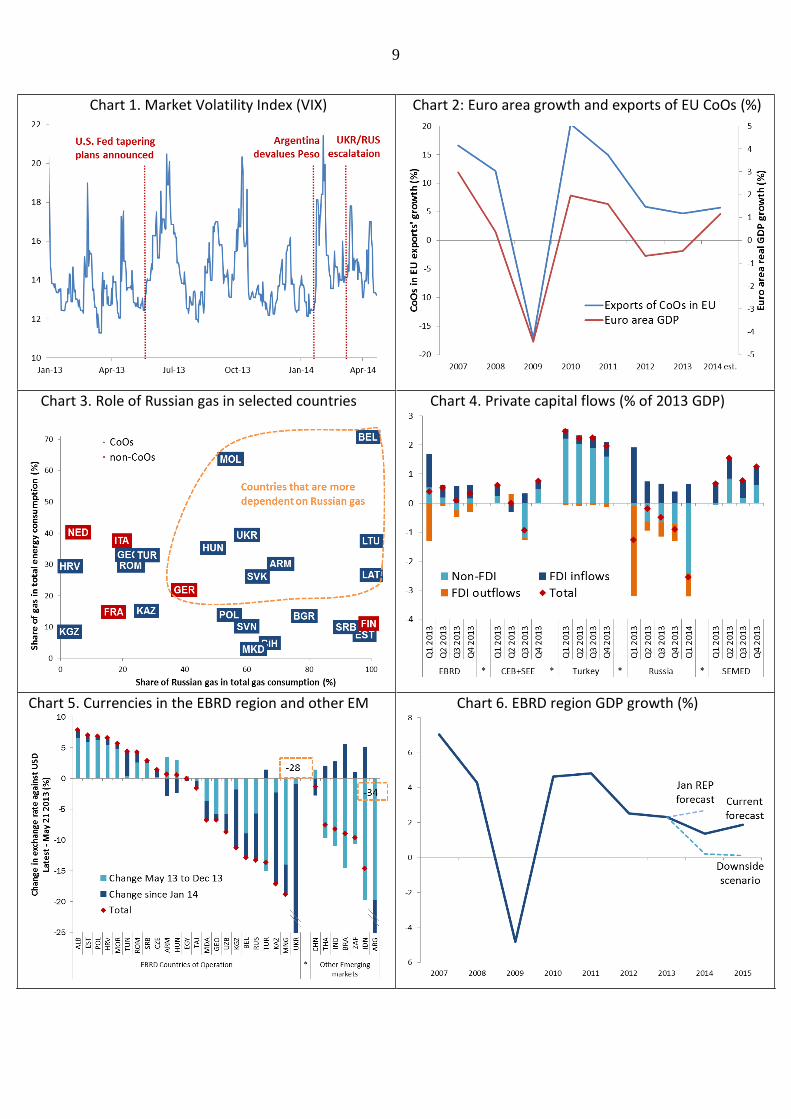
with CDS spreads over 1,200 basis points. Global market volatility also spiked
around the time of the referendum in Crimea (Chart 1).
Pressures on emerging markets stemming from QE tapering in the US
have reduced recently, following significant volatility in May-December
2013. Interest rates and emerging market currencies have stabilized in the first
four months of 2014, despite the fact that QE monthly purchases have been
reduced. Moderating pressures reflect expectations of a slower tightening of
monetary policy in advanced markets and better policy communication. In
addition, emerging markets also stand to benefit from faster export market
growth associated with higher growth in advanced economies that had
prompted the QE tapering in the first place. Larger buffers and stronger policy
frameworks have also helped cushion emerging markets from market
volatility. There is now also an expectation that long-term interest rates will
stay lower longer due to generally suppressed post-crisis demand conditions
(“secular stagnation”).
The recovery in the Eurozone is taking hold (Chart 2). The single currency
area grew at the rate of 0.3 per cent in the last quarter of 2013 (1.2 per cent in
annualised terms) and Greece and Portugal were able to access international
debt markets at reasonably favourable rates. Purchasing managers indices and
indicators of consumer and business confidence suggest further strengthening
of economic performance in the first half of 2014. Recovery gained
momentum in advanced countries more broadly, including in the United
States, the United Kingdom and Japan. By contrast, China’s growth
decelerated somewhat in the first quarter of 2014 to 7.4 per cent, and is widely
expected to remain around this level for the remainder of the year.
Recovery in the Eurozone is particularly benefitting countries which have the
closest links to it – central Europe and the Baltics (CEB) and south-eastern
Europe (SEE). Growth in the last quarter of 2013 in these regions was stronger than
initially estimated, particularly in Poland, and even Slovenia returned to positive
3
growth in that quarter. However, serious energy security concerns have arisen in
many countries in view of the dependence on energy sources (primarily gas but also
oil) from Russia (Chart 3) and other signs of contagion such as reduced access to
finance for firms with financial linkages to Russian entities.
Growth in the Eastern Europe and the Caucasus (EEC) region accelerated
towards the end-2013, but the outlook has worsened considerably in early 2014
amidst tensions in Ukraine. A growth pick-up in the last quarter of 2013 was in part
driven by a good harvest season. At the same time, this strong growth in agriculture
was not sufficient to compensate for the general slowdown in many other sectors
during the year as well as weak investment activity. The region is at risk of direct
material impact from the Ukraine/Russia crisis. Intensifying trade linkages with the
EU in the context of the Association Agreements, including Deep and Comprehensive
Free Trade Agreements (AA/DCFTA) expected to be signed by Moldova and Georgia
by June 2014 should help redirect exports over the medium term.
Growth has so far remained strong in Central Asia. Large new mining and
hydrocarbon extraction projects contributed to growth in Kazakhstan, Mongolia and
Turkmenistan. Remittances from Russia to the Kyrgyz Republic, Tajikistan and
Uzbekistan continued to grow, notwithstanding Russia’s slowdown, providing an
important source of external financing and consumer demand. However, a further
lowering of Russian growth would affect several of these countries negatively.
Despite political uncertainty and global shifts in sentiment last summer,
Turkey’s economy expanded by 4 per cent in 2013, somewhat more than
expected. Growth was primarily driven by private consumption and inventories,
whereas net exports have been a drag, pushing the current account deficit to 7.9
percent of GDP, one of the highest on recent record. Meanwhile, average annual
inflation reached 7.7 per cent in March 2014, remaining above the central bank’s
target of 5 per cent for the third consecutive year.
Recovery in the South-eastern Mediterranean (SEMED) has been slow due to a
combination of domestic and external shocks. Protracted political transition and
volatile security conditions have weighed on economic activity in Egypt and, until
recently, Tunisia. However, Tunisia has seen significant progress in political
transition in recent months, with expected positive spillovers onto the economy going
forward. Regional turmoil continues to adversely affect Jordan’s economy and strain
the country's public services. At the same time, growth in Morocco accelerated
markedly in 2013 reflecting a strong harvest, and increased FDI thanks to a relatively
more favourable policy environment. Improvements in the Eurozone should provide
support for export, tourism and remittance flows to Morocco and Tunisia, which are
closely linked to the economies in the southern part of the monetary zone.
Capital flows and currency movements
Private capital flows to the transition region as a whole have remained relatively
low. While the aggregate flows recovered somewhat in the fourth quarter of the year
compared with the low of the third quarter, they remain modest, as FDI inflows into
SEE and CEB have been partly offset by the impact of cross-border deleveraging and
capital outflows from Russia. The latter accelerated further in the first quarter of 2014
(Chart 4).
4
Several currencies and stock markets in the region have experienced downward
pressures (Chart 5). The Ukrainian Hryvnia depreciated by around 28 per cent
against the US dollar in the first four months of the year, and the Russian rouble
depreciated by 9 per cent against the policy basket of US dollar and euro over the
same period. Depreciation in Russia led to increasing expectations of downward
exchange rate movements in some of the neighbouring countries, where residents
increased purchases of foreign currency. In response to these pressures, in early
February the National Bank of Kazakhstan made a one-off downward adjustment to
the tenge’s tightly managed exchange rate against the US dollar resulting in a
devaluation of around 16 per cent. The Kyrgyz som subsequently also weakened
against the US dollar. Mongolia’s currency continued depreciating as the economy
faced an adverse terms of trade shock and uncertainty regarding major mining
projects.
The pressure on a number of regional currencies thus has mainly reflected
country-specific factors and increased geopolitical uncertainty in the region. In
contrast, emerging market currencies in Asia, Latin America and the Middle East
regions have tended to appreciate slightly over the same period, (with the notable
exception of Argentina), as tapering-related pressures on emerging markets eased.
This contrasts with the trends of the second half of 2013 when emerging markets in
Europe and Central Asia generally performed better than emerging market peers
elsewhere, as discussed in the November 2013 Regional Economic Prospects (see
also Chart 5).
Credit conditions
Cross-border deleveraging in the region continued. Sustained deleveraging is
delaying the resumption of credit growth, particularly in CEB and SEE. While credit
surveys indicate a growing demand for loans, local and international funding
conditions continued to tighten. However, the pace of tightening slowed, compared
with the third quarter of 2013, as concerns about the impact of QE tapering on
domestic markets subsided and a number of policy rate cuts in the region took effect.
Credit standards were tightened further across all loan categories, except for business
loans.
In addition, an overhang of non-performing loans (NPLs) continues to hold back
the recovery. NPL ratios continued rising in Hungary, Slovenia, and most SEE
countries. All these countries and Ukraine now have NPL ratios close to or above 20
per cent. In Kazakhstan, the NPL ratio persistently exceeds 30 per cent,
notwithstanding a slight decline recently. Completion of asset quality reviews in
several CEB countries may lead to further revisions of NPL estimates and NPLs in
Ukraine may rise significantly in the aftermath of the crisis.
Inflation
In line with global trends, inflation rates continued to decline in most countries.
Lower inflation reflects weaker demand pressures against the background of slower
growth in emerging markets, high unemployment in advanced economies and lower
prices of agricultural and energy commodities, as the commodity supercycle appears
to be over (though energy price volatility is possible around the Ukraine/Russia
events). Administrative reductions in utility tariffs in a number of countries also
5
contributed to lower inflation. In Egypt and Mongolia, however, inflation rates
remained high and rising, and inflation in Russia and Turkey remains above the
central bank’s target range. Ukraine will see a temporary spike in inflation due
primarily to pass-through of currency devaluations.
Outlook
Forecasting uncertainty for the EBRD region is unusually high at the current
juncture due to the Ukraine/Russia crisis.
In our baseline scenario, growth in the transition region slows down to 1.4 per
cent in 2014 from 2.3 per cent in 2013, instead of rising to 2.7 per cent as foreseen
in our January forecast, mainly on account of expected slowdown in Russia and
Ukraine with spillovers primarily to neighbouring countries as well as a deceleration
in Turkey (see Chart 6 and Table). Growth is then expected to edge up to only 1.9 per
cent in 2015.
Ukraine’s economy is expected to undergo a major, though gradual, adjustment
with significant short-term output costs. External and fiscal imbalances would be
gradually reduced with the support of an IMF programme, complemented by
assistance from multilateral and bilateral donors and IFIs. Under this baseline
scenario, necessary structural reforms would be implemented on schedule and a
systemic banking crisis would be averted, though fiscal costs of bank recapitalisation
may turn out to be significant. However, ongoing disruptions related to developments
in eastern Ukraine will weigh on growth even without any further escalation. Under
these assumptions, GDP would contract by about 7 per cent in 2014 and growth
would stagnate in 2015.
In Russia, the already weak growth outlook has materially worsened since
February/early March. Investor confidence, which had been already feeble, has
been hit by the events in Ukraine/Russia. It may suffer further, resulting in continued,
and possibly stronger, capital flight, lower investment and hence lower growth,
despite some limited use of the resources from the National Welfare Fund and quasi-
fiscal operations of state-owned entities to support investment. Stubbornly high
inflation and pressure on the rouble may limit the scope for monetary easing while
fiscal policy response is constrained by the current level of oil prices as well as
apparent supply-side bottle-necks. Growth is expected to come to a halt in 2014 and
remain below 1 per cent in 2015.
Increased uncertainty will have a clear negative impact on the region, though
with significant country differences:
The growth outlook for the CEB region was expected to improve significantly
on account of a stronger recovery in the Eurozone as well as improving
domestic demand, but the Ukraine/Russia events are dampening growth rates
to a certain extent. Private investment has recovered in several countries,
lifting growth which has suffered following the financial crisis. Slovenia has
by now emerged from its recession, yet as corporate deleveraging and bank
restructuring continue to unfold, economic growth is unlikely to resume with
much momentum for the time being. As elsewhere in the Eurozone periphery,
risk spreads on bond issuance have been compressed thus far, allowing the
6
government to meet much of this year’s funding needs. Croatia in contrast will
continue to remain in recession (growth of -0.5 per cent in 2014) on the basis
of depressed investment and credit. Croatia is the only country in the transition
region, other than crisis-hit Ukraine, that continues to remain in recession. At
the same time, the three Baltic states’ trade and investment linkages to Russia
and Ukraine are significant, and financial contagion in the form of reduced
access of funding to firms with contacts to Russian businesses – possibly out
of fear of Iran-type financial sanctions – may deepen. Several central
European countries are also dependent on Russia’s gas and oil (Chart 3).
Greater risk aversion in bank and bond market funding is more likely to
present a downside risk to growth this year.
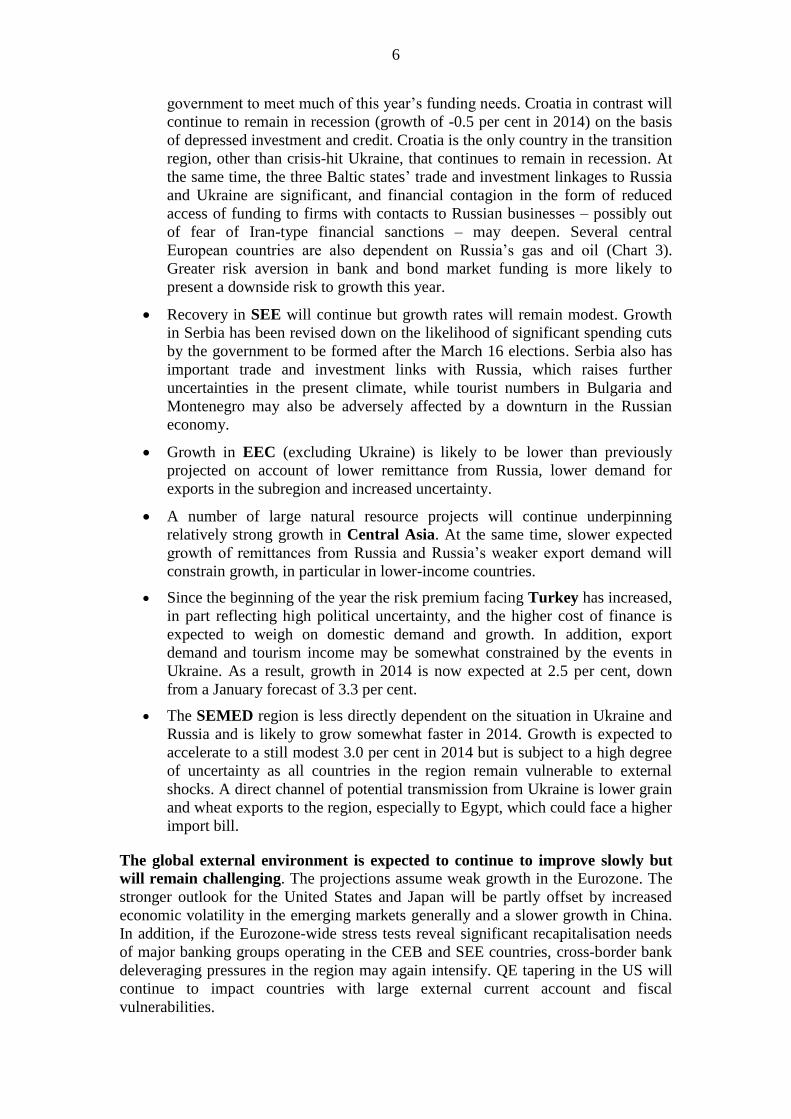
Recovery in SEE will continue but growth rates will remain modest. Growth
in Serbia has been revised down on the likelihood of significant spending cuts
by the government to be formed after the March 16 elections. Serbia also has
important trade and investment links with Russia, which raises further
uncertainties in the present climate, while tourist numbers in Bulgaria and
Montenegro may also be adversely affected by a downturn in the Russian
economy.
Growth in EEC (excluding Ukraine) is likely to be lower than previously
projected on account of lower remittance from Russia, lower demand for
exports in the subregion and increased uncertainty.
A number of large natural resource projects will continue underpinning
relatively strong growth in Central Asia. At the same time, slower expected
growth of remittances from Russia and Russia’s weaker export demand will
constrain growth, in particular in lower-income countries.
Since the beginning of the year the risk premium facing Turkey has increased,
in part reflecting high political uncertainty, and the higher cost of finance is
expected to weigh on domestic demand and growth. In addition, export
demand and tourism income may be somewhat constrained by the events in
Ukraine. As a result, growth in 2014 is now expected at 2.5 per cent, down
from a January forecast of 3.3 per cent.
The SEMED region is less directly dependent on the situation in Ukraine and
Russia and is likely to grow somewhat faster in 2014. Growth is expected to
accelerate to a still modest 3.0 per cent in 2014 but is subject to a high degree
of uncertainty as all countries in the region remain vulnerable to external
shocks. A direct channel of potential transmission from Ukraine is lower grain
and wheat exports to the region, especially to Egypt, which could face a higher
import bill.
The global external environment is expected to continue to improve slowly but
will remain challenging. The projections assume weak growth in the Eurozone. The
stronger outlook for the United States and Japan will be partly offset by increased
economic volatility in the emerging markets generally and a slower growth in China.
In addition, if the Eurozone-wide stress tests reveal significant recapitalisation needs
of major banking groups operating in the CEB and SEE countries, cross-border bank
deleveraging pressures in the region may again intensify. QE tapering in the US will
continue to impact countries with large external current account and fiscal
vulnerabilities.
7
Risks to the outlook
The risks to the economic outlook are concentrated on the downside:
Escalation of the crisis and/or a disorderly adjustment of Ukraine’s economy
could have significant negative impact on investor confidence, growth, trade
and possibly energy and food security in the region. In particular, many
countries in CEB, SEE and EEC rely heavily on imports of Russian gas (Chart
3).
Heightened tensions and economic difficulties in Ukraine are likely to be
associated with intensified capital flight from Russia, leading to a sharp drop
in investment. Lower demand from Russia will impact negatively countries
that have close trade and financial links with it.
A lower growth of remittances will particularly affect Tajikistan, the Kyrgyz
Republic, Moldova and Armenia.
Heightened geopolitical uncertainty may lead to temporary oil price spikes.
Currencies in a number of countries in EEC and Central Asia may come under
stronger pressure in case of a significant depreciation in Russia coupled with
the devaluation in Kazakhstan in February.
Under a more negative scenario, Russian economy would enter recession and
output contraction in Ukraine would deepen. Coupled with increased risk aversion
in global markets, this would bring growth in the EBRD region to a standstill (Chart
6). At this point, the Russia/Ukraine crisis would start impacting the global economy.
8
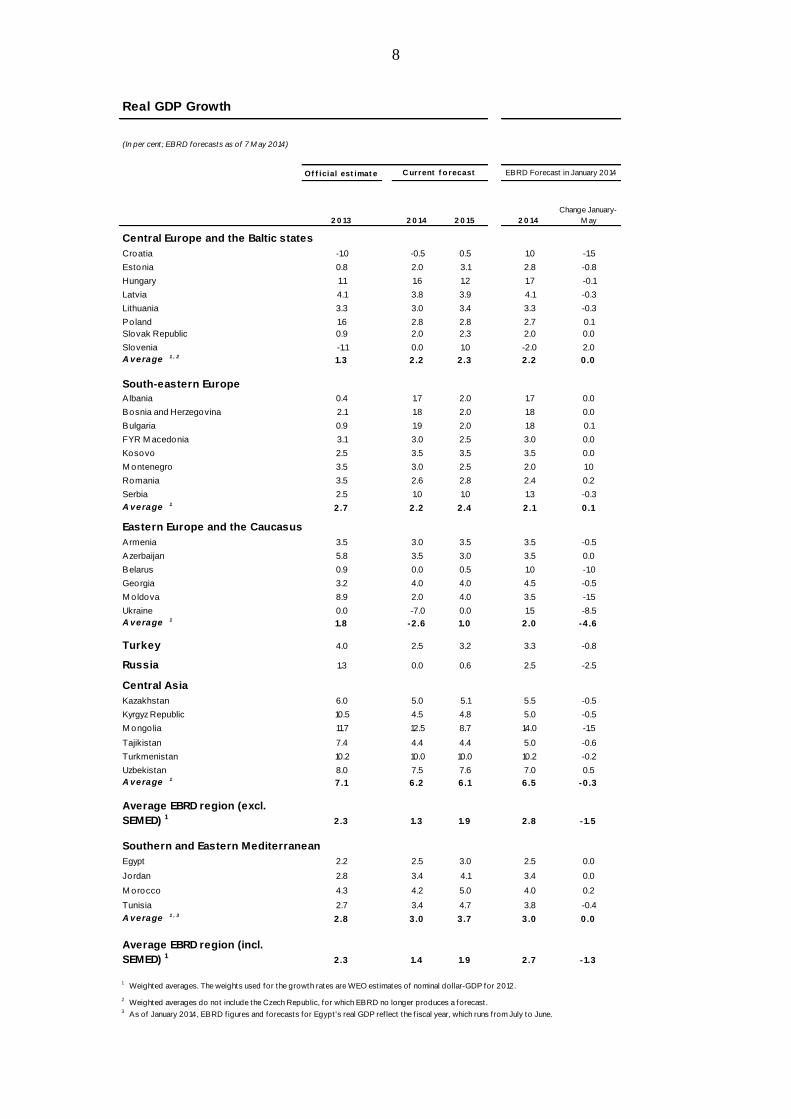
Real GDP Growth
Of f icial est imat e
2 0 13 2 0 14 2 0 15 2 0 14
Change January-
M ay
Central Europe and the Baltic states
Croatia -1.0 -0.5 0.5 1.0 -1.5
Estonia 0.8 2.0 3.1 2.8 -0.8
Hungary 1.1 1.6 1.2 1.7 -0.1
Latvia 4.1 3.8 3.9 4.1 -0.3
Lithuania 3.3 3.0 3.4 3.3 -0.3
Poland 1.6 2.8 2.8 2.7 0.1
Slovak Republic 0.9 2.0 2.3 2.0 0.0
Slovenia -1.1 0.0 1.0 -2.0 2.0
A verage 1 , 21.3 2.2 2.3 2.2 0.0
A verage 1 , 2
South-eastern Europe
Albania 0.4 1.7 2.0 1.7 0.0
Bosnia and Herzegovina 2.1 1.8 2.0 1.8 0.0
Bulgaria 0.9 1.9 2.0 1.8 0.1
FYR M acedonia 3.1 3.0 2.5 3.0 0.0
Kosovo 2.5 3.5 3.5 3.5 0.0
M ontenegro 3.5 3.0 2.5 2.0 1.0
Romania 3.5 2.6 2.8 2.4 0.2
Serbia 2.5 1.0 1.0 1.3 -0.3
A verage 12.7 2.2 2.4 2.1 0.1
Eastern Europe and the Caucasus
Armenia 3.5 3.0 3.5 3.5 -0.5
Azerbaijan 5.8 3.5 3.0 3.5 0.0
Belarus 0.9 0.0 0.5 1.0 -1.0
Georgia 3.2 4.0 4.0 4.5 -0.5
M oldova 8.9 2.0 4.0 3.5 -1.5
Ukraine 0.0 -7.0 0.0 1.5 -8.5
A verage 11.8 -2.6 1.0 2.0 -4.6
Turkey 4.0 2.5 3.2 3.3 -0.8
Russia 1.3 0.0 0.6 2.5 -2.5
Central Asia
Kazakhstan 6.0 5.0 5.1 5.5 -0.5
Kyrgyz Republic 10.5 4.5 4.8 5.0 -0.5
M ongolia 11.7 12.5 8.7 14.0 -1.5
Tajikistan 7.4 4.4 4.4 5.0 -0.6
Turkmenistan 10.2 10.0 10.0 10.2 -0.2
Uzbekistan 8.0 7.5 7.6 7.0 0.5
A verage 17.1 6.2 6.1 6.5 -0.3
Average EBRD region (excl.
SEMED) 1 2.3 1.3 1.9 2.8 -1.5
Southern and Eastern Mediterranean
Egypt 2.2 2.5 3.0 2.5 0.0
Jordan 2.8 3.4 4.1 3.4 0.0
M orocco 4.3 4.2 5.0 4.0 0.2
Tunisia 2.7 3.4 4.7 3.8 -0.4
A verage 1 , 32.8 3.0 3.7 3.0 0.0
Average EBRD region (incl.
SEMED) 1 2.3 1.4 1.9 2.7 -1.3
3 As of January 2014, EBRD f igures and forecasts for Egypt 's real GDP ref lect the f iscal year, which runs from July to June.
1 Weighted averages. The weights used for the growth rates are WEO est imates of nominal dollar-GDP for 2012.
2 Weighted averages do not include the Czech Republic, for which EBRD no longer produces a forecast.
(In per cent; EBRD forecasts as of 7 M ay 2014)
C urrent f o recast EBRD Forecast in January 2014
9
Chart 1. Market Volatility Index (VIX)
Chart 2: Euro area growth and exports of EU CoOs (%)
Chart 3. Role of Russian gas in selected countries
Chart 4. Private capital flows (% of 2013 GDP)
Chart 5. Currencies in the EBRD region and other EM
Chart 6. EBRD region GDP growth (%)
10
Central Europe and the Baltic States (CEB)
Growth rates in the CEB region have continued to gain momentum since the second
half of 2013, primarily on the back of rebounding demand from the Eurozone. Due to
falling unemployment, historically low inflation rates and increasing real wages in
most countries, private consumption is expected to pick-up gradually. A key positive
development is the incipient recovery in private investment, which reinforces public
investment trends as countries transition into the new period for the disbursement of
EU structural funds. We now expect a recovery in average growth for the eight
countries of the central Europe region to 2.3 per cent, close but still below the growth
rate observed in 2010. Nevertheless, growth in potential output, the level of real GDP
that does not trigger overheating, will continue to lag, given the diminished growth in
the real capital stock, and continued adverse financing conditions for companies.
International financing conditions for the public sector have been remarkably
supportive, so that countries are on the whole well prepared for a change in US
monetary policy and the expected change in capital market conditions. With the
notable exception of the three Baltic countries direct exposures through trade and
investment to Russia and Ukraine are modest. Still, regional security concerns are
beginning to impact financing conditions of companies, in particular at long
maturities, and may dampen confidence of local and foreign investors.
Poland’s recovery continues to accelerate, following last year’s expansion by
1.6 per cent. Labour market developments in the first quarter point to very
strong growth in real wages, and a further expansion in employment. This
should continue to support a more balanced expansion that benefits to a
considerable degree from private consumption. Improving external demand
has also led to a pick-up in industrial production that is set to underpin private
investment, as credit conditions improve further. In a similar vein, currently
low public investment is set to recover as the government has started
disbursing the roughly €106 billion of EU structural funds that are foreseen to
fund infrastructure and R&D projects during the 2014-20 EU financial funding
framework. Our projections are upgraded to 2.8 per cent this year and next.
While the direct exposure through trade to either Russia or Ukraine remains
relatively small, downside risks could materialise in terms of more adverse
financing conditions for enterprises.
Having suffered a second recession in 2012, Hungary’s economy rebounded
last year with growth of 1.1 per cent. A surprisingly brisk expansion of 2.7 per
cent in annual terms in the fourth quarter was mainly driven by domestic
demand. Still, one-off factors such as the administratively decreed reduction in
utility tariffs or the final disbursement of EU grant funds explain much of this.
Total credit continued a contraction that began in 2009. Credit in local
currency turned positive in September last year on the back of the central
bank’s Funding for Growth scheme. The second phase of this programme has
begun only slowly, and is unlikely to overcome the underlying lack of
investment demand. Even though medium-term growth potential remains much
diminished, the recovery in domestic demand can give some impetus in the
short term. On balance, we downgrade our projections to 1.6 per cent this year
and 1.2 per cent in 2015.
11
After a significant slowdown in 2013, GDP growth in the Slovak Republic is
expected to pick up markedly as domestic demand recovers. Last year, gross
investment continued to contract, falling by 4.3 per cent. Private consumption
has remained subdued due to persistent high unemployment (13.9 per cent in
February), even though consumer confidence has steadily improved since the
second half of 2013, along with retail trade data. Industrial production
(excluding construction) has been relatively strong since the end of the last
year, boosted by robust results for manufacturing, primarily stimulated by
recovery in demand from Germany and the pick-up in domestic demand. We
have upgraded our forecasts for growth to 2 per cent this year and 2.3 per cent
next year.
Last year, growth in the Lithuania and Latvia again stood out in the
European context, at 3.3 and 4.1 per cent respectively, while growth in
Estonia slowed down on account of weaker export performance. Private
consumption was one of the main growth drivers in all three economies,
though only in Lithuania gross investments positively contributed to growth.
Going forward, private investments should continue to support growth, given
increasing demand from the Eurozone and recovering business sentiment, in
particular in Latvia where the recent euro adoption has reduced investors’ risk
perceptions. Private consumption is expected to continue to revive, amid
moderate inflation rates and higher real wages in these economies. In contrast
to the other CEB countries, the immediate developments in economic
performance of all three Baltic States are more directly exposed to trade with
Russia to which Lithuania, for instance, sells about 20 per cent of its exports
(13 per cent of GDP).
The year 2013 saw a continuation of the recession in Croatia, with real GDP
dropping by 1 per cent. The economy continues to face long-standing
problems of competitiveness, a large public sector and difficulties in the
business environment. Credit growth has been minimal and the level of NPLs
has risen above 15 per cent of total loans. In January 2014, Croatia entered the
EU’s excessive deficit procedure because of persistent government deficits
above 3 per cent of GDP and a rising level of public debt that is now close to
60 per cent of GDP. In the absence of any obvious growth drivers, GDP
growth may once again be negative this year at around -0.5 per cent, but the
recovery is expected to begin in 2015 on the back of an improved external
environment and the absorption of some EU structural and cohesion funds.
In Slovenia the year-on-year growth rate turned positive in the last quarter of
2013, after two years of recession, although the economy contracted by 1.1 per
cent overall in 2013. The major culprit behind the negative growth was the
depressed domestic demand, which stem from the rising unemployment,
decline in real wages, high cost of finance, and firms’ limited access to capital
and credit. If sustained, the recapitalization and restructuring of banking and
corporate sectors, which commenced following the asset quality review and
stress tests in December, will prove a turning point for Slovenian reforms and
growth. Although it may weigh down on employment and domestic demand,
suppressing growth in the second half of 2014 and in 2015, it will also provide
much better grounds for sustainable growth in the medium to long run. So far,
the credible progress in reforms has boosted the confidence of the market and
led to a fall in the country risk premium and the costs of sovereign financing.
12
It is critical to persevere with the necessary reforms that have been underway
during the past year. Alongside rising export demand from the euro zone this
will partly compensate the above-mentioned temporary negative effect of
restructuring, keeping the economic activity still in 2014 and pushing the
growth up to 1.0 per cent in 2015.
South-Eastern Europe (SEE)
The year 2013 saw a pickup in growth in SEE to 2.7 per cent, relative to 0.2 per cent
in 2012. Growth was driven by several factors, notably by a sizable increase in
exports in most countries and a good harvest. However, domestic demand remains
subdued and foreign direct investment flows continue to lag well behind levels seen in
the pre-crisis years. Several countries in the region face big fiscal challenges, as the
combination of weak growth and the failure to rein in public expenditure to
accompany fiscal tightening on the revenue side, has led to rising fiscal deficits and
public debt levels. In the financial sector, deleveraging pressures persist and the level
of non-performing loans is close to, or has exceeded, 20 per cent of total loans in
several cases. Inflation is low in all countries, helped by the drop in regional and food
prices, although an uptick in global agricultural prices is apparent in recent months
and could cause a renewal of inflationary pressures in the immediate future. Progress
in deeper structural reforms has been limited in the past year, and there have been
regressive steps in some crucial areas such as energy sector reform.
Albania's economic growth was minimal in 2013, reflecting a combination of
weak domestic demand and corporate balance sheets, as well as difficulties in
neighbouring EU countries (Italy and Greece) which have contributed to a
sharp drop in remittances in the past year. Public debt has risen to 70 per cent
of GDP and financial sector vulnerabilities are evident with NPLs of around
23 per cent of total loans. The government has signed a new agreement with
the IMF and, with the support from the World Bank, has started to clear public
arrears to companies, which had surged to more than 5 per cent of GDP. This
should help to alleviate the problems of high NPLs and weak credit growth,
thus contributing to a modest upturn in growth in 2014 and 2015.
Bosnia and Herzegovina’s economy emerged from recession with mild GDP
growth of 2.1 per cent in 2013, mainly due to some improvements in exports.
However, gross fixed capital formation in the last two years has been almost
non-existent, and remittances are far behind their pre-crisis level. Moreover,
an unfavourable political stalemate has held back necessary structural reforms.
The authorities remain committed to reforms agreed under the IMF Stand-By
Arrangement, approved in September 2012 and recently extended into 2015.
Growth is expected to remain around 2 per cent this year and next mainly on
the back of some big infrastructure investments and a further improvement in
exports, but downside risks, both internal and external, remain considerable.
The economy in Bulgaria grew modestly at just under one per cent in 2013.
Export performance improved but weak internal demand and minimal credit
growth are holding back domestic consumption and investment. The
combination of subdued domestic demand and a series of electricity tariff cuts
has led to a negative inflation rate in recent months. Bulgaria’s fiscal position
remains strong. Growth is expected to slightly pick up this year to around 2.0
13
per cent, driven by continual improvement of exports and some recovery in
domestic private consumption.
Economic performance has considerably improved in FYR Macedonia in
2013. Output grew by 3.1 per cent driven primarily by a strong rise in
investment. The country continues to make strong effort to attract much-
needed FDI, and these efforts should maintain positive growth prospects in the
coming years and enable FYR Macedonia to reap the benefits of sustained
macroeconomic stability and business environment reforms that have been
pursued in recent years.
Economic growth in Kosovo in 2013 continued to be high, at an estimated 2.5
per cent, but the country also remains the poorest in SEE, with unemployment
and poverty at elevated levels. The macroeconomic environment is stable,
with low inflation and fiscal deficit and modest levels of public debt. The
economy is expected to grow at 3.5 per cent in the coming years supported by
strong remittance inflows and a pick-up in external demand.
In Montenegro, economic activity picked up in 2013 on the back of strong
growth in electricity production and a good tourism season. However, the
current account deficit at 15 per cent of GDP remains the highest in the region.
In addition, the fiscal position has been weakened by the activation of state
loan guarantees related to aluminium company, KAP, which raised the budget
deficit. Consequently, the public debt has further risen, and now it stands just
below 60 per cent, a 10 percentage point increase relative to 2011. Growth in
2014 is forecast at 3.0 per cent, on account of the improvements in external
demand, as well as the progress in several major infrastructure projects, but
downside risks remain large.
Economic activity in Romania has improved in 2013 above market
expectations. GDP rose by 3.5 per cent mainly on account of a strong export
performance and an exceptional harvest. Inflation returned to the central
bank’s target range of 2-4 per cent and has recently dropped below the lower
band. Fiscal performance has also been good and the country exited the
European Union’s excessive deficit procedure in 2013. Growth is expected to
be around 2.6 per cent in 2014, slightly rising in 2015, driven by exports and a
pick-up in domestic demand. However, the high level of NPLs (over 20 per
cent of total loans), ongoing cross-border deleveraging and increased
uncertainties in the neighbouring Ukraine, may weigh down on growth
prospects in the near term.
Serbia’s economy grew by 2.5 per cent in 2013 on the back of a strong
harvest and a major jump in exports, much of them related to the car industry.
Inflation has fallen significantly in recent months and the March 2014 rate was
below the central bank’s target zone of 2.5 - 5.5 per cent. However, the
country has major fiscal problems, with a large government deficit (above 7
per cent of GDP on a broad definition of the general government deficit) and
public debt above 60 per cent of GDP. NPLs are around 20 per cent of total
loans and also constitute a significant vulnerability for the banking sector and
the economy as a whole. Fiscal tightening is now essential and will constrain
growth in the next two years, but exports will continue to be the main growth
driver in 2014. Growth is expected to drop to 1 per cent in 2014 and 2015, and
14
it can slow further down under the downside scenario of negative external
developments.
Turkey
Economic activity in Turkey picked up in 2013, following a sharp slowdown in 2012.
Despite political uncertainty and global shifts in sentiment during the summer, the
economy expanded by 4 per cent in 2013, somewhat more than expected. The growth
was primarily driven by private consumption and the build-up of inventories, whereas
net exports have been a drag, pushing the current account deficit to 7.9 percent of
GDP.
The country risk premium and thus the cost of finance shot up in the first quarter of
2014 due to elevated political uncertainty, Federal Reserve’s tapering, and necessary
monetary tightening. As a result, lira depreciated around 10 per cent in the three
months by mid-March. Since then, however, following the local elections and Federal
Reserve’s dovish messages, most of the rise in the country risk premium has been
erased, lira appreciated by around 4 per cent, and the exchange rate stabilised.
Meanwhile, average annual inflation reached 9.4 per cent in April 2014, remaining
above the central bank’s target of 5 per cent for the third consecutive year, and is
expected to remain elevated above the target in 2014 at an average of 8.5 per cent,
driven by tax hikes and currency depreciation passing through to inflation, and less
favourable base effects of food and energy prices. The usually persistent core inflation
reached a multi-year high of 9.3 per cent in March, posing a risk to de-anchor
inflationary expectations.
The inflationary pressures will likely keep interest rates, and thus the cost of finance,
high throughout 2014. The higher cost of finance, alongside the introduction of
legislation curtailing credit card spending, is expected to constrain private
consumption and investment activity, and weigh on growth in 2014. Although net
exports may benefit from the recent depreciation and constrained consumption, the
growth in 2014 is expected to moderate to 2.5 per cent. We expect growth to recover
somewhat in 2015 to 3.2 per cent on the back of favourable base effect, opening up
the space for monetary easing, and somewhat elevated business and consumer
confidence resulting in higher contribution of consumption and investment.
The major downside risk is that Fed’s tapering weighs on the flow of foreign funds to
the emerging markets more than expected, where Turkey might take the brunt of the
drain in short term capital flows, with its still large external imbalances mainly
financed through this channel. But on a positive side, the economy proved resilient to
unfavourable circumstances in 2013, with still positive net portfolio inflows, and
continuing access to international markets for both public and private sectors, albeit
with higher interest rates. Besides, banking sector remains well-capitalized and non-
performing loans are low.
While we don’t expect large impact of the Russia/Ukraine crisis on growth outlook in
Turkey, a further deepening of the crisis, especially if it pushes up the price of oil,
would pose a downside risk.
15
Eastern Europe and the Caucasus (EEC)
Growth in the region accelerated towards the end-2013, but underlying weakness
remained. Growth pick-up in the last quarter of 2013 was in part driven by the good
harvest season. This late-2013 acceleration, however, was not enough to compensate
for general slowdown in most economies outside agriculture during the year, reflected
in weaker annual growth rates. Investment activity and FDI inflows remained subdued
across the region, while consumer spending growth moderated. In 2014, crisis in
Ukraine, substantial slowdown in Russia and rapidly increasing geopolitical risks in
the region and enhanced probability of negative cross-border economic and financial
spill-overs will constrain economic activity further. Devaluation of Russian ruble,
Kazakh tenge, Ukrainian hryvnia and Turkish lira in the beginning of the year may
affect competitiveness in the EEC region and impact trade volumes.
Growth in Armenia rebounded in the fourth quarter of 2013, led by
agriculture, industry and financial services. Construction sector showed early
signs of stabilization after steep contraction in the first nine months of the
year. Still, the annual pace of growth slowed down to 3.5 per cent in 2013, the
lowest since 2010. Remittances growth was also weaker than in 2012, and this
weakness persisted into early 2014 mainly due to the fall in the investment
spending in Russia. Cabinet reshuffle and the decision of the Constitutional
Court on the pension reform may increase near-term political uncertainty in
the country and weigh on the private investor confidence. Negative impact on
Armenia’s economy by the expected slowdown in Russia and by the
deteriorating regional security situation may be mitigated by some fiscal
easing (envisaged in the recently announced IMF programme). The 2014 GDP
growth forecast is slightly downgraded to 3 per cent and growth is expected to
accelerate in 2015.
After growing 5.8 per cent in 2013, Azerbaijan’s economy slowed down
considerably in early 2014. Preliminary estimates show that GDP grew by 2.5
per cent year-on-year in the first quarter of 2014 on the back of the fall in oil
output. Non-oil sector continued to grow at fast pace. Credit growth remained
buoyant at the beginning of 2014 and showed little signs of moderating.
Assuming that the fall in oil production is short-lived and non-oil sector
continues expansion, output is expected to grow at the rate of 3.5 per cent in
2014, in line with the January forecast.
Unsustainable policies of the past led to large external imbalances and
economic stagnation in Belarus. After meagre growth in 2013, preliminary
estimates point to a growth of 0.5 per cent year-on-year in January-March
2014. Exports continued to decline in the first two months of 2014 while real
wages growth decelerated from 15.8 per cent in 2013 to 4.4 per cent year-on-
year in January-February 2014. Inflation stayed elevated in the first quarter, at
15.5 per cent on average year-on-year, propelled by relaxation of some
administrative price controls and high nominal wage and credit growth.
Investments plunged by almost 20 per cent year-on-year in January-February
2014 as the government tightened policies to avoid sharp adjustment. Still, as
gross international reserves fell to the critically low level of 1.5 months of
imports as of end-March, Belarus’s economy is in urgent need of external
financing to avoid a sharp adjustment and financial crisis. Timing, source and
16
volume of external support and risks associated with potential expansionary
economic policies in the run-up to the presidential elections in November 2015
generate uncertainty which may lead to a wide range of potential outcomes for
the economy in 2014-2015. The 2014 GDP growth forecast has thus been
revised down to zero, with large downside risks.
In Georgia, growth slowed down to 3.2 per cent in 2013 after a rapid growth
period of 2010 to 2012. The slowdown was reverted in the last quarter of the
year, after the government increased expenditures considerably. The net export
performance had a positive impact on the growth throughout the year on the
back of strengthened demand from the EU and the increased access to the
Russian market for Georgian foodstuffs. October’s presidential elections have
lowered political tensions and paved the way to improved consumer and
business confidence. The Association Agreement with the EU, due to be
signed on 13 June 2014, is expected to boost exports further thanks to the
reduction or removal of trade barriers on agricultural products. However, the
Russia/Ukraine crisis will weigh on growth through lower regional export
demand, more cautious investors, and possibly less favourable tourism
revenues. The growth outlook for Georgia is thus moderately reduced to 4.0
per cent in 2014 and 2015, providing that the Russia/Ukraine crisis does not
significantly deepen.
Moldova registered a record-high growth in 2013 at 8.9 per cent driven by
agricultural recovery and related growth of manufacturing and trade.
Investment activity, including FDI inflow, remained subdued, aggravated by
the weak business environment and poor corporate governance in banks.
Remittances were growing steadily throughout 2013, fuelling private
consumption growth, but some signs of a slowdown emerged by year-end.
With unfolding crisis in Ukraine and deceleration of investment activity in
Russia in 2014, private remittances and export demand for goods from
Moldova may weaken further. Adoption of visa-free regime with the EU could
facilitate labour mobility and support inbound remittances. Parliamentary
elections in 2014 and problems in the financial sector introduce element of
uncertainty. Economic growth is expected to moderate to 2 per cent this year
and accelerate to 4 per cent in 2015.
Ukraine’s economy is going through a painful macroeconomic adjustment
with high short-term costs for growth. As the crisis unfolded, the National
Bank of Ukraine abandoned the currency peg in early February, allowing the
hryvnia to depreciate significantly. Simultaneously, the government embarked
on fiscal austerity and hiked energy tariffs for households and industry.
Significant vulnerabilities in the financial sector constrain credit growth. As a
result, domestic demand is expected to contract this year. Trade liberalisation
with the EU and the hryvnia depreciation may benefit exports, although further
disruption of economic and financial links with Russia will affect investor and
lender confidence and trade flows. GDP is expected to contract by 7.0 per cent
in 2014. Following the developments in the Crimea, any further intervention in
Ukraine would increase the downside risks to the outlook. Structural reforms
are of the essence for the medium-term economic recovery.
17
Russia
The growth outlook for 2014 has been strongly affected by geopolitical tensions.
These have added to the drag of underlying structural factors. Household consumption
growth, one of the main drivers of growth since 2010, went down from almost 8 per
cent in 2012 to below 5 per cent in 2013 also driven by the cooling down of consumer
lending. After fast investment growth driven by the preparations for the Sochi
Olympics, investments declined by more than 6 per cent in 2013 and further in
January-February 2014. Exports were an important growth driver at 4.2 per cent while
imports decelerated in line with lower consumption and investment growth.
The deceleration has been mainly driven by weakening investor and consumer
confidence as well as growing household indebtedness and difficult external
environment. While oil prices remained high, they were slightly lower in year-on-year
terms, not providing enough support for Russian growth. Public and private sector
forecasts for this year have been revised down to the range between 0 and 1 per cent.
Both the central bank and the Ministry of Economic Development consider that recent
growth has been below potential, but high inflation and close-to-full capacity
utilisation limits policy choices to raise growth in a sustainable manner.
Net capital outflows increased driven by lower external borrowing. In the first quarter
of 2014, private sector capital outflows reached US$ 64 billion, exceeding the annual
amount for 2013 or 2012. Unlike the previous years, capital outflows were driven
primarily by lower borrowing rather than more extensive investment abroad. The
corporate sector borrowed only US$ 9 billion in the first quarter 2014 compared to
US$ 36 billion in the first quarter of 2013, due to such factors as weaker investment
activity and more constrained access to external financing. Due to higher capital
outflows and lower current account surplus, the rouble has weakened by more than 10
per cent during 2014 keeping inflation above the central bank’s target level. This,
together with the loss of reserves of almost US$ 50 billion, forced the central bank to
hike interest rates by 150 basis points in March and another 50 basis points in April,
to 7.5 per cent. Inflationary pressures and increased country risk premium may keep
monetary policy tight for a prolonged period.
Fiscal room is limited. Even though the central budget is expected to receive an
additional 1 per cent of GDP due to the substantially weaker rouble and slightly
higher than projected oil prices, there is little capacity to increase spending. Russia’s
fiscal stance is different from the crisis year 2008, as sovereign wealth funds are half
of their pre-crisis levels (as a percentage of GDP), government debt exceeds savings,
and regional debt is rapidly growing. Government bond yields are some 200 basis
points above their 2013 levels, and foreign holdings of sovereign rouble debt went
down from 24 to 22 per cent, as associated demand dwindled. As a result, the
Ministry of Finance was forced to cancel some of its auctions.
GDP is expected to stagnate in 2014 and pick up only to 0.6 per cent in 2015, unless
supported by a significant increase in fiscal and quasi-fiscal spending. This scenario
assumes that geopolitical tensions do not escalate but will only ease very slowly,
nevertheless trade sanctions are not applied. Prolonged geopolitical uncertainties
would lead to significantly weaker investor sentiment, contributing to accelerating
capital inflows, further drop in investments and deceleration in consumption. Higher
oil price in this scenario would only provide a temporary respite as demand for
18
Russian oil and gas may also decline due to the search for alternative suppliers. Fast
de-escalation of tensions in Ukraine and intensified reforms improving the business
climate would be needed to reinvigorate Russia’s medium- to long-term growth
potential.
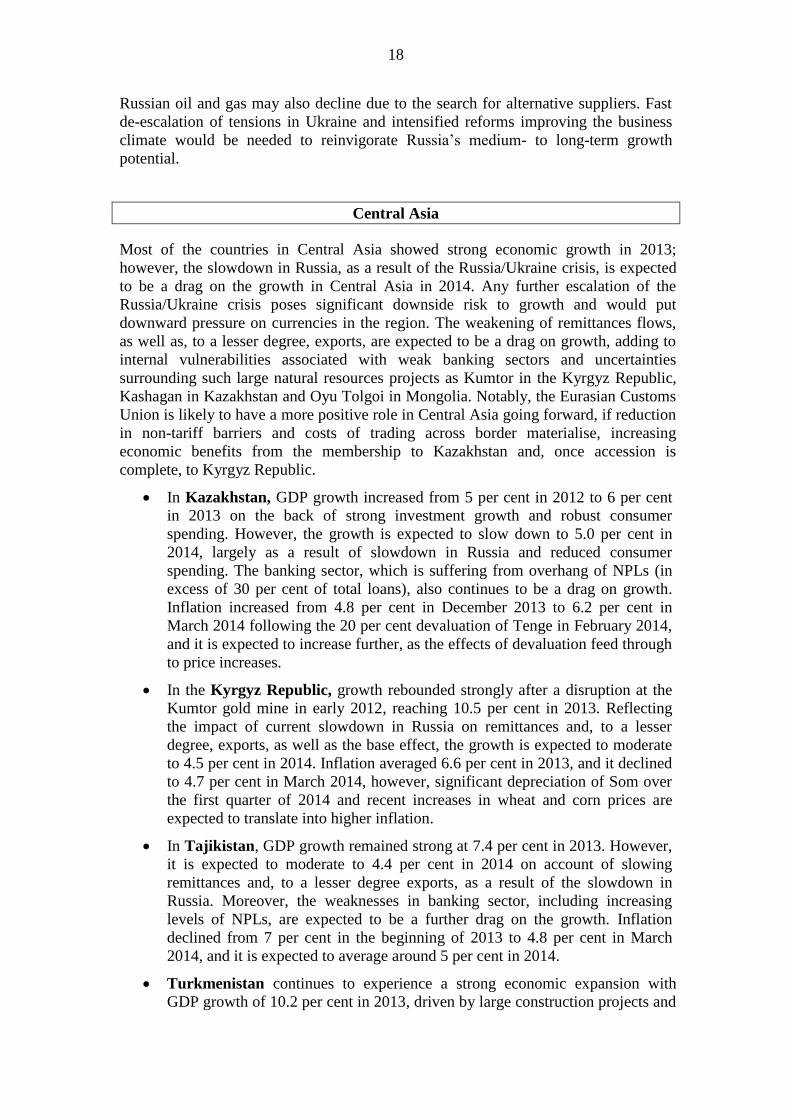
Central Asia
Most of the countries in Central Asia showed strong economic growth in 2013;
however, the slowdown in Russia, as a result of the Russia/Ukraine crisis, is expected
to be a drag on the growth in Central Asia in 2014. Any further escalation of the
Russia/Ukraine crisis poses significant downside risk to growth and would put
downward pressure on currencies in the region. The weakening of remittances flows,
as well as, to a lesser degree, exports, are expected to be a drag on growth, adding to
internal vulnerabilities associated with weak banking sectors and uncertainties
surrounding such large natural resources projects as Kumtor in the Kyrgyz Republic,
Kashagan in Kazakhstan and Oyu Tolgoi in Mongolia. Notably, the Eurasian Customs
Union is likely to have a more positive role in Central Asia going forward, if reduction
in non-tariff barriers and costs of trading across border materialise, increasing
economic benefits from the membership to Kazakhstan and, once accession is
complete, to Kyrgyz Republic.
In Kazakhstan, GDP growth increased from 5 per cent in 2012 to 6 per cent
in 2013 on the back of strong investment growth and robust consumer
spending. However, the growth is expected to slow down to 5.0 per cent in
2014, largely as a result of slowdown in Russia and reduced consumer
spending. The banking sector, which is suffering from overhang of NPLs (in
excess of 30 per cent of total loans), also continues to be a drag on growth.
Inflation increased from 4.8 per cent in December 2013 to 6.2 per cent in
March 2014 following the 20 per cent devaluation of Tenge in February 2014,
and it is expected to increase further, as the effects of devaluation feed through
to price increases.
In the Kyrgyz Republic, growth rebounded strongly after a disruption at the
Kumtor gold mine in early 2012, reaching 10.5 per cent in 2013. Reflecting
the impact of current slowdown in Russia on remittances and, to a lesser
degree, exports, as well as the base effect, the growth is expected to moderate
to 4.5 per cent in 2014. Inflation averaged 6.6 per cent in 2013, and it declined
to 4.7 per cent in March 2014, however, significant depreciation of Som over
the first quarter of 2014 and recent increases in wheat and corn prices are
expected to translate into higher inflation.
In Tajikistan, GDP growth remained strong at 7.4 per cent in 2013. However,
it is expected to moderate to 4.4 per cent in 2014 on account of slowing
remittances and, to a lesser degree exports, as a result of the slowdown in
Russia. Moreover, the weaknesses in banking sector, including increasing
levels of NPLs, are expected to be a further drag on the growth. Inflation
declined from 7 per cent in the beginning of 2013 to 4.8 per cent in March
2014, and it is expected to average around 5 per cent in 2014.
Turkmenistan continues to experience a strong economic expansion with
GDP growth of 10.2 per cent in 2013, driven by large construction projects and
19
strong gas exports to China. GDP growth is expected to reach 10 per cent in
2014, as a new gas field comes on stream, with only minimal impact from the
slowdown in Russia.
Uzbekistan’s GDP growth remained strong at 8.0 per cent in 2013, driven by a
combination of such factors as diversification of gas export routes and
accommodating monetary conditions. Growth is expected to slow down to
around 7.5 per cent in 2014, which is, however, an upward revision of growth
projection for 2014, which can be explained by an upward revision of the
actual growth in 2013.
Mongolia continued to benefit from a mining boom, and production of copper
concentrate at Oyu Tolgoi, which started operating in July 2013 and is
expected to become one of the world’s largest copper mines, made an
important contribution to growth. The output expanded by 11.7 per cent in
2013, notwithstanding weaker external demand, decreases in prices of key
commodities and delays at key mining projects. Growth is projected to reach
12.5 per cent in 2014, as the first phase of Oyu Tolgoi comes fully on stream.
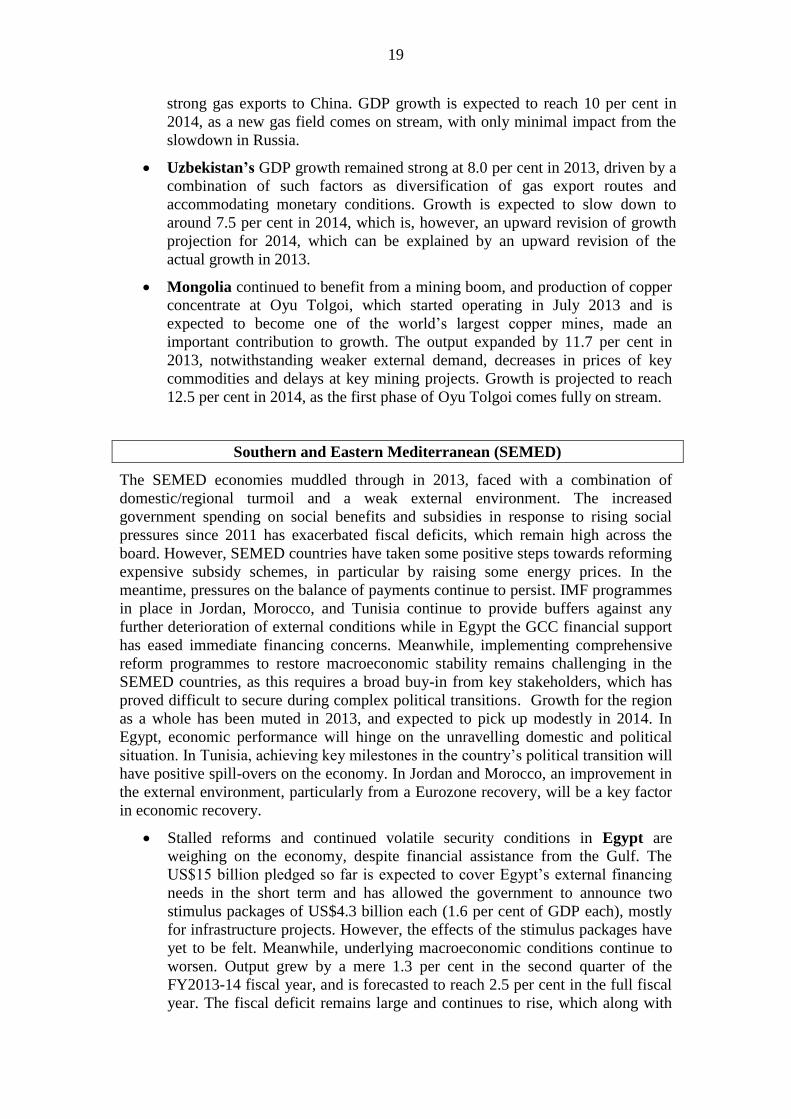
Southern and Eastern Mediterranean (SEMED)
The SEMED economies muddled through in 2013, faced with a combination of
domestic/regional turmoil and a weak external environment. The increased
government spending on social benefits and subsidies in response to rising social
pressures since 2011 has exacerbated fiscal deficits, which remain high across the
board. However, SEMED countries have taken some positive steps towards reforming
expensive subsidy schemes, in particular by raising some energy prices. In the
meantime, pressures on the balance of payments continue to persist. IMF programmes
in place in Jordan, Morocco, and Tunisia continue to provide buffers against any
further deterioration of external conditions while in Egypt the GCC financial support
has eased immediate financing concerns. Meanwhile, implementing comprehensive
reform programmes to restore macroeconomic stability remains challenging in the
SEMED countries, as this requires a broad buy-in from key stakeholders, which has
proved difficult to secure during complex political transitions. Growth for the region
as a whole has been muted in 2013, and expected to pick up modestly in 2014. In
Egypt, economic performance will hinge on the unravelling domestic and political
situation. In Tunisia, achieving key milestones in the country’s political transition will
have positive spill-overs on the economy. In Jordan and Morocco, an improvement in
the external environment, particularly from a Eurozone recovery, will be a key factor
in economic recovery.
Stalled reforms and continued volatile security conditions in Egypt are
weighing on the economy, despite financial assistance from the Gulf. The
US$15 billion pledged so far is expected to cover Egypt’s external financing
needs in the short term and has allowed the government to announce two
stimulus packages of US$4.3 billion each (1.6 per cent of GDP each), mostly
for infrastructure projects. However, the effects of the stimulus packages have
yet to be felt. Meanwhile, underlying macroeconomic conditions continue to
worsen. Output grew by a mere 1.3 per cent in the second quarter of the
FY2013-14 fiscal year, and is forecasted to reach 2.5 per cent in the full fiscal
year. The fiscal deficit remains large and continues to rise, which along with
20
high and persistent inflation, are key macroeconomic challenges. Spill overs
from the Ukraine/Russia crisis are expected to have minimal economic impact
on Egypt. As the largest importer of wheat in the world, Egypt has already
begun diversifying its sources of wheat imports. This could, however, push up
the import bill and could pose additional fiscal burdens on the country.
Economic activity in Jordan remains sluggish, adversely impacted by on-
going regional turmoil. The conflict in Syria has disrupted trade and tourism
and resulted in an influx of over half a million refugees, putting a strain public
services and finances and labour market conditions. Fiscal pressures have
persisted, although a large influx of grants has helped to ease budget strains
arising from the massive inflow of refugees. The current account deficit still
remains large, despite a slight improvement on the back of external financial
assistance. The IMF’s US$ 2 billion Stand-by Arrangement has helped reduce
the country’s financing gap. Jordan has also secured additional financial
support from the US (through loan guarantees) and the World Bank to
alleviate budget pressures in addition to non-budget grants from the GCC.
GDP is expected to gradually recover in the near-term, with output growth
projected at 3.4 per cent in 2014 and 4.1 per cent in 2015.
In Morocco, economic activity rebounded in 2013 on the back of a strong
harvest. Real GDP expanded by a 4.3 percent in 2013 compared to 2.6 per cent
in 2012, driven by the continued rebound in the agricultural sector (which
accounts for around 13 per cent of GDP and 40 per cent of employment),
while growth of non-agricultural output slowed. In the meantime, Morocco
successfully completed the third and last review of the IMF US$6.2 billion
precautionary credit line. The authorities have treated the arrangement, which
will expire in August 2014, as precautionary. External balance dynamics
improved in 2013, driven mostly by a lower import bill and some revival of
tourism. The fiscal deficit also narrowed in 2013, reflecting a reduction in the
subsidy bill and lower international oil prices. Growth in 2014 is expected to
moderate slightly to 4.2 per cent predominantly due to bumper crop harvest in
the previous year, but will pick up to 5 per cent in 2015 as the non-agricultural
sector picks up in tandem with an expected recovery in the Eurozone.
Tunisia’s economy was hard hit by political and security unrest in 2013, with
real GDP growth reaching a mere 2.7 per cent. Large-scale protests and
strikes, coupled with deteriorating security conditions, negatively impacted the
economy, and the protracted political crisis weighed on economic conditions.
Progress on structural reforms has been slower than planned, especially on
those requiring wide popular buy-in and legislative approval, and performance
under the IMF programme has so far been mixed, with the fiscal and current
accounts remaining under considerable pressure. Nevertheless, major
milestones in Tunisia’s political transition have been completed in 2014 and
are expected to have positive spill-overs on the economy. Growth is expected
to pick up to 3.4 per cent in 2014 and 4.7 per cent in 2015 on the back of
stabilising domestic conditions and a gradual pickup in external demand from
the Eurozone.
21
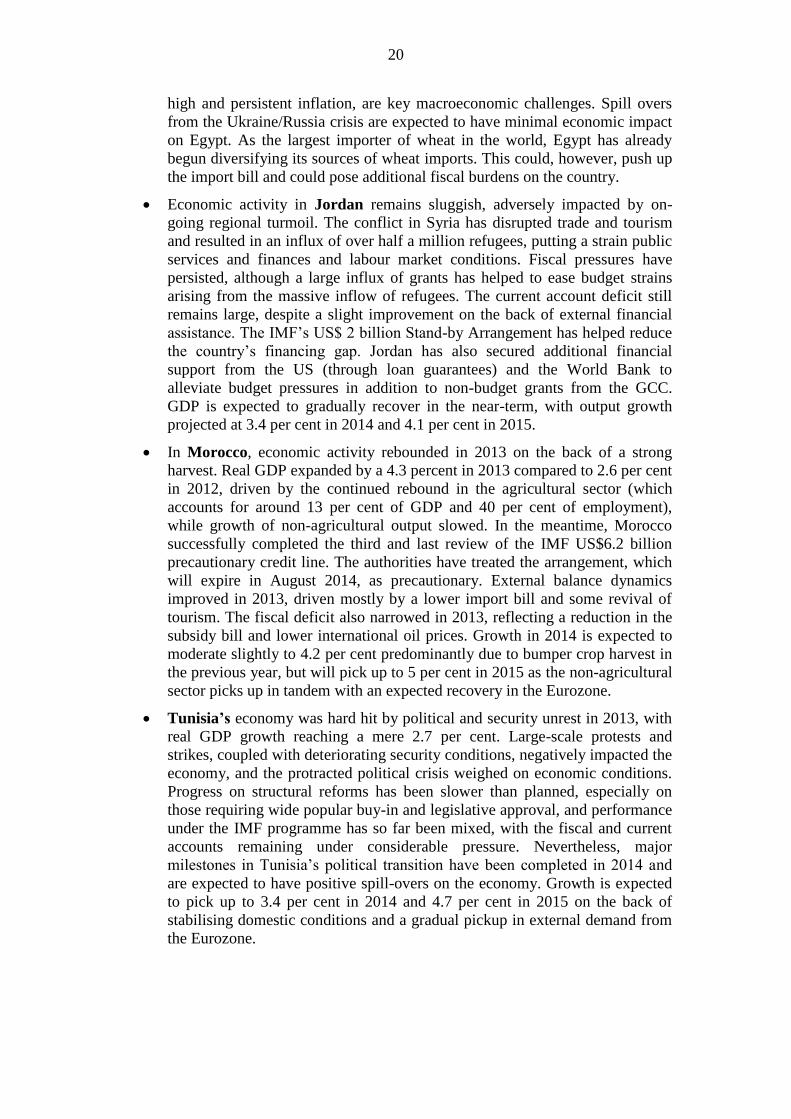
Table 1. Transition Region: Vulnerability Indicators 1/
Bank
dep.
Loans/
dep.
Unem-
ployment
Government
(end 2013) 07-May-14
Total (end
2013)
Private
(end
2013)
Short term
(remaining
maturity)
GDPShort
term debt
month of
prosp.
Imports
% of
GDP
Private
sector, in
%
(CDS
spread,
bps)
S&P
sovereign
country
ratings
Fitch
sovereign
country
ratings
Corp. HH latest
%
(latest
avail.)
Central Europe and Baltics
Croatia 59.8 103.4 80.0 30.4 16.6 27.0 88.9 8.4 68.4 134.6 300.0 BB BB+ 54.5 25.2 29.3 74.7 15.6 17.6
Estonia* 10.0 85.1 78.6 51.5 … … … … 48.9 142.4 … AA- A+ … … … 1.3 1.8 8.7
Hungary 79.2 115.9 66.6 27.8 49.6 36.0 129.8 5.2 40.1 117.2 200.7 BB BB+ 25.8 12.4 13.4 51.9 17.3 8.3
Latvia* 38.1 134.8 104.5 60.8 … … … … 33.5 130.0 BBB+ BBB+ … … … 86.5 8.3 11.6
Lithuania 39.4 64.4 32.7 30.5 7.4 17.1 56.1 3.0 35.8 118.2 … A- BBB+ 33.2 17.4 15.8 72.2 11.0 11.5
Poland 57.0 71.1 41.8 19.6 98.6 19.1 97.6 5.2 45.3 107.5 71.0 A- A- 15.1 3.8 11.3 29.8 8.5 9.7
Slovak Republic* 55.4 … … … … … … … 48.9 96.7 59.5 A A+ … … … 0.4 5.5 13.9
Slovenia* 71.7 108.9 52.0 17.2 … … … … 53.3 119.2 … A- BBB+ … … … 4.1 18.0 9.8
South-Eastern Europe
Albania 70.5 39.7 10.7 2.4 2.7 21.0 874.7 6.4 69.1 56.5 … B … 24.6 18.8 5.8 61.6 23.2 13.9
Bosnia and Herzegovina 42.7 52.1 22.8 13.0 4.7 25.8 198.7 6.0 44.6 130.9 … B … 39.5 21.3 18.2 66.1 15.1 27.5
Bulgaria 17.6 95.9 87.5 37.1 17.6 32.8 88.5 5.7 67.0 99.8 125.0 BBB BBB- 41.7 32.5 9.2 60.9 16.9 13.1
FYR Macedonia 35.8 64.9 41.5 27.2 2.4 22.6 83.1 3.9 51.1 93.2 … BB- BB+ 24.1 15.3 8.8 48.2 11.2 28.6
Kosovo* … … … … 1.2 17.4 … 4.0 … … … … … … … … … 7.5 30.9
Montenegro* 56.8 120.4 … … 0.6 13.2 … 2.5 55.8 102.4 … BB- … … … … … 17.7 19.5
Romania 39.3 69.7 45.1 31.9 43.1 23.5 73.6 6.4 30.8 107.6 152.0 BB+ BBB- 22.6 10.9 11.7 61.2 22.5 7.2
Serbia 65.8 87.4 40.6 16.0 14.1 32.3 201.5 7.1 40.6 118.4 … BB- B+ 37.9 25.5 12.4 72.5 21.1 20.1
Eastern Europe and the
Caucasus
Armenia 41.9 79.3 41.0 9.8 2.0 19.4 198.0 4.7 22.7 159.9 … … BB- 24.7 19.3 5.4 62.8 6.0 15.4
Azerbaijan 13.8 13.4 … … 16.3 25.1 … 11.2 15.9 149.7 … BBB- BBB- 7.2 4.0 3.2 28.6 5.3 5.2
Belarus 36.7 50.1 28.6 30.3 3.8 6.4 21.1 1.0 23.5 164.3 … B- … 23.4 23.2 0.0 49.6 4.6 0.5
Georgia 31.8 60.0 34.2 18.9 2.3 14.5 116.0 3.6 35.3 109.4 … BB- BB- 22.9 12.1 10.8 62.9 7.3 15.0
Moldova 24.4 80.4 57.7 32.0 2.7 39.0 122.0 5.1 43.0 … … … 17.6 17.2 0.4 40.4 13.2 4.1
Ukraine 41.0 76.6 60.1 38.0 13.3 8.1 21.5 1.6 42.7 138.2 1251.0 CCC CCC 20.4 15.4 4.9 35.6 16.9 7.6
Turkey 35.8 45.8 32.3 18.7 109.0 13.3 84.4 5.2 41.5 110.7 181.5 BB+ BBB- 19.4 19.4 0.0 27.7 2.7 10.1
Russia 13.4 34.3 7.7 30.7 442.8 23.4 278.3 11.2 40.7 121.8 261.5 BBB BBB 8.9 8.5 0.4 17.0 4.3 5.2
Central Asia
Kazakhstan 13.5 67.0 64.5 8.8 20.3 10.8 122.3 4.0 29.6 109.4 175.0 BBB+ BBB+ 10.9 9.3 1.7 29.5 33.6 5.1
Kyrgyz Republic 47.7 74.2 29.3 12.1 2.0 31.7 261.0 3.4 … … … … … 8.3 6.5 1.8 52.8 5.5 7.6
Mongolia … 119.9 76.6 … 2.1 24.4 … 3.3 … … … BB- B+ 15.2 14.1 1.2 31.8 5.2 7.8
Tajikistan 29.2 43.2 19.1 1.5 0.4 5.7 379.1 0.8 … … … … … … … … … 9.8 2.4
Turkmenistan 20.6 20.6 0.0 0.3 … … … … … … … … … … … … … ... …
Uzbekistan 8.6 13.0 4.9 0.9 … … … … … … … … … … … … … ... …
Southern and Eastern
Mediterranean … … …
Egypt 89.2 14.5 0.7 2.2 17.4 7.4 337.0 3.7 62.0 46.3 678.0 B- B- 8.4 8.3 0.2 … 9.5 13.4
Jordan 87.7 24.5 0.0 2.4 13.6 39.9 … 5.4 106.5 70.9 … BB- … 11.5 … … … ... 11.8
Morocco 61.9 30.9 4.1 1.9 17.5 17.6 924.6 4.2 63.5 103.6 … BBB- BBB- … … … … 6.1 9.5
Tunisia 44.4 52.0 16.0 16.8 7.1 15.4 91.5 3.1 54.2 … … NR BB- … … … … ... 14.3
1/ National sources based on CEIC and IFS, unless stated otherw ise.
2/ WEO April 2014 estimates. CEB figures from Eurostat.
3/ Slovenia NPLs: EBRD estimate
* Euro area members, Kosovo and Monetnegro use the Euro as legal tender.
Country risk
External
Public and External Debt /2
(% of GDP)
Total reserves (excl. gold) /2
billions
US$
(latest)
in percent of
Nonperfo
rming
loans /3
latest
Domestic FX loan stocks
(latest)
(% GDP)
Total
pvt
sector
of whichLatest % FX
credit in
total
loan
stock
22
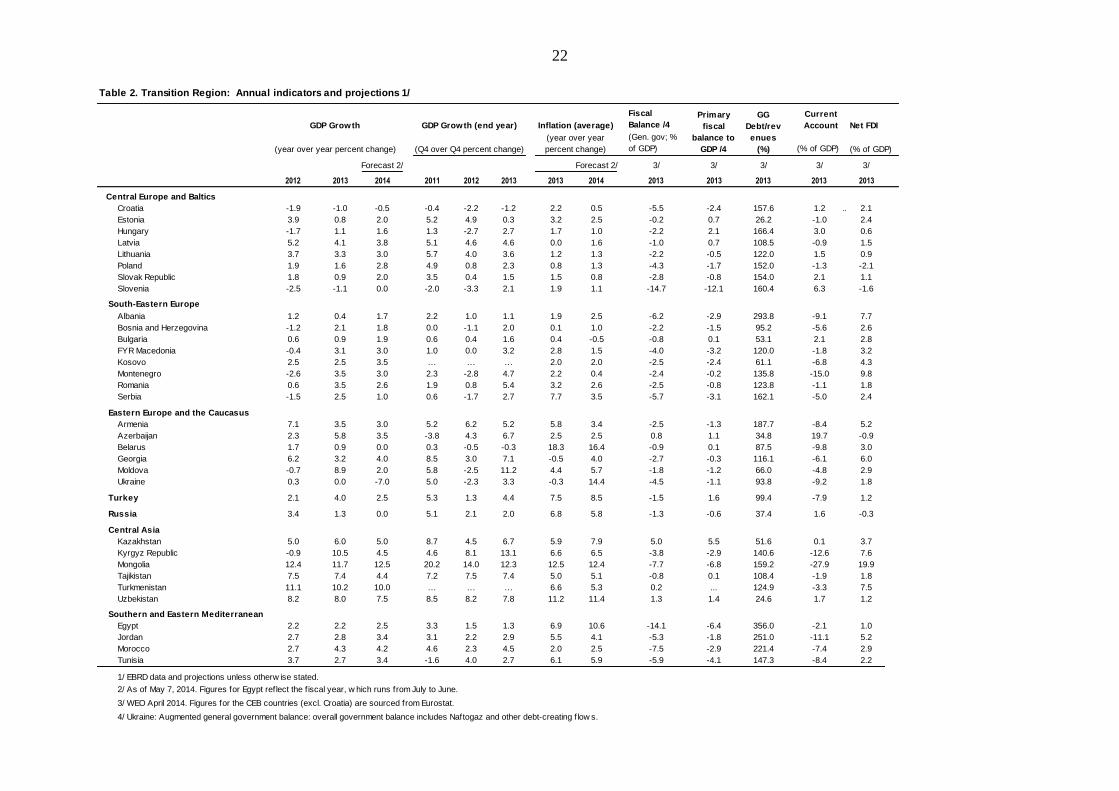
Table 2. Transition Region: Annual indicators and projections 1/
Fiscal
Balance /4 Net FDI
(Gen. gov; %
of GDP) (% of GDP) (% of GDP)
Forecast 2/ Forecast 2/ 3/ 3/ 3/ 3/ 3/
2012 2013 2014 2011 2012 2013 2013 2014 2013 2013 2013 2013 2013
Central Europe and Baltics
Croatia -1.9 -1.0 -0.5 -0.4 -2.2 -1.2 2.2 0.5 -5.5 -2.4 157.6 1.2 ... 2.1
Estonia 3.9 0.8 2.0 5.2 4.9 0.3 3.2 2.5 -0.2 0.7 26.2 -1.0 2.4
Hungary -1.7 1.1 1.6 1.3 -2.7 2.7 1.7 1.0 -2.2 2.1 166.4 3.0 0.6
Latvia 5.2 4.1 3.8 5.1 4.6 4.6 0.0 1.6 -1.0 0.7 108.5 -0.9 1.5
Lithuania 3.7 3.3 3.0 5.7 4.0 3.6 1.2 1.3 -2.2 -0.5 122.0 1.5 0.9
Poland 1.9 1.6 2.8 4.9 0.8 2.3 0.8 1.3 -4.3 -1.7 152.0 -1.3 -2.1
Slovak Republic 1.8 0.9 2.0 3.5 0.4 1.5 1.5 0.8 -2.8 -0.8 154.0 2.1 1.1
Slovenia -2.5 -1.1 0.0 -2.0 -3.3 2.1 1.9 1.1 -14.7 -12.1 160.4 6.3 -1.6
South-Eastern Europe
Albania 1.2 0.4 1.7 2.2 1.0 1.1 1.9 2.5 -6.2 -2.9 293.8 -9.1 7.7
Bosnia and Herzegovina -1.2 2.1 1.8 0.0 -1.1 2.0 0.1 1.0 -2.2 -1.5 95.2 -5.6 2.6
Bulgaria 0.6 0.9 1.9 0.6 0.4 1.6 0.4 -0.5 -0.8 0.1 53.1 2.1 2.8
FYR Macedonia -0.4 3.1 3.0 1.0 0.0 3.2 2.8 1.5 -4.0 -3.2 120.0 -1.8 3.2
Kosovo 2.5 2.5 3.5 … … … 2.0 2.0 -2.5 -2.4 61.1 -6.8 4.3
Montenegro -2.6 3.5 3.0 2.3 -2.8 4.7 2.2 0.4 -2.4 -0.2 135.8 -15.0 9.8
Romania 0.6 3.5 2.6 1.9 0.8 5.4 3.2 2.6 -2.5 -0.8 123.8 -1.1 1.8
Serbia -1.5 2.5 1.0 0.6 -1.7 2.7 7.7 3.5 -5.7 -3.1 162.1 -5.0 2.4
Eastern Europe and the Caucasus
Armenia 7.1 3.5 3.0 5.2 6.2 5.2 5.8 3.4 -2.5 -1.3 187.7 -8.4 5.2
Azerbaijan 2.3 5.8 3.5 -3.8 4.3 6.7 2.5 2.5 0.8 1.1 34.8 19.7 -0.9
Belarus 1.7 0.9 0.0 0.3 -0.5 -0.3 18.3 16.4 -0.9 0.1 87.5 -9.8 3.0
Georgia 6.2 3.2 4.0 8.5 3.0 7.1 -0.5 4.0 -2.7 -0.3 116.1 -6.1 6.0
Moldova -0.7 8.9 2.0 5.8 -2.5 11.2 4.4 5.7 -1.8 -1.2 66.0 -4.8 2.9
Ukraine 0.3 0.0 -7.0 5.0 -2.3 3.3 -0.3 14.4 -4.5 -1.1 93.8 -9.2 1.8
Turkey 2.1 4.0 2.5 5.3 1.3 4.4 7.5 8.5 -1.5 1.6 99.4 -7.9 1.2
Russia 3.4 1.3 0.0 5.1 2.1 2.0 6.8 5.8 -1.3 -0.6 37.4 1.6 -0.3
Central Asia
Kazakhstan 5.0 6.0 5.0 8.7 4.5 6.7 5.9 7.9 5.0 5.5 51.6 0.1 3.7
Kyrgyz Republic -0.9 10.5 4.5 4.6 8.1 13.1 6.6 6.5 -3.8 -2.9 140.6 -12.6 7.6
Mongolia 12.4 11.7 12.5 20.2 14.0 12.3 12.5 12.4 -7.7 -6.8 159.2 -27.9 19.9
Tajikistan 7.5 7.4 4.4 7.2 7.5 7.4 5.0 5.1 -0.8 0.1 108.4 -1.9 1.8
Turkmenistan 11.1 10.2 10.0 … … … 6.6 5.3 0.2 ... 124.9 -3.3 7.5
Uzbekistan 8.2 8.0 7.5 8.5 8.2 7.8 11.2 11.4 1.3 1.4 24.6 1.7 1.2
Southern and Eastern Mediterranean
Egypt 2.2 2.2 2.5 3.3 1.5 1.3 6.9 10.6 -14.1 -6.4 356.0 -2.1 1.0
Jordan 2.7 2.8 3.4 3.1 2.2 2.9 5.5 4.1 -5.3 -1.8 251.0 -11.1 5.2
Morocco 2.7 4.3 4.2 4.6 2.3 4.5 2.0 2.5 -7.5 -2.9 221.4 -7.4 2.9
Tunisia 3.7 2.7 3.4 -1.6 4.0 2.7 6.1 5.9 -5.9 -4.1 147.3 -8.4 2.2
1/ EBRD data and projections unless otherw ise stated.
2/ As of May 7, 2014. Figures for Egypt reflect the f iscal year, w hich runs from July to June.
3/ WEO April 2014. Figures for the CEB countries (excl. Croatia) are sourced from Eurostat.
4/ Ukraine: Augmented general government balance: overall government balance includes Naftogaz and other debt-creating f low s.
GG
Debt/rev
enues
(%)
Primary
fiscal
balance to
GDP /4
Current
Account
(year over year
percent change)(Q4 over Q4 percent change)
GDP Growth (end year)
(year over year percent change)
GDP Growth Inflation (average)
23
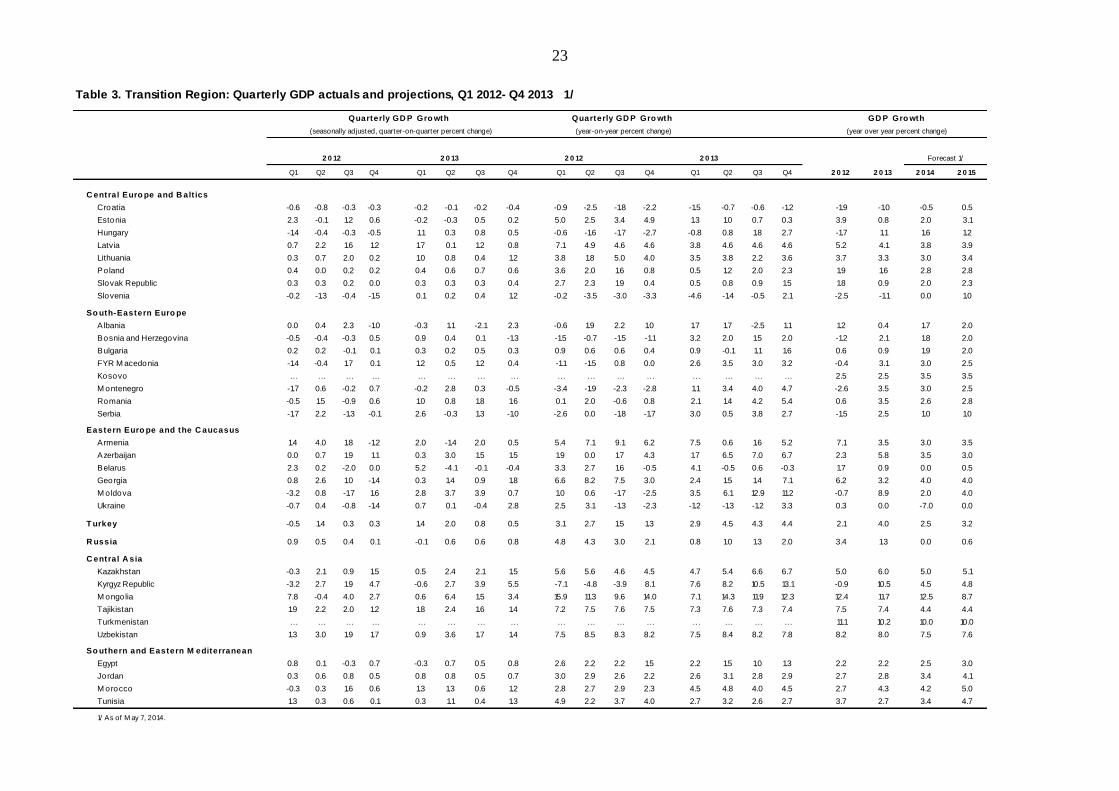
Table 3. Transition Region: Quarterly GDP actuals and projections, Q1 2012- Q4 2013 1/
Q1 Q2 Q3 Q4 Q1 Q2 Q3 Q4 Q1 Q2 Q3 Q4 Q1 Q2 Q3 Q4 2 0 12 2 0 13 2 0 14 2 0 15
C entral Euro pe and B alt ics
Croatia -0.6 -0.8 -0.3 -0.3 -0.2 -0.1 -0.2 -0.4 -0.9 -2.5 -1.8 -2.2 -1.5 -0.7 -0.6 -1.2 -1.9 -1.0 -0.5 0.5
Estonia 2.3 -0.1 1.2 0.6 -0.2 -0.3 0.5 0.2 5.0 2.5 3.4 4.9 1.3 1.0 0.7 0.3 3.9 0.8 2.0 3.1
Hungary -1.4 -0.4 -0.3 -0.5 1.1 0.3 0.8 0.5 -0.6 -1.6 -1.7 -2.7 -0.8 0.8 1.8 2.7 -1.7 1.1 1.6 1.2
Latvia 0.7 2.2 1.6 1.2 1.7 0.1 1.2 0.8 7.1 4.9 4.6 4.6 3.8 4.6 4.6 4.6 5.2 4.1 3.8 3.9
Lithuania 0.3 0.7 2.0 0.2 1.0 0.8 0.4 1.2 3.8 1.8 5.0 4.0 3.5 3.8 2.2 3.6 3.7 3.3 3.0 3.4
Poland 0.4 0.0 0.2 0.2 0.4 0.6 0.7 0.6 3.6 2.0 1.6 0.8 0.5 1.2 2.0 2.3 1.9 1.6 2.8 2.8
Slovak Republic 0.3 0.3 0.2 0.0 0.3 0.3 0.3 0.4 2.7 2.3 1.9 0.4 0.5 0.8 0.9 1.5 1.8 0.9 2.0 2.3
Slovenia -0.2 -1.3 -0.4 -1.5 0.1 0.2 0.4 1.2 -0.2 -3.5 -3.0 -3.3 -4.6 -1.4 -0.5 2.1 -2.5 -1.1 0.0 1.0
So uth-Eastern Euro pe
Albania 0.0 0.4 2.3 -1.0 -0.3 1.1 -2.1 2.3 -0.6 1.9 2.2 1.0 1.7 1.7 -2.5 1.1 1.2 0.4 1.7 2.0
Bosnia and Herzegovina -0.5 -0.4 -0.3 0.5 0.9 0.4 0.1 -1.3 -1.5 -0.7 -1.5 -1.1 3.2 2.0 1.5 2.0 -1.2 2.1 1.8 2.0
Bulgaria 0.2 0.2 -0.1 0.1 0.3 0.2 0.5 0.3 0.9 0.6 0.6 0.4 0.9 -0.1 1.1 1.6 0.6 0.9 1.9 2.0
FYR M acedonia -1.4 -0.4 1.7 0.1 1.2 0.5 1.2 0.4 -1.1 -1.5 0.8 0.0 2.6 3.5 3.0 3.2 -0.4 3.1 3.0 2.5
Kosovo … … … … … … … … … … … … … … … … 2.5 2.5 3.5 3.5
M ontenegro -1.7 0.6 -0.2 0.7 -0.2 2.8 0.3 -0.5 -3.4 -1.9 -2.3 -2.8 1.1 3.4 4.0 4.7 -2.6 3.5 3.0 2.5
Romania -0.5 1.5 -0.9 0.6 1.0 0.8 1.8 1.6 0.1 2.0 -0.6 0.8 2.1 1.4 4.2 5.4 0.6 3.5 2.6 2.8
Serbia -1.7 2.2 -1.3 -0.1 2.6 -0.3 1.3 -1.0 -2.6 0.0 -1.8 -1.7 3.0 0.5 3.8 2.7 -1.5 2.5 1.0 1.0
Eastern Euro pe and the C aucasus
Armenia 1.4 4.0 1.8 -1.2 2.0 -1.4 2.0 0.5 5.4 7.1 9.1 6.2 7.5 0.6 1.6 5.2 7.1 3.5 3.0 3.5
Azerbaijan 0.0 0.7 1.9 1.1 0.3 3.0 1.5 1.5 1.9 0.0 1.7 4.3 1.7 6.5 7.0 6.7 2.3 5.8 3.5 3.0
Belarus 2.3 0.2 -2.0 0.0 5.2 -4.1 -0.1 -0.4 3.3 2.7 1.6 -0.5 4.1 -0.5 0.6 -0.3 1.7 0.9 0.0 0.5
Georgia 0.8 2.6 1.0 -1.4 0.3 1.4 0.9 1.8 6.6 8.2 7.5 3.0 2.4 1.5 1.4 7.1 6.2 3.2 4.0 4.0
M oldova -3.2 0.8 -1.7 1.6 2.8 3.7 3.9 0.7 1.0 0.6 -1.7 -2.5 3.5 6.1 12.9 11.2 -0.7 8.9 2.0 4.0
Ukraine -0.7 0.4 -0.8 -1.4 0.7 0.1 -0.4 2.8 2.5 3.1 -1.3 -2.3 -1.2 -1.3 -1.2 3.3 0.3 0.0 -7.0 0.0
T urkey -0.5 1.4 0.3 0.3 1.4 2.0 0.8 0.5 3.1 2.7 1.5 1.3 2.9 4.5 4.3 4.4 2.1 4.0 2.5 3.2
R ussia 0.9 0.5 0.4 0.1 -0.1 0.6 0.6 0.8 4.8 4.3 3.0 2.1 0.8 1.0 1.3 2.0 3.4 1.3 0.0 0.6
C entral A sia
Kazakhstan -0.3 2.1 0.9 1.5 0.5 2.4 2.1 1.5 5.6 5.6 4.6 4.5 4.7 5.4 6.6 6.7 5.0 6.0 5.0 5.1
Kyrgyz Republic -3.2 2.7 1.9 4.7 -0.6 2.7 3.9 5.5 -7.1 -4.8 -3.9 8.1 7.6 8.2 10.5 13.1 -0.9 10.5 4.5 4.8
M ongolia 7.8 -0.4 4.0 2.7 0.6 6.4 1.5 3.4 15.9 11.3 9.6 14.0 7.1 14.3 11.9 12.3 12.4 11.7 12.5 8.7
Tajikistan 1.9 2.2 2.0 1.2 1.8 2.4 1.6 1.4 7.2 7.5 7.6 7.5 7.3 7.6 7.3 7.4 7.5 7.4 4.4 4.4
Turkmenistan … … … … … … … … … … … … … … … … 11.1 10.2 10.0 10.0
Uzbekistan 1.3 3.0 1.9 1.7 0.9 3.6 1.7 1.4 7.5 8.5 8.3 8.2 7.5 8.4 8.2 7.8 8.2 8.0 7.5 7.6
So uthern and Eastern M editerranean
Egypt 0.8 0.1 -0.3 0.7 -0.3 0.7 0.5 0.8 2.6 2.2 2.2 1.5 2.2 1.5 1.0 1.3 2.2 2.2 2.5 3.0
Jordan 0.3 0.6 0.8 0.5 0.8 0.8 0.5 0.7 3.0 2.9 2.6 2.2 2.6 3.1 2.8 2.9 2.7 2.8 3.4 4.1
M orocco -0.3 0.3 1.6 0.6 1.3 1.3 0.6 1.2 2.8 2.7 2.9 2.3 4.5 4.8 4.0 4.5 2.7 4.3 4.2 5.0
Tunisia 1.3 0.3 0.6 0.1 0.3 1.1 0.4 1.3 4.9 2.2 3.7 4.0 2.7 3.2 2.6 2.7 3.7 2.7 3.4 4.7
1/ As of M ay 7, 2014.
2 0 122 0 12 2 0 13 2 0 13 Forecast 1/
GD P Gro wth
(year over year percent change)
Quarterly GD P Gro wth
(year-on-year percent change)
Quarterly GD P Gro wth
(seasonally adjusted, quarter-on-quarter percent change)
24
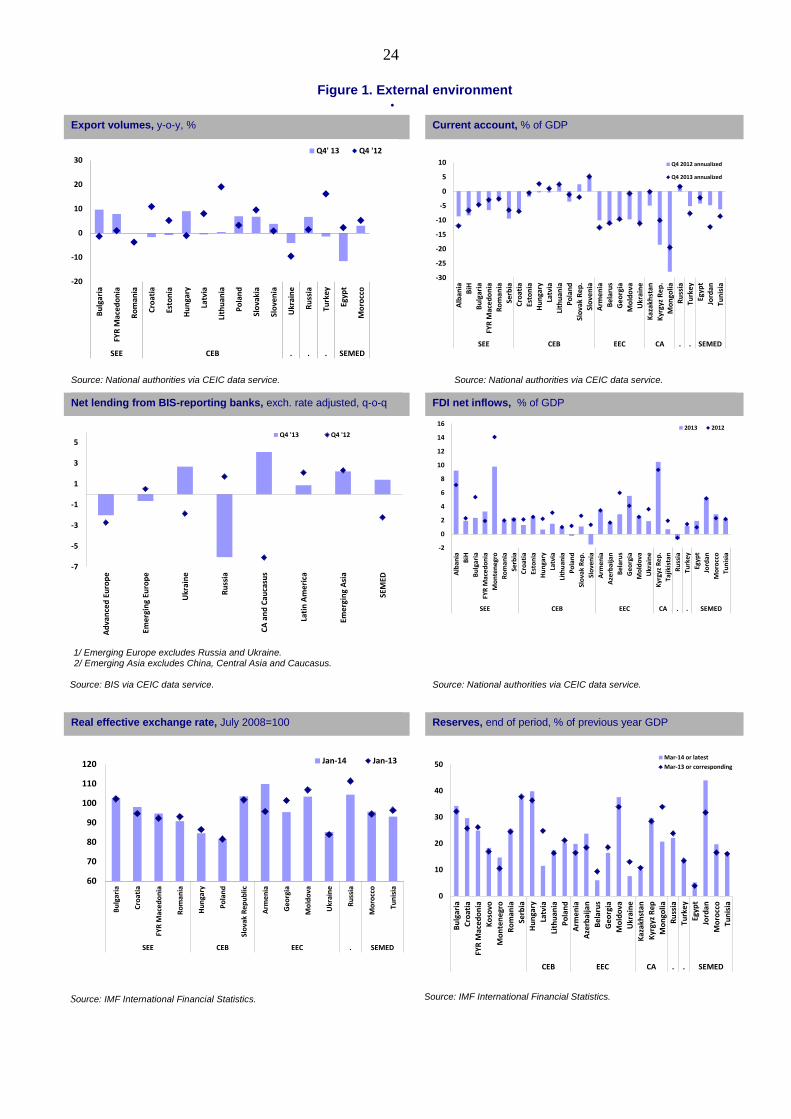
Figure 1. External environment
Export volumes, y-o-y, % Current account, % of GDP
Source: National authorities via CEIC data service. Source: National authorities via CEIC data service.
Net lending from BIS-reporting banks, exch. rate adjusted, q-o-q FDI net inflows, % of GDP
1/ Emerging Europe excludes Russia and Ukraine. 2/ Emerging Asia excludes China, Central Asia and Caucasus.
Source: BIS via CEIC data service.
Source: National authorities via CEIC data service.
Real effective exchange rate, July 2008=100 Reserves, end of period, % of previous year GDP
Source: IMF International Financial Statistics. Source: IMF International Financial Statistics.
-20
-10
0
10
20
30
Bu
lgar
ia
FYR
Mac
edo
nia
Ro
man
ia
Cro
atia
Esto
nia
Hu
nga
ry
Latv
ia
Lith
uan
ia
Po
lan
d
Slo
vaki
a
Slo
ven
ia
Ukr
ain
e
Ru
ssia
Turk
ey
Egyp
t
Mo
rocc
oSEE CEB . . . SEMED
Q4' 13 Q4 '12
-30
-25
-20
-15
-10
-5
0
5
10
Alb
ania
BiH
Bu
lgar
ia
FYR
Mac
ed
on
ia
Ro
man
ia
Serb
ia
Cro
atia
Esto
nia
Hu
nga
ry
Latv
ia
Lith
uan
ia
Po
lan
d
Slo
vak
Rep
.
Slo
ven
ia
Arm
en
ia
Be
laru
s
Geo
rgia
Mo
ldo
va
Ukr
ain
e
Kaz
akh
stan
Kyr
gyz
Rep
.
Mo
ngo
lia
Ru
ssia
Turk
ey
Egyp
t
Jord
an
Tun
isia
SEE CEB EEC CA . . SEMED
Q4 2012 annualized
Q4 2013 annualized
-7
-5
-3
-1
1
3
5
Ad
van
ced
Eu
rop
e
Eme
rgin
g Eu
rop
e
Ukr
ain
e
Ru
ssia
CA
an
d C
auca
sus
Lati
n A
me
rica
Eme
rgin
g A
sia
SEM
ED
Q4 '13 Q4 '12
-2
0
2
4
6
8
10
12
14
16
Alb
ania
BiH
Bu
lgar
ia
FYR
Mac
ed
on
ia
Mo
nte
neg
ro
Ro
man
ia
Serb
ia
Cro
atia
Esto
nia
Hu
nga
ry
Latv
ia
Lith
uan
ia
Po
lan
d
Slo
vak
Re
p.
Slo
ven
ia
Arm
en
ia
Aze
rbai
jan
Be
laru
s
Ge
org
ia
Mo
ldo
va
Ukr
ain
e
Kyr
gyz
Re
p.
Taji
kist
an
Ru
ssia
Turk
ey
Egyp
t
Jord
an
Mo
rocc
o
Tun
isia
SEE CEB EEC CA . . SEMED
2013 2012
60
70
80
90
100
110
120
Bu
lgar
ia
Cro
atia
FYR
Mac
edo
nia
Ro
man
ia
Hu
nga
ry
Po
lan
d
Slo
vak
Re
pu
blic
Arm
en
ia
Ge
org
ia
Mo
ldo
va
Ukr
ain
e
Ru
ssia
Mo
rocc
o
Tun
isia
SEE CEB EEC . SEMED
Jan-14 Jan-13
0
10
20
30
40
50
Bu
lgar
ia
Cro
atia
FYR
Mac
ed
on
ia
Ko
sovo
Mo
nte
ne
gro
Ro
man
ia
Serb
ia
Hu
nga
ry
Latv
ia
Lith
uan
ia
Po
lan
d
Arm
en
ia
Aze
rbai
jan
Be
laru
s
Ge
org
ia
Mo
ldo
va
Ukr
ain
e
Kaz
akh
stan
Kyr
gyz
Re
p
Mo
ngo
lia
Ru
ssia
Turk
ey
Egyp
t
Jord
an
Mo
rocc
o
Tun
isia
CEB EEC CA . . SEMED
Mar-14 or latest
Mar-13 or corresponding
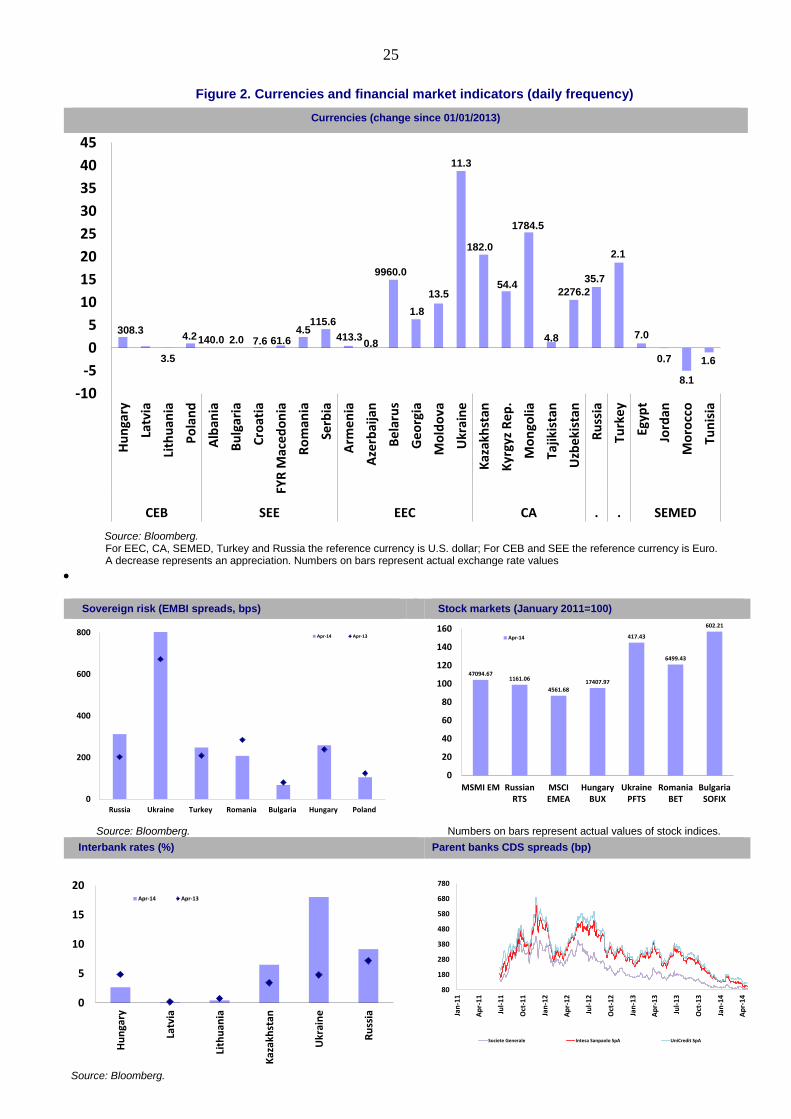
25
Figure 2. Currencies and financial market indicators (daily frequency)
Currencies (change since 01/01/2013)
Source: Bloomberg. For EEC, CA, SEMED, Turkey and Russia the reference currency is U.S. dollar; For CEB and SEE the reference currency is Euro. A decrease represents an appreciation. Numbers on bars represent actual exchange rate values
Sovereign risk (EMBI spreads, bps) Stock markets (January 2011=100)
Source: Bloomberg. Numbers on bars represent actual values of stock indices.
Interbank rates (%) Parent banks CDS spreads (bp)
Source: Bloomberg.
308.3
3.5
4.2140.0 2.0 7.6 61.64.5
115.6
413.30.8
9960.0
1.8
13.5
11.3
182.0
54.4
1784.5
4.8
2276.2
35.7
2.1
7.0
0.7
8.1
1.6
-10
-5
0
5
10
15
20
25
30
35
40
45
Hu
nga
ry
Latv
ia
Lith
uan
ia
Po
lan
d
Alb
ania
Bu
lgar
ia
Cro
atia
FYR
Mac
ed
on
ia
Ro
man
ia
Serb
ia
Arm
en
ia
Aze
rbai
jan
Be
laru
s
Ge
org
ia
Mo
ldo
va
Ukr
ain
e
Kaz
akh
stan
Kyr
gyz
Re
p.
Mo
ngo
lia
Tajik
ista
n
Uzb
eki
stan
Ru
ssia
Turk
ey
Egyp
t
Jord
an
Mo
rocc
o
Tun
isia
CEB SEE EEC CA . . SEMED
0
200
400
600
800
Russia Ukraine Turkey Romania Bulgaria Hungary Poland
Apr-14 Apr-13
47094.671161.06
4561.6817407.97
417.43
6499.43
602.21
0
20
40
60
80
100
120
140
160
MSMI EM RussianRTS
MSCIEMEA
HungaryBUX
UkrainePFTS
RomaniaBET
BulgariaSOFIX
Apr-14
0
5
10
15
20
Hu
nga
ry
Latv
ia
Lith
uan
ia
Kaz
akh
stan
Ukr
ain
e
Ru
ssia
Apr-14 Apr-13
80
180
280
380
480
580
680
780
Jan
-11
Ap
r-1
1
Jul-
11
Oct
-11
Jan
-12
Ap
r-1
2
Jul-
12
Oct
-12
Jan
-13
Ap
r-1
3
Jul-
13
Oct
-13
Jan
-14
Ap
r-1
4
Societe Generale Intesa Sanpaolo SpA UniCredit SpA
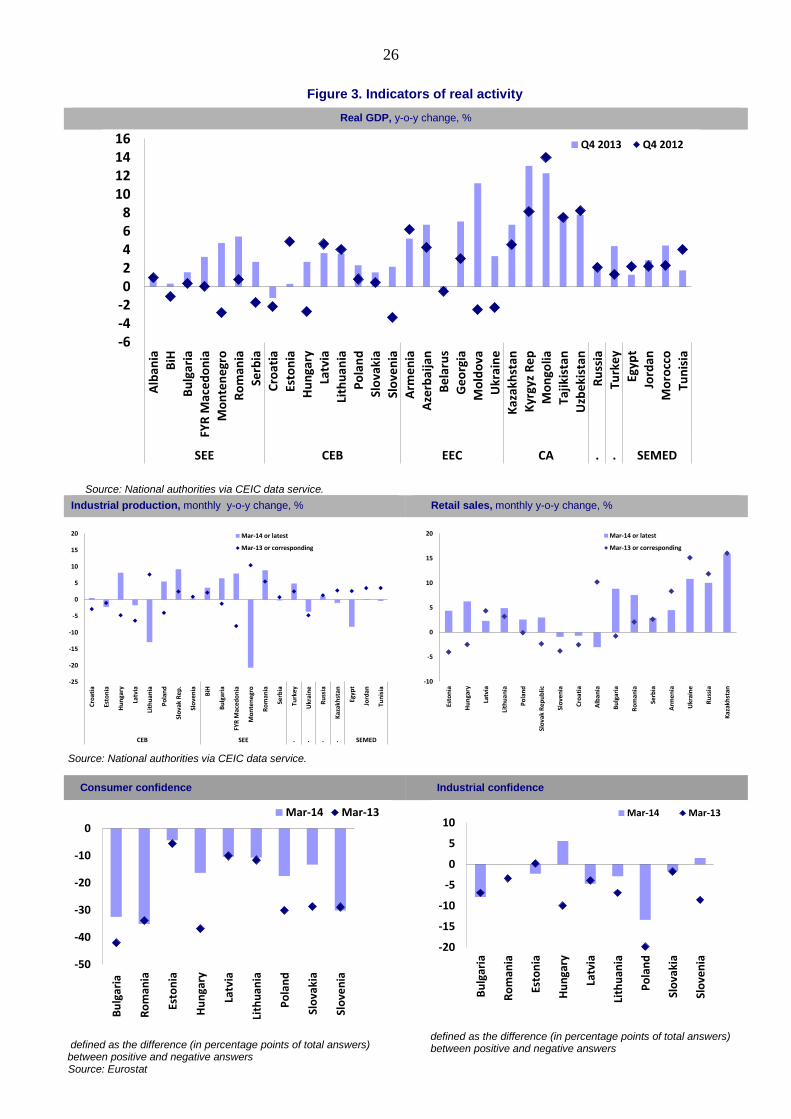
26
Figure 3. Indicators of real activity
Real GDP, y-o-y change, %
Source: National authorities via CEIC data service.
Industrial production, monthly y-o-y change, % Retail sales, monthly y-o-y change, %
Source: National authorities via CEIC data service.
Consumer confidence Industrial confidence
defined as the difference (in percentage points of total answers) between positive and negative answers
defined as the difference (in percentage points of total answers) between positive and negative answers
Source: Eurostat
-6-4-202468
10121416
Alb
ania
BiH
Bu
lgar
ia
FYR
Mac
ed
on
ia
Mo
nte
ne
gro
Ro
man
ia
Serb
ia
Cro
atia
Esto
nia
Hu
nga
ry
Latv
ia
Lith
uan
ia
Po
lan
d
Slo
vaki
a
Slo
ven
ia
Arm
en
ia
Aze
rbai
jan
Be
laru
s
Ge
org
ia
Mo
ldo
va
Ukr
ain
e
Kaz
akh
stan
Kyr
gyz
Re
p
Mo
ngo
lia
Taji
kist
an
Uzb
eki
stan
Ru
ssia
Turk
ey
Egyp
t
Jord
an
Mo
rocc
o
Tun
isia
SEE CEB EEC CA . . SEMED
Q4 2013 Q4 2012
-25
-20
-15
-10
-5
0
5
10
15
20
Cro
atia
Esto
nia
Hu
nga
ry
Latv
ia
Lith
uan
ia
Po
lan
d
Slo
vak
Re
p.
Slo
ven
ia
BiH
Bu
lgar
ia
FYR
Mac
edo
nia
Mo
nte
neg
ro
Ro
man
ia
Serb
ia
Turk
ey
Ukr
ain
e
Ru
ssia
Kaz
akh
stan
Egyp
t
Jord
an
Tun
isia
CEB SEE . . . . SEMED
Mar-14 or latest
Mar-13 or corresponding
-10
-5
0
5
10
15
20
Esto
nia
Hu
nga
ry
Latv
ia
Lith
uan
ia
Po
lan
d
Slo
vak
Re
pu
blic
Slo
ven
ia
Cro
atia
Alb
ania
Bu
lgar
ia
Ro
man
ia
Serb
ia
Arm
en
ia
Ukr
ain
e
Ru
ssia
Kaz
akh
stan
Mar-14 or latest
Mar-13 or corresponding
-50
-40
-30
-20
-10
0
Bu
lgar
ia
Ro
man
ia
Esto
nia
Hu
nga
ry
Latv
ia
Lith
uan
ia
Po
lan
d
Slo
vaki
a
Slo
ven
ia
Mar-14 Mar-13
-20
-15
-10
-5
0
5
10
Bu
lgar
ia
Ro
man
ia
Esto
nia
Hu
nga
ry
Latv
ia
Lith
uan
ia
Po
lan
d
Slo
vaki
a
Slo
ven
ia
Mar-14 Mar-13
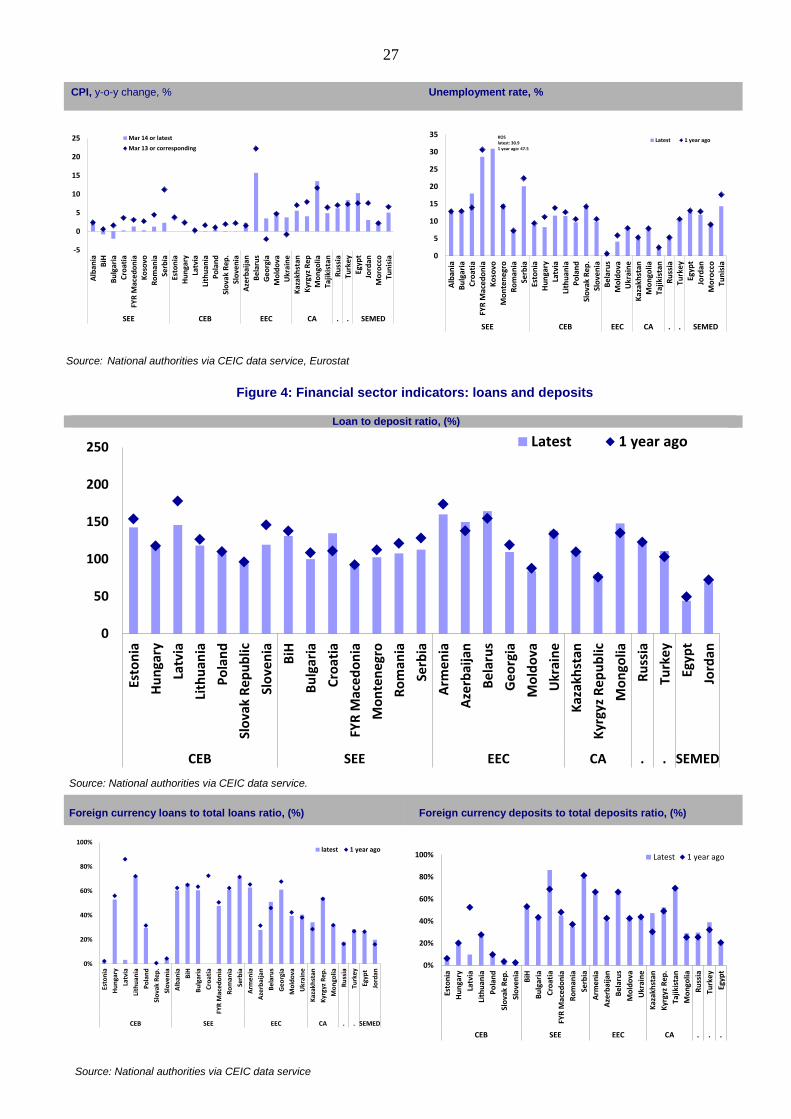
27
CPI, y-o-y change, % Unemployment rate, %
Source: National authorities via CEIC data service, Eurostat
Figure 4: Financial sector indicators: loans and deposits
Loan to deposit ratio, (%)
Source: National authorities via CEIC data service.
k Foreign currency loans to total loans ratio, (%)
Foreign currency deposits to total deposits ratio, (%)
Source: National authorities via CEIC data service
-5
0
5
10
15
20
25
Alb
ania
BiH
Bu
lgar
iaC
roat
iaFY
R M
ace
do
nia
Ko
sovo
Ro
man
iaSe
rbia
Esto
nia
Hu
nga
ryLa
tvia
Lith
uan
iaP
ola
nd
Slo
vak
Rep
.Sl
ove
nia
Aze
rbai
jan
Be
laru
sG
eo
rgia
Mo
ldo
vaU
krai
ne
Kaz
akh
stan
Kyr
gyz
Rep
Mo
ngo
liaTa
jikis
tan
Ru
ssia
Turk
ey
Egyp
tJo
rdan
Mo
rocc
oTu
nis
ia
SEE CEB EEC CA . . SEMED
Mar 14 or latest
Mar 13 or corresponding
0
5
10
15
20
25
30
35
Alb
ania
Bu
lgar
iaC
roat
iaFY
R M
ace
do
nia
Ko
sovo
Mo
nte
ne
gro
Ro
man
iaSe
rbia
Esto
nia
Hu
nga
ryLa
tvia
Lith
uan
iaP
ola
nd
Slo
vak
Rep
.Sl
ove
nia
Be
laru
sM
old
ova
Ukr
ain
eK
azak
hst
anM
on
golia
Tajik
ista
nR
uss
iaTu
rke
yEg
ypt
Jord
anM
oro
cco
Tun
isia
SEE CEB EEC CA . . SEMED
Latest 1 year agoKOSlatest: 30.91 year ago: 47.5
0
50
100
150
200
250
Esto
nia
Hu
nga
ry
Latv
ia
Lith
uan
ia
Po
lan
d
Slo
vak
Re
pu
blic
Slo
ven
ia
BiH
Bu
lgar
ia
Cro
atia
FYR
Mac
ed
on
ia
Mo
nte
ne
gro
Ro
man
ia
Serb
ia
Arm
en
ia
Aze
rbai
jan
Be
laru
s
Ge
org
ia
Mo
ldo
va
Ukr
ain
e
Kaz
akh
stan
Kyr
gyz
Re
pu
blic
Mo
ngo
lia
Ru
ssia
Turk
ey
Egyp
t
Jord
an
CEB SEE EEC CA . . SEMED
Latest 1 year ago
0%
20%
40%
60%
80%
100%
Esto
nia
Hu
nga
ry
Latv
ia
Lith
uan
ia
Po
lan
d
Slo
vak
Re
p.
Slo
ven
ia
Alb
ania
BiH
Bu
lgar
ia
Cro
atia
FYR
Mac
ed
on
ia
Ro
man
ia
Serb
ia
Arm
en
ia
Aze
rbai
jan
Be
laru
s
Ge
org
ia
Mo
ldo
va
Ukr
ain
e
Kaz
akh
stan
Kyr
gyz
Re
p.
Mo
ngo
lia
Ru
ssia
Turk
ey
Egyp
t
Jord
an
CEB SEE EEC CA . . SEMED
latest 1 year ago
0%
20%
40%
60%
80%
100%
Esto
nia
Hu
nga
ry
Latv
ia
Lith
uan
ia
Po
lan
d
Slo
vak
Re
p.
Slo
ven
ia
BiH
Bu
lgar
ia
Cro
atia
FYR
Mac
edo
nia
Ro
man
ia
Serb
ia
Arm
en
ia
Aze
rbai
jan
Be
laru
s
Mo
ldo
va
Ukr
ain
e
Kaz
akh
stan
Kyr
gyz
Rep
.
Taji
kist
an
Mo
ngo
lia
Ru
ssia
Turk
ey
Egyp
t
CEB SEE EEC CA . . .
Latest 1 year ago
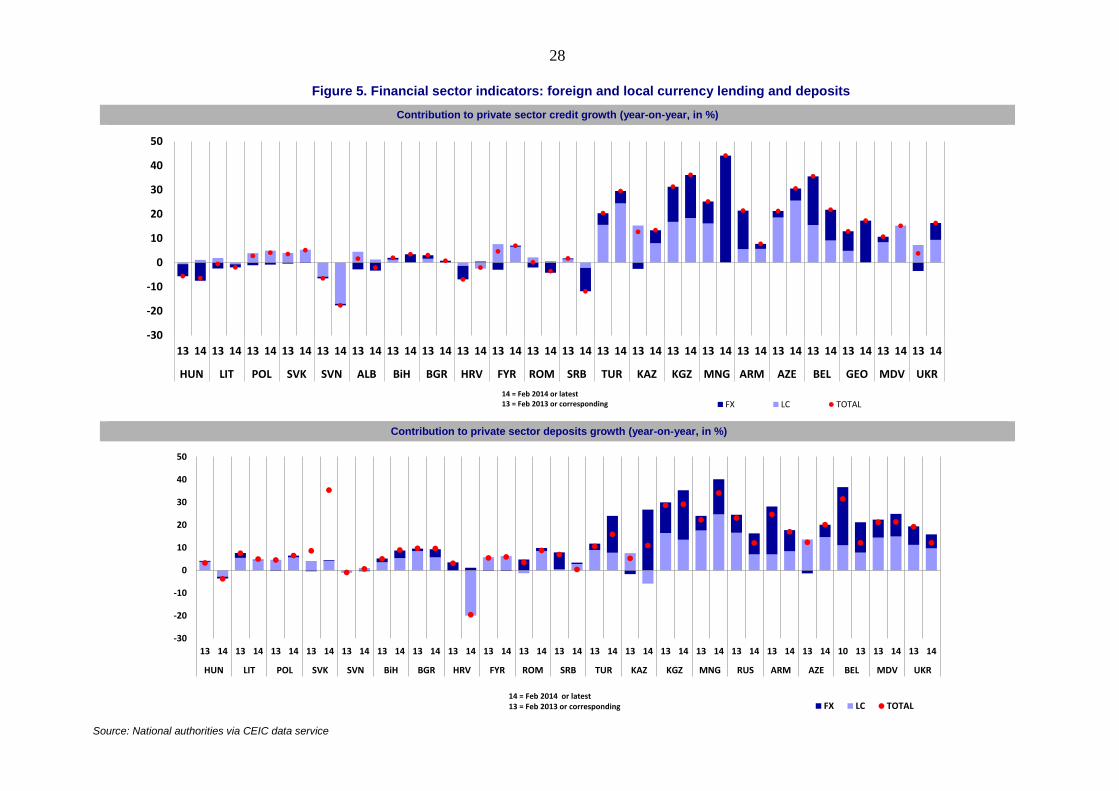
28
Figure 5. Financial sector indicators: foreign and local currency lending and deposits
Contribution to private sector credit growth (year-on-year, in %)
Contribution to private sector deposits growth (year-on-year, in %)
Source: National authorities via CEIC data service
-30
-20
-10
0
10
20
30
40
50
13 14 13 14 13 14 13 14 13 14 13 14 13 14 13 14 13 14 13 14 13 14 13 14 13 14 13 14 13 14 13 14 13 14 13 14 13 14 13 14 13 14 13 14
HUN LIT POL SVK SVN ALB BiH BGR HRV FYR ROM SRB TUR KAZ KGZ MNG ARM AZE BEL GEO MDV UKR
FX LC TOTAL14 = Feb 2014 or latest13 = Feb 2013 or corresponding
-30
-20
-10
0
10
20
30
40
50
13 14 13 14 13 14 13 14 13 14 13 14 13 14 13 14 13 14 13 14 13 14 13 14 13 14 13 14 13 14 13 14 13 14 13 14 10 13 13 14 13 14
HUN LIT POL SVK SVN BiH BGR HRV FYR ROM SRB TUR KAZ KGZ MNG RUS ARM AZE BEL MDV UKR
FX LC TOTAL14 = Feb 2014 or latest13 = Feb 2013 or corresponding

29