Embed Size (px)
Citation preview
Customer Support Metrics | 1
WHITEPAPER
The Ultimate Guide to Customer Support Metrics
Tips to Build a Productive, Reli-able,
High-Quality Global Team
Customer Support Metrics | 2
WHITEPAPER
We’ve created this guide to help you confidently achieve the right customer technical support
operation for your business. Whether you’re starting a support operation, run support in-house or
plan to outsource all or part of it — using the right metrics, with the right approach, will help you
clearly determine and attain success.
The key is that successful support for you probably looks different from successful support for
someone else. In this guide, we start with the general approaches companies take with their support
operations, show the kinds of Service Level Agreements (SLAs) that help with each approach and
finally define customer support metrics within the context of these approaches.
The Ultimate Guide to Customer Support Metrics
Customer Support Metrics | 3
WHITEPAPER
Cost vs. Quality: Competing Goals
Your metrics need to follow both your goals and your approach to meeting your goals. So, when selecting metrics to track, start by defining and prioritizing your goals and your approach.
Broadly speaking, companies have two competing support goals:
• Minimize support costs• Deliver exceptional customer service
Metrics that apply to minimizing support costs primarily measure the efficiency of your support operation. Example measures include the quantity of tickets handled, the percentage of your team’s time spent on support and the speed of contact resolution — i.e. output measures.
Metrics that apply to maintaining exceptional customer service primarily measure the quality of customer experience. Example measures include customer satisfaction (CSAT) scores and the time customers spend waiting before reaching a support agent.
Generally, efficiency metrics and quality metrics compete with each other, and they tend to lie on a continuum. The more you focus on lowering operational support costs, the more you tend to see dips in customer experience metrics. Similarly, the higher your required customer experience numbers, the lower your efficiency numbers will tend to run. And that’s okay. No single approach is best for everyone; the best approach is the one that suits your business, and it may even change over time. As a support team, the idea is to model the different possibilities along the continuum, identify the tradeoffs and make intentional decisions. Finally, set up the systems and accountability to ensure you hit the mark.

Customer Support Metrics | 4
WHITEPAPER
Setting Up the Right Service Level Agreement (SLA)
Once you prioritize your goals, define your approach to meet those goals with a strong Service Level Agree-ment (SLA). An SLA should typically define:
• What metrics are used• How those metrics are measured and calculated• Specific goals for each metric
Typically, there are two broad models for setting up an SLA. The options are generally:
• Fixed cost staffing model — you hire a fixed number of support professionals, and you pay a set price• Pay-per-ticket model — you pay a set rate per ticket and have set quality metrics that your team is
contractually obligated to meet
Fixed-CostIn a fixed-cost staffing model, the budget largely defines the customer satisfaction numbers you can meet. A set budget means you have a set number of support team members, which means your team can handle a fixed number of tickets in a given time period. Your customers will simply be served as your team gets to them. You can still make tradeoffs and prioritize certain support outcomes, but your set budget limits flexibility. This model lends itself well to focusing on operational and cost efficiencies, and as a rule, it’s always less expensive than a per-ticket model. But in this setup, you’ll also typically need to be quite hands on, even if you outsource to a customer technical support vendor.
Pay-Per-TicketTypically, if you want to focus on customer satisfaction and be as hands-off as possible, the pay-per-ticket model is a better fit. And if you outsource, it puts the responsibility for meeting set quality standards on your outsourcing partner — who is expected to find ways to meet the numbers. The higher your per-ticket rate, the more time your team can spend with each customer or the faster your team can respond to incoming tickets. Adjusting the rate up or down creates tradeoffs between costs and the flexibility your team may have to add resources and meet different metrics. That said, the right outsourcing partner can often save you money by improving efficiency over an in-house team. In the next section, we’ll use tangible metrics to nail down what efficiency and quality mean.
* Though pay-per-ticket technically only applies for outsourced teams, if you currently manage your support in-house or plan to continue doing so, we highly recommend identifying your actual per-ticket rate — or price per contact. In many cases, we’ve seen clients who manage in-house teams quickly uncover opportunities to reduce support costs by calculating their per-ticket rates. You probably will too.
Customer Support Metrics | 5
WHITEPAPER
Customer Support Metrics
We’ve given you the context around metrics, now we’ll give you the metrics rundown, starting with operational cost efficiency metrics and progressing onto metrics used to track customer experience.
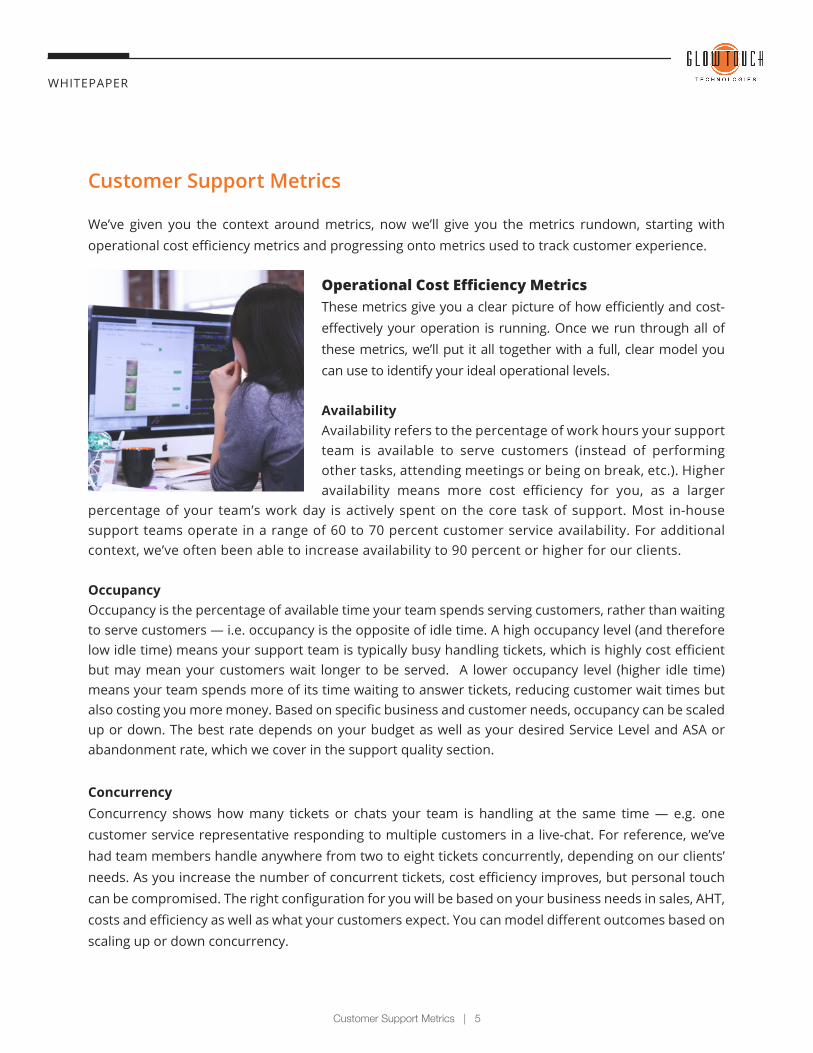
Operational Cost Efficiency MetricsThese metrics give you a clear picture of how efficiently and cost-effectively your operation is running. Once we run through all of these metrics, we’ll put it all together with a full, clear model you can use to identify your ideal operational levels.
AvailabilityAvailability refers to the percentage of work hours your support team is available to serve customers (instead of performing other tasks, attending meetings or being on break, etc.). Higher availability means more cost efficiency for you, as a larger
percentage of your team’s work day is actively spent on the core task of support. Most in-house support teams operate in a range of 60 to 70 percent customer service availability. For additional context, we’ve often been able to increase availability to 90 percent or higher for our clients.
OccupancyOccupancy is the percentage of available time your team spends serving customers, rather than waiting to serve customers — i.e. occupancy is the opposite of idle time. A high occupancy level (and therefore low idle time) means your support team is typically busy handling tickets, which is highly cost efficient but may mean your customers wait longer to be served. A lower occupancy level (higher idle time) means your team spends more of its time waiting to answer tickets, reducing customer wait times but also costing you more money. Based on specific business and customer needs, occupancy can be scaled up or down. The best rate depends on your budget as well as your desired Service Level and ASA or abandonment rate, which we cover in the support quality section.
ConcurrencyConcurrency shows how many tickets or chats your team is handling at the same time — e.g. one customer service representative responding to multiple customers in a live-chat. For reference, we’ve had team members handle anywhere from two to eight tickets concurrently, depending on our clients’ needs. As you increase the number of concurrent tickets, cost efficiency improves, but personal touch can be compromised. The right configuration for you will be based on your business needs in sales, AHT, costs and efficiency as well as what your customers expect. You can model different outcomes based on scaling up or down concurrency.
Customer Support Metrics | 6
WHITEPAPER
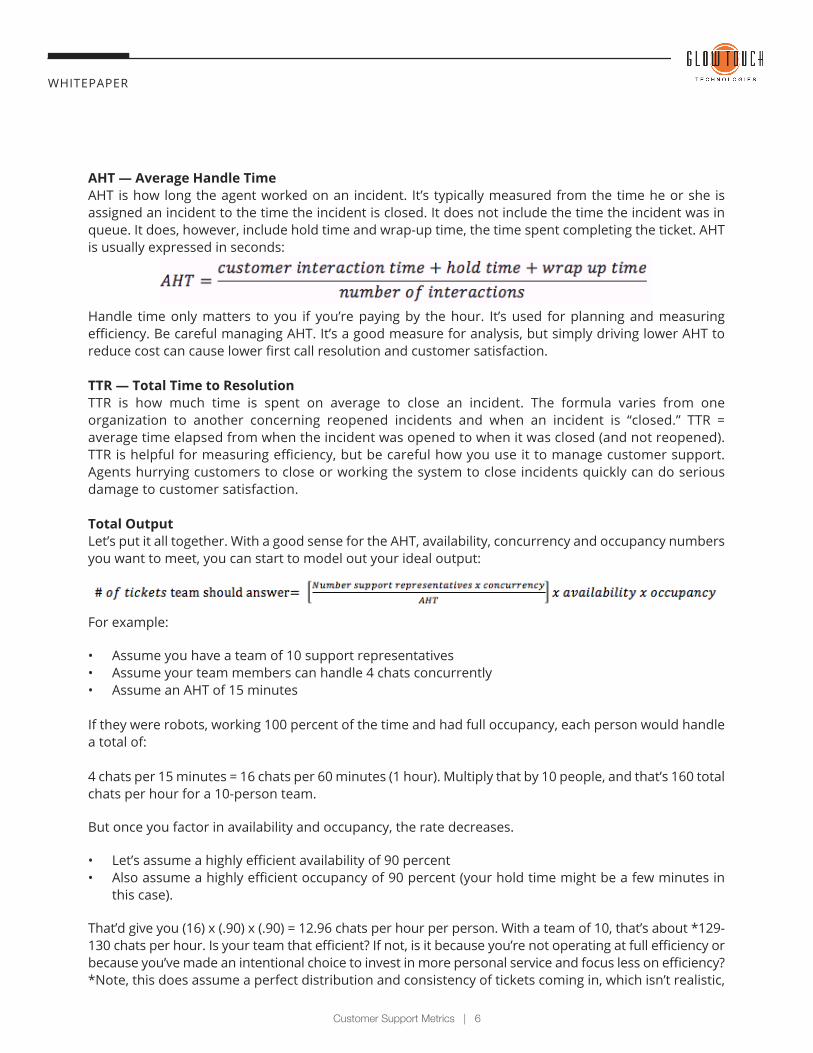
AHT — Average Handle TimeAHT is how long the agent worked on an incident. It’s typically measured from the time he or she is assigned an incident to the time the incident is closed. It does not include the time the incident was in queue. It does, however, include hold time and wrap-up time, the time spent completing the ticket. AHT is usually expressed in seconds:
Handle time only matters to you if you’re paying by the hour. It’s used for planning and measuring efficiency. Be careful managing AHT. It’s a good measure for analysis, but simply driving lower AHT to reduce cost can cause lower first call resolution and customer satisfaction.
TTR — Total Time to ResolutionTTR is how much time is spent on average to close an incident. The formula varies from one organization to another concerning reopened incidents and when an incident is “closed.” TTR = average time elapsed from when the incident was opened to when it was closed (and not reopened). TTR is helpful for measuring efficiency, but be careful how you use it to manage customer support. Agents hurrying customers to close or working the system to close incidents quickly can do serious damage to customer satisfaction.
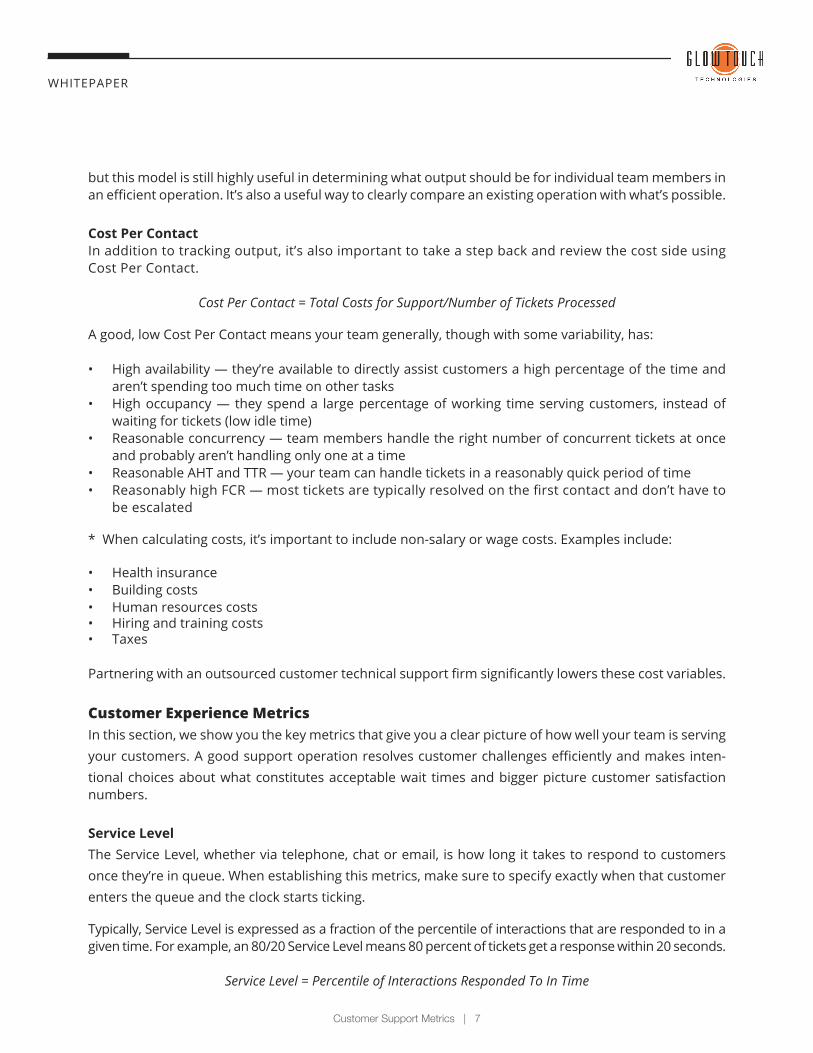
Total OutputLet’s put it all together. With a good sense for the AHT, availability, concurrency and occupancy numbers you want to meet, you can start to model out your ideal output:
For example:
• Assume you have a team of 10 support representatives• Assume your team members can handle 4 chats concurrently• Assume an AHT of 15 minutes
If they were robots, working 100 percent of the time and had full occupancy, each person would handle a total of:
4 chats per 15 minutes = 16 chats per 60 minutes (1 hour). Multiply that by 10 people, and that’s 160 total chats per hour for a 10-person team.
But once you factor in availability and occupancy, the rate decreases.
• Let’s assume a highly efficient availability of 90 percent• Also assume a highly efficient occupancy of 90 percent (your hold time might be a few minutes in
this case).
That’d give you (16) x (.90) x (.90) = 12.96 chats per hour per person. With a team of 10, that’s about *129-130 chats per hour. Is your team that efficient? If not, is it because you’re not operating at full efficiency or because you’ve made an intentional choice to invest in more personal service and focus less on efficiency?*Note, this does assume a perfect distribution and consistency of tickets coming in, which isn’t realistic,
Customer Support Metrics | 7
WHITEPAPER
but this model is still highly useful in determining what output should be for individual team members in an efficient operation. It’s also a useful way to clearly compare an existing operation with what’s possible.
Cost Per ContactIn addition to tracking output, it’s also important to take a step back and review the cost side using Cost Per Contact.
Cost Per Contact = Total Costs for Support/Number of Tickets Processed
A good, low Cost Per Contact means your team generally, though with some variability, has:
• High availability — they’re available to directly assist customers a high percentage of the time and aren’t spending too much time on other tasks
• High occupancy — they spend a large percentage of working time serving customers, instead of waiting for tickets (low idle time)
• Reasonable concurrency — team members handle the right number of concurrent tickets at once and probably aren’t handling only one at a time
• Reasonable AHT and TTR — your team can handle tickets in a reasonably quick period of time• Reasonably high FCR — most tickets are typically resolved on the first contact and don’t have to
be escalated
* When calculating costs, it’s important to include non-salary or wage costs. Examples include:
• Health insurance• Building costs• Human resources costs• Hiring and training costs• Taxes
Partnering with an outsourced customer technical support firm significantly lowers these cost variables.
Customer Experience MetricsIn this section, we show you the key metrics that give you a clear picture of how well your team is serving your customers. A good support operation resolves customer challenges efficiently and makes inten-tional choices about what constitutes acceptable wait times and bigger picture customer satisfaction numbers.
Service LevelThe Service Level, whether via telephone, chat or email, is how long it takes to respond to customers once they’re in queue. When establishing this metrics, make sure to specify exactly when that customer enters the queue and the clock starts ticking.
Typically, Service Level is expressed as a fraction of the percentile of interactions that are responded to in a given time. For example, an 80/20 Service Level means 80 percent of tickets get a response within 20 seconds.
Service Level = Percentile of Interactions Responded To In Time
Customer Support Metrics | 8
WHITEPAPER
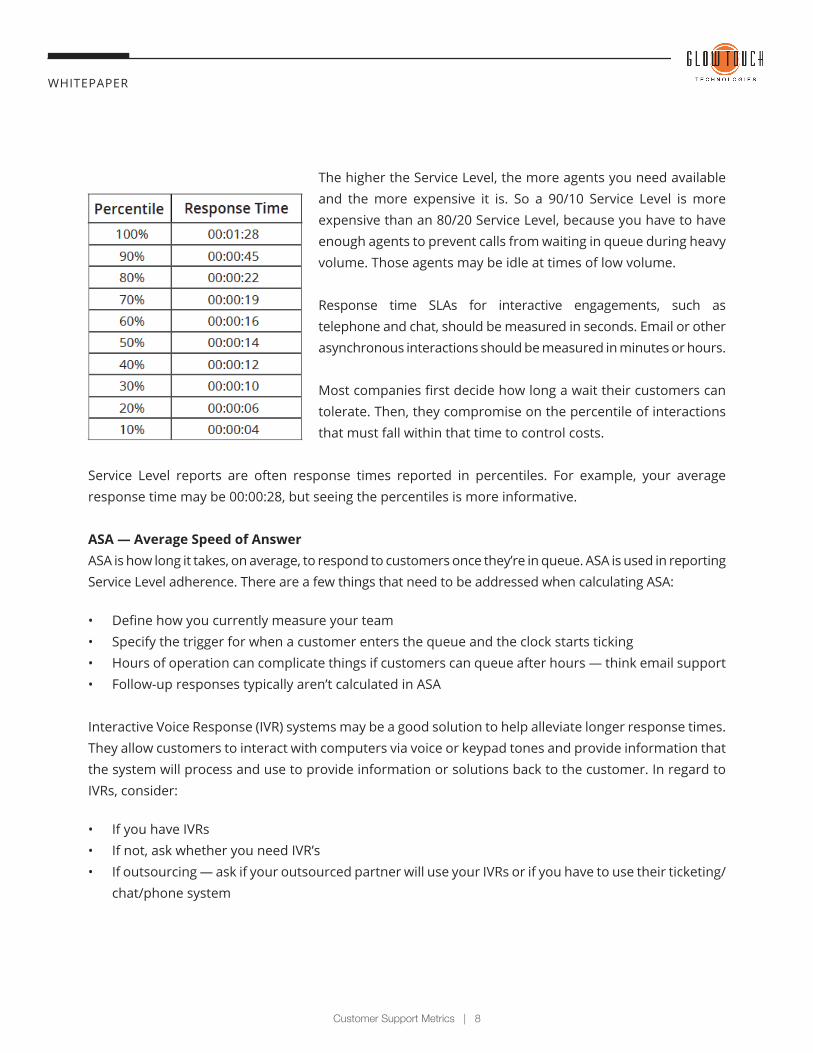
The higher the Service Level, the more agents you need available and the more expensive it is. So a 90/10 Service Level is more expensive than an 80/20 Service Level, because you have to have enough agents to prevent calls from waiting in queue during heavy volume. Those agents may be idle at times of low volume.
Response time SLAs for interactive engagements, such as telephone and chat, should be measured in seconds. Email or other asynchronous interactions should be measured in minutes or hours.
Most companies first decide how long a wait their customers can tolerate. Then, they compromise on the percentile of interactions that must fall within that time to control costs.
Service Level reports are often response times reported in percentiles. For example, your average response time may be 00:00:28, but seeing the percentiles is more informative.
ASA — Average Speed of AnswerASA is how long it takes, on average, to respond to customers once they’re in queue. ASA is used in reporting Service Level adherence. There are a few things that need to be addressed when calculating ASA:
• Define how you currently measure your team• Specify the trigger for when a customer enters the queue and the clock starts ticking• Hours of operation can complicate things if customers can queue after hours — think email support• Follow-up responses typically aren’t calculated in ASA
Interactive Voice Response (IVR) systems may be a good solution to help alleviate longer response times. They allow customers to interact with computers via voice or keypad tones and provide information that the system will process and use to provide information or solutions back to the customer. In regard to IVRs, consider:
• If you have IVRs • If not, ask whether you need IVR’s• If outsourcing — ask if your outsourced partner will use your IVRs or if you have to use their ticketing/
chat/phone system
Customer Support Metrics | 9
WHITEPAPER
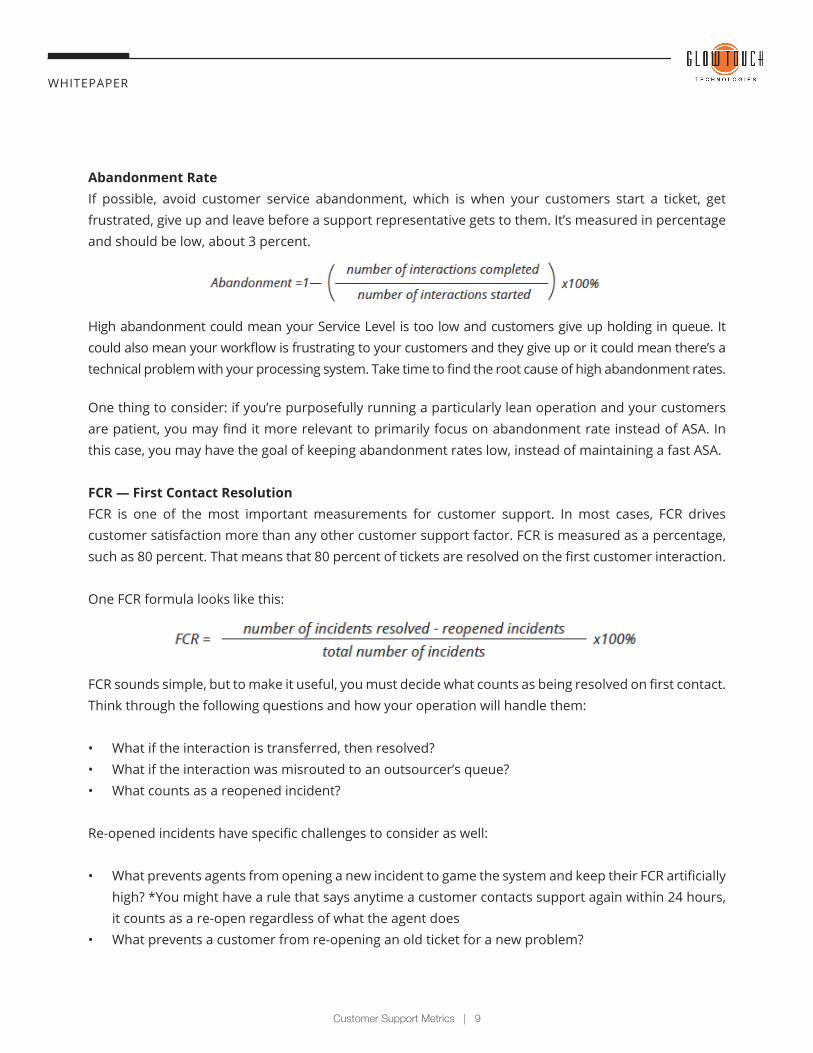
Abandonment RateIf possible, avoid customer service abandonment, which is when your customers start a ticket, get frustrated, give up and leave before a support representative gets to them. It’s measured in percentage and should be low, about 3 percent.
High abandonment could mean your Service Level is too low and customers give up holding in queue. It could also mean your workflow is frustrating to your customers and they give up or it could mean there’s a technical problem with your processing system. Take time to find the root cause of high abandonment rates.
One thing to consider: if you’re purposefully running a particularly lean operation and your customers are patient, you may find it more relevant to primarily focus on abandonment rate instead of ASA. In this case, you may have the goal of keeping abandonment rates low, instead of maintaining a fast ASA.
FCR — First Contact ResolutionFCR is one of the most important measurements for customer support. In most cases, FCR drives customer satisfaction more than any other customer support factor. FCR is measured as a percentage, such as 80 percent. That means that 80 percent of tickets are resolved on the first customer interaction.
One FCR formula looks like this:
FCR sounds simple, but to make it useful, you must decide what counts as being resolved on first contact. Think through the following questions and how your operation will handle them:
• What if the interaction is transferred, then resolved? • What if the interaction was misrouted to an outsourcer’s queue?• What counts as a reopened incident?
Re-opened incidents have specific challenges to consider as well:
• What prevents agents from opening a new incident to game the system and keep their FCR artificially high? * You might have a rule that says anytime a customer contacts support again within 24 hours, it counts as a re-open regardless of what the agent does
• What prevents a customer from re-opening an old ticket for a new problem?
Customer Support Metrics | 10
WHITEPAPER
CSAT — Customer SatisfactionIt’s important to find a good way to measure CSAT, but it’s difficult to do well. Here are some reasons why:
• Opt-in/out surveys don’t offer a good sample• Customer service agents may exploit means of preventing unhappy customers from completing surveys• Your most valuable customers probably don’t want to be bothered with surveys• Surveys are so ubiquitous today that many people avoid them• Poorly worded questions may yield unreliable results• Changing survey questions too often robs the value over time
Spend time developing a good strategy to measure customer satisfaction. There is a lot of scholarly work on how to conduct good customer satisfaction. Don’t take it lightly. Consider these options:
• Multiple channels for feedback (email, inbound/outbound phone calls, etc.)• Remove biases (e.g. happy or unhappy customers are more likely to respond)• Make sure you’re measuring what really matters: o How satisfied are your customers with their service? o What’s important to your customers and what can you do better? o How loyal are your customers? (e.g. NPS)• Consider incentives: incentives are tricky to get right without introducing bias, but should be considered• Don’t default to a 0-10 scale for every question• Keep it simple and don’t ask too many questions• Measure over time• Pay attention to the confidence interval and confidence level for your population and sample size
NPS — Net Promoter ScoreHave you noticed how many surveys ask:
How likely is it that you would recommend our company to a friend or colleague?
That’s the question companies use to measure NPS. The idea is there are only three types of customers: Promoters, Passives, and Detractors. NPS was developed by and is a registered trademark of Fred Reichheld, Bain & Company, and Satmetrix, and was published in the December 2003 issue of Harvard Business Review article The One Number You Need to Grow.
• Promoters (score of 9–10) are loyal customers who would refer you to others and help grow your customer base
• Passives (score of 7–8) are satisfied but unenthusiastic customers who may choose another provider if given the chance
• Detractors (score of 0–6) are unhappy customers who can cause others not to become your customer
Customer Support Metrics | 11
WHITEPAPER
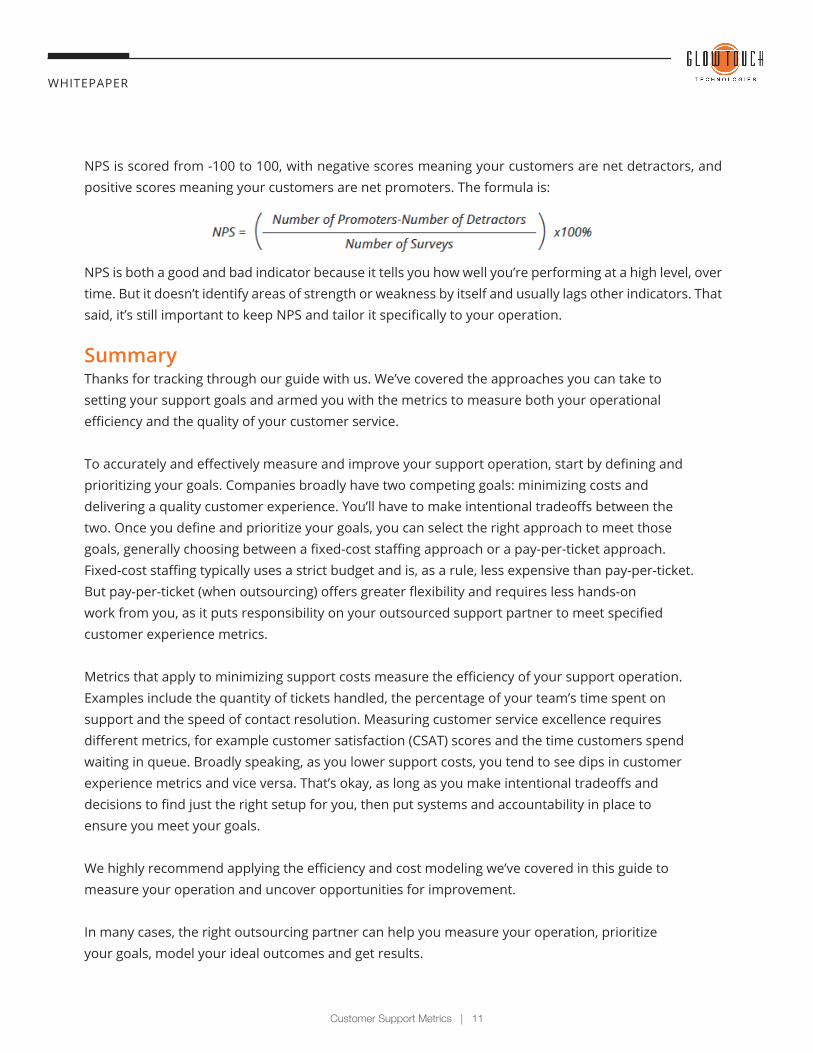
NPS is scored from -100 to 100, with negative scores meaning your customers are net detractors, and positive scores meaning your customers are net promoters. The formula is:
NPS is both a good and bad indicator because it tells you how well you’re performing at a high level, over time. But it doesn’t identify areas of strength or weakness by itself and usually lags other indicators. That said, it’s still important to keep NPS and tailor it specifically to your operation.
SummaryThanks for tracking through our guide with us. We’ve covered the approaches you can take tosetting your support goals and armed you with the metrics to measure both your operationalefficiency and the quality of your customer service.
To accurately and effectively measure and improve your support operation, start by defining andprioritizing your goals. Companies broadly have two competing goals: minimizing costs anddelivering a quality customer experience. You’ll have to make intentional tradeoffs between thetwo. Once you define and prioritize your goals, you can select the right approach to meet thosegoals, generally choosing between a fixed-cost staffing approach or a pay-per-ticket approach.Fixed-cost staffing typically uses a strict budget and is, as a rule, less expensive than pay-per-ticket.But pay-per-ticket (when outsourcing) offers greater flexibility and requires less hands-onwork from you, as it puts responsibility on your outsourced support partner to meet specifiedcustomer experience metrics.
Metrics that apply to minimizing support costs measure the efficiency of your support operation.Examples include the quantity of tickets handled, the percentage of your team’s time spent onsupport and the speed of contact resolution. Measuring customer service excellence requiresdifferent metrics, for example customer satisfaction (CSAT) scores and the time customers spendwaiting in queue. Broadly speaking, as you lower support costs, you tend to see dips in customerexperience metrics and vice versa. That’s okay, as long as you make intentional tradeoffs anddecisions to find just the right setup for you, then put systems and accountability in place toensure you meet your goals.
We highly recommend applying the efficiency and cost modeling we’ve covered in this guide tomeasure your operation and uncover opportunities for improvement.
In many cases, the right outsourcing partner can help you measure your operation, prioritizeyour goals, model your ideal outcomes and get results.
Customer Support Metrics | 12
WHITEPAPER
+1 502 410 1732 | glowtouch.com | [email protected]
Need to build an efficient, effective outsourced team for your customer support? Whether you want
to cut costs, offer 24/7 availability or just scale your team, we can help.
At GlowTouch, we handle customer technical support for hundreds of companies across a range of
industries. We’ve modeled support metrics and executed to them countless times, always tailoring
plans to the needs of our clients. Bottom line, we make the process easy.
We can even take it a step further to help you generate revenue through your support. In fact, our
clients often see 250 percent ROI.
How do we deliver this?
We’re an Inc. 5000 company, we’ve been in business since 2001 and we provide a skilled, 1,200-
person team in India with the convenience of U.S. headquarters. That means we manage support
offshoring from start to finish — contracts, IP, time zones, cultural complexities, all of it. It means
we’ve perfected processes, we’re fast and we can scale at will. But most important, we’re 100 percent
dedicated to serving you with total flexibility and long-term reliability — clients note our responsive
service.
To talk about solving your support challenges, call us at +1 502 410 1732 or email us at
About GlowTouch