Embed Size (px)
Citation preview
The US Contact Center Decision-Makers’ Guide 2017
Sponsored by

2
“The 2017 US Contact Center Decision-Makers’ Guide (10th edition)”
© ContactBabel 2017
Please note that all information is believed correct at the time of publication, but ContactBabel does not
accept responsibility for any action arising from errors or omissions within the report, links to external
websites or other third-party content.
3
CONTENTS
CONTENTS .........................................................................................................................................3
LIST OF TABLES ..................................................................................................................................5
INTRODUCTION AND METHODOLOGY .............................................................................................. 11
HOW TO USE THE REPORT............................................................................................................................ 11
SEGMENTATIONS ....................................................................................................................................... 12
VERTICAL MARKETS .................................................................................................................................... 12
SIZE BAND ................................................................................................................................................ 13
CONTACT CENTER TYPE ............................................................................................................................... 13
THE STRUCTURE OF THE DATASETS ................................................................................................................ 13
DISTRIBUTION AND USE OF THIS REPORT......................................................................................................... 15
IMPROVING QUALITY AND PERFORMANCE....................................................................................... 16
MULTICHANNEL WORKFORCE MANAGEMENT ................................................................................................. 17
INTERACTION RECORDING ........................................................................................................................... 29
CUSTOMER INTERACTION ANALYTICS ............................................................................................................. 36
QUALITY & PERFORMANCE MANAGEMENT .................................................................................................... 56
AGENT ENGAGEMENT & GAMIFICATION ........................................................................................................ 62
DESKTOP AUTOMATION & ANALYTICS ........................................................................................................... 75
CUSTOMER EXPERIENCE MEASUREMENT & IMPROVEMENT ............................................................................... 87
MAXIMIZING EFFICIENCY AND AGENT OPTIMIZATION .................................................................... 102
CONTACT CENTER PERFORMANCE............................................................................................................... 103
VIRTUAL CONTACT CENTERS & HOMEWORKING ............................................................................................ 119
OMNICHANNEL ROUTING .......................................................................................................................... 135
PCI DSS COMPLIANCE .............................................................................................................................. 150
CUSTOMER IDENTITY VERIFICATION ............................................................................................................ 163
QUEUE MANAGEMENT AND CALL-BACK ...................................................................................................... 176
HEADSETS .............................................................................................................................................. 184
NEW MEDIA AND THE CUSTOMER OF THE FUTURE ......................................................................... 195
OMNICHANNEL ....................................................................................................................................... 200
EMAIL MANAGEMENT .............................................................................................................................. 214
WEB CHAT ............................................................................................................................................. 222
SELF-SERVICE .......................................................................................................................................... 235
SOCIAL MEDIA ........................................................................................................................................ 254
THE MOBILE CUSTOMER ........................................................................................................................... 266
INCREASING PROFITABILITY ........................................................................................................... 283
CLOUD-BASED CONTACT CENTER SOLUTIONS ................................................................................................ 284
PROACTIVE CUSTOMER SERVICE ................................................................................................................. 302
4
STAFFING MANAGEMENT .............................................................................................................. 312
ATTRITION .............................................................................................................................................. 313
RECRUITMENT ......................................................................................................................................... 323
SALARIES ................................................................................................................................................ 327
STRATEGIC DIRECTIONS & INVESTMENT ......................................................................................... 328
TECHNOLOGY USAGE AND PLANS ............................................................................................................... 330
TECHNOLOGY, PEOPLE, PROCESS & PERCEPTION ........................................................................................... 335
HELPING THE CONTACT CENTER ACHIEVE ITS AIMS ........................................................................................ 336
APPENDIX: ABOUT CONTACTBABEL ................................................................................................ 338
5
LIST OF TABLES
FIGURE 1: VERTICAL MARKET DEFINITIONS ......................................................................................................... 12
FIGURE 2: USE OF WORKFORCE MANAGEMENT SYSTEMS, BY VERTICAL MARKET ........................................................ 21
FIGURE 3: USE OF WORKFORCE MANAGEMENT SYSTEMS, BY CONTACT CENTER SIZE ................................................... 22
FIGURE 4: FUNCTIONALITY USED WITHIN WFM SOLUTION.................................................................................... 23
FIGURE 5: SCHEDULING OF MULTICHANNEL WORKFORCE ACTIVITY, BY CONTACT CENTER SIZE ...................................... 24
FIGURE 6: WORKFORCE MANAGEMENT SYSTEM FUNCTIONALITY AND CAPABILITIES ................................................... 25
FIGURE 7: USE OF CALL RECORDING, BY VERTICAL MARKET .................................................................................... 31
FIGURE 8: USE OF CALL RECORDING, BY CONTACT CENTER SIZE .............................................................................. 32
FIGURE 9: SITUATIONAL RECORDING CHOICES ..................................................................................................... 32
FIGURE 10: STORAGE OF RECORDED CALLS, BY CONTACT CENTER SIZE ..................................................................... 33
FIGURE 11: STORAGE OF RECORDED NON-VOICE INTERACTIONS, BY CONTACT CENTER SIZE ......................................... 34
FIGURE 12: MOST USEFUL ADDITIONS OR IMPROVEMENTS TO INTERACTION RECORDING SOLUTION.............................. 35
FIGURE 13: USE OF INTERACTION ANALYTICS, BY CONTACT CENTER SIZE .................................................................. 48
FIGURE 14: USE OF HISTORICAL, REAL-TIME, SCREEN AND MULTICHANNEL INTERACTION ANALYTICS FUNCTIONALITY
(RESPONDENTS USING INTERACTION ANALYTICS) .......................................................................................... 52
FIGURE 15: USEFULNESS OF ANALYTICS SOLUTION ............................................................................................... 53
FIGURE 16: FOCUS OF ANALYTICS ACTIVITY ........................................................................................................ 54
FIGURE 17: FOCUS ON IMPROVEMENTS IN KPIS AND ACTIVITIES USING ANALYTICS .................................................... 55
FIGURE 18: PRIORITY AREA FOR CONTACT CENTER IMPROVEMENT .......................................................................... 57
FIGURE 19: HOW EFFECTIVE AND IMPACTFUL IS QUALITY ASSURANCE IN YOUR CONTACT CENTER? ............................... 58
FIGURE 20: WHO SCORES OR EVALUATES CALLS FROM CUSTOMERS IN YOUR ORGANIZATION? ..................................... 59
FIGURE 21: HOW EFFECTIVE IS YOUR QUALITY EVALUATION WITHIN THESE AREAS?.................................................... 60
FIGURE 22: CHALLENGES TO MANAGING PERFORMANCE & QUALITY ....................................................................... 61
FIGURE 23: EFFECTIVE METHODS OF REWARD FOR MOTIVATING AND ENGAGING AGENTS ........................................... 62
FIGURE 24: AGENT ATTRITION RATES DEPENDING ON THE EFFECTIVENESS OF REWARDS METHODS ............................... 63
FIGURE 25: AGENT ABSENCE RATES DEPENDING ON THE EFFECTIVENESS OF REWARDS METHODS ................................. 64
FIGURE 26: DIFFICULTY IN GETTING BUDGET FOR AGENT REWARD AND INCENTIVE PROGRAMS, BY CONTACT CENTER ACTIVITY
........................................................................................................................................................... 65
FIGURE 27: TOP 3 CHARACTERISTICS / ACHIEVEMENTS TO ENCOURAGE IN AGENTS .................................................... 66
FIGURE 28: TOP 3 CHARACTERISTICS TO ENCOURAGE IN AGENTS, BY CONTACT CENTER SIZE ........................................ 67
FIGURE 29: EXTENT TO WHICH THE AGENT ENGAGEMENT / REWARD PROGRAM DIRECTLY MONITORS AND SUPPORTS AGENT
IMPROVEMENTS ..................................................................................................................................... 68
FIGURE 30: COMPARISON BETWEEN CHARACTERISTICS ENCOURAGED, AND CHARACTERISTICS REWARDED ..................... 69
FIGURE 31: USE OF GAMIFICATION, BY CONTACT CENTER SIZE ............................................................................... 73
FIGURE 32: USE OF GAMIFICATION, BY CONTACT CENTER ACTIVITY ......................................................................... 74
FIGURE 33: USE OF MULTIPLE APPLICATIONS ACROSS VERTICAL MARKETS ................................................................ 76
FIGURE 34: HOW MANY APPLICATIONS DOES AN AGENT USE WITHIN A CALL? (BY CONTACT CENTER SIZE) ...................... 77
FIGURE 35: SELECTED PERFORMANCE METRICS, BY NUMBER OF IN-CALL OR POST-CALL APPLICATIONS USED ................... 79
FIGURE 36: HOW MANY APPLICATIONS DOES AN AGENT USE AFTER A CALL? (BY CONTACT CENTER SIZE) ........................ 80
FIGURE 37: AGENT DESKTOP APPLICATION FEATURES BY CONTACT CENTER SIZE ........................................................ 84
FIGURE 38: IN-CALL ACCESS TO COMPUTER-BASED KNOWLEDGE SOURCES FOR AGENTS, BY CONTACT CENTER SIZE .......... 85
6
FIGURE 39: FACTORS MOST VALUED BY CUSTOMERS USING A CONTACT CENTER ........................................................ 88
FIGURE 40: EFFECTIVENESS OF METHODS FOR GATHERING CUSTOMER INSIGHT ......................................................... 93
FIGURE 41: CUSTOMER JOURNEY PROJECTS: AN ASSESSMENT ................................................................................ 95
FIGURE 42: PROPORTION OF CALLS RECEIVED THAT ARE COMPLAINTS / TARGET OF COMPLAINTS, BY VERTICAL MARKET
(SORTED BY LARGEST PROPORTION OF COMPLAINTS ABOUT THE CONTACT CENTER - HIGH-TO-LOW) ...................... 99
FIGURE 43: BEST CHANNEL TO USE FOR COMPLAINTS ......................................................................................... 101
FIGURE 44: CONTACT CENTER METRICS ........................................................................................................... 103
FIGURE 45: USE OF MANAGEMENT INFORMATION SYSTEMS, BY CONTACT CENTER SIZE ............................................ 107
FIGURE 46: AGENT ACTIVITY ......................................................................................................................... 108
FIGURE 47: TALK TIME AND IDLE TIME, 2008-2017 .......................................................................................... 110
FIGURE 48: SELECTED PERFORMANCE METRICS ................................................................................................. 111
FIGURE 49: SELECTED PERFORMANCE METRICS (2012-2017) ............................................................................. 112
FIGURE 50: MOST IMPORTANT CONTACT CENTER METRICS ................................................................................. 113
FIGURE 51: CHANGES IN FIRST-CALL RESOLUTION RATE (2007 - 2017) ................................................................ 115
FIGURE 52: USE OF FIRST-CALL RESOLUTION MEASUREMENT METHODS ................................................................. 117
FIGURE 53: EFFECTIVENESS OF FIRST-CALL RESOLUTION MEASUREMENT METHODS (WHERE USED) ............................. 118
FIGURE 54: VIRTUAL CONTACT CENTER COMMERCIAL AND OPERATIONAL BENEFITS ................................................. 121
FIGURE 55: VIRTUALIZATION BY VERTICAL MARKET (MULTIPLE-SITE OPERATIONS ONLY) ........................................... 122
FIGURE 56: EFFECTS OF CONTACT CENTER VIRTUALIZATION ................................................................................. 123
FIGURE 57: REASONS FOR NOT YET IMPLEMENTING A FULLY VIRTUAL CONTACT CENTER ........................................... 124
FIGURE 58: NON-CONTACT CENTER STAFF HANDLING SUBSTANTIAL NUMBERS OF CALLS ........................................... 126
FIGURE 59: CURRENT USE OF HOMEWORKING .................................................................................................. 128
FIGURE 60: CHANGES IN USE OF HOMEWORKERS, 2007- Q2 2017 ..................................................................... 129
FIGURE 61: CURRENT USE OF HOMEWORKING, BY CONTACT CENTER SIZE .............................................................. 130
FIGURE 62: PROPORTION OF AGENTS TO BE HOMEWORKERS, MID-2017 & MID-2019 ............................................ 131
FIGURE 63: BUSINESS DRIVERS FOR HOMEWORKING .......................................................................................... 132
FIGURE 64: INHIBITORS TO HOMEWORKING ..................................................................................................... 133
FIGURE 65: CURRENT USE OF IP PBX / TELEPHONY INFRASTRUCTURE, BY CONTACT CENTER SIZE................................ 138
FIGURE 66: CURRENT USE OF IP PBX / TELEPHONY INFRASTRUCTURE, BY VERTICAL MARKET ..................................... 139
FIGURE 67: PRE-CALL ROUTING DECISION FACTORS, BY CONTACT CENTER SIZE ........................................................ 140
FIGURE 68: METHODS USED FOR CALL ROUTING, BY CONTACT CENTER SIZE ............................................................ 141
FIGURE 69: DTMF IVR ROUTING MENU LEVELS, BY CONTACT CENTER SIZE ............................................................ 142
FIGURE 70: DTMF IVR TOTAL ROUTING OPTIONS, BY CONTACT CENTER SIZE ......................................................... 143
FIGURE 71: TELEPHONY ROUTING STRATEGIES USED, BY CONTACT CENTER SIZE ....................................................... 145
FIGURE 72: AGENT SKILL-SETS CONSIDERED WHEN USING SKILLS-BASED ROUTING, BY CONTACT CENTER SIZE ................ 146
FIGURE 73: BARRIERS TO OMNICHANNEL: “TECHNOLOGY PLATFORM DOES NOT SUPPORT SINGLE CUSTOMER VIEW”, BY
CONTACT CENTER SIZE ........................................................................................................................... 147
FIGURE 74: DATA ELEMENTS AND STORAGE IN PCI DSS ..................................................................................... 152
FIGURE 75: HOW DOES YOUR CONTACT CENTER TAKE PAYMENTS OVER THE PHONE? (BY CONTACT CENTER SIZE) – MULTIPLE
SELECTIONS ALLOWED ........................................................................................................................... 154
FIGURE 76: METHODS USED TO ASSIST WITH PCI COMPLIANCE ........................................................................... 156
FIGURE 77: LEVEL OF CONCERN THAT CONTACT CENTER FRAUD CAN HURT THE BUSINESS, BY VERTICAL MARKET............ 161
7
FIGURE 78: HOW IN THE CONTACT CENTER’S PCI COMPLIANCE PROGRAM RUN? .................................................... 162
FIGURE 79: PROPORTION OF CALLS REQUIRING CALLER IDENTIFICATION, BY VERTICAL MARKET .................................. 164
FIGURE 80: CALLER IDENTITY AUTHENTICATION METHODS, BY CONTACT CENTER SIZE ............................................... 165
FIGURE 81: TIME TAKEN TO AUTHENTICATE CALLER IDENTITY USING AN AGENT (SECONDS) ....................................... 166
FIGURE 82: TIME TAKEN TO AUTHENTICATE CALLER IDENTITY USING AN AGENT, BY VERTICAL MARKET ......................... 166
FIGURE 83: FUTURE USE OF VOICE BIOMETRICS, BY CONTACT CENTER SIZE ............................................................. 172
FIGURE 84: INHIBITORS TO USING VOICE BIOMETRICS......................................................................................... 173
FIGURE 85: REASONS GIVEN FOR DISLIKE OF CONTACT CENTER QUEUING ............................................................... 176
FIGURE 86: TYPES OF TELEPHONY CALL-BACK OFFERED TO CUSTOMERS ................................................................. 178
FIGURE 87: USE OF WEBSITE AND QUEUE CALL-BACK OPTIONS AND QUEUE POSITION ANNOUNCEMENTS, BY CONTACT
CENTER SIZE ........................................................................................................................................ 179
FIGURE 88: PROPORTION OF CUSTOMERS IN TELEPHONY QUEUE OFFERED CALL-BACK THAT ACCEPT ........................... 180
FIGURE 89: TYPICAL QUEUE TIME OR ESTIMATED QUEUE TIME BEFORE CALL-BACK IS OFFERED (EXCLUDING IMMEDIATELY)
......................................................................................................................................................... 181
FIGURE 90: USEFULNESS OF TELEPHONY CALL-BACK FUNCTIONALITY ..................................................................... 182
FIGURE 91: USEFULNESS OF WEBSITE CALL-BACK FUNCTIONALITY ......................................................................... 183
FIGURE 92: HEADSET MANUFACTURERS USED BY RESPONDENTS (NB: TOTAL IS GREATER THAN 100% AS MULTIPLE HEADSET
MANUFACTURERS MAY HAVE BEEN USED WITHIN THE SAME OPERATION) ........................................................ 187
FIGURE 93: USE OF WIRELESS HEADSETS, BY CONTACT CENTER SIZE ...................................................................... 188
FIGURE 94: USE OF IP HEADSETS, BY CONTACT CENTER SIZE ................................................................................ 190
FIGURE 95: USE OF IP HARDPHONES AND DESKTOP SOFTPHONES, BY CONTACT CENTER SIZE ..................................... 191
FIGURE 96: USE OF SINGLE AND DUAL EARPIECE HEADSETS ................................................................................. 192
FIGURE 97: USE OF NOISE-CANCELING MICROPHONES AND HEADPHONES/EARPHONES ............................................ 193
FIGURE 98: MULTIMEDIA CHANNELS .............................................................................................................. 197
FIGURE 99: THE CUSTOMER INTERACTION CUBE AND ASSOCIATED CHANNELS ........................................................ 201
FIGURE 100: MULTICHANNEL, MULTIMODAL OR OMNICHANNEL? (BY CONTACT CENTER SIZE) ................................... 204
FIGURE 101: BARRIERS TO OMNICHANNEL ....................................................................................................... 206
FIGURE 102: MULTICHANNEL AGENT CAPABILITIES, BY CONTACT CENTER SIZE ........................................................ 207
FIGURE 103: DO NON-VOICE INTERACTIONS SHOW UP ON THE CUSTOMER’S RECORD? (BY CONTACT CENTER SIZE) ....... 208
FIGURE 104: HOW DO YOU IDENTIFY THE TOPICS OR REASONS THAT CAUSE CUSTOMERS TO CONTACT YOUR ORGANIZATION
MULTIPLE TIMES? ................................................................................................................................. 209
FIGURE 105: HOW DO YOU THINK INBOUND CHANNELS WILL CHANGE IN YOUR CONTACT CENTER IN THE NEXT 12 MONTHS?
......................................................................................................................................................... 210
FIGURE 106: INBOUND INTERACTIONS BY CHANNEL ........................................................................................... 211
FIGURE 107: INBOUND INTERACTIONS THAT ARE TELEPHONE (AGENT), BY VERTICAL MARKET .................................... 212
FIGURE 108: COST PER INBOUND INTERACTION (PHONE, EMAIL & WEB CHAT) ....................................................... 213
FIGURE 109: INBOUND INTERACTIONS THAT ARE EMAIL, BY CONTACT CENTER SIZE .................................................. 215
FIGURE 110: ESTIMATED COST PER EMAIL ....................................................................................................... 215
FIGURE 111: WHAT PROPORTION OF EMAILS ARE ANSWERED SUCCESSFULLY AND COMPLETELY WITHIN THESE TIMESCALES?
......................................................................................................................................................... 217
FIGURE 112: LEVEL OF AUTOMATION USED IN EMAIL MANAGEMENT .................................................................... 218
FIGURE 113: CONTENT OF INBOUND EMAILS .................................................................................................... 219
8
FIGURE 114: EMAILS THAT REQUIRE THE USE OF ANOTHER CHANNEL TO BE ANSWERED FULLY ................................... 220
FIGURE 115: REASONS FOR USING ANOTHER CHANNEL TO ANSWER EMAILS FULLY................................................... 221
FIGURE 116: ESTIMATED COST PER WEB CHAT .................................................................................................. 225
FIGURE 117: STAGE IN THE WEBSITE VISIT WHERE WEB CHAT IS OFFERED (MULTIPLE SELECTIONS ALLOWED) ................ 226
FIGURE 118: WEB CHAT AGENT BLENDING, BY CONTACT CENTER SIZE ................................................................... 227
FIGURE 119: CONCURRENT WEB CHATS PER AGENT ........................................................................................... 228
FIGURE 120: WEB CHAT: NEW PROSPECTS OR EXISTING CUSTOMERS? .................................................................. 229
FIGURE 121: WEB CHAT: SALES ADVICE OR SERVICE REQUESTS? .......................................................................... 230
FIGURE 122: LEVEL OF AUTOMATION USED IN WEB CHAT, BY CONTACT CENTER SIZE ................................................ 231
FIGURE 123: AVERAGE WAIT TIME TO INTERACT WITH WEB CHAT AGENT, BY CONTACT CENTER SIZE ........................... 232
FIGURE 124: ADVANTAGES AND DISADVANTAGES OF TELEPHONY SELF-SERVICE ...................................................... 237
FIGURE 125: SOME FUNCTIONS FOR SELF-SERVICE, BY VERTICAL MARKET .............................................................. 238
FIGURE 126: OVERALL PROPORTION OF CALLS HANDLED ENTIRELY THROUGH SELF-SERVICE (ONLY IN RESPONDENTS WHICH
OFFER TELEPHONY SELF-SERVICE) ............................................................................................................ 240
FIGURE 127: PROPORTION OF SELF-SERVICE CALLS HANDLED THROUGH DTMF IVR OR AUTOMATED SPEECH RECOGNITION,
BY CONTACT CENTER SIZE ....................................................................................................................... 240
FIGURE 128: PROPORTION OF SELF-SERVICE SESSIONS ‘ZEROED-OUT’ TO AN AGENT ................................................ 241
FIGURE 129: REASONS FOR ABANDONING SELF-SERVICE SESSIONS ....................................................................... 243
FIGURE 130: VISUAL IVR: BENEFITS FOR BUSINESSES AND CUSTOMERS ................................................................. 247
FIGURE 131: WEB SELF-SERVICE METHODS (2016 & 2017) ............................................................................... 252
FIGURE 132: USE OF SOCIAL MEDIA AS A SERVICE CHANNEL, BY CONTACT CENTER SIZE ............................................. 255
FIGURE 133: HOW IS SOCIAL MEDIA HANDLED? ................................................................................................ 256
FIGURE 134: HOW IS SOCIAL MEDIA HANDLED? (BY CONTACT CENTER SIZE) ........................................................... 257
FIGURE 135: POSSIBLE CUSTOMER EXPERIENCE OF SOCIAL MEDIA CHANNEL ........................................................... 258
FIGURE 136: USEFULNESS OF SOCIAL MEDIA FOR BUSINESS ACTIVITIES .................................................................. 259
FIGURE 137: TARGET RESPONSE TIMES FOR HANDLING A CUSTOMER SERVICE REQUEST VIA SOCIAL MEDIA ................... 262
FIGURE 138: SERVICE REQUESTS VIA SOCIAL MEDIA: VALUE-ADDED OPTIONS ......................................................... 263
FIGURE 139: USE OF MOBILE FUNCTIONALITY (APP, MOBILE WEBSITE) FOR CUSTOMER SERVICE, BY CONTACT CENTER SIZE
......................................................................................................................................................... 270
FIGURE 140: USE OF MOBILE FUNCTIONALITY (APP, MOBILE WEBSITE) FOR CUSTOMER SERVICE, BY VERTICAL MARKET ... 271
FIGURE 141: MOBILE CUSTOMER COMMUNICATION METHODS (BY CONTACT CENTER SIZE) – ONLY THOSE OFFERING MOBILE
SERVICE .............................................................................................................................................. 272
FIGURE 142: MOBILE CUSTOMER COMMUNICATION METHODS (BY CONTACT CENTER SIZE) ...................................... 273
FIGURE 143: WHAT INFORMATION IS PASSED TO AN AGENT AFTER ESCALATION FROM THE MOBILE CHANNEL? (BY CONTACT
CENTER SIZE) ....................................................................................................................................... 275
FIGURE 144: PRIMARY AND SECONDARY BUDGET HOLDERS FOR THE MOBILE CUSTOMER SERVICE FUNCTION ................ 276
FIGURE 145: REASONS FOR CHOOSING CLOUD-BASED SOLUTIONS ........................................................................ 291
FIGURE 146: USE OF CLOUD SOLUTIONS, BY VERTICAL MARKET ............................................................................ 296
FIGURE 147: WHICH OF YOUR CONTACT CENTER FUNCTIONALITY IS HOSTED IN THE CLOUD? (2016, WITH MID-2019
PLANS) – CLOUD-USERS ONLY ................................................................................................................. 297
FIGURE 148: HAVE CLOUD-BASED SOLUTIONS MADE ANY DIFFERENCE TO YOUR CONTACT CENTER? ........................... 299
FIGURE 149: CONCERNS ABOUT CLOUD-BASED SOLUTIONS (RESPONDENTS NOT USING CLOUD) ................................. 300
9
FIGURE 150: CONCERNS ABOUT CLOUD-BASED SOLUTIONS (RESPONDENTS USING CLOUD) ....................................... 301
FIGURE 151: USE OF AUTOMATED OUTBOUND COMMUNICATION FOR PROACTIVE CUSTOMER SERVICE ....................... 303
FIGURE 152: COST PER INBOUND INTERACTION (PHONE, EMAIL & WEB CHAT) ....................................................... 305
FIGURE 153: OUTBOUND ACTIVITY ................................................................................................................. 307
FIGURE 154: USE OF AUTOMATED OUTBOUND DIALERS, BY CONTACT CENTER SIZE .................................................. 308
FIGURE 155: USE OF CALL BLENDING BY CONTACT CENTER SIZE ............................................................................ 310
FIGURE 156: AVERAGE SPEED TO ANSWER, BY CALL BLENDING ENVIRONMENT TYPE ................................................ 310
FIGURE 157: HISTORICAL ATTRITION RATES ...................................................................................................... 315
FIGURE 158: AGENT ATTRITION RANGES ......................................................................................................... 316
FIGURE 159: MEAN AGENT ATTRITION BY VERTICAL MARKET ............................................................................... 317
FIGURE 160: CHANGES IN AGENT ATTRITION RATE IN THE PAST 12 MONTHS, BY VERTICAL MARKET ............................ 318
FIGURE 161: AGENT ATTRITION RATE BY CONTACT CENTER SIZE ........................................................................... 319
FIGURE 162: REASONS FOR AGENT ATTRITION (RANKED IN ORDER) ...................................................................... 320
FIGURE 163: SHORT-TERM ABSENCE BY VERTICAL MARKET ................................................................................. 322
FIGURE 164: SHORT-TERM ABSENCE BY CONTACT CENTER SIZE ............................................................................ 322
FIGURE 165: COST OF RECRUITING A NEW AGENT, BY CONTACT CENTER SIZE .......................................................... 324
FIGURE 166: COST OF RECRUITING A NEW AGENT, BY CONTACT CENTER ACTIVITY ................................................... 325
FIGURE 167: COST OF RECRUITING A NEW AGENT, BY VERTICAL MARKET ............................................................... 326
FIGURE 168: CONTACT CENTER SALARIES AND CHANGES .................................................................................... 327
FIGURE 169: TECHNOLOGY PENETRATION AND IMPLEMENTATION PLANS .............................................................. 330
FIGURE 170: TOP 5 MOST IMPORTANT AREAS OF CONTACT CENTER IT EXPENDITURE IN THE NEXT TWO YEARS (RANKED BY
OVERALL NUMBER OF TOP 5 PLACES) ....................................................................................................... 331
FIGURE 171: CHANGE IN TOP 5 MOST IMPORTANT AREAS OF CONTACT CENTER IT EXPENDITURE IN THE NEXT TWO YEARS,
2016-2017........................................................................................................................................ 333
FIGURE 172: RATING OF TECHNOLOGY, PEOPLE, PROCESS AND PERCEPTION IN THE CONTACT CENTER ......................... 335
FIGURE 173: WHAT IS PREVENTING THE CONTACT CENTER FROM ACHIEVING ITS AIMS? ........................................... 336
10
Shine Bright.
Serenova envisions a world where customer experiences are so fluid and effortless that they’re simply
taken for granted. We’re building that world with software that connects data, people, and brands for
brighter interactions, brighter insights, and brighter outcomes.
CxENGAGE CLOUD CONTACT CENTER
CxEngage is the highly secure, true multi-tenant, and instantly scalable multi-channel cloud Contact
Center as a Service (CCaaS) platform that transforms the way businesses and individuals interact and
perceive each other. Designed to enable exceptional customer experiences anywhere anytime - it
drastically reduces the complexity and frustration associated with multiple legacy tools and provides
better insight into data and performance than ever before possible. And with the industry's most
massively open API architecture you can effortlessly integrate with existing systems and instantly scale
to meet demand without sacrificing performance, reliability, or security.
• Command & Control Architecture
• Future Ready
• Informed Performance
• Simplified Agent Experience
• AWS Global Infrastructure & Availability
Contact:
a: (HQ) - 7300 Ranch Road 222, Bldg. III, Ste. 200
Austin, TX 78730
t: 800.411.4700
a: (UK) Abbey House, 1650 Arlington Business Park
Theale, Reading RG7 4SA
t: +44 7780 678617
w: www.serenova.com
Twitter / LinkedIn
11
INTRODUCTION AND METHODOLOGY
The "US Contact Center Decision-Makers' Guide (2017 - 10th edition)" is the major annual report studying
the performance, operations, technology and HR aspects of US contact center operations.
Taking a random sample of the industry, a detailed structured questionnaire was answered by 214
contact center managers and directors between March and June 2017. Analysis of the results was
carried out in June & July 2017. The result is the 10th edition of the largest and most comprehensive
study of all aspects of the US contact center industry.
Complete editorial independence has been maintained at all stages, and readers can be confident about
the objectivity of the report’s findings. Where sponsor opinions are given, these are clearly marked as
such.
HOW TO USE THE REPORT
“The US Contact Center Decision-Makers' Guide” identifies six of the major pain points and issues that
affect the contact center industry:
• Improving quality and performance
• Maximizing efficiency and agent optimization
• New media and the customer of the future
• Increasing profitability
• HR management
• Strategic directions.
Within each section, specific solutions are identified that can be used to solve these issues, along with
the analysis of the primary research data that are relevant to this area, including a comprehensive
statistical analysis in graphical and tabular form.
Third-party White Papers, case studies and thought leadership pieces may also be used to assist readers
who may wish to look more in-depth at specific areas or gain another viewpoint.
12
SEGMENTATIONS
Looking at industry averages for contact center statistics is only so useful. Only with a clear
understanding of how and why metrics differ between operations can readers see where they stand
compared to their competitors. As such, key statistics have been segmented in many different ways
where relevant and possible:
• by vertical market (industry sector)
• by contact center size (agent positions)
• by contact center type (e.g. inbound/outbound).
We may also segment data along other lines (e.g. sales / service) where possible and relevant.
VERTICAL MARKETS
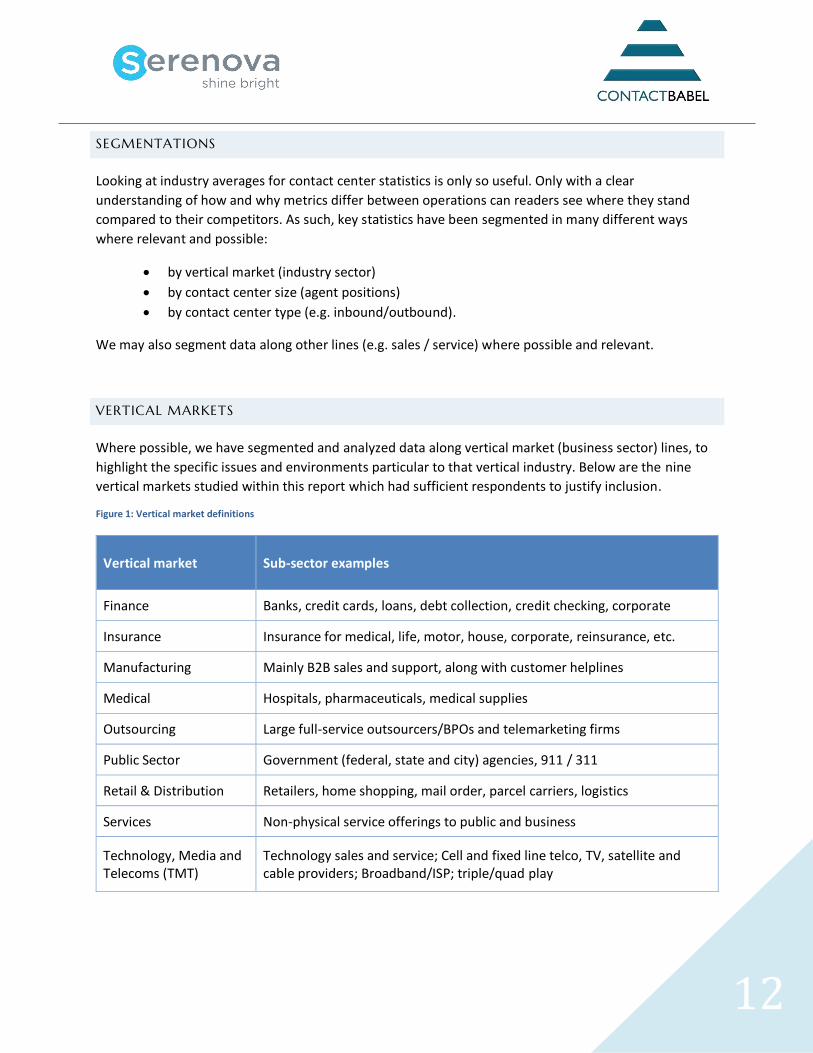
Where possible, we have segmented and analyzed data along vertical market (business sector) lines, to
highlight the specific issues and environments particular to that vertical industry. Below are the nine
vertical markets studied within this report which had sufficient respondents to justify inclusion.
Figure 1: Vertical market definitions
Vertical market
Sub-sector examples
Finance Banks, credit cards, loans, debt collection, credit checking, corporate
Insurance Insurance for medical, life, motor, house, corporate, reinsurance, etc.
Manufacturing Mainly B2B sales and support, along with customer helplines
Medical Hospitals, pharmaceuticals, medical supplies
Outsourcing Large full-service outsourcers/BPOs and telemarketing firms
Public Sector Government (federal, state and city) agencies, 911 / 311
Retail & Distribution Retailers, home shopping, mail order, parcel carriers, logistics
Services Non-physical service offerings to public and business
Technology, Media and Telecoms (TMT)
Technology sales and service; Cell and fixed line telco, TV, satellite and cable providers; Broadband/ISP; triple/quad play
13
SIZE BAND
Almost every survey question is considered from the size aspect, as differences in resources,
management techniques and technology vary greatly between size bands.
Contact centers surveyed fit into one of three categories:
• Small - 10 to 50 agent positions
• Medium - 51 to 200 agent positions
• Large - over 200 agent positions.
CONTACT CENTER TYPE
Whether a contact center is predominantly inbound or outbound can fundamentally determine how the
contact center is run. Therefore, we sometimes analyze data by contact center type:
• Inbound: at least 75% of activity is inbound
• Outbound: at least 75% of activity is outbound
• Mixed: less than 75% of activity is either inbound or outbound.
THE STRUCTURE OF THE DATASETS
The data provided by the 214 contact centers interviewed in this study were broken down into discrete
segments:
Vertical markets
• Finance - 26
• Insurance - 15
• Manufacturing - 14
• Medical - 21
• Outsourcing – 40
• Public Sector - 17
• Retail & Distribution - 14
• Services – 39
• Technology, Media and Telecoms (TMT) – 28.
14
Size bands
• Small (10 to 50 agent positions) - 87
• Medium (51 to 200 agent positions) - 57
• Large (200+ agent positions) - 68
• Did not answer (not included in size analysis) - 2.
Inbound / outbound
• Mostly inbound (75%+ inbound) - 134
• Mixed (between 26% and 74% inbound and outbound) - 54
• Mostly outbound (75%+ outbound) – 26.
Sales / service
• Mostly service (75%+ service) - 147
• Mixed (between 26% and 74% service and sales) - 41
• Mostly sales (75%+ sales) - 26.
15
DISTRIBUTION AND USE OF THIS REPORT
This report is written for the community of people interested in the present and future performance of
the US contact center industry. Amongst others, these may include:
• Contact center managers and directors
• HR managers and directors
• Operations managers and directors
• Customer service directors and those involved in contact center strategy
• IT managers and directors
• Contact center solution providers: hardware, software & services
• Outsourcers
• Consultants
• Training providers
• New entrants to the US contact center industry
• Government bodies
• Academic institutions
• Contact center industry organizations
• Regional & national development/inward investment agencies.
No sharing, swapping, gifting, photocopying or other dissemination of this report must occur
without prior written permission from ContactBabel. No findings of this report may be made
available outside your organization without prior written permission. Please email
[email protected] if you wish to reproduce any findings.
All content is strictly © ContactBabel 2017.
ContactBabel is not responsible for the content of outside agencies that are linked to via this report. All
external files are downloaded at the risk of the user.
16
IMPROVING QUALITY AND PERFORMANCE
Within this chapter, methods and solutions are discussed that improve the quality of the customer
experience and allow the contact center to gain insight into each customer and agent to improve their
own business strategy.
Topics include:
• Multichannel Workforce Management
• Interaction Recording
• Interaction Analytics
• Quality & Performance Management
• Gamification
• Desktop Automation & Analytics
• Customer Experience Measurement & Improvement
• Headsets.
17
MULTICHANNEL WORKFORCE MANAGEMENT
Workforce management solutions have to deal with environments which have become much more
complex, in order to cope with the reality of the work that is being presented to agents. For example, all
agents require good listening ability, familiarity with keyboard and IT skills and a knowledge of the
business they are working in, but more now need a pool of in-depth and specific skills to be available in
order to satisfy customers fully, including:
• Familiarity with either specific customers (e.g. account management) or customer sub-sets (e.g.
commercial vs. domestic products)
• Specific product or technical knowledge
• Right level of experience and empowerment for the customer (e.g. “gold-card” customers may
demand single-call resolution, meaning senior agents must take the call)
• Language skills (both in domestic and international markets)
• Ability to deal with multichannel interactions (either in real-time - such as web chats - or offline,
such as emails).
Fulfilling service levels while managing costs is an iterative cycle, requiring several key processes to be
completed. Feedback from each stage means that the enterprise can continually improve its efficiency
and become more confident in future predictions.
The modern contact center not only requires the basics of having enough people to answer the phone in
a reasonable amount of time, but is increasingly demanding more sophisticated functionality, such as
the ability to forecast and schedule agents within the daily activity, accurately staff across both
multichannel and voice interactions, and include back-office activities within scheduling as well where
relevant.
FORECASTING
Before any staff planning can be done, an enterprise first needs to understand what has happened in
the past. A solution which provides historical data from entire customer contacts means that scheduling
can take place in a more realistic way. Enterprises should also be able to factor in exceptions, such as
advertising campaigns, training and public holidays, view when the best time for a meeting or training
session will be, and measure the impact on the rest of the contact center. Running regular hypothetical
'what-if' scenarios can show a scheduler how alterations to shift-patterns would impact performance, as
well as assisting in business continuity by seeing what would happen in a flu epidemic, for example.
18
A great deal of unnecessary agent work can be removed by identifying the types of calls that are being
received, and determining whether these could be reduced further up the line, in the departments
whose work actively affects the volume and type of calls received, e.g. marketing or IT (for the website).
As such, workforce management is increasingly being used as part of an overall workforce optimization
suite, which can include quality monitoring, speech analytics, HR management and training as well as
the traditional workforce management roles of forecasting and scheduling, as all of these factors affect
each other.
For example, understanding when and how other departments will be operating means that workforce
management tools can be used to forecast and schedule accordingly (e.g. a new TV advert may trigger a
wave of specific calls). Additionally, contact center management is able to brief agents - via a desktop
broadcast or smartphone alert at short notice - about the correct responses and issues, as well as
changing IVR prompts and messages to provide answers to the simpler questions, as well as managing
agent skill-sets for relevant call groups.
Businesses should look for flexibility in forecasting functionality: situations can develop very quickly
which mean that forecasts can become useless without the ability to alter schedules dynamically at an
intraday level to reflect reality. As around 25% of a typical contact center’s activity is now through digital
channels, a demonstrable and sophisticated understanding of email, chat and social media volumes
should also be looked for in a vendor.
Resource planning applications, which typically look at requirements over a longer term than the typical
WFM solution, should also be considered within the forecasting functionality. Understanding how the
business will change some months in advance - perhaps for seasonal reasons, or with the launch of a
new product - will certainly impact on resourcing, and close communication and integration between
resource planning and day-to-day WFM is desirable.
SCHEDULING
Scheduling has moved far away from the traditional approach of simply making sure that approximately
the right number of agents are available based on forecasts.
While this is obviously still key to successful scheduling, the enlightened enterprise takes agent
preferences and skill sets into account. The “standard agent” approach to solving resource issues (i.e.
treating one agent the same as any other) will cause problems with both agent satisfaction and
customer service levels. Most companies using advanced workforce management software will have
between six and nine skill-sets to work with, although a few contact centers use as many as 50.
A scheduler will have to find the best way to match the company’s requirements with those of its
employees, and agent self-scheduling functionality - which allows an agent to bid for and choose specific
shifts and vacations - is not only helpful in terms of forecasting, but has a demonstratively positive effect
on agent morale and attrition rates as well.
19
Scheduling can get particularly complicated in a multichannel environment which usually has agents
with multiple media-handling skills (e.g. voice, e-mail, web chat etc.) and multiple business abilities (e.g.
sales, service, product knowledge, languages etc.), and which may well be operating within a blended
inbound-outbound environment.
An increasing number of contact center operations no longer work on strict shift patterns of a fixed
length, as flexibility can be of benefit both to the organization and the agent: the organization can
resource peak hours without risking high levels of idle time outside of this, and shorter shifts may fit in
better with the work-life balance of the agent. Many WFM solutions now offer a self-service function to
allow agents to state their preferred shift patterns, request time off, swap shifts and request overtime,
leading to more engaged and empowered agents and much less manual work for the scheduler. The
advent of cloud-based solutions and mobile smartphone apps means that agents can make requests
wherever they are, improving employee satisfaction and keeping the WFM system more up-to-date
than if they were restricted to doing this within the physical contact center within their own working
hours.
ADHERENCE AND REPORTING
Adherence is the ability to compare forecasts with reality, and learn from mistakes. Sophisticated
scheduling and forecasting is useless without the opportunity for improvement brought about by
adherence monitoring. Real-time adherence allows managers to see exactly what is happening, and can
alert them to deviations from the expected activity, allowing them to make changes before problems
occur. Adherence allows a business to fine-tune its contact center activity, and the more it is used, the
more accurate forecasts and schedules become.
WFM solutions enable contact center managers to monitor and manage agent performance in real time
by monitoring the status of an agent's activity (for example, time spent logged on, against planned work
schedules), even if the agent is working remotely. Agent adherence and non-adherence can then be
acted upon quickly, and used to support performance appraisals.
Adherence is another area where the cerebral activity of traditional workforce management has become
more dynamic. Real-time reporting on schedule adherence, and the ability to access this information
through a web browser or mobile phone means that dynamic changes can be made to the system, with
automated intraday changes being used increasingly, taking away the need for human intervention.
20
INTRADAY
In older versions of WFM, once the forecasts and schedules were set based on historical data and
expectation, the opportunity for change was extremely limited and restricted to moving agents between
queues and tasks manually: more of an art than a science. Today, leading WFM solutions allow changes
in real-time, driven by actual interaction volumes. This is often known as ‘Intraday’, a just-in-time
scheduling system based on actual demand within the contact center, and relies upon flexibility from
the agent and the enterprise, working together for the benefit of all .
For example:
• the WFM system forecasts the likely volume of interactions through each channel
• resource requirements are forecasted, based on the agent skills required
• agents submit their preferences for working hours (they have contracted to work a certain
number of hours each month)
• shift patterns are scheduled and communicated to agents, who have the opportunity to arrange
shift swaps with other agents. Businesses may wish agents to be contactable outside of their
shift, possibly through SMS or an app, so that any requested schedule alterations or short-notice
requests to login can be implemented in a timely fashion
• the WFM system alters schedules accordingly throughout the day, based on real volumes and
service levels.
Intraday goes some way to resolving the underlying tension between employee and organization
concerning workforce scheduling. It is in the enterprise’s interest to have strictly calculated forecasts
and exact allocation of resource, regardless of how this impacts upon the employee. Unsurprisingly, this
leads to resentment amongst the workforce, increasing attrition and absence rates. Intraday goes some
way to empowering the employee, without putting the enterprise at a disadvantage. WFM solutions
that are built with a flexible architecture capable of scheduling in small time-increments (e.g. minutes
rather than hours) will support employees’ needs without damaging service levels.
It is important to understand that greater empowerment of agents over their working patterns is greatly
beneficial to morale: rather than have to ask a supervisor or manager, they are to a great extent
choosing their own hours, with the resulting benefit that they have greater buy-in to the process and are
less likely to be absent, as well as reducing the time spent by supervisors in changing schedules
manually. Organizations can decide whether they wish to treat all agent requests the same way, or
whether those employees identified as the highest performers should be prioritized.
Having a more flexible WFM system should also widen the available pool of labor: whereas in the past,
the nature of scheduling meant that full-time employees were preferred, being able to schedule in
shorter time periods in near real-time supports part-time workers, homeworkers, employees based
elsewhere in the enterprise and seasonal workers.
21
There are a number of workforce management solutions that use their forecasting and scheduling
functionality to identify periods in the working day where agents are likely to be underutilized and
experience high levels of idle time. The identification of idle time is one thing: being able to recover
unproductive time in the agent’s daily routine and use this otherwise-lost capacity is quite another. A
workforce management solution that has intraday capabilities can recover these small pockets of
fragmented agent idle time as the day goes on, aggregating this time into larger blocks that can be
allocated to other productive activities such as training, coaching, back office tasks or administration,
which goes a long way towards using the agent time that businesses necessarily pay for already, but
which could not previously be accessed.
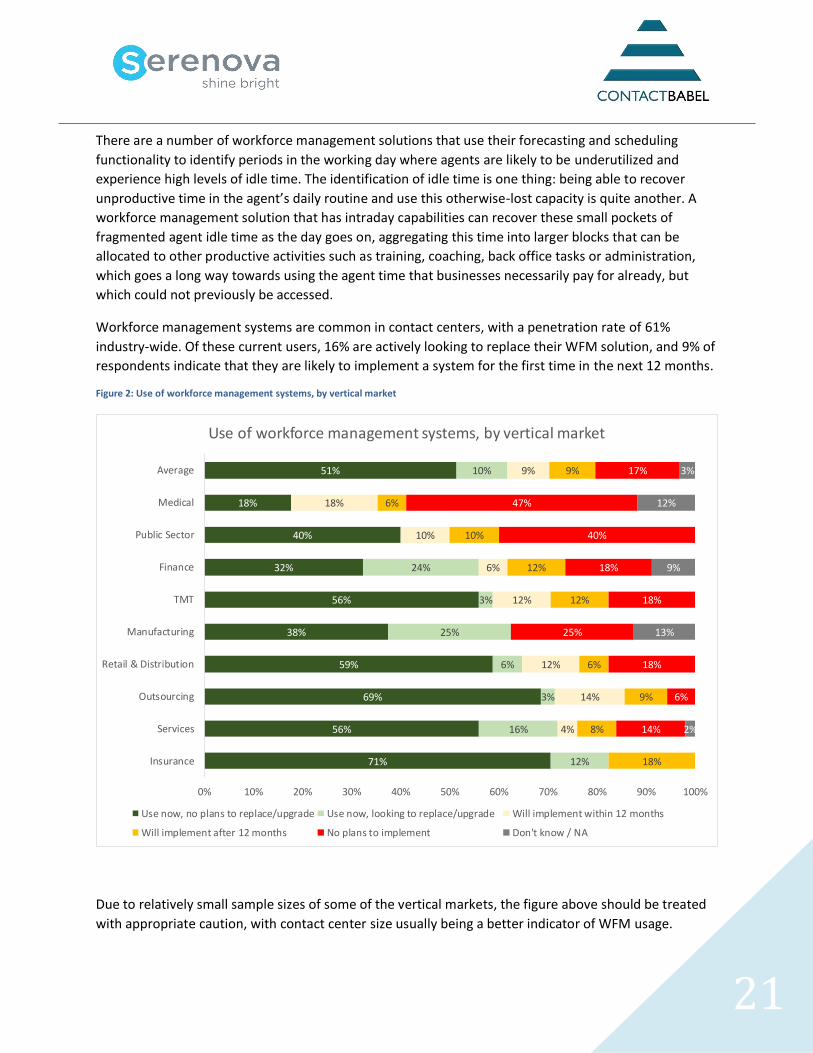
Workforce management systems are common in contact centers, with a penetration rate of 61%
industry-wide. Of these current users, 16% are actively looking to replace their WFM solution, and 9% of
respondents indicate that they are likely to implement a system for the first time in the next 12 months.
Figure 2: Use of workforce management systems, by vertical market
Due to relatively small sample sizes of some of the vertical markets, the figure above should be treated
with appropriate caution, with contact center size usually being a better indicator of WFM usage.
71%
56%
69%
59%
38%
56%
32%
40%
18%
51%
12%
16%
3%
6%
25%
3%
24%
10%
4%
14%
12%
12%
6%
10%
18%
9%
18%
8%
9%
6%
12%
12%
10%
6%
9%
14%
6%
18%
25%
18%
18%
40%
47%
17%
2%
13%
9%
12%
3%
0% 10% 20% 30% 40% 50% 60% 70% 80% 90% 100%
Insurance
Services
Outsourcing
Retail & Distribution
Manufacturing
TMT
Finance
Public Sector
Medical
Average
Use of workforce management systems, by vertical market
Use now, no plans to replace/upgrade Use now, looking to replace/upgrade Will implement within 12 months
Will implement after 12 months No plans to implement Don't know / NA
22
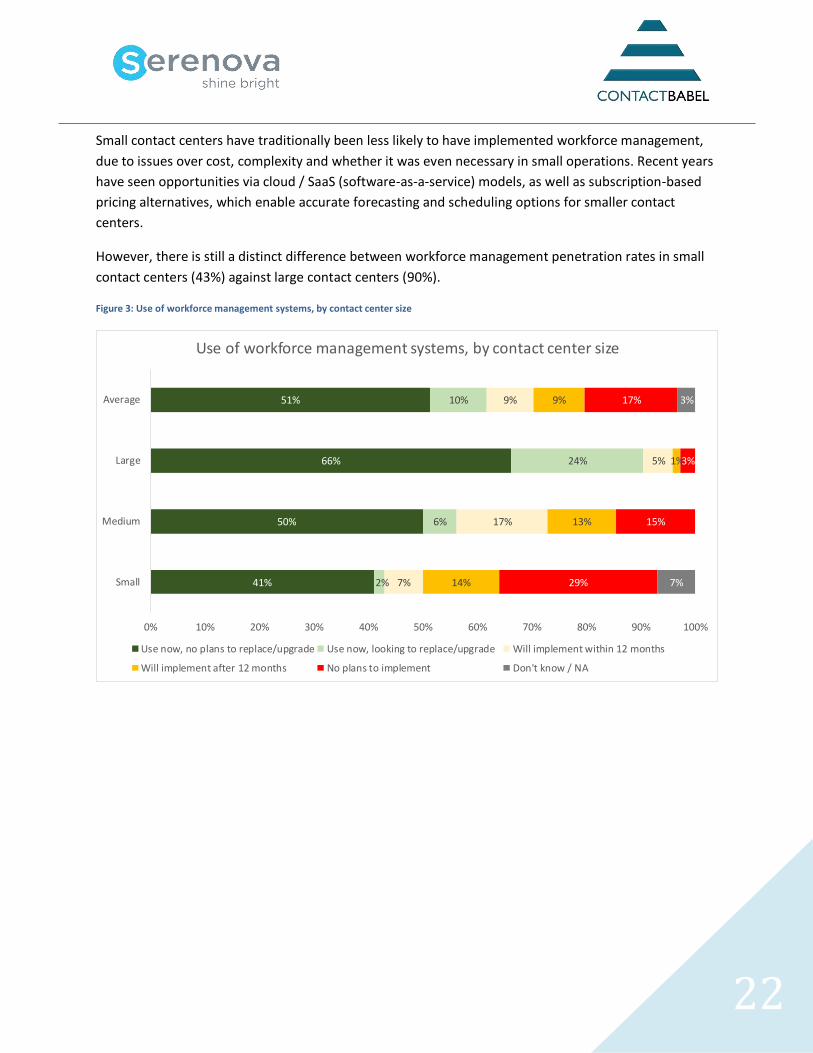
Small contact centers have traditionally been less likely to have implemented workforce management,
due to issues over cost, complexity and whether it was even necessary in small operations. Recent years
have seen opportunities via cloud / SaaS (software-as-a-service) models, as well as subscription-based
pricing alternatives, which enable accurate forecasting and scheduling options for smaller contact
centers.
However, there is still a distinct difference between workforce management penetration rates in small
contact centers (43%) against large contact centers (90%).
Figure 3: Use of workforce management systems, by contact center size
41%
50%
66%
51%
2%
6%
24%
10%
7%
17%
5%
9%
14%
13%
1%
9%
29%
15%
3%
17%
7%
3%
0% 10% 20% 30% 40% 50% 60% 70% 80% 90% 100%
Small
Medium
Large
Average
Use of workforce management systems, by contact center size
Use now, no plans to replace/upgrade Use now, looking to replace/upgrade Will implement within 12 months
Will implement after 12 months No plans to implement Don't know / NA
23
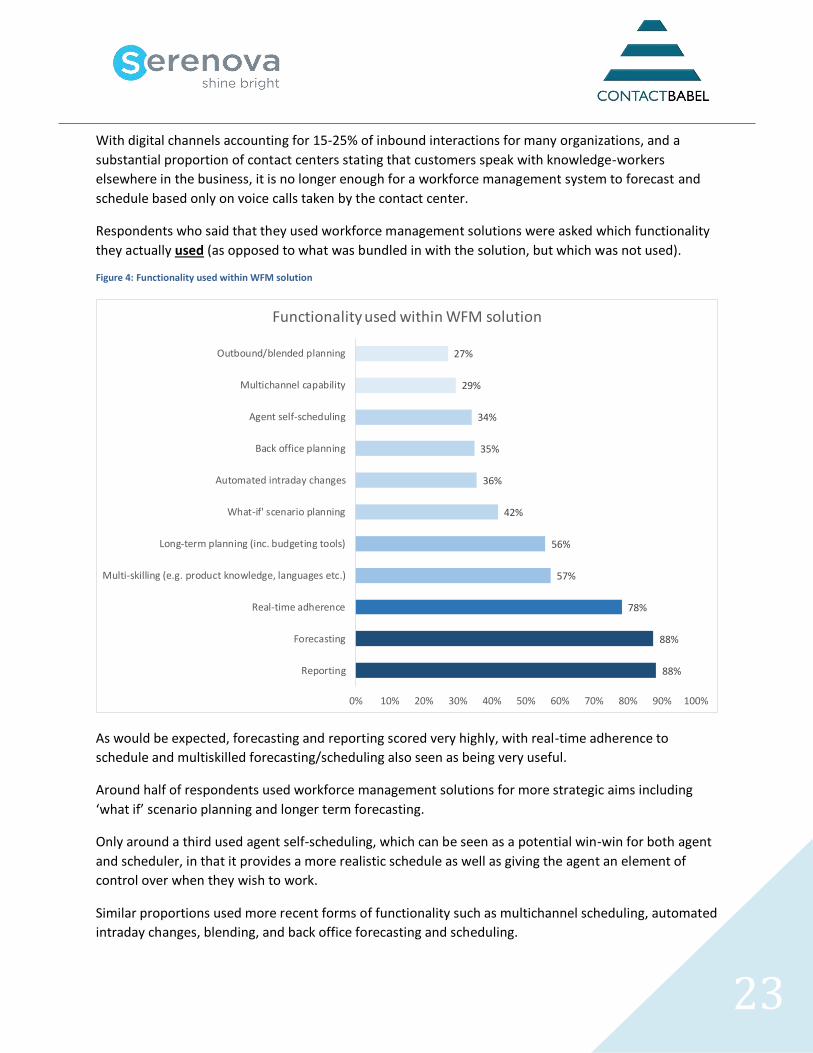
With digital channels accounting for 15-25% of inbound interactions for many organizations, and a
substantial proportion of contact centers stating that customers speak with knowledge-workers
elsewhere in the business, it is no longer enough for a workforce management system to forecast and
schedule based only on voice calls taken by the contact center.
Respondents who said that they used workforce management solutions were asked which functionality
they actually used (as opposed to what was bundled in with the solution, but which was not used).
Figure 4: Functionality used within WFM solution
As would be expected, forecasting and reporting scored very highly, with real-time adherence to
schedule and multiskilled forecasting/scheduling also seen as being very useful.
Around half of respondents used workforce management solutions for more strategic aims including
‘what if’ scenario planning and longer term forecasting.
Only around a third used agent self-scheduling, which can be seen as a potential win-win for both agent
and scheduler, in that it provides a more realistic schedule as well as giving the agent an element of
control over when they wish to work.
Similar proportions used more recent forms of functionality such as multichannel scheduling, automated
intraday changes, blending, and back office forecasting and scheduling.
88%
88%
78%
57%
56%
42%
36%
35%
34%
29%
27%
0% 10% 20% 30% 40% 50% 60% 70% 80% 90% 100%
Reporting
Forecasting
Real-time adherence
Multi-skilling (e.g. product knowledge, languages etc.)
Long-term planning (inc. budgeting tools)
What-if' scenario planning
Automated intraday changes
Back office planning
Agent self-scheduling
Multichannel capability
Outbound/blended planning
Functionality used within WFM solution
24
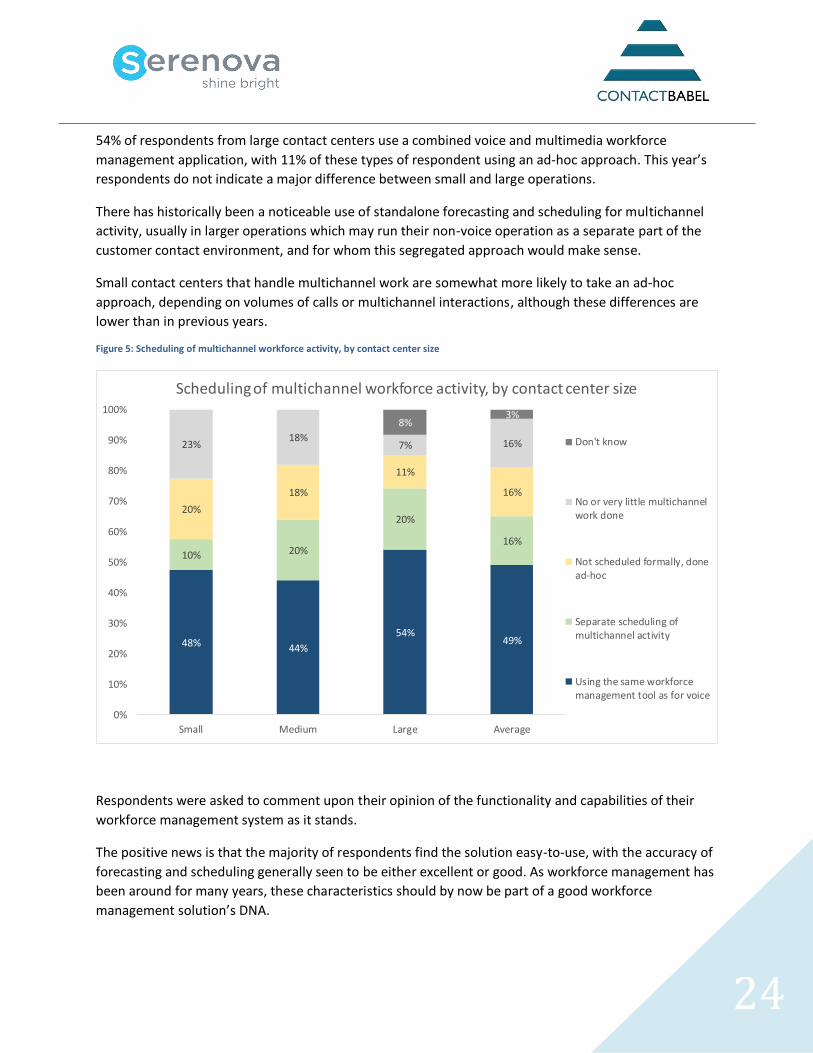
54% of respondents from large contact centers use a combined voice and multimedia workforce
management application, with 11% of these types of respondent using an ad-hoc approach. This year’s
respondents do not indicate a major difference between small and large operations.
There has historically been a noticeable use of standalone forecasting and scheduling for multichannel
activity, usually in larger operations which may run their non-voice operation as a separate part of the
customer contact environment, and for whom this segregated approach would make sense.
Small contact centers that handle multichannel work are somewhat more likely to take an ad-hoc
approach, depending on volumes of calls or multichannel interactions, although these differences are
lower than in previous years.
Figure 5: Scheduling of multichannel workforce activity, by contact center size
Respondents were asked to comment upon their opinion of the functionality and capabilities of their
workforce management system as it stands.
The positive news is that the majority of respondents find the solution easy-to-use, with the accuracy of
forecasting and scheduling generally seen to be either excellent or good. As workforce management has
been around for many years, these characteristics should by now be part of a good workforce
management solution’s DNA.
48% 44%
54%49%
10% 20%
20%
16%
20%
18%
11%
16%
23%18%
7% 16%
8%3%
0%
10%
20%
30%
40%
50%
60%
70%
80%
90%
100%
Small Medium Large Average
Scheduling of multichannel workforce activity, by contact center size
Don't know
No or very little multichannelwork done
Not scheduled formally, donead-hoc
Separate scheduling ofmultichannel activity
Using the same workforcemanagement tool as for voice
25
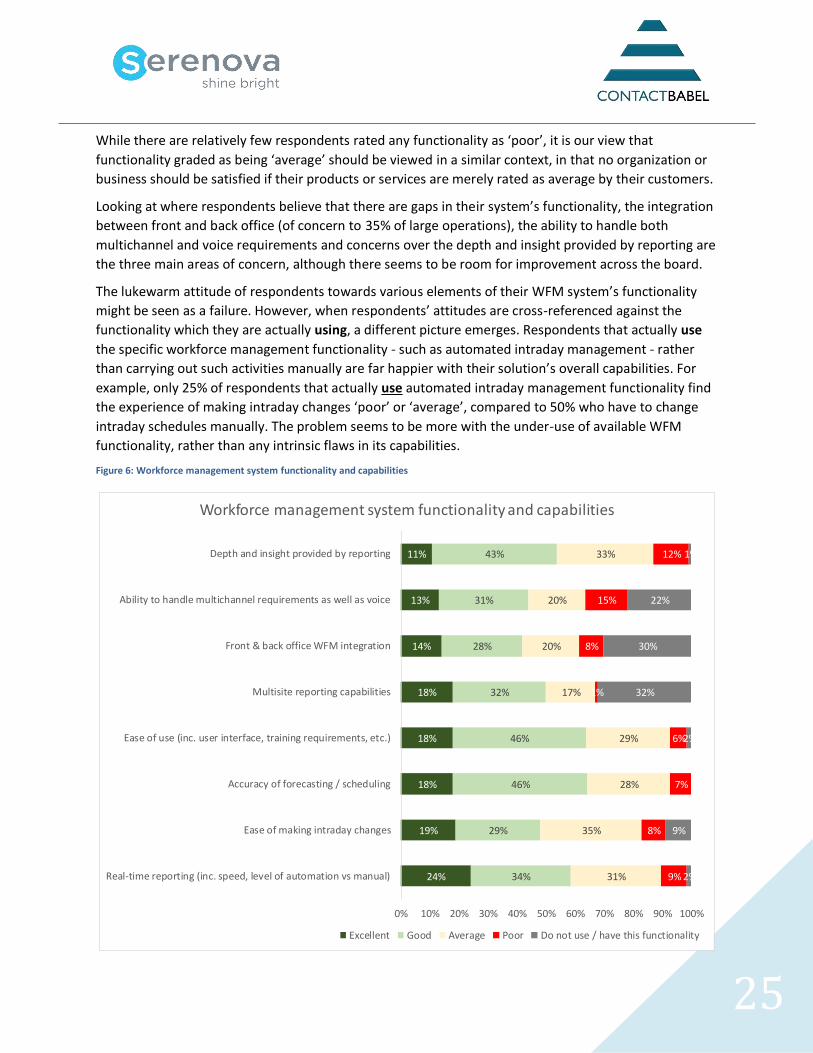
While there are relatively few respondents rated any functionality as ‘poor’, it is our view that
functionality graded as being ‘average’ should be viewed in a similar context, in that no organization or
business should be satisfied if their products or services are merely rated as average by their customers.
Looking at where respondents believe that there are gaps in their system’s functionality, the integration
between front and back office (of concern to 35% of large operations), the ability to handle both
multichannel and voice requirements and concerns over the depth and insight provided by reporting are
the three main areas of concern, although there seems to be room for improvement across the board.
The lukewarm attitude of respondents towards various elements of their WFM system’s functionality
might be seen as a failure. However, when respondents’ attitudes are cross-referenced against the
functionality which they are actually using, a different picture emerges. Respondents that actually use
the specific workforce management functionality - such as automated intraday management - rather
than carrying out such activities manually are far happier with their solution’s overall capabilities. For
example, only 25% of respondents that actually use automated intraday management functionality find
the experience of making intraday changes ‘poor’ or ‘average’, compared to 50% who have to change
intraday schedules manually. The problem seems to be more with the under-use of available WFM
functionality, rather than any intrinsic flaws in its capabilities.
Figure 6: Workforce management system functionality and capabilities
24%
19%
18%
18%
18%
14%
13%
11%
34%
29%
46%
46%
32%
28%
31%
43%
31%
35%
28%
29%
17%
20%
20%
33%
9%
8%
7%
6%
1%
8%
15%
12%
2%
9%
2%
32%
30%
22%
1%
0% 10% 20% 30% 40% 50% 60% 70% 80% 90% 100%
Real-time reporting (inc. speed, level of automation vs manual)
Ease of making intraday changes
Accuracy of forecasting / scheduling
Ease of use (inc. user interface, training requirements, etc.)
Multisite reporting capabilities
Front & back office WFM integration
Ability to handle multichannel requirements as well as voice
Depth and insight provided by reporting
Workforce management system functionality and capabilities
Excellent Good Average Poor Do not use / have this functionality
26
WORKFORCE MANAGEMENT: MANAGING THE IMPACT OF THE WIDER BUSINESS ON THE CONTACT CENTRE
No contact center is an island. The volume, type and distribution of interactions can vary considerably,
sometimes at very short notice, depending on actions happening elsewhere in the organization of which
the contact center may be unaware. As such, procedures should be put in place to inform the contact
center of issues and strategies that may alter their resourcing requirement.
For example:
• commercial leadership, HR and the contact center must communicate effectively in order to
identify skills gaps caused by a change in business strategy or direction, that can be closed
through training and/or the recruitment of employees that display the required behaviors,
characteristics and capabilities
• the types of skill set assigned to agents should be continually revisited in order to make sure
that they are aligned with the requirements and reality of the contact center, and the wider
business strategy
• ongoing communication between the contact center and ‘demand-generating’ parts of the
business (e.g. marketing, sales and new product development) needs to take place, so that likely
scenarios can be built and tested in the WFM solution and any gaps in resource or capability can
be identified and filled
• the amplifying nature of some social media can lead to sudden spikes in interactions, and also
require agents to propagate specific messages at very short notice. While the responsibility for
social media is gradually coming into the contact center’s sphere of influence, there are still
many notable occasions where a separate social media team’s actions or inactions can create
difficulties for the contact center, and the WFM solution should be capable of moving into
firefighting mode in such instances, correctly shifting resource into the necessary areas while
informing agents of the company line.
27
THE FUTURE OF WORKFORCE MANAGEMENT SOLUTIONS
Agents account for around 75% of contact center costs, and as effective workforce management
solutions have such an impact on efficiency, productivity and expense of the operation, workforce
management will continue to be the amongst the most important tools of the contact center’s disposal.
This is a very interesting time for those involved in WFM, as many disruptive influences – cloud, flexible
working, analytics, multichannel / omnichannel and back office WFM – are coalescing simultaneously,
driving vendors to expand and develop their functionality.
Cloud-based solutions don’t just offer financial benefits: as the time taken to roll out new releases is so
much less than the traditional CPE model, vendors can bring out new versions much more frequently,
and experiment with offering cutting-edge functionality far sooner than they would in a traditional
premise-based deployment environment. The continued rise in homeworking, virtualization, and
mobility in general will be a major driver for the uptake of cloud-based solutions. This model also
encourages smaller operations to implement WFM, or experiment with functionality that was previously
out of their price range.
Workforce management solution providers are keen to expand out of the traditional contact center,
with the back offices and branches of large organizations being seen as potential goldmines. Far more
employees work in these spaces than in the contact center, although many back offices lack the same
focus upon efficiency and the tools to improve it. With the increased focus on the entire customer
journey, back office processes are starting to fall within the remit of customer experience professionals,
who are likely to take their knowledge of contact center workforce management and apply it in these
new areas. The industry is likely to see back office and contact center workforce management systems
being closely integrated, or even working as a single centralized function that can track and analyze the
effect of different departments and processes on others throughout the customer journey.
This is not to say that selling back office workforce management solutions is a simple matter of
repackaging existing contact center functionality, as the back office has somewhat different
requirements to the contact center – for example, presence management, deferred workload, forecasts
built on contact center events and volumes, longer service levels, different resource requirement
calculations, adherence to schedule without data from an ACD and the identification of bottleneck
processes. Yet the opportunity exists and contact center workforce management vendors are in a prime
position to make the most of it.
Omnichannel/multichannel forecasting and scheduling will become even more important, not just as
overall digital interactions grow generally across the industry, but also as those operations that have
been struggling to handle a small proportion of emails recognize that the problem is not going to go
away, and look to invest in new workforce management solutions. While a considerable proportion of
organizations still have dedicated digital teams, many small and mid-size operations have a much more
flexible approach to multichannel, and the ability to move agents between channels in the near real-
time capacity will be highly prized. It is noticeable in previous charts in the chapter that the majority of
operations are less than satisfied with current multichannel WFM functionality, so we can expect to see
a focus from solution providers on improving this.
28
It’s important to understand that the number of channels will continue to increase: even traditional
media such as letters and faxes still have their place in many contact center operations, and next-
generation social media such as WhatsApp and Messenger are positioning themselves in the customer
contact space. Next-generation WFM solutions need to be flexible enough to handle any number of new
channels, taking into account their nature and customers’ expectations of service level when using
them. It is also likely that more sophisticated workforce management systems will be able to predict
with a reasonable level of accuracy those interaction types which are likely to require more than one
channel in order to handle them successfully, and forecast and schedule appropriately.
Recent years have seen improvements in the WFM user interface without sacrificing the sophistication
of the solution, in order to offer the benefits and capabilities to more than just dedicated technical WFM
professionals. This suits both the vendor and the business: on the one hand, justifying the extra expense
of the solution compared to basic workforce management; on the other, gaining competitive advantage
without having to employ more WFM specialists.
Contact centers as a whole are now certainly less centralized than in the past: virtualization and
homeworking are well-entrenched in many organizations and the power and ubiquity of smartphones
and tablets have led to an increase in mobile working - no longer do supervisors or managers have to be
at their desks in order to monitor performance and react accordingly - and the new generation of
workers have an expectation, both culturally and supported through regulation, that their employment
will be treated as flexible by the business as well as themselves. This attitude towards work, and the
increased empowerment of individuals will mean an increase in WFM functionality that allows shift-
swapping, vacation bidding and short-notice shift changes, with smartphone apps supporting this. The
term ‘intraday’ - referring to dynamic scheduling and resourcing in response to rapidly changing
conditions – is so useful and necessary that we expect intraday capability to become standard
functionality in future WFM solutions, meaning that the term itself may even disappear. It is also likely
that increased agent self-responsibility will lead to a situation where they are more empowered and
aware of their own performance and skills gaps, allowing them to take control of their education and
training rather than waiting for a team leader or trainer to tell them what to do.
The technological strides being made in Big Data analytics are likely to lead to advances in data
modelling and analysis that will find their way into future workforce management offerings. The use of
artificial intelligence to improve forecasting and scheduling in difficult-to-optimize areas such as call
blending is also expected. Customer journey analytics, which includes looking at workload necessary in
back office operations to fulfil the overall transaction, will be supported through the use of artificial
intelligence which will be able to use data from multiple sources throughout the enterprise in near real-
time to predict demand, forecasting and scheduling resource based upon far deeper data than simply
historical ACD statistics.
WFM will also integrate more deeply with other elements of the WFO suite: analytics is an obvious area
where business intelligence and contact center performance meet closely, but also the performance
management and QA modules, identifying best practices and singling out agents skilled in particular
types of interaction or channel. This will enable contact centers not just to have enough agents at the
right place at the right time, but enough of the right agents. This insight will also feed into coaching and
e-learning functionality, sharing best practice and identifying training opportunities.
29
INTERACTION RECORDING
Call recording and monitoring may have been around for a long time, but are still at the forefront of the
battle to improve quality and thus customer satisfaction and loyalty. The new generation of interaction
recording solutions brings the whole contact center into play, potentially gaining at several levels of the
business through using the solution in different ways.
Recording solutions have moved on from the days of simple bulk recording, and the phrase ‘call
recording’ is no longer an accurate description of the solution, and it is certainly more realistic to talk of
‘interaction recording’, which captures and synchronizes what is happening on the agent’s screen with
what is happening in the audio channel, and allows recording of after-call work, email and web chat, and
can be used to identify areas of workflow improvement.
The new generation of interaction recording solutions brings the whole contact center into play,
potentially gaining at several levels of the business through using the solution in different ways.
The traditional user of interaction recording solutions has been the contact center supervisor or team
leader. The supervisor deals heavily with quality monitoring at the agent and team level, using the
recording facility along with data about the call (e.g. call outcome) to provide examples of best practice
to other team members. This means the supervisor does not have to listen in live to the call, but can
choose which to listen to, considerably reducing cost.
The supervisor may also be responsible for the initial stages of customer dispute resolution, and can find
out exactly what has been said by customer and agent in order to deal with the matter accurately. In
industries where recording may be a legal requirement - an increasing trend - businesses may have
compliance officers to deal with disputes. Even in areas which do not require bulk recording, many
companies look upon this solution as a tool to protect against an increasingly litigious world.
With some of the more sophisticated interaction recording solutions available, the supervisor can move
into a more analytical role, understanding not only what has happened, but the reasons for it as well.
Taking a top-level view of team performance, a supervisor may see that certain types of call have been
dealt with very quickly by a specific agent. Standard management information systems may show this as
a positive situation, but the use of interaction recording capabilities may find that the agent is unable to
help the customers, and is simply passing the calls through to colleagues. Now the supervisor has a
chance to improve the situation, rather than missing the problem altogether.
Agents can be given the chance to add to the value which interaction recording can provide. By using
agent-initiated tagging of calls, your front-line team can add to the store of useful information which can
be acted upon by the company as a whole. For example, if customers talk about the competition and
what they are offering specifically, these agent-tagged calls can be reviewed for possible action by a
business’s commercial team. This has the added benefit of making agents feel a key part of the overall
business.
30
A strategic use of call recording may occur at the management or executive level. When all interactions
are recorded and analyzed, a complete performance management program may be put in place. Agent
performance can be viewed by supervisors, team performances can be analyzed by the operational
manager, and contact center performance can be evaluated by executives. Analysis of interactions is
also vital as part of a wider process optimization strategy, to identify good and bad business practices
and business process bottle-necks.
Using interaction recording, the performance of the contact center as a whole can be viewed in terms of
quality, not just quantity. Key performance indicators can be set and reviewed (such as average revenue
per call), which are directly relevant to the needs of a business as a whole. Contrast this with the
traditional efficiency measures of a contact center’s success: average speed to answer, average call
duration and occupancy rate. Measurement and improvement in key performance indicators, due to
interaction recording analysis, will help to prove the contact center capable of making a real impact on a
company’s profit.
Of those contact centers which use interaction recording, the majority use it for both quality assurance
and training purposes, so that the supervisor and the agent can both learn from it. Many of those using
interaction recording solutions are trying to get their senior management involved in what goes on
within the contact center. Compliance has also been a major reason to implement call recording.
Call recording may be used in three modes:
• 100% call recording: often used for compliance purposes, this records the entirety of every call
• Random / Scheduled Call Recording: priority-based call recording schedules can be defined
based on business rules, using multiple criteria on each schedule
• On-Demand Call Recording: contact centers may have situations where they do not need to
record an entire call. On-demand recording can be customized to support agent-initiated call
recording through a desktop interface, or automated through call recording triggers sent from
third-party software.
Call recording is used by 89% of this year’s respondents, 17% of which state that they wish to replace or
upgrade their current system. Only 4% of respondents have no intention of using call recording.
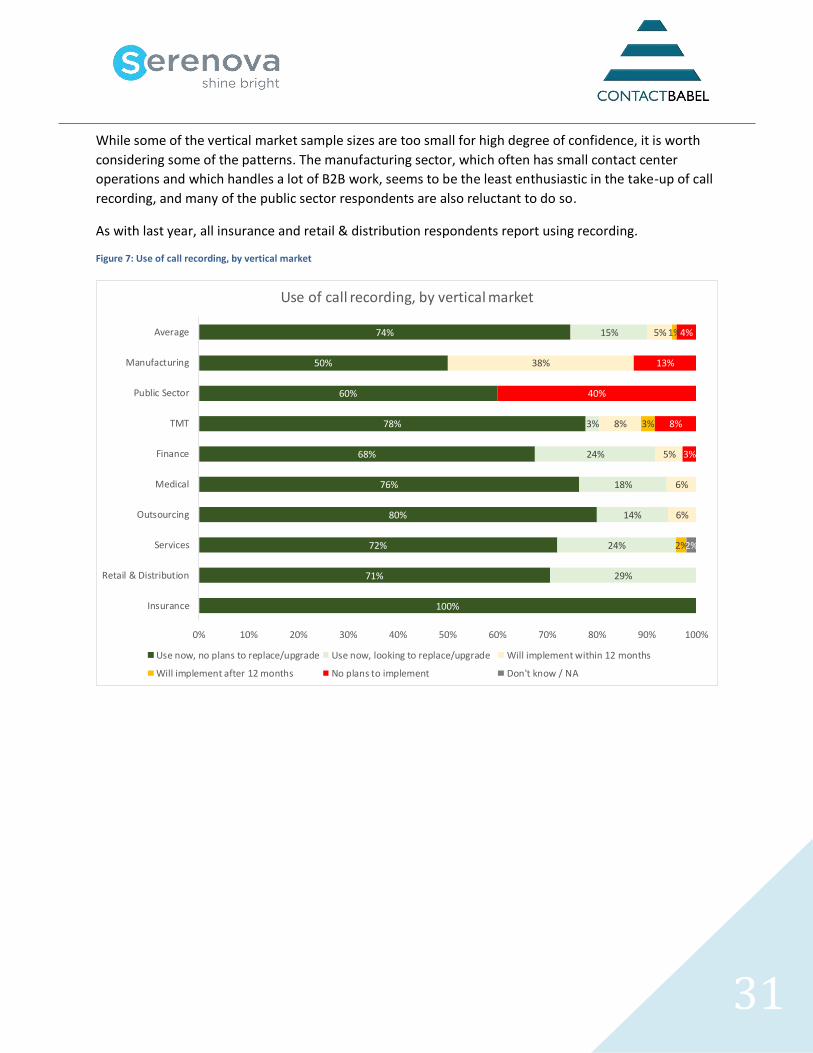
31
While some of the vertical market sample sizes are too small for high degree of confidence, it is worth
considering some of the patterns. The manufacturing sector, which often has small contact center
operations and which handles a lot of B2B work, seems to be the least enthusiastic in the take-up of call
recording, and many of the public sector respondents are also reluctant to do so.
As with last year, all insurance and retail & distribution respondents report using recording.
Figure 7: Use of call recording, by vertical market
100%
71%
72%
80%
76%
68%
78%
60%
50%
74%
29%
24%
14%
18%
24%
3%
15%
6%
6%
5%
8%
38%
5%
2%
3%
1%
3%
8%
40%
13%
4%
2%
0% 10% 20% 30% 40% 50% 60% 70% 80% 90% 100%
Insurance
Retail & Distribution
Services
Outsourcing
Medical
Finance
TMT
Public Sector
Manufacturing
Average
Use of call recording, by vertical market
Use now, no plans to replace/upgrade Use now, looking to replace/upgrade Will implement within 12 months
Will implement after 12 months No plans to implement Don't know / NA
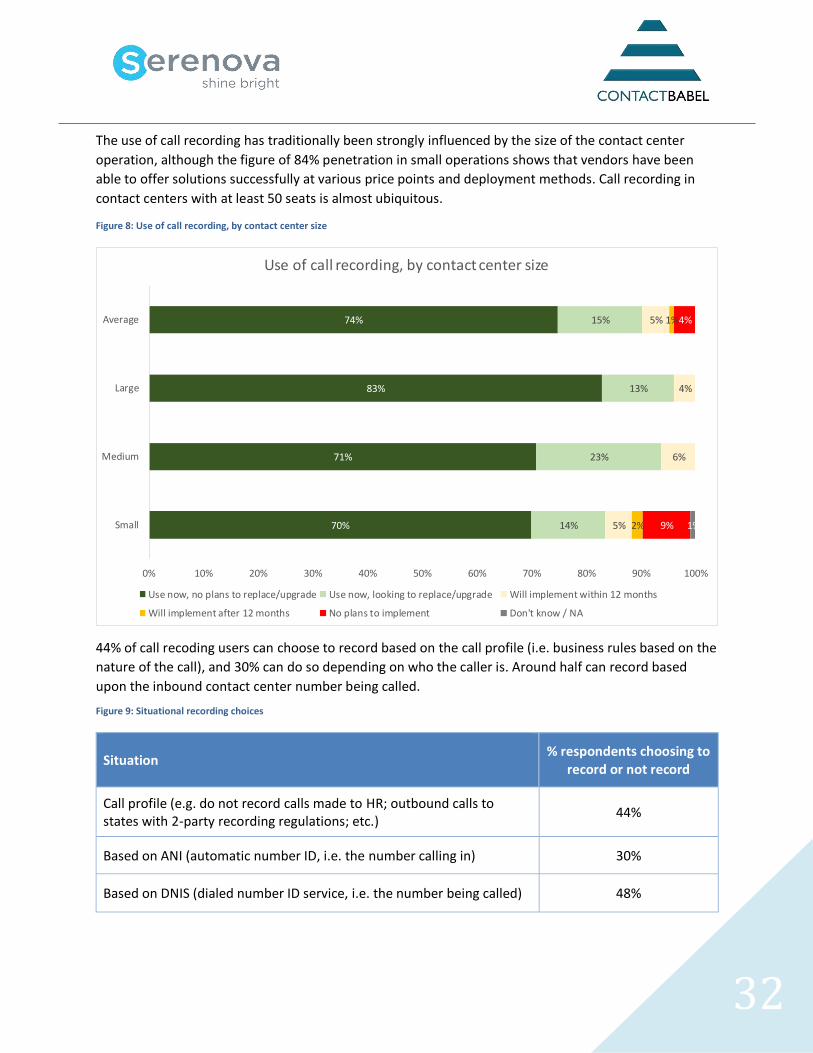
32
The use of call recording has traditionally been strongly influenced by the size of the contact center
operation, although the figure of 84% penetration in small operations shows that vendors have been
able to offer solutions successfully at various price points and deployment methods. Call recording in
contact centers with at least 50 seats is almost ubiquitous.
Figure 8: Use of call recording, by contact center size
44% of call recoding users can choose to record based on the call profile (i.e. business rules based on the
nature of the call), and 30% can do so depending on who the caller is. Around half can record based
upon the inbound contact center number being called.
Figure 9: Situational recording choices
Situation
% respondents choosing to record or not record
Call profile (e.g. do not record calls made to HR; outbound calls to states with 2-party recording regulations; etc.)
44%
Based on ANI (automatic number ID, i.e. the number calling in) 30%
Based on DNIS (dialed number ID service, i.e. the number being called) 48%
70%
71%
83%
74%
14%
23%
13%
15%
5%
6%
4%
5%
2%
1%
9%
4%
1%
0% 10% 20% 30% 40% 50% 60% 70% 80% 90% 100%
Small
Medium
Large
Average
Use of call recording, by contact center size
Use now, no plans to replace/upgrade Use now, looking to replace/upgrade Will implement within 12 months
Will implement after 12 months No plans to implement Don't know / NA
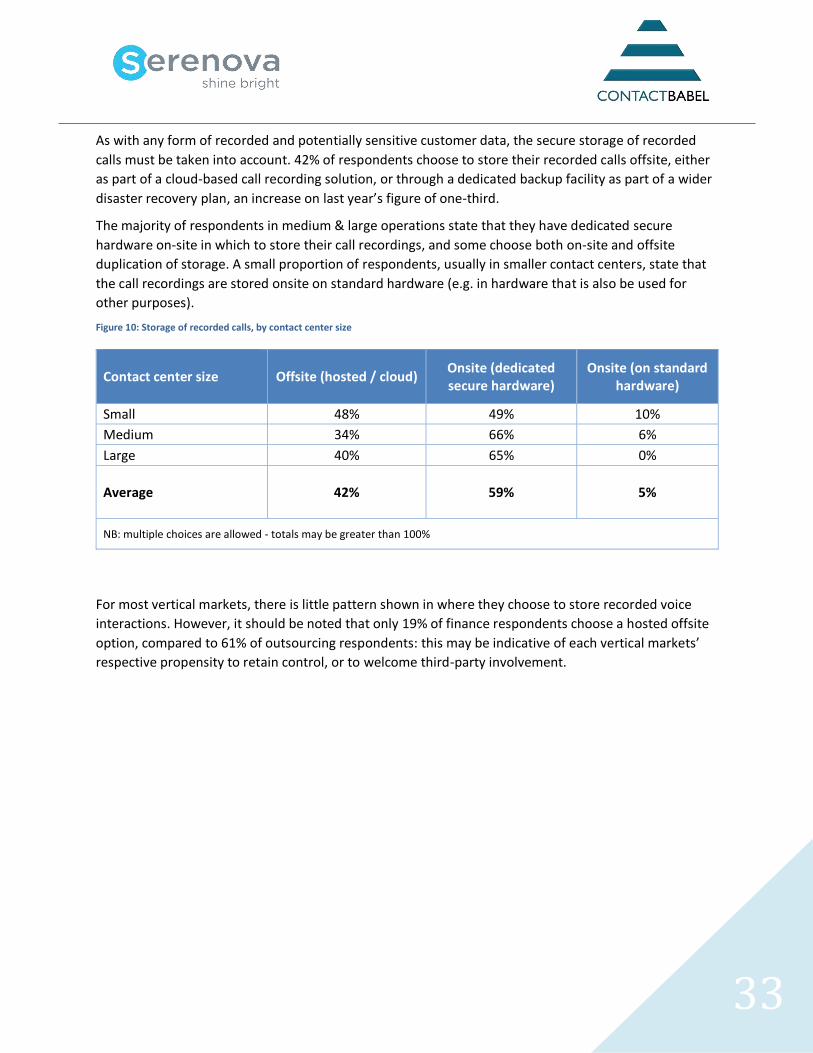
33
As with any form of recorded and potentially sensitive customer data, the secure storage of recorded
calls must be taken into account. 42% of respondents choose to store their recorded calls offsite, either
as part of a cloud-based call recording solution, or through a dedicated backup facility as part of a wider
disaster recovery plan, an increase on last year’s figure of one-third.
The majority of respondents in medium & large operations state that they have dedicated secure
hardware on-site in which to store their call recordings, and some choose both on-site and offsite
duplication of storage. A small proportion of respondents, usually in smaller contact centers, state that
the call recordings are stored onsite on standard hardware (e.g. in hardware that is also be used for
other purposes).
Figure 10: Storage of recorded calls, by contact center size
Contact center size
Offsite (hosted / cloud) Onsite (dedicated secure hardware)
Onsite (on standard hardware)
Small 48% 49% 10%
Medium 34% 66% 6%
Large 40% 65% 0%
Average 42% 59% 5%
NB: multiple choices are allowed - totals may be greater than 100%
For most vertical markets, there is little pattern shown in where they choose to store recorded voice
interactions. However, it should be noted that only 19% of finance respondents choose a hosted offsite
option, compared to 61% of outsourcing respondents: this may be indicative of each vertical markets’
respective propensity to retain control, or to welcome third-party involvement.
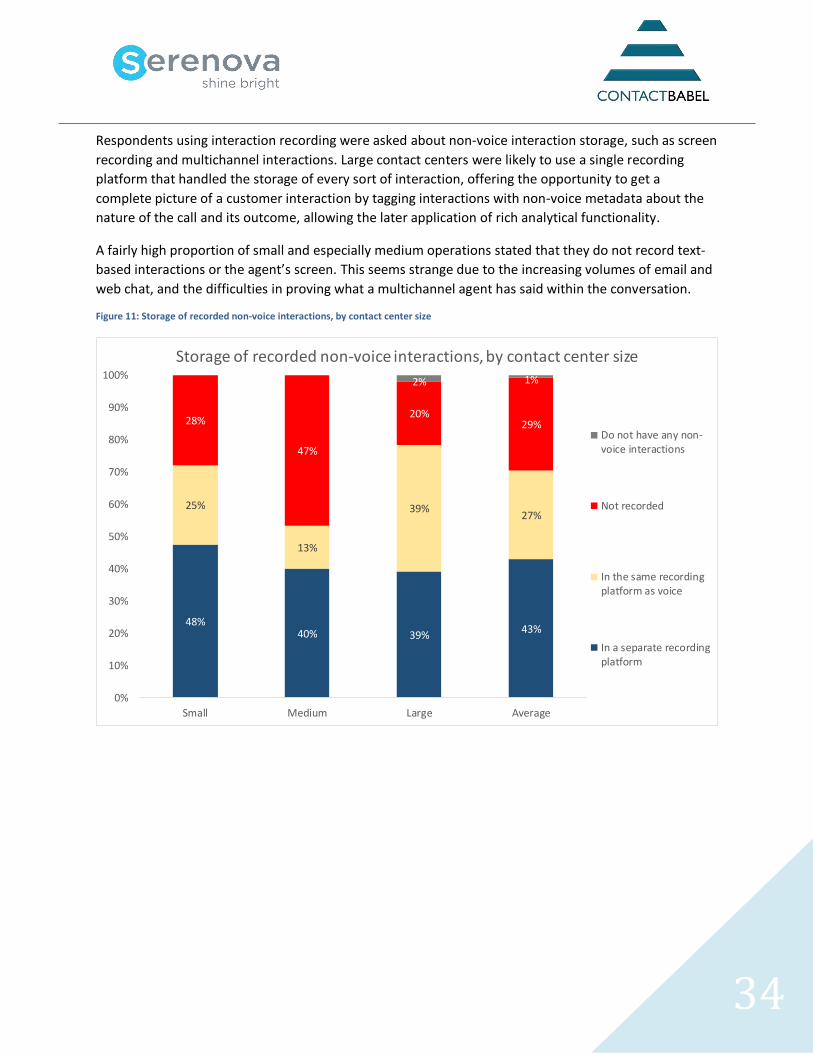
34
Respondents using interaction recording were asked about non-voice interaction storage, such as screen
recording and multichannel interactions. Large contact centers were likely to use a single recording
platform that handled the storage of every sort of interaction, offering the opportunity to get a
complete picture of a customer interaction by tagging interactions with non-voice metadata about the
nature of the call and its outcome, allowing the later application of rich analytical functionality.
A fairly high proportion of small and especially medium operations stated that they do not record text-
based interactions or the agent’s screen. This seems strange due to the increasing volumes of email and
web chat, and the difficulties in proving what a multichannel agent has said within the conversation.
Figure 11: Storage of recorded non-voice interactions, by contact center size
48%40% 39%
43%
25%
13%
39%27%
28%
47%
20%29%
2% 1%
0%
10%
20%
30%
40%
50%
60%
70%
80%
90%
100%
Small Medium Large Average
Storage of recorded non-voice interactions, by contact center size
Do not have any non-voice interactions
Not recorded
In the same recordingplatform as voice
In a separate recordingplatform
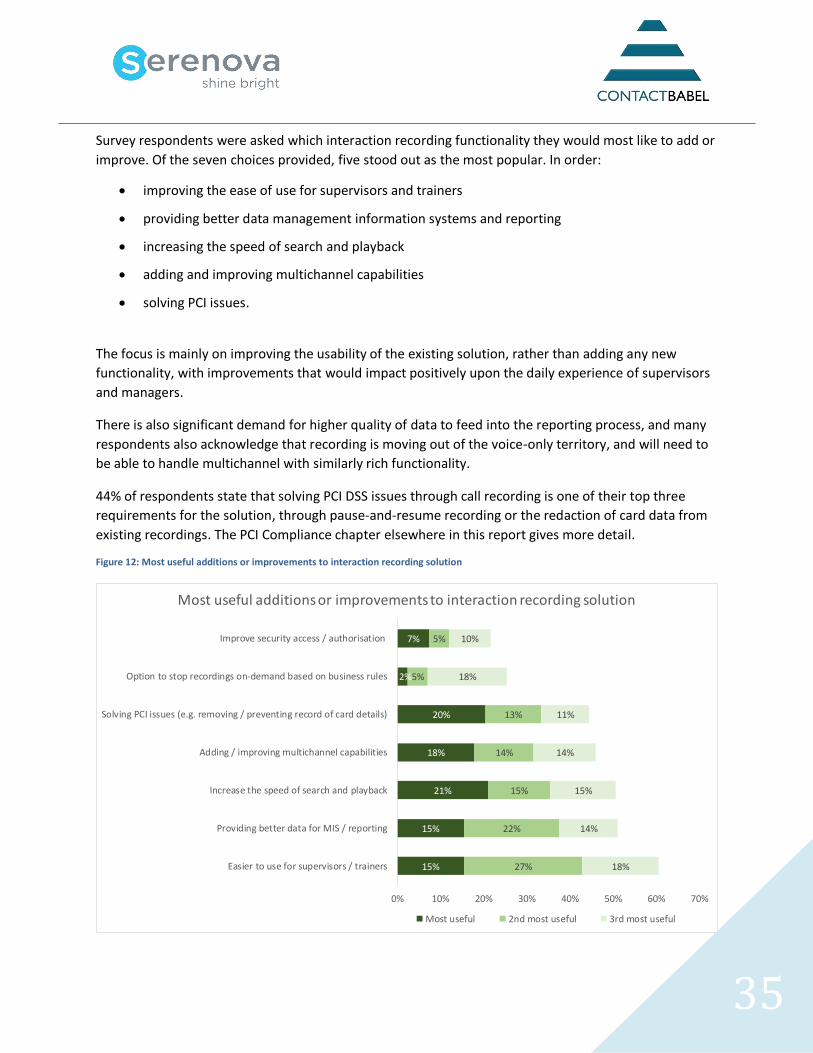
35
Survey respondents were asked which interaction recording functionality they would most like to add or
improve. Of the seven choices provided, five stood out as the most popular. In order:
• improving the ease of use for supervisors and trainers
• providing better data management information systems and reporting
• increasing the speed of search and playback
• adding and improving multichannel capabilities
• solving PCI issues.
The focus is mainly on improving the usability of the existing solution, rather than adding any new
functionality, with improvements that would impact positively upon the daily experience of supervisors
and managers.
There is also significant demand for higher quality of data to feed into the reporting process, and many
respondents also acknowledge that recording is moving out of the voice-only territory, and will need to
be able to handle multichannel with similarly rich functionality.
44% of respondents state that solving PCI DSS issues through call recording is one of their top three
requirements for the solution, through pause-and-resume recording or the redaction of card data from
existing recordings. The PCI Compliance chapter elsewhere in this report gives more detail.
Figure 12: Most useful additions or improvements to interaction recording solution
15%
15%
21%
18%
20%
2%
7%
27%
22%
15%
14%
13%
5%
5%
18%
14%
15%
14%
11%
18%
10%
0% 10% 20% 30% 40% 50% 60% 70%
Easier to use for supervisors / trainers
Providing better data for MIS / reporting
Increase the speed of search and playback
Adding / improving multichannel capabilities
Solving PCI issues (e.g. removing / preventing record of card details)
Option to stop recordings on-demand based on business rules
Improve security access / authorisation
Most useful additions or improvements to interaction recording solution
Most useful 2nd most useful 3rd most useful
36
CUSTOMER INTERACTION ANALYTICS
Customer interaction analytics solutions offer huge opportunities to gain business insight, improve
operational efficiency and develop agent performance. In fact, the list of potential applications for this
technology is so high that businesses could be forgiven for being confused about how to target and
quantify the potential business gains.
Depending on the type of business, the issues being faced and even the type of technology being
implemented, drivers, inhibitors and return on investment can differ greatly. While an analytics solution
will be implemented to look at one particular pressing issue, such as automating the QA process, it will
further develop over time into looking at business intelligence and process optimization.
INTERACTION ANALYTICS TECHNOLOGY
There are various elements to customer contact analytics solutions, including::
• Speech engine: a software program that recognizes speech and converts it into data (either
phonemes - the sounds that go to make up words - or as a text transcription, although there are
solutions which directly recognize entire spoken phrases and categorize calls based upon the
occurrence of those phrases)
• Indexing layer: a software layer that improves and indexes the output from the speech engine in
order to make it searchable
• Query-and-search user interface: the desktop application where users interact with the analytics
software, defining their requirements and carrying out searches on the indexed data
• Reporting applications: the presentation layer of analytics, often in graphical format
• Business applications: provided by vendors, these pre-defined modules look at specific issues such
as adherence to script, debt collections etc., and provide suggestions on what to look for
• Text analytics: this solution combines the transcription of customer calls with other forms of text
interactions such as email and web chat. It then uses natural language processing models along with
statistical models to find patterns
• Desktop data analytics: a solution that gathers metadata from agent desktop and CRM applications
– for example, account ID, product order history and order value – and tags them to call recordings
or digital records, enabling deeper insight.
37
Most customer contact analytics solutions use speech engines that are either phonetic or speech-to-text
/ LVCSR (Large Vocabulary Continuous Speech Recognition), also known as ‘transcription-based’.
Increasingly, solutions are using both methods to increase speed and effectiveness.
In LVCSR, the call is transcribed into text in order for analysis to take place, and depends upon a
language model and dictionary to identify words correctly. Unlike phonetics-based solutions, LVCSR
does not require predefinition of words to search for as the content of calls is available in the index.
Transcription processing has been slower than phonetic indexing, although the actual search process is
far quicker. It is generally accepted that 75-80% accuracy in word recognition is about average (although
some solutions now report up to 95% accuracy), a figure which has risen from 65-70% a few years ago.
This method allows companies to retain the entire content of calls, not just initially specified keywords
and phrases, and is generally thought of as best for root cause analysis, and identifying clusters of terms
that occur together, giving a starting point for deeper analysis.
Phonetics-based applications - which look for defined sounds or strings of sounds - attempt to match
these sounds to target words or phrases in a phonetic index file. The phonetic indexing process converts
the audio into symbols that represent the audio and the identification of issues relies upon the
predefinition of the terms to search for. The phonetic search process leverages an acoustic model tuned
to the specific language, with the search terms converted into phonemes and returns relevancy-ranked
results. In circumstances where new phrases or words are frequently being used in conversations - for
example, in retail, where new products may be emerging all the time - a phonetics approach means that
analytics users can just type in the name and it can be searched upon. Using a transcription approach,
the user has to add new words to the dictionary, and reprocess the audio, which can be time-consuming
and may require professional services.
However, if the system accurately identifies a key word, there is no guarantee that it will be used in the
correct context (for example, the word "website" may not just refer to a company's own site, but to a
competitor's or something else entirely), or will be the right word (e.g. it may be a homophone -
reed/read - or homonym bank (finance) / bank (river)). Searching on a single word will bring back many
more results, which can risk lots of false positives unless the word is very distinctive, like a competitor's
name, for example. Although a phonetics system is typically faster at processing than LVCSR, (as most
languages have a small number of unique phonemes), the search process itself is much slower since
phonemes cannot be as efficiently indexed the way whole words can.
38
Solution providers that offer analytics based upon a phonetic speech engine emphasize its usefulness
and speed where customers already know the type of words and phrases that they are looking for based
on their business needs, and not having to identify the right words in advance to put into a language
model means that unknown words and phrases can be found quickly, uncovering trends or events that
are relevant to the business. However, a different query will require searching all the data again.
There are also solutions where a phrase-driven direct speech recognition engine recognizes entire
phrases within recorded or live calls without first converting the speech into text or phonemes. This
approach combines speech and business concept recognition by directly recognizing the phrases spoken
during the conversation and comparing them to the phrases that are often found in these types of call
(sales, complaints, etc.), or those that have been defined by the client, for example in the case of
compliance or scripting which will support a real-time response.
Increasingly, solution providers are offering dual phonetic and transcription-based systems, in order to
give their customers the best of both worlds. Although these solutions may be referred to as hybrid, the
reality is that they use both methods in order to benefit from phonetics’ rapid identification of key
words and phrases, while allowing in-depth discovery and root cause analysis by use of the transcription
method. One possible way to use this is to analyze 100% of calls quickly with phonetic indexing,
categorizing and viewing trends, then transcribing the calls that are identified as being of particular
interest in order to conduct root cause analysis, without having to transcribe 100% of calls (which can
require many servers in a high call volume environment).
Businesses likely to be searching the information many times a day as part of business intelligence or
process improvement may prefer transcription as searching is quicker. If the business will be processing
large amounts of audio but searching it infrequently, for example in the case of evidence production or
proof of compliance, then phonetics may be a more appropriate choice, but as noted, many modern
applications now use both methods.
The speed, accuracy and precision of customer contact analytics technology is continually improving.
Even amongst vendors, on both sides there is broad agreement that transcription and phonetics both
work, and that they will both be around for quite some time to come. System integrators and
consultants that implement both types of solution state that accuracy levels and phrase-finding
capabilities are similar for each type of technology, and that both are able to provide historical analysis
and reporting. There is also consensus that the major issue is not which flavor of analytics solution to
choose, but the organization’s ability to deliver business change based on the insights that come out of
whatever customer contact analytics solution is chosen.
39
DRIVERS FOR CUSTOMER INTERACTION ANALYTICS
Most contact center solutions have a specific, easily-communicated reason for purchase, usually around
cost savings. The most popular and widespread solutions, such as IVR, workforce management, CTI and
outbound dialing, have all had a clear and quantifiable route to cost savings and improved efficiency.
Interaction analytics has a different appeal to contact centers, and can be used in many different ways
to address various business issues. This is an advantage - it is hugely flexible - but it can also make its
message to the market more complicated. However, depending upon how interaction analytics is used,
it can assist in:
• agent improvement
• business process optimization
• avoidance of litigation and fines
• customer satisfaction and loyalty improvements
• increases in revenue and profitability
• improvements in contact center operational performance, and cost reduction.
40
AGENT IMPROVEMENT
Improve the quality monitoring program
Interaction analytics tries to takes the guesswork out of improving customer experience, agent
performance and customer insight. By moving from anecdote-based decisions, from qualitative to
quantitative information, some order is put on the millions of interactions that many large contact
centers have in their recording systems, improving the reliability of the intelligence provided to decision-
makers. The need to listen to calls is still there, but those listened to are far more likely to be the right
ones, whether for agent evaluation or business insight. Automated QM also saves considerable time and
money. Rather than just monitoring 1-3% of calls which is average for contact centers using manual QM,
companies can monitor 100% of calls with the same number or fewer QM staff.
In addition, automated QM takes all the subjectivity out of performance evaluations. All agents are
being evaluated and scored on the same KPIs based on purely objective measures. Instead of catching
agents on a good day or a bad day, they can be evaluated based on all conversations.
Identification of training needs
Apart from 100% monitoring of calls, speech analytics is used to flag cases of talk-over, as well as silence
detection. The former can be a source of irritation to the customer and long silences can indicate lack of
agent knowledge, although long system navigation times or delays in system response times can also
cause this. The analysis of these types of call will identify which of these issues is really the problem, and
make the training and coaching received by new agents in particular far more effective and targeted.
Speech analytics also provides trend analysis so users can identify which agents consistently achieve the
best outcomes and what they are doing differently, allowing best practice training for all agents.
41
BUSINESS PROCESS OPTIMIZATION & INTELLIGENCE
Cross-departmental insight
The marketing, sales and product development departments are amongst the non-contact center areas
most likely to be benefiting currently from insights about customers' views, but there are also examples
of how delivery, provisioning, billing and even warehousing departments have learned from the analysis
of customers' experiences in the contact center.
The quality of insight and its actionability is totally dependent on a swift reporting process, simple yet
rich intelligence, the ownership of process improvement at senior level and before/after comparisons to
prove success. Cross-department rivalries or poor communication are a real risk to this, and the
importance of having a project champion of sufficient seniority to exercise cross-department control
cannot be underestimated.
Categorization
No other contact center solution apart from customer interaction analytics can provide a solid
understanding of why customers are calling. Categorizing types of calls, and then analyzing them for the
occurrence of similar types of words and phrases can give insight into the reasons for customers' calls.
The automatic categorization of calls, based on the types of words and phrases that typically get used
within these types of calls, is a starting point. Analytics solutions can then add non-audio data, such as
desktop activity or account status, and the tracking of word usage compared with its historical use (e.g.
a 300% rise in the use of the phrase "can't log-on" after a software upgrade) can quickly indicate and
identify issues that can be handed to the relevant department much more quickly than typical inter-
department channels could usually manage.
The customer experience outside the contact center
There is an increasing requirement and interest in multichannel analytics, including considering email,
web chat, IVR and web browsing sessions to get the full picture of the customer's real journey in a single
interaction, in order to identify and improve any channels that failed to fulfil their requirements.
Improving self-service optimization is often a quick win that can provide immediate economic benefit to
businesses: around 1 in 5 calls that go into an IVR system are 'zeroed-out' - rejected by the customer in
favor of an operator.
42
COMPLIANCE
Many businesses, especially those in finance, insurance, public sector and debt collection, have become
encumbered with regulations which they must follow strictly, with potentially expensive penalties for
failure, including heavy fines and criminal prosecution. Contact centers have tried to reduce their risk
through scripting, call monitoring and call recording, but these do not offer any guarantees or proof of
compliance. Speech analytics means that 100% of calls can be verified as compliant - and be proven to
be so - preventing disputes or escalation of enquiries by monitoring the exact language used within each
call.
Real-time compliance and adherence to script
Real-time call monitoring means that the creation of phone-based contracts can be completed (and
seen to be completed) first-time, with all relevant information provided to the customer on the call, and
red-flagged on the agent's screen if they have missed saying anything vital, or made an error. This
reduces the need to call a customer back and avoids any dispute over whether a legitimate contract has
been made. While some compliance solutions use historical analysis to check that regulations have been
adhered to, other solution providers take the view that compliance should be enforced within the
conversation itself, and trigger alerts to the agent desktop to make sure that all of the relevant script
and customer responses have been included.
CUSTOMER SATISFACTION & LOYALTY IMPROVEMENTS
With all of the methods of customer surveys, the questions are fixed in advance, and if the right
questions aren’t asked, the level of actionable insight is low. In many cases, a business might know that
x% of its customers are satisfied, and y% dissatisfied, but it still has no real idea why this is, or even how
it will impact their profitability. As an alternative to customer satisfaction surveys, customer interaction
analytics allows a business to gather customers' views within the interaction itself - guaranteeing
immediacy and accuracy - and can be applied across 100% of calls, rather than focusing on the outlying
'very dissatisfied' or 'delighted' customers. Furthermore, through widespread and detailed analysis of
what the call is about, the type of language or messages used in the call, how the customer was
handled, and the eventual outcome, businesses will be able to learn how to improve their customer
retention and satisfaction in real-life, by-passing the standard metric (e.g. "83% of customers are
satisfied") and getting to the root causes of satisfaction or dissatisfaction and sharing the results with
the rest of the operation.
43
First-call resolution
A major metric for contact center and customer experience success, first-call resolution can be
increased by identifying repeat callers and eliminating the root cause of repeat calls.
An example of this was an organization where they had identified repeat issues as being a problem.
Analyzing the calls categorized as such, it was found that agents were saying "we'll call you back within 3
hours". As the callers were very keen to get the issue resolved, they were prone to overestimate the
time passing, so analysis found that many called back before the three hours were up. By changing the
script to e.g. "It's now 11.45am, we'll call you back by 2.45pm", customer expectations were set and call-
backs dropped immediately. A few weeks later, call-backs went back up, and it was found that many
agents had gone back to the 'old ways', and had forgotten to give the exact time.
Complaints handling
Complaints are a potentially rich environment for businesses to understand where they are going
wrong, and which issues are in danger of turning a customer into an ex-customer. For many businesses,
each complaint is dealt with on a case-by-case basis, with little in the way of categorization or structure
being put in place formally, and little chance of communicating findings in an actionable way to the
relevant department.
Speech analytics gives businesses a chance to quantify the reasons that customers complain, identifying
the most important factors, assessing trends and spikes, and providing hard recommendations based on
every call taken. Real-time analytics allow businesses to track words and phrases related to complaints
(such as 'supervisor', 'manager', 'complain', 'unhappy' etc.), allowing escalation to a supervisor, or
screen-pop to the agent to provide them with a revised script or suggestions of how to handle the call.
Emotion detection and sentiment analysis may also be used to identify unhappy or wavering customers
within the call, updating supervisors who can then intervene or advise the agent accordingly.
44
REVENUE AND PROFITABILITY
Competitor and product feedback
Customer interaction analytics allows businesses to seek out key words and phrases, such as
competitors' names or any instances of pricing, or to gather feedback after a marketing campaign goes
out. Some businesses are actively using speech analytics to uncover competitive intelligence as well. For
example, one wholesaler uses analytics to identify when competitors' pricing information is mentioned
on a call, and passes this back to the commercial team to revisit their own pricing structure.
Debt collection and improving cross-selling & up-selling
Although many debt collection firms have detailed scripts for their agents - often driven by the need to
comply with regulations - the results, such as the promise-to-pay ratio - can differ widely by agent.
Speech analytics provides two benefits for debt collectors: the ability to prove compliance, and through
the analysis of successful and unsuccessful calls, the chance to understand the type of agent language
and behavior that yields the best results, and share these with underperforming agents.
For performance marketing and other revenue-generating contact centers, customer interaction
analytics can identify the language and techniques used across the entire agent population that result in
the best outcomes and then use these best practices to train others.
Managing customers at risk of churn
Using real-time analytics, linked with a company's own CRM systems, agents can be provided with up-
to-the-second advice on how to handle customers identified as being at risk of churn, including linking
what the customer is saying on the call back to the transactional model in order to update the best offer
available for that customer. Some businesses use customer interaction analytics to identify phrases or
behaviors that indicate potential likely cancellation, but protect their profit margins by making sure that
agents are only offering incentives such as money off coupons at appropriate points within the
conversation, to those customers that are at risk of churning. Integrating speech analytics with desktop
analytics allow CRM information such as the value of the customer to be added to the decisioning
engine, providing extra accuracy and confidence that any offer made will be the right one.
45
IMPROVEMENTS IN CONTACT CENTER OPERATIONAL PERFORMANCE
On first glance, customer interaction analytics can be seen as providing similar information to
management information and reporting systems - taking masses of data and making sense of what they
mean to the contact center's performance and perhaps even inside the wider business. However, the
vital thing to understand about analytics is that it gives contact centers the answer to 'Why', not just
'What'. Why are average handle times so different across agents? Why are customers of this product
upset? Why are people calling the contact center?
Call transfers
Rather than making an agent use a call disposition code when they pass a call to another agent (which
they may forget to do, or code inaccurately), speech analytics can identify the reasons for passing calls
to other agents and putting customers on hold (whether lack of training, broken processes or lack of
access to the right systems).
Average handle time
Long call durations may be linked with poor agent abilities, lack of knowledge, navigation between
systems or very complicated calls, and of course, impact on cost, queue times and the customer
experience. Short AHTs can be as bad, if not worse, as they can indicate lack of agent capabilities (so
agents pass the call to a colleague, or even deliberately lose the connection), that the contact center is
handling too many simple calls that might be better handled by self-service or that there is a quick and
easily-resolved common issue, the solution to which could be propagated in the IVR announcement, on
the website or via email/SMS. The problem for businesses is that they often don't know with any level of
confidence why call durations differ.
Customer interaction analytics allows businesses to categorize each type of call, and through root-cause
analysis, determine what a reasonable length for each type of call is, and investigate the outlying
anomalies, either on an agent level, or more widely, by comparing the amount of time taken on each
category of call now compared to the past. The identification of calls resolved successfully in a
reasonable amount of time will also provide the training department with examples of best practice.
It is also the case that solving issues is much easier when the situation is understood and evidence
presented, especially if this issue is associated with an area outside the contact center’s control, and
interdepartmental politics have to be considered. Agents may give some indication if they see
something happening in recent calls, but that does not provide enough information to act upon.
Businesses will find it difficult to justify changing a whole campaign because an agent said that he had
two customers struggling to understand it. Customer interaction analytics helps to find out whether
these issues take place across the entire call volume, and allows businesses to quantify and prioritize
issues.
46
THE ROI OF ANALYTICS
Return on investment for customer interaction analytics can come from numerous sources, depending
upon how the solution is used. Generally, it will come from the avoidance of a specific cost, (including
the reduction of a risk in the case of compliance), or the increase in revenue.
The return on investment of customer interaction analytics used for compliance can at first glance be
difficult to prove, but it is the avoidance or reduction in litigation and regulatory fines which can be
placed against the cost of the solution. Large banks will have funds put away running into the tens of
millions of dollars each year against the possibility of paying out, and any significant reduction in fines
would pay for a speech analytics solution very quickly. In the UK, the banking industry had put aside
several billion pounds to pay compensation for the mis-selling of PPI (payment protection insurance),
and having the ability to prove that no regulations had been broken would have been of great use.
Most vendors have tools which can be used to estimate return on investment, often based on what they
have seen in similar operations elsewhere, and they are keen to share them with potential customers.
Vendors' own estimates of the time taken for the solution to pay for itself vary between 6 and 18
months.
Variables to be considered for ROI measurements include:
Cost reduction:
• Reduction in headcount from automation of quality monitoring and compliance checking,
allowing supervisors to spend more time coaching agents and achieving higher performance
• Understanding and minimizing the parts of the call which do not add value, including
understanding the reasons for silence within the call and addressing these
• Avoidance of fines and damages for non-compliance
• Reduced fraud through the analysis of 100% of calls
• Reduction in cost of unnecessary callbacks after improving first-call resolution rates through
root cause analysis which can lead to more targeted training and improved agent skills
• Avoidance of live calls that can be handled by better IVR or website self-service
• Reduced cost of QA and QM
• Understanding customer intent. For example, an insurance company received a lot of calls after
customers had bought policies from their website. Analysis was able to show that customers
were ringing for reassurance that the policy had been started, meaning the company could
immediately send an email to new customers with their policy details on it, avoiding the
majority of these calls
• Lower cost per call through shortened handle times and fewer transfers
• Lower new staff attrition rates and recruitment costs through early identification of specific
training requirements
• Identifying non-optimized business processes (e.g. a confusing website or a high number of
callers ringing about delivery) and fix these, avoiding calls and improving revenue.
47
Revenue increase:
• Increase in sales conversion rates and values based on dissemination of best practice across
agents, monitored by script compliance
• Increase in promise-to-pay ratios (debt collection)
• Optimized marketing messages through instant customer evaluation
• Reduced customer churn through dynamic screen-pop and real-time analytics, and also through
understanding the root cause of customer dissatisfaction and the differences in outcome
depending upon the agents’ approach
• Quicker response to new competitor and pricing information
• Increase sales revenue by automating manual, non-revenue generating activity by identifying
and improving self-service options
• Route specific customer types to the best available agents to optimize empathy by matching
communication styles
• Some businesses assign a revenue value to an improvement in customer satisfaction ratings or
Net Promoter Score®
• Understanding and correlating call outcomes, using metadata and call analysis to see what
works and what doesn’t.
Also, the improved quality of agents, better complaints handling and improved business processes
outside the contact center should be considered.
It is important for the CFO to see the customer data and brand loyalty as assets, and to consider the
effect that complaints and general dissatisfaction have upon those assets. Analytics helps businesses to
understand why these assets (i.e. the customer base) may be shrinking over time, and to put actions in
place to turn that around. In order to get sign off on an analytics project, these benefits must be
monetized.
Against these potential positives, potential costs to consider include:
• License fees or cost per call analyzed
• IT costs to implement (internal and external) which are much more extensive if on-premise
solution rather than cloud
• Upgrade to call recording environment if required
• Annual maintenance and support, which for some solutions may be 15-20% of the original
licensing cost (applies to on-premise solutions)
• Additional users - headcount cost - decide who will own and use it, do you need a speech
analyst, etc. This may be offset by a reduction in QA staff headcount
• Extra hardware e.g. servers (if on-premise)
• Ongoing and additional training costs if not included
• Extra work generated by findings which may well be more than offset by effect of improvements
• May need extra software to extract data from the call recording production environment.
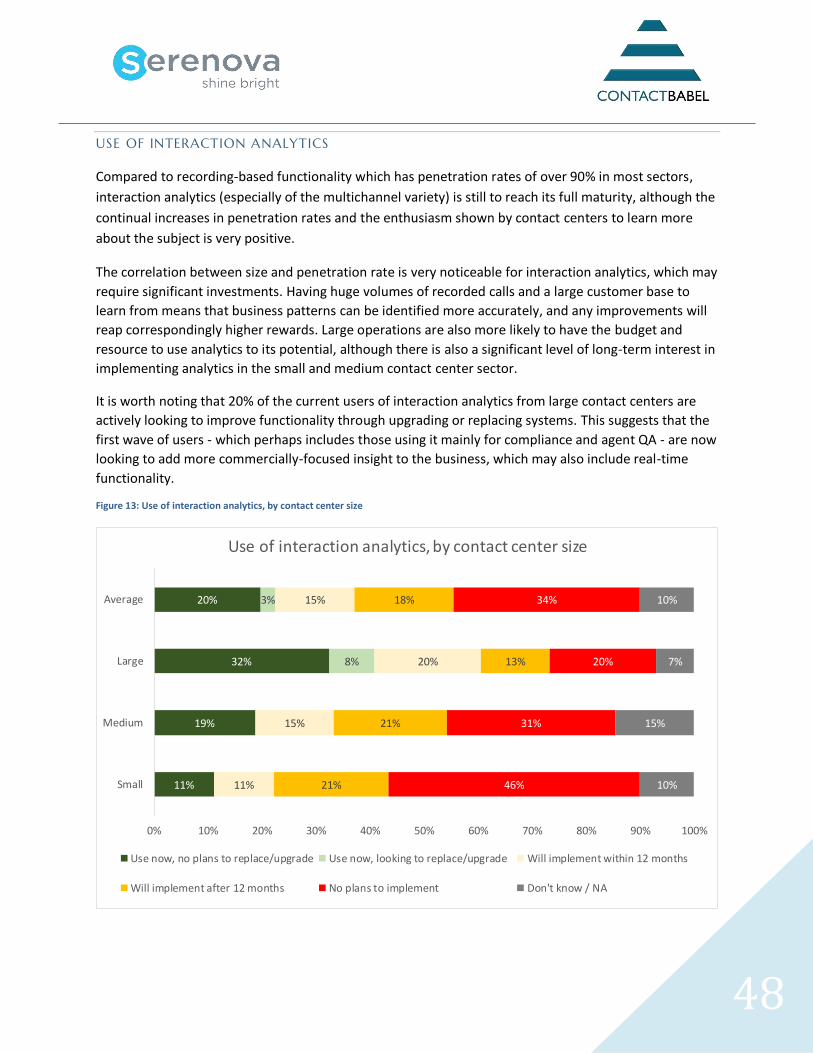
48
USE OF INTERACTION ANALYTICS
Compared to recording-based functionality which has penetration rates of over 90% in most sectors,
interaction analytics (especially of the multichannel variety) is still to reach its full maturity, although the
continual increases in penetration rates and the enthusiasm shown by contact centers to learn more
about the subject is very positive.
The correlation between size and penetration rate is very noticeable for interaction analytics, which may
require significant investments. Having huge volumes of recorded calls and a large customer base to
learn from means that business patterns can be identified more accurately, and any improvements will
reap correspondingly higher rewards. Large operations are also more likely to have the budget and
resource to use analytics to its potential, although there is also a significant level of long-term interest in
implementing analytics in the small and medium contact center sector.
It is worth noting that 20% of the current users of interaction analytics from large contact centers are
actively looking to improve functionality through upgrading or replacing systems. This suggests that the
first wave of users - which perhaps includes those using it mainly for compliance and agent QA - are now
looking to add more commercially-focused insight to the business, which may also include real-time
functionality.
Figure 13: Use of interaction analytics, by contact center size
11%
19%
32%
20%
8%
3%
11%
15%
20%
15%
21%
21%
13%
18%
46%
31%
20%
34%
10%
15%
7%
10%
0% 10% 20% 30% 40% 50% 60% 70% 80% 90% 100%
Small
Medium
Large
Average
Use of interaction analytics, by contact center size
Use now, no plans to replace/upgrade Use now, looking to replace/upgrade Will implement within 12 months
Will implement after 12 months No plans to implement Don't know / NA
49
TYPES OF INTERACTION ANALYTICS
HISTORICAL SPEECH ANALYTICS
Historical implementations of speech analytics solutions were focused upon analyzing large numbers of
recorded calls, often a long time after the actual event. Many of the original users purchased these
solutions to assist them with compliance and as part of a larger quality assurance system, and these
benefits have not decreased over time. Being able to analyze 100% of calls automatically can provide
high quality information for the QA process, giving a fair and accurate reflection of the agent’s
performance.
While there is real and growing interest in real-time analytics, historical speech analytics is still vital for
business intelligence, performance improvement, QA and compliance. As the majority of contact centers
have call recording in place, the raw material is already available. In fact, the amount of recorded voice
data available to most businesses can be overwhelming, and historical speech analytics that analyze
100% of recorded calls is proving hugely valuable. The use of historical speech analytics for various
business issues is investigated in-depth within the next major section, “Uses of Analytics”.
It should be noted that many recording environments are still mono rather than stereo, meaning that
there is no distinction between the caller and the agent except through context. This is a clear
disadvantage for effective historical speech analytics, as in order to learn from customer feedback and
experience, clearly a business needs to know whether it is the customer talking about products,
processes or competitors, rather than the agent. More recording systems are moving to stereo, and this
will further improve the accuracy and potential benefit of speech analytics, and some vendors have
restructured their solution to offer software-based speaker separation for analytics.
REAL-TIME SPEECH ANALYTICS
Some solution providers suggest that ‘real-time analytics’ should perhaps be more accurately referred to
as ‘real-time monitoring and action’. Analysis (“a detailed examination of the elements or structure of
something1”), refers to the discovery and understanding of patterns in data, and is currently something
that by definition only happens post-call when all data are fully present. Real-time monitoring on the
other hand, looks for and recognizes predefined words, phrases and sometimes context, within a
handful of seconds, giving the business the opportunity to act.
For some businesses, real-time is an important and growing part of the armory that they have to
improve their efficiency and effectiveness. There is potentially a great deal of benefit to be gained from
understanding automatically what is happening on the call, and in being able to act while improvements
are still possible, rather than being made aware some time after the call of what has happened.
1 http://www.oxforddictionaries.com/definition/english/analysis
50
Real-time can be used in many ways:
• monitoring calls for key words and phrases, which can either be acted upon within the
conversation, or passed to another department (e.g. Marketing, if the customer indicates
something relevant to other products or services sold by the company)
• alerting the agent or supervisor if pre-specified words or phrases occur
• offering guidance to the agent on the next best action for them to take, bringing in CRM data
and knowledge bases to suggest answers to the question being asked, or advice on whether to
change the tone or speed of the conversation
• escalating calls to a supervisor as appropriate
• detecting negative sentiment through instances of talk-over, negative language, obscenities,
increased speaking volume etc., that can be escalated to a supervisor
• triggering back-office processes and opening agent desktop screens depending on call events.
For example, the statement of a product name or serial number within the conversation can
open an agent assistant screen that is relevant to that product
• making sure that all required words and phrases have been used, e.g. in the case of compliance
or forming a phone-based contract
• suggesting cross-selling or upselling opportunities.
SCREEN ANALYTICS
Screen analytics (also known as desktop analytics) allow businesses to record an agent’s desktop in
order to assist with quality assessments at an agent level, and also to identify areas within systems and
processes that cause delays within customer interactions.
Additionally, management can search for examples where agents skipped compulsory screens or
ignored guidelines around how best to close the sale, in order to maximize future compliance with
regulation and company procedure.
Average call duration is a metric that has been measured in contact centers since their very first
inception. However, businesses have had to rely upon anecdotal information in order to decide whether
excessively lengthy calls are a factor of agent inexperience or inability to answer the customer’s
question, or if there is a particular step within the procedure when delays are occurring in an otherwise
competently-handled call (for example, from a lack of training about a particular area, or a badly
designed screen layout).
Desktop analytics can provide information about exactly how long each step with an interaction takes,
providing management with the insight as to which processes could potentially be automated, and how
much time (and thus, cost) would be saved. Businesses would also gain insight into how agents actually
research issues that they cannot immediately answer (for example, do they research the company
website, a knowledge base or the wider Internet - and if so, which method is the most successful?).
51
MULTICHANNEL ANALYTICS
As with speech analytics, text analytics can be applied historically or in real time. It can be applied to
interactions between customers and agents (as in the case of email, web chat or social media contact),
or by looking at customer feedback, whether on the business’s own website or on third-party sites.
Unlike speech analytics, text analytics does not require a speech recognition engine to identify the
words being used, but the general principles and opportunities are similar.
Just as with speech analytics, text analytics solutions aim to categorize comments and interactions to
provide actionable insight about a discrete part of the business (e.g. a specific product or store; the
online sales experience; the politeness or otherwise of the contact center staff, etc.). The analytics
solution should be able to identify the many different ways that people refer to the same thing in order
to categorize correctly and make sure that the actual importance of the issue is represented fairly and
accurately. Categories can be created automatically by the analytics application, and/or through the
input of business experts, and should be revisited regularly to make sure they are still addressing the
reality of the business.
Real-time text analytics can be used to assist agents when answering emails or handling web chats, or to
identify customers at risk based on feedback comments they have left, initiating an action aimed at
alleviating their problem immediately. Some solutions actively monitor feedback as it is being given,
using logical branching based on the customer’s responses in order to ask more relevant questions. For
example, a customer mentioning a particular product may be asked where they first heard of it, or
bought it from.
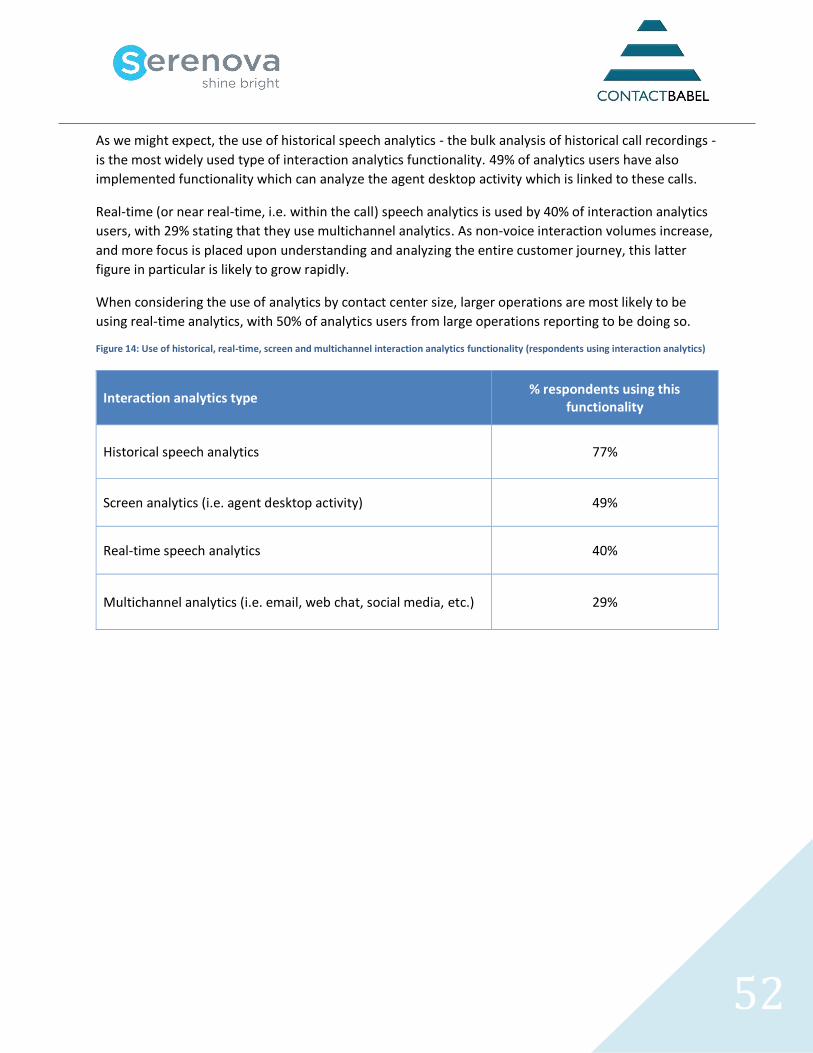
52
As we might expect, the use of historical speech analytics - the bulk analysis of historical call recordings -
is the most widely used type of interaction analytics functionality. 49% of analytics users have also
implemented functionality which can analyze the agent desktop activity which is linked to these calls.
Real-time (or near real-time, i.e. within the call) speech analytics is used by 40% of interaction analytics
users, with 29% stating that they use multichannel analytics. As non-voice interaction volumes increase,
and more focus is placed upon understanding and analyzing the entire customer journey, this latter
figure in particular is likely to grow rapidly.
When considering the use of analytics by contact center size, larger operations are most likely to be
using real-time analytics, with 50% of analytics users from large operations reporting to be doing so.
Figure 14: Use of historical, real-time, screen and multichannel interaction analytics functionality (respondents using interaction analytics)
Interaction analytics type
% respondents using this functionality
Historical speech analytics 77%
Screen analytics (i.e. agent desktop activity) 49%
Real-time speech analytics 40%
Multichannel analytics (i.e. email, web chat, social media, etc.) 29%
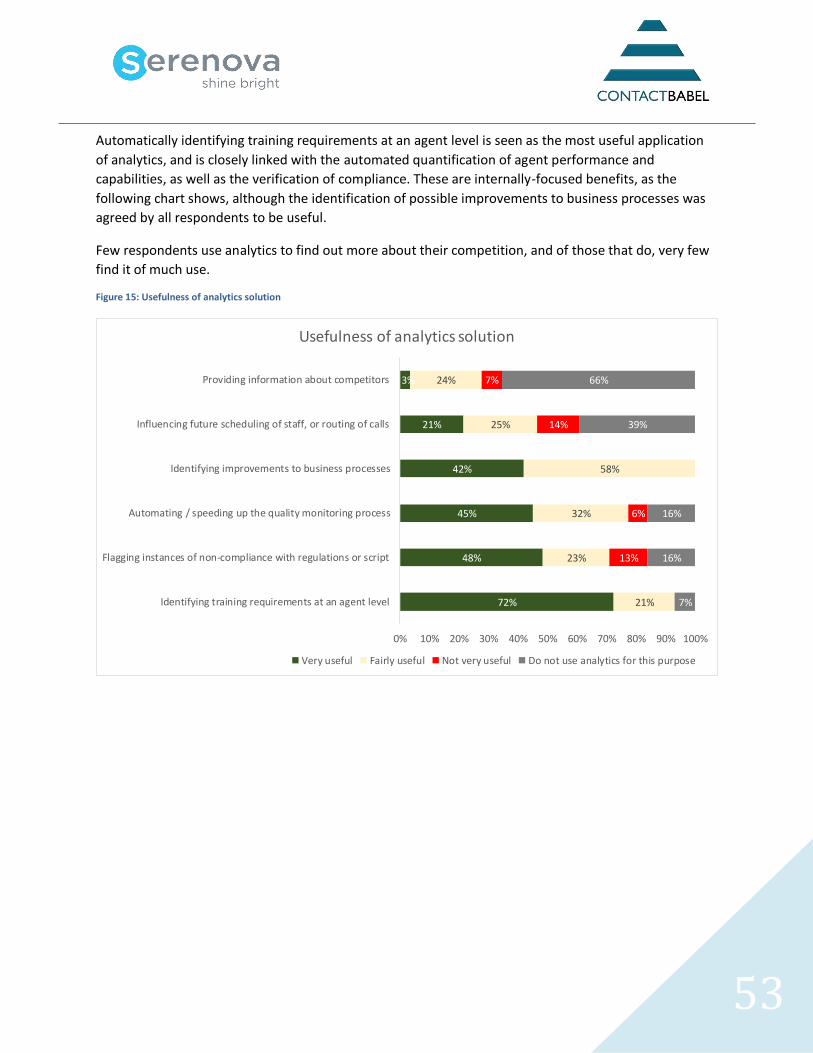
53
Automatically identifying training requirements at an agent level is seen as the most useful application
of analytics, and is closely linked with the automated quantification of agent performance and
capabilities, as well as the verification of compliance. These are internally-focused benefits, as the
following chart shows, although the identification of possible improvements to business processes was
agreed by all respondents to be useful.
Few respondents use analytics to find out more about their competition, and of those that do, very few
find it of much use.
Figure 15: Usefulness of analytics solution
72%
48%
45%
42%
21%
3%
21%
23%
32%
58%
25%
24%
13%
6%
14%
7%
7%
16%
16%
39%
66%
0% 10% 20% 30% 40% 50% 60% 70% 80% 90% 100%
Identifying training requirements at an agent level
Flagging instances of non-compliance with regulations or script
Automating / speeding up the quality monitoring process
Identifying improvements to business processes
Influencing future scheduling of staff, or routing of calls
Providing information about competitors
Usefulness of analytics solution
Very useful Fairly useful Not very useful Do not use analytics for this purpose
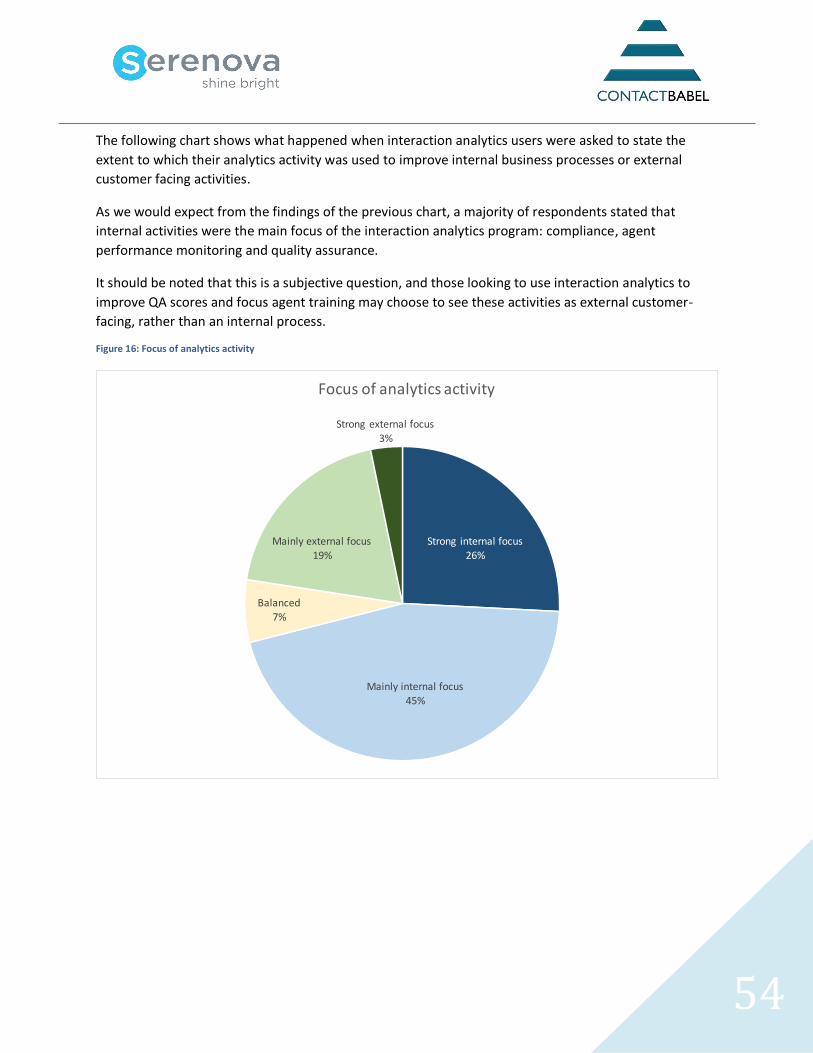
54
The following chart shows what happened when interaction analytics users were asked to state the
extent to which their analytics activity was used to improve internal business processes or external
customer facing activities.
As we would expect from the findings of the previous chart, a majority of respondents stated that
internal activities were the main focus of the interaction analytics program: compliance, agent
performance monitoring and quality assurance.
It should be noted that this is a subjective question, and those looking to use interaction analytics to
improve QA scores and focus agent training may choose to see these activities as external customer-
facing, rather than an internal process.
Figure 16: Focus of analytics activity
Strong internal focus26%
Mainly internal focus45%
Balanced7%
Mainly external focus19%
Strong external focus
3%
Focus of analytics activity
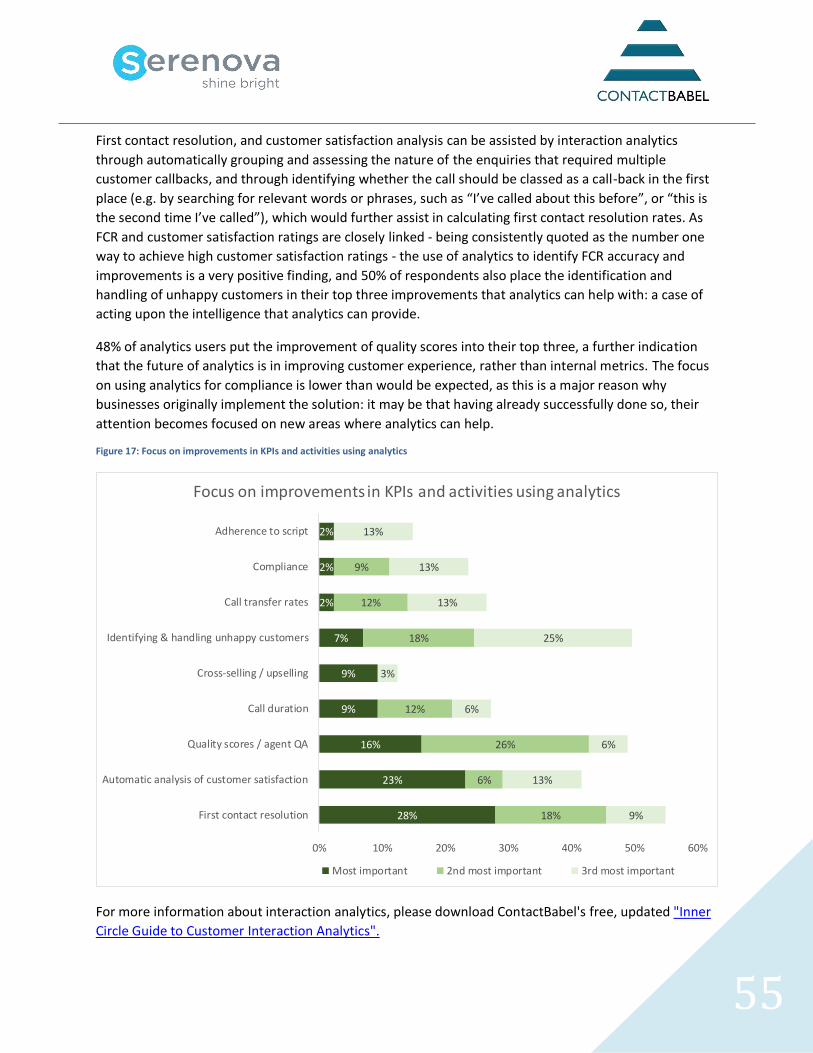
55
First contact resolution, and customer satisfaction analysis can be assisted by interaction analytics
through automatically grouping and assessing the nature of the enquiries that required multiple
customer callbacks, and through identifying whether the call should be classed as a call-back in the first
place (e.g. by searching for relevant words or phrases, such as “I’ve called about this before”, or “this is
the second time I’ve called”), which would further assist in calculating first contact resolution rates. As
FCR and customer satisfaction ratings are closely linked - being consistently quoted as the number one
way to achieve high customer satisfaction ratings - the use of analytics to identify FCR accuracy and
improvements is a very positive finding, and 50% of respondents also place the identification and
handling of unhappy customers in their top three improvements that analytics can help with: a case of
acting upon the intelligence that analytics can provide.
48% of analytics users put the improvement of quality scores into their top three, a further indication
that the future of analytics is in improving customer experience, rather than internal metrics. The focus
on using analytics for compliance is lower than would be expected, as this is a major reason why
businesses originally implement the solution: it may be that having already successfully done so, their
attention becomes focused on new areas where analytics can help.
Figure 17: Focus on improvements in KPIs and activities using analytics
For more information about interaction analytics, please download ContactBabel's free, updated "Inner
Circle Guide to Customer Interaction Analytics".
28%
23%
16%
9%
9%
7%
2%
2%
2%
18%
6%
26%
12%
18%
12%
9%
9%
13%
6%
6%
3%
25%
13%
13%
13%
0% 10% 20% 30% 40% 50% 60%
First contact resolution
Automatic analysis of customer satisfaction
Quality scores / agent QA
Call duration
Cross-selling / upselling
Identifying & handling unhappy customers
Call transfer rates
Compliance
Adherence to script
Focus on improvements in KPIs and activities using analytics
Most important 2nd most important 3rd most important
56
QUALITY & PERFORMANCE MANAGEMENT
Historically, the success or otherwise of contact centers was measured in terms of efficiency: call
throughput, average handle time, calls per hour, etc. In recent years, the focus upon customer
satisfaction has grown to such an extent that it is now seen industry-wide as the number one indicator
of success, being consistently voted more important than increasing revenues, decreasing costs or
hitting target metrics.
Of course, customer satisfaction is also closely linked to efficiency: part of the customer experience is
the amount of time spent in the queue, and whether or not the agent can then help them quickly and
decisively. As such, internal contact center metrics directly correlate to external customer satisfaction,
which also is influenced by the customer’s experience of any telephony or web-based self-service, or
other pre-call activity such as customer authentication.
The contact center industry has to find a balance between increasing the efficiency of its processes -
which in the ‘production line’ mentality tends to mean following specific processes without deviation -
and the need to understand the individual requirements of each customer so as to deliver appropriate
service. As such, the measurement and improvement of quality and performance is not straightforward:
in fact, even deciding what ‘quality’ actually means is very much a subjective matter.
Operations driving their performance and quality forward often carry out many of the same types of improvement:
• Assessment: changing QA assessment frameworks (the scorecard), not just in the contact center
but in some cases across back office functions as well as for emails and other contact types
• Freedom: giving advisors the freedom to do what is needed to meet the customers’ needs;
stepping away from the standard process where this is not appropriate and taking steps to
improve processes for the future
• Development: creating a cultural change supported by a new coaching and development
framework – for example, how the evaluation process is used for performance management and enabling the advisors to make suggestions for improvement
• Learning: linking quality into a wider continuous improvement framework, gaining insight about
the drivers for customer satisfaction and loyalty which can be shared throughout the
organization in a quality-focused ‘voice of the customer’ program.
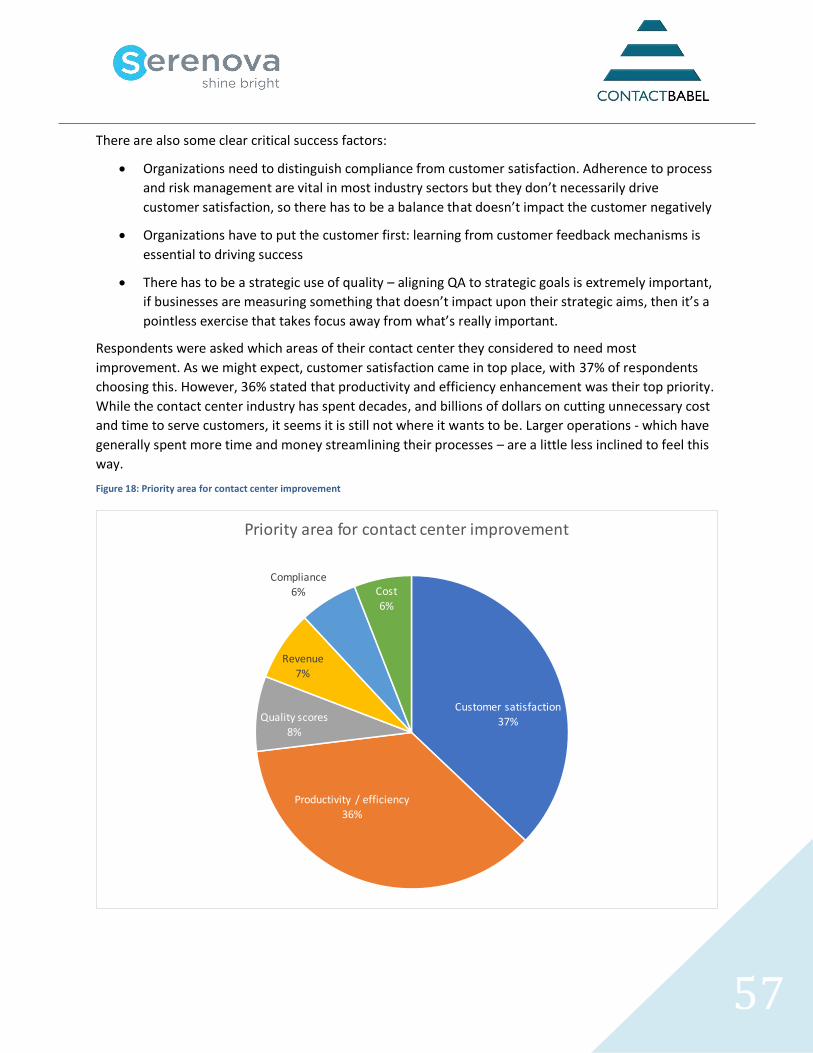
57
There are also some clear critical success factors:
• Organizations need to distinguish compliance from customer satisfaction. Adherence to process
and risk management are vital in most industry sectors but they don’t necessarily drive
customer satisfaction, so there has to be a balance that doesn’t impact the customer negatively
• Organizations have to put the customer first: learning from customer feedback mechanisms is
essential to driving success
• There has to be a strategic use of quality – aligning QA to strategic goals is extremely important,
if businesses are measuring something that doesn’t impact upon their strategic aims, then it’s a
pointless exercise that takes focus away from what’s really important.
Respondents were asked which areas of their contact center they considered to need most
improvement. As we might expect, customer satisfaction came in top place, with 37% of respondents
choosing this. However, 36% stated that productivity and efficiency enhancement was their top priority.
While the contact center industry has spent decades, and billions of dollars on cutting unnecessary cost
and time to serve customers, it seems it is still not where it wants to be. Larger operations - which have
generally spent more time and money streamlining their processes – are a little less inclined to feel this
way.
Figure 18: Priority area for contact center improvement
Customer satisfaction37%
Productivity / efficiency36%
Quality scores8%
Revenue
7%
Compliance6% Cost
6%
Priority area for contact center improvement
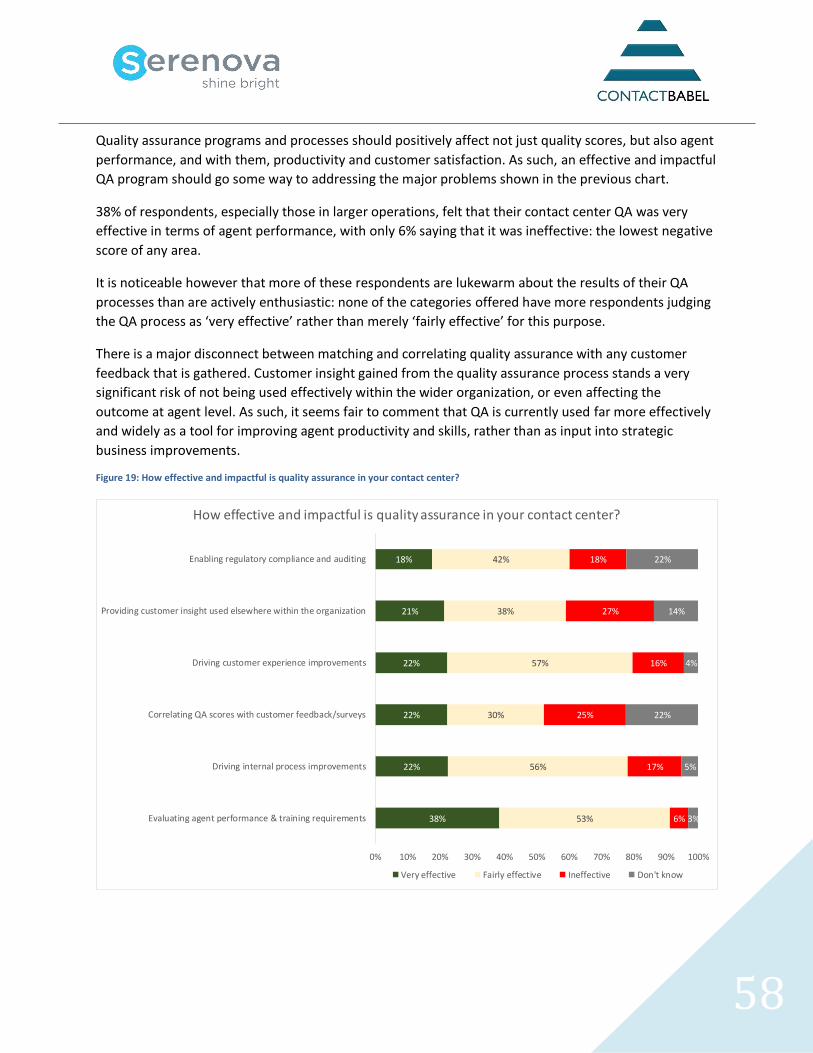
58
Quality assurance programs and processes should positively affect not just quality scores, but also agent
performance, and with them, productivity and customer satisfaction. As such, an effective and impactful
QA program should go some way to addressing the major problems shown in the previous chart.
38% of respondents, especially those in larger operations, felt that their contact center QA was very
effective in terms of agent performance, with only 6% saying that it was ineffective: the lowest negative
score of any area.
It is noticeable however that more of these respondents are lukewarm about the results of their QA
processes than are actively enthusiastic: none of the categories offered have more respondents judging
the QA process as ‘very effective’ rather than merely ‘fairly effective’ for this purpose.
There is a major disconnect between matching and correlating quality assurance with any customer
feedback that is gathered. Customer insight gained from the quality assurance process stands a very
significant risk of not being used effectively within the wider organization, or even affecting the
outcome at agent level. As such, it seems fair to comment that QA is currently used far more effectively
and widely as a tool for improving agent productivity and skills, rather than as input into strategic
business improvements.
Figure 19: How effective and impactful is quality assurance in your contact center?
38%
22%
22%
22%
21%
18%
53%
56%
30%
57%
38%
42%
6%
17%
25%
16%
27%
18%
3%
5%
22%
4%
14%
22%
0% 10% 20% 30% 40% 50% 60% 70% 80% 90% 100%
Evaluating agent performance & training requirements
Driving internal process improvements
Correlating QA scores with customer feedback/surveys
Driving customer experience improvements
Providing customer insight used elsewhere within the organization
Enabling regulatory compliance and auditing
How effective and impactful is quality assurance in your contact center?
Very effective Fairly effective Ineffective Don't know
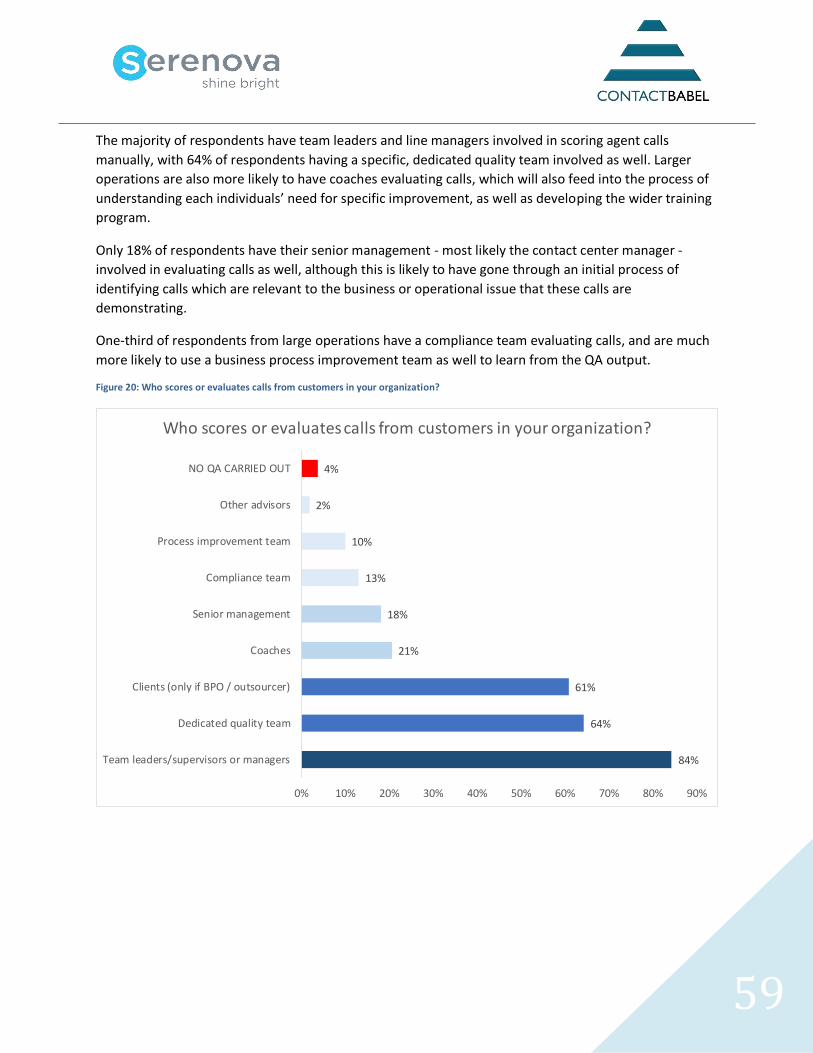
59
The majority of respondents have team leaders and line managers involved in scoring agent calls
manually, with 64% of respondents having a specific, dedicated quality team involved as well. Larger
operations are also more likely to have coaches evaluating calls, which will also feed into the process of
understanding each individuals’ need for specific improvement, as well as developing the wider training
program.
Only 18% of respondents have their senior management - most likely the contact center manager -
involved in evaluating calls as well, although this is likely to have gone through an initial process of
identifying calls which are relevant to the business or operational issue that these calls are
demonstrating.
One-third of respondents from large operations have a compliance team evaluating calls, and are much
more likely to use a business process improvement team as well to learn from the QA output.
Figure 20: Who scores or evaluates calls from customers in your organization?
84%
64%
61%
21%
18%
13%
10%
2%
4%
0% 10% 20% 30% 40% 50% 60% 70% 80% 90%
Team leaders/supervisors or managers
Dedicated quality team
Clients (only if BPO / outsourcer)
Coaches
Senior management
Compliance team
Process improvement team
Other advisors
NO QA CARRIED OUT
Who scores or evaluates calls from customers in your organization?
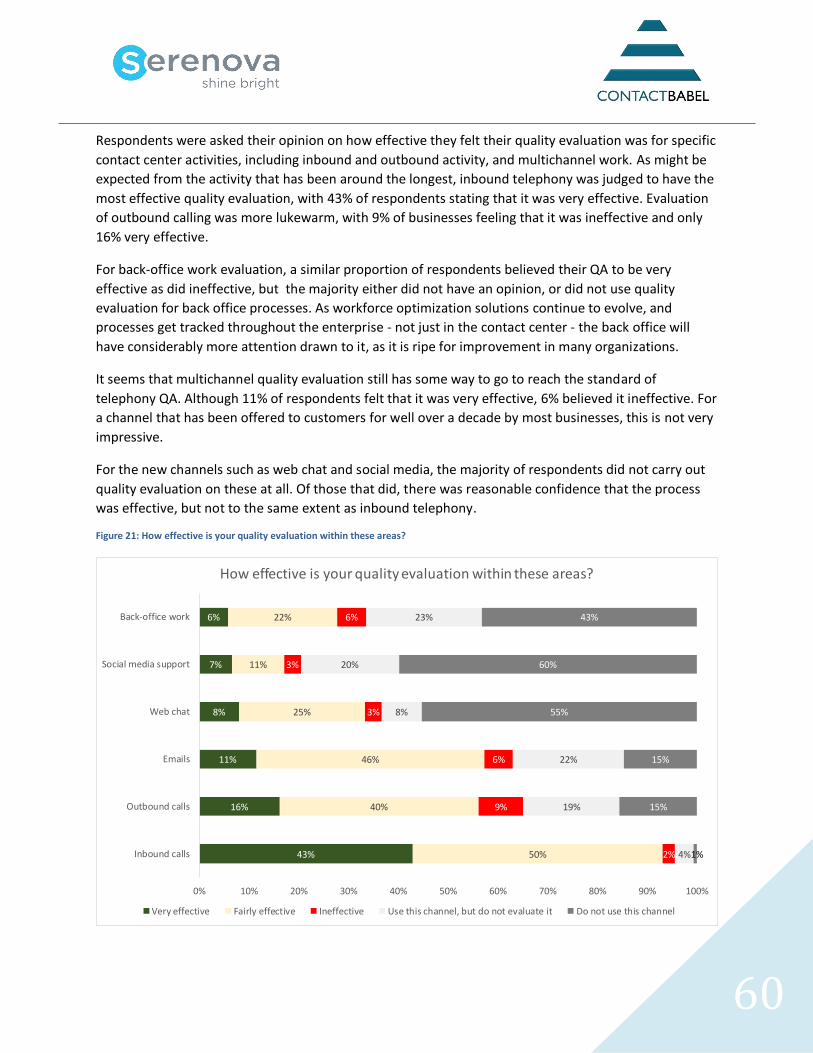
60
Respondents were asked their opinion on how effective they felt their quality evaluation was for specific
contact center activities, including inbound and outbound activity, and multichannel work. As might be
expected from the activity that has been around the longest, inbound telephony was judged to have the
most effective quality evaluation, with 43% of respondents stating that it was very effective. Evaluation
of outbound calling was more lukewarm, with 9% of businesses feeling that it was ineffective and only
16% very effective.
For back-office work evaluation, a similar proportion of respondents believed their QA to be very
effective as did ineffective, but the majority either did not have an opinion, or did not use quality
evaluation for back office processes. As workforce optimization solutions continue to evolve, and
processes get tracked throughout the enterprise - not just in the contact center - the back office will
have considerably more attention drawn to it, as it is ripe for improvement in many organizations.
It seems that multichannel quality evaluation still has some way to go to reach the standard of
telephony QA. Although 11% of respondents felt that it was very effective, 6% believed it ineffective. For
a channel that has been offered to customers for well over a decade by most businesses, this is not very
impressive.
For the new channels such as web chat and social media, the majority of respondents did not carry out
quality evaluation on these at all. Of those that did, there was reasonable confidence that the process
was effective, but not to the same extent as inbound telephony.
Figure 21: How effective is your quality evaluation within these areas?
43%
16%
11%
8%
7%
6%
50%
40%
46%
25%
11%
22%
2%
9%
6%
3%
3%
6%
4%
19%
22%
8%
20%
23%
1%
15%
15%
55%
60%
43%
0% 10% 20% 30% 40% 50% 60% 70% 80% 90% 100%
Inbound calls
Outbound calls
Emails
Web chat
Social media support
Back-office work
How effective is your quality evaluation within these areas?
Very effective Fairly effective Ineffective Use this channel, but do not evaluate it Do not use this channel
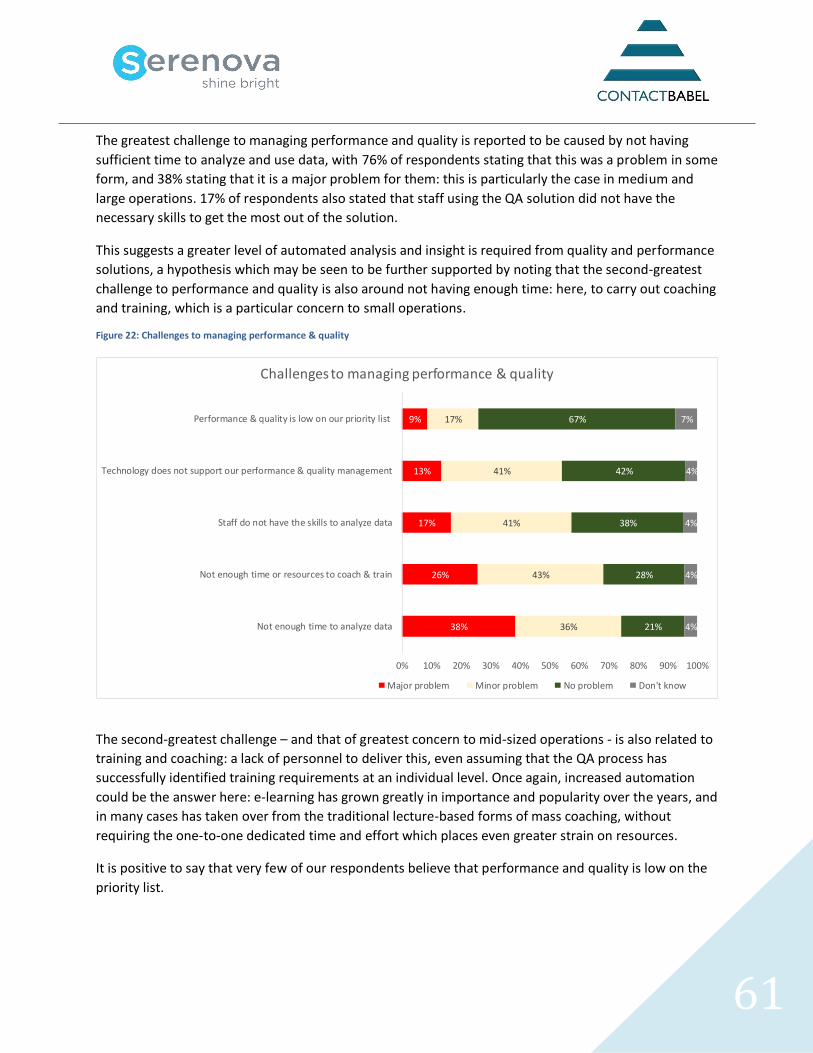
61
The greatest challenge to managing performance and quality is reported to be caused by not having
sufficient time to analyze and use data, with 76% of respondents stating that this was a problem in some
form, and 38% stating that it is a major problem for them: this is particularly the case in medium and
large operations. 17% of respondents also stated that staff using the QA solution did not have the
necessary skills to get the most out of the solution.
This suggests a greater level of automated analysis and insight is required from quality and performance
solutions, a hypothesis which may be seen to be further supported by noting that the second-greatest
challenge to performance and quality is also around not having enough time: here, to carry out coaching
and training, which is a particular concern to small operations.
Figure 22: Challenges to managing performance & quality
The second-greatest challenge – and that of greatest concern to mid-sized operations - is also related to
training and coaching: a lack of personnel to deliver this, even assuming that the QA process has
successfully identified training requirements at an individual level. Once again, increased automation
could be the answer here: e-learning has grown greatly in importance and popularity over the years, and
in many cases has taken over from the traditional lecture-based forms of mass coaching, without
requiring the one-to-one dedicated time and effort which places even greater strain on resources.
It is positive to say that very few of our respondents believe that performance and quality is low on the
priority list.
38%
26%
17%
13%
9%
36%
43%
41%
41%
17%
21%
28%
38%
42%
67%
4%
4%
4%
4%
7%
0% 10% 20% 30% 40% 50% 60% 70% 80% 90% 100%
Not enough time to analyze data
Not enough time or resources to coach & train
Staff do not have the skills to analyze data
Technology does not support our performance & quality management
Performance & quality is low on our priority list
Challenges to managing performance & quality
Major problem Minor problem No problem Don't know
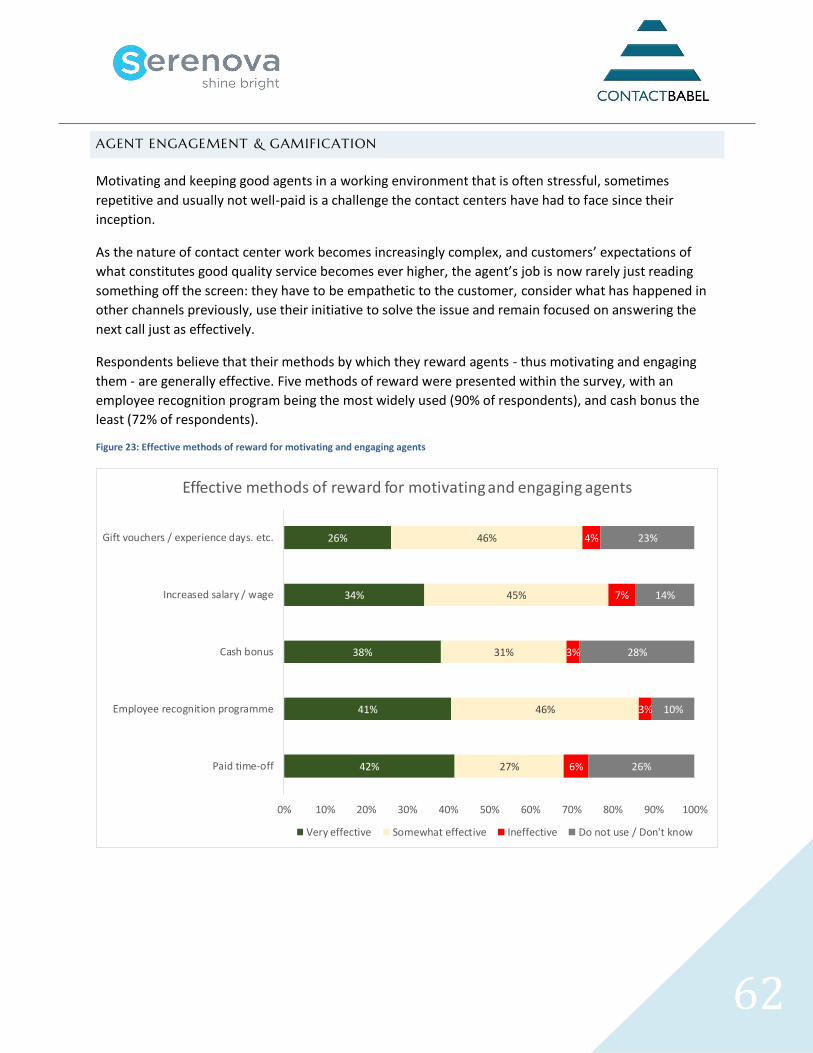
62
AGENT ENGAGEMENT & GAMIFICATION
Motivating and keeping good agents in a working environment that is often stressful, sometimes
repetitive and usually not well-paid is a challenge the contact centers have had to face since their
inception.
As the nature of contact center work becomes increasingly complex, and customers’ expectations of
what constitutes good quality service becomes ever higher, the agent’s job is now rarely just reading
something off the screen: they have to be empathetic to the customer, consider what has happened in
other channels previously, use their initiative to solve the issue and remain focused on answering the
next call just as effectively.
Respondents believe that their methods by which they reward agents - thus motivating and engaging
them - are generally effective. Five methods of reward were presented within the survey, with an
employee recognition program being the most widely used (90% of respondents), and cash bonus the
least (72% of respondents).
Figure 23: Effective methods of reward for motivating and engaging agents
42%
41%
38%
34%
26%
27%
46%
31%
45%
46%
6%
3%
3%
7%
4%
26%
10%
28%
14%
23%
0% 10% 20% 30% 40% 50% 60% 70% 80% 90% 100%
Paid time-off
Employee recognition programme
Cash bonus
Increased salary / wage
Gift vouchers / experience days. etc.
Effective methods of reward for motivating and engaging agents
Very effective Somewhat effective Ineffective Do not use / Don't know
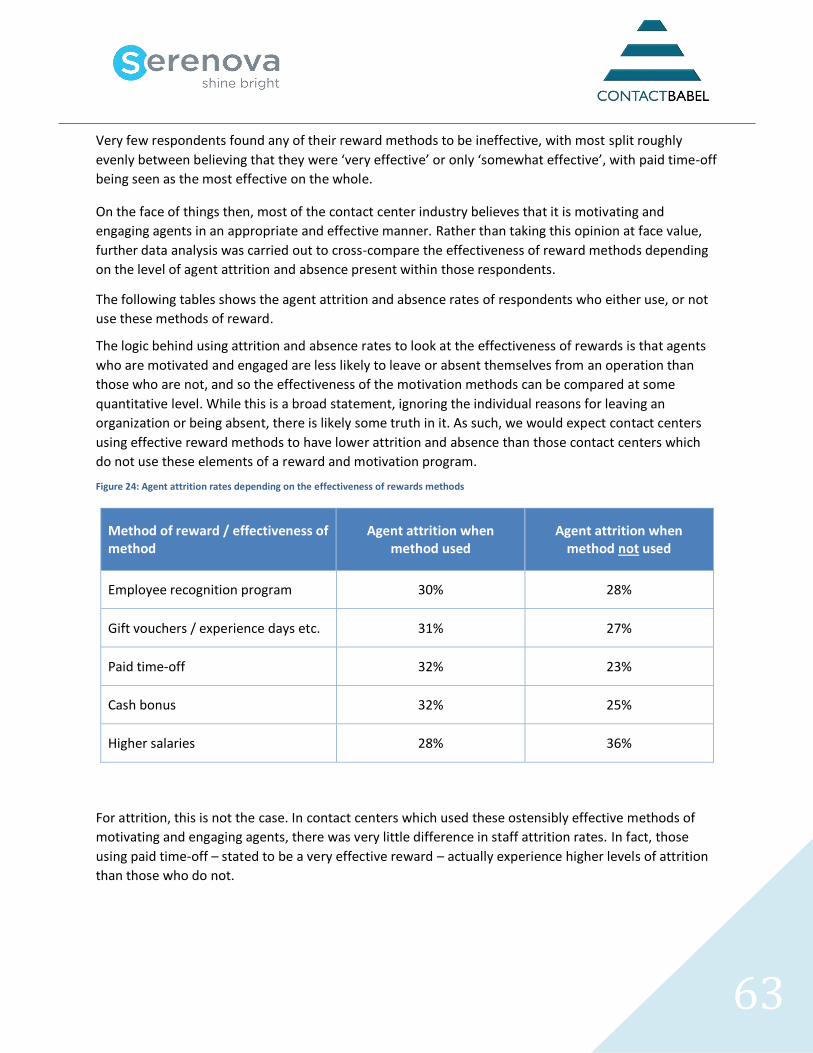
63
Very few respondents found any of their reward methods to be ineffective, with most split roughly
evenly between believing that they were ‘very effective’ or only ‘somewhat effective’, with paid time-off
being seen as the most effective on the whole.
On the face of things then, most of the contact center industry believes that it is motivating and
engaging agents in an appropriate and effective manner. Rather than taking this opinion at face value,
further data analysis was carried out to cross-compare the effectiveness of reward methods depending
on the level of agent attrition and absence present within those respondents.
The following tables shows the agent attrition and absence rates of respondents who either use, or not
use these methods of reward.
The logic behind using attrition and absence rates to look at the effectiveness of rewards is that agents
who are motivated and engaged are less likely to leave or absent themselves from an operation than
those who are not, and so the effectiveness of the motivation methods can be compared at some
quantitative level. While this is a broad statement, ignoring the individual reasons for leaving an
organization or being absent, there is likely some truth in it. As such, we would expect contact centers
using effective reward methods to have lower attrition and absence than those contact centers which
do not use these elements of a reward and motivation program.
Figure 24: Agent attrition rates depending on the effectiveness of rewards methods
Method of reward / effectiveness of method
Agent attrition when method used
Agent attrition when method not used
Employee recognition program 30% 28%
Gift vouchers / experience days etc. 31% 27%
Paid time-off 32% 23%
Cash bonus 32% 25%
Higher salaries 28% 36%
For attrition, this is not the case. In contact centers which used these ostensibly effective methods of
motivating and engaging agents, there was very little difference in staff attrition rates. In fact, those
using paid time-off – stated to be a very effective reward – actually experience higher levels of attrition
than those who do not.
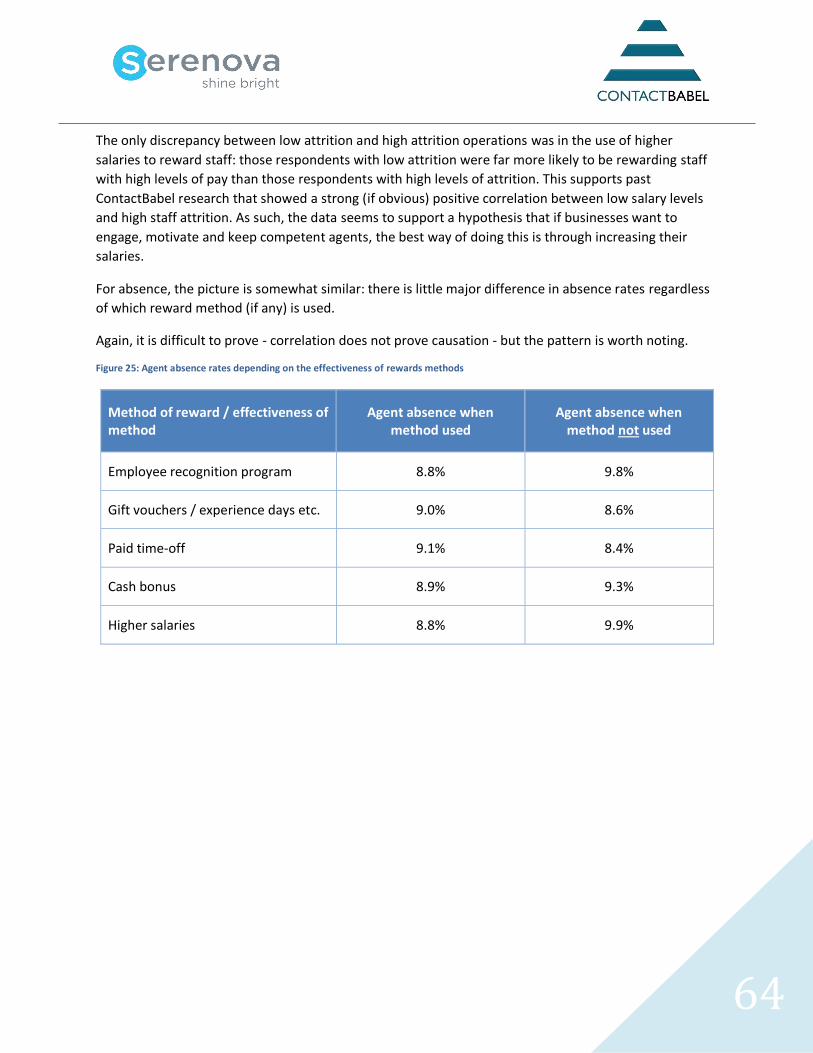
64
The only discrepancy between low attrition and high attrition operations was in the use of higher
salaries to reward staff: those respondents with low attrition were far more likely to be rewarding staff
with high levels of pay than those respondents with high levels of attrition. This supports past
ContactBabel research that showed a strong (if obvious) positive correlation between low salary levels
and high staff attrition. As such, the data seems to support a hypothesis that if businesses want to
engage, motivate and keep competent agents, the best way of doing this is through increasing their
salaries.
For absence, the picture is somewhat similar: there is little major difference in absence rates regardless
of which reward method (if any) is used.
Again, it is difficult to prove - correlation does not prove causation - but the pattern is worth noting.
Figure 25: Agent absence rates depending on the effectiveness of rewards methods
Method of reward / effectiveness of method
Agent absence when method used
Agent absence when method not used
Employee recognition program 8.8% 9.8%
Gift vouchers / experience days etc. 9.0% 8.6%
Paid time-off 9.1% 8.4%
Cash bonus 8.9% 9.3%
Higher salaries 8.8% 9.9%
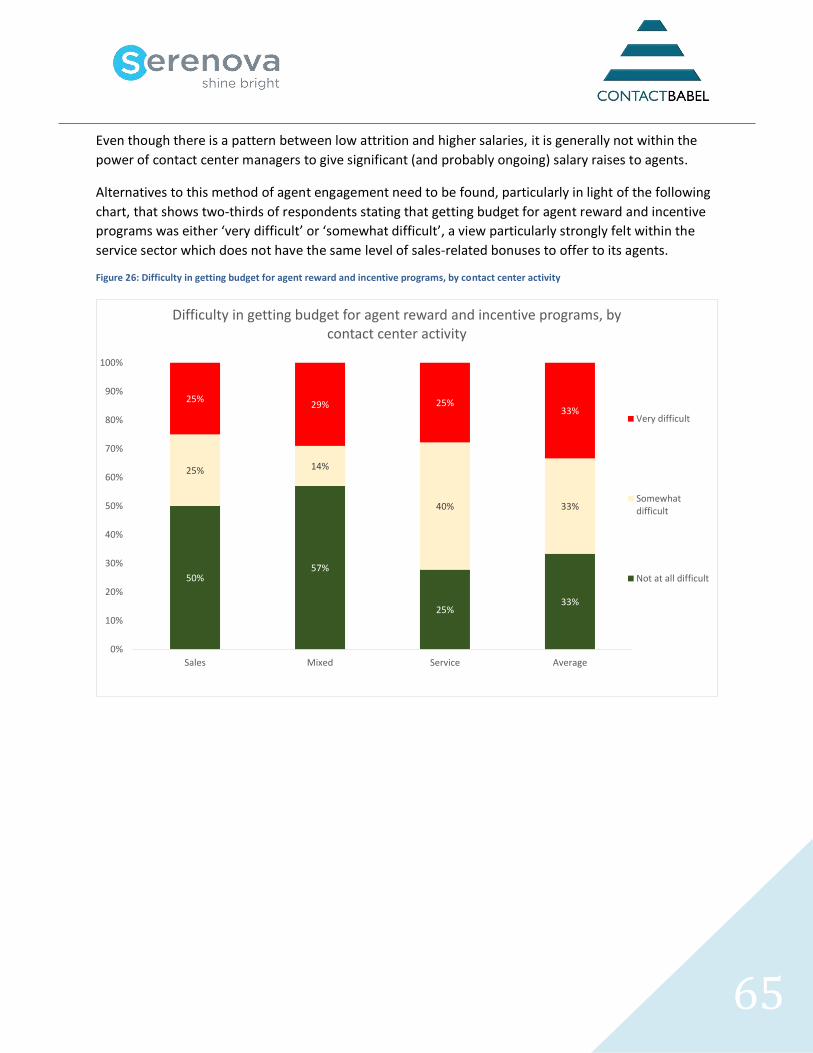
65
Even though there is a pattern between low attrition and higher salaries, it is generally not within the
power of contact center managers to give significant (and probably ongoing) salary raises to agents.
Alternatives to this method of agent engagement need to be found, particularly in light of the following
chart, that shows two-thirds of respondents stating that getting budget for agent reward and incentive
programs was either ‘very difficult’ or ‘somewhat difficult’, a view particularly strongly felt within the
service sector which does not have the same level of sales-related bonuses to offer to its agents.
Figure 26: Difficulty in getting budget for agent reward and incentive programs, by contact center activity
50%57%
25%33%
25% 14%
40% 33%
25%29% 25%
33%
0%
10%
20%
30%
40%
50%
60%
70%
80%
90%
100%
Sales Mixed Service Average
Difficulty in getting budget for agent reward and incentive programs, by contact center activity
Very difficult
Somewhatdifficult
Not at all difficult
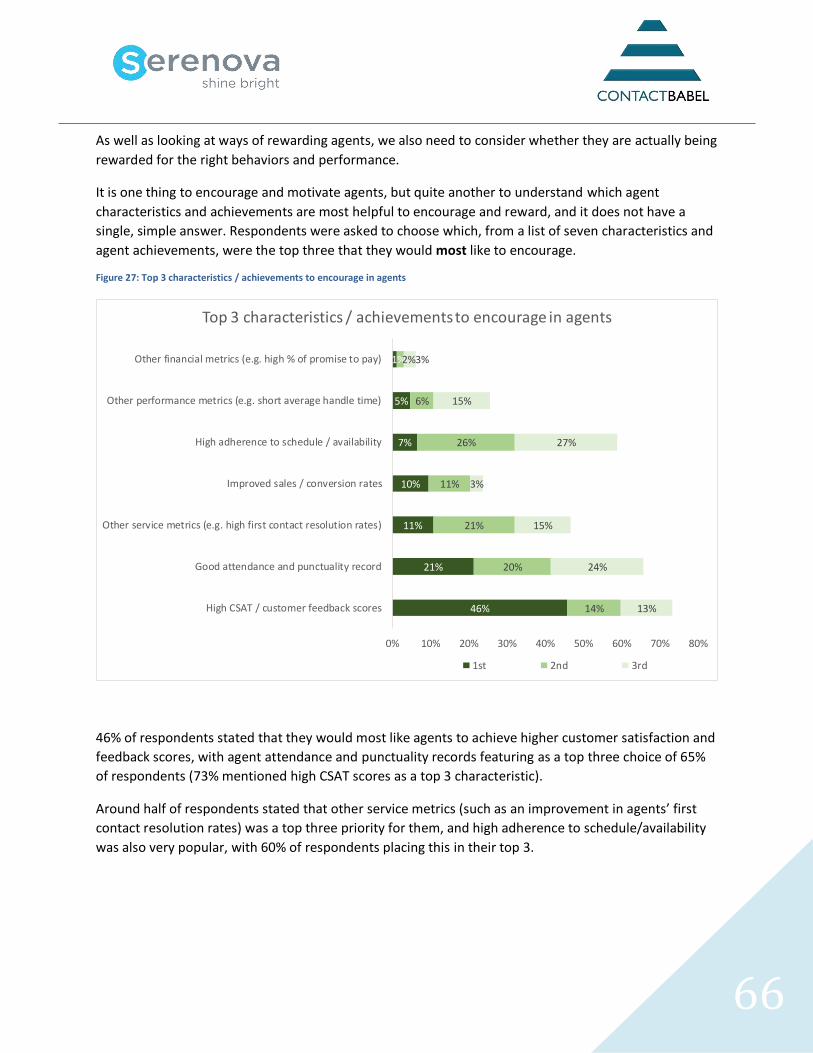
66
As well as looking at ways of rewarding agents, we also need to consider whether they are actually being
rewarded for the right behaviors and performance.
It is one thing to encourage and motivate agents, but quite another to understand which agent
characteristics and achievements are most helpful to encourage and reward, and it does not have a
single, simple answer. Respondents were asked to choose which, from a list of seven characteristics and
agent achievements, were the top three that they would most like to encourage.
Figure 27: Top 3 characteristics / achievements to encourage in agents
46% of respondents stated that they would most like agents to achieve higher customer satisfaction and
feedback scores, with agent attendance and punctuality records featuring as a top three choice of 65%
of respondents (73% mentioned high CSAT scores as a top 3 characteristic).
Around half of respondents stated that other service metrics (such as an improvement in agents’ first
contact resolution rates) was a top three priority for them, and high adherence to schedule/availability
was also very popular, with 60% of respondents placing this in their top 3.
46%
21%
11%
10%
7%
5%
1%
14%
20%
21%
11%
26%
6%
2%
13%
24%
15%
3%
27%
15%
3%
0% 10% 20% 30% 40% 50% 60% 70% 80%
High CSAT / customer feedback scores
Good attendance and punctuality record
Other service metrics (e.g. high first contact resolution rates)
Improved sales / conversion rates
High adherence to schedule / availability
Other performance metrics (e.g. short average handle time)
Other financial metrics (e.g. high % of promise to pay)
Top 3 characteristics / achievements to encourage in agents
1st 2nd 3rd
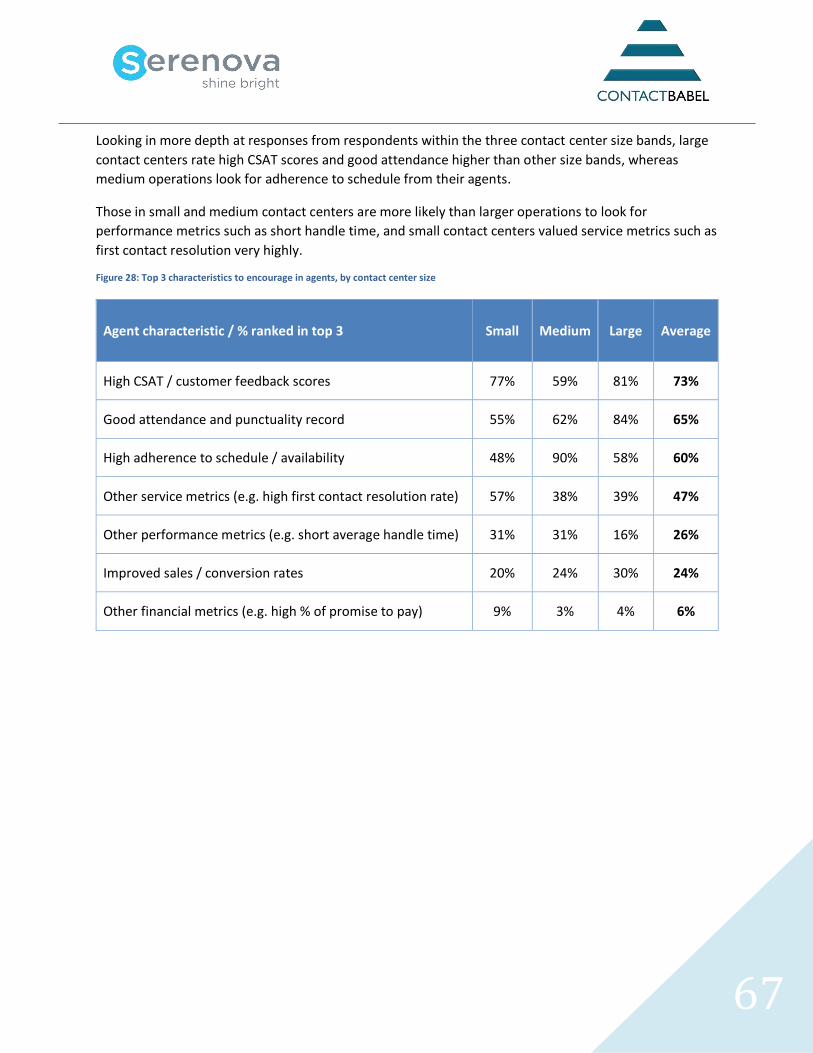
67
Looking in more depth at responses from respondents within the three contact center size bands, large
contact centers rate high CSAT scores and good attendance higher than other size bands, whereas
medium operations look for adherence to schedule from their agents.
Those in small and medium contact centers are more likely than larger operations to look for
performance metrics such as short handle time, and small contact centers valued service metrics such as
first contact resolution very highly.
Figure 28: Top 3 characteristics to encourage in agents, by contact center size
Agent characteristic / % ranked in top 3 Small Medium Large Average
High CSAT / customer feedback scores 77% 59% 81% 73%
Good attendance and punctuality record 55% 62% 84% 65%
High adherence to schedule / availability 48% 90% 58% 60%
Other service metrics (e.g. high first contact resolution rate) 57% 38% 39% 47%
Other performance metrics (e.g. short average handle time) 31% 31% 16% 26%
Improved sales / conversion rates 20% 24% 30% 24%
Other financial metrics (e.g. high % of promise to pay) 9% 3% 4% 6%
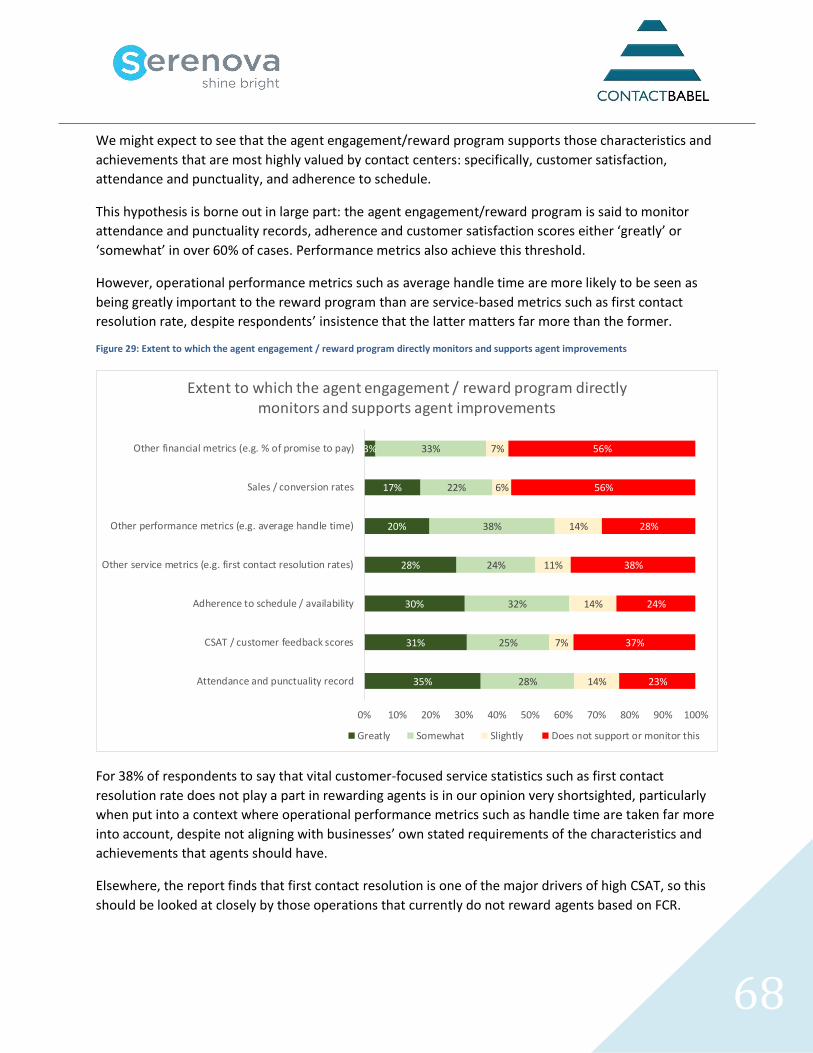
68
We might expect to see that the agent engagement/reward program supports those characteristics and
achievements that are most highly valued by contact centers: specifically, customer satisfaction,
attendance and punctuality, and adherence to schedule.
This hypothesis is borne out in large part: the agent engagement/reward program is said to monitor
attendance and punctuality records, adherence and customer satisfaction scores either ‘greatly’ or
‘somewhat’ in over 60% of cases. Performance metrics also achieve this threshold.
However, operational performance metrics such as average handle time are more likely to be seen as
being greatly important to the reward program than are service-based metrics such as first contact
resolution rate, despite respondents’ insistence that the latter matters far more than the former.
Figure 29: Extent to which the agent engagement / reward program directly monitors and supports agent improvements
For 38% of respondents to say that vital customer-focused service statistics such as first contact
resolution rate does not play a part in rewarding agents is in our opinion very shortsighted, particularly
when put into a context where operational performance metrics such as handle time are taken far more
into account, despite not aligning with businesses’ own stated requirements of the characteristics and
achievements that agents should have.
Elsewhere, the report finds that first contact resolution is one of the major drivers of high CSAT, so this
should be looked at closely by those operations that currently do not reward agents based on FCR.
35%
31%
30%
28%
20%
17%
3%
28%
25%
32%
24%
38%
22%
33%
14%
7%
14%
11%
14%
6%
7%
23%
37%
24%
38%
28%
56%
56%
0% 10% 20% 30% 40% 50% 60% 70% 80% 90% 100%
Attendance and punctuality record
CSAT / customer feedback scores
Adherence to schedule / availability
Other service metrics (e.g. first contact resolution rates)
Other performance metrics (e.g. average handle time)
Sales / conversion rates
Other financial metrics (e.g. % of promise to pay)
Extent to which the agent engagement / reward program directly monitors and supports agent improvements
Greatly Somewhat Slightly Does not support or monitor this
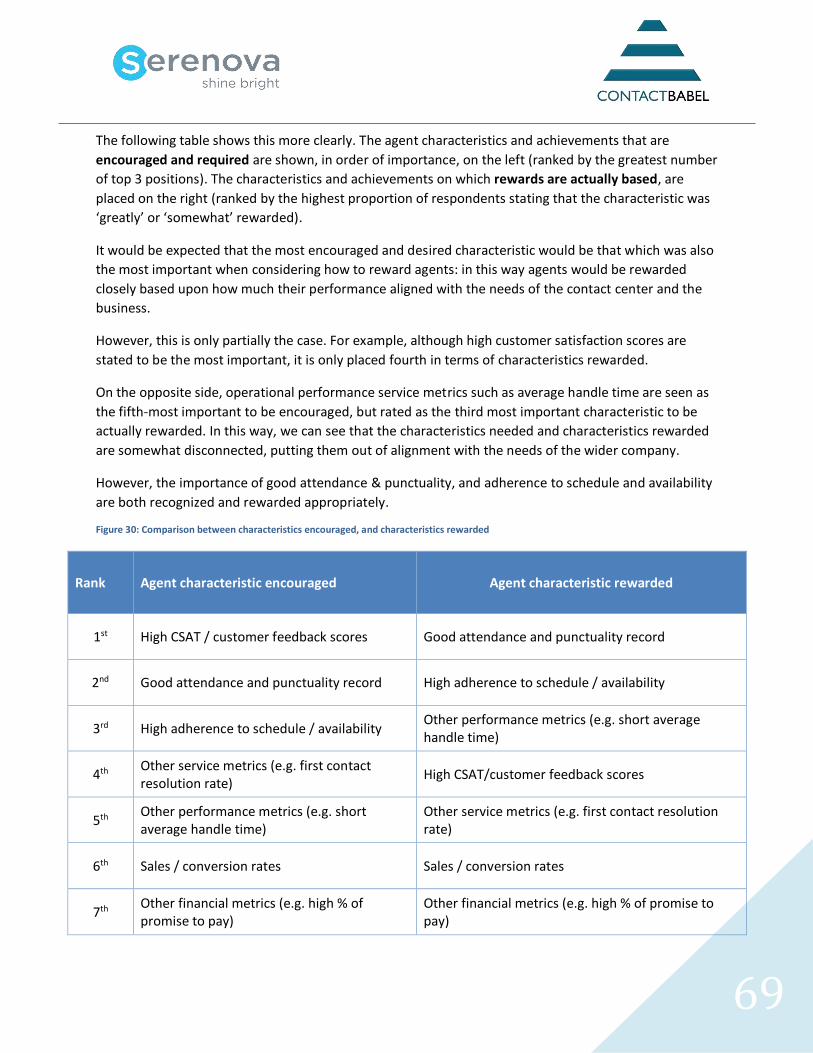
69
The following table shows this more clearly. The agent characteristics and achievements that are
encouraged and required are shown, in order of importance, on the left (ranked by the greatest number
of top 3 positions). The characteristics and achievements on which rewards are actually based, are
placed on the right (ranked by the highest proportion of respondents stating that the characteristic was
‘greatly’ or ‘somewhat’ rewarded).
It would be expected that the most encouraged and desired characteristic would be that which was also
the most important when considering how to reward agents: in this way agents would be rewarded
closely based upon how much their performance aligned with the needs of the contact center and the
business.
However, this is only partially the case. For example, although high customer satisfaction scores are
stated to be the most important, it is only placed fourth in terms of characteristics rewarded.
On the opposite side, operational performance service metrics such as average handle time are seen as
the fifth-most important to be encouraged, but rated as the third most important characteristic to be
actually rewarded. In this way, we can see that the characteristics needed and characteristics rewarded
are somewhat disconnected, putting them out of alignment with the needs of the wider company.
However, the importance of good attendance & punctuality, and adherence to schedule and availability
are both recognized and rewarded appropriately.
Figure 30: Comparison between characteristics encouraged, and characteristics rewarded
Rank Agent characteristic encouraged Agent characteristic rewarded
1st High CSAT / customer feedback scores Good attendance and punctuality record
2nd Good attendance and punctuality record High adherence to schedule / availability
3rd High adherence to schedule / availability Other performance metrics (e.g. short average handle time)
4th Other service metrics (e.g. first contact resolution rate)
High CSAT/customer feedback scores
5th Other performance metrics (e.g. short average handle time)
Other service metrics (e.g. first contact resolution rate)
6th Sales / conversion rates Sales / conversion rates
7th Other financial metrics (e.g. high % of promise to pay)
Other financial metrics (e.g. high % of promise to pay)
70
The findings of the chapter so far are that there is a lack of proof that most agent rewards have a
positive effect on attrition and absence, and that there is a misalignment of rewards and requirements
in many contact centers.
The difficulty in keeping agents engaged, understanding and focusing upon the behaviors, actions and
characteristics that are most helpful for the contact center and the business, and the limited budget
which most contact centers have for incentive programs create a situation whereby an alternative
approach may need to be considered.
Gamification is an approach taken to improving agent engagement, aligning behaviors and
characteristics with those of the contact center and wider enterprise: at the most basic level, it involves
making work tasks into games. The contact center is a particularly rich potential environment for this
approach, as it contains many of the factors that can make gamification successful:
• opportunity for achievement, reward and recognition at an individual level
• the possibility of team-based and goal-based quantified success
• a large pool of competitors and team members, that can be segmented appropriately to make
competition and teamwork more manageable
• clearly defined tasks and metrics that can enable direct comparison between individuals and
teams, over time, with measurable improvements possible.
Generally speaking, contact center agents tend to work in stressful environments for relatively low pay,
doing work which may sometimes be repetitive (although generally less so than in the past). Depending
on the nature of the calls, they may be dealing mainly with customers who have negative experiences of
the company, which is unlikely to make the agent happier about representing the enterprise, especially
over time.
The new agent, while often feeling uncertain about their competence to do tasks, is usually willing to
learn and is engaged in their work. As time goes on, their competence will increase but they can become
bored and cynical, which may in the longer term lead to high levels of agent attrition and
correspondingly lower levels of operation-wide competence. As such, there is a twofold problem: lack of
engagement at agent level leading to lower quality and productivity, and the corresponding costs
associated with unnecessary agent attrition.
Gamification looks to meet these twin challenges with two solutions of its own: making work a more fun
place to be, while encouraging the behaviors, competencies and characteristics that most closely aligned
with the enterprise’s own requirements, through giving agents real-time feedback about their
performance, the opportunities to improve themselves and to be seen positively by peers and managers
with the attendant social and material rewards.
71
Through the process of awarding badges, points and achievement levels, gamification gives agents an
opportunity to show their achievements and compete as individuals and part of the team. The goals in
mind are set by the business, and these require a great deal of thought, as any agent behaviors and
actions must be closely aligned with where the business wants to go. This is an area of particular
potential risk for businesses: taking a simple example, rewarding agents based upon average call
handling time so as to reduce cost could obviously lead to them dropping difficult calls or not answering
customers fully in order to meet these targets. There is also a risk that the novelty of games will wear
off, with rewards having to have a higher and higher tangible monetary value in order to keep people’s
motivation, so ongoing efforts must be made by management to keep games fresh and goals relevant.
It is also important to note that gamification - while providing feedback and rewards to agents on an
individual level - should be used as part of a team or community experience, encouraging high
performing agents to share their best practice and for all agents to be continually challenged and
pushed to learn new skills and improve their own performance.
Contact centers that use gamification frequently report that most agents go beyond the required
training schedule, completing extra units and developing skills further in order to accumulate more
points and badges. In a heavily incentivized sales environment, encouraging agents to take time off
revenue generating activity to take training can be difficult, and this is a potential solution.
Gamification looks to increase agent engagement through:
• providing immediate feedback to the agent, who does not have to wait until the scheduled
supervisory review to see how they are doing
• improving esprit de corps through the pooling of knowledge and collaboration within a group in
order to achieve specific goals for which all will be rewarded
• cut down on the amount of time required for new agents to become competent, providing real-
time feedback in order to encourage positive behaviors
• reduce the amount of management time required to run incentives programs, and deliver them
more fairly and objectively
• focus upon and reward those characteristics and behaviors that are most closely aligned with
the contact center’s and enterprise’s own requirements.
This final point - encouraging agents to do what benefits the business - is a key purpose for gamification.
As seen earlier in this chapter, many organizations are rewarding agents for behaviors which are not
closely aligned with where the business needs to go, while ignoring those attitudes and characteristics
that would actually support them in their journey, often because these latter are more difficult to
measure.
72
Gamification can help businesses to support their objectives, and to achieve specific results. For
example, steps to make gamification assist with achieving a company’s business priorities could include:
• clarifying the enterprise’s objectives
• identifying contact center metrics that directly impact upon these objectives
• identifying the agent characteristics, behavior and actions that impact these metrics the most
• developing a gamification strategy that can measure and improve these metrics, through
motivating the agents to act in ways that support this goal.
For businesses which want to achieve specific results, gamification can assist through:
• increasing the skills and competencies of new agents more rapidly, decreasing time to
productivity by switching from formal, classroom lecture-based training into structured real-life
work tasks
• further developing the skills of agents through encouraging and rewarding the completion of
extra training courses and activities beyond what is required
• cutting agent retention through increasing agent engagement, and recognizing and rewarding
positive behaviors and characteristics.
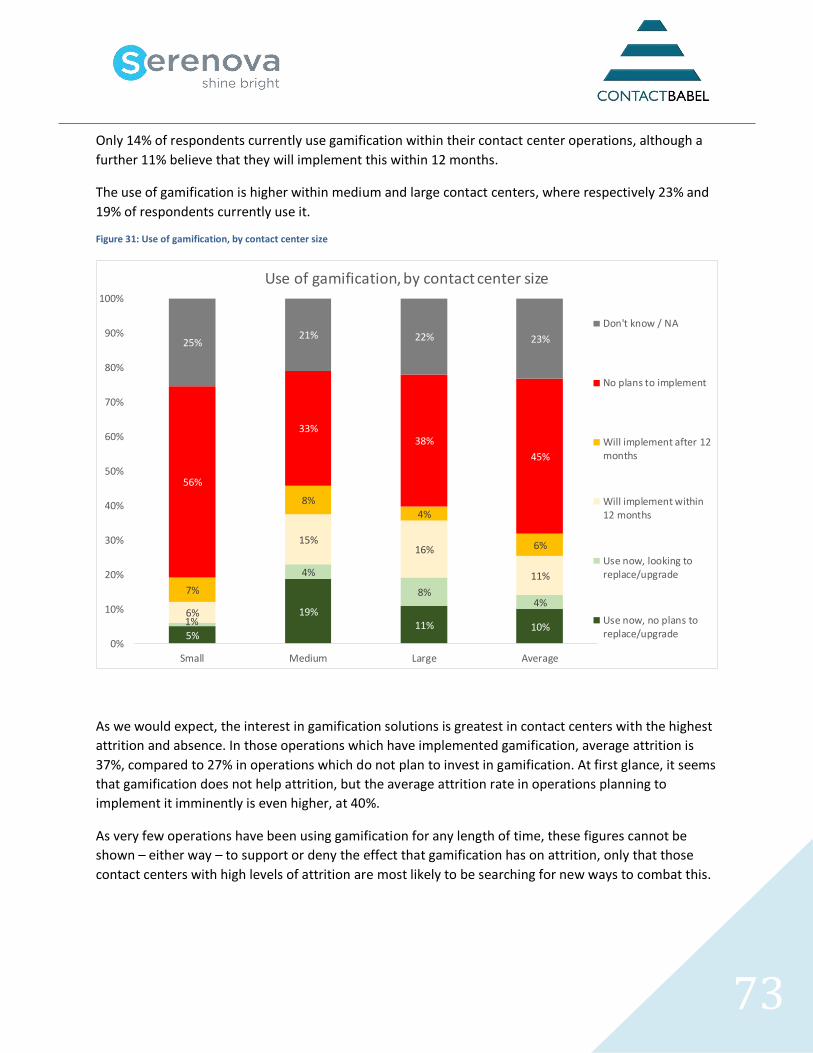
73
Only 14% of respondents currently use gamification within their contact center operations, although a
further 11% believe that they will implement this within 12 months.
The use of gamification is higher within medium and large contact centers, where respectively 23% and
19% of respondents currently use it.
Figure 31: Use of gamification, by contact center size
As we would expect, the interest in gamification solutions is greatest in contact centers with the highest
attrition and absence. In those operations which have implemented gamification, average attrition is
37%, compared to 27% in operations which do not plan to invest in gamification. At first glance, it seems
that gamification does not help attrition, but the average attrition rate in operations planning to
implement it imminently is even higher, at 40%.
As very few operations have been using gamification for any length of time, these figures cannot be
shown – either way – to support or deny the effect that gamification has on attrition, only that those
contact centers with high levels of attrition are most likely to be searching for new ways to combat this.
5%
19%11% 10%1%
4%
8%4%
6%
15%16%
11%
7%
8%4%
6%
56%
33%38%
45%
25%21% 22% 23%
0%
10%
20%
30%
40%
50%
60%
70%
80%
90%
100%
Small Medium Large Average
Use of gamification, by contact center size
Don't know / NA
No plans to implement
Will implement after 12months
Will implement within12 months
Use now, looking toreplace/upgrade
Use now, no plans toreplace/upgrade
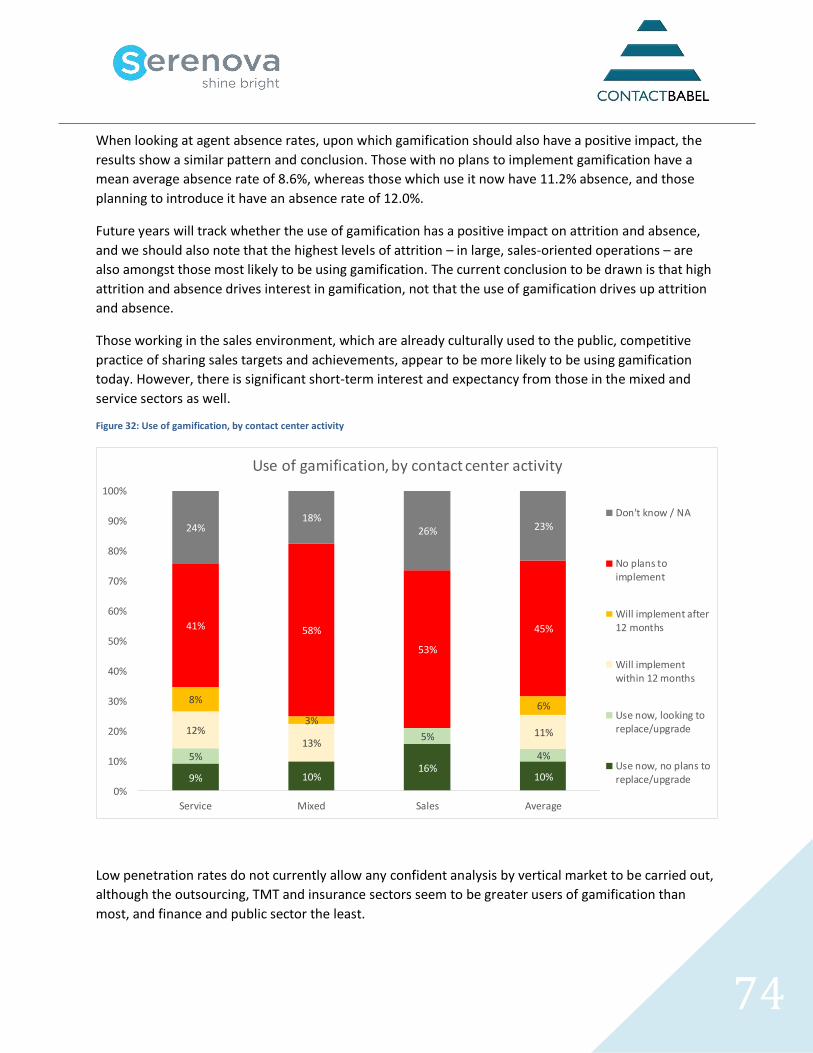
74
When looking at agent absence rates, upon which gamification should also have a positive impact, the
results show a similar pattern and conclusion. Those with no plans to implement gamification have a
mean average absence rate of 8.6%, whereas those which use it now have 11.2% absence, and those
planning to introduce it have an absence rate of 12.0%.
Future years will track whether the use of gamification has a positive impact on attrition and absence,
and we should also note that the highest levels of attrition – in large, sales-oriented operations – are
also amongst those most likely to be using gamification. The current conclusion to be drawn is that high
attrition and absence drives interest in gamification, not that the use of gamification drives up attrition
and absence.
Those working in the sales environment, which are already culturally used to the public, competitive
practice of sharing sales targets and achievements, appear to be more likely to be using gamification
today. However, there is significant short-term interest and expectancy from those in the mixed and
service sectors as well.
Figure 32: Use of gamification, by contact center activity
Low penetration rates do not currently allow any confident analysis by vertical market to be carried out,
although the outsourcing, TMT and insurance sectors seem to be greater users of gamification than
most, and finance and public sector the least.
9% 10%16%
10%
5%
5%
4%
12%13%
11%
8%
3%
6%
41% 58%
53%
45%
24%18%
26% 23%
0%
10%
20%
30%
40%
50%
60%
70%
80%
90%
100%
Service Mixed Sales Average
Use of gamification, by contact center activity
Don't know / NA
No plans toimplement
Will implement after12 months
Will implementwithin 12 months
Use now, looking toreplace/upgrade
Use now, no plans toreplace/upgrade
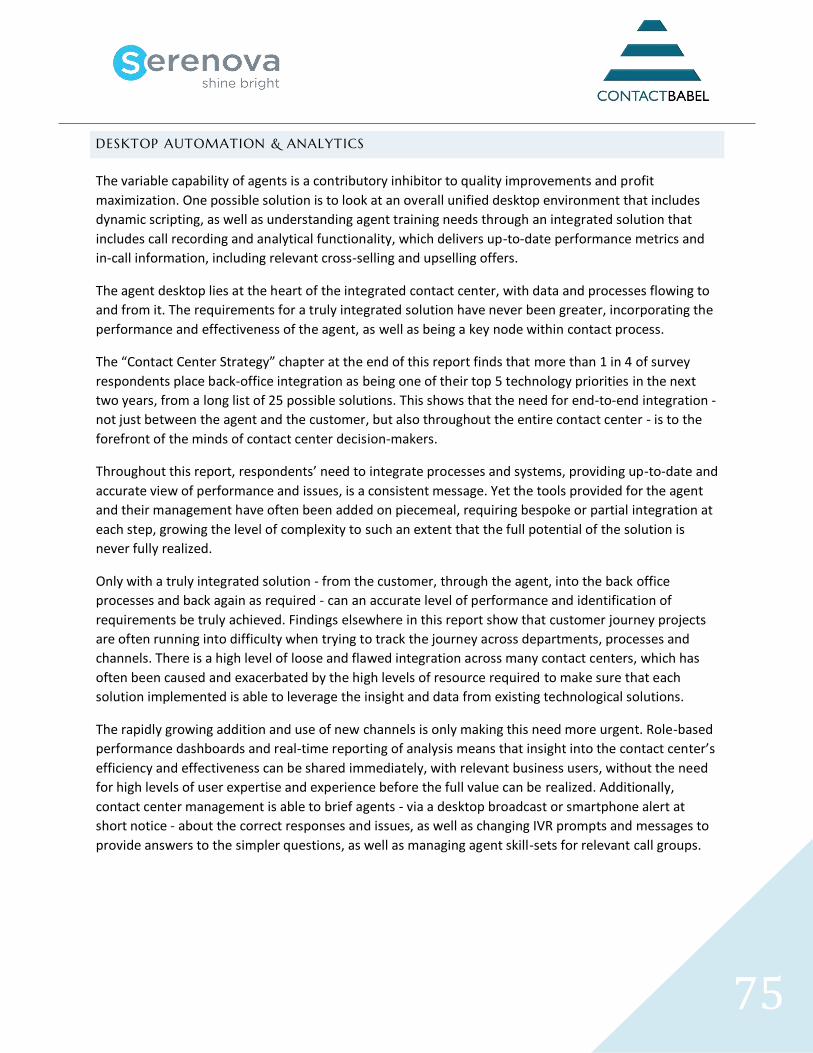
75
DESKTOP AUTOMATION & ANALYTICS
The variable capability of agents is a contributory inhibitor to quality improvements and profit
maximization. One possible solution is to look at an overall unified desktop environment that includes
dynamic scripting, as well as understanding agent training needs through an integrated solution that
includes call recording and analytical functionality, which delivers up-to-date performance metrics and
in-call information, including relevant cross-selling and upselling offers.
The agent desktop lies at the heart of the integrated contact center, with data and processes flowing to
and from it. The requirements for a truly integrated solution have never been greater, incorporating the
performance and effectiveness of the agent, as well as being a key node within contact process.
The “Contact Center Strategy” chapter at the end of this report finds that more than 1 in 4 of survey
respondents place back-office integration as being one of their top 5 technology priorities in the next
two years, from a long list of 25 possible solutions. This shows that the need for end-to-end integration -
not just between the agent and the customer, but also throughout the entire contact center - is to the
forefront of the minds of contact center decision-makers.
Throughout this report, respondents’ need to integrate processes and systems, providing up-to-date and
accurate view of performance and issues, is a consistent message. Yet the tools provided for the agent
and their management have often been added on piecemeal, requiring bespoke or partial integration at
each step, growing the level of complexity to such an extent that the full potential of the solution is
never fully realized.
Only with a truly integrated solution - from the customer, through the agent, into the back office
processes and back again as required - can an accurate level of performance and identification of
requirements be truly achieved. Findings elsewhere in this report show that customer journey projects
are often running into difficulty when trying to track the journey across departments, processes and
channels. There is a high level of loose and flawed integration across many contact centers, which has
often been caused and exacerbated by the high levels of resource required to make sure that each
solution implemented is able to leverage the insight and data from existing technological solutions.
The rapidly growing addition and use of new channels is only making this need more urgent. Role-based
performance dashboards and real-time reporting of analysis means that insight into the contact center’s
efficiency and effectiveness can be shared immediately, with relevant business users, without the need
for high levels of user expertise and experience before the full value can be realized. Additionally,
contact center management is able to brief agents - via a desktop broadcast or smartphone alert at
short notice - about the correct responses and issues, as well as changing IVR prompts and messages to
provide answers to the simpler questions, as well as managing agent skill-sets for relevant call groups.
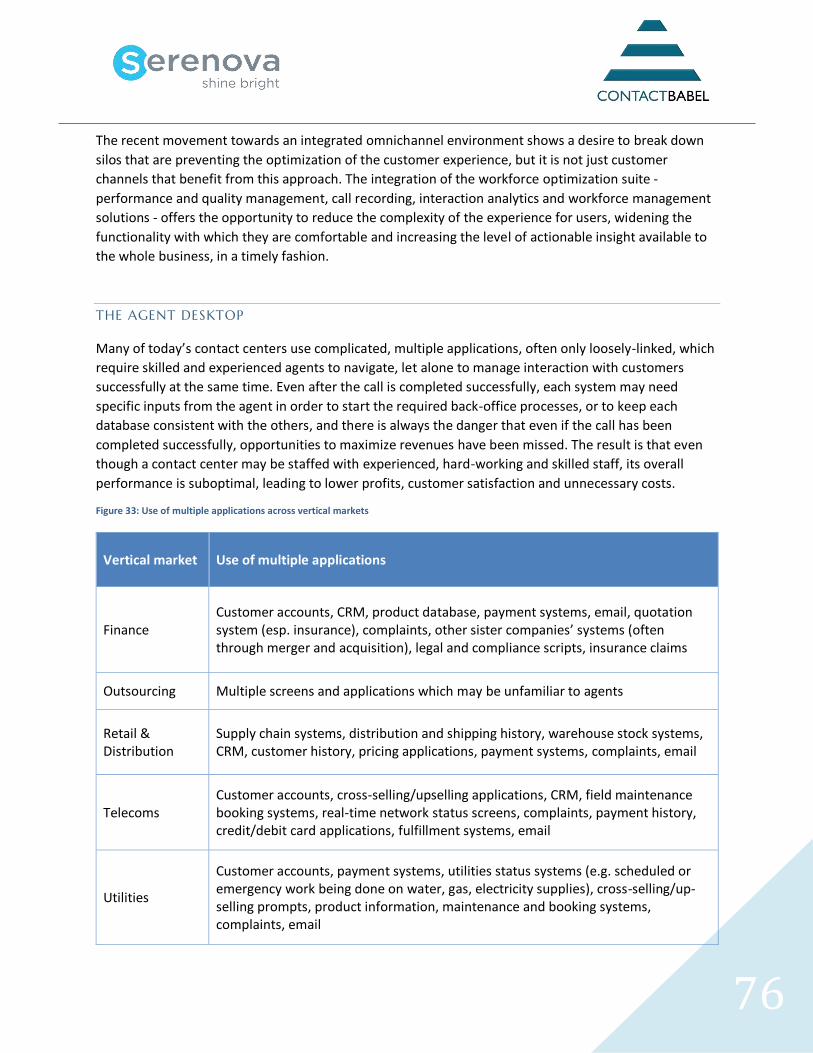
76
The recent movement towards an integrated omnichannel environment shows a desire to break down
silos that are preventing the optimization of the customer experience, but it is not just customer
channels that benefit from this approach. The integration of the workforce optimization suite -
performance and quality management, call recording, interaction analytics and workforce management
solutions - offers the opportunity to reduce the complexity of the experience for users, widening the
functionality with which they are comfortable and increasing the level of actionable insight available to
the whole business, in a timely fashion.
THE AGENT DESKTOP
Many of today’s contact centers use complicated, multiple applications, often only loosely-linked, which
require skilled and experienced agents to navigate, let alone to manage interaction with customers
successfully at the same time. Even after the call is completed successfully, each system may need
specific inputs from the agent in order to start the required back-office processes, or to keep each
database consistent with the others, and there is always the danger that even if the call has been
completed successfully, opportunities to maximize revenues have been missed. The result is that even
though a contact center may be staffed with experienced, hard-working and skilled staff, its overall
performance is suboptimal, leading to lower profits, customer satisfaction and unnecessary costs.
Figure 33: Use of multiple applications across vertical markets
Vertical market
Use of multiple applications
Finance Customer accounts, CRM, product database, payment systems, email, quotation system (esp. insurance), complaints, other sister companies’ systems (often through merger and acquisition), legal and compliance scripts, insurance claims
Outsourcing Multiple screens and applications which may be unfamiliar to agents
Retail & Distribution
Supply chain systems, distribution and shipping history, warehouse stock systems, CRM, customer history, pricing applications, payment systems, complaints, email
Telecoms Customer accounts, cross-selling/upselling applications, CRM, field maintenance booking systems, real-time network status screens, complaints, payment history, credit/debit card applications, fulfillment systems, email
Utilities
Customer accounts, payment systems, utilities status systems (e.g. scheduled or emergency work being done on water, gas, electricity supplies), cross-selling/up-selling prompts, product information, maintenance and booking systems, complaints, email
77
With 93% of respondents requiring their agents to use multiple applications within a call, there are
significant dangers around forgetting to key in information, not asking for the required information,
starting the correct processes or failing to type in consistent data.
The use of multiple applications will require longer training times and initially lower accuracy rates for
new agents as well.
43% of respondents report that agents use four or more applications within a call, and this especially
seems to be the case in 50+ seat operations.
Figure 34: How many applications does an agent use within a call? (by contact center size)
6%11%
7%
25%
11%
21%21%
31%
43%
23% 30%
13%25%
17%17%
15% 11%17% 15%
10% 11% 11% 11%
0%
10%
20%
30%
40%
50%
60%
70%
80%
90%
100%
Small Medium Large Average
How many applications does an agent use within a call? (by contact center size)
More than five
Five
Four
Three
Two
One
78
In most cases where complex, multiple applications are used, they are necessary for the agents to do
their job, so the question is not “How can we reduce the number of applications?”, but rather “How can
we improve how the agent uses the applications?”. At the moment, due to complexity, expense and the
sheer weight of constant change, applications are either integrated very loosely, or not at all. Agents are
trained (or more likely, learn on the job) to switch rapidly between applications, relying on their
experience to make sure they don’t forget to do what’s required.
Such an approach can have severe primary and secondary effects:
• Increased training costs
• Higher staff attrition caused by inability to complete tasks successfully
• Inconsistent data caused by keying errors or missed procedures caused by manual wrap-ups
• Increased call handling times
• Lower customer satisfaction caused by long queues and unnecessarily long calls
• Missed opportunities to cross-sell and up-sell
• Multiple open applications on the agent desktop can lead to system instability and lower
performance.
Desktop automation solutions can remove the need for agents to log into multiple applications, assist
them with the navigation between applications within the call, and make sure that customer data is
gathered from the correct places and written consistently back to any relevant databases without the
need to navigate through multiple systems.
Within the call, dynamic call scripting helps the agent to provide the right information at the right time,
seamlessly linking with multiple back-office applications and databases, providing only what is relevant
onto the agent’s screen. Depending on the experience or profile of the agent, what the customer is
trying to do and any regulatory inhibitors, on-screen buttons can be enabled or disabled, or access to
fields limited according to business rules. Furthermore, adherence to business processes can be assured
by making the agent complete all of the required steps in the transaction (for example, adding call
notes, reading disclaimers, etc.).
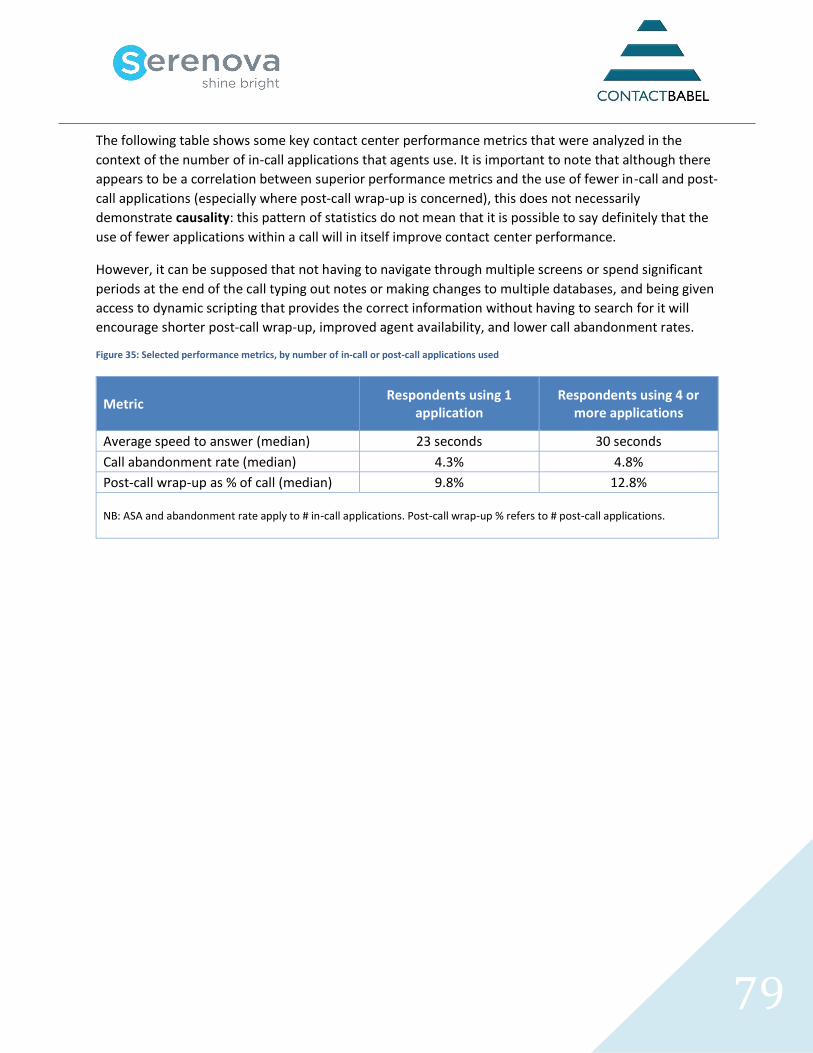
79
The following table shows some key contact center performance metrics that were analyzed in the
context of the number of in-call applications that agents use. It is important to note that although there
appears to be a correlation between superior performance metrics and the use of fewer in-call and post-
call applications (especially where post-call wrap-up is concerned), this does not necessarily
demonstrate causality: this pattern of statistics do not mean that it is possible to say definitely that the
use of fewer applications within a call will in itself improve contact center performance.
However, it can be supposed that not having to navigate through multiple screens or spend significant
periods at the end of the call typing out notes or making changes to multiple databases, and being given
access to dynamic scripting that provides the correct information without having to search for it will
encourage shorter post-call wrap-up, improved agent availability, and lower call abandonment rates.
Figure 35: Selected performance metrics, by number of in-call or post-call applications used
Metric
Respondents using 1 application
Respondents using 4 or more applications
Average speed to answer (median) 23 seconds 30 seconds
Call abandonment rate (median) 4.3% 4.8%
Post-call wrap-up as % of call (median) 9.8% 12.8%
NB: ASA and abandonment rate apply to # in-call applications. Post-call wrap-up % refers to # post-call applications.
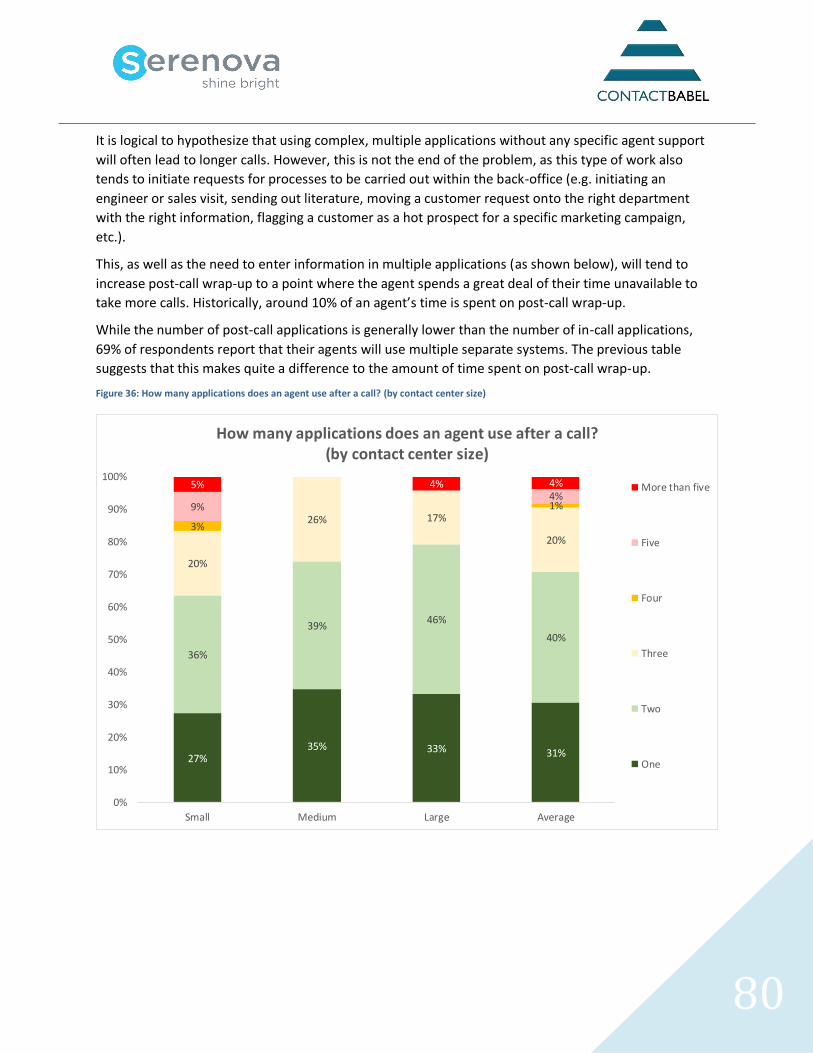
80
It is logical to hypothesize that using complex, multiple applications without any specific agent support
will often lead to longer calls. However, this is not the end of the problem, as this type of work also
tends to initiate requests for processes to be carried out within the back-office (e.g. initiating an
engineer or sales visit, sending out literature, moving a customer request onto the right department
with the right information, flagging a customer as a hot prospect for a specific marketing campaign,
etc.).
This, as well as the need to enter information in multiple applications (as shown below), will tend to
increase post-call wrap-up to a point where the agent spends a great deal of their time unavailable to
take more calls. Historically, around 10% of an agent’s time is spent on post-call wrap-up.
While the number of post-call applications is generally lower than the number of in-call applications,
69% of respondents report that their agents will use multiple separate systems. The previous table
suggests that this makes quite a difference to the amount of time spent on post-call wrap-up.
Figure 36: How many applications does an agent use after a call? (by contact center size)
27%35% 33% 31%
36%
39%46%
40%
20%
26% 17%
20%3%
1%9%4%
5% 4% 4%
0%
10%
20%
30%
40%
50%
60%
70%
80%
90%
100%
Small Medium Large Average
How many applications does an agent use after a call? (by contact center size)
More than five
Five
Four
Three
Two
One
81
It is in the post-call wrap-up stage that a lot of time and effort is wasted by sub-optimal manual
processing of data. For example, a simple change of address request could take many minutes in a non-
unified environment, with several separate databases having to be altered, which is itself a process
prone to error, with a negative impact on the customer and business, as well as at least one extra
unnecessary future phone call from the customer. Reducing wrap-up time through optimizing the agent
desktop is not simply a matter of writing consistently to the correct databases, although this is a key
element. The contact center also kicks off a number of processes elsewhere in the enterprise: it is the
prime mover for sending out documents, instructing the warehouse to release goods, arranging
deliveries, taking payment and many other key elements to a successful customer-business transaction.
Some calls require a great many notes to be made to the agent desktop application the end of the call.
Desktop automation solutions can automatically log the events which happened within the call (for
example, changes to customer data records, billing enquiries, alterations to orders, etc.) which can save
minutes in the post-call wrap-up stage in some cases.
82
The cost of excessive wrap-up
Although few contact center managers would say that excessive wrap-up times cause the same level of
concern as attrition or customer satisfaction, the current average of 9.3% of time that contact center
agent spend each hour in after-call work adds up to an enormous cost.
The overall expenditure of the US contact center sector - salaries, IT, telecoms, building, rent, utilities,
etc. - comes to around $210bn each year. Wrap-up time accounts for over 9% of the time spent by the
industry: usually slightly less in larger contact centers, which account for the bulk of the jobs. As such,
wrap-up costs the industry around $19.5bn each year. This is not to say that all wrap-up is wasted and
unnecessary, but this is a segment of expenditure that is ripe for efficiency-enhancement.
As an example, a 500-seat contact center, processing 5m calls per year, would spend well around $2m
each year just on wrap-up. A 25% reduction in wrap-up time would save around $500,000, quite apart
from the savings in training and lower attrition, as well as the benefits of shorter queues and simpler
applications.
There has been a big growth in interest in unified desktop solutions in recent times, with additional
benefits coming from reduced training times (as agents are learning one system, not many); processing
the call quicker (by hiding slow legacy applications or posting information to multiple systems in one go
without replicated effort) and improved customer satisfaction / conversion rates (as the agent can
concentrate on the customer and is supported by knowledge bases).
Businesses can usually focus either on cutting costs or improving quality. However, there is a third way,
which allows desktop solutions for users to be developed separately from the underlying applications,
re-using existing logic and interfaces rather than replacing them. The agent works with a single desktop
application which is tailored to their specific needs, pulling in only the right data and applications from
disparate systems and presenting them on a single screen. In the background, business rules and
workflow make sure that the right back-office processes happen without agent intervention, thus
reducing wrap-up costs.
An application which supports less-experienced agents, and helps them to learn means that staff
attrition rates can be managed more effectively. High attrition rates and poor knowledge bases mean
that people take away the knowledge as they leave. By having a user interface which provides the right
information dynamically - and which increases the amount of leeway an agent has as they become more
competent - means that agents can find the right balance between being too tightly managed and
feeling cast adrift by the system’s lack of user-friendliness.
83
This desire to improve the agent desktop and workflow seems to be more of an issue for those with
numerous in-call applications - as we would expect - but it is by no means exclusive to them. Even
amongst those respondents with only one or two in-call applications, there is significant appreciation
that processes and follow-on work can be improved, which suggest that this is not simply about
reducing the number of applications that an agent has to learn to use.
69% of respondents use agent desktops which provide a single sign-on mechanism to multiple systems,
which can potentially greatly reduce the amount of time that agents spent logging in and out of systems.
Static scripting (which does not change depending on the context of the conversation) is used by 32% of
respondents, and dynamic scripting (which alters depending on the context and direction of the
conversation) is used by 23%.
The latter can be useful for compliance: some solutions use historical analysis to check that regulations
have been adhered to, but other solution providers take the view that compliance should be enforced
within the conversation itself, and trigger alerts to the agent desktop to make sure that all of the
relevant script and customer responses have been included. Many solution providers have worked hard
to bring to market new or improved solutions to assist with real-time monitoring and alerts, and
recognition of key words, phrases, instances of talk-over, emotion and sentiment detection, pitch, tone,
speed and audibility of language and many other important variables can be presented on the agent
desktop within the call, triggering business-driven alerts and processes if required.
Only 1 in 5 respondents which use scripting of either type have both varieties. 28% provide contextual
help to their agents, offering solutions or hints depending on where the conversation has gone, or the
activity the agent is currently involved with, for example, triggering back-office processes and opening
agent desktop screens depending on call events. For example, the statement of a product name or serial
number within the conversation can open an agent assistant screen that is relevant to that product
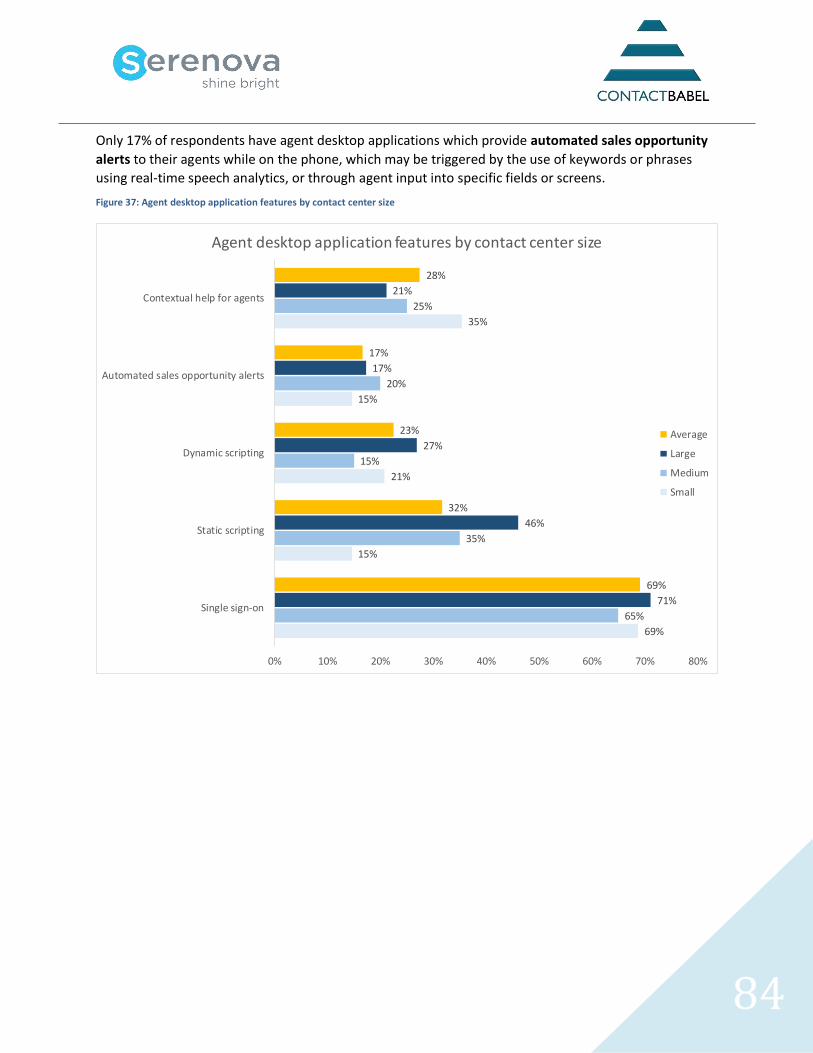
84
Only 17% of respondents have agent desktop applications which provide automated sales opportunity
alerts to their agents while on the phone, which may be triggered by the use of keywords or phrases
using real-time speech analytics, or through agent input into specific fields or screens.
Figure 37: Agent desktop application features by contact center size
69%
15%
21%
15%
35%
65%
35%
15%
20%
25%
71%
46%
27%
17%
21%
69%
32%
23%
17%
28%
0% 10% 20% 30% 40% 50% 60% 70% 80%
Single sign-on
Static scripting
Dynamic scripting
Automated sales opportunity alerts
Contextual help for agents
Agent desktop application features by contact center size
Average
Large
Medium
Small
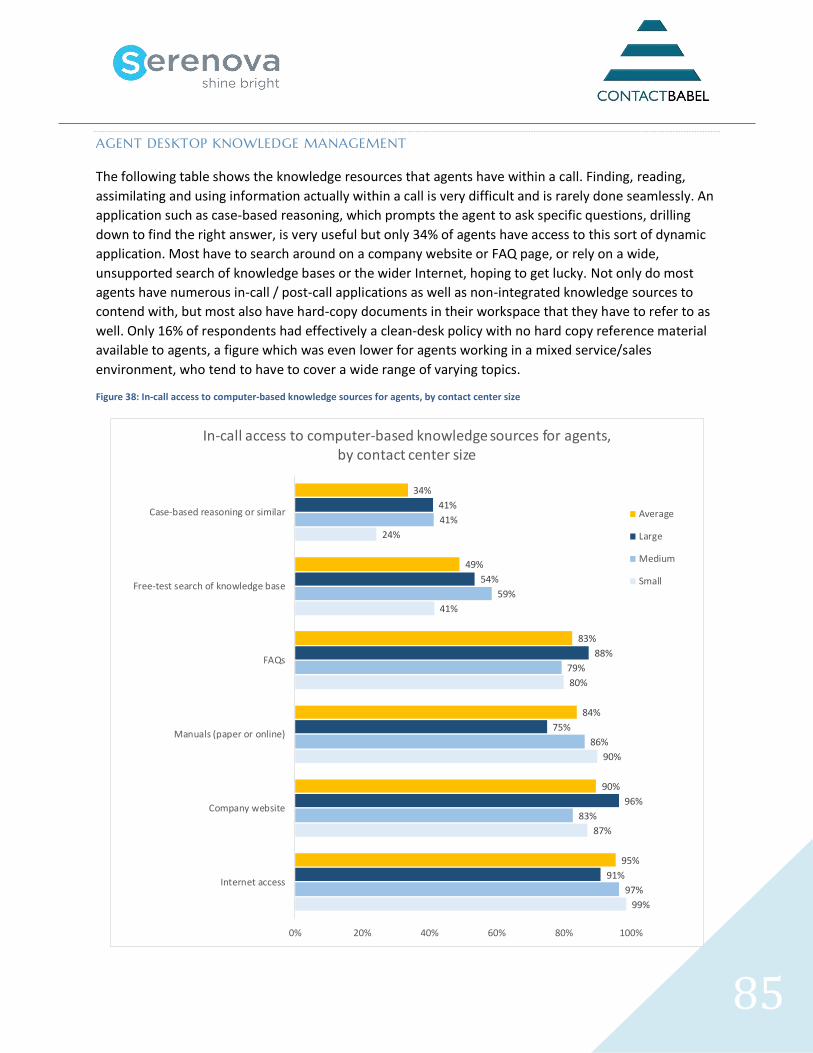
85
AGENT DESKTOP KNOWLEDGE MANAGEMENT
The following table shows the knowledge resources that agents have within a call. Finding, reading,
assimilating and using information actually within a call is very difficult and is rarely done seamlessly. An
application such as case-based reasoning, which prompts the agent to ask specific questions, drilling
down to find the right answer, is very useful but only 34% of agents have access to this sort of dynamic
application. Most have to search around on a company website or FAQ page, or rely on a wide,
unsupported search of knowledge bases or the wider Internet, hoping to get lucky. Not only do most
agents have numerous in-call / post-call applications as well as non-integrated knowledge sources to
contend with, but most also have hard-copy documents in their workspace that they have to refer to as
well. Only 16% of respondents had effectively a clean-desk policy with no hard copy reference material
available to agents, a figure which was even lower for agents working in a mixed service/sales
environment, who tend to have to cover a wide range of varying topics.
Figure 38: In-call access to computer-based knowledge sources for agents, by contact center size
99%
87%
90%
80%
41%
24%
97%
83%
86%
79%
59%
41%
91%
96%
75%
88%
54%
41%
95%
90%
84%
83%
49%
34%
0% 20% 40% 60% 80% 100%
Internet access
Company website
Manuals (paper or online)
FAQs
Free-test search of knowledge base
Case-based reasoning or similar
In-call access to computer-based knowledge sources for agents, by contact center size
Average
Large
Medium
Small
86
DESKTOP ANALYTICS
Desktop analytics allows businesses to record and analyze an agent’s desktop in order to assist with
quality assessments at an agent level, and also to identify areas within systems and processes that cause
delays within customer interactions. Additionally, management can search for examples where agents
skipped compulsory screens or ignored guidelines around how best to close the sale, in order to
maximize future compliance with regulation and company procedure.
Average call duration is a metric that has been measured in contact centers since their very first
inception. However, businesses have had to rely upon anecdotal information in order to decide whether
excessively lengthy calls are a factor of agent inexperience or inability to answer the customer’s
question, or if there is a particular step within the procedure when delays are occurring in an otherwise
competently-handled call (for example, from a lack of training about a particular area, or a badly
designed screen layout). Solution providers note that some of the most sophisticated users of analytics
have evolved to optimizing handle time, rather than simply reducing it. That is to say, they investigate
the causes of longer calls – often using desktop analytics as well as speech analytics - weighing up the
profitability or any other positive element within each segment of the call, and aim to minimize the time
spent on any part of the call which does not add value.
Desktop analytics can provide information about exactly how long each step with an interaction takes,
providing management with the insight as to which processes could potentially be automated, and how
much time (and thus, cost) would be saved. Businesses would also gain insight into how agents actually
research issues that they cannot immediately answer (for example, do they research the company
website, a knowledge base or the wider Internet - and if so, which method is the most successful?).
Desktop analytics can be integrated with speech analytics, tagging data such as account ID, product
name and order value to recorded interactions, which can then be used to enhance automated
classification and understand key business issues.
A growing use of analytics is applying desktop analytics and screen recording in the back office, which
means that even non-customer-facing employees to have their performance measured and optimized in
the same way as their front office colleagues.
87
CUSTOMER EXPERIENCE MEASUREMENT & IMPROVEMENT
Most businesses say that customer satisfaction is vital to them. Yet this raises more questions: how
‘satisfied’ do customers have to be? And what do customers want from contact centers? Quite simply,
they would like to be answered quickly by a person who is able to help them without passing them
around, and have the correct answer given to them quickly by someone with whom they feel
comfortable talking. Additionally, the business has to deliver on the reason the customer is calling in the
first place - by sending out the purchased item promptly, changing the database details or refunding
money, for example. So the contact center does not stand alone: it orchestrates the rest of the business.
Various pieces of research show that the benefits to a business that are made from increasing customer
satisfaction are non-linear: if a customer is very happy, they are likely to be worth a great deal in
additional direct purchases and possibly more importantly, will act as a brand advocate for your
company. A customer who is merely ‘satisfied’ will not have anywhere near the same positive impact on
revenues or profits, and is likely to be a good deal less loyal.
A contact center can achieve all the operational performance measurements which it sets for itself,
without actually being successful. If the customer does not hang up the phone feeling that she has been
treated appropriately and that her query has been resolved to her satisfaction, then that counts as a
failure, regardless of how good the internal metrics may be.
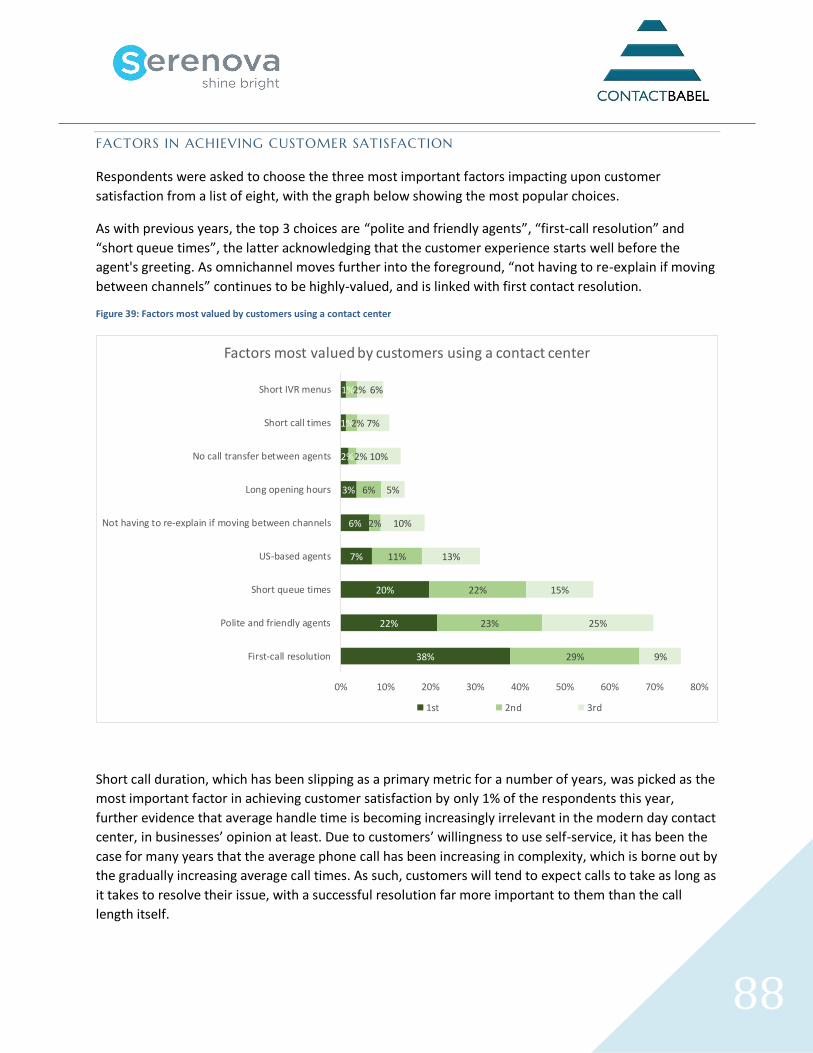
88
FACTORS IN ACHIEVING CUSTOMER SATISFACTION
Respondents were asked to choose the three most important factors impacting upon customer
satisfaction from a list of eight, with the graph below showing the most popular choices.
As with previous years, the top 3 choices are “polite and friendly agents”, “first-call resolution” and
“short queue times”, the latter acknowledging that the customer experience starts well before the
agent's greeting. As omnichannel moves further into the foreground, “not having to re-explain if moving
between channels” continues to be highly-valued, and is linked with first contact resolution.
Figure 39: Factors most valued by customers using a contact center
Short call duration, which has been slipping as a primary metric for a number of years, was picked as the
most important factor in achieving customer satisfaction by only 1% of the respondents this year,
further evidence that average handle time is becoming increasingly irrelevant in the modern day contact
center, in businesses’ opinion at least. Due to customers’ willingness to use self-service, it has been the
case for many years that the average phone call has been increasing in complexity, which is borne out by
the gradually increasing average call times. As such, customers will tend to expect calls to take as long as
it takes to resolve their issue, with a successful resolution far more important to them than the call
length itself.
38%
22%
20%
7%
6%
3%
2%
1%
1%
29%
23%
22%
11%
2%
6%
2%
2%
2%
9%
25%
15%
13%
10%
5%
10%
7%
6%
0% 10% 20% 30% 40% 50% 60% 70% 80%
First-call resolution
Polite and friendly agents
Short queue times
US-based agents
Not having to re-explain if moving between channels
Long opening hours
No call transfer between agents
Short call times
Short IVR menus
Factors most valued by customers using a contact center
1st 2nd 3rd
89
CUSTOMER SATISFACTION MEASUREMENT TECHNIQUES
Customer surveys have been an integral part of most businesses since time immemorial. Recently, there
has been a great increase in the number of organizations implementing “Voice of the Customer”
programs, often based around large-scale analysis of call recordings. This approach is investigated in
more depth within the ‘Customer Interaction Analytics’ chapter within this report, but the more
traditional, direct methods of understanding customer experience and requirements are still very much
present.
The numerous methods of directly surveying customers include the following:
IVR: at the end of the call, and after agreeing to do so, the customer may be passed through to an
automated IVR system, which typically asks a mixture of open and closed questions which can be
answered with a combination of DTMF touchtone and speech. This has the benefit of immediacy, in that
the caller will be able to give an accurate assessment of the call and the agent, and also allows the
business to be alerted in near-real-time to any major problems through pre-programmed automated
SMS, dashboard or email alerts.
The speed and ease with which an agent-invited IVR survey can be implemented gives it a distinct
advantage over a survey conducted via outbound calls. The resources and staff time required to make
outbound calls often mean that they are conducted erratically and rarely during peak times which
undermines the quality and usefulness of the data collated. As agent-invited IVR surveys are automated,
they require little staff input and can monitor customer satisfaction whenever the contact center is
open.
It is also worth mentioning that outbound automated surveys are becoming more prevalent, with many
tens of millions of outbound IVR survey calls estimated to be made each year in the US. After the call has
been concluded, the caller's number may be put into an outbound dialer's queue, which calls them and
offers an IVR survey. The speed with which this call-back is made is crucial to the take-up rate of the
survey, with up to 70% acceptance rate if the call-back is in minutes, but perhaps only 10% if the call is
made over 48 hours later.
90
Written: a system-generated letter is posted to the customer soon after an interaction takes place,
requesting feedback. Typically, more customers who have had a poor experience will bother to return
the questionnaire, skewing the figures, and although some good and detailed learning points can
emerge, it's an expensive way to survey customers. It's also the case that results will be tilted towards
the demographics with more time available to them, especially older people. There can be a lack of
immediacy, and some people might feel that sending out a written questionnaire to ask about how well
a call was handled is excessively solicitous.
Written surveys via letter or person-to-person interviews have an important role to play, particularly
where the feedback generated can be compared side-to-side with feedback by other methods. Having
quantitative and qualitative data provides valuable feedback that can’t be achieved by adopting a single
surveying method.
Digital: a email-generated survey request can be immediate and easy for customers to complete. This
form of feedback is most popular these days but response rates are still low, between 2 and 10%. This
mechanism allows businesses to marry the customer feedback to known customer demographic data.
The most effective form of feedback will inevitably be the “open ended” questions that ask the
customer for feedback using their own words.
Outbound: frequently, the contact details of a proportion of incoming callers will be passed to a
dedicated outbound team, who will call the customer back, often within 24 hours, to ascertain the
customer’s level of satisfaction with the original call. Sometimes customers will find this intrusive, while
others will welcome the chance to provide feedback. Additionally, certain companies employ outside
agencies to survey customers regularly, which may be useful in benchmarking exercises, since they will
apply a more formalized and structured approach to data gathering and presentation. The automated
option as mentioned in the ‘Outbound & Call Blending’ section elsewhere in this report should also be
considered as an option.
SMS: In theory, text messaging has the advantage of immediacy of sending and also of reporting on the
results. It is a cheap way of carrying out surveys, and can be linked to a specific agent, allowing the
contact center to use this information for agent performance as well as satisfaction with the business.
SMS does not allow detailed or multiple questions though, and businesses will have to collect cellphone
numbers if they do not already have them, and the costs of sending and receiving SMS will have to be
considered.
91
In today’s omnichannel society, it is important to choose a survey method and platform that caters for
all your customers. Though many customers want to continue to contact by telephone, there are others
who prefer to text or email and it is necessary to offer consistent service across the business. Monitoring
all interactions to the company will give comprehensive insight into customers’ opinions of the service
being offered.
Similarly, different customers will prefer to be surveyed in different ways and a survey platform should
have the flexibility to support IVR, web, text and written surveys and collate the results in a unified
reporting system. Not only will this mean that this is an increase in the number of customers accessed,
but there will be a different quality of feedback from each approach.
We would suggest that there is no single best way to gauge customer satisfaction. If detailed feedback is
what's needed, a written or telephone-based questionnaire is best, although IVR can offer the option of
direct quotes through speech recognition or recording transcription. If immediate knowledge about an
issue is needed (including your customers' views of agents' performance), consider post-call IVR or an
SMS survey in certain circumstances. No matter the channel, all the feedback should be evaluated
together in a feedback hub. The more information businesses have at their disposal, the more confident
they can be that they fully understand your customers.
It is important before organizations begin to survey their customers, that they:
• Clearly determine the purpose and aims of the survey
• Consider adopting a variety of question types. Scored questions enable the business to produce
statistically significant and representative data. Free comments can provide real insight into
customers’ perception of service
• Consider selecting an experienced company to set up and host the survey. Businesses can
benefit from their expertise and knowledge and avoid potentially costly errors
• Ensure that the survey can be carried out throughout the day, including peak times, to gain a
true picture of the customer experience
• Make sure that the results of the survey can be collated and analyzed alongside all other forms
of feedback, including other surveys, online feedback, email, web chat and voice recordings. It is
pointless to amass information if it cannot be evaluated uniformly and the results disseminated
usefully
• Have procedures in place to act upon the information that is found. The feedback may have
uncovered some broken processes in the service which need attention. It will also inevitably
throw up disgruntled customers whose specific concerns need addressing. In this instance, any
feedback platform should provide some mechanism for alerting and following-up to ensure that
dissatisfied customers are escalated to the appropriate staff
92
• Adopt a unified approach across the business to assessing and monitoring customer satisfaction.
If businesses continue to reward agents based on traditional call performance metrics, they are
merely paying lip service to good service. If they reward agents based on customer satisfaction
ratings the businesses will increase agent engagement and retention at the same time as
improving the service offered to customers
• Give the contact center leadership a chance to share the feedback gathered across the other
lines of business, because it should be clear to all that every person in the business, even the
back office, impacts the customer experience.
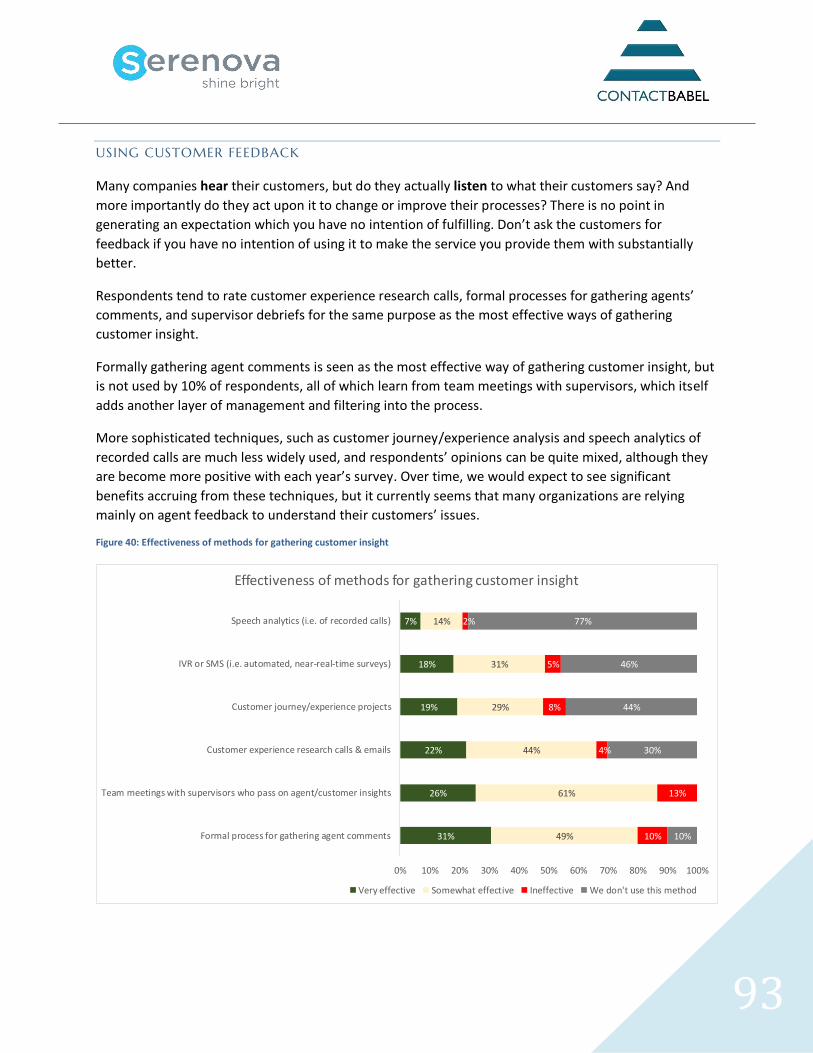
93
USING CUSTOMER FEEDBACK
Many companies hear their customers, but do they actually listen to what their customers say? And
more importantly do they act upon it to change or improve their processes? There is no point in
generating an expectation which you have no intention of fulfilling. Don’t ask the customers for
feedback if you have no intention of using it to make the service you provide them with substantially
better.
Respondents tend to rate customer experience research calls, formal processes for gathering agents’
comments, and supervisor debriefs for the same purpose as the most effective ways of gathering
customer insight.
Formally gathering agent comments is seen as the most effective way of gathering customer insight, but
is not used by 10% of respondents, all of which learn from team meetings with supervisors, which itself
adds another layer of management and filtering into the process.
More sophisticated techniques, such as customer journey/experience analysis and speech analytics of
recorded calls are much less widely used, and respondents’ opinions can be quite mixed, although they
are become more positive with each year’s survey. Over time, we would expect to see significant
benefits accruing from these techniques, but it currently seems that many organizations are relying
mainly on agent feedback to understand their customers’ issues.
Figure 40: Effectiveness of methods for gathering customer insight
31%
26%
22%
19%
18%
7%
49%
61%
44%
29%
31%
14%
10%
13%
4%
8%
5%
2%
10%
30%
44%
46%
77%
0% 10% 20% 30% 40% 50% 60% 70% 80% 90% 100%
Formal process for gathering agent comments
Team meetings with supervisors who pass on agent/customer insights
Customer experience research calls & emails
Customer journey/experience projects
IVR or SMS (i.e. automated, near-real-time surveys)
Speech analytics (i.e. of recorded calls)
Effectiveness of methods for gathering customer insight
Very effective Somewhat effective Ineffective We don't use this method
94
CUSTOMER JOURNEY ANALYTICS
Driven by the need to get beyond the siloed nature of multichannel interactions, customer journey
analytics aims to gather together the various data sources, triggered processes, and customer touch
points involved the customer interaction, in order to optimize the overall customer journey. By fully
understanding the customer experience, businesses can identify and rectify inefficiencies, helping to
break down the boundaries between channels and between the front office and the back office.
Customer journey analytics goes beyond the measurement of individual interactions and touchpoints.
Sophisticated analytics solutions use data inputs from multiple sources, both structured and
unstructured, in association with journey maps, which are produced by employees in multiple roles
within the organization who document how various processes currently work and how they could be
optimized.
McKinsey talks about the ‘moment of truth’ in customer interactions2, often occurring when the
customer has an unexpected problem or has a high emotional stake, when long-term loyalty and
customer advocacy can be won or lost depending on the outcome and the way in which it is handled.
Businesses and their representatives should be aware that these relatively rare occurrences offer great
opportunities. Recognizing and handling these moments of truth appropriately – moments which are
defined as such by the customer, not the business - will have a far greater long-term impact on
customer satisfaction and loyalty than the dozens of competently-handled, forgettable interactions that
may have happened previously. A business that has carried out customer journey analytics based upon
large quantities of real data has a much better understanding of when these moments of truth are likely
to emerge, and have the resources and capabilities in place to deal with them as they occur.
In the past few years, a widespread realization amongst businesses that the complexity of the customer
journey has increased in line with the number of new devices and channels available to customers to
communicate with the business has led to the initiation of customer journey projects, backed by new
management positions coming under the wider ‘Customer Experience’ banner.
This is particularly the case in larger contact center operations, where businesses are increasingly
looking at the effectiveness of back office processes that can impact upon whether the customer has to
contact the business multiple times.
Customer effort and engagement is very dependent upon effectiveness by which channels work
together, as well as the level of first-time contact resolution. Proactively engaging the customer at the
appropriate time within the customer journey has an opportunity to reduce the effort required for the
customer to fulfil their interaction completely. As part of a wider omnichannel engagement, businesses
must seek to understand how and why customers prefer to engage with them, optimizing the flow of
information throughout any connected processes and channels so that the organization becomes easy
to do business with.
2 http://www.mckinsey.com/business-functions/organization/our-insights/the-moment-of-truth-in-customer-
service
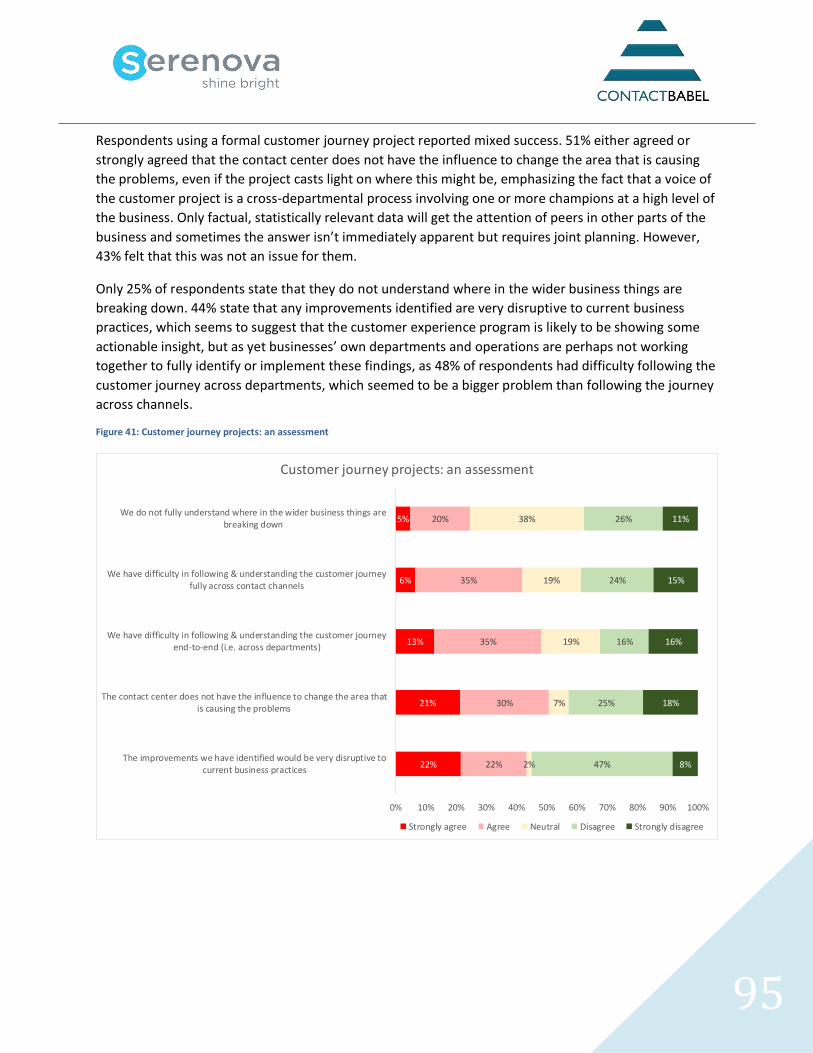
95
Respondents using a formal customer journey project reported mixed success. 51% either agreed or
strongly agreed that the contact center does not have the influence to change the area that is causing
the problems, even if the project casts light on where this might be, emphasizing the fact that a voice of
the customer project is a cross-departmental process involving one or more champions at a high level of
the business. Only factual, statistically relevant data will get the attention of peers in other parts of the
business and sometimes the answer isn’t immediately apparent but requires joint planning. However,
43% felt that this was not an issue for them.
Only 25% of respondents state that they do not understand where in the wider business things are
breaking down. 44% state that any improvements identified are very disruptive to current business
practices, which seems to suggest that the customer experience program is likely to be showing some
actionable insight, but as yet businesses’ own departments and operations are perhaps not working
together to fully identify or implement these findings, as 48% of respondents had difficulty following the
customer journey across departments, which seemed to be a bigger problem than following the journey
across channels.
Figure 41: Customer journey projects: an assessment
22%
21%
13%
6%
5%
22%
30%
35%
35%
20%
2%
7%
19%
19%
38%
47%
25%
16%
24%
26%
8%
18%
16%
15%
11%
0% 10% 20% 30% 40% 50% 60% 70% 80% 90% 100%
The improvements we have identified would be very disruptive tocurrent business practices
The contact center does not have the influence to change the area thatis causing the problems
We have difficulty in following & understanding the customer journeyend-to-end (i.e. across departments)
We have difficulty in following & understanding the customer journeyfully across contact channels
We do not fully understand where in the wider business things arebreaking down
Customer journey projects: an assessment
Strongly agree Agree Neutral Disagree Strongly disagree
96
Many solution providers refer to ‘the customer journey’ as one of the major places where analytics will
surely go in the longer term, once businesses have used analytics to handle shorter-term, more
operational issues.
There is an increasing requirement for, and interest in multichannel analytics, including email, text chat,
IVR and web browsing sessions, to get the full picture of the customer's real journey in a single
interaction, in order to identify and improve any channels that failed to fulfil their requirements.
Improving self-service optimization is often a quick win that can provide immediate economic benefit to
businesses: in the UK, a mean average of 9% of calls that go into an IVR system are 'zeroed-out' -
rejected by the customer in favor of an operator - and in the US, a staggering 26% fail the self-service
test.
Businesses using customer contact analytics to review these failed self-service sessions will be able to
categorize many of them in order to improve the processes at a macro-level. Common findings from the
analysis of these calls is that the IVR system was poorly worded, menu choices were not intuitive, or did
not match current service choices. Other failures occur through mistakes in IVR routing, and there may
also be problems with a lack of customer awareness that various activities can be carried out by self-
service.
Integrating desktop data analytics into speech analytics allows businesses to tag valuable data
automatically - such as account ID, product name and order value - from CRM, helpdesk and other
servicing applications to recorded interactions. This additional desktop data can be used to enhance
automated classification, which allows more targeted and efficient analysis centered on key business
issues, such as customer churn, differences in call handling patterns between employees, frequency of
holds/transfers associated with order cancellations and upselling and cross-selling success rates.
The use of desktop data analytics also allows the business to see what the agent is doing on the desktop
(for example, are they spending too much time in particular applications, are they navigating the screens
in the most efficient way, do they spend too much time on post-call wrap activities, etc.), and for them
to understand how much time is being spent in each section of the call.
The next step is to get rid of the silos between channels, allowing the customer to be identified at the
beginning of their ‘journey’, and for the business to be able to analyze the efficiency and effectiveness at
each stage, whether mobile app, website, self-service application or live call. The end goal is for
businesses to understand where customers make their choice, where they drop out, and where the
profit is within the multiple processes along the customer journey.
Longer-term, future customer contact is likely to become along polarized lines: for everyday, mundane
tasks, the customer will choose the website or mobile app for self-service, leaving the contact center to
deal with those interactions which are complex or emotive for the customer (as well as there being
demographics for whom the contact center will continue to be primary). With the website becoming the
first port-of-call for many customers, the analysis and understanding of the success (or otherwise) of
pre-call web activity is a valuable source of knowledge about how effective the main portal to the
business is being, as well as being able to give businesses greater insight into why people are calling.
97
Manually analyzing thousands of web sessions and linking them with specific customers and their phone
calls is impossible, so there is a great potential for multichannel analysis. Adding in growing channels
such as social media, web chat, SMS and email will make the mix more complex, and more potentially
suitable for analysis. It is also certainly worth mentioning that some solutions also analyze the
customer's pre-call use of self-service via IVR, providing the agent with a background on the caller's
recent experience and offering the chance to improve self-service process failures.
Including social media, email and text chat into the analytics equation is increasingly important, and
while many vendors have multichannel/omnichannel analytics within their overall customer contact
analytics solution, this functionality is not yet used to anywhere near the same extent as speech
analytics. This lack of uptake in multichannel analytics may have many reasons:
• the social media channel is often the responsibility of the marketing function within a business,
whereas customer contact analytics - being focused on speech at the moment - is usually under
the remit of the customer contact operation, meaning that harmonious, integrated analysis
across channels is that much more difficult
• for most businesses, interaction volumes for email, chat, social media and other non-voice
channels are far lower than for speech, so consequently there has been less urgency in analyzing
these
• there may not be a single unified view of the customers’ interactions across channels, as is the
case in a siloed operation
• it can be more difficult to understand customers’ context in social channels, as it requires
natural language processing tuned to social media for rich understanding of content
Having said that, most solution providers seem quite definite that omnichannel analytics will grow in
importance. While being able to optimize customer contact within each siloed channel, or being able to
monitor the quality of an email or chat agent in the same way that businesses are now using analytics to
improve the performance of a phone-based agent is useful, the real key is to include all of the stages
along the customer journey. For example, understanding where potential customers drop out; the
overall effort that the customer has to put in; the point at which buying decisions are made; bottlenecks
in processes; the suboptimal points where customers get confused and have to place a call into the
business - these are the promises that customer journey analysis makes.
Leading organizations are combining all data generated within a business and are able to cross-correlate
to provide insights not only to the customer contact department but also to parties such as marketing,
operations and finance, so they have greater insight about issues such as price elasticity and revenue
maximization. The ability to prove to senior management that the actions and insight held within the
contact center has a distinct and measurable impact on the entire company – and as such is not simply a
cost center - is likely to improve its visibility and credibility which should help to create a long-term
holistic view and assist further investment.
98
COMPLAINTS & CLOSED-LOOP
John Seddon uses the term “failure demand” to describe calls that are created by the inability of the
business’s systems to do something right for the customer:
“A failure to do something - turn up, call back, send something…causes the customer to make a
further demand on the system. A failure to do something right - not solve a problem, send out
forms that customers have difficulty with and so on - similarly create demand and creates extra
work. Failure demand is under the organization’s control, and it is a major form of sub-
optimization.”3
Seddon cites the instance of the bank where failure demand created almost half of the calls which they
had to deal with. Another classic example of failure demand is where emails go unanswered, leading to
calls being made (first-stage failure demand). Later, the email will be answered, unnecessarily, as the
customer already has their answer or has gone elsewhere (second-stage failure demand). This
redundant work will then impact on other (still live) messages in the email queue, creating a vicious
circle of failure demand. Redesigning and restructuring the way in which work flows around the
organization, putting the contact center at the heart of it, rather than treating it as a separate silo, will
go much of the way to reducing unnecessary contacts. The customer ends up getting a better service
from the whole company, not just the contact center.
One way in which this can be achieved is to unify and automate the agent desktop, bringing in the
relevant data automatically, depending on who the caller is and what they want. At the end of the call,
the correct data is written back to the relevant places, and the correct processes kicked off
automatically, meaning that the right departments will be provided with the right information, thus
reducing the risk of failure demand, unnecessary calls and irate customers. This also takes the pressure
off the agents to remember which systems to update and how to navigate through them within the call
(which causes long delays, negatively impacting customer satisfaction), or in the wrap-up, which risks
agent forgetting to do things, and also decreases agent availability, increasing the queue length, and
decreasing customer satisfaction. In cases where multiple processes have to happen in order for the
customer’s requirement to be met, automated outbound messaging to the customer, whether by email,
SMS or IVR is likely to reduce the number of follow-up contacts that the customer feels that they have to
make.
Information on failure demand can be gleaned from the contact center, which can also hold huge
amounts of knowledge about what customers’ views of the products, services, competitors and
company are. Feedback loops will be established in leading contact centers to push information and
insights upwards to those who can make a difference in product development, process improvements
and customer strategies. Interaction analytics offers businesses the chance to mine huge amounts of
data and find patterns and reasons in a timely fashion, and it is vital then to act upon this knowledge,
proving to both customers and agents that the business takes them seriously.
3 Freedom from Command and Control: A better way to make the work, work, John Seddon
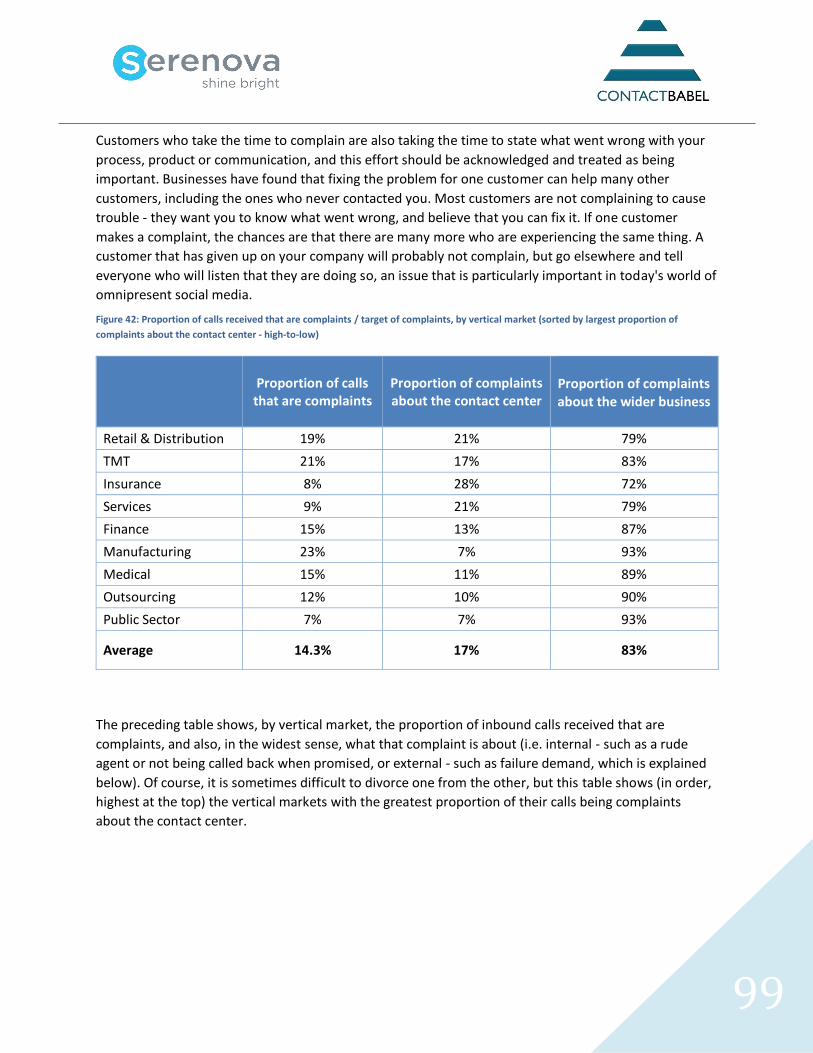
99
Customers who take the time to complain are also taking the time to state what went wrong with your
process, product or communication, and this effort should be acknowledged and treated as being
important. Businesses have found that fixing the problem for one customer can help many other
customers, including the ones who never contacted you. Most customers are not complaining to cause
trouble - they want you to know what went wrong, and believe that you can fix it. If one customer
makes a complaint, the chances are that there are many more who are experiencing the same thing. A
customer that has given up on your company will probably not complain, but go elsewhere and tell
everyone who will listen that they are doing so, an issue that is particularly important in today's world of
omnipresent social media.
Figure 42: Proportion of calls received that are complaints / target of complaints, by vertical market (sorted by largest proportion of
complaints about the contact center - high-to-low)
Proportion of calls that are complaints
Proportion of complaints about the contact center
Proportion of complaints about the wider business
Retail & Distribution 19% 21% 79%
TMT 21% 17% 83%
Insurance 8% 28% 72%
Services 9% 21% 79%
Finance 15% 13% 87%
Manufacturing 23% 7% 93%
Medical 15% 11% 89%
Outsourcing 12% 10% 90%
Public Sector 7% 7% 93%
Average 14.3% 17% 83%
The preceding table shows, by vertical market, the proportion of inbound calls received that are
complaints, and also, in the widest sense, what that complaint is about (i.e. internal - such as a rude
agent or not being called back when promised, or external - such as failure demand, which is explained
below). Of course, it is sometimes difficult to divorce one from the other, but this table shows (in order,
highest at the top) the vertical markets with the greatest proportion of their calls being complaints
about the contact center.
100
The majority of complaints received by a contact center are not about the contact center itself (or its
staff), but rather ‘failure demand’, caused by a breakdown of process elsewhere in the organization.
However, the contact center has to deal with the dirty work, and further failures within the complaints
procedure (or lack of it) can see customers calling into the contact center again and again, becoming
more irate each time, despite the real problem lying outside the contact center. There is also the case
that there is a blurring of responsibility between the contact center and the rest of the business so that
lines of demarcation over where the fault lies can be difficult to find. For example, a telecoms provider
that has taken an order for a new line has to rely on the rest of the organization to provision and deliver
this correctly. If the agent takes the contact email down incorrectly, the customer will not receive any
information about their order, which may have a query on it. When the irate customer rings in to
complain, the problem may appear to be with the back-office processes where the order has halted, but
the fault actually lay with the agent. Whether this is tracked or reported on correctly is not a certainty,
so the split above between contact center / back-office complaints should be treated with caution.
There is also a real risk, especially within large contact centers, that a single agent does not have the
capability or responsibility to deal with the customer’s issue, which may reach across various internal
departments (e.g. finance, billing, provisioning and technical support), none of which will (or can) take
responsibility for sorting out the problem.
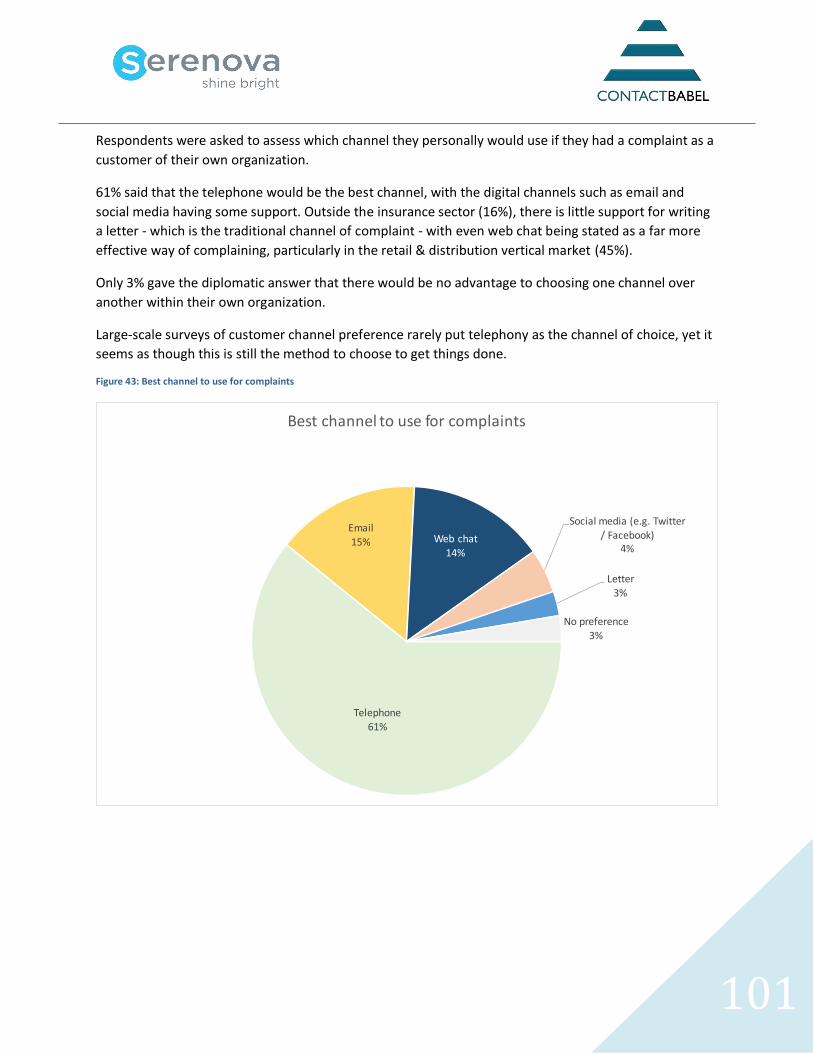
101
Respondents were asked to assess which channel they personally would use if they had a complaint as a
customer of their own organization.
61% said that the telephone would be the best channel, with the digital channels such as email and
social media having some support. Outside the insurance sector (16%), there is little support for writing
a letter - which is the traditional channel of complaint - with even web chat being stated as a far more
effective way of complaining, particularly in the retail & distribution vertical market (45%).
Only 3% gave the diplomatic answer that there would be no advantage to choosing one channel over
another within their own organization.
Large-scale surveys of customer channel preference rarely put telephony as the channel of choice, yet it
seems as though this is still the method to choose to get things done.
Figure 43: Best channel to use for complaints
Telephone61%
Email15% Web chat
14%
Social media (e.g. Twitter
/ Facebook)4%
Letter3%
No preference3%
Best channel to use for complaints
102
MAXIMIZING EFFICIENCY AND AGENT OPTIMIZATION
Improving call throughput and decreasing costs has been a focus of most contact centers since the
industry started, and few solutions or processes are considered without understanding how they will
affect productivity.
This section looks at ways in which contact centers can make the most of what they've got, through
increasing efficiency, or by avoiding unnecessary calls in the first place. Solutions and issues include:
• Contact center performance metrics
• Alternative ways of working - virtualization and homeworking
• The enterprise-wide contact center
• IP and convergence
• Voice biometrics
• Call routing and queue management
• Workforce management
• Headsets.
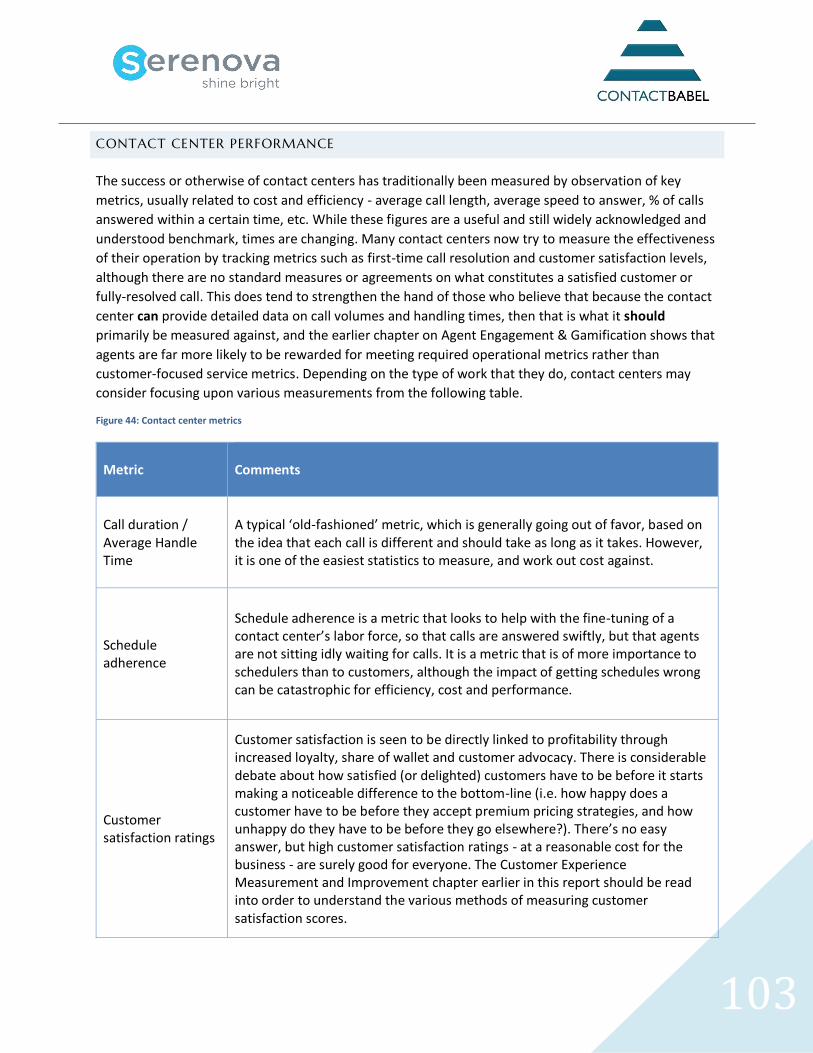
103
CONTACT CENTER PERFORMANCE
The success or otherwise of contact centers has traditionally been measured by observation of key
metrics, usually related to cost and efficiency - average call length, average speed to answer, % of calls
answered within a certain time, etc. While these figures are a useful and still widely acknowledged and
understood benchmark, times are changing. Many contact centers now try to measure the effectiveness
of their operation by tracking metrics such as first-time call resolution and customer satisfaction levels,
although there are no standard measures or agreements on what constitutes a satisfied customer or
fully-resolved call. This does tend to strengthen the hand of those who believe that because the contact
center can provide detailed data on call volumes and handling times, then that is what it should
primarily be measured against, and the earlier chapter on Agent Engagement & Gamification shows that
agents are far more likely to be rewarded for meeting required operational metrics rather than
customer-focused service metrics. Depending on the type of work that they do, contact centers may
consider focusing upon various measurements from the following table.
Figure 44: Contact center metrics
Metric Comments
Call duration / Average Handle Time
A typical ‘old-fashioned’ metric, which is generally going out of favor, based on the idea that each call is different and should take as long as it takes. However, it is one of the easiest statistics to measure, and work out cost against.
Schedule adherence
Schedule adherence is a metric that looks to help with the fine-tuning of a contact center’s labor force, so that calls are answered swiftly, but that agents are not sitting idly waiting for calls. It is a metric that is of more importance to schedulers than to customers, although the impact of getting schedules wrong can be catastrophic for efficiency, cost and performance.
Customer satisfaction ratings
Customer satisfaction is seen to be directly linked to profitability through increased loyalty, share of wallet and customer advocacy. There is considerable debate about how satisfied (or delighted) customers have to be before it starts making a noticeable difference to the bottom-line (i.e. how happy does a customer have to be before they accept premium pricing strategies, and how unhappy do they have to be before they go elsewhere?). There’s no easy answer, but high customer satisfaction ratings - at a reasonable cost for the business - are surely good for everyone. The Customer Experience Measurement and Improvement chapter earlier in this report should be read into order to understand the various methods of measuring customer satisfaction scores.
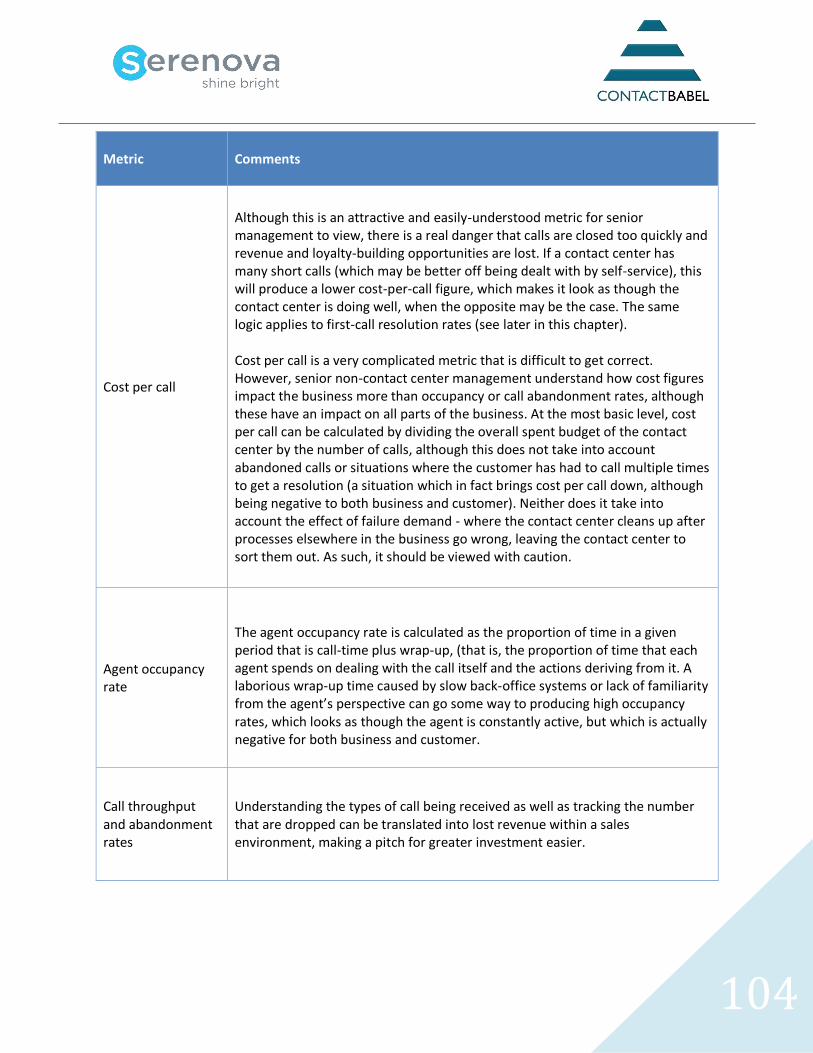
104
Metric Comments
Cost per call
Although this is an attractive and easily-understood metric for senior management to view, there is a real danger that calls are closed too quickly and revenue and loyalty-building opportunities are lost. If a contact center has many short calls (which may be better off being dealt with by self-service), this will produce a lower cost-per-call figure, which makes it look as though the contact center is doing well, when the opposite may be the case. The same logic applies to first-call resolution rates (see later in this chapter). Cost per call is a very complicated metric that is difficult to get correct. However, senior non-contact center management understand how cost figures impact the business more than occupancy or call abandonment rates, although these have an impact on all parts of the business. At the most basic level, cost per call can be calculated by dividing the overall spent budget of the contact center by the number of calls, although this does not take into account abandoned calls or situations where the customer has had to call multiple times to get a resolution (a situation which in fact brings cost per call down, although being negative to both business and customer). Neither does it take into account the effect of failure demand - where the contact center cleans up after processes elsewhere in the business go wrong, leaving the contact center to sort them out. As such, it should be viewed with caution.
Agent occupancy rate
The agent occupancy rate is calculated as the proportion of time in a given period that is call-time plus wrap-up, (that is, the proportion of time that each agent spends on dealing with the call itself and the actions deriving from it. A laborious wrap-up time caused by slow back-office systems or lack of familiarity from the agent’s perspective can go some way to producing high occupancy rates, which looks as though the agent is constantly active, but which is actually negative for both business and customer.
Call throughput and abandonment rates
Understanding the types of call being received as well as tracking the number that are dropped can be translated into lost revenue within a sales environment, making a pitch for greater investment easier.
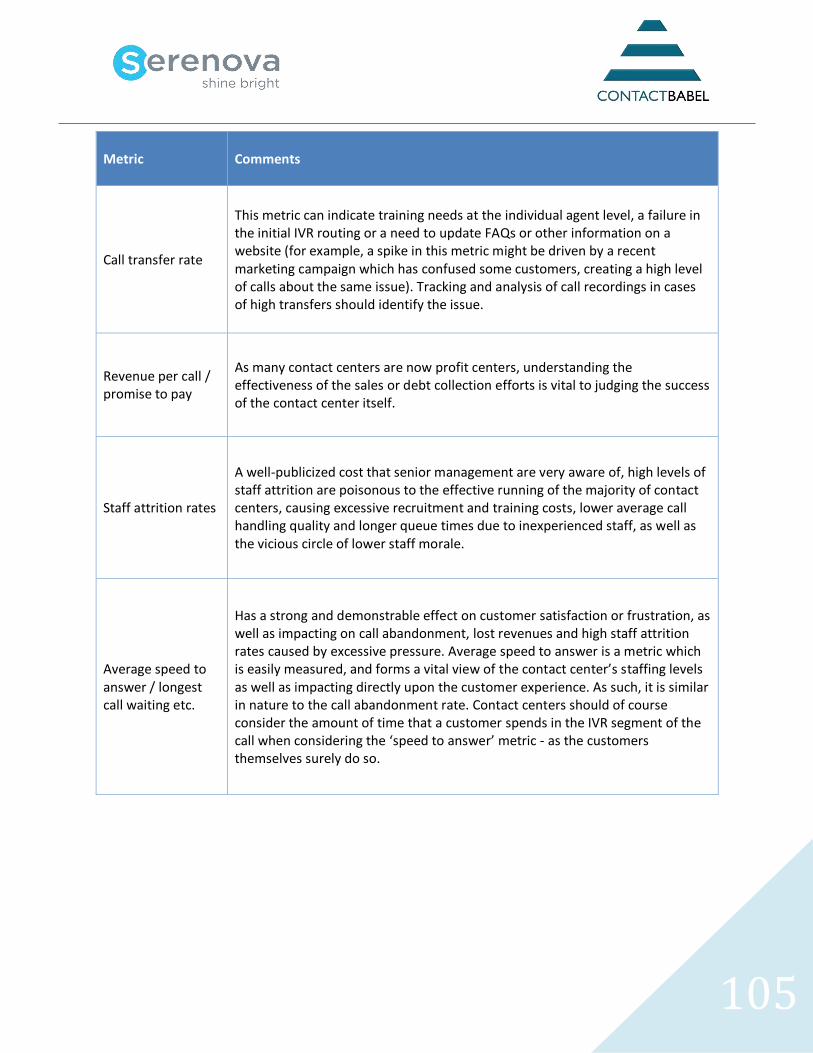
105
Metric Comments
Call transfer rate
This metric can indicate training needs at the individual agent level, a failure in the initial IVR routing or a need to update FAQs or other information on a website (for example, a spike in this metric might be driven by a recent marketing campaign which has confused some customers, creating a high level of calls about the same issue). Tracking and analysis of call recordings in cases of high transfers should identify the issue.
Revenue per call / promise to pay
As many contact centers are now profit centers, understanding the effectiveness of the sales or debt collection efforts is vital to judging the success of the contact center itself.
Staff attrition rates
A well-publicized cost that senior management are very aware of, high levels of staff attrition are poisonous to the effective running of the majority of contact centers, causing excessive recruitment and training costs, lower average call handling quality and longer queue times due to inexperienced staff, as well as the vicious circle of lower staff morale.
Average speed to answer / longest call waiting etc.
Has a strong and demonstrable effect on customer satisfaction or frustration, as well as impacting on call abandonment, lost revenues and high staff attrition rates caused by excessive pressure. Average speed to answer is a metric which is easily measured, and forms a vital view of the contact center’s staffing levels as well as impacting directly upon the customer experience. As such, it is similar in nature to the call abandonment rate. Contact centers should of course consider the amount of time that a customer spends in the IVR segment of the call when considering the ‘speed to answer’ metric - as the customers themselves surely do so.
106
Metric Comments
Customer loyalty / lifetime value / churn rates
A central thought of CRM is that a business should focus upon keeping profitable customers, and growing unprofitable ones. A single figure for customer retention is not effective, as it does not include the types of customer churn, or the undesirability (or otherwise) of losing such customers.
First call resolution
Improving first call resolution (FCR) benefits customers (who are more happy / loyal / profitable / etc.); agents (higher morale; fewer frustrating calls); and business (lower cost of repeated calls; higher profitability): everyone wins. This can be very hard to measure, as it is the customer, and not the contact center that should be stating whether the issue has been resolved successfully. There is more detail on the use and effectiveness of first call resolution methods later in this chapter.
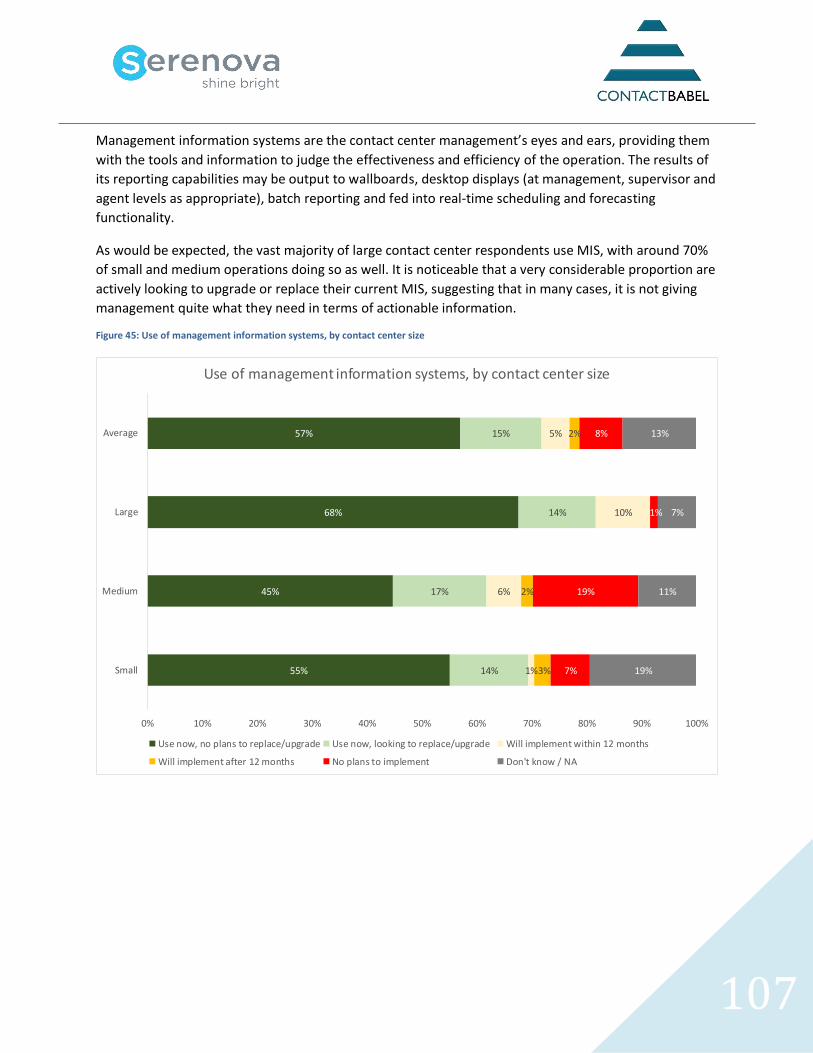
107
Management information systems are the contact center management’s eyes and ears, providing them
with the tools and information to judge the effectiveness and efficiency of the operation. The results of
its reporting capabilities may be output to wallboards, desktop displays (at management, supervisor and
agent levels as appropriate), batch reporting and fed into real-time scheduling and forecasting
functionality.
As would be expected, the vast majority of large contact center respondents use MIS, with around 70%
of small and medium operations doing so as well. It is noticeable that a very considerable proportion are
actively looking to upgrade or replace their current MIS, suggesting that in many cases, it is not giving
management quite what they need in terms of actionable information.
Figure 45: Use of management information systems, by contact center size
55%
45%
68%
57%
14%
17%
14%
15%
1%
6%
10%
5%
3%
2%
2%
7%
19%
1%
8%
19%
11%
7%
13%
0% 10% 20% 30% 40% 50% 60% 70% 80% 90% 100%
Small
Medium
Large
Average
Use of management information systems, by contact center size
Use now, no plans to replace/upgrade Use now, looking to replace/upgrade Will implement within 12 months
Will implement after 12 months No plans to implement Don't know / NA
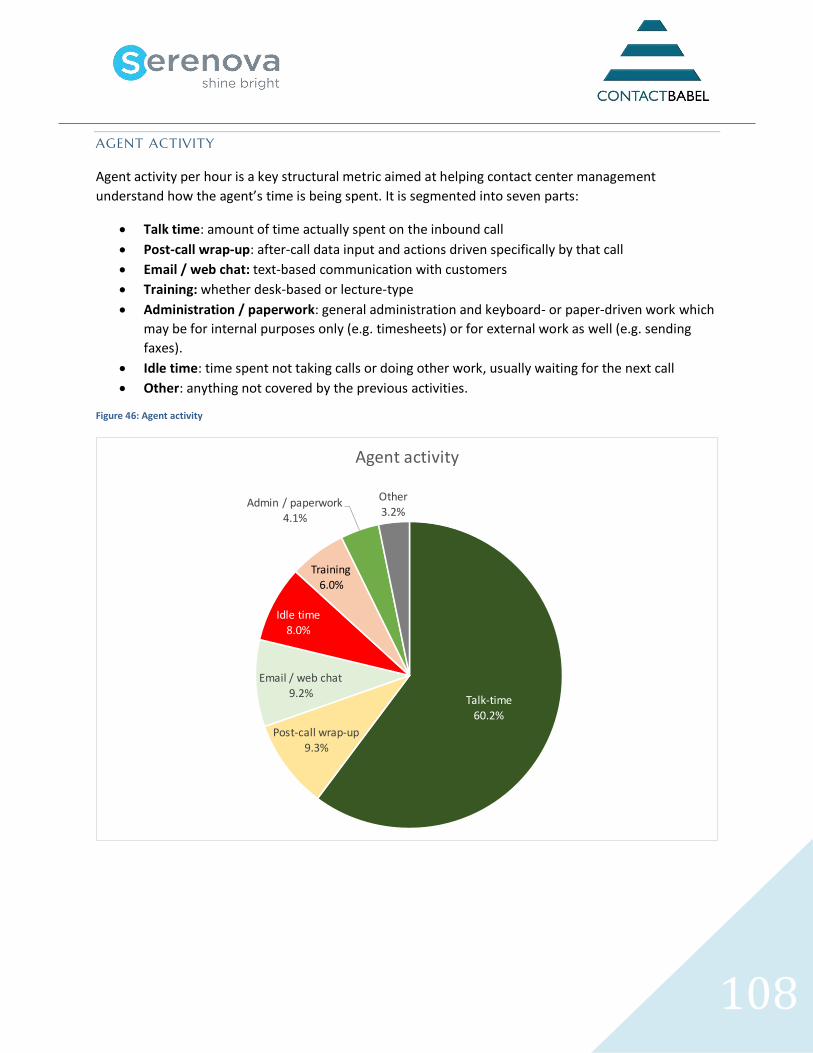
108
AGENT ACTIVITY
Agent activity per hour is a key structural metric aimed at helping contact center management
understand how the agent’s time is being spent. It is segmented into seven parts:
• Talk time: amount of time actually spent on the inbound call
• Post-call wrap-up: after-call data input and actions driven specifically by that call
• Email / web chat: text-based communication with customers
• Training: whether desk-based or lecture-type
• Administration / paperwork: general administration and keyboard- or paper-driven work which
may be for internal purposes only (e.g. timesheets) or for external work as well (e.g. sending
faxes).
• Idle time: time spent not taking calls or doing other work, usually waiting for the next call
• Other: anything not covered by the previous activities.
Figure 46: Agent activity
Talk-time
60.2%
Post-call wrap-up9.3%
Email / web chat9.2%
Idle time8.0%
Training6.0%
Admin / paperwork4.1%
Other3.2%
Agent activity
109
Talk time rises slightly to 60% this year, with post-call wrap-up steady again at under 10%. The relative
proportions of activities remain very stable, and have done so for some years, and it will be interesting
to see if these figures have now reached a point of relative stability. Taking into account email and web
chat handling time as well, the overall agent/customer communication time is close to 70%. Post-call
wrap-up seems to be remaining steady at around 9-10%, and the figure for idle time has decreased to an
unprecedented 8%.
The identification of idle time is one thing: being able to recover unproductive time in the agent’s daily
routine and use this otherwise-lost capacity is quite another. A workforce management solution that has
intraday capabilities can recover these small pockets of fragmented agent idle time as the day goes on,
aggregating this time into larger blocks that can be allocated to other productive activities such as
training, coaching, back office tasks or administration, which goes a long way towards using the agent
time that businesses necessarily pay for already, but which could not previously be accessed.
There is also a significant opportunity for reducing the non-productive call time at the beginning of the
call, where an agent is authenticating the caller’s identity. By doing this automatically, either through
IVR or more securely, through biometric identification, the business can free up 30 seconds or more of
agent time, which makes a big difference to call and queue lengths. This element is investigated in-
depth in the ‘Customer Identity Verification’ section later in this report.
Post-call wrap-up time is also an area which could further be reduced in many contact centers. There are
many applications in the market which are capable of reducing the amount of after-call work that an
agent has to do by bringing together all of the systems and applications the agent needs on that specific
call into a single virtual application and then updating the relevant databases accordingly. This removes
the need for a specialist knowledge of legacy system navigation, reducing keying errors and dramatically
shortening wrap-time through kicking off relevant back-office processes automatically. Most of these
agent desktop optimizers do not touch the logic of the existing systems, but act as a user interface that
picks up and presents the relevant fields and business processes at the right time. There is further detail
on how this can be achieved in the ‘Desktop Automation & Analytics’ chapter.
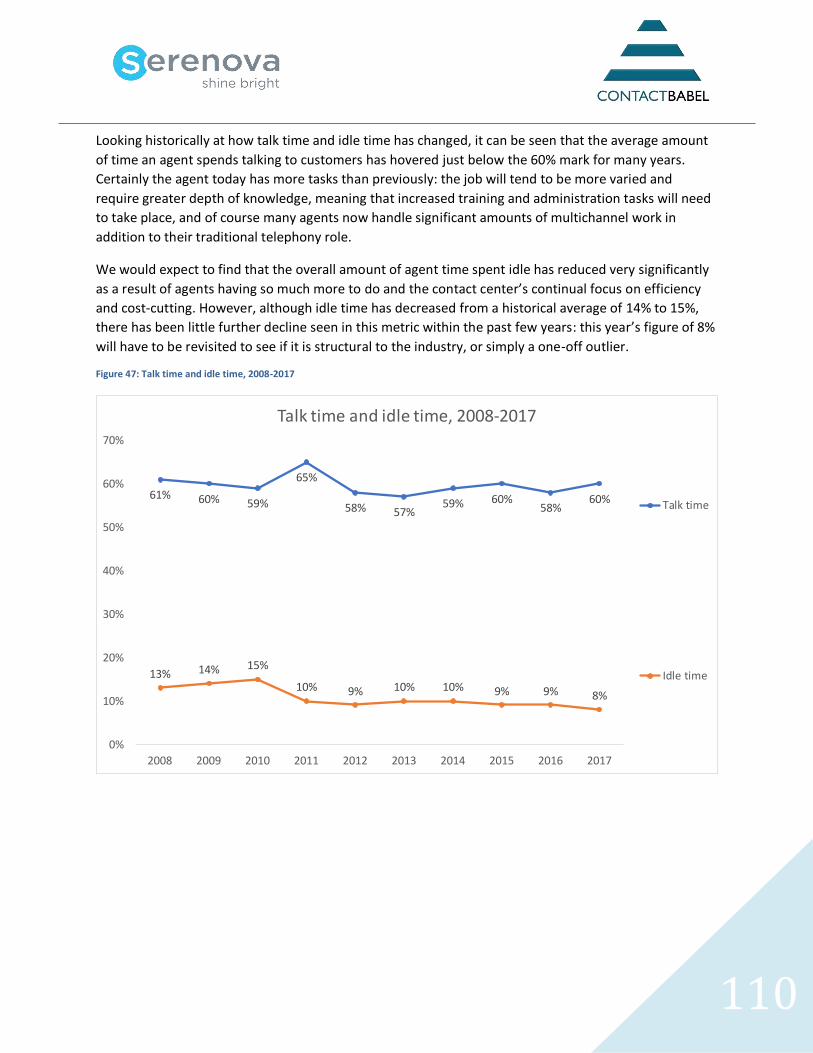
110
Looking historically at how talk time and idle time has changed, it can be seen that the average amount
of time an agent spends talking to customers has hovered just below the 60% mark for many years.
Certainly the agent today has more tasks than previously: the job will tend to be more varied and
require greater depth of knowledge, meaning that increased training and administration tasks will need
to take place, and of course many agents now handle significant amounts of multichannel work in
addition to their traditional telephony role.
We would expect to find that the overall amount of agent time spent idle has reduced very significantly
as a result of agents having so much more to do and the contact center’s continual focus on efficiency
and cost-cutting. However, although idle time has decreased from a historical average of 14% to 15%,
there has been little further decline seen in this metric within the past few years: this year’s figure of 8%
will have to be revisited to see if it is structural to the industry, or simply a one-off outlier.
Figure 47: Talk time and idle time, 2008-2017
61% 60% 59%
65%
58% 57%59% 60%
58%60%
13% 14% 15%
10% 9% 10% 10% 9% 9% 8%
0%
10%
20%
30%
40%
50%
60%
70%
2008 2009 2010 2011 2012 2013 2014 2015 2016 2017
Talk time and idle time, 2008-2017
Talk time
Idle time
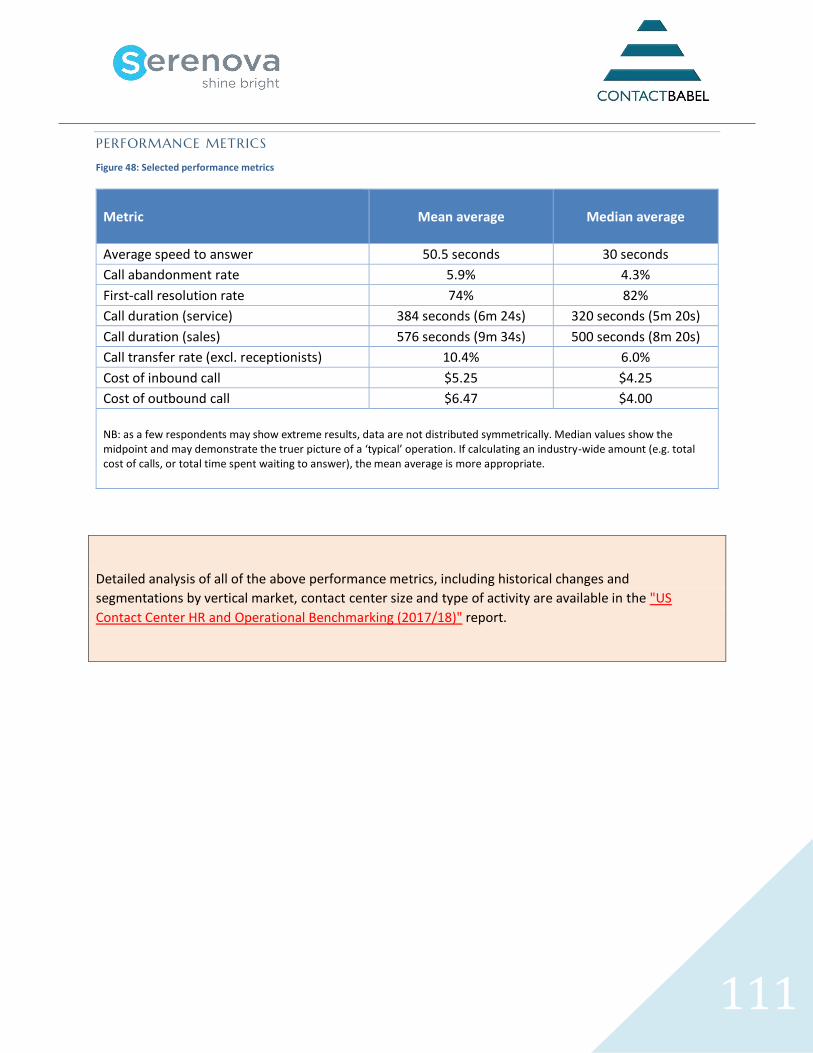
111
PERFORMANCE METRICS
Figure 48: Selected performance metrics
Metric
Mean average Median average
Average speed to answer 50.5 seconds 30 seconds
Call abandonment rate 5.9% 4.3%
First-call resolution rate 74% 82%
Call duration (service) 384 seconds (6m 24s) 320 seconds (5m 20s)
Call duration (sales) 576 seconds (9m 34s) 500 seconds (8m 20s)
Call transfer rate (excl. receptionists) 10.4% 6.0%
Cost of inbound call $5.25 $4.25
Cost of outbound call $6.47 $4.00
NB: as a few respondents may show extreme results, data are not distributed symmetrically. Median values show the midpoint and may demonstrate the truer picture of a ‘typical’ operation. If calculating an industry-wide amount (e.g. total cost of calls, or total time spent waiting to answer), the mean average is more appropriate.
Detailed analysis of all of the above performance metrics, including historical changes and
segmentations by vertical market, contact center size and type of activity are available in the "US
Contact Center HR and Operational Benchmarking (2017/18)" report.
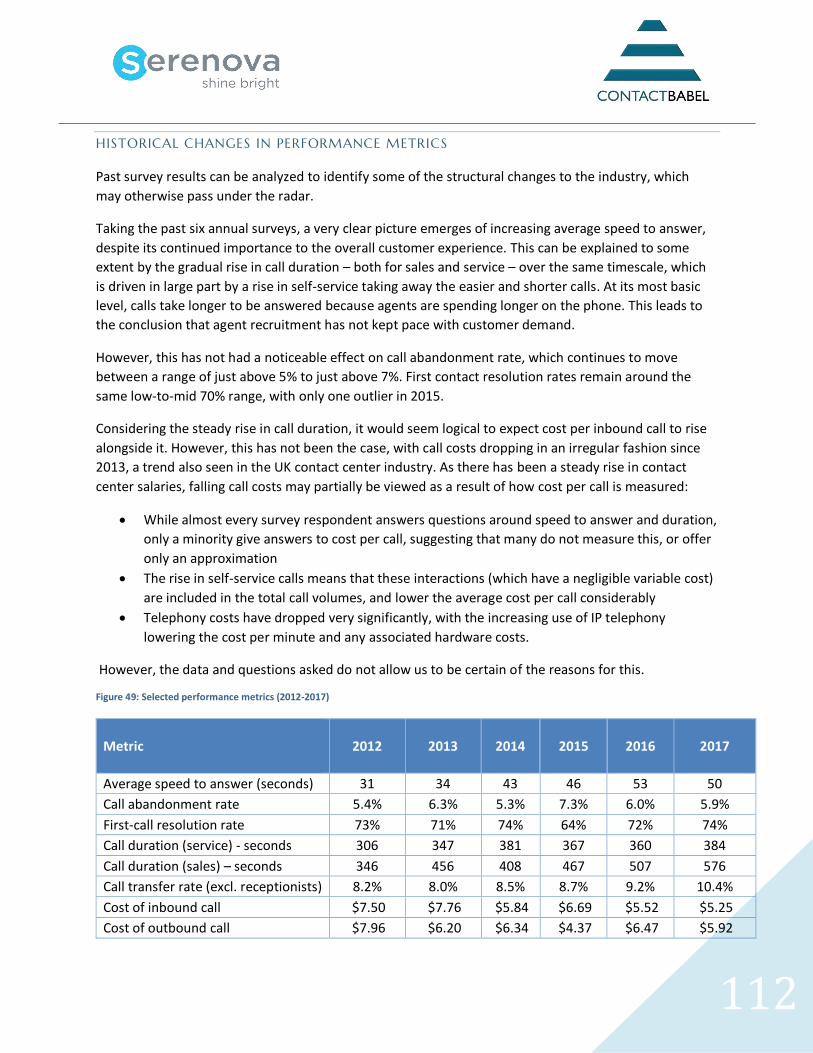
112
HISTORICAL CHANGES IN PERFORMANCE METRICS
Past survey results can be analyzed to identify some of the structural changes to the industry, which
may otherwise pass under the radar.
Taking the past six annual surveys, a very clear picture emerges of increasing average speed to answer,
despite its continued importance to the overall customer experience. This can be explained to some
extent by the gradual rise in call duration – both for sales and service – over the same timescale, which
is driven in large part by a rise in self-service taking away the easier and shorter calls. At its most basic
level, calls take longer to be answered because agents are spending longer on the phone. This leads to
the conclusion that agent recruitment has not kept pace with customer demand.
However, this has not had a noticeable effect on call abandonment rate, which continues to move
between a range of just above 5% to just above 7%. First contact resolution rates remain around the
same low-to-mid 70% range, with only one outlier in 2015.
Considering the steady rise in call duration, it would seem logical to expect cost per inbound call to rise
alongside it. However, this has not been the case, with call costs dropping in an irregular fashion since
2013, a trend also seen in the UK contact center industry. As there has been a steady rise in contact
center salaries, falling call costs may partially be viewed as a result of how cost per call is measured:
• While almost every survey respondent answers questions around speed to answer and duration,
only a minority give answers to cost per call, suggesting that many do not measure this, or offer
only an approximation
• The rise in self-service calls means that these interactions (which have a negligible variable cost)
are included in the total call volumes, and lower the average cost per call considerably
• Telephony costs have dropped very significantly, with the increasing use of IP telephony
lowering the cost per minute and any associated hardware costs.
However, the data and questions asked do not allow us to be certain of the reasons for this.
Figure 49: Selected performance metrics (2012-2017)
Metric
2012 2013 2014 2015 2016 2017
Average speed to answer (seconds) 31 34 43 46 53 50
Call abandonment rate 5.4% 6.3% 5.3% 7.3% 6.0% 5.9%
First-call resolution rate 73% 71% 74% 64% 72% 74%
Call duration (service) - seconds 306 347 381 367 360 384
Call duration (sales) – seconds 346 456 408 467 507 576
Call transfer rate (excl. receptionists) 8.2% 8.0% 8.5% 8.7% 9.2% 10.4%
Cost of inbound call $7.50 $7.76 $5.84 $6.69 $5.52 $5.25
Cost of outbound call $7.96 $6.20 $6.34 $4.37 $6.47 $5.92
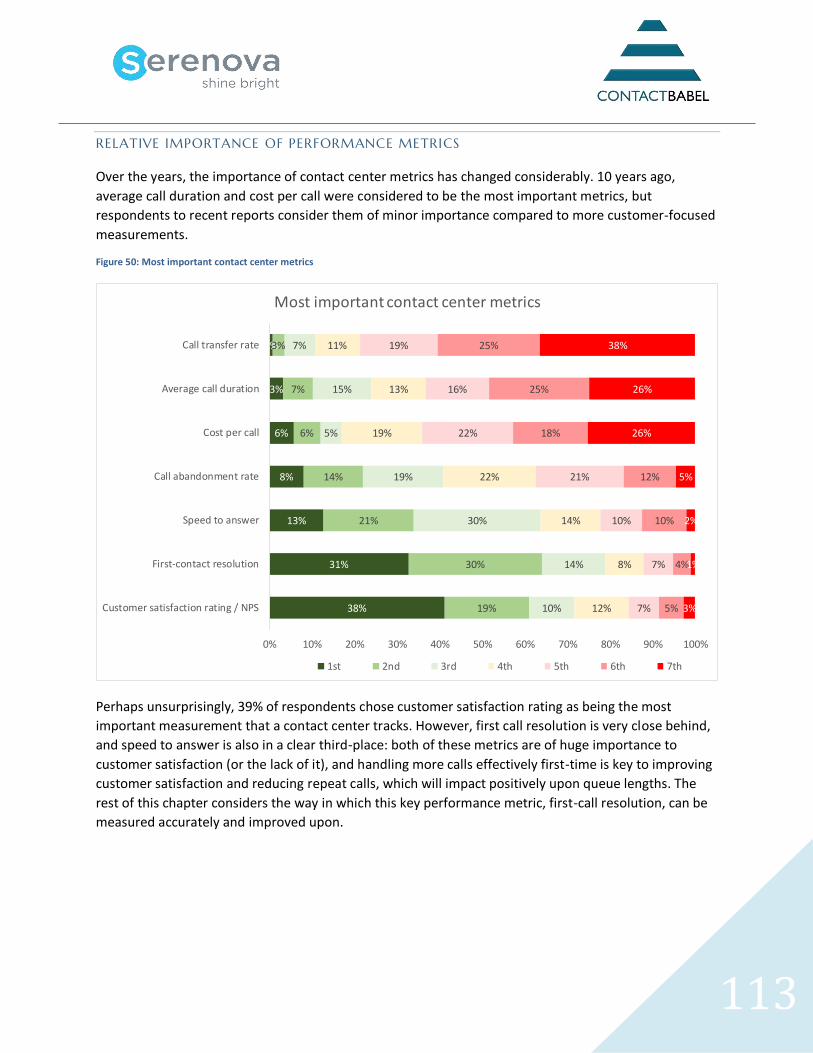
113
RELATIVE IMPORTANCE OF PERFORMANCE METRICS
Over the years, the importance of contact center metrics has changed considerably. 10 years ago,
average call duration and cost per call were considered to be the most important metrics, but
respondents to recent reports consider them of minor importance compared to more customer-focused
measurements.
Figure 50: Most important contact center metrics
Perhaps unsurprisingly, 39% of respondents chose customer satisfaction rating as being the most
important measurement that a contact center tracks. However, first call resolution is very close behind,
and speed to answer is also in a clear third-place: both of these metrics are of huge importance to
customer satisfaction (or the lack of it), and handling more calls effectively first-time is key to improving
customer satisfaction and reducing repeat calls, which will impact positively upon queue lengths. The
rest of this chapter considers the way in which this key performance metric, first-call resolution, can be
measured accurately and improved upon.
38%
31%
13%
8%
6%
3%
1%
19%
30%
21%
14%
6%
7%
3%
10%
14%
30%
19%
5%
15%
7%
12%
8%
14%
22%
19%
13%
11%
7%
7%
10%
21%
22%
16%
19%
5%
4%
10%
12%
18%
25%
25%
3%
1%
2%
5%
26%
26%
38%
0% 10% 20% 30% 40% 50% 60% 70% 80% 90% 100%
Customer satisfaction rating / NPS
First-contact resolution
Speed to answer
Call abandonment rate
Cost per call
Average call duration
Call transfer rate
Most important contact center metrics
1st 2nd 3rd 4th 5th 6th 7th
114
THE ROLE OF FIRST-CONTACT RESOLUTION
For most businesses, there is no fixed agreement on what a successful contact center looks like: even in
similar industries, around half of businesses state that a contact center is a strategic asset, with the
other half seeing it as an operational cost center. Contact center managers are tasked to balance factors
such as cost, efficiency, staff morale and attrition, call quality, customer satisfaction and revenue - some
of which may be mutually antagonistic - in a constantly-changing environment where there is limited
opportunity for reflection. Often these contact centers exist on a virtual island away from the rest of the
business, not just geographically, but logically as well. Although they belong to the business, and
constantly receive insights about other parts of the operation, they may not have the ability to provide
actionable insight either for their own benefit or for other departments.
Having said that, most of the contact center world has moved on from the ruthless focus on call
throughput and call duration that characterized many operations a decade ago. A major question being
asked today is, “How do contact centers attempt to measure the most important metric of all - first-
contact resolution?” (First-contact’ resolution differs slightly from ‘first-call’ resolution, in that it includes
email, web chat and other non-voice channels as well. In reality though, non-voice resolution rates are
much less commonly measured).
It can be stated with some confidence that first-contact resolution is seen as the key to a successful
contact center: while the previous chart shows that customer satisfaction rating is the most important
metric, 76% of the report’s respondents place first-contact resolution as being one of the top 3 metrics
that are most influential on customer satisfaction, with 38% stating it as being no.1: in effect, far more
important than any other metric. (The section of the report on ‘Customer Experience Measurement &
Improvement’ gives more detail). So, logically it seems that to improve customer satisfaction, a business
has to improve first contact resolution rates.
The ability to understand a query and deal with it in a reasonable timeframe at the first time of asking is
the key to a contact center’s success, reducing the overall number of contacts while providing the
customer with a good experience which will impact on the company’s overall performance. It also has a
positive effect on the agent’s morale (and thus, staff attrition rates), and increases the chances of a
successful cross-sell and up-sell being made. Little wonder that the first-contact resolution metric has
grown hugely in importance, but it can be problematic to quantify accurately. This risks the metric being
downplayed, especially as it is not simply a matter of producing a monthly report from ACD statistics.
First-contact resolution rates are not simple to understand, but have to be viewed in context. An
improving business may well see its FCR rate actually decline after it implements process improvements,
which is counter-intuitive, but if the business had been handling live calls that were more suited to self-
service or avoidable through better marketing communications, getting rid of these ‘easy’ calls entirely
will make the FCR rate decline. If many calls are about the same issue, and are answered quickly and
accurately, it improves FCR rates, but of course piles up cost and impacts negatively upon other
performance metrics, such as queue length and call abandonment rate.
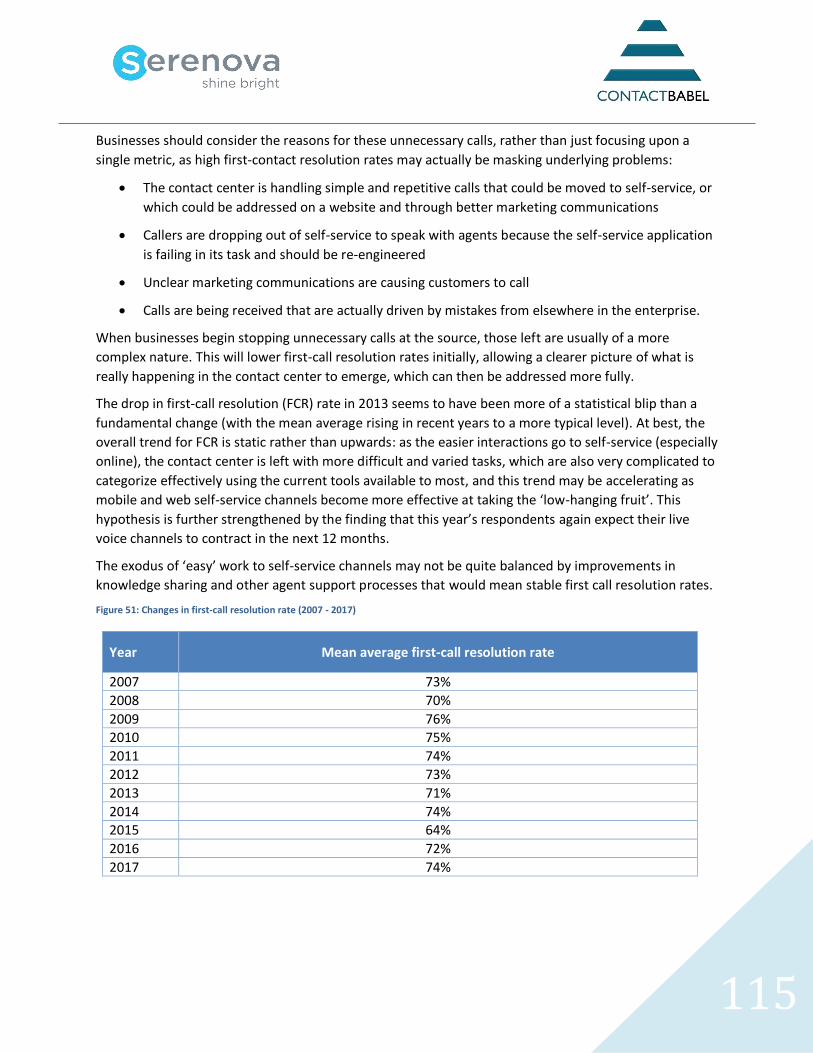
115
Businesses should consider the reasons for these unnecessary calls, rather than just focusing upon a
single metric, as high first-contact resolution rates may actually be masking underlying problems:
• The contact center is handling simple and repetitive calls that could be moved to self-service, or
which could be addressed on a website and through better marketing communications
• Callers are dropping out of self-service to speak with agents because the self-service application
is failing in its task and should be re-engineered
• Unclear marketing communications are causing customers to call
• Calls are being received that are actually driven by mistakes from elsewhere in the enterprise.
When businesses begin stopping unnecessary calls at the source, those left are usually of a more
complex nature. This will lower first-call resolution rates initially, allowing a clearer picture of what is
really happening in the contact center to emerge, which can then be addressed more fully.
The drop in first-call resolution (FCR) rate in 2013 seems to have been more of a statistical blip than a
fundamental change (with the mean average rising in recent years to a more typical level). At best, the
overall trend for FCR is static rather than upwards: as the easier interactions go to self-service (especially
online), the contact center is left with more difficult and varied tasks, which are also very complicated to
categorize effectively using the current tools available to most, and this trend may be accelerating as
mobile and web self-service channels become more effective at taking the ‘low-hanging fruit’. This
hypothesis is further strengthened by the finding that this year’s respondents again expect their live
voice channels to contract in the next 12 months.
The exodus of ‘easy’ work to self-service channels may not be quite balanced by improvements in
knowledge sharing and other agent support processes that would mean stable first call resolution rates.
Figure 51: Changes in first-call resolution rate (2007 - 2017)
Year Mean average first-call resolution rate
2007 73%
2008 70%
2009 76%
2010 75%
2011 74%
2012 73%
2013 71%
2014 74%
2015 64%
2016 72%
2017 74%
116
The first-contact resolution rate is an important metric to study, being concerned both with the
customers' experience as well as avoiding unnecessary calls. However, it is very difficult to measure
effectively, with no single best practice method of getting definitive statistics that are directly
comparable to the rest of the industry. This difficulty is shown by the fact that six or seven years ago,
perhaps half of contact centers responding to this survey did not collect FCR performance at all (this
year’s non-responding figure is only 7%, which is an ongoing improvement). Of those that do, there are
various ways to measure, or at least closely estimate, first-call resolution rates:
• Agents provide opinions on whether the call was resolved completely, including tagging the
interactions with a disposition code at the end of the call
• Tracking of issues shows if they are re-opened
• Supervisors monitor calls and score based on their opinion
• Customers can be contacted to ask their views
• Analytics of interaction recordings can be used to see whether the call was actually resolved or
more interactions were needed.
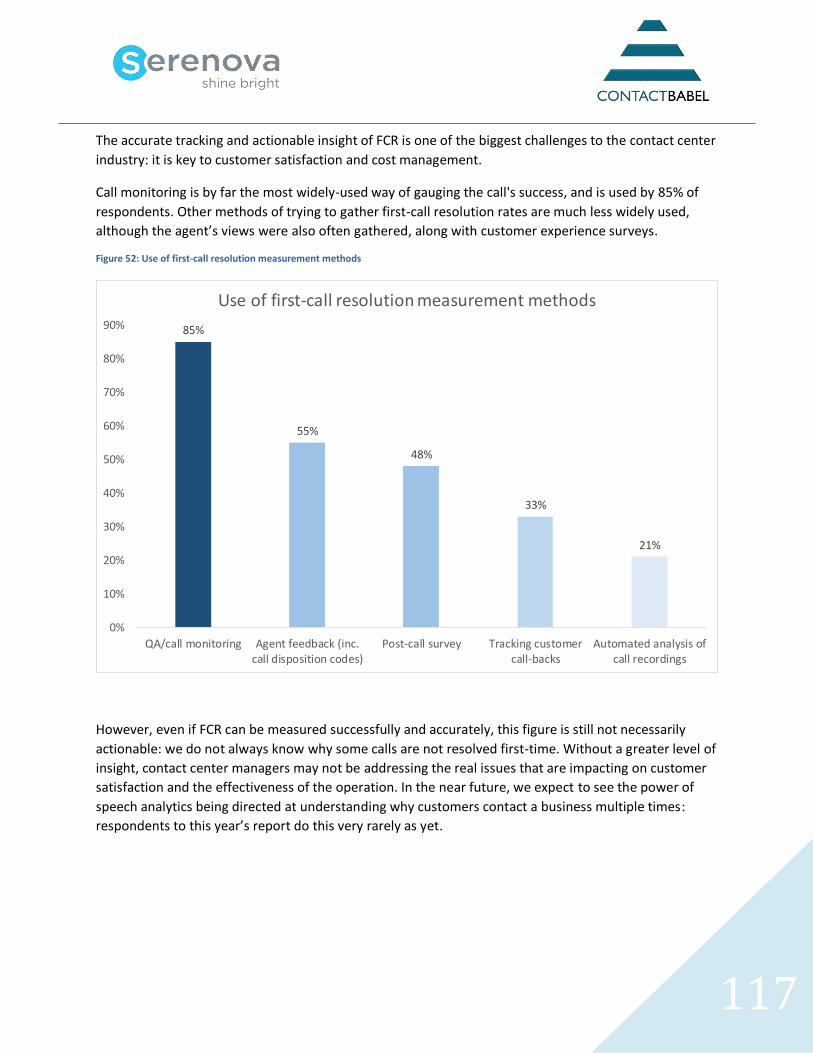
117
The accurate tracking and actionable insight of FCR is one of the biggest challenges to the contact center
industry: it is key to customer satisfaction and cost management.
Call monitoring is by far the most widely-used way of gauging the call's success, and is used by 85% of
respondents. Other methods of trying to gather first-call resolution rates are much less widely used,
although the agent’s views were also often gathered, along with customer experience surveys.
Figure 52: Use of first-call resolution measurement methods
However, even if FCR can be measured successfully and accurately, this figure is still not necessarily
actionable: we do not always know why some calls are not resolved first-time. Without a greater level of
insight, contact center managers may not be addressing the real issues that are impacting on customer
satisfaction and the effectiveness of the operation. In the near future, we expect to see the power of
speech analytics being directed at understanding why customers contact a business multiple times:
respondents to this year’s report do this very rarely as yet.
85%
55%
48%
33%
21%
0%
10%
20%
30%
40%
50%
60%
70%
80%
90%
QA/call monitoring Agent feedback (inc.call disposition codes)
Post-call survey Tracking customercall-backs
Automated analysis ofcall recordings
Use of first-call resolution measurement methods
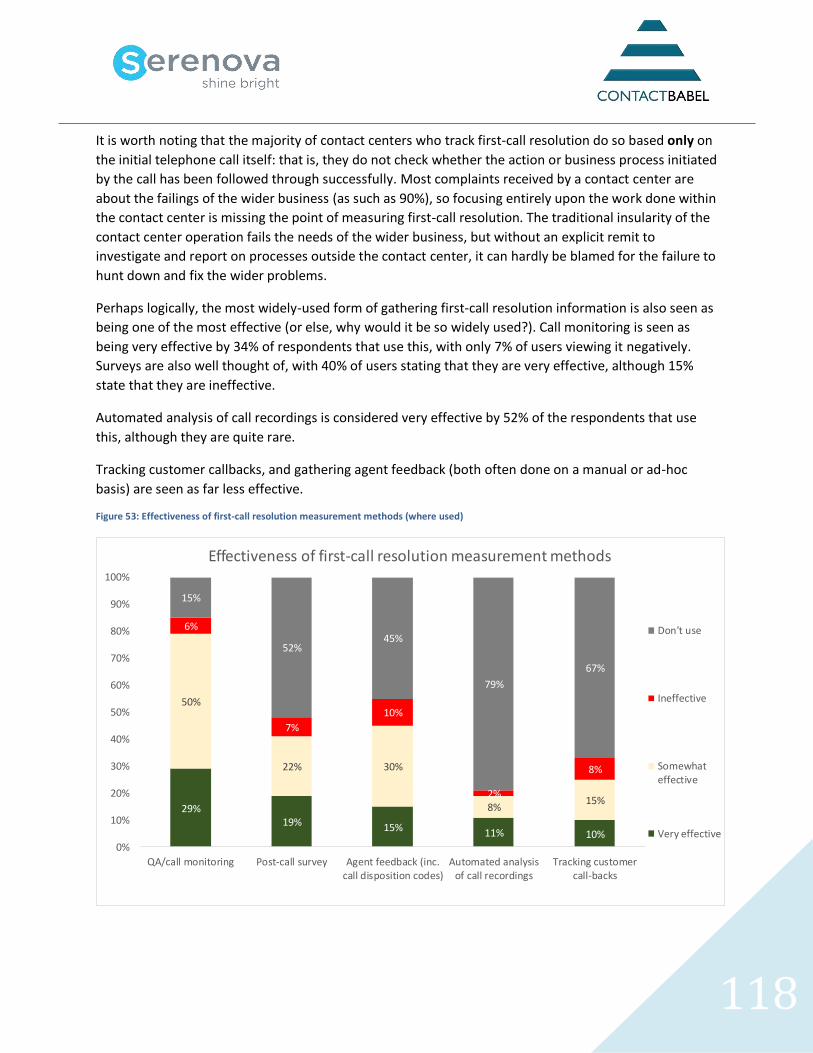
118
It is worth noting that the majority of contact centers who track first-call resolution do so based only on
the initial telephone call itself: that is, they do not check whether the action or business process initiated
by the call has been followed through successfully. Most complaints received by a contact center are
about the failings of the wider business (as such as 90%), so focusing entirely upon the work done within
the contact center is missing the point of measuring first-call resolution. The traditional insularity of the
contact center operation fails the needs of the wider business, but without an explicit remit to
investigate and report on processes outside the contact center, it can hardly be blamed for the failure to
hunt down and fix the wider problems.
Perhaps logically, the most widely-used form of gathering first-call resolution information is also seen as
being one of the most effective (or else, why would it be so widely used?). Call monitoring is seen as
being very effective by 34% of respondents that use this, with only 7% of users viewing it negatively.
Surveys are also well thought of, with 40% of users stating that they are very effective, although 15%
state that they are ineffective.
Automated analysis of call recordings is considered very effective by 52% of the respondents that use
this, although they are quite rare.
Tracking customer callbacks, and gathering agent feedback (both often done on a manual or ad-hoc
basis) are seen as far less effective.
Figure 53: Effectiveness of first-call resolution measurement methods (where used)
29%19% 15% 11% 10%
50%
22% 30%
8%15%
6%
7%
10%
2%
8%
15%
52%45%
79%
67%
0%
10%
20%
30%
40%
50%
60%
70%
80%
90%
100%
QA/call monitoring Post-call survey Agent feedback (inc.call disposition codes)
Automated analysisof call recordings
Tracking customercall-backs
Effectiveness of first-call resolution measurement methods
Don't use
Ineffective
Somewhateffective
Very effective
119
VIRTUAL CONTACT CENTERS & HOMEWORKING
Although many contact centers still operate in the same way in which most were originally set-up - a
single, centralized site - for many years there have been increasing commercial pressures and technical
opportunities allowing businesses to look at alternative ways of working, such as using virtual contact
centers, or encouraging homeworking.
The causes for this include:
• the presence of multiple contact centers - possibly gained through mergers and acquisitions
(especially in the finance, insurance, telecoms and utilities sectors) which are not linked
together in any way, thus not gaining from any economies of scale
• increasing levels of staff attrition and difficulty in finding the right staff to replace them,
especially highly-skilled agents
• the requirement of many contact centers for better-qualified staff, rather than just “warm
bodies” to answer phones as a result of self-service take-up
• the need to keep the contact center open for longer, despite agents not wishing to work anti-
social hours or businesses wanting to pay for a full shift when only a couple of hours are needed
• the rising concern about coping with call spikes, which could be dealt with by logging agents on
for an hour or two, rather than having them come in for a full shift
• the desire to increase the size of the contact center, which may not be possible in that location
due to market saturation and a shrinking labor pool.
This section looks at alternatives to the 9-to-5, full-time, centralized ways of working, and investigates
the number and type of contact centers that are using these alternatives.
120
VIRTUAL CONTACT CENTERS
The application of technological abilities to commercial issues created the virtual contact center which,
although located in multiple sites, can still be run as a single logical entity. The virtual contact center
consists of many operations (including homeworkers or satellite offices) which are linked together so as
to be viewed and managed as a single site, allowing significant economies of scale and improvements in
performance to take place, but with theoretically fewer of the attendant problems around environment,
morale and attrition that plague many very large operations.
The virtual contact center model has been driven by several factors. These include:
• For businesses involved in acquisitions or mergers, the number of contact centers they run have
increased, particularly in the finance, insurance, telecoms and utilities sectors
• Rapid contact center growth in certain geographical hotspots has caused agent recruitment
issues. This has meant that businesses have to consider new physical locations in which to
establish and grow their operations
• A rise in teleworking and remote locations means some agents may never see their parent
contact center. This is increasingly the case in 2nd- and 3rd line technical support, where skilled
agents can be extremely scarce and expensive to replace
• Some companies prefer to offer a local touch to customers by basing operations in the area or
country which they serve, or in which the company already has a non-contact center operation,
but with capacity available to develop a new telephony department
• Improvements in networking and communications, such as cloud and IP telephony, have meant
that the virtual contact center is now much more easy to realize at an affordable cost with
reduced upfront investment required
• Companies have increasing needs to serve global customers, necessitating either contact
centers operating in different time zones, or paying overtime for working anti-social hours
• Operational redundancy, disaster recovery and continuous service are possible with multisite
contact centers
• Smaller contact centers tend to have lower staff attrition rates than large operations, meaning
that a large virtual operation made up of several smaller sites could benefit from this.
Treating multiple contact centers as a virtual contact center allows great efficiencies can be made
through economies of scale. This is especially true where businesses are using skills-based routing. All
agent competencies are displayed to the scheduler - regardless of agent location - who can be more
flexible, simply because the available resource pool is so much deeper.
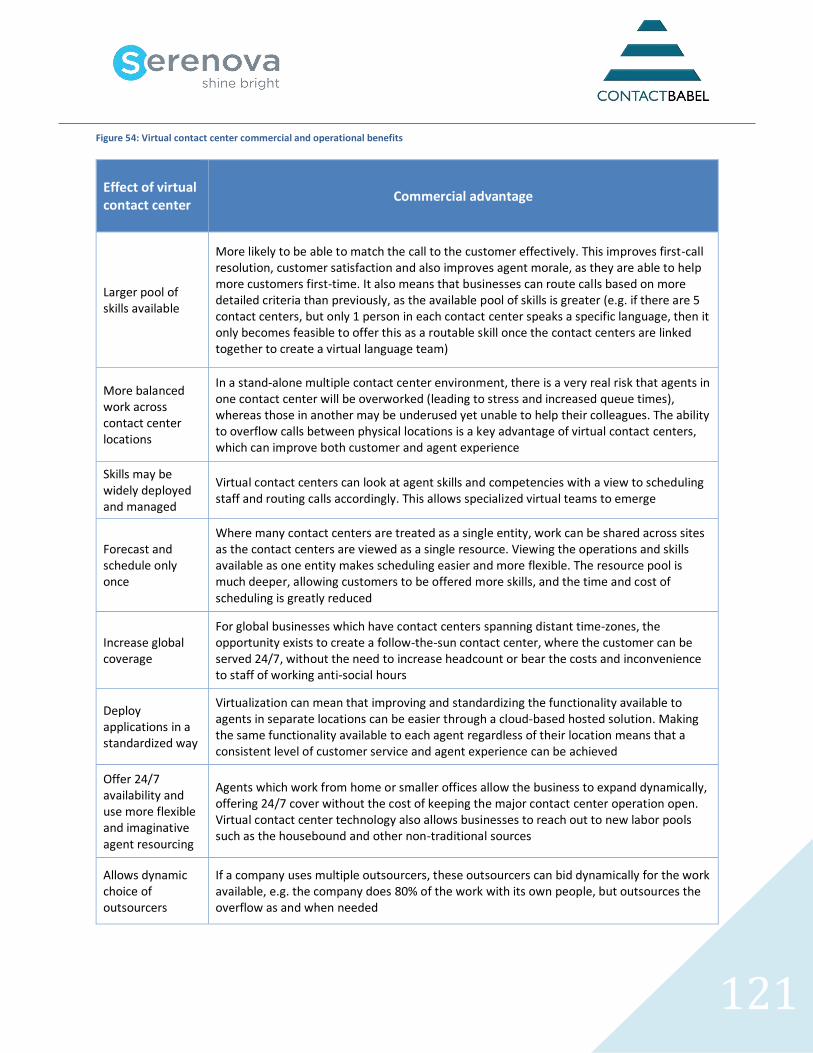
121
Figure 54: Virtual contact center commercial and operational benefits
Effect of virtual contact center
Commercial advantage
Larger pool of skills available
More likely to be able to match the call to the customer effectively. This improves first-call resolution, customer satisfaction and also improves agent morale, as they are able to help more customers first-time. It also means that businesses can route calls based on more detailed criteria than previously, as the available pool of skills is greater (e.g. if there are 5 contact centers, but only 1 person in each contact center speaks a specific language, then it only becomes feasible to offer this as a routable skill once the contact centers are linked together to create a virtual language team)
More balanced work across contact center locations
In a stand-alone multiple contact center environment, there is a very real risk that agents in one contact center will be overworked (leading to stress and increased queue times), whereas those in another may be underused yet unable to help their colleagues. The ability to overflow calls between physical locations is a key advantage of virtual contact centers, which can improve both customer and agent experience
Skills may be widely deployed and managed
Virtual contact centers can look at agent skills and competencies with a view to scheduling staff and routing calls accordingly. This allows specialized virtual teams to emerge
Forecast and schedule only once
Where many contact centers are treated as a single entity, work can be shared across sites as the contact centers are viewed as a single resource. Viewing the operations and skills available as one entity makes scheduling easier and more flexible. The resource pool is much deeper, allowing customers to be offered more skills, and the time and cost of scheduling is greatly reduced
Increase global coverage
For global businesses which have contact centers spanning distant time-zones, the opportunity exists to create a follow-the-sun contact center, where the customer can be served 24/7, without the need to increase headcount or bear the costs and inconvenience to staff of working anti-social hours
Deploy applications in a standardized way
Virtualization can mean that improving and standardizing the functionality available to agents in separate locations can be easier through a cloud-based hosted solution. Making the same functionality available to each agent regardless of their location means that a consistent level of customer service and agent experience can be achieved
Offer 24/7 availability and use more flexible and imaginative agent resourcing
Agents which work from home or smaller offices allow the business to expand dynamically, offering 24/7 cover without the cost of keeping the major contact center operation open. Virtual contact center technology also allows businesses to reach out to new labor pools such as the housebound and other non-traditional sources
Allows dynamic choice of outsourcers
If a company uses multiple outsourcers, these outsourcers can bid dynamically for the work available, e.g. the company does 80% of the work with its own people, but outsources the overflow as and when needed
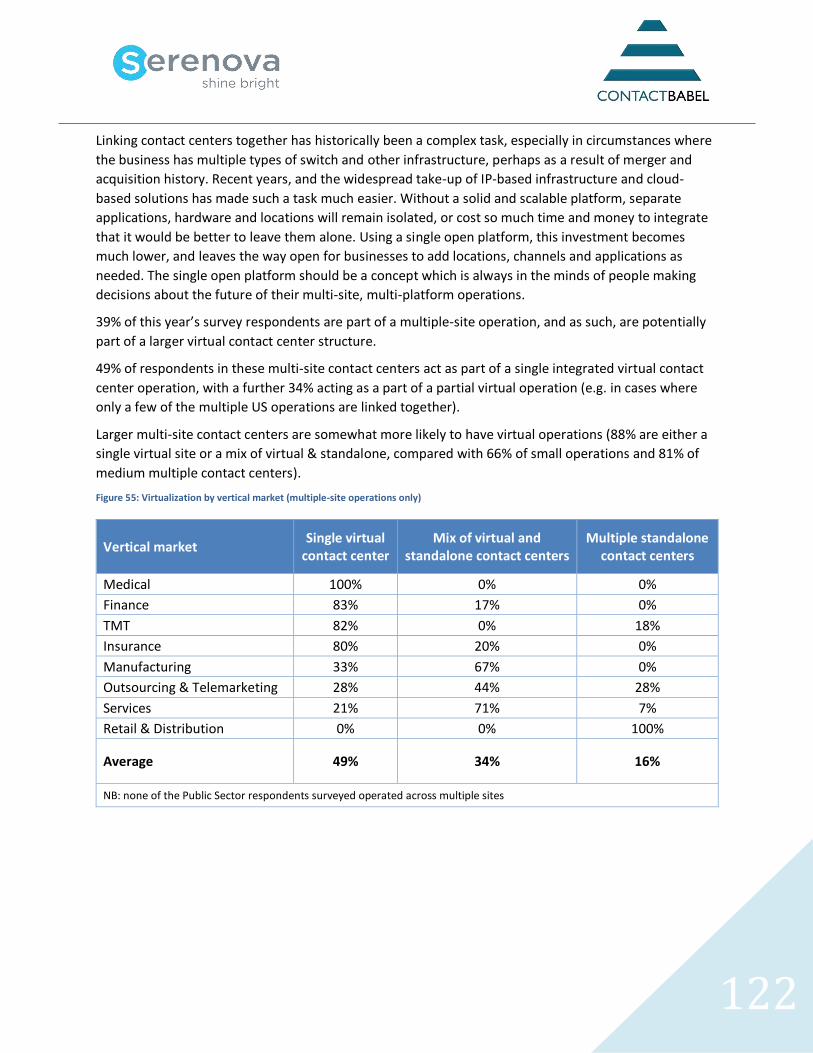
122
Linking contact centers together has historically been a complex task, especially in circumstances where
the business has multiple types of switch and other infrastructure, perhaps as a result of merger and
acquisition history. Recent years, and the widespread take-up of IP-based infrastructure and cloud-
based solutions has made such a task much easier. Without a solid and scalable platform, separate
applications, hardware and locations will remain isolated, or cost so much time and money to integrate
that it would be better to leave them alone. Using a single open platform, this investment becomes
much lower, and leaves the way open for businesses to add locations, channels and applications as
needed. The single open platform should be a concept which is always in the minds of people making
decisions about the future of their multi-site, multi-platform operations.
39% of this year’s survey respondents are part of a multiple-site operation, and as such, are potentially
part of a larger virtual contact center structure.
49% of respondents in these multi-site contact centers act as part of a single integrated virtual contact
center operation, with a further 34% acting as a part of a partial virtual operation (e.g. in cases where
only a few of the multiple US operations are linked together).
Larger multi-site contact centers are somewhat more likely to have virtual operations (88% are either a
single virtual site or a mix of virtual & standalone, compared with 66% of small operations and 81% of
medium multiple contact centers).
Figure 55: Virtualization by vertical market (multiple-site operations only)
Vertical market
Single virtual contact center
Mix of virtual and standalone contact centers
Multiple standalone contact centers
Medical 100% 0% 0%
Finance 83% 17% 0%
TMT 82% 0% 18%
Insurance 80% 20% 0%
Manufacturing 33% 67% 0%
Outsourcing & Telemarketing 28% 44% 28%
Services 21% 71% 7%
Retail & Distribution 0% 0% 100%
Average 49% 34% 16%
NB: none of the Public Sector respondents surveyed operated across multiple sites
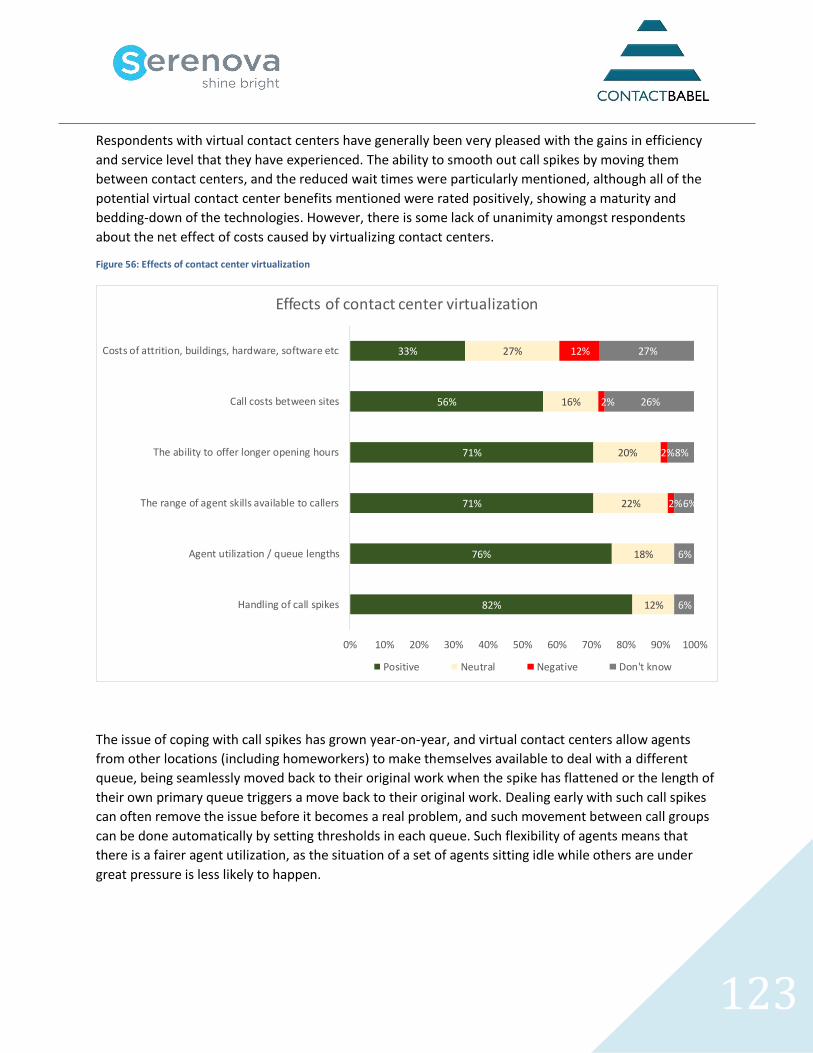
123
Respondents with virtual contact centers have generally been very pleased with the gains in efficiency
and service level that they have experienced. The ability to smooth out call spikes by moving them
between contact centers, and the reduced wait times were particularly mentioned, although all of the
potential virtual contact center benefits mentioned were rated positively, showing a maturity and
bedding-down of the technologies. However, there is some lack of unanimity amongst respondents
about the net effect of costs caused by virtualizing contact centers.
Figure 56: Effects of contact center virtualization
The issue of coping with call spikes has grown year-on-year, and virtual contact centers allow agents
from other locations (including homeworkers) to make themselves available to deal with a different
queue, being seamlessly moved back to their original work when the spike has flattened or the length of
their own primary queue triggers a move back to their original work. Dealing early with such call spikes
can often remove the issue before it becomes a real problem, and such movement between call groups
can be done automatically by setting thresholds in each queue. Such flexibility of agents means that
there is a fairer agent utilization, as the situation of a set of agents sitting idle while others are under
great pressure is less likely to happen.
82%
76%
71%
71%
56%
33%
12%
18%
22%
20%
16%
27%
2%
2%
2%
12%
6%
6%
6%
8%
26%
27%
0% 10% 20% 30% 40% 50% 60% 70% 80% 90% 100%
Handling of call spikes
Agent utilization / queue lengths
The range of agent skills available to callers
The ability to offer longer opening hours
Call costs between sites
Costs of attrition, buildings, hardware, software etc
Effects of contact center virtualization
Positive Neutral Negative Don't know
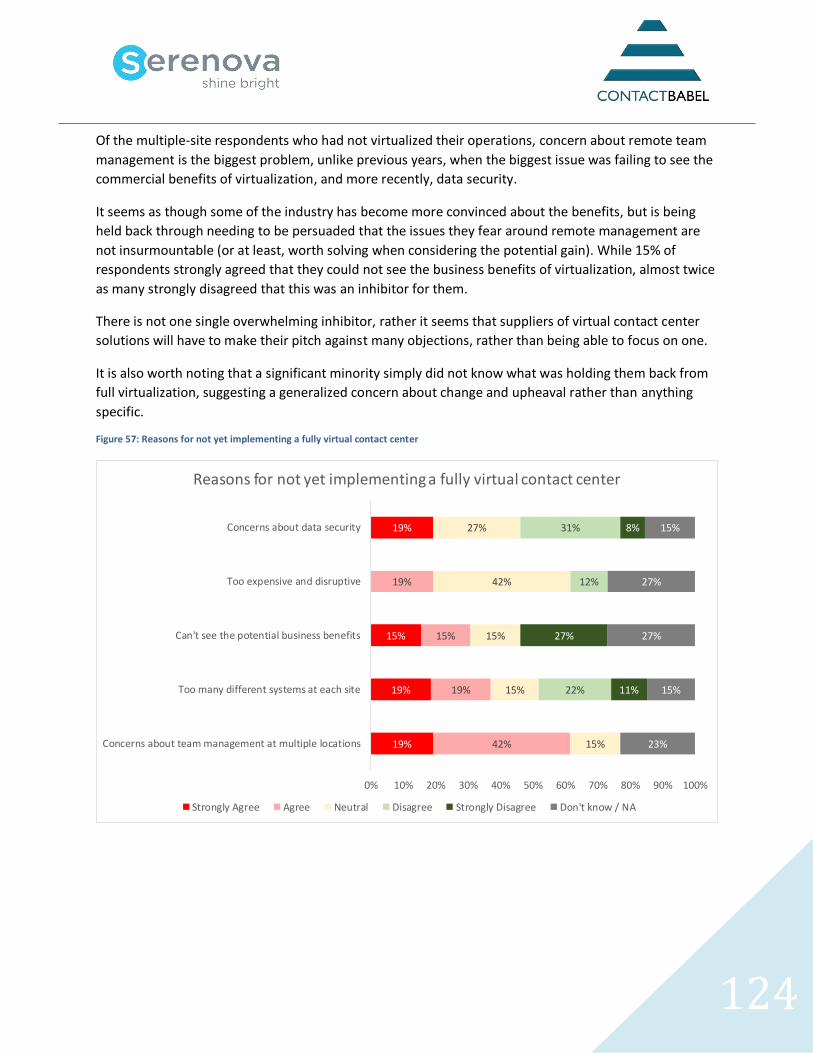
124
Of the multiple-site respondents who had not virtualized their operations, concern about remote team
management is the biggest problem, unlike previous years, when the biggest issue was failing to see the
commercial benefits of virtualization, and more recently, data security.
It seems as though some of the industry has become more convinced about the benefits, but is being
held back through needing to be persuaded that the issues they fear around remote management are
not insurmountable (or at least, worth solving when considering the potential gain). While 15% of
respondents strongly agreed that they could not see the business benefits of virtualization, almost twice
as many strongly disagreed that this was an inhibitor for them.
There is not one single overwhelming inhibitor, rather it seems that suppliers of virtual contact center
solutions will have to make their pitch against many objections, rather than being able to focus on one.
It is also worth noting that a significant minority simply did not know what was holding them back from
full virtualization, suggesting a generalized concern about change and upheaval rather than anything
specific.
Figure 57: Reasons for not yet implementing a fully virtual contact center
19%
19%
15%
19%
42%
19%
15%
19%
15%
15%
15%
42%
27%
22%
12%
31%
11%
27%
8%
23%
15%
27%
27%
15%
0% 10% 20% 30% 40% 50% 60% 70% 80% 90% 100%
Concerns about team management at multiple locations
Too many different systems at each site
Can't see the potential business benefits
Too expensive and disruptive
Concerns about data security
Reasons for not yet implementing a fully virtual contact center
Strongly Agree Agree Neutral Disagree Strongly Disagree Don't know / NA
125
THE ENTERPRISE AS THE CONTACT CENTER
For many years, the larger contact center solution providers have been encouraging businesses to look
beyond the four walls of a typical operation and consider how and when to involve other knowledge
workers in the enterprise, whether office- or field-based, in the business of customer service.
IP contact center and cloud-based solutions can break down the boundaries between the contact center
and the wider business, allowing every employee to act in the capacity of a contact center agent if in the
best interests of the business. In many cases, the drive and interest towards IP telephony came from the
internal corporate telephony and IT departments, especially in the multi-office environments where real
savings can be made.
From a contact center perspective, there are potentially massive advantages to having non-contact
center personnel available to speak with customers on occasion: superior customer service (and the
attendant improvements in customer spend and retention), immediate interaction with the right
person, reduced call abandonment rates and shorter resolution times, as well as more intangible
benefits like the ability of executives to listen to the customer first-hand and learn from the experience.
Knowledge workers / experts form part of the overall customer handling resource pool in 19% of
respondents' operations, especially in the insurance, TMT and retail sectors.
21% of respondents state that employees within branches or stores can handle a significant number of
customer calls, with the finance and services sectors most likely to do this (respondents from the latter
vertical market are probably referring to their satellite offices).
14% of this year’s respondents state that field-based workers handle customer calls, with those in the
TMT sector having the greatest proportion of these.
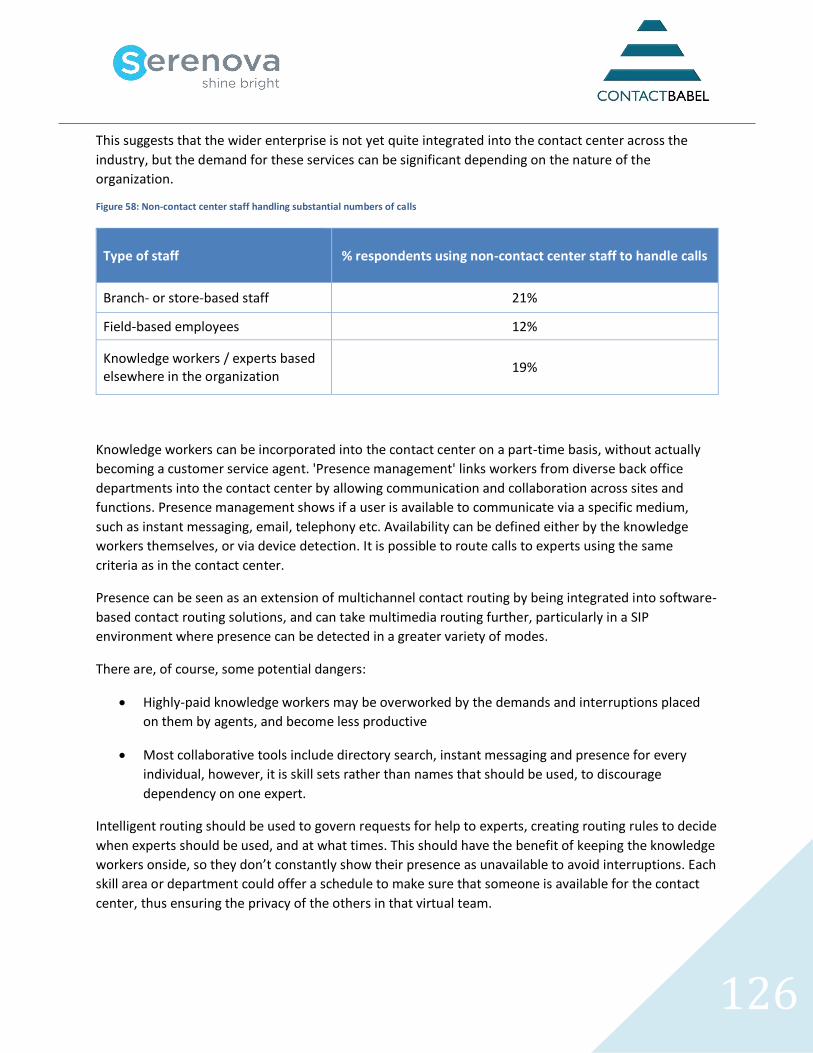
126
This suggests that the wider enterprise is not yet quite integrated into the contact center across the
industry, but the demand for these services can be significant depending on the nature of the
organization.
Figure 58: Non-contact center staff handling substantial numbers of calls
Type of staff
% respondents using non-contact center staff to handle calls
Branch- or store-based staff 21%
Field-based employees 12%
Knowledge workers / experts based elsewhere in the organization
19%
Knowledge workers can be incorporated into the contact center on a part-time basis, without actually
becoming a customer service agent. 'Presence management' links workers from diverse back office
departments into the contact center by allowing communication and collaboration across sites and
functions. Presence management shows if a user is available to communicate via a specific medium,
such as instant messaging, email, telephony etc. Availability can be defined either by the knowledge
workers themselves, or via device detection. It is possible to route calls to experts using the same
criteria as in the contact center.
Presence can be seen as an extension of multichannel contact routing by being integrated into software-
based contact routing solutions, and can take multimedia routing further, particularly in a SIP
environment where presence can be detected in a greater variety of modes.
There are, of course, some potential dangers:
• Highly-paid knowledge workers may be overworked by the demands and interruptions placed
on them by agents, and become less productive
• Most collaborative tools include directory search, instant messaging and presence for every
individual, however, it is skill sets rather than names that should be used, to discourage
dependency on one expert.
Intelligent routing should be used to govern requests for help to experts, creating routing rules to decide
when experts should be used, and at what times. This should have the benefit of keeping the knowledge
workers onside, so they don’t constantly show their presence as unavailable to avoid interruptions. Each
skill area or department could offer a schedule to make sure that someone is available for the contact
center, thus ensuring the privacy of the others in that virtual team.
127
HOMEWORKING
Homeworking and homeshoring promise contact centers significant benefits, but is perhaps not for
every agent or contact center. Amongst the potential advantages are:
• the environmental benefits of working at home, reducing carbon emissions and decreasing
congestion on the roads
• offshored contact centers are often unpopular, yet businesses are looking at ways to cut costs
• increased flexibility in working hours means rapid response and reduced idle time
• increasing costs of recruiting and retaining staff allow agents outside the commutable distance
to work as well.
Remote working opens the door to the sorts of people who might not otherwise seek employment in a
typical contact center but who would happily work in their own home taking calls. For an industry facing
cyclical difficulties in recruitment of employees who themselves are having to become more highly
skilled and deal with more complex issues year-on-year, this opportunity to deepen the labor pool
without widespread pay increases should not be ignored. The contact center could also use limited
homeworking (for example, one day a week) as a reward for its top agents, encouraging their loyalty and
offering a tangible promise to others.
Remote agents, whether working at home, or in a telecottage (small, remote sites), can be a part of the
larger virtual contact center by being linked to the main operation via DSL or a leased line (in the case of
telecottages). Some solutions permit least-cost routing and redundancy, where if the IP voice quality
deteriorates, the call can be switched onto a back-up connection until the IP quality improves
sufficiently to move it back to IP. Agents need only a PC which may act as a softphone, a headset (or IP
phone) and a data connection.
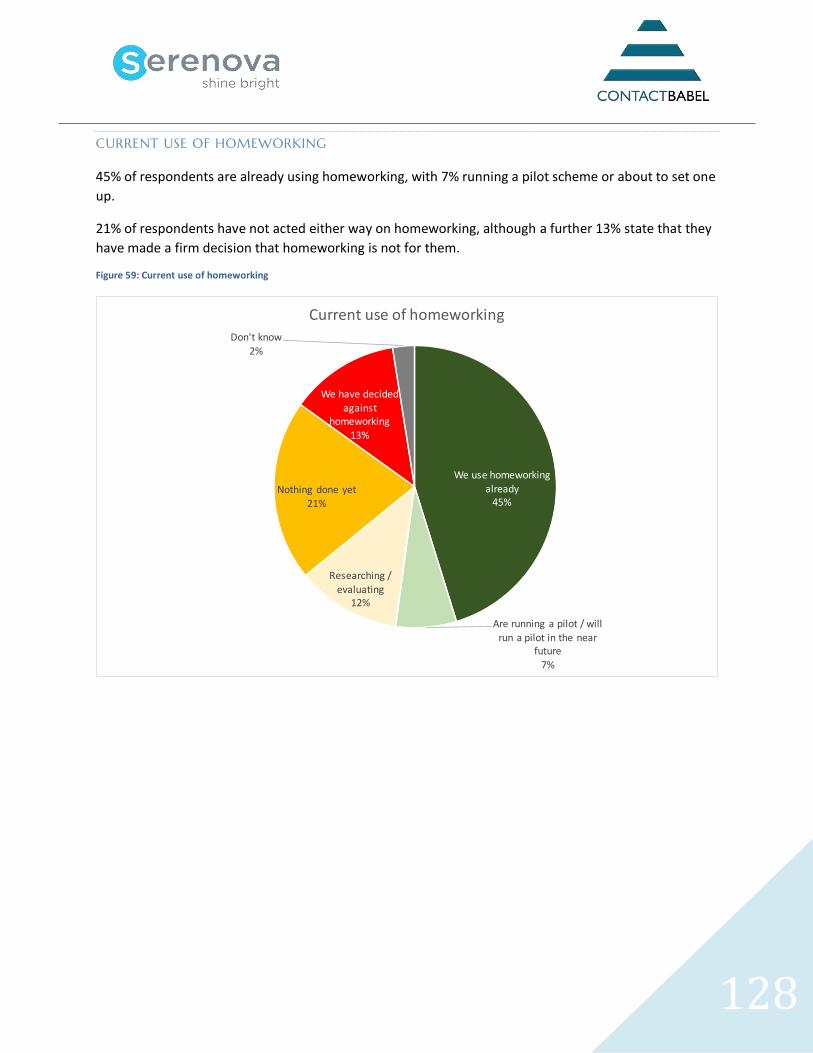
128
CURRENT USE OF HOMEWORKING
45% of respondents are already using homeworking, with 7% running a pilot scheme or about to set one
up.
21% of respondents have not acted either way on homeworking, although a further 13% state that they
have made a firm decision that homeworking is not for them.
Figure 59: Current use of homeworking
We use homeworking already
45%
Are running a pilot / will run a pilot in the near
future7%
Researching / evaluating
12%
Nothing done yet21%
We have decided against
homeworking13%
Don't know2%
Current use of homeworking
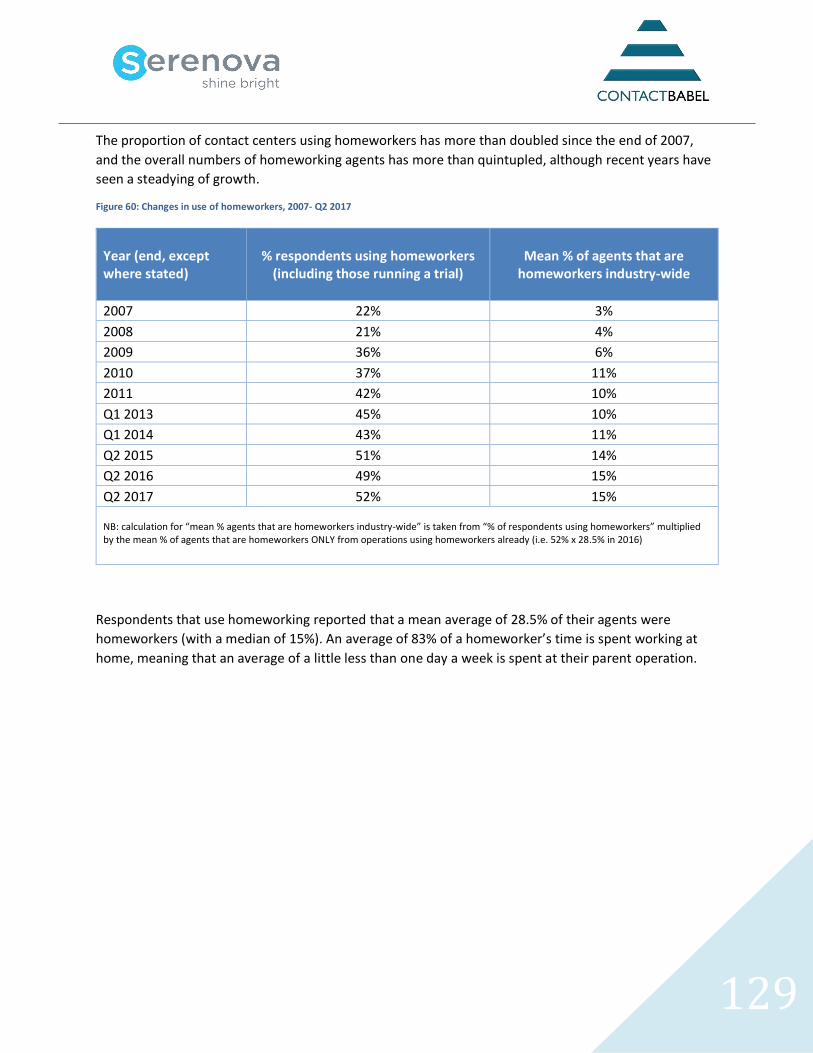
129
The proportion of contact centers using homeworkers has more than doubled since the end of 2007,
and the overall numbers of homeworking agents has more than quintupled, although recent years have
seen a steadying of growth.
Figure 60: Changes in use of homeworkers, 2007- Q2 2017
Year (end, except where stated)
% respondents using homeworkers (including those running a trial)
Mean % of agents that are homeworkers industry-wide
2007 22% 3%
2008 21% 4%
2009 36% 6%
2010 37% 11%
2011 42% 10%
Q1 2013 45% 10%
Q1 2014 43% 11%
Q2 2015 51% 14%
Q2 2016 49% 15%
Q2 2017 52% 15% NB: calculation for “mean % agents that are homeworkers industry-wide” is taken from “% of respondents using homeworkers” multiplied by the mean % of agents that are homeworkers ONLY from operations using homeworkers already (i.e. 52% x 28.5% in 2016)
Respondents that use homeworking reported that a mean average of 28.5% of their agents were
homeworkers (with a median of 15%). An average of 83% of a homeworker’s time is spent working at
home, meaning that an average of a little less than one day a week is spent at their parent operation.
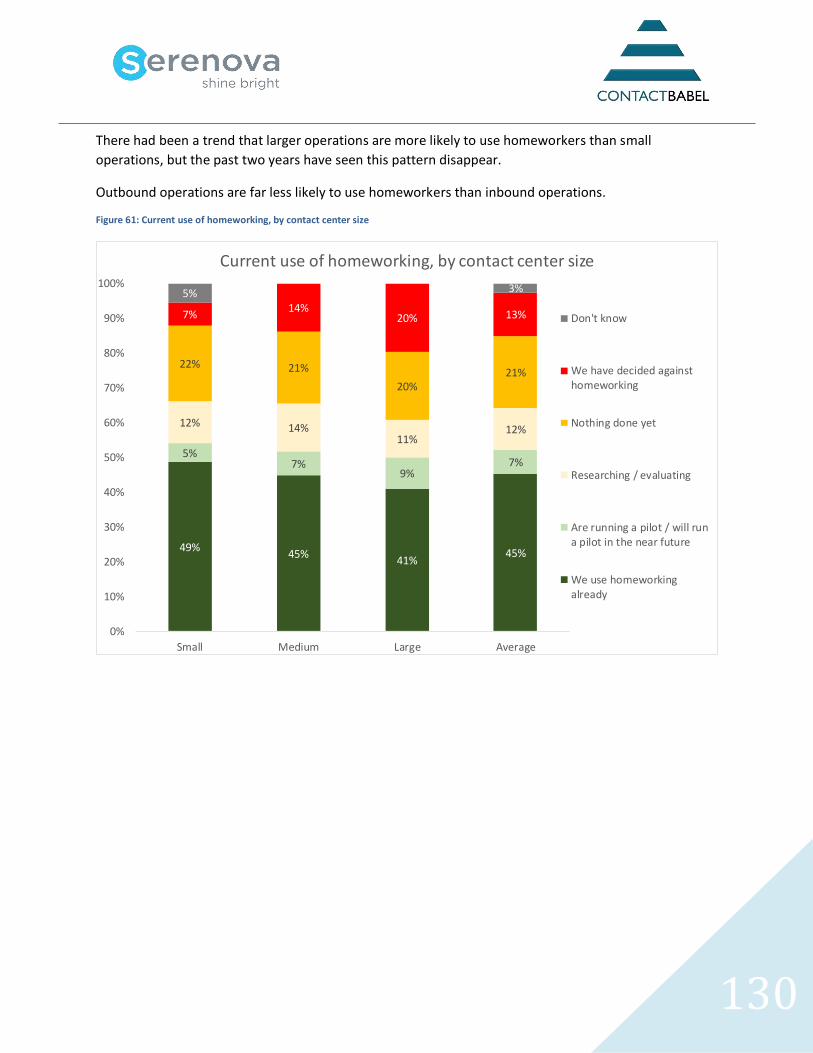
130
There had been a trend that larger operations are more likely to use homeworkers than small
operations, but the past two years have seen this pattern disappear.
Outbound operations are far less likely to use homeworkers than inbound operations.
Figure 61: Current use of homeworking, by contact center size
49%45%
41%45%
5%7%
9%7%
12% 14%11%
12%
22% 21%
20%21%
7%14%
20% 13%
5% 3%
0%
10%
20%
30%
40%
50%
60%
70%
80%
90%
100%
Small Medium Large Average
Current use of homeworking, by contact center size
Don't know
We have decided againsthomeworking
Nothing done yet
Researching / evaluating
Are running a pilot / will runa pilot in the near future
We use homeworkingalready
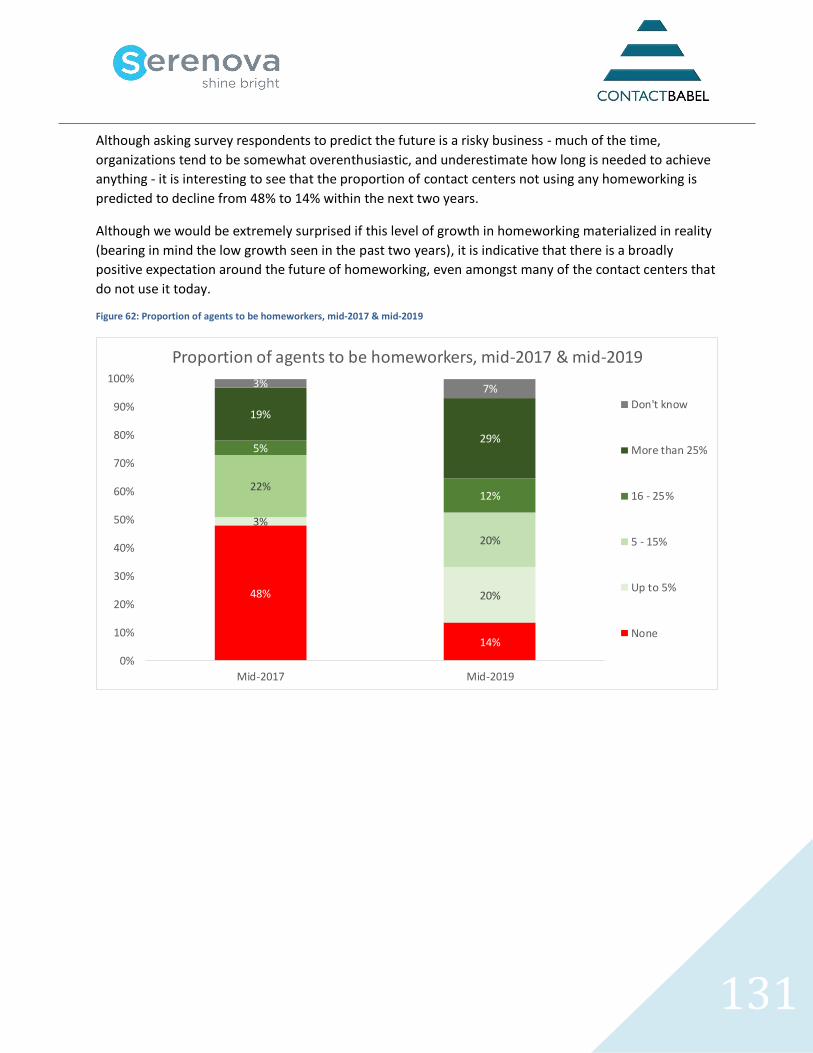
131
Although asking survey respondents to predict the future is a risky business - much of the time,
organizations tend to be somewhat overenthusiastic, and underestimate how long is needed to achieve
anything - it is interesting to see that the proportion of contact centers not using any homeworking is
predicted to decline from 48% to 14% within the next two years.
Although we would be extremely surprised if this level of growth in homeworking materialized in reality
(bearing in mind the low growth seen in the past two years), it is indicative that there is a broadly
positive expectation around the future of homeworking, even amongst many of the contact centers that
do not use it today.
Figure 62: Proportion of agents to be homeworkers, mid-2017 & mid-2019
48%
14%
3%
20%
22%
20%
5%
12%
19%
29%
3% 7%
0%
10%
20%
30%
40%
50%
60%
70%
80%
90%
100%
Mid-2017 Mid-2019
Proportion of agents to be homeworkers, mid-2017 & mid-2019
Don't know
More than 25%
16 - 25%
5 - 15%
Up to 5%
None
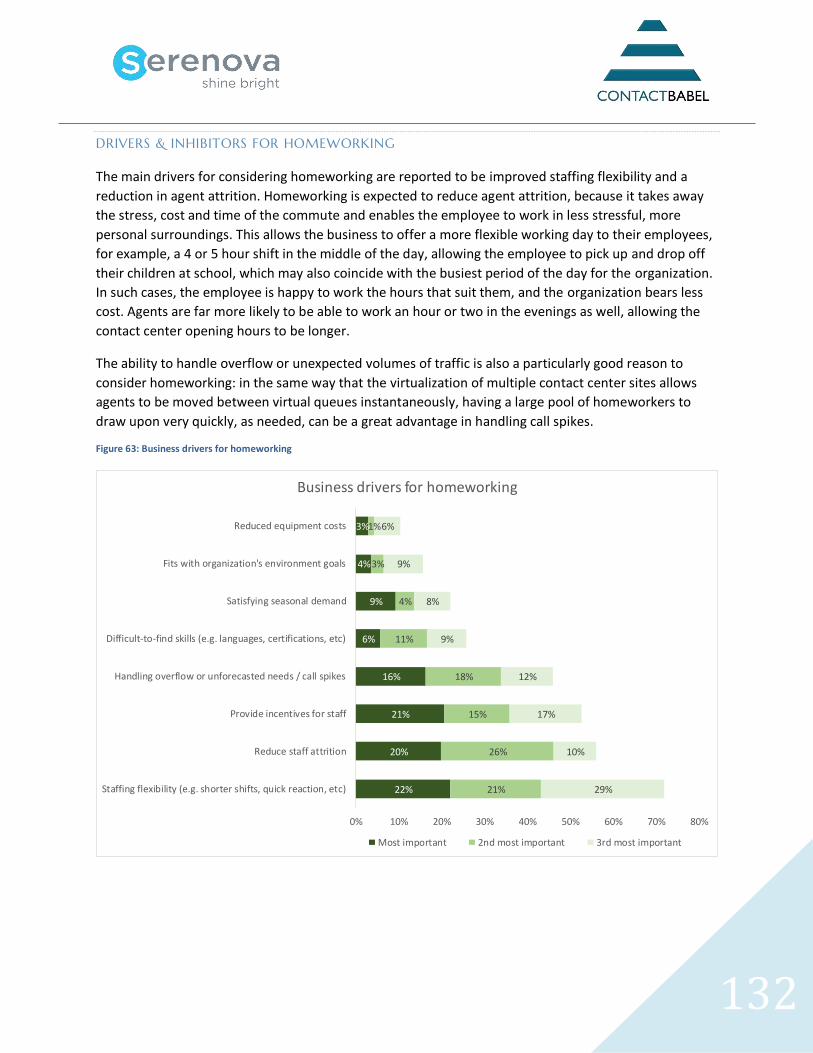
132
DRIVERS & INHIBITORS FOR HOMEWORKING
The main drivers for considering homeworking are reported to be improved staffing flexibility and a
reduction in agent attrition. Homeworking is expected to reduce agent attrition, because it takes away
the stress, cost and time of the commute and enables the employee to work in less stressful, more
personal surroundings. This allows the business to offer a more flexible working day to their employees,
for example, a 4 or 5 hour shift in the middle of the day, allowing the employee to pick up and drop off
their children at school, which may also coincide with the busiest period of the day for the organization.
In such cases, the employee is happy to work the hours that suit them, and the organization bears less
cost. Agents are far more likely to be able to work an hour or two in the evenings as well, allowing the
contact center opening hours to be longer.
The ability to handle overflow or unexpected volumes of traffic is also a particularly good reason to
consider homeworking: in the same way that the virtualization of multiple contact center sites allows
agents to be moved between virtual queues instantaneously, having a large pool of homeworkers to
draw upon very quickly, as needed, can be a great advantage in handling call spikes.
Figure 63: Business drivers for homeworking
22%
20%
21%
16%
6%
9%
4%
3%
21%
26%
15%
18%
11%
4%
3%
1%
29%
10%
17%
12%
9%
8%
9%
6%
0% 10% 20% 30% 40% 50% 60% 70% 80%
Staffing flexibility (e.g. shorter shifts, quick reaction, etc)
Reduce staff attrition
Provide incentives for staff
Handling overflow or unforecasted needs / call spikes
Difficult-to-find skills (e.g. languages, certifications, etc)
Satisfying seasonal demand
Fits with organization's environment goals
Reduced equipment costs
Business drivers for homeworking
Most important 2nd most important 3rd most important
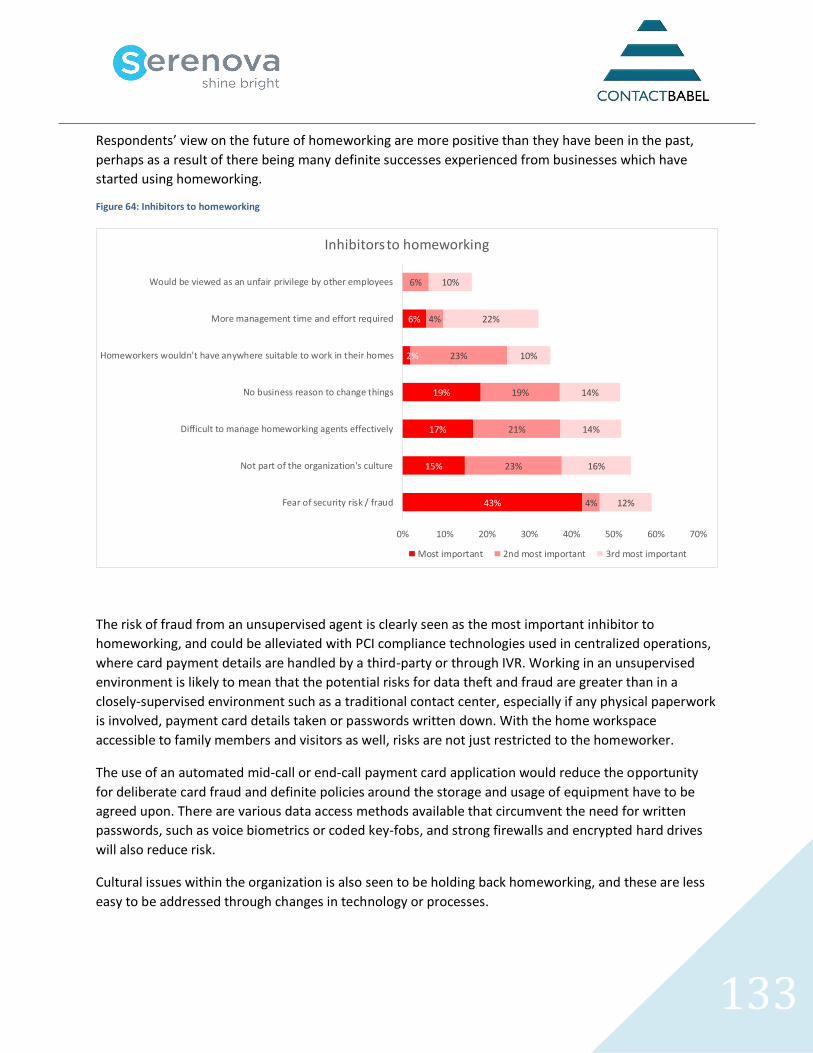
133
Respondents’ view on the future of homeworking are more positive than they have been in the past,
perhaps as a result of there being many definite successes experienced from businesses which have
started using homeworking.
Figure 64: Inhibitors to homeworking
The risk of fraud from an unsupervised agent is clearly seen as the most important inhibitor to
homeworking, and could be alleviated with PCI compliance technologies used in centralized operations,
where card payment details are handled by a third-party or through IVR. Working in an unsupervised
environment is likely to mean that the potential risks for data theft and fraud are greater than in a
closely-supervised environment such as a traditional contact center, especially if any physical paperwork
is involved, payment card details taken or passwords written down. With the home workspace
accessible to family members and visitors as well, risks are not just restricted to the homeworker.
The use of an automated mid-call or end-call payment card application would reduce the opportunity
for deliberate card fraud and definite policies around the storage and usage of equipment have to be
agreed upon. There are various data access methods available that circumvent the need for written
passwords, such as voice biometrics or coded key-fobs, and strong firewalls and encrypted hard drives
will also reduce risk.
Cultural issues within the organization is also seen to be holding back homeworking, and these are less
easy to be addressed through changes in technology or processes.
43%
15%
17%
19%
2%
6%
4%
23%
21%
19%
23%
4%
6%
12%
16%
14%
14%
10%
22%
10%
0% 10% 20% 30% 40% 50% 60% 70%
Fear of security risk / fraud
Not part of the organization's culture
Difficult to manage homeworking agents effectively
No business reason to change things
Homeworkers wouldn't have anywhere suitable to work in their homes
More management time and effort required
Would be viewed as an unfair privilege by other employees
Inhibitors to homeworking
Most important 2nd most important 3rd most important
134
The third-greatest concern is that homeworkers cannot be managed effectively from a remote location
has always been an objection to this way of working. Isolation can be a problem for both agent and
management, and not all roles or agents are suitable for homeworking. It is generally considered that
new mothers returning to work part-time, or older people who wish to reduce their working hours but
who are not yet ready to retire completely are particularly suitable to be considered for homeworking
roles, which require experience and maturity in the agent. With real-time adherence and call
management systems in place, there is no real reason that a virtual contact center made up of
homeworkers is more difficult to manage than a ‘typical’ operation, although the role of the team-
leader (being someone to help actively) has to be re-addressed.
Non-homeworking respondents are typically more likely to expect homeworkers to be less productive
than centralized staff, perhaps as they are not in such a high pressure environment, with supervisors
encouraging them, peer pressure and wallboards telling them the state of play. To some extent, it
depends on the definition of ‘productive’: if it is a matter of call volumes, then not having these cues to
hurry up may well have an effect. On the other hand, there are perhaps fewer distractions in the home.
In any case, there is no reason to expect that quality will suffer - probably quite the opposite - and the
homeworking model is particularly suitable to moving agents between queues rapidly, which in fact will
improve the productivity of the entire operation.
For some contact center workers, it would be difficult to have a room away from the noise of the
household, and this is a concern for some businesses. Obviously, it's important to consider working
location on a case-by-case basis to assess the suitability of the agent for homeworking.
135
OMNICHANNEL ROUTING
IP IN THE CONTACT CENTER
Traditional contact centers operate their telephony functions in a circuit-switched telephony
environment, where a fixed, dedicated line is left open between caller and agent. Running alongside
this, a packet-switched data network breaks up any data (e.g. a customer record to go along with the
phone call), sends it in packets along many routes, and reassembles it at the destination in the right
order.
IP contact centers differ from traditional PBX-centric operations in that voice traffic is converted into
packets of data and carried around the contact center (or between contact centers) on a data network,
rather than a voice network. There are two types of IP contact centers: those running on an IP-only
architecture, and those running a hybrid environment, where both IP and traditional circuit-switched
infrastructures are used.
There have been many reasons to consider changing from a traditional to an IP contact center,
including:
• The use of common protocol (IP) and the growth of key standards such as SIP allow rapid
development of new application functionality
• IP enables virtual contact centers, homeworking and the remote office model
• IP promotes the successful take-up and management of multimedia customer interactions
• More affordable functionality is made available to smaller contact centers
• IP reduces the cost of maintaining two networks
• There is more flexibility to add and change agents in an IP environment
• There is a reduction in call charges between sites via IP trunking
• IP supports reduced staff attrition through allowing flexible working
• The boundaries between contact center and the wider business are breaking down, and IP is a
common theme across all parts of the enterprise
• IP infrastructure may be cheaper to upgrade than a circuit-switched platform.
136
The use of IP within the contact center has been present for some years now, and despite the relatively
slow start to IP implementation, IP is now an integral, mainstream and strategic part of the contact
center industry. Moving contact center operations to an open IP environment should be seen as a
strategic enabler, rather than just an obvious cost-cutting exercise. The key to understanding the real
value of IP is through how it enables functionality to be deployed quickly and effectively regardless of
physical location. Put simply, completely and genuinely adopting open standards means that contact
centers release themselves from high maintenance costs associated with proprietary systems, and can
choose the applications that exactly suit their needs at the time. Standards-based IP solutions are the
closest the industry has come to being truly able to future-proof their contact centers.
SIP - SESSION INITIATION PROTOCOL
Advances in standards such as the Session Initiation Protocol (RFC 3261) or SIP, enable telephony
applications to interface with each other and provide functionality that used to be only available using
proprietary infrastructure hardware.
• Widely regarded as the successor to H.323 for IP-based telephony
• Gaining increased attention and visibility due to major technology solution providers
• An alternative to TAPI-based IP telephony models
• A protocol that removes the need for a separate IP-PBX and contact center solution
• The emerging standard for session control for a variety of media - greater flexibility and more
scalability than many alternative multimedia communication protocols in use today
• Software-based, open and lightweight, allowing organizations of all types to support the new breed
of SIP phones along with soft phones, analogue phones, desktop PCs, and even mobile devices and
PDAs
• SIP also provides strong support for real-time voice communications, text-based messaging and
application sharing - SIP can initiate real-time, multimedia sessions that seamlessly integrate voice,
data and video
Open systems allow customers to select non-proprietary hardware and software for queuing, routing
and applying treatments to interactions. This means that future contact centers will be free of the
restrictive nature of proprietary systems, and able to develop and deploy applications which may have
previously been too complex to integrate or maintain cost-effectively. The widespread use of a truly
open standard will encourage application developers to push functionality boundaries further as time-
to-market should be significantly decreased because integration will become much easier.
It is important to understand that there is no CTI link in the SIP world - true interoperability takes care of
the integration. This has a distinct cost benefit, a reduction in complexity of deployment and
maintenance, and an ability to implement quickly. Through SIP, the value of contact center solutions is
moving from routing to applications - not so much “how shall we do it?” as “what shall we do?”.
137
Recently, some vendors have developed unified communication platforms that allow contact center
solutions to operate on standard servers with no specialized hardware components, providing an
infrastructure that can be supported and maintained by clients’ existing IT staff. This offers an easy path
to a software-only platform or to allow hybrid applications where both traditional telephony and
software-only SIP environments can be unified for a best-of-breed Unified Communication approach.
SIP will enable companies to use CTI functionality throughout IT infrastructures instead using a
proprietary hardware/software layer. Applications will use SIP commands to carry out call-related
activities and also non-call functions such as presence management. A contact center's CTI servers use
caller ID information from PBXs to retrieve customer information from various databases. This
information is then passed to the agent along with the voice call as a screen-pop, cutting down the time
spent at the beginning of a conversation. If calls are transferred, the information follows the voice call so
the customer does not have to repeat information they have already given. CTI is extremely effective,
however, it's also expensive, proprietary and complex. The use of SIP allows CTI-like functionality to be
used far more widely and effectively.
Enabling a voice device to communicate with a data network has required the CTI middleware layer to
translate TDM (Time Division Multiplexed) voice traffic into data. If a contact center uses SIP and a pure
IP infrastructure, it removes the need for CTI as a separate layer in the IT infrastructure because SIP
enables mobile phones, laptops, smartphones, etc. to communicate directly with IT resources. In pure IP
networks, calls will enter the infrastructure as VoIP traffic and travel to a SIP proxy server which initiates
sessions with the necessary applications to perform call routing and customer information searches for
which the CTI server was formerly responsible.
Standards-based SIP proxy servers are much cheaper than CTI servers and can be implemented on
standard hardware. Integration is easier and quicker as all the input and output in the network is one
standard protocol, which opens this up to smaller operations too, however all voice traffic must be
through VoIP.
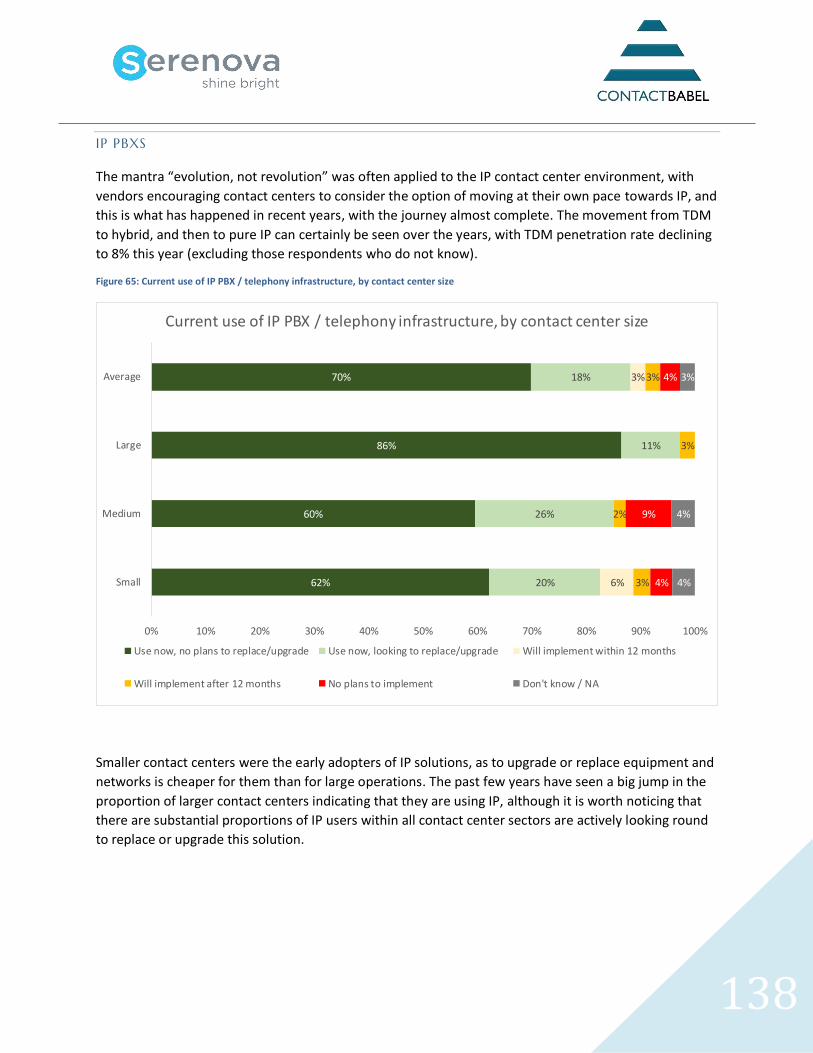
138
IP PBXS
The mantra “evolution, not revolution” was often applied to the IP contact center environment, with
vendors encouraging contact centers to consider the option of moving at their own pace towards IP, and
this is what has happened in recent years, with the journey almost complete. The movement from TDM
to hybrid, and then to pure IP can certainly be seen over the years, with TDM penetration rate declining
to 8% this year (excluding those respondents who do not know).
Figure 65: Current use of IP PBX / telephony infrastructure, by contact center size
Smaller contact centers were the early adopters of IP solutions, as to upgrade or replace equipment and
networks is cheaper for them than for large operations. The past few years have seen a big jump in the
proportion of larger contact centers indicating that they are using IP, although it is worth noticing that
there are substantial proportions of IP users within all contact center sectors are actively looking round
to replace or upgrade this solution.
62%
60%
86%
70%
20%
26%
11%
18%
6%
3%
3%
2%
3%
3%
4%
9%
4%
4%
4%
3%
0% 10% 20% 30% 40% 50% 60% 70% 80% 90% 100%
Small
Medium
Large
Average
Current use of IP PBX / telephony infrastructure, by contact center size
Use now, no plans to replace/upgrade Use now, looking to replace/upgrade Will implement within 12 months
Will implement after 12 months No plans to implement Don't know / NA
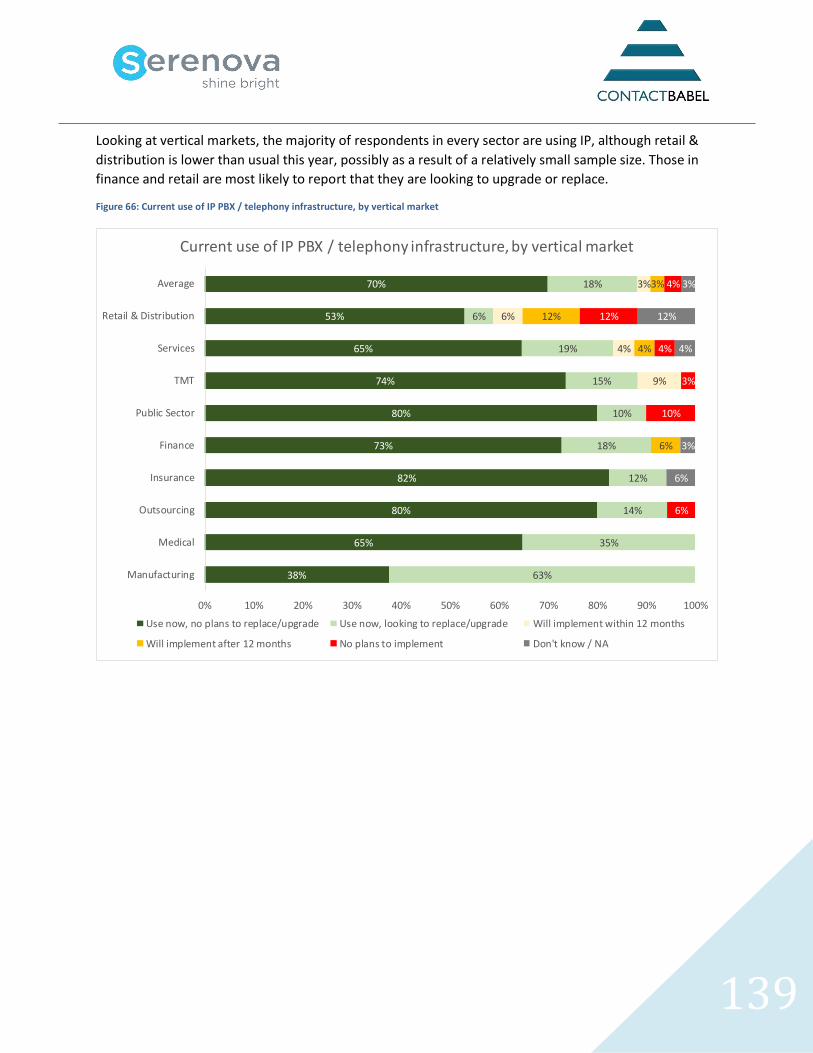
139
Looking at vertical markets, the majority of respondents in every sector are using IP, although retail &
distribution is lower than usual this year, possibly as a result of a relatively small sample size. Those in
finance and retail are most likely to report that they are looking to upgrade or replace.
Figure 66: Current use of IP PBX / telephony infrastructure, by vertical market
38%
65%
80%
82%
73%
80%
74%
65%
53%
70%
63%
35%
14%
12%
18%
10%
15%
19%
6%
18%
9%
4%
6%
3%
6%
4%
12%
3%
6%
10%
3%
4%
12%
4%
6%
3%
4%
12%
3%
0% 10% 20% 30% 40% 50% 60% 70% 80% 90% 100%
Manufacturing
Medical
Outsourcing
Insurance
Finance
Public Sector
TMT
Services
Retail & Distribution
Average
Current use of IP PBX / telephony infrastructure, by vertical market
Use now, no plans to replace/upgrade Use now, looking to replace/upgrade Will implement within 12 months
Will implement after 12 months No plans to implement Don't know / NA
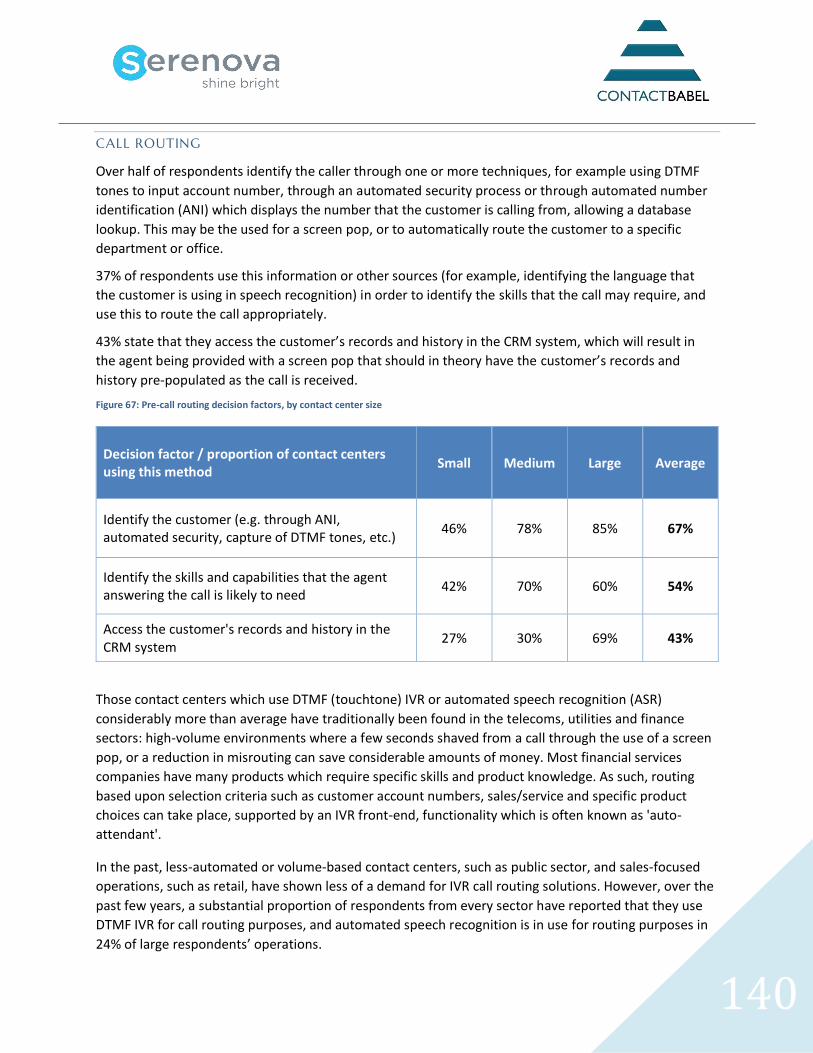
140
CALL ROUTING
Over half of respondents identify the caller through one or more techniques, for example using DTMF
tones to input account number, through an automated security process or through automated number
identification (ANI) which displays the number that the customer is calling from, allowing a database
lookup. This may be the used for a screen pop, or to automatically route the customer to a specific
department or office.
37% of respondents use this information or other sources (for example, identifying the language that
the customer is using in speech recognition) in order to identify the skills that the call may require, and
use this to route the call appropriately.
43% state that they access the customer’s records and history in the CRM system, which will result in
the agent being provided with a screen pop that should in theory have the customer’s records and
history pre-populated as the call is received.
Figure 67: Pre-call routing decision factors, by contact center size
Decision factor / proportion of contact centers using this method
Small Medium Large Average
Identify the customer (e.g. through ANI, automated security, capture of DTMF tones, etc.)
46% 78% 85% 67%
Identify the skills and capabilities that the agent answering the call is likely to need
42% 70% 60% 54%
Access the customer's records and history in the CRM system
27% 30% 69% 43%
Those contact centers which use DTMF (touchtone) IVR or automated speech recognition (ASR)
considerably more than average have traditionally been found in the telecoms, utilities and finance
sectors: high-volume environments where a few seconds shaved from a call through the use of a screen
pop, or a reduction in misrouting can save considerable amounts of money. Most financial services
companies have many products which require specific skills and product knowledge. As such, routing
based upon selection criteria such as customer account numbers, sales/service and specific product
choices can take place, supported by an IVR front-end, functionality which is often known as 'auto-
attendant'.
In the past, less-automated or volume-based contact centers, such as public sector, and sales-focused
operations, such as retail, have shown less of a demand for IVR call routing solutions. However, over the
past few years, a substantial proportion of respondents from every sector have reported that they use
DTMF IVR for call routing purposes, and automated speech recognition is in use for routing purposes in
24% of large respondents’ operations.
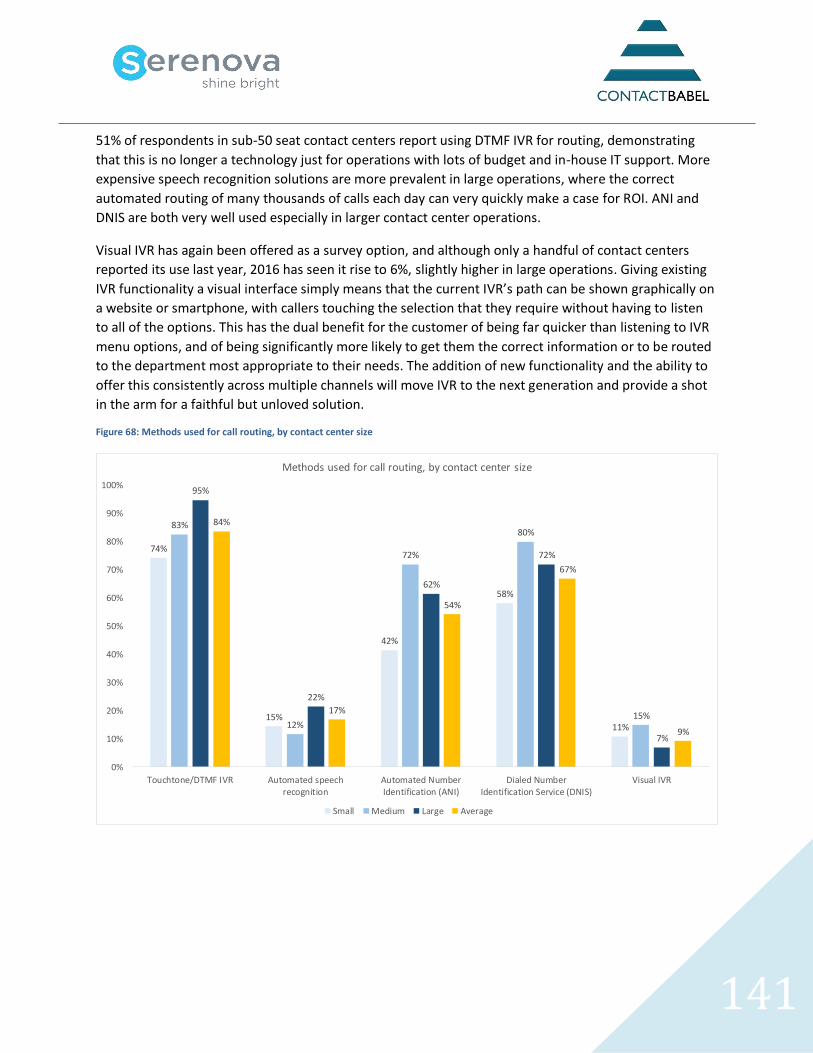
141
51% of respondents in sub-50 seat contact centers report using DTMF IVR for routing, demonstrating
that this is no longer a technology just for operations with lots of budget and in-house IT support. More
expensive speech recognition solutions are more prevalent in large operations, where the correct
automated routing of many thousands of calls each day can very quickly make a case for ROI. ANI and
DNIS are both very well used especially in larger contact center operations.
Visual IVR has again been offered as a survey option, and although only a handful of contact centers
reported its use last year, 2016 has seen it rise to 6%, slightly higher in large operations. Giving existing
IVR functionality a visual interface simply means that the current IVR’s path can be shown graphically on
a website or smartphone, with callers touching the selection that they require without having to listen
to all of the options. This has the dual benefit for the customer of being far quicker than listening to IVR
menu options, and of being significantly more likely to get them the correct information or to be routed
to the department most appropriate to their needs. The addition of new functionality and the ability to
offer this consistently across multiple channels will move IVR to the next generation and provide a shot
in the arm for a faithful but unloved solution.
Figure 68: Methods used for call routing, by contact center size
74%
15%
42%
58%
11%
83%
12%
72%
80%
15%
95%
22%
62%
72%
7%
84%
17%
54%
67%
9%
0%
10%
20%
30%
40%
50%
60%
70%
80%
90%
100%
Touchtone/DTMF IVR Automated speechrecognition
Automated NumberIdentification (ANI)
Dialed NumberIdentification Service (DNIS)
Visual IVR
Methods used for call routing, by contact center size
Small Medium Large Average
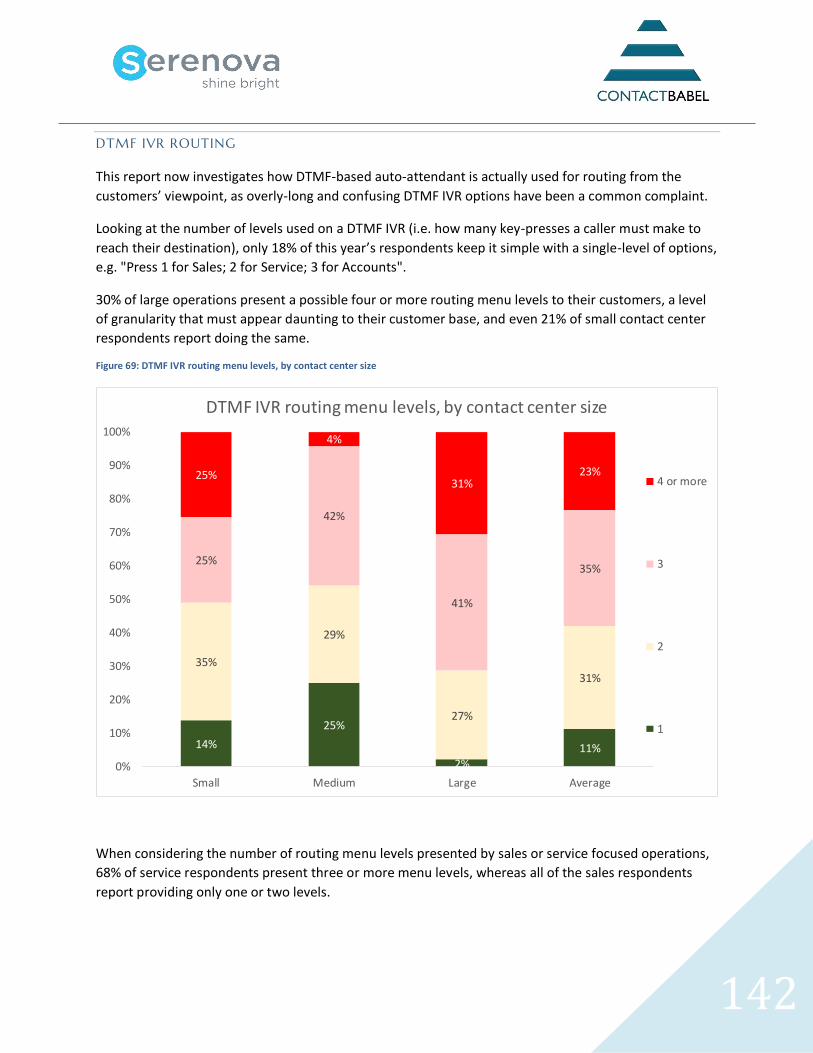
142
DTMF IVR ROUTING
This report now investigates how DTMF-based auto-attendant is actually used for routing from the
customers’ viewpoint, as overly-long and confusing DTMF IVR options have been a common complaint.
Looking at the number of levels used on a DTMF IVR (i.e. how many key-presses a caller must make to
reach their destination), only 18% of this year’s respondents keep it simple with a single-level of options,
e.g. "Press 1 for Sales; 2 for Service; 3 for Accounts".
30% of large operations present a possible four or more routing menu levels to their customers, a level
of granularity that must appear daunting to their customer base, and even 21% of small contact center
respondents report doing the same.
Figure 69: DTMF IVR routing menu levels, by contact center size
When considering the number of routing menu levels presented by sales or service focused operations,
68% of service respondents present three or more menu levels, whereas all of the sales respondents
report providing only one or two levels.
14%
25%
2%11%
35%
29%
27%
31%
25%
42%
41%
35%
25%
4%
31%23%
0%
10%
20%
30%
40%
50%
60%
70%
80%
90%
100%
Small Medium Large Average
DTMF IVR routing menu levels, by contact center size
4 or more
3
2
1
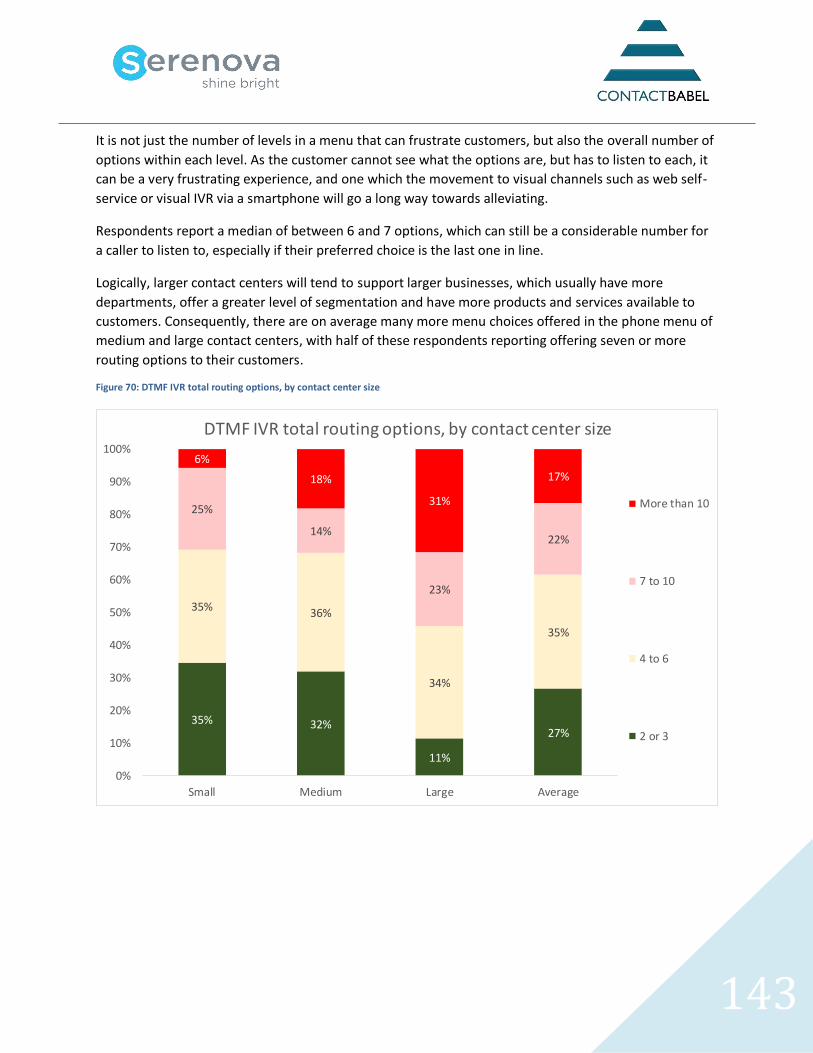
143
It is not just the number of levels in a menu that can frustrate customers, but also the overall number of
options within each level. As the customer cannot see what the options are, but has to listen to each, it
can be a very frustrating experience, and one which the movement to visual channels such as web self-
service or visual IVR via a smartphone will go a long way towards alleviating.
Respondents report a median of between 6 and 7 options, which can still be a considerable number for
a caller to listen to, especially if their preferred choice is the last one in line.
Logically, larger contact centers will tend to support larger businesses, which usually have more
departments, offer a greater level of segmentation and have more products and services available to
customers. Consequently, there are on average many more menu choices offered in the phone menu of
medium and large contact centers, with half of these respondents reporting offering seven or more
routing options to their customers.
Figure 70: DTMF IVR total routing options, by contact center size
35% 32%
11%
27%
35%36%
34%
35%
25%
14%
23%
22%
6%
18%
31%
17%
0%
10%
20%
30%
40%
50%
60%
70%
80%
90%
100%
Small Medium Large Average
DTMF IVR total routing options, by contact center size
More than 10
7 to 10
4 to 6
2 or 3
144
SKILLS-BASED ROUTING & OTHER STRATEGIES
Sophisticated call routing capabilities allow the business to put the right agent with the right skills in
front of the customer to meet the business’s strategic aims, keep costs low and improve the customer’s
experience. Obviously, a business will want to treat a delinquent account differently to a high-value
customer, or a caller identified at risk of leaving the business. The former can be routed straight through
to collections, and the latter two to highly-skilled agents who may even have assisted the customer
previously.
There are many different call routing strategies employed by contact centers, including:
• Hunt groups: also known as direct routing, this is a basic strategy which aims to connect callers
to the department which they have called, searching for available members of that group to
take a call
• Least Idle / Least Occupied: these strategies are based upon the agent’s level of activity,
respectively looking for agents who have been waiting the longest or who have done least work
throughout the day
• Skills-based routing: particular skills and characteristics can be assigned to specific agents,
allowing a better match between the call and the agent. This requires knowledge of who the
caller is, or what they want, or both
• Dynamic or service level routing: building on skills-based routing, this strategy also takes into
account the predicted demand for the specific skills, which can flexibly reallocate other agents
who may have lesser skill sets if service levels risk being missed
• Business rules based on customer identity: once the customer has been identified - perhaps
through the use of ANI or automated verification - the business can then decide how they would
like calls from this particular customer to be handled. For example, Premier customers may get
put to the front of the queue; agents who have handled this customer’s calls successfully before
may be allocated; or customers who have indicated that they wish to cancel a contract may be
put through to expert retention staff
• Intelligent routing based on customer history: intelligent routing goes one step further than
this, by gathering information from the customer’s record, and routing the call based not only
on the customer’s identity but also on their history, status and profile. For example, those who
are in debt may get passed straight through to the collections department, whereas high-value
customers reaching the end of the contract may be passed through to staff who are highly
skilled in cross-selling and up-selling.
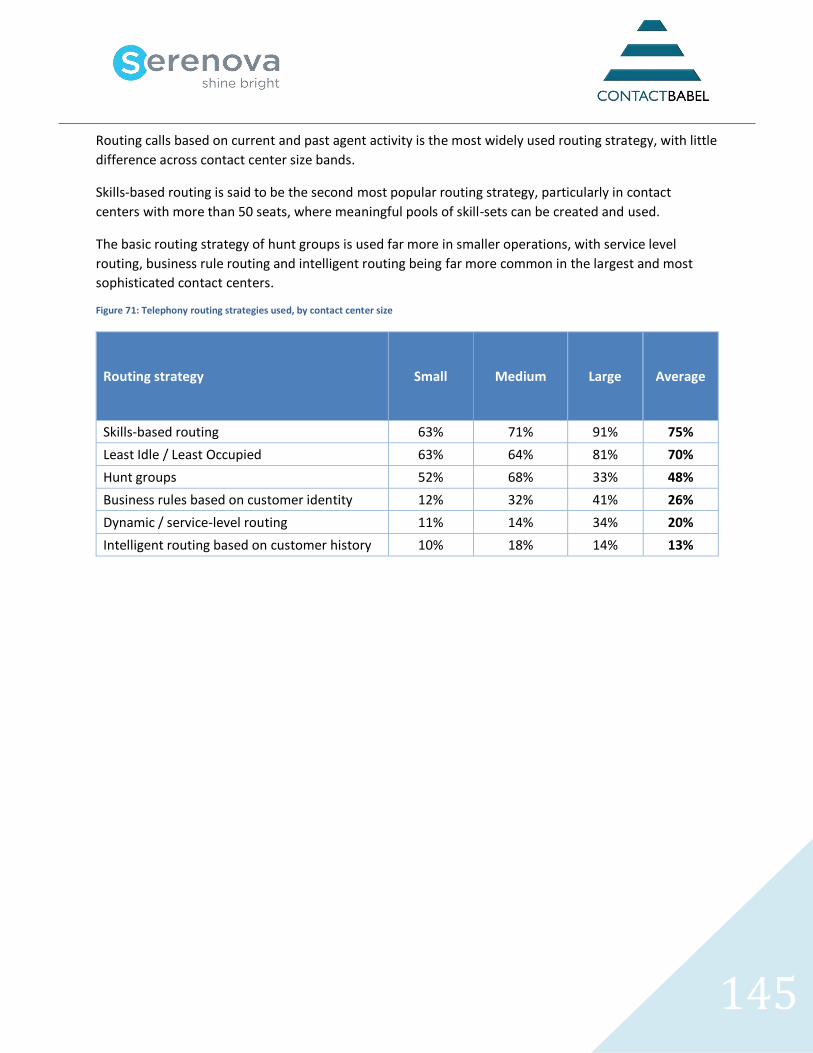
145
Routing calls based on current and past agent activity is the most widely used routing strategy, with little
difference across contact center size bands.
Skills-based routing is said to be the second most popular routing strategy, particularly in contact
centers with more than 50 seats, where meaningful pools of skill-sets can be created and used.
The basic routing strategy of hunt groups is used far more in smaller operations, with service level
routing, business rule routing and intelligent routing being far more common in the largest and most
sophisticated contact centers.
Figure 71: Telephony routing strategies used, by contact center size
Routing strategy
Small Medium Large Average
Skills-based routing 63% 71% 91% 75%
Least Idle / Least Occupied 63% 64% 81% 70%
Hunt groups 52% 68% 33% 48%
Business rules based on customer identity 12% 32% 41% 26%
Dynamic / service-level routing 11% 14% 34% 20%
Intelligent routing based on customer history 10% 18% 14% 13%
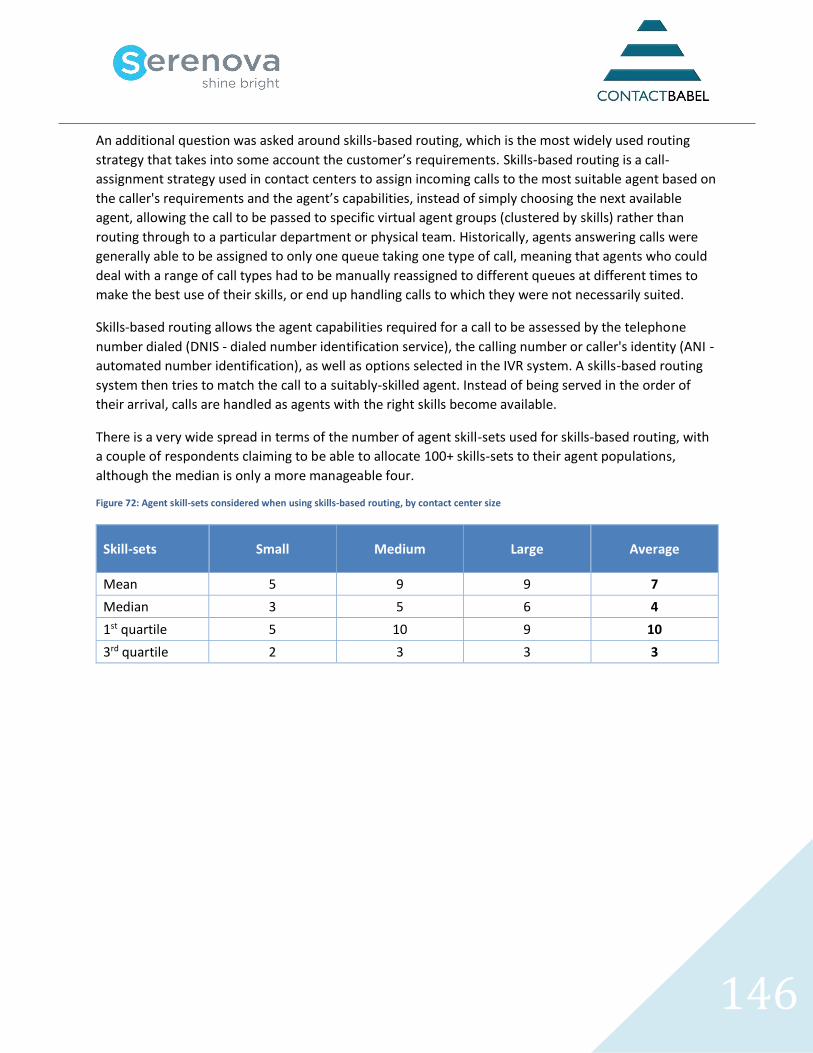
146
An additional question was asked around skills-based routing, which is the most widely used routing
strategy that takes into some account the customer’s requirements. Skills-based routing is a call-
assignment strategy used in contact centers to assign incoming calls to the most suitable agent based on
the caller's requirements and the agent’s capabilities, instead of simply choosing the next available
agent, allowing the call to be passed to specific virtual agent groups (clustered by skills) rather than
routing through to a particular department or physical team. Historically, agents answering calls were
generally able to be assigned to only one queue taking one type of call, meaning that agents who could
deal with a range of call types had to be manually reassigned to different queues at different times to
make the best use of their skills, or end up handling calls to which they were not necessarily suited.
Skills-based routing allows the agent capabilities required for a call to be assessed by the telephone
number dialed (DNIS - dialed number identification service), the calling number or caller's identity (ANI -
automated number identification), as well as options selected in the IVR system. A skills-based routing
system then tries to match the call to a suitably-skilled agent. Instead of being served in the order of
their arrival, calls are handled as agents with the right skills become available.
There is a very wide spread in terms of the number of agent skill-sets used for skills-based routing, with
a couple of respondents claiming to be able to allocate 100+ skills-sets to their agent populations,
although the median is only a more manageable four.
Figure 72: Agent skill-sets considered when using skills-based routing, by contact center size
Skill-sets Small Medium Large Average
Mean 5 9 9 7
Median 3 5 6 4
1st quartile 5 10 9 10
3rd quartile 2 3 3 3
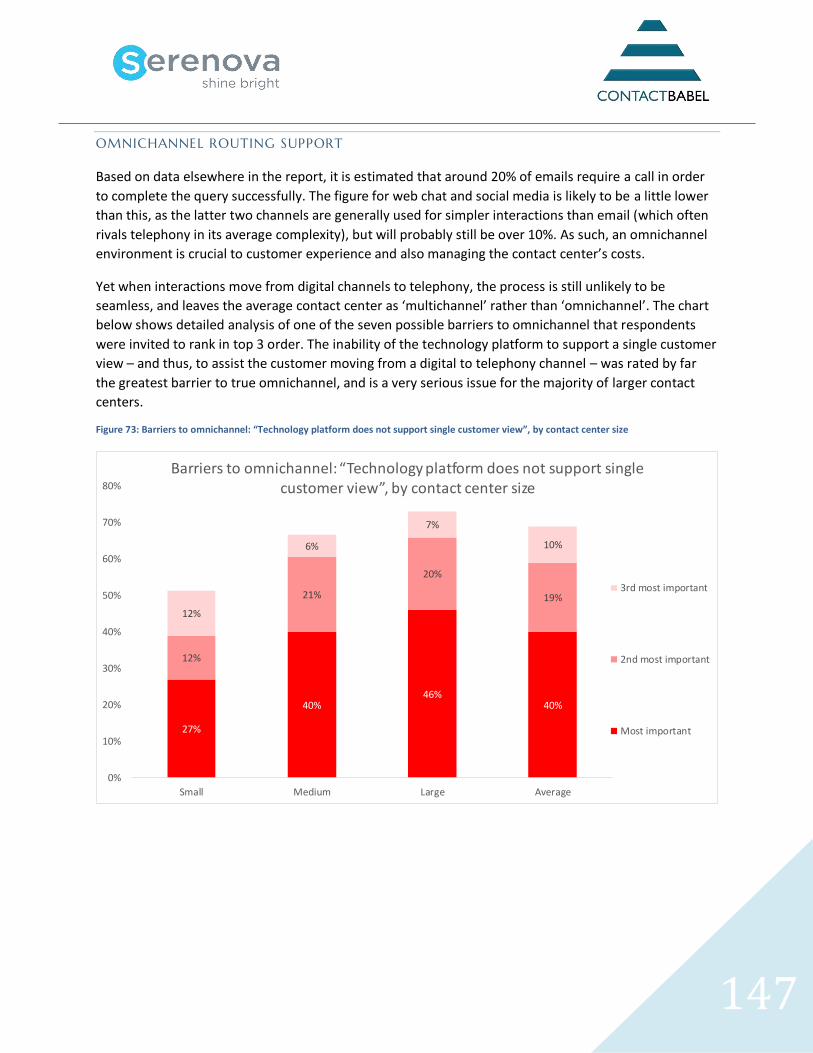
147
OMNICHANNEL ROUTING SUPPORT
Based on data elsewhere in the report, it is estimated that around 20% of emails require a call in order
to complete the query successfully. The figure for web chat and social media is likely to be a little lower
than this, as the latter two channels are generally used for simpler interactions than email (which often
rivals telephony in its average complexity), but will probably still be over 10%. As such, an omnichannel
environment is crucial to customer experience and also managing the contact center’s costs.
Yet when interactions move from digital channels to telephony, the process is still unlikely to be
seamless, and leaves the average contact center as ‘multichannel’ rather than ‘omnichannel’. The chart
below shows detailed analysis of one of the seven possible barriers to omnichannel that respondents
were invited to rank in top 3 order. The inability of the technology platform to support a single customer
view – and thus, to assist the customer moving from a digital to telephony channel – was rated by far
the greatest barrier to true omnichannel, and is a very serious issue for the majority of larger contact
centers.
Figure 73: Barriers to omnichannel: “Technology platform does not support single customer view”, by contact center size
27%
40%46%
40%
12%
21%
20%
19%
12%
6%
7%
10%
0%
10%
20%
30%
40%
50%
60%
70%
80%
Small Medium Large Average
Barriers to omnichannel: “Technology platform does not support single customer view”, by contact center size
3rd most important
2nd most important
Most important
148
Having said that, it is important to realize that omnichannel is not simply about implementing the right
technology. While omnichannel obviously involves supporting multiple channels consistently along the
customer journey, it is vital to understand and create the business process workflows that occur within
each interaction type, not simply across customer service channels, but also reaching into the back
office, financial and order management systems, the distribution process and any other business activity
that is affected by the initial customer contact.
‘Consistency’ is a concept that should be at the forefront of any discussion of omnichannel, as it is
perhaps the key to a successful customer interaction, and applies to many of the elements within this
strategy:
• Look-and-feel / branding across channels
• Unified knowledge base, both for the self-service and live agent environment
• Consistent pricing and stock levels available across all channels
• Single customer history, including the current customer journey and context of where they have
been, updated across channels in real-time. This is particularly important at the boundary
between self-service and live agent interaction: currently, the context and experience of the
customer is usually lost once the move into the live agent environment - breaking down this
boundary is vital to a successful omnichannel experience
• Functionality offered should be consistent where possible: for example, while it is not suitable
to fill in a loan application on public social media, it is possible to carry out a web chat about a
specific question on the loan application form while on the website.
A key aim of omnichannel is to provide a consistency of customer experience, and this requires access
not only to the same master dataset, but also that the same knowledge bases and business logic must
be applied equally. There must be real-time data flow and updates between channels and databases, as
without this, consistency is impossible. Putting such systems and processes in place will not only allow
the seamless escalation of service requests within channels, but also gives the business a chance to use
their automated systems to react to an escalation before it reaches a live agent, deflecting the cost
while fulfilling the service request more quickly. For example, analysis of past interactions may indicate
that if a particular customer has placed an online order, they are likely to ring the contact center within
two days to check on its progress. Making the IVR aware of the customer’s history means that this call
can be intercepted before it reaches an agent, and a personalized IVR experience (with the option to
“Check your order status”) will reduce customer effort and the time and cost of the agent who would
otherwise handle this.
149
For businesses which are currently handling multichannel interactions successfully, there will be little
appetite for starting over with an entirely new customer contact infrastructure. The industry is now
talking about customer engagement hubs / centers, defined by Gartner4 as:
“…referring to a logical set of technologies and business applications that are engineered to
provide customer service and support, regardless of the interaction (or engagement) channel.
The goal of the CEC (Customer Engagement Center) is not only to provide service to customers
as they move among communications channels — including social media and community forums
— while retaining the customers’ context, but also to deliver the appropriate business rule to
determine the next best action, information or process with which to engage the customers.”
This approach allows businesses to leave their working databases, CRM and multichannel contact
applications and infrastructure alone, while being able to update and view an individual’s customer
record at any appropriate point in the customer journey.
4 http://www.gartner.com/it-glossary/customer-engagement-center-cec/
150
PCI DSS COMPLIANCE
PCI DSS BACKGROUND
The Payment Card Industry Data Security Standard (PCI-DSS) is the creation of five of the largest
payment card providers: VISA, MasterCard, American Express, Discover and JCB International, which
together have named themselves the PCI Security Standards Council. The PCI SSC wished to clarify and
align their various fraud prevention measures and regulations into a single agreed global framework. PCI
DSS provides guidance to merchants as well as payment card processors around how to process, store
and transmit information about the payment card and its owner, with the aim of reducing the incidence
of card fraud and promoting best practice in information security. Although compliance with PCI DSS is
not enforced by law, the card brands may fine those banks whose merchants do not follow regulations
(which the banks will pass on), or even deny the merchant the ability to take card payments at all.
There are 12 requirements to fulfil in order to achieve PCI DSS compliance (current details are available
here5), with many specific sub-requirements within them. While all of the requirements have some
impact upon the workings of the contact center, it is generally considered that Requirements 3, 4 and 12
may have the greatest relevance.
Requirement 3: Protect stored cardholder data
This requirement is about reducing the impact of any data breach or fraud, by minimizing the holding of
any unnecessary data as well as reducing the value of any stored payment card information. Data must
only be stored if necessary, and if stored must be strongly encrypted, and only kept for the period where
it is actually needed, with a formal disposal procedure. Businesses should revisit the necessity of data
storage on an ongoing basis, and it should be remembered that the storage of sensitive authentication
data such as card verification codes, is prohibited even if encrypted, and must be permanently deleted
immediately after authorization. The requirements of other regulations (which may mandate keeping
recordings for a long period of time) may need to be balanced against PCI DSS guidelines, with possible
compromises occurring such as archiving encrypted call recordings offsite in a secure facility, with access
to them only in the case of fraud investigation or when proving industry-specific regulatory compliance.
Sensitive authentication data such as the card verification code should normally never be stored, even in
an encrypted format. PCI DSS requirements also indicate that the full card number (PAN) should only be
available on a need-to-know basis, and should otherwise be hidden, with 1234-56XX-XXXX-7890
considered the minimum masking format. For businesses which choose for agents to type in card
details, post-call masking and role-based access to the full PAN should be considered, along with strong
cryptography when stored.
For contact centers, the most obvious place where data is stored as in the recorded environment, and
there is an increased use of RAM scrapers, which is a form of malware that takes data from volatile
memory as it as being processed and before it is encrypted.
5 https://www.pcisecuritystandards.org/document_library?category=pcidss&document=pci_dss
151
Organizations have to determine all of the locations which credit card data could potentially be stored,
even if it is not part of the formal card handling process. For example, there is nothing to stop the
customer sending their credit card details, including the card verification code, by email or web chat: if
the email or chat interaction is then stored, then a risk exists, and the operation is not PCI DSS
compliant. There is an increasing use of data loss prevention solutions as a way to track data that has
somehow moved out of the original environment, and PCI DSS version 3.2 states more clearly than
previously that businesses need to have a good inventory not just of the equipment and infrastructure,
but also of their logical environment as well.
Requirement 4: Encrypt transmission of cardholder data across open, public networks
In the event of a security breach, it is important to make sure that credit card data (such as the PAN, or
‘long card number’) is not readable through the use of strong cryptography, not only at its stored
location but also as it is being passed across the network. The network is only as strong as its weakest
link, and badly configured wireless networks, with out-of-date security and weak passwords are a
particular concern.
Requirement 12: Maintain a policy that addresses information security for all personnel
All employees should be made aware, in writing and through daily exposure to information security
guidelines, of what their responsibilities are in terms of handling data. The regular and ongoing
minimization of potential security risks is perhaps even more important for homeworking agents, who
are less likely to be in a rigidly maintained environment, and whose vigilance and adherence to security
guidelines may therefore be less rigorous.
Compensating controls
Businesses that are unable to fully comply with PCI DSS objectives, for technical or business process
reasons perhaps, may consider implementing ‘compensating controls’, which act as workarounds to
achieve roughly the same aim as the PCI control in situations whereby the end result could not
otherwise be achieved. These are not meant as an alternative to the control objectives, to be used in
cases where the business simply does not want to meet the regulations, but are supposed to act as a
last resort allowing the business to achieve the spirit of the control, if not actually the very letter.
Guidelines for valid compensating controls indicate that it must meet the intent of the original
requirement, and provide a similar level of defense, go at least as far as the original requirement and
not negatively impact upon other PCI DSS requirements.
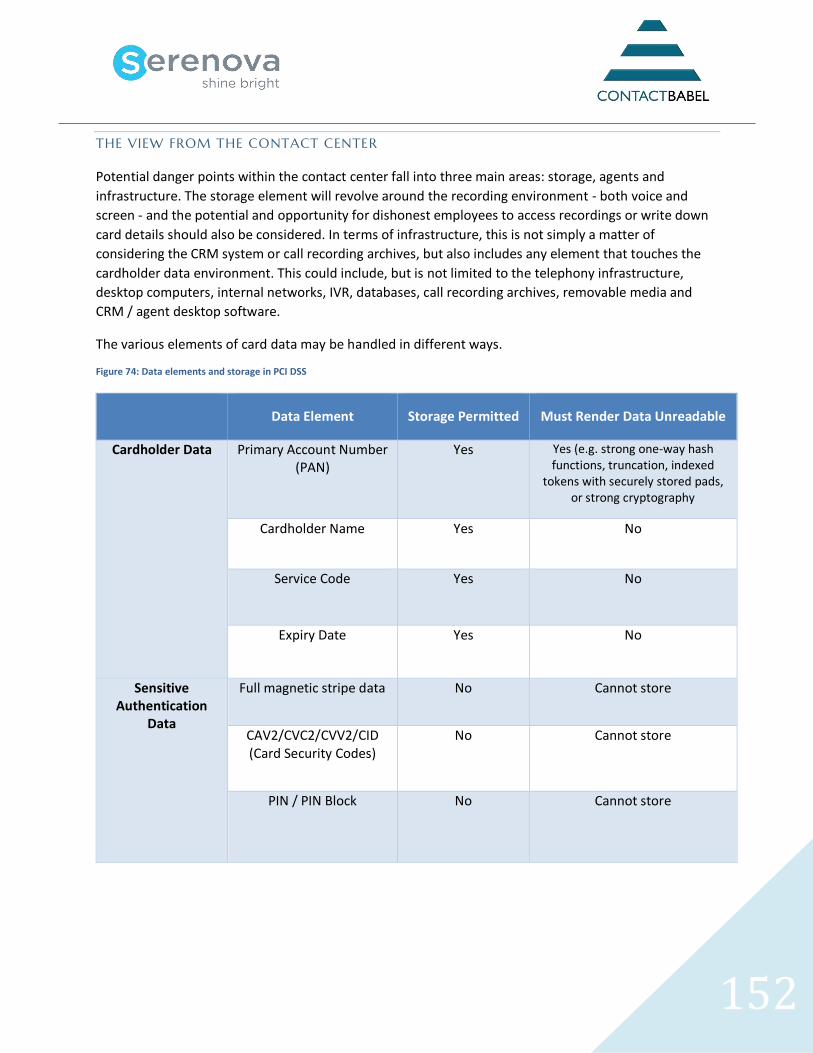
152
THE VIEW FROM THE CONTACT CENTER
Potential danger points within the contact center fall into three main areas: storage, agents and
infrastructure. The storage element will revolve around the recording environment - both voice and
screen - and the potential and opportunity for dishonest employees to access recordings or write down
card details should also be considered. In terms of infrastructure, this is not simply a matter of
considering the CRM system or call recording archives, but also includes any element that touches the
cardholder data environment. This could include, but is not limited to the telephony infrastructure,
desktop computers, internal networks, IVR, databases, call recording archives, removable media and
CRM / agent desktop software.
The various elements of card data may be handled in different ways.
Figure 74: Data elements and storage in PCI DSS
Data Element Storage Permitted Must Render Data Unreadable
Cardholder Data Primary Account Number (PAN)
Yes Yes (e.g. strong one-way hash functions, truncation, indexed
tokens with securely stored pads, or strong cryptography
Cardholder Name Yes No
Service Code Yes No
Expiry Date Yes No
Sensitive Authentication
Data
Full magnetic stripe data No Cannot store
CAV2/CVC2/CVV2/CID (Card Security Codes)
No Cannot store
PIN / PIN Block No Cannot store
153
Compliance with PCI DSS should be seen in the wider context of a far-reaching information security
framework, which may also take into account industry-specific regulations. There is likely to be a
balance to be found between compliance with the various regulations in the context of the business’s
unique processes and internal guidelines. Policies and activities that are helpful include:
• make sure that contact center employees do not share passwords or user IDs with each other, in
order to maintain a segmented and auditable security and access environment
• limit the number of employees given access to full card information. For example, restrict access
to call recordings based on logging and corporate role, only allowing screen recording playbacks
that display payment card information to managers and compliance officers, having it masked
for all other users
• manage the physical and logical access to stored recordings and regularly report upon those
accessing this information
• do not allow payment card data to be transferred through non-encrypted means, including
email, web chat, SMS or other means, and have the means to identify and delete it immediately
if present
• initial focus should be on improving business processes, rather than implementing technology.
For example, analyzing and restricting access to cardholder information to only those employees
who actually need it will significantly reduce the risk of fraud even before implementing any
technology
• quarterly vulnerability scans should be carried out via an external Approved Scanning Vendor
approved by the Payment Card Industry Security Standards Council (PCI SSC), which holds a list
of these. ASVs perform penetration tests on the company’s network in order to verify that it
cannot easily be hacked
• use secure data centers and limit physical access to servers which store payment card
information
• do not record sensitive authentication data such as the card validation code in any
circumstances if possible
• use strong encryption for the storage and transit of voice traffic, call recordings, screen
recordings and personal identification data, making sure that the most current guidelines on
encryption and transmission protocols are adhered to
• up-to-date, fully patched and automated malware, anti-virus and personal firewall software (of
particular importance to homeworkers) - requirements 5 and 6
• regularly review stored data, and keep only that which is necessary for business or regulatory
purposes. For example, hotels need to keep customers credit card details from the reservation
point until checkout: there is no hard and fast rule.
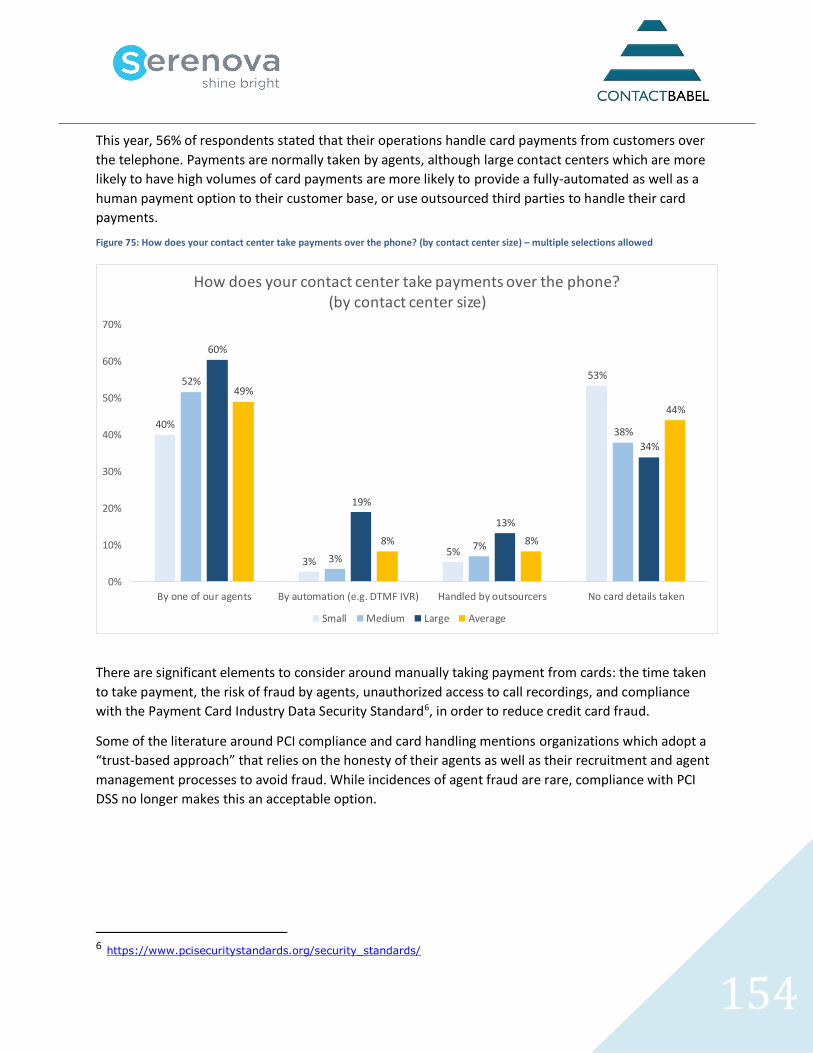
154
This year, 56% of respondents stated that their operations handle card payments from customers over
the telephone. Payments are normally taken by agents, although large contact centers which are more
likely to have high volumes of card payments are more likely to provide a fully-automated as well as a
human payment option to their customer base, or use outsourced third parties to handle their card
payments.
Figure 75: How does your contact center take payments over the phone? (by contact center size) – multiple selections allowed
There are significant elements to consider around manually taking payment from cards: the time taken
to take payment, the risk of fraud by agents, unauthorized access to call recordings, and compliance
with the Payment Card Industry Data Security Standard6, in order to reduce credit card fraud.
Some of the literature around PCI compliance and card handling mentions organizations which adopt a
“trust-based approach” that relies on the honesty of their agents as well as their recruitment and agent
management processes to avoid fraud. While incidences of agent fraud are rare, compliance with PCI
DSS no longer makes this an acceptable option.
6 https://www.pcisecuritystandards.org/security_standards/
40%
3%5%
53%52%
3%7%
38%
60%
19%
13%
34%
49%
8% 8%
44%
0%
10%
20%
30%
40%
50%
60%
70%
By one of our agents By automation (e.g. DTMF IVR) Handled by outsourcers No card details taken
How does your contact center take payments over the phone? (by contact center size)
Small Medium Large Average
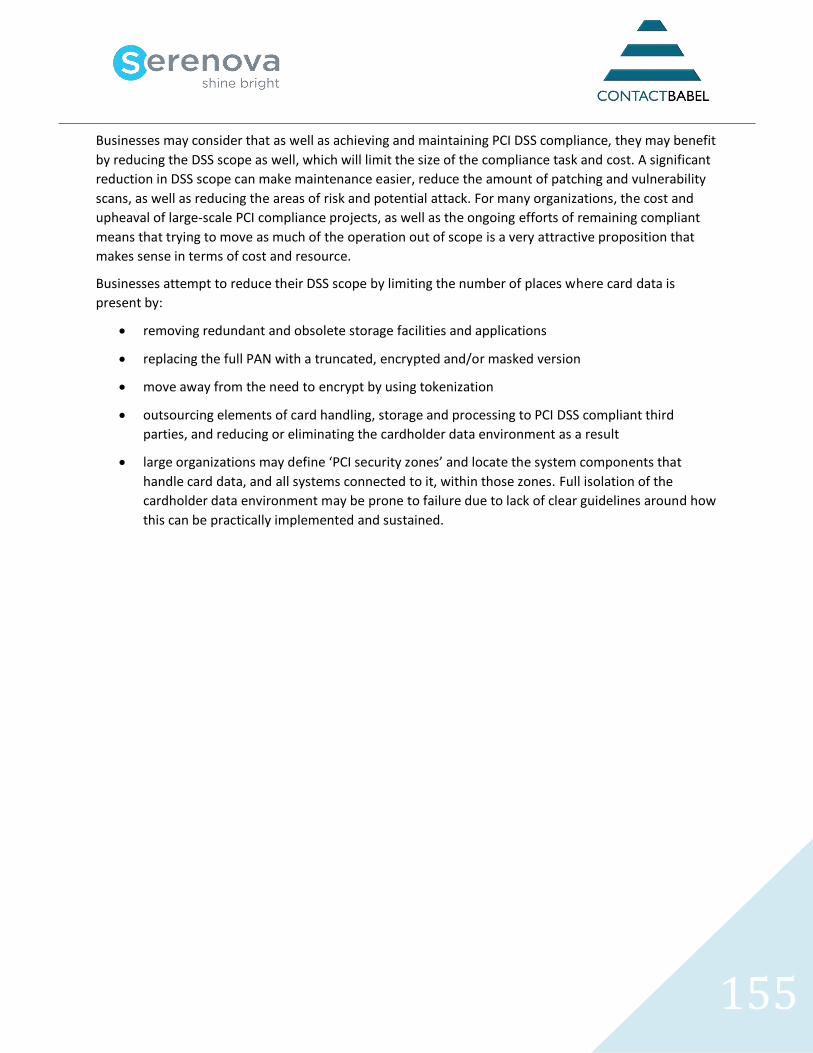
155
Businesses may consider that as well as achieving and maintaining PCI DSS compliance, they may benefit
by reducing the DSS scope as well, which will limit the size of the compliance task and cost. A significant
reduction in DSS scope can make maintenance easier, reduce the amount of patching and vulnerability
scans, as well as reducing the areas of risk and potential attack. For many organizations, the cost and
upheaval of large-scale PCI compliance projects, as well as the ongoing efforts of remaining compliant
means that trying to move as much of the operation out of scope is a very attractive proposition that
makes sense in terms of cost and resource.
Businesses attempt to reduce their DSS scope by limiting the number of places where card data is
present by:
• removing redundant and obsolete storage facilities and applications
• replacing the full PAN with a truncated, encrypted and/or masked version
• move away from the need to encrypt by using tokenization
• outsourcing elements of card handling, storage and processing to PCI DSS compliant third
parties, and reducing or eliminating the cardholder data environment as a result
• large organizations may define ‘PCI security zones’ and locate the system components that
handle card data, and all systems connected to it, within those zones. Full isolation of the
cardholder data environment may be prone to failure due to lack of clear guidelines around how
this can be practically implemented and sustained.
156
PCI DSS compliance is not simply about implementing a piece of technology, as compliance covers
people and business processes, as well as systems. As PCI DSS is replaced and upgraded every few years
(the current version is v.3.2), businesses have tended to implemented a patchwork of solutions and
processes to reduce the danger of card fraud and maintain compliance.
Respondents were presented with a long list of solutions, approaches and business processes that
aimed to reduce the risk of card fraud within the contact center, and were asked to indicate which they
used. It should be noted that some of these methods used do not in themselves render the operation
fully PCI-compliant.
Figure 76: Methods used to assist with PCI compliance
65%
46%
35%
34%
24%
15%
7%
6%
6%
4%
0% 10% 20% 30% 40% 50% 60% 70%
Manual processes and training
Obscure the data entered on an agent's screen
Clean desks / rooms
Pause and resume voice recording
Screen recording does not capture card details
Cloud-based: payment information does not enter contact center
Automated IVR mid-call
Automated IVR at the end of the call
Dedicated internal card payment team
Detect and block the phone's DTMF tones
Methods used to assist with PCI compliance
157
CARD FRAUD REDUCTION METHODS USED
Improving Processes and Agent Training (65%)
The widely used method was that of improving processes and agent training: the biggest risk in any
organization relating to data theft is its staff – not necessarily from fraudsters, but laxity in taking proper
care of data - and the relatively low cost of training and education of the risks can go a long way in
making staff vigilant to perils such as phishing emails and such like. Phishing emails can mean that staff
innocently allow hackers to enter the system, and is a bigger risk than a rogue staff member writing
down card numbers.
The practice of obscuring card details (46%) on an agent’s screen as they are being typed in is a low-
tech way of preventing screenshots of the card data being taken on a smartphone, for example. It can
be linked to IVR data input, so that the agent can see that the card details have been entered by the
caller, but not be able to see exactly what they are. Disabling screen recording (24%) in the card input
screen also reduces the risk of card data being hacked, as it is simply not available to be stolen.
Pause and Resume (34%)
‘Pause and resume’ or ‘stop-start’ recording aims to prevent sensitive authentication data and other
confidential information from entering the call recording environment. Pause and resume may be agent-
initiated, act for a fixed time period (e.g. stopping recording for a minute), or be fully automated. The
PCI DSS standard could be interpreted as to prefer automation over manual intervention to avoid
human error. Automated pause and resume may use an API or desktop analytics to link the recording
solution to the agent desktop or CRM application, being triggered when agent navigates to a payment
screen, for example. The recording may then be paused, to be resumed at the time when the agent
leaves the payment screen, which in theory should remove the period of time whereby the customer is
reading out the card details. This method, one of the most popular, has several obvious benefits, not
least of which include a low set-up cost and the speed of implementation.
There are also alternative options, such as muting the recording or playing a continuous audio tone to
the recording system while payment details are being collected, rather than actually pausing the
recording, meaning that there is still a single call recording which can be used for QA and compliance
purposes. This principle is similar to that applied to screen recording applications, where 24% of
respondents stated that their application does not record card details from the agent’s screen. 46% of
respondents mask card details on the agent’s screen, to prevent copies being made.
158
Clean Desks / Rooms (35% / 6%)
Some organizations set up dedicated payment teams (6%), working away from other agents, often in a
clean room environment with no pens, paper or mobile phones, so that customers can be passed
through this team to make payment. As these agents have a single responsibility - handling card
payments - sometimes they are underutilized, and at other times there can be a queue of people
waiting to make payments. In terms of the customer experience, this latter scenario is suboptimal. A
clean room is generally not seen as being a particularly pleasant working environment for agents, being
Spartan of necessity. Not being able to be in touch with the outside world, for example with children or
schools, can be a significant problem for some agents. It has been estimated that it takes around $3,000
per agent per year to create and maintain a clean room environment. Implementing a clean desk policy
in the contact center (rather than a dedicated clean room) will reduce the opportunity for agents to
write down card details, but cannot be relied upon to prevent fraud.
Post-Call IVR Payments (6%)
A minority of respondents, especially those with a large contact centers, using automated IVR process to
take card details from the customer, cutting the agent risk out of the loop entirely. Mid-call IVR (or
agent assisted IVR) (7%) is more popular than post-call IVR (6%), as it is seen as a more customer-
friendly approach: the caller may have additional questions or the requirement for reassurance and
confirmation after the payment process, perhaps around delivery times or other queries not related to
the payment process.
Detect and Block the Phone’s DTMF Tones (4%)
4% of this year’s respondents use DTMF suppression in order to assist with their PCI compliance. DTMF
suppression describes the practice of capturing DTMF tones and altering them in such a way that
cardholder details cannot be identified either by the agent, the recording environment or any
unauthorized person listening in. DTMF suppression aims to take the agent out of scope as well as the
storage environment, as card details on the agent’s screen may be masked as well as the DTMF tones
being neutralized (thus removing any - albeit theoretically small - danger of a handheld recorder being
used).
At the point in the conversation where payment is to be taken, the agent directs the customer to type in
their card details using the telephone keypad. The DTMF tones are altered so that they no longer
represent the card number or sensitive authentication details. The caller inputs their card data via a
touchtone keypad in a similar way to an IVR session, keeping them in touch with the agent at any point
in the transaction in case of difficulty, clarification or confirmation. There are anecdotal references made
to an average time-saving per call of around 10 seconds if the caller types in their own card details
rather than reading them out and having confirmed by an agent.
159
Third-Party Cloud-Based Payment Solution (15%)
11% of this year’s respondents use third-party cloud-based payment solutions, which is far more likely
to be the case in larger operations. Using a hosted or cloud-based solution to intercept card data at the
network level means that no cardholder data is passed into the contact center environment, whether
infrastructure, agents or storage. As such, this can be seen to de-scope the entire contact center from
PCI compliance. Like any cloud or hosted solution, it relies heavily upon the security processes and
operational effectiveness of the service provider, although the PCI DSS attestation of compliance and
external audits, along with regular penetration testing may well show superior levels of security over
that present in-house. Some cloud-based solutions may require greater levels of integration or
configurations than their on-site equivalents, but most seem to be engineered in such a way as to
minimize changes to the contact center systems, processes or agent activities.
Tokenization
In this discussion, the practice of tokenization should also be mentioned. Tokenization takes place in
order to protect sensitive card information such as the PAN (primary account number or ‘long card
number’) by replacing it with non-sensitive data which merely represents the initial data. The purpose of
this is to devalue the data so that even if it is hacked or stolen, it is of no use to a criminal. One of the
main benefits to tokenization is that it requires little change to the existing environment or business
processes, as apart from the addition of a decoding mechanism, the flow of data, its capture and
processing works in the same way as if it were true card information coming into the contact center
environment.
A customer entering a 16-digit card number might have six digits within the middle of the card taken out
and replaced by entirely different digits, before this information is passed as DTMF tones into the
contact center environment. This allows the contact center to be outside PCI scope, as there is actually
no real cardholder data entering the environment, as well as making it a less attractive target for data
hacking and stealing. Tokenization does not require special integration with existing payment processes,
storage systems, telephony or IVR systems, nor does the agent desktop have to change as the same data
format is coming into the desktop environment.
The first stage of tokenization is to collect the actual cardholder data via DTMF tones. For each key
press, the solution replaces the associated tone with a neutral or silent tone, and sends the actual
number relating to the DTMF tone elsewhere within the solution in order to be tokenised. Card numbers
and sensitive authentication data such as card validation codes are replaced as necessary, and the new
tokenised DTMF tones are played down the line to the contact center. The actual cardholder data is held
temporarily within the hosted environment.
160
Within the contact center environment, the tokenised DTMF goes to the same places that the existing
payment process defines, being recorded as usual and going to the agent desktop just as if the card
information was actually true, passing through a decoder (which may be hardware or software) which
converts the tones to keystrokes that are entered in the payment screen. As the card data is only a
tokenised representation, it cannot be said to be actual cardholder data and thus does not fall into the
scope of PCI DSS compliance.
Once the agent submits the tokenised payment card details, the transaction is sent back to the hosted
environment, where the tokenised data is matched and converted back into the actual cardholder
information, which is passed on to the payment service provider, which returns the usual payment
success/failure confirmation.
Of course, cardholder data is not the only DTMF-provided information coming into the contact center
environment, as other data such as IVR routing options and the entry of account numbers often requires
capture of DTMF tones as well. Various configuration options exist within solutions, based upon the
specifics of the business in order to circumvent confusion. Customers should check that any hosted
tokenization solution will not alter the performance of any required card number validation checks,
including card length, range validation and ‘Luhn’ checks (to make sure a card number ‘looks right’
before presenting it to the payment services provider). The PCI SSC has published tokenization product
security guidelines7.
There seems to be an awareness that relying on manual processes and training is not sufficient, and
methods such as third-party cloud-based card handling and field masking have definitely grown in use.
Further details about all of these methods, as well as other approaches to take, are investigated in depth
in ContactBabel’s free report, “The Inner Circle Guide to PCI DSS Compliance in the Contact Center”,
which is available from www.contactbabel.com/reports.cfm
7 https://www.pcisecuritystandards.org/documents/Tokenization_Product_Security_Guidelines.pdf
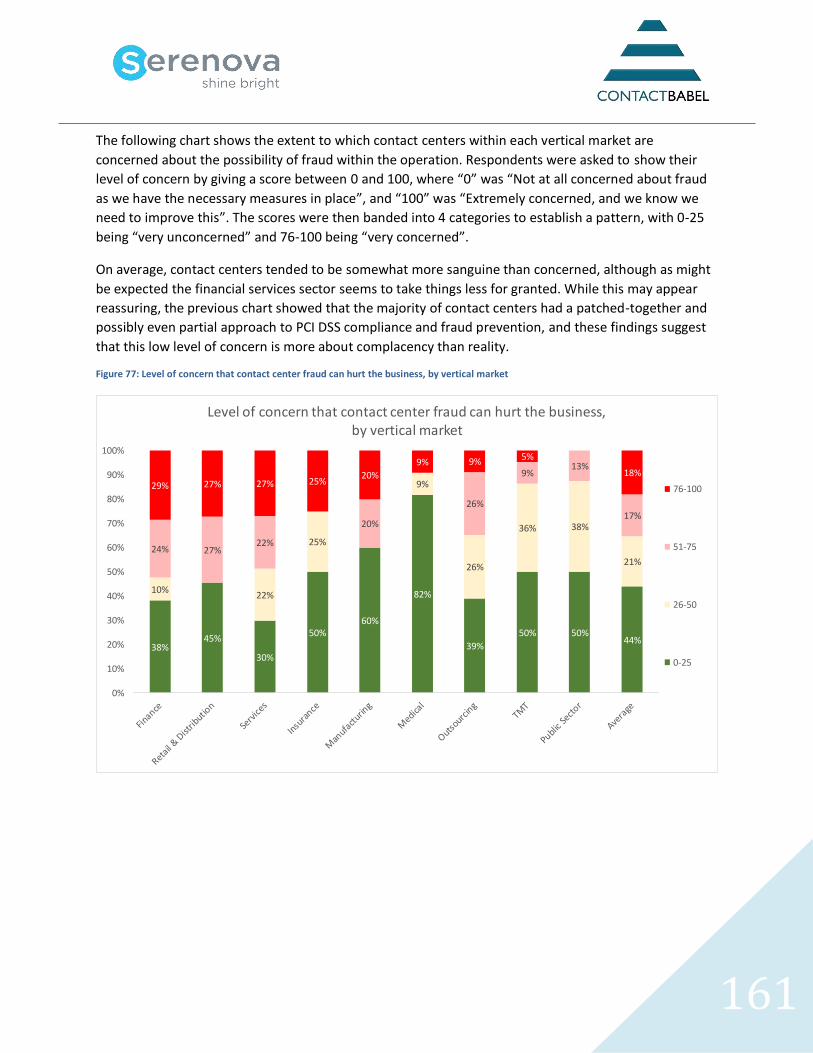
161
The following chart shows the extent to which contact centers within each vertical market are
concerned about the possibility of fraud within the operation. Respondents were asked to show their
level of concern by giving a score between 0 and 100, where “0” was “Not at all concerned about fraud
as we have the necessary measures in place”, and “100” was “Extremely concerned, and we know we
need to improve this”. The scores were then banded into 4 categories to establish a pattern, with 0-25
being “very unconcerned” and 76-100 being “very concerned”.
On average, contact centers tended to be somewhat more sanguine than concerned, although as might
be expected the financial services sector seems to take things less for granted. While this may appear
reassuring, the previous chart showed that the majority of contact centers had a patched-together and
possibly even partial approach to PCI DSS compliance and fraud prevention, and these findings suggest
that this low level of concern is more about complacency than reality.
Figure 77: Level of concern that contact center fraud can hurt the business, by vertical market
38%45%
30%
50%60%
82%
39%
50% 50%44%
10%22%
25%
9%
26%
36% 38%
21%24% 27%
22%
20%
26%
9%13%
17%
29% 27% 27% 25%20%
9% 9% 5%
18%
0%
10%
20%
30%
40%
50%
60%
70%
80%
90%
100%
Level of concern that contact center fraud can hurt the business, by vertical market
76-100
51-75
26-50
0-25
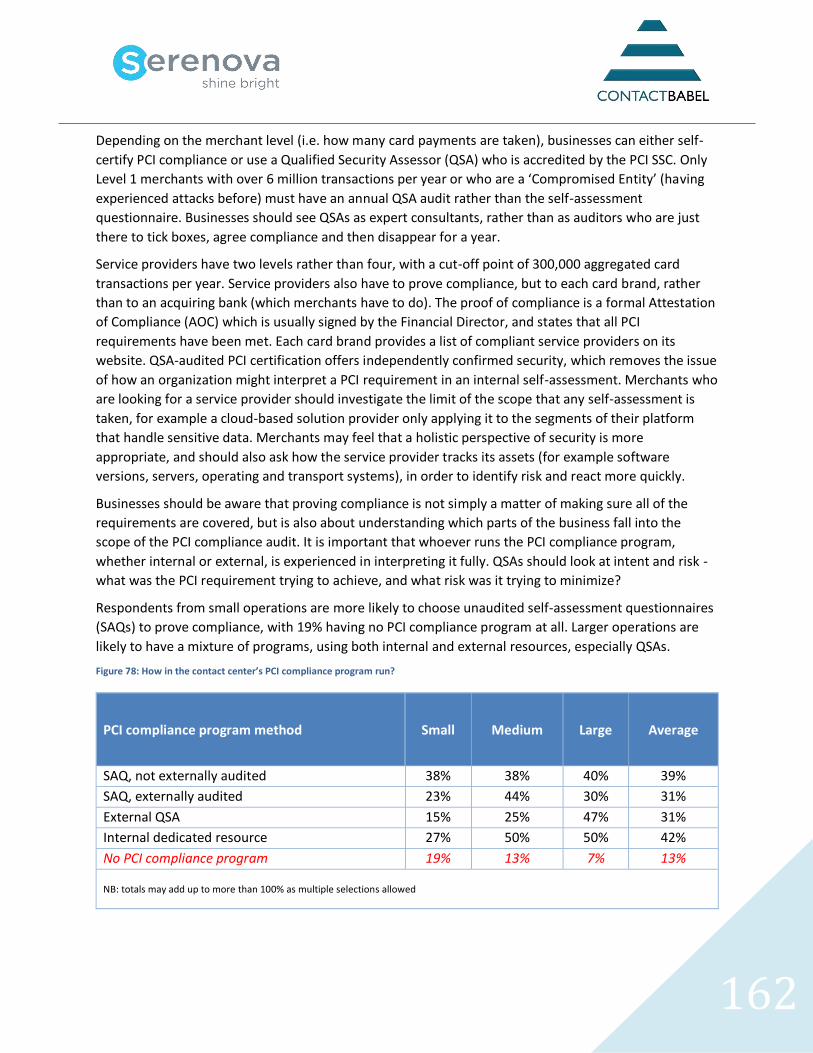
162
Depending on the merchant level (i.e. how many card payments are taken), businesses can either self-
certify PCI compliance or use a Qualified Security Assessor (QSA) who is accredited by the PCI SSC. Only
Level 1 merchants with over 6 million transactions per year or who are a ‘Compromised Entity’ (having
experienced attacks before) must have an annual QSA audit rather than the self-assessment
questionnaire. Businesses should see QSAs as expert consultants, rather than as auditors who are just
there to tick boxes, agree compliance and then disappear for a year.
Service providers have two levels rather than four, with a cut-off point of 300,000 aggregated card
transactions per year. Service providers also have to prove compliance, but to each card brand, rather
than to an acquiring bank (which merchants have to do). The proof of compliance is a formal Attestation
of Compliance (AOC) which is usually signed by the Financial Director, and states that all PCI
requirements have been met. Each card brand provides a list of compliant service providers on its
website. QSA-audited PCI certification offers independently confirmed security, which removes the issue
of how an organization might interpret a PCI requirement in an internal self-assessment. Merchants who
are looking for a service provider should investigate the limit of the scope that any self-assessment is
taken, for example a cloud-based solution provider only applying it to the segments of their platform
that handle sensitive data. Merchants may feel that a holistic perspective of security is more
appropriate, and should also ask how the service provider tracks its assets (for example software
versions, servers, operating and transport systems), in order to identify risk and react more quickly.
Businesses should be aware that proving compliance is not simply a matter of making sure all of the
requirements are covered, but is also about understanding which parts of the business fall into the
scope of the PCI compliance audit. It is important that whoever runs the PCI compliance program,
whether internal or external, is experienced in interpreting it fully. QSAs should look at intent and risk -
what was the PCI requirement trying to achieve, and what risk was it trying to minimize?
Respondents from small operations are more likely to choose unaudited self-assessment questionnaires
(SAQs) to prove compliance, with 19% having no PCI compliance program at all. Larger operations are
likely to have a mixture of programs, using both internal and external resources, especially QSAs.
Figure 78: How in the contact center’s PCI compliance program run?
PCI compliance program method
Small Medium Large Average
SAQ, not externally audited 38% 38% 40% 39%
SAQ, externally audited 23% 44% 30% 31%
External QSA 15% 25% 47% 31%
Internal dedicated resource 27% 50% 50% 42%
No PCI compliance program 19% 13% 7% 13% NB: totals may add up to more than 100% as multiple selections allowed
163
CUSTOMER IDENTITY VERIFICATION
Customer security processes are about two factors: are you who you say you are, and are you allowed to
do what you are trying to do?
Until a few years ago many businesses relied on trust that the caller was who they claimed to be, asking
only for a name and address. Today, strong identity verification processes are now seen as critically
important and most calls that are not initial enquiries will need to verify a caller’s claimed identity by
asking for additional information that only the real customer should know. The increasing focus upon
fraud detection, strengthened by the need to comply with regulations, has meant that identity
verification continues to become more important year-on-year, yet businesses have been slow to take
up alternatives to the traditional challenge/response method.
Identity theft is high-profile, and businesses have tightened security and been seen to do so by their
customers: fraud prevention is a brand issue, as well as a regulatory one. While fraud certainly causes
losses to a business, along with the threat of regulatory fines, risk of losing customers’ confidence by
being seen as lackadaisical about security is at least as great a risk. Criminals’ methods and the
technology used have become more sophisticated, and businesses responded by introducing ever more
complex identity verification processes.
In many cases, customer identity verification has become intrusive and inconvenient for the customer,
who is expected to remember an increasing array of IDs, passwords, PINs, memorable information, or
details of their last transactions. Customers can undergo a ‘Spanish Inquisition’ before being permitted
to make their enquiry or place their order – not only reducing customer satisfaction, but also costing
businesses time and money. It takes an average of over 30 seconds to verify a customer’s identity
manually, and this mounts up considerably: the US contact center industry spends many billions of
dollars each year, just to verify the caller is who they claim to be, and are permitted to do what they are
asking.
Over the past ten years, our surveys have found that over 40% more calls now require identity checks,
which themselves take considerably longer due to more stringent testing. Although in-call efficiency has
improved, identify verification is no faster than it ever was: all factors which drive up the cost of initial
identification.
Identity verification processes are typically based on one or more authentication factors that fall into the
following generally-accepted categories
• something you know - e.g. password, PIN or memorable information
• something you are - a biometric such as a fingerprint, retina pattern or voiceprint
• something you have - a tangible object, e.g. a PIN-generating key fob, or the 3- or 4-digit
security code on payment cards.
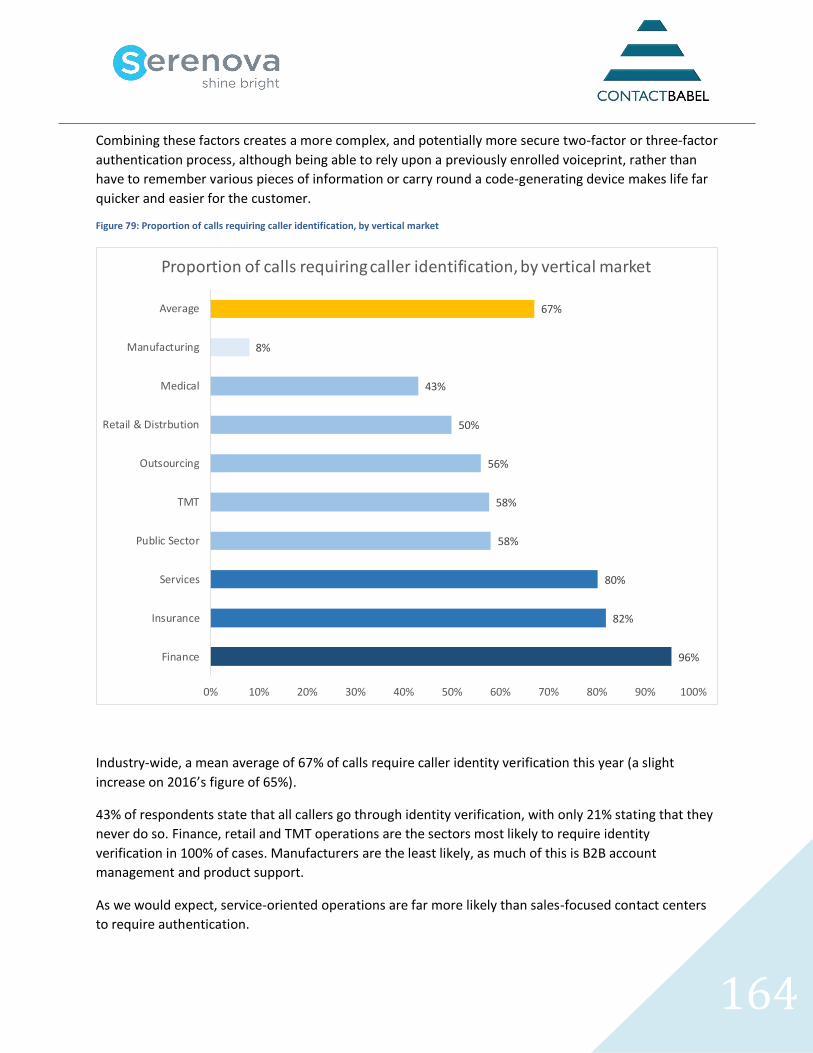
164
Combining these factors creates a more complex, and potentially more secure two-factor or three-factor
authentication process, although being able to rely upon a previously enrolled voiceprint, rather than
have to remember various pieces of information or carry round a code-generating device makes life far
quicker and easier for the customer.
Figure 79: Proportion of calls requiring caller identification, by vertical market
Industry-wide, a mean average of 67% of calls require caller identity verification this year (a slight
increase on 2016’s figure of 65%).
43% of respondents state that all callers go through identity verification, with only 21% stating that they
never do so. Finance, retail and TMT operations are the sectors most likely to require identity
verification in 100% of cases. Manufacturers are the least likely, as much of this is B2B account
management and product support.
As we would expect, service-oriented operations are far more likely than sales-focused contact centers
to require authentication.
96%
82%
80%
58%
58%
56%
50%
43%
8%
67%
0% 10% 20% 30% 40% 50% 60% 70% 80% 90% 100%
Finance
Insurance
Services
Public Sector
TMT
Outsourcing
Retail & Distrbution
Medical
Manufacturing
Average
Proportion of calls requiring caller identification, by vertical market
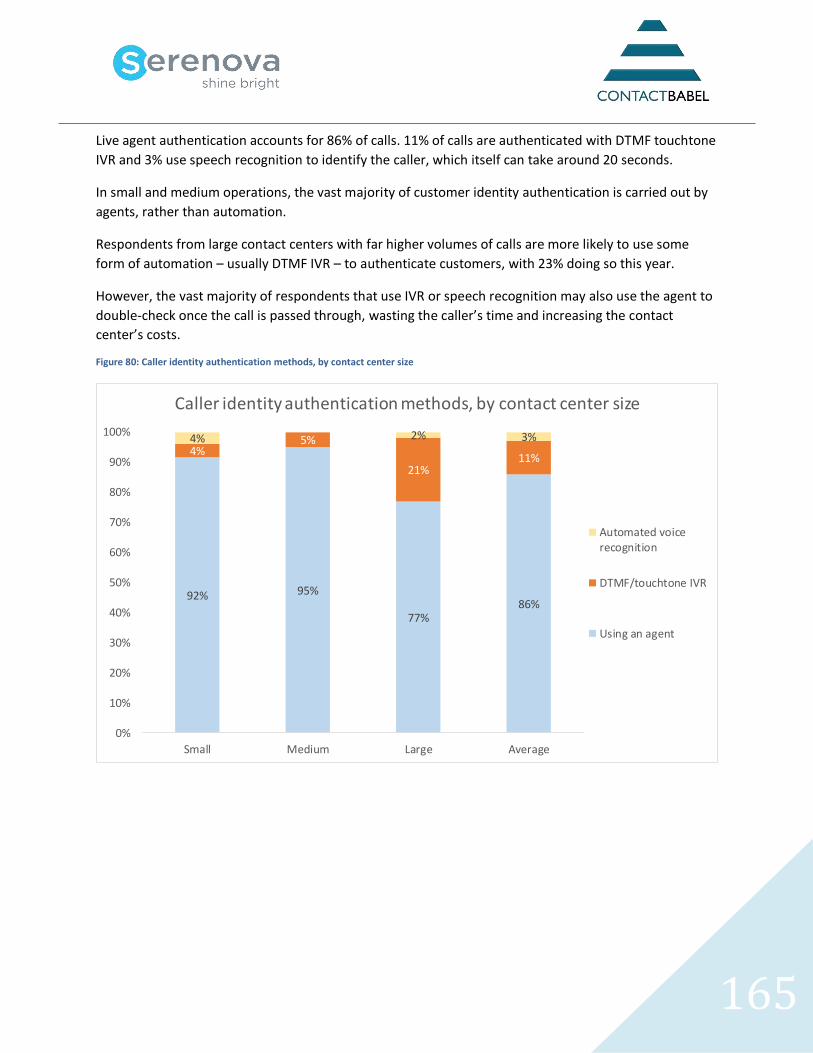
165
Live agent authentication accounts for 86% of calls. 11% of calls are authenticated with DTMF touchtone
IVR and 3% use speech recognition to identify the caller, which itself can take around 20 seconds.
In small and medium operations, the vast majority of customer identity authentication is carried out by
agents, rather than automation.
Respondents from large contact centers with far higher volumes of calls are more likely to use some
form of automation – usually DTMF IVR – to authenticate customers, with 23% doing so this year.
However, the vast majority of respondents that use IVR or speech recognition may also use the agent to
double-check once the call is passed through, wasting the caller’s time and increasing the contact
center’s costs.
Figure 80: Caller identity authentication methods, by contact center size
92% 95%
77%86%
4%5%
21%11%
4% 2% 3%
0%
10%
20%
30%
40%
50%
60%
70%
80%
90%
100%
Small Medium Large Average
Caller identity authentication methods, by contact center size
Automated voicerecognition
DTMF/touchtone IVR
Using an agent
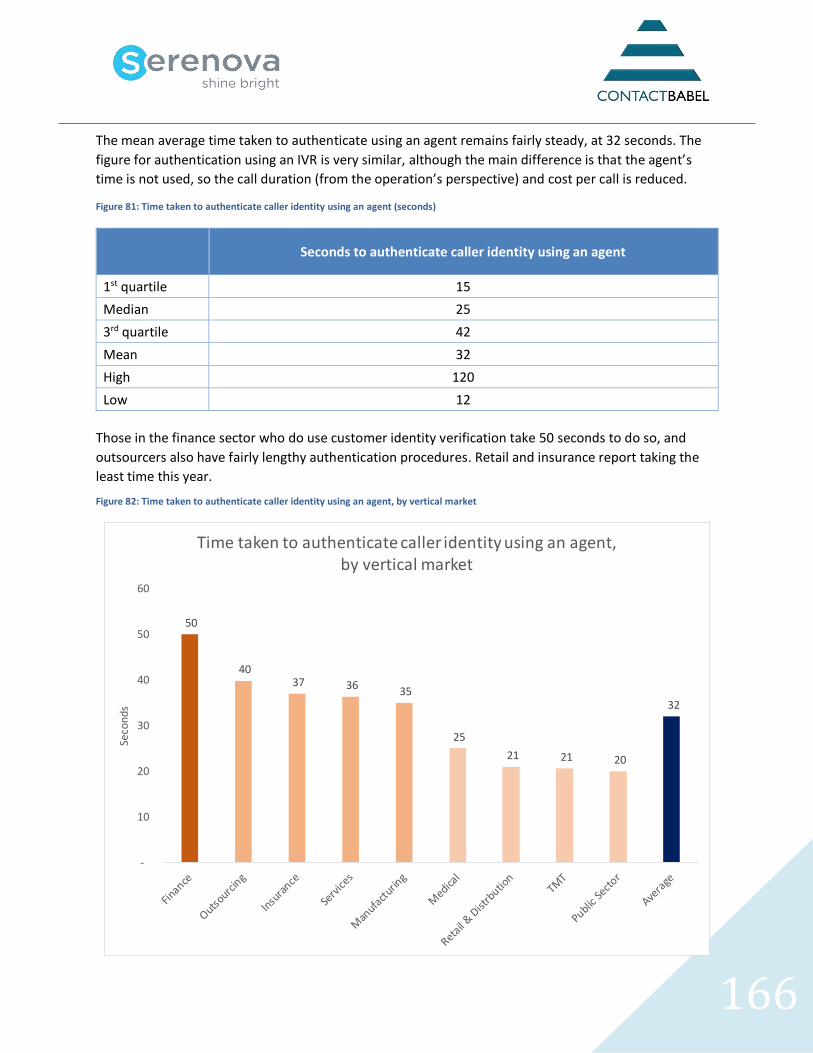
166
The mean average time taken to authenticate using an agent remains fairly steady, at 32 seconds. The
figure for authentication using an IVR is very similar, although the main difference is that the agent’s
time is not used, so the call duration (from the operation’s perspective) and cost per call is reduced.
Figure 81: Time taken to authenticate caller identity using an agent (seconds)
Seconds to authenticate caller identity using an agent
1st quartile 15
Median 25
3rd quartile 42
Mean 32
High 120
Low 12
Those in the finance sector who do use customer identity verification take 50 seconds to do so, and
outsourcers also have fairly lengthy authentication procedures. Retail and insurance report taking the
least time this year.
Figure 82: Time taken to authenticate caller identity using an agent, by vertical market
50
40 37 36
35
25
21 21 20
32
-
10
20
30
40
50
60
Seco
nd
s
Time taken to authenticate caller identity using an agent, by vertical market
167
The unnecessary cost of caller authentication
Using figures from this report and other ContactBabel research, it is possible to estimate the industry-
wide cost of customer identification authentication using an agent. Please note that as respondents
change each year, this figure is an indicative estimate based on this year’s survey and should be read as
such.
67% of all calls require a security and identification process to be completed first. This year, 86% of calls
were reported to be authenticated by agents. On average, it takes 32 seconds to go through security.
Using these statistics, it is possible to estimate how much US contact centers spend each year on
screening customers by using agents.
Inbound calls per year (handled by agents): 36.0bn8
Proportion of inbound calls that require security and identification checks: 67%
Average length of agent-handled security and identification check: 32 seconds
Average call duration: 7m 04s (therefore 7.5% of the call is ID&V)
Mean average cost per inbound call: $4.42
Cost of time spent on agent-handled security and identification check: 33.2c per call
Overall cost of agent-handled security and identification checking: $8bn per year
8 ContactBabel, “US Contact Centers 2017-2021: The State of the Industry”
168
To recap, there are several factors to consider when trying to predict changes in the ways in which
customers are identified:
• businesses want to reduce the cost of fraud
• customers want convenience, but also their personal information and assets protected
• businesses need to comply with existing and new laws and regulations
• the contact center industry spend excessive amounts of money on identifying and verifying
customer identities
• existing methods of identity verification (e.g. PIN, password, device, etc.) are not secure and/or
are user-unfriendly
• it is not just criminal fraud that identity verification aims to stop. The issue of privacy, especially
in the healthcare vertical market, is a powerful driver for using right-party authentication to
facilitate personal information sharing. This is also the case when using speech-enabled
automated outbound calls, it being necessary to make sure that the person answering the call is
the one to which the business actually needs to talk.
169
THE EMERGENCE OF BIOMETRIC TECHNOLOGIES
Biometric technology uses physiological or behavioral characteristics to verify a person's claimed
identity. Physiological biometrics includes fingerprints, iris, or retina recognition, and voice verification.
Behavioral biometrics includes signature verification, gait and keystroke dynamics.
Of these, voice is the only biometric that can currently be used over the phone, making it a viable
identity verification solution for contact centers. It should be noted that some businesses now allow
thumbprint-enabled smartphones to be used as trusted devices to log into mobile apps.
Voice verification systems use spoken words to generate a voiceprint, and each call can be compared
with a previously enrolled voiceprint to verify a caller’s identity. Systems generate a voiceprint by using
spoken words to calculate vocal measurements of a caller’s vocal tract, thereby creating a unique digital
representation of an individual’s voice, as well as other physical and behavioral factors, including
pronunciation, emphasis, accent and speech rate. These systems are not affected by factors such as the
caller having a cold, using different types of phones, or aging.
A significant advantage of voice biometric verification is that both enrollment and verification can be
done unobtrusively - in the background during the natural course of customers’ conversations with an
agent - using text-independent and language-independent technology. Real-time authentication
significantly reduces average handle time and improves the customer experience by utilizing voice
biometrics to authenticate customers within the course of the conversation.
With this advanced technology, contact centers can:
• Voiceprint the vast majority of customers for seamless passive enrolment: in the course of a
conversation, a voiceprint is created for that customer which lies on record for them to be
authenticated against on the next call
• Securely authenticate customers with zero customer effort: the first few seconds of a call will be
enough to match the customer’s voiceprint against those on record
• Cut seconds off average handle time: no need for customers to answer numerous security
questions as the conversation they are having provides enough information to identify them
• Significantly reduce fraud risk for all customers, and deter fraudsters when combined with other
layers of security, for example, phoneprinting, which analyzes the background audio of the call.
170
The customer’s experience
Since speaking is natural and intuitive, a well-planned implementation can result in a better customer
experience that eliminates the need for PINs or passwords. For example:
• In the case of text- and language-independent authentication, the customer’s voiceprint
(collected on previous calls) is authenticated in the background during the natural course of
conversation with an agent, while simply outlining their service request - minimizing both
customer effort and time-to-service. There is no need to remember PINs or passwords, which
greatly improves the customer’s experience
• ‘Account Number’-based voice verification - the caller is asked to speak their account number.
The account number identifies the caller, and the spoken words are used to generate a
voiceprint that verifies the caller is the account holder
• ‘Challenge Response’. Typically, the customer is asked to repeat a series of numbers, e.g.
“Please say ‘one seven three four’”. The spoken words are used to generate a voiceprint. The
numbers spoken are usually different each time the caller phones.
In cases where a two-factor authentication process is required, voice verification can be combined with
a ‘something you know’ - such as an answer to a memorable question. Real-time agent guidance can
prompt agents to ask a further security question within the call if the process requires it.
The business benefits
Businesses benefit from two types of savings. These can be illustrated in the following example:
A contact center receives 10 million inbound calls per annum with the existing identity verification
procedure taking on average 32 seconds and being performed by an agent:
• Eliminating the time taken by an agent to verify a caller’s identity can save 33.2c per call
($3.32m per annum)
• Secure automated identity verification enables a broader range of fully automated services
to be offered, reducing agent cost.
The potential benefits for the business are huge, and the customer also gains through a better
experience, longer opening hours and greater identity protection.
Similar savings will also be found in the case of text-independent authentication, where the caller’s
voiceprint is authenticated within the natural course of the conversation. The agent begins each call by
immediately asking how they can help the customer, and the authentication process is carried out by
voiceprint verification at the same time that the agent is listening to the caller and preparing to help
them.
171
It is also possible to use contextual analysis, such as the caller’s geolocation (as detailed from their
cellphone’s GPS coordinates, or their ANI) to add another layer of confidence in the security process,
automatically notifying the agent whether the caller has been identified successfully, and guiding the
agent to ask alternative questions if further verification is required.
Voice verification can also be used to protect the enterprise against repudiation (where the customer
says at a later date that they did not do it) as it can verify the physical presence of an individual at the
other end of a phone line. Interestingly, this capability is already used by various US law enforcement
agencies to check that released offenders are where they should be.
For procedures such as internet password resetting, the higher level of security achieved with voice
verification can enable businesses to offer real-time password resets or reminders. This benefits both
customer and business and can reduce up to 70% of helpdesk calls.
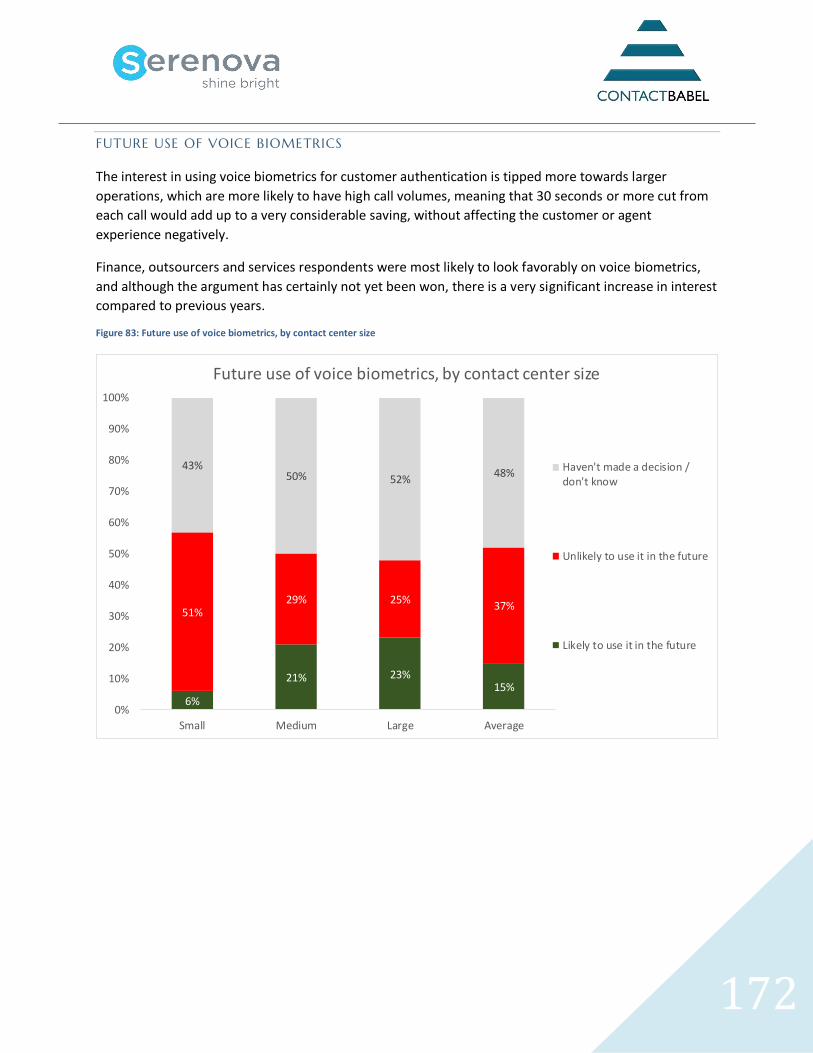
172
FUTURE USE OF VOICE BIOMETRICS
The interest in using voice biometrics for customer authentication is tipped more towards larger
operations, which are more likely to have high call volumes, meaning that 30 seconds or more cut from
each call would add up to a very considerable saving, without affecting the customer or agent
experience negatively.
Finance, outsourcers and services respondents were most likely to look favorably on voice biometrics,
and although the argument has certainly not yet been won, there is a very significant increase in interest
compared to previous years.
Figure 83: Future use of voice biometrics, by contact center size
6%
21% 23%15%
51%29% 25%
37%
43%50% 52%
48%
0%
10%
20%
30%
40%
50%
60%
70%
80%
90%
100%
Small Medium Large Average
Future use of voice biometrics, by contact center size
Haven't made a decision /don't know
Unlikely to use it in the future
Likely to use it in the future
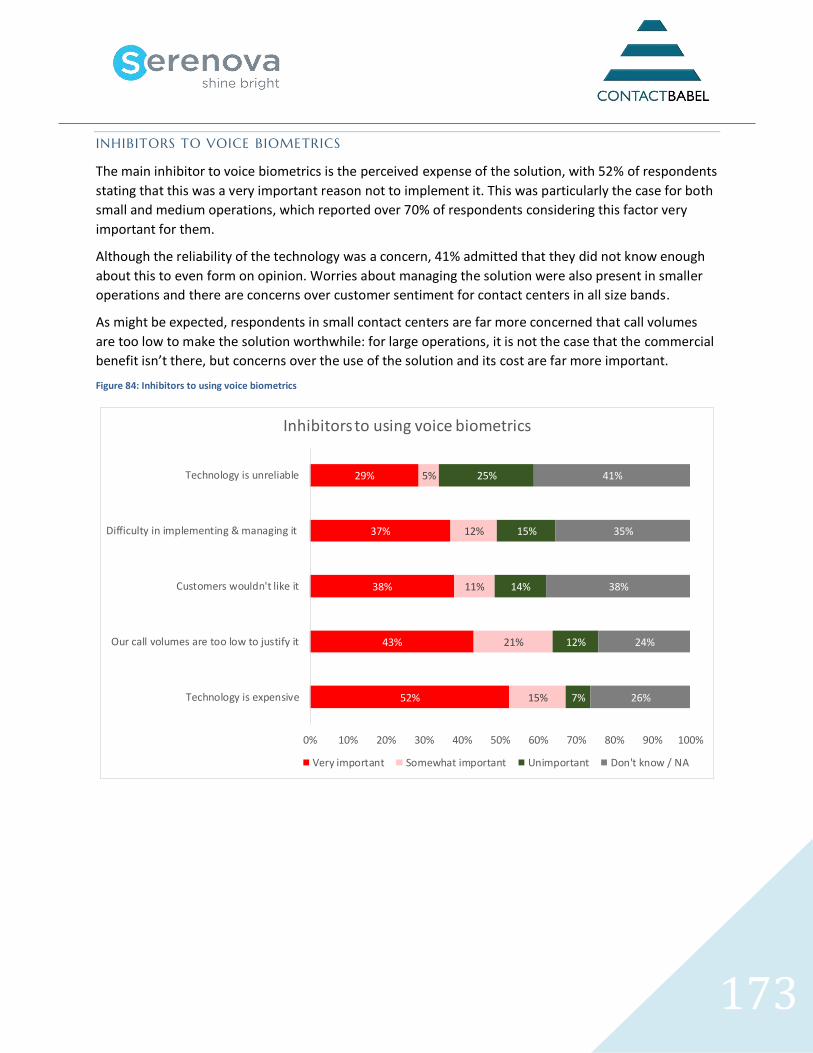
173
INHIBITORS TO VOICE BIOMETRICS
The main inhibitor to voice biometrics is the perceived expense of the solution, with 52% of respondents
stating that this was a very important reason not to implement it. This was particularly the case for both
small and medium operations, which reported over 70% of respondents considering this factor very
important for them.
Although the reliability of the technology was a concern, 41% admitted that they did not know enough
about this to even form on opinion. Worries about managing the solution were also present in smaller
operations and there are concerns over customer sentiment for contact centers in all size bands.
As might be expected, respondents in small contact centers are far more concerned that call volumes
are too low to make the solution worthwhile: for large operations, it is not the case that the commercial
benefit isn’t there, but concerns over the use of the solution and its cost are far more important.
Figure 84: Inhibitors to using voice biometrics
52%
43%
38%
37%
29%
15%
21%
11%
12%
5%
7%
12%
14%
15%
25%
26%
24%
38%
35%
41%
0% 10% 20% 30% 40% 50% 60% 70% 80% 90% 100%
Technology is expensive
Our call volumes are too low to justify it
Customers wouldn't like it
Difficulty in implementing & managing it
Technology is unreliable
Inhibitors to using voice biometrics
Very important Somewhat important Unimportant Don't know / NA
174
BEYOND VOICE BIOMETRICS
Voice biometrics can be a useful tool, especially for larger contact centers through cutting call lengths
and costs, and improving customer experience. However, it may not always be enough against a
fraudulent attack or series of attacks.
Solutions that focus on identifying potential fraudulent callers don’t rely solely on matching the
voiceprint, which is not an infallible method of authentication, as can be seen below.
Biometric security fooled by twin’s voice
In May 2017, the BBC carried a story9 about an experiment that a BBC reporter and his twin had tried on
a UK bank. The reporter had enrolled in a bank’s voice identification system, but his twin was able to
access the account after ringing the bank and pretending to be his brother.
The security breach did not allow the twin to withdraw money, but he was given access to some of the
account’s functionality. The twin took eight attempts to access the account, which is a failing in the
implementation process rather than the technology – most typed passwords will allow perhaps three
failures before the user is locked out.
Experts stated that although each voice is unique, if the system has been implemented to allow too
much leeway when detecting some of the 100+ characteristics of the voice, then it would not take an
exact voiceprint match to access the account.
The expert noted that if the voiceprint was hacked or copied, the genuine account holder would not
have the option to change their voice like they would change their password.
Voice replication software was also noted to be becoming increasingly sophisticated, and the general
feeling was that alternative methods of security would be required alongside voice biometrics.
9 http://www.bbc.co.uk/news/technology-39965545
175
One alternative method of customer identity verification is ‘phoneprinting’, which is perhaps focused
more on identifying and preventing fraud than on simply authenticating genuine customers.
Phoneprinting collects information about the call being made, such as location, the type of phone being
used (VoIP is far more likely to be used in fraudulent calls), ANI (the calling number), the phone
number’s history and the chances it has been ‘spoofed’, levels of voice distortion, etc. These factors can
be scored, and after assessing the likelihood of the call being fraudulent will then impact upon the
security processes and questions that the agent is required to ask the caller, speeding up the process for
genuine callers, and focusing the tightest levels of security on potentially fraudulent calls.
Some solutions allow fraudulent phone numbers to be gathered and shared with other businesses, red-
flagging likely fraudsters. Data from various sources can be added, such as consumer complaint sites,
the FTC and spam calls databases, detecting attack patterns and improving suspicious call identification.
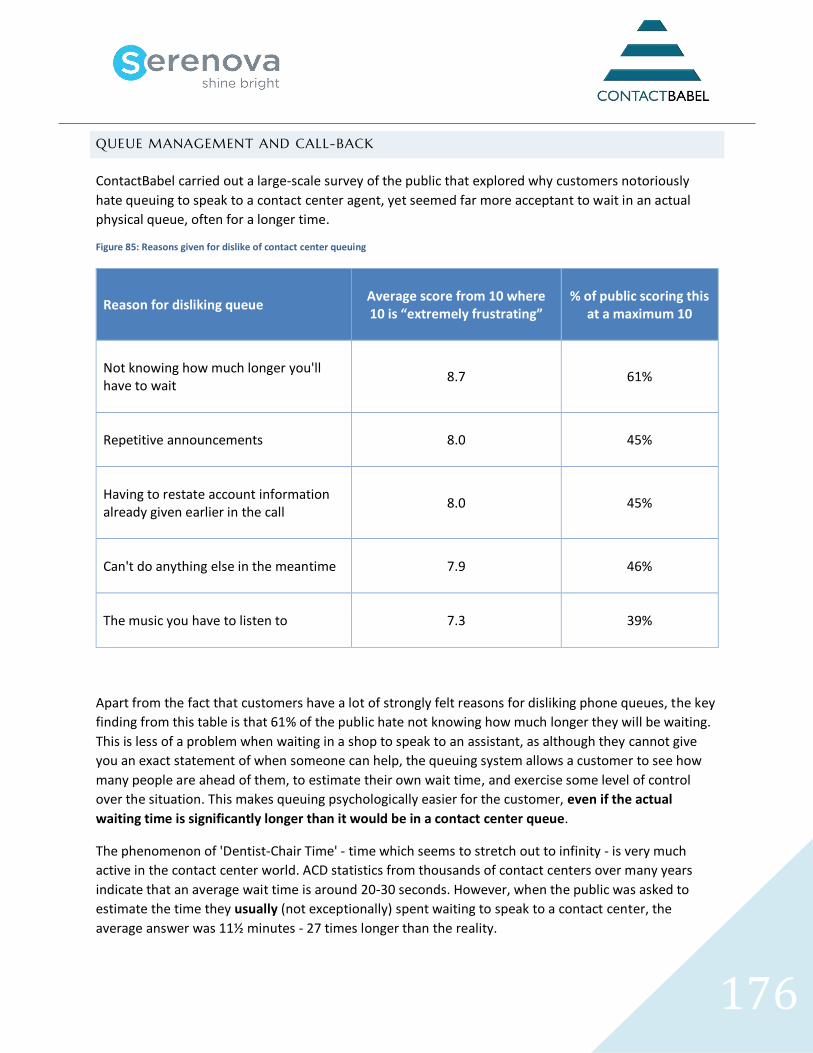
176
QUEUE MANAGEMENT AND CALL-BACK
ContactBabel carried out a large-scale survey of the public that explored why customers notoriously
hate queuing to speak to a contact center agent, yet seemed far more acceptant to wait in an actual
physical queue, often for a longer time.
Figure 85: Reasons given for dislike of contact center queuing
Reason for disliking queue
Average score from 10 where 10 is “extremely frustrating”
% of public scoring this at a maximum 10
Not knowing how much longer you'll have to wait
8.7 61%
Repetitive announcements
8.0 45%
Having to restate account information already given earlier in the call
8.0 45%
Can't do anything else in the meantime
7.9 46%
The music you have to listen to
7.3 39%
Apart from the fact that customers have a lot of strongly felt reasons for disliking phone queues, the key
finding from this table is that 61% of the public hate not knowing how much longer they will be waiting.
This is less of a problem when waiting in a shop to speak to an assistant, as although they cannot give
you an exact statement of when someone can help, the queuing system allows a customer to see how
many people are ahead of them, to estimate their own wait time, and exercise some level of control
over the situation. This makes queuing psychologically easier for the customer, even if the actual
waiting time is significantly longer than it would be in a contact center queue.
The phenomenon of 'Dentist-Chair Time' - time which seems to stretch out to infinity - is very much
active in the contact center world. ACD statistics from thousands of contact centers over many years
indicate that an average wait time is around 20-30 seconds. However, when the public was asked to
estimate the time they usually (not exceptionally) spent waiting to speak to a contact center, the
average answer was 11½ minutes - 27 times longer than the reality.
177
Clearly, trimming 10% off a queue time isn't going to make a lot of difference to the perception of the
caller, even though it may be a very difficult task for the contact center to carry out. If customers aren't
informed of wait time, they may become discouraged and frustrated as hold time drags on. This can lead
to increased abandonment and even if the caller does decide to hold on, this experience starts the call
off badly leaving the agent with a lot to make up. Customers waste time complaining about their
experiences and may even ask additional questions on the call so that they ‘get their money's worth’.
If customers are given the estimated wait time, they may decide to abandon immediately or may judge
that the wait is acceptable and remain on the line to speak with an agent. This alleviates some customer
frustration but means that some of the callers which abandon may not call back - ever - and it doesn't
solve the fact that customers are still having to wait. One solution is to implement a virtual queuing
system, which not only provides customers with information about current queue conditions but also
presents them with various active options, such as remaining on hold or choosing to be called back
when it is their turn.
There are several different varieties of virtual queuing systems: the "First-In, First-Out" (FIFO) system
keeps the customer's place in line by monitoring queue conditions until the estimated wait time hits a
set target, at which point it intercepts incoming calls before they enter the queue, informing customers
of the likely wait time and offering the option of receiving an outbound call in the same amount of time
as if they had personally waited on hold.
At this point, customers choosing to remain on hold go directly into a queue. Customers who opt for a
call-back are prompted to enter their telephone number and possibly some extra details that can be
used for agent selection and skills-based routing, and are then asked to hang up. Virtual placeholders
keep the customers' places in line and the virtual queuing system launches an outbound call to the
customer at the agreed time. When the call-back is answered by the customer, the system checks the
right person is on the line and ready to talk. If this is the case, the call is routed to the next available
suitable agent, who handles it as a normal inbound call.
By replacing real hold time with this virtual version, customers are free to do other things, thus
removing four of the five problems that they have with queues - unknown queue times, hold music, the
inability to do anything else and repetitive announcements.
Scheduled call-back options differ from a FIFO experience, in that customers do not keep their place in
queue, but are called back at some time in the future that is more convenient for them (for example,
when they know they will be back at their desk and available to take a call).
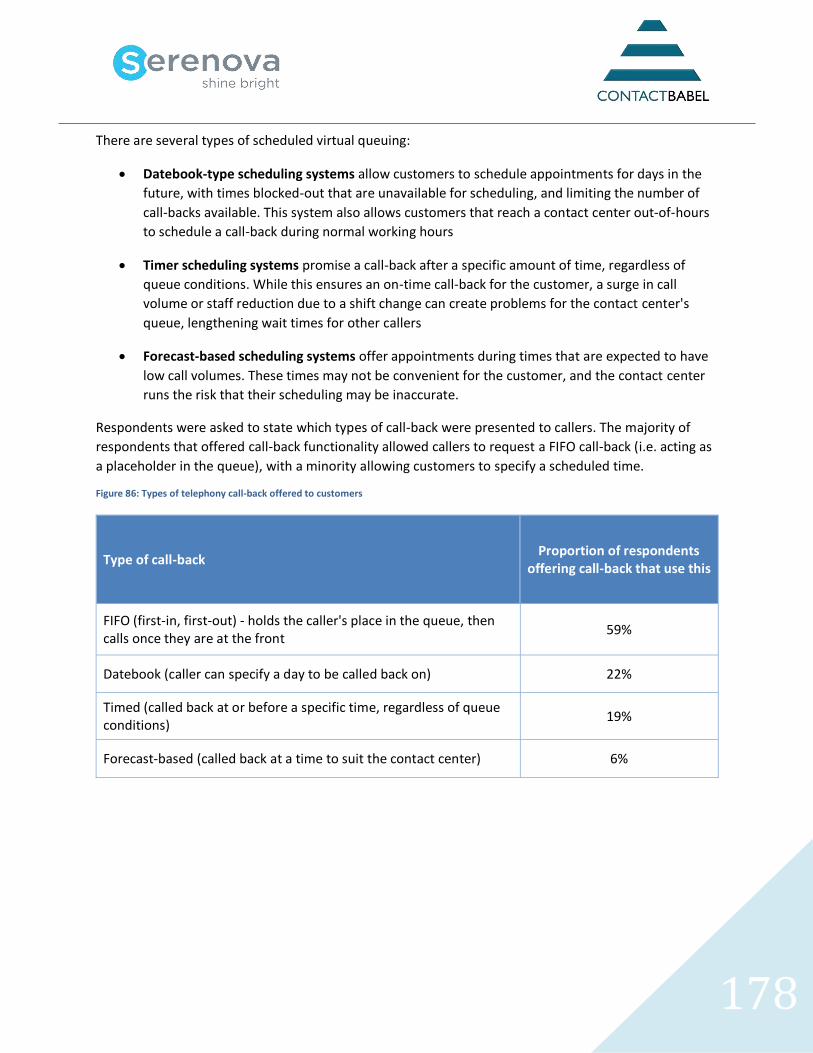
178
There are several types of scheduled virtual queuing:
• Datebook-type scheduling systems allow customers to schedule appointments for days in the
future, with times blocked-out that are unavailable for scheduling, and limiting the number of
call-backs available. This system also allows customers that reach a contact center out-of-hours
to schedule a call-back during normal working hours
• Timer scheduling systems promise a call-back after a specific amount of time, regardless of
queue conditions. While this ensures an on-time call-back for the customer, a surge in call
volume or staff reduction due to a shift change can create problems for the contact center's
queue, lengthening wait times for other callers
• Forecast-based scheduling systems offer appointments during times that are expected to have
low call volumes. These times may not be convenient for the customer, and the contact center
runs the risk that their scheduling may be inaccurate.
Respondents were asked to state which types of call-back were presented to callers. The majority of
respondents that offered call-back functionality allowed callers to request a FIFO call-back (i.e. acting as
a placeholder in the queue), with a minority allowing customers to specify a scheduled time.
Figure 86: Types of telephony call-back offered to customers
Type of call-back
Proportion of respondents offering call-back that use this
FIFO (first-in, first-out) - holds the caller's place in the queue, then calls once they are at the front
59%
Datebook (caller can specify a day to be called back on) 22%
Timed (called back at or before a specific time, regardless of queue conditions)
19%
Forecast-based (called back at a time to suit the contact center) 6%
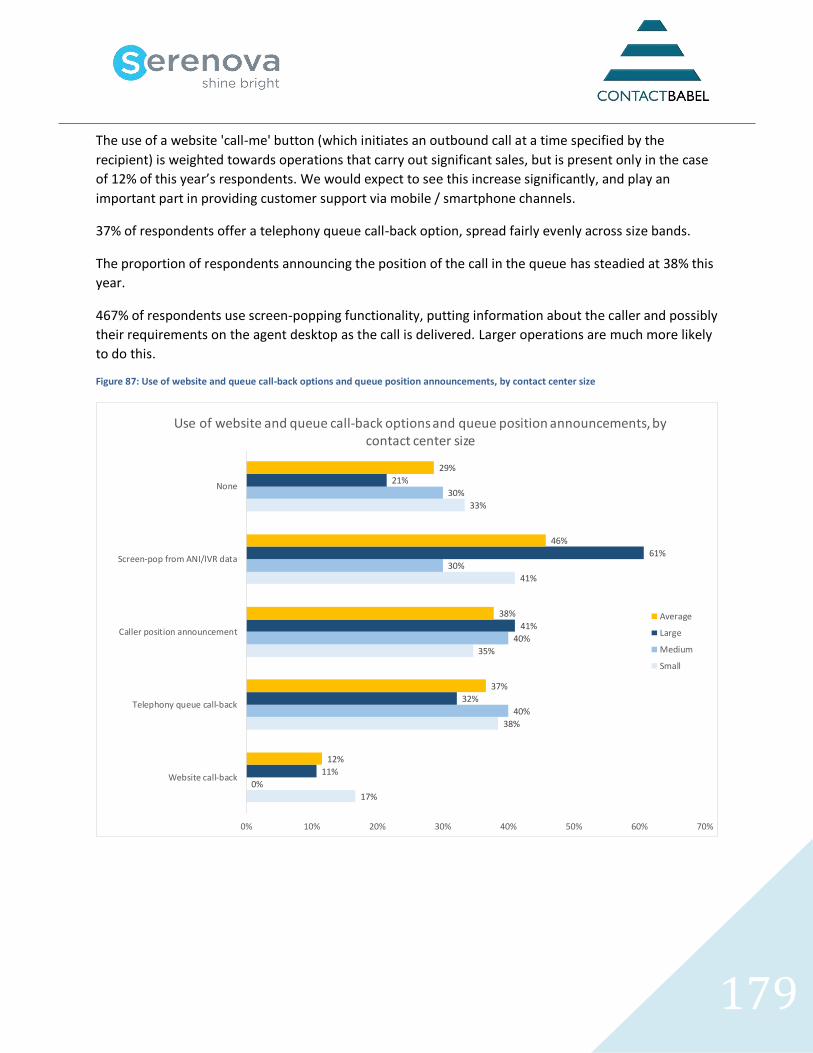
179
The use of a website 'call-me' button (which initiates an outbound call at a time specified by the
recipient) is weighted towards operations that carry out significant sales, but is present only in the case
of 12% of this year’s respondents. We would expect to see this increase significantly, and play an
important part in providing customer support via mobile / smartphone channels.
37% of respondents offer a telephony queue call-back option, spread fairly evenly across size bands.
The proportion of respondents announcing the position of the call in the queue has steadied at 38% this
year.
467% of respondents use screen-popping functionality, putting information about the caller and possibly
their requirements on the agent desktop as the call is delivered. Larger operations are much more likely
to do this.
Figure 87: Use of website and queue call-back options and queue position announcements, by contact center size
17%
38%
35%
41%
33%
0%
40%
40%
30%
30%
11%
32%
41%
61%
21%
12%
37%
38%
46%
29%
0% 10% 20% 30% 40% 50% 60% 70%
Website call-back
Telephony queue call-back
Caller position announcement
Screen-pop from ANI/IVR data
None
Use of website and queue call-back options and queue position announcements, by contact center size
Average
Large
Medium
Small
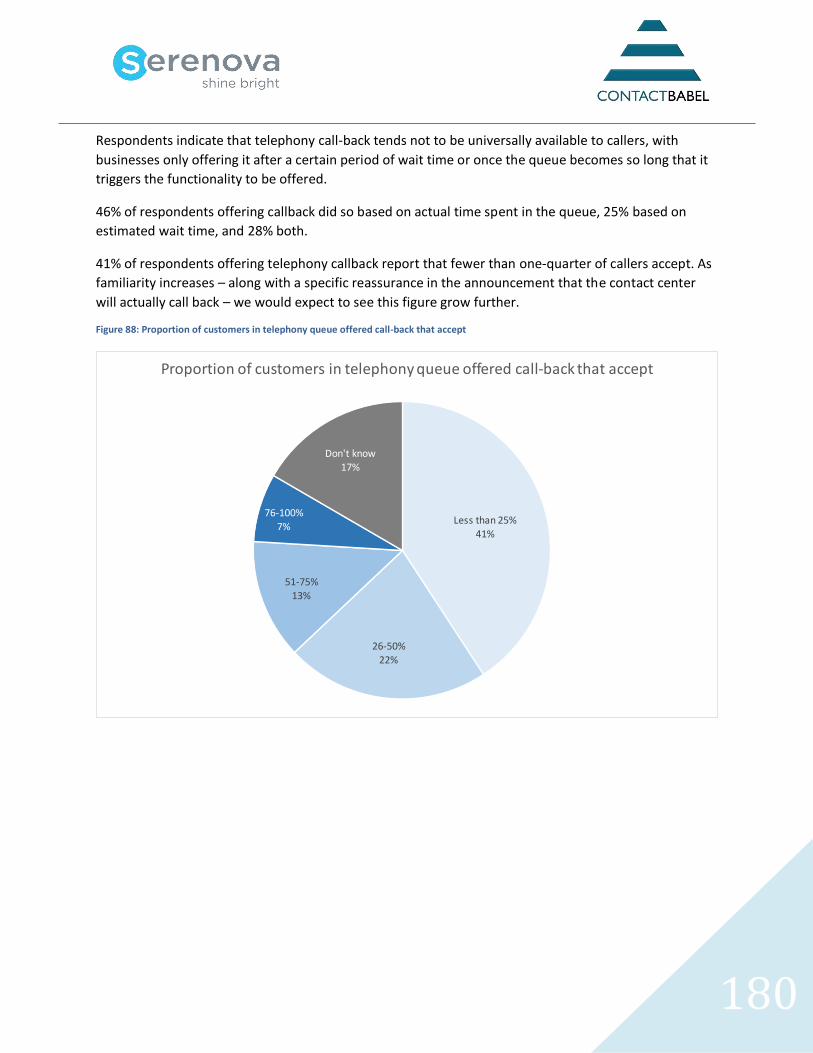
180
Respondents indicate that telephony call-back tends not to be universally available to callers, with
businesses only offering it after a certain period of wait time or once the queue becomes so long that it
triggers the functionality to be offered.
46% of respondents offering callback did so based on actual time spent in the queue, 25% based on
estimated wait time, and 28% both.
41% of respondents offering telephony callback report that fewer than one-quarter of callers accept. As
familiarity increases – along with a specific reassurance in the announcement that the contact center
will actually call back – we would expect to see this figure grow further.
Figure 88: Proportion of customers in telephony queue offered call-back that accept
Less than 25%41%
26-50%22%
51-75%13%
76-100%
7%
Don't know17%
Proportion of customers in telephony queue offered call-back that accept
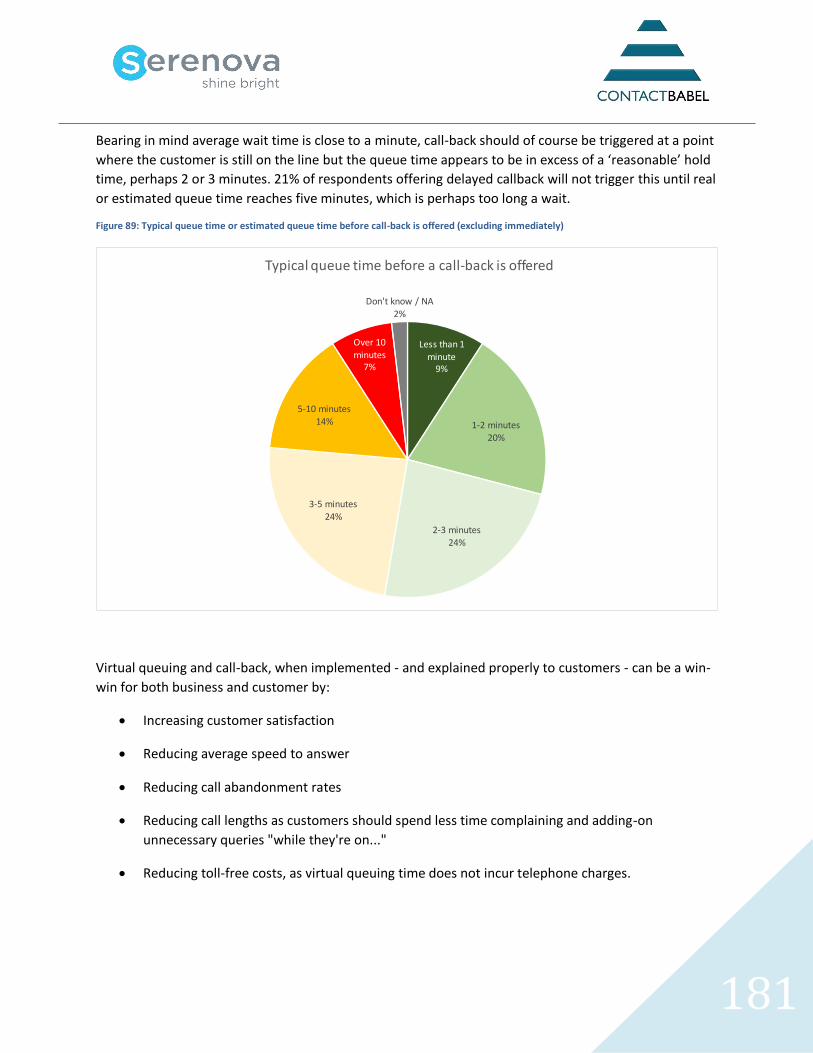
181
Bearing in mind average wait time is close to a minute, call-back should of course be triggered at a point
where the customer is still on the line but the queue time appears to be in excess of a ‘reasonable’ hold
time, perhaps 2 or 3 minutes. 21% of respondents offering delayed callback will not trigger this until real
or estimated queue time reaches five minutes, which is perhaps too long a wait.
Figure 89: Typical queue time or estimated queue time before call-back is offered (excluding immediately)
Virtual queuing and call-back, when implemented - and explained properly to customers - can be a win-
win for both business and customer by:
• Increasing customer satisfaction
• Reducing average speed to answer
• Reducing call abandonment rates
• Reducing call lengths as customers should spend less time complaining and adding-on
unnecessary queries "while they're on..."
• Reducing toll-free costs, as virtual queuing time does not incur telephone charges.
Less than 1 minute
9%
1-2 minutes20%
2-3 minutes
24%
3-5 minutes24%
5-10 minutes
14%
Over 10 minutes
7%
Don't know / NA2%
Typical queue time before a call-back is offered
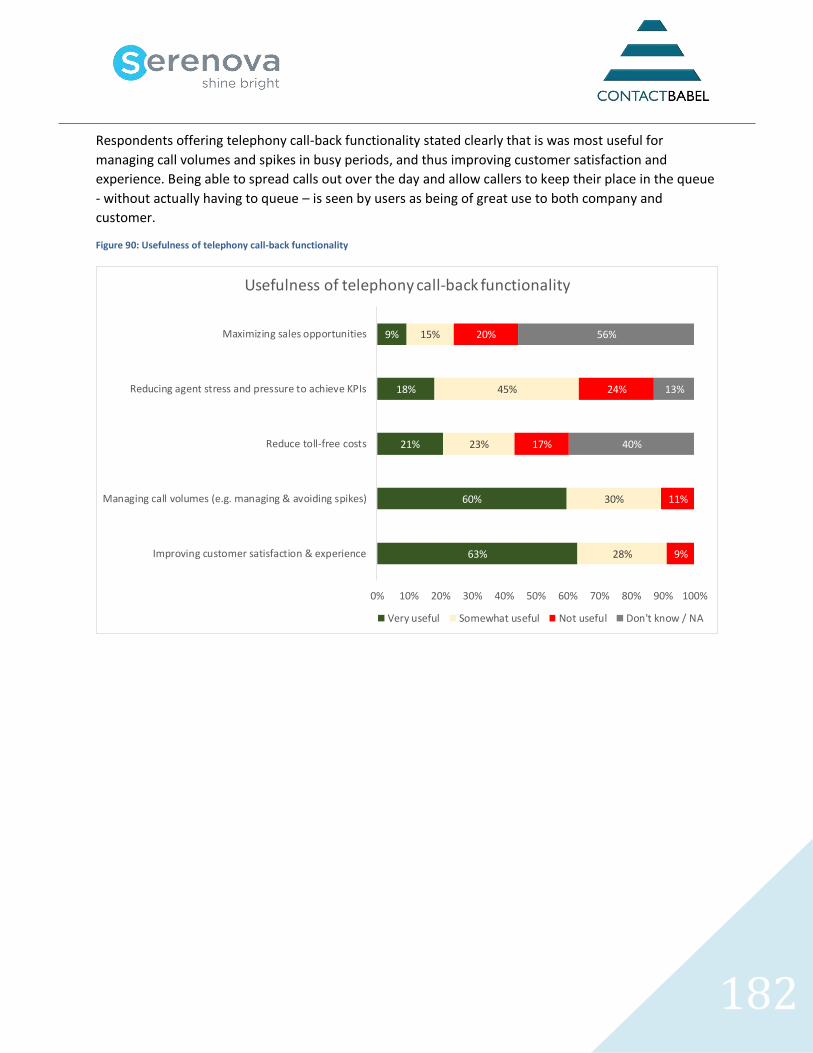
182
Respondents offering telephony call-back functionality stated clearly that is was most useful for
managing call volumes and spikes in busy periods, and thus improving customer satisfaction and
experience. Being able to spread calls out over the day and allow callers to keep their place in the queue
- without actually having to queue – is seen by users as being of great use to both company and
customer.
Figure 90: Usefulness of telephony call-back functionality
63%
60%
21%
18%
9%
28%
30%
23%
45%
15%
9%
11%
17%
24%
20%
40%
13%
56%
0% 10% 20% 30% 40% 50% 60% 70% 80% 90% 100%
Improving customer satisfaction & experience
Managing call volumes (e.g. managing & avoiding spikes)
Reduce toll-free costs
Reducing agent stress and pressure to achieve KPIs
Maximizing sales opportunities
Usefulness of telephony call-back functionality
Very useful Somewhat useful Not useful Don't know / NA
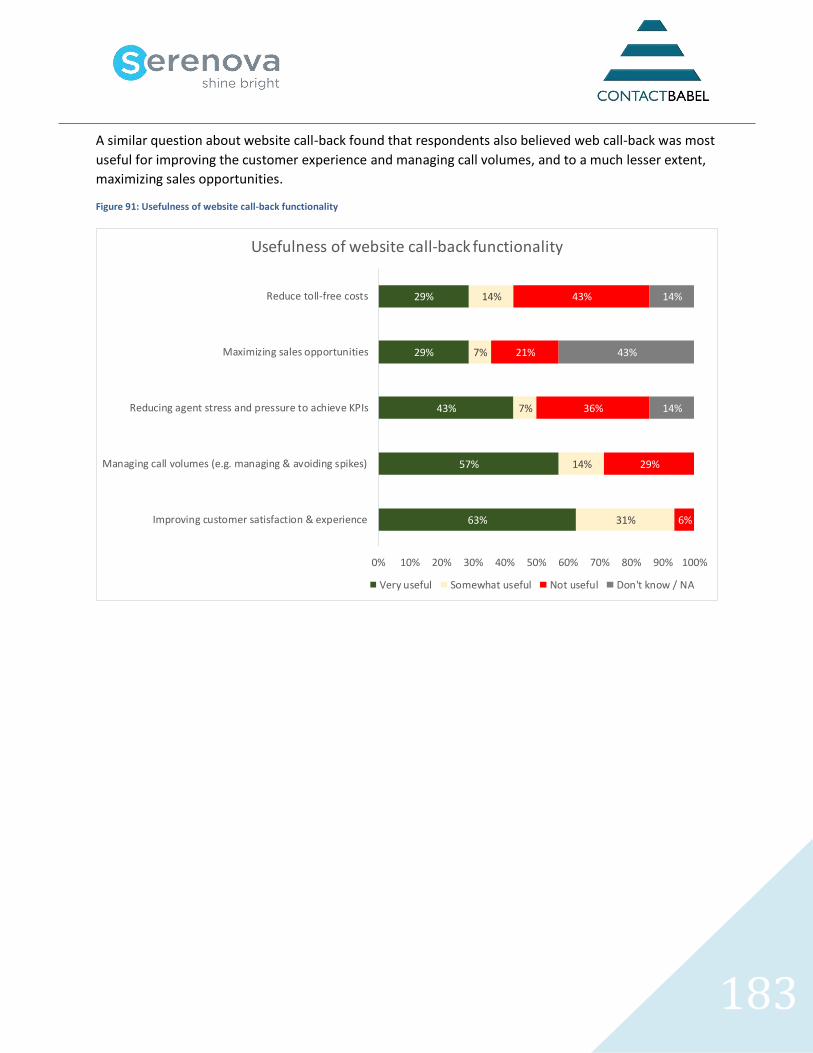
183
A similar question about website call-back found that respondents also believed web call-back was most
useful for improving the customer experience and managing call volumes, and to a much lesser extent,
maximizing sales opportunities.
Figure 91: Usefulness of website call-back functionality
63%
57%
43%
29%
29%
31%
14%
7%
7%
14%
6%
29%
36%
21%
43%
14%
43%
14%
0% 10% 20% 30% 40% 50% 60% 70% 80% 90% 100%
Improving customer satisfaction & experience
Managing call volumes (e.g. managing & avoiding spikes)
Reducing agent stress and pressure to achieve KPIs
Maximizing sales opportunities
Reduce toll-free costs
Usefulness of website call-back functionality
Very useful Somewhat useful Not useful Don't know / NA
184
HEADSETS
There are various factors to consider when deciding which headset to purchase for your contact center
workforce. If you have many hundreds or even thousands of agents, headset purchase is a large ongoing
expenditure that is important to get right. There are many things to consider:
• Compliance with health and safety legislation
• Total cost of ownership
• Durability
• Performance
• Comfort
• Contact center telephony infrastructure
• Sound quality.
Most contact center agents wear headsets for hours every day, and the cost of replacing or repairing
headsets should be considered in the total cost of ownership, requiring good levels of after-sales
support and guarantees.
Some contact center agents like having the freedom to move around while on calls, especially in a high-
pressure sales environment. Some contact centers may decide they don’t want agents wandering
around, but that the supervisor needs to be able to be mobile. Agents with wireless headsets can spend
less time putting callers on hold as they can walk to where the information they need is held, taking the
caller with them. This in turn can reduce the time taken on each call, improving customer satisfaction.
Headsets and the 'enterprise as contact center'
The newest headsets support the 'enterprise as contact center' model by allowing the agent to involve
knowledge workers in a three-way conversation with the agent via Skype for Business, IBM SameTime or
VoIP, for example. This could allow a 2nd-line technical support worker to help immediately with a
difficult part of a query without a formal, long-winded escalation process taking place.
The majority of contact centers have implemented Internet protocol (IP) telephony as part of their
technology environment. Agents will make and take calls via their PC, so choosing a headset that can
adapt to future technology infrastructures is key.
185
The weight, sound quality, amount of background noise allowed in and out, comfort and the length of
time the headset will be worn should also be considered. Having sound in both ears (binaural) allows
noise levels to be lower than is the case with single-ear sound (monaural), although some agents can
feel isolated if they cannot hear the world around them. In addition, noise-cancelling microphones filter
out the unwanted background noise which can make the conversation harder for a caller to hear. This
may be especially relevant for homeworkers, where the background noise (traffic, children, dogs, etc.)
may be less easily managed or predictable. Voice tubes can also allow more flexible positioning of the
microphone, with attendant improvements in sound quality.
The effect of headsets upon productivity
There are examples of how improving audio and speech quality can positively impact upon call handling
time and overall contact center performance. A Spanish contact center gave some sets of agents
headsets with digital audio processors, and some used the more traditional headset. The first group's
technology had the effect of 'cleaning up' unwanted noise at either end of the line, allowing the
customer and agent to communicate more effectively. Calls were handled more quickly, fewer mistakes
were made with data collection (with the attendant knock-on effect that fewer repeat calls were
required), and overall, agents handled an average of 10% more calls per day than did the control group.
In some countries, there has been legislation put in place around noise at work, which detail maximum
average and peak noise levels that a worker may undergo, and the maximum amount of time that it is
permissible for the worker to experience these sounds. We believe that it is only a matter of time until
similar legislation is imposed in all Western contact center industries, and that businesses should be
putting procedures in place before they are forced to, which could help agents’ health, and limit the
business’s exposure to litigation.
Surveys have seen that only 6% of contact center managers are aware of the level of ambient noise
within their contact centers, and only 9% regularly measure it10.
10 Source: CCF magazine
186
In the UK, “The Acoustic Safety Programme” has developed some simple advice for contact centers to
help them meet or exceed legislation and make working life safer and more comfortable for their
agents:
• Measure contact center noise regularly and record it
• Fully understand legislation and create a formal policy so that staff at all levels of a business are
aware of it
• Make sure that the headsets used are compliant with current legislation, and test them throughout
their life
• Provide agents with a choice of headsets - monaural or binaural - the latter can help to absorb
background noise, but may make the agent feel more cut-off from their environment
• Be aware that excessively long shifts may cause damage to agents’ hearing, even if within nominally-
safe limits
• Use sound-absorbing materials as much as possible to absorb unnecessary echoes and reverberation
• Educate agents on how to use their headset and phone correctly, including volume and ergonomic
adjustments
• Test staff’s hearing throughout their contact center career.
For more information, please visit www.acousticsafety.org.
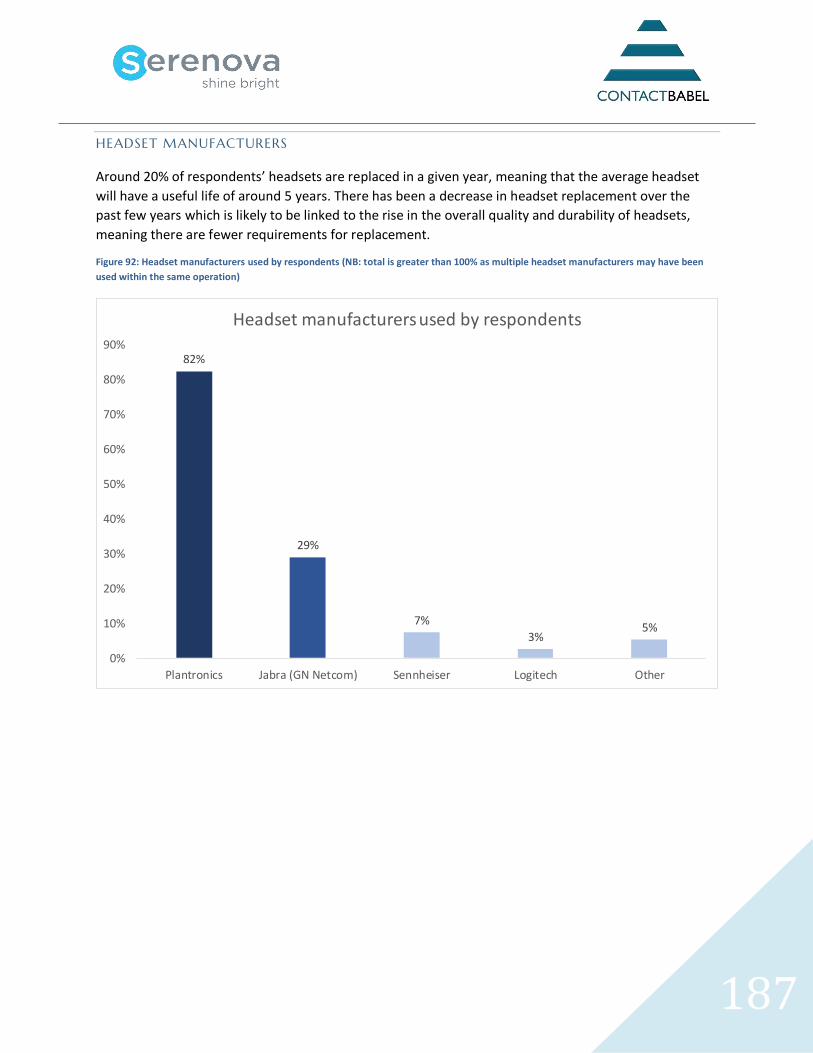
187
HEADSET MANUFACTURERS
Around 20% of respondents’ headsets are replaced in a given year, meaning that the average headset
will have a useful life of around 5 years. There has been a decrease in headset replacement over the
past few years which is likely to be linked to the rise in the overall quality and durability of headsets,
meaning there are fewer requirements for replacement.
Figure 92: Headset manufacturers used by respondents (NB: total is greater than 100% as multiple headset manufacturers may have been
used within the same operation)
82%
29%
7%
3%5%
0%
10%
20%
30%
40%
50%
60%
70%
80%
90%
Plantronics Jabra (GN Netcom) Sennheiser Logitech Other
Headset manufacturers used by respondents
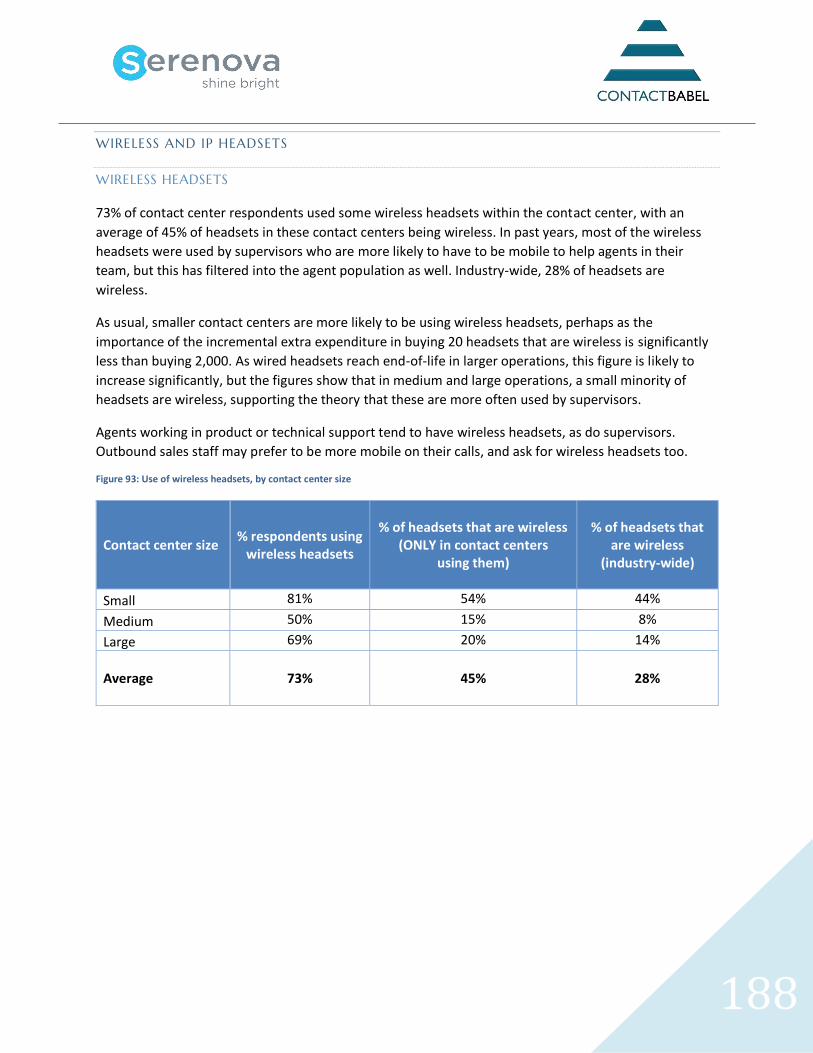
188
WIRELESS AND IP HEADSETS
WIRELESS HEADSETS
73% of contact center respondents used some wireless headsets within the contact center, with an
average of 45% of headsets in these contact centers being wireless. In past years, most of the wireless
headsets were used by supervisors who are more likely to have to be mobile to help agents in their
team, but this has filtered into the agent population as well. Industry-wide, 28% of headsets are
wireless.
As usual, smaller contact centers are more likely to be using wireless headsets, perhaps as the
importance of the incremental extra expenditure in buying 20 headsets that are wireless is significantly
less than buying 2,000. As wired headsets reach end-of-life in larger operations, this figure is likely to
increase significantly, but the figures show that in medium and large operations, a small minority of
headsets are wireless, supporting the theory that these are more often used by supervisors.
Agents working in product or technical support tend to have wireless headsets, as do supervisors.
Outbound sales staff may prefer to be more mobile on their calls, and ask for wireless headsets too.
Figure 93: Use of wireless headsets, by contact center size
Contact center size
% respondents using wireless headsets
% of headsets that are wireless (ONLY in contact centers
using them)
% of headsets that are wireless
(industry-wide)
Small 81% 54% 44%
Medium 50% 15% 8%
Large 69% 20% 14%
Average
73% 45% 28%
189
IP HEADSETS
As VoIP is a digital signal and human speech is analogue, converting between the two takes a certain
amount of time. IP was not initially designed to transfer speech and so does not guarantee a time
between the signal leaving one point and arriving at the next. These two points mean that there may be
more of a delay in speech being transmitted from one point to it being heard at another on a VoIP
system than with a conventional system, although performance and delivery has improved considerably
over recent years.
As with all telephone systems, the person speaking will hear some of their own speech in their ear. This
is referred to as ‘sidetone’, and when the delay levels are low it is an important part of the telephone
system. When delays are excessive, the sidetone becomes echo, which is distracting for the people on
both ends of the call. Excessive delays are more common in VoIP systems than with standard telephony,
meaning that echo cancellation is a critical component in improving call quality.
Some headsets are able to alleviate or even remove the impact of sub-optimal network performance on
the conversation:
• Echo - how the earpiece fits to the ear and the positioning of the microphone relative to user’s
mouth helps prevent echo, and digital signal processing (DSP) alleviates echo management when it
is unavoidable. DSP can help with unequal call levels, and manage sudden increases in amplitude
and/or volume, and prevent acoustic shock
• Distortion - clipping the voice signal by taking away the highest and lowest voice registers can mean
that the voice sounds distorted, an unpleasant sound for both agent and caller
• Latency - often viewed as one of the major bugbears of IP, latency is experienced as a lag, due to
information being sent and received across the network in a sub-optimal manner. This can cause
broken conversations, and can be extremely frustrating for both customer and agent, particularly
when experienced as poor sound quality, such as missing pieces of sound, as well as the lag itself.
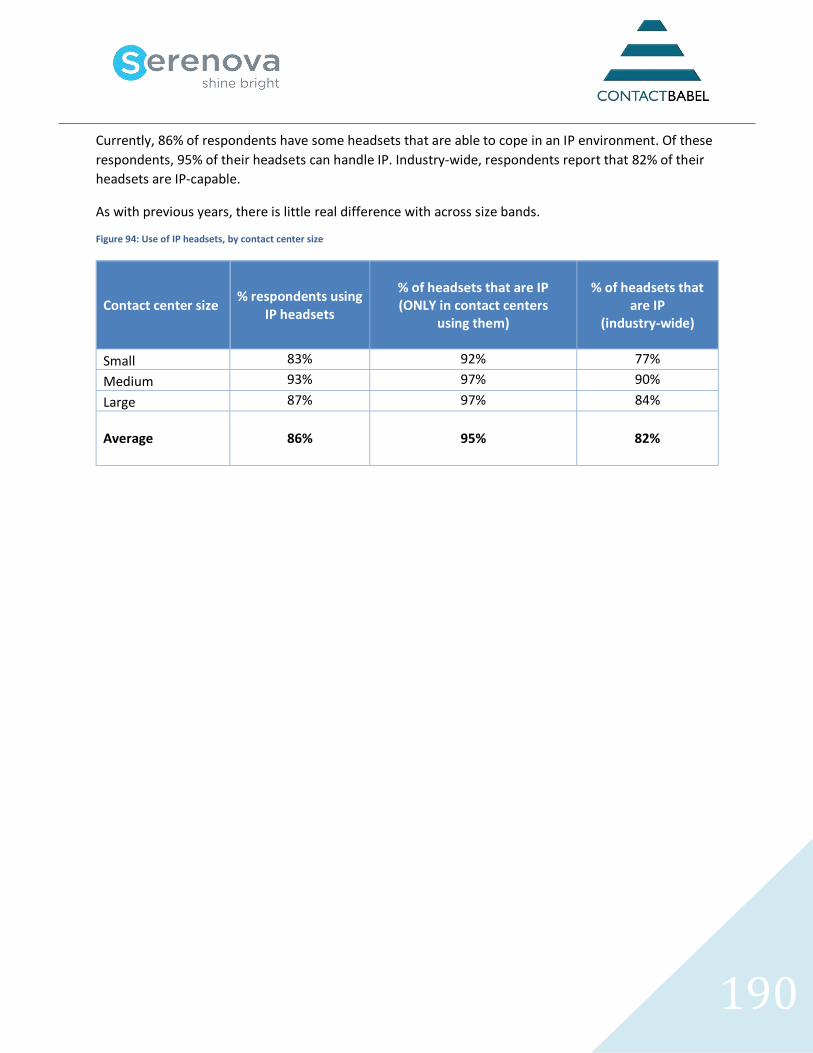
190
Currently, 86% of respondents have some headsets that are able to cope in an IP environment. Of these
respondents, 95% of their headsets can handle IP. Industry-wide, respondents report that 82% of their
headsets are IP-capable.
As with previous years, there is little real difference with across size bands.
Figure 94: Use of IP headsets, by contact center size
Contact center size
% respondents using IP headsets
% of headsets that are IP (ONLY in contact centers
using them)
% of headsets that are IP
(industry-wide)
Small 83% 92% 77%
Medium 93% 97% 90%
Large 87% 97% 84%
Average
86% 95% 82%
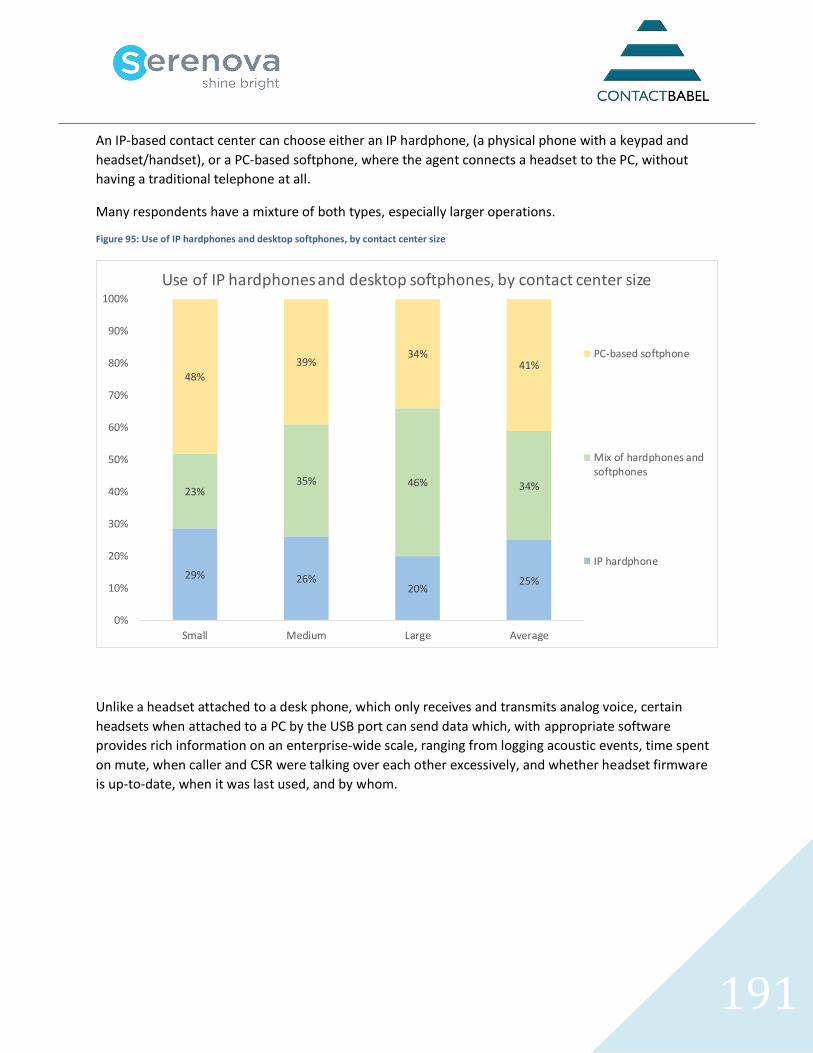
191
An IP-based contact center can choose either an IP hardphone, (a physical phone with a keypad and
headset/handset), or a PC-based softphone, where the agent connects a headset to the PC, without
having a traditional telephone at all.
Many respondents have a mixture of both types, especially larger operations.
Figure 95: Use of IP hardphones and desktop softphones, by contact center size
Unlike a headset attached to a desk phone, which only receives and transmits analog voice, certain
headsets when attached to a PC by the USB port can send data which, with appropriate software
provides rich information on an enterprise-wide scale, ranging from logging acoustic events, time spent
on mute, when caller and CSR were talking over each other excessively, and whether headset firmware
is up-to-date, when it was last used, and by whom.
29% 26%20%
25%
23%35% 46% 34%
48%39%
34%41%
0%
10%
20%
30%
40%
50%
60%
70%
80%
90%
100%
Small Medium Large Average
Use of IP hardphones and desktop softphones, by contact center size
PC-based softphone
Mix of hardphones andsoftphones
IP hardphone
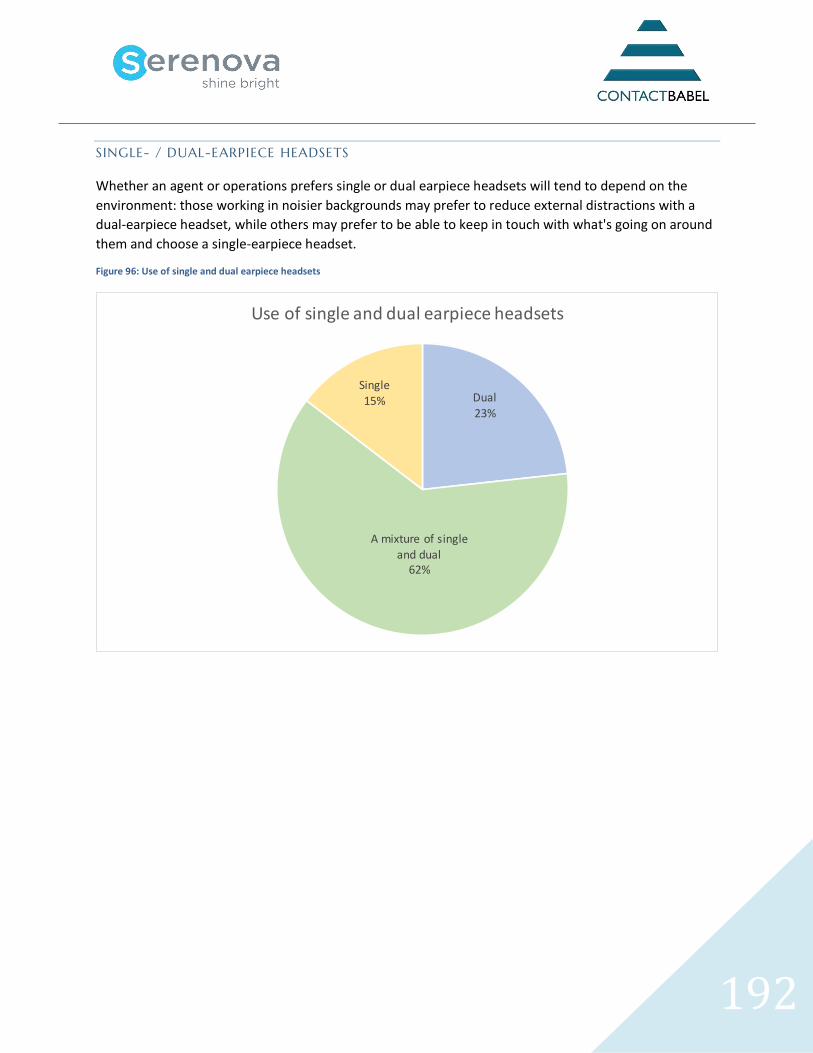
192
SINGLE- / DUAL-EARPIECE HEADSETS
Whether an agent or operations prefers single or dual earpiece headsets will tend to depend on the
environment: those working in noisier backgrounds may prefer to reduce external distractions with a
dual-earpiece headset, while others may prefer to be able to keep in touch with what's going on around
them and choose a single-earpiece headset.
Figure 96: Use of single and dual earpiece headsets
Dual23%
A mixture of single
and dual62%
Single15%
Use of single and dual earpiece headsets
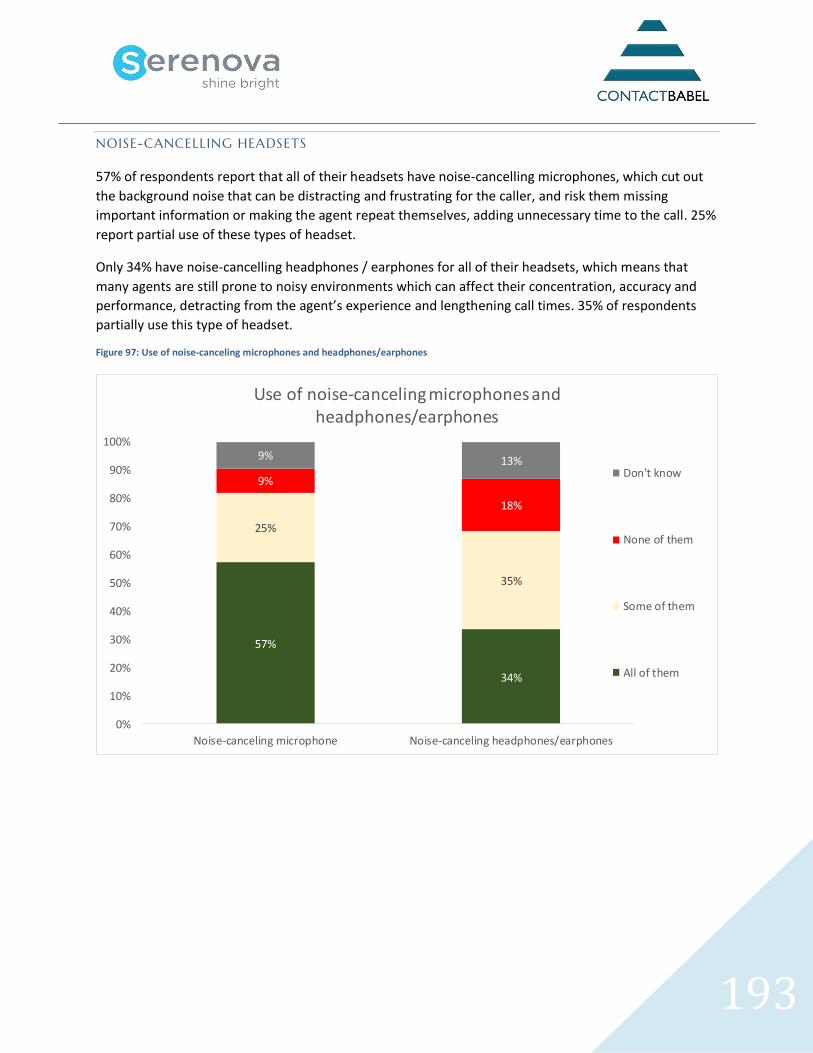
193
NOISE-CANCELLING HEADSETS
57% of respondents report that all of their headsets have noise-cancelling microphones, which cut out
the background noise that can be distracting and frustrating for the caller, and risk them missing
important information or making the agent repeat themselves, adding unnecessary time to the call. 25%
report partial use of these types of headset.
Only 34% have noise-cancelling headphones / earphones for all of their headsets, which means that
many agents are still prone to noisy environments which can affect their concentration, accuracy and
performance, detracting from the agent’s experience and lengthening call times. 35% of respondents
partially use this type of headset.
Figure 97: Use of noise-canceling microphones and headphones/earphones
57%
34%
25%
35%
9%
18%
9% 13%
0%
10%
20%
30%
40%
50%
60%
70%
80%
90%
100%
Noise-canceling microphone Noise-canceling headphones/earphones
Use of noise-canceling microphones and headphones/earphones
Don't know
None of them
Some of them
All of them
194
ACOUSTIC SHOCK
‘Acoustic shock’ is a phrase coined to describe a sudden, unexpected noise, often delivered at a very
intense frequency. It may be caused by feedback from telephone equipment, faulty telephone lines,
non-compliant switchboards and headsets. Other sources of acoustic damage include caller abuse
(shouting, screaming, blowing whistles etc. - most often found in the outbound environment) or
background noise on the call. Acoustic shock also refers to the damage done by long-term exposure to
noise in excess of healthy limits. It can lead to permanent hearing damage and cases of psychological
trauma. The CCMA (www.ccma.org.uk) has stated that tens of millions of pounds have been spent in the
UK alone on settlements related to acoustic shock.
Readers wanting more information may like to consider viewing www.acousticsafety.org
Contact centers may like to implement a traceable reporting system for headset users who may have
been exposed to acoustic shock incidents.
The following information should be reported:
• Date and time of the incident;
• Details of the source of the exposure;
• Description of the noise;
• Duration of the exposure;
• Details of the headset and telephone equipment used;
• Whether the incident was electronically recorded (a copy should be kept for future
reference);
• Symptoms experienced by the operator directly related to the acoustic shock incident.
Operators should be trained to recognize such incidents and how to report them. Organizations that
operate call centers are further advised that they should keep up to date with developments in this field
through their professional associations and other representative bodies, as well as through their
enforcing authority if applicable.
195
NEW MEDIA AND THE CUSTOMER OF THE FUTURE
In the late 1990s, analysts predicted email to be the next big B2C communication method, only for
customers to find that, in many cases, sending an email didn't get customers any sort of answer at all.
Predictably, for many years, email accounted for only 1-2% of a business's inbound communication.
However, individual organizations (especially those in the IT and retail sector) managed to make email
an acceptable channel for customers, breaking the vicious circle that consumers had experienced:
receiving poor service via email from a number of companies put customers off from using the medium,
which meant that investments weren't made in improving the email channel because the required
volumes weren’t there, which further weakened its effectiveness.
It is consumers, not businesses, who make the decision on which communication methods will be most
used. If the channel proposed by businesses is suitable for the type of interaction, then it will succeed -
otherwise, it will fail. Predicting which channels will be used in future, and by whom, will give businesses
a better chance to deliver high-quality service at the right points, while reducing cost where possible.
Getting it wrong is expensive and damaging to the brand.
Multichannel contact centers have been mainstream for years, and the web - as a channel for self-
service, sales and increasingly person-to-person contact - is an integral part of most businesses’
customer contact strategy, with the advent of social media and the mobile channel throwing other
elements into the mix. Each channel has its strengths and weaknesses, and customer familiarity also
plays a part in its role.
White mail: suited to issues of great complexity and importance, due to the ability to establish a paper
trail, found particularly in industries that are contract-driven, for example, insurance. Response times
are, by definition, relatively long.
Telephony: on average, by far the largest inbound interaction channel. It has ubiquity, is a real-time
two-way channel that is able to cover many different topics, and if queue length is reasonable, has one
of the quickest speeds of response of any channel, despite popular perceptions. Since the widespread
uptake of self-service, telephony is in the process of reinventing itself as the channel of choice for
lengthy, important or complex interactions. For many businesses, contact center agents have actually
become ‘knowledge experts’, without this having being planned.
Email: despite the inherent difficulty of establishing a real-time, two-way conversation, email volumes
have grown dramatically in the past few years. Like white mail, email allows customers to go into
considerable detail, expressing their thoughts in the order in which they wish. This ability is particularly
valued in issues such as complaints, where the customer may have detailed information to impart which
it is difficult to put across on a phone conversation, and the ability to create a paper trail with attached
documentation and reference is particularly valued for complex issues. The red arrow shows that email
response times have improved considerably, but it is still by no means the quickest channel.
196
Web self-service: this channel has grown enormously in the past few years, to some extent at the
expense of telephony self-service. The visual medium provides customers with a far more flexible
experience, and it is a very quick channel to use for simple queries.
Telephony self-service: A significant cost-cutter, in that 6 or 7 IVR calls cost less than a single person-to-
person call. Self-service frees agents from repetitive work, allowing them to spend more time doing high
value-add work, complex customer care and loyalty development. It also allows customers to carry out
their requests without having to queue for an agent. The appearance of visual IVR - which allows users
of smartphones in particular to view the IVR menu structure - should give this technology a major boost.
SMS: Although SMS accounts for less than 1% of inbound interactions, for many companies it is a vital
part of proactive outbound customer service, often used as confirmation or reminders. It does not
require the customer to own a smartphone, so is quite a democratic and ubiquitous channel.
Web chat: this formerly niche channel is establishing itself with significant recent growth, particularly in
retail-based environments. As telephony agents provide a live back-up to telephony IVR self-service
attempts, web chat offers the same capabilities to support a web self-service session which cannot be
fulfilled successfully. It offers a similar speed of response to the phone channel, and there is no reason
why customer authentication cannot take place which would allow access to a wider level of service
than is currently the case. Cobrowsing can be seen as a very closely related to channel to web chat, with
similar capabilities and uptake which will be closely tied to that of web chat.
Social media: social media as a customer service channel is growing rapidly and has an extremely high
profile both outside and within the organization, and grabbing the attention of senior executives far
more than the traditional contact center has ever managed to do. As such, there is a great deal of
interest being shown in social media as a customer contact channel, due in no small part to the
potentially damaging nature of a customer service failure being made extremely public.
For more information about the future of multichannel and omnichannel customer communication,
please download the free report: “The Inner Circle Guide to Omnichannel Customer Contact” from
www.contactbabel.com.
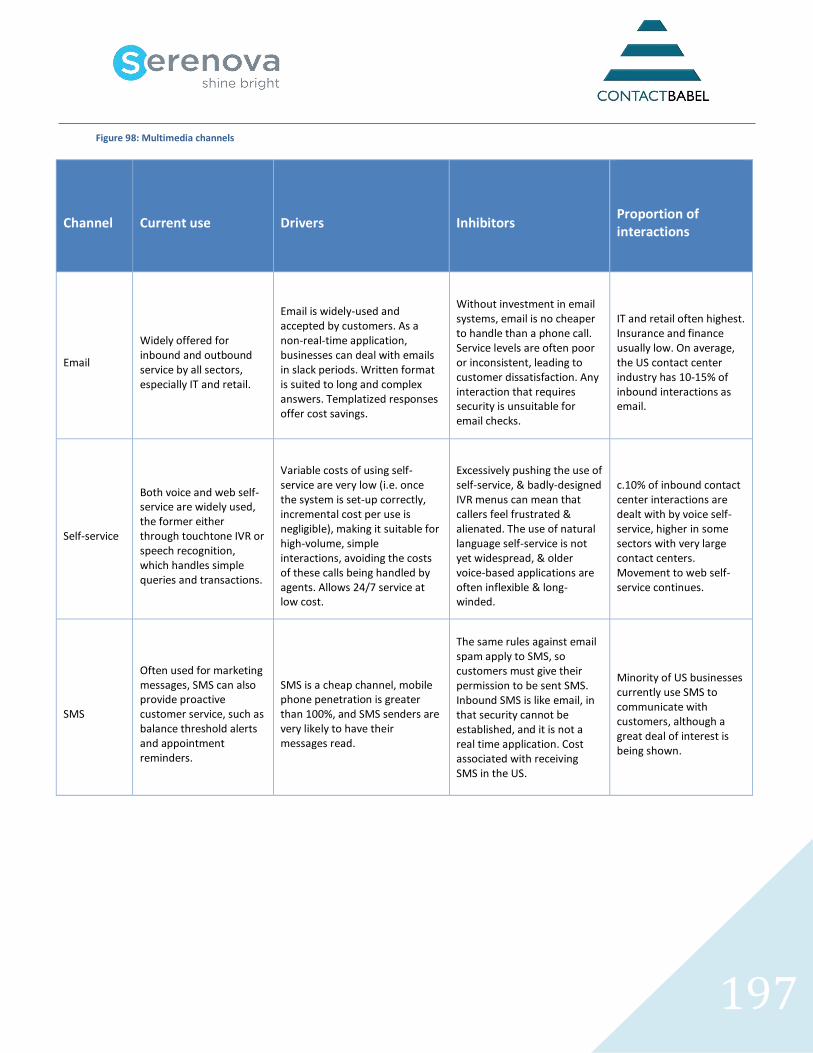
197
Figure 98: Multimedia channels
Channel Current use Drivers Inhibitors
Proportion of interactions
Widely offered for inbound and outbound service by all sectors, especially IT and retail.
Email is widely-used and accepted by customers. As a non-real-time application, businesses can deal with emails in slack periods. Written format is suited to long and complex answers. Templatized responses offer cost savings.
Without investment in email systems, email is no cheaper to handle than a phone call. Service levels are often poor or inconsistent, leading to customer dissatisfaction. Any interaction that requires security is unsuitable for email checks.
IT and retail often highest. Insurance and finance usually low. On average, the US contact center industry has 10-15% of inbound interactions as email.
Self-service
Both voice and web self-service are widely used, the former either through touchtone IVR or speech recognition, which handles simple queries and transactions.
Variable costs of using self-service are very low (i.e. once the system is set-up correctly, incremental cost per use is negligible), making it suitable for high-volume, simple interactions, avoiding the costs of these calls being handled by agents. Allows 24/7 service at low cost.
Excessively pushing the use of self-service, & badly-designed IVR menus can mean that callers feel frustrated & alienated. The use of natural language self-service is not yet widespread, & older voice-based applications are often inflexible & long-winded.
c.10% of inbound contact center interactions are dealt with by voice self-service, higher in some sectors with very large contact centers. Movement to web self-service continues.
SMS
Often used for marketing messages, SMS can also provide proactive customer service, such as balance threshold alerts and appointment reminders.
SMS is a cheap channel, mobile phone penetration is greater than 100%, and SMS senders are very likely to have their messages read.
The same rules against email spam apply to SMS, so customers must give their permission to be sent SMS. Inbound SMS is like email, in that security cannot be established, and it is not a real time application. Cost associated with receiving SMS in the US.
Minority of US businesses currently use SMS to communicate with customers, although a great deal of interest is being shown.
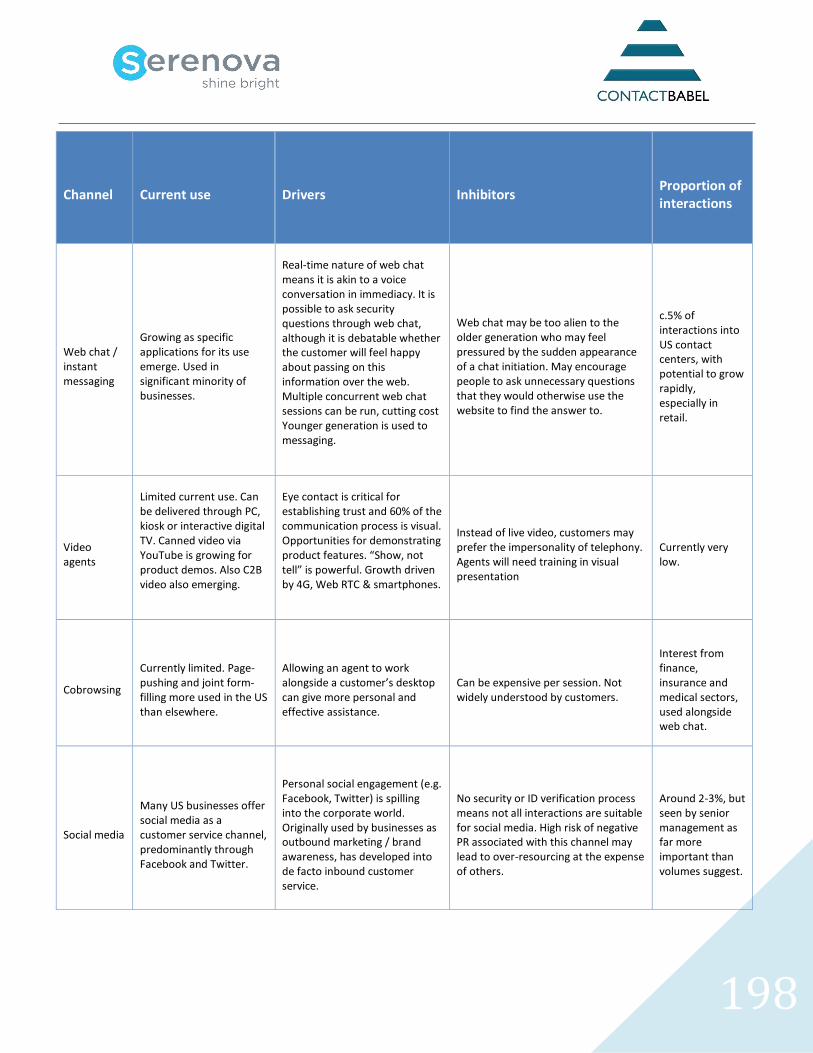
198
Channel Current use Drivers Inhibitors
Proportion of interactions
Web chat / instant messaging
Growing as specific applications for its use emerge. Used in significant minority of businesses.
Real-time nature of web chat means it is akin to a voice conversation in immediacy. It is possible to ask security questions through web chat, although it is debatable whether the customer will feel happy about passing on this information over the web. Multiple concurrent web chat sessions can be run, cutting cost Younger generation is used to messaging.
Web chat may be too alien to the older generation who may feel pressured by the sudden appearance of a chat initiation. May encourage people to ask unnecessary questions that they would otherwise use the website to find the answer to.
c.5% of interactions into US contact centers, with potential to grow rapidly, especially in retail.
Video agents
Limited current use. Can be delivered through PC, kiosk or interactive digital TV. Canned video via YouTube is growing for product demos. Also C2B video also emerging.
Eye contact is critical for establishing trust and 60% of the communication process is visual. Opportunities for demonstrating product features. “Show, not tell” is powerful. Growth driven by 4G, Web RTC & smartphones.
Instead of live video, customers may prefer the impersonality of telephony. Agents will need training in visual presentation
Currently very low.
Cobrowsing
Currently limited. Page-pushing and joint form-filling more used in the US than elsewhere.
Allowing an agent to work alongside a customer’s desktop can give more personal and effective assistance.
Can be expensive per session. Not widely understood by customers.
Interest from finance, insurance and medical sectors, used alongside web chat.
Social media
Many US businesses offer social media as a customer service channel, predominantly through Facebook and Twitter.
Personal social engagement (e.g. Facebook, Twitter) is spilling into the corporate world. Originally used by businesses as outbound marketing / brand awareness, has developed into de facto inbound customer service.
No security or ID verification process means not all interactions are suitable for social media. High risk of negative PR associated with this channel may lead to over-resourcing at the expense of others.
Around 2-3%, but seen by senior management as far more important than volumes suggest.
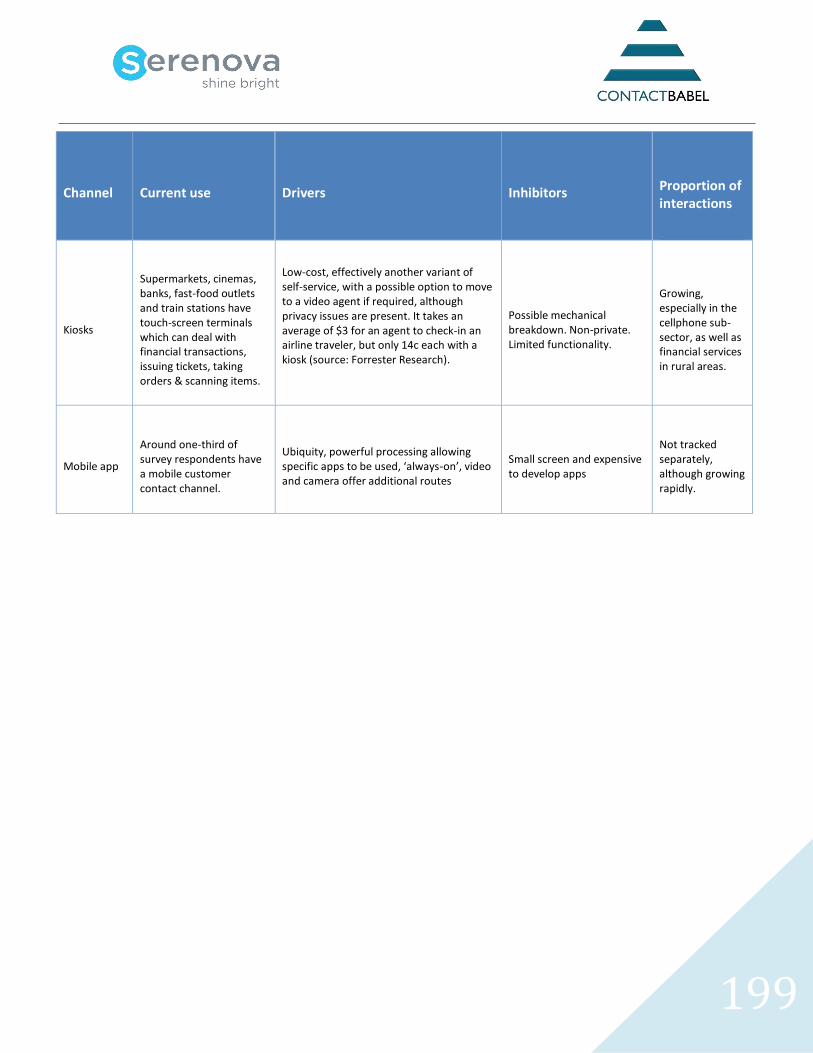
199
Channel Current use Drivers Inhibitors
Proportion of interactions
Kiosks
Supermarkets, cinemas, banks, fast-food outlets and train stations have touch-screen terminals which can deal with financial transactions, issuing tickets, taking orders & scanning items.
Low-cost, effectively another variant of self-service, with a possible option to move to a video agent if required, although privacy issues are present. It takes an average of $3 for an agent to check-in an airline traveler, but only 14c each with a kiosk (source: Forrester Research).
Possible mechanical breakdown. Non-private. Limited functionality.
Growing, especially in the cellphone sub-sector, as well as financial services in rural areas.
Mobile app
Around one-third of survey respondents have a mobile customer contact channel.
Ubiquity, powerful processing allowing specific apps to be used, ‘always-on’, video and camera offer additional routes
Small screen and expensive to develop apps
Not tracked separately, although growing rapidly.
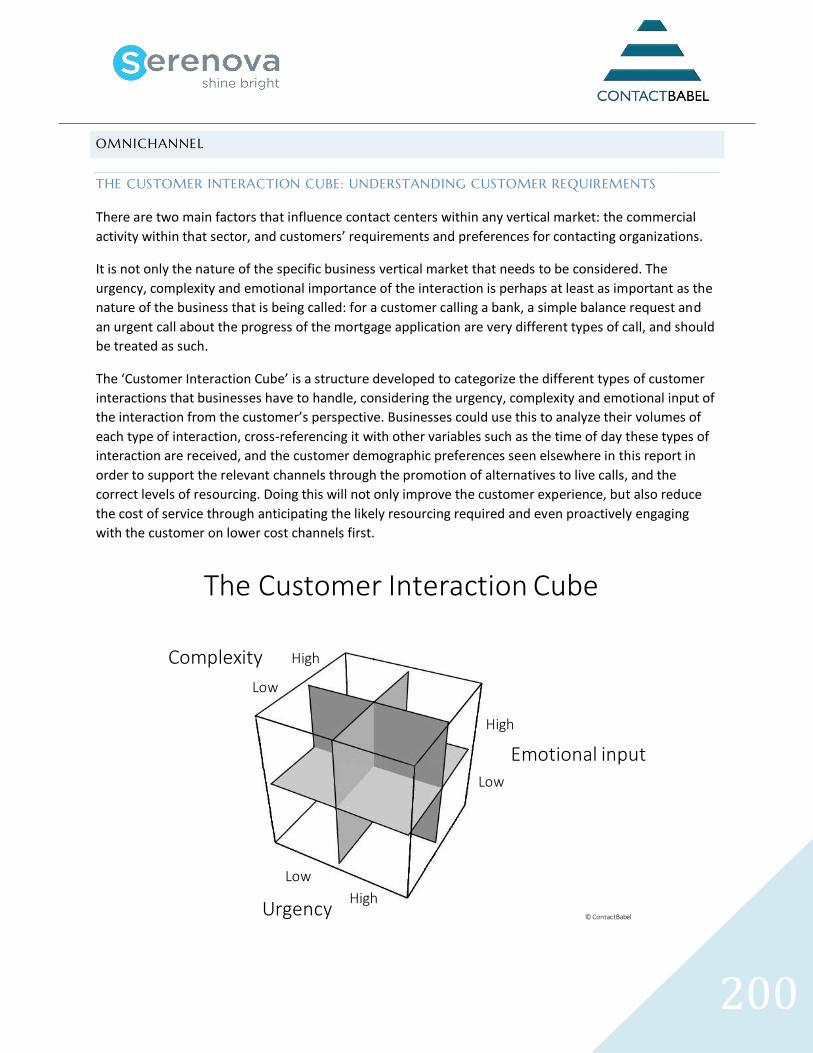
200
OMNICHANNEL
THE CUSTOMER INTERACTION CUBE: UNDERSTANDING CUSTOMER REQUIREMENTS
There are two main factors that influence contact centers within any vertical market: the commercial
activity within that sector, and customers’ requirements and preferences for contacting organizations.
It is not only the nature of the specific business vertical market that needs to be considered. The
urgency, complexity and emotional importance of the interaction is perhaps at least as important as the
nature of the business that is being called: for a customer calling a bank, a simple balance request and
an urgent call about the progress of the mortgage application are very different types of call, and should
be treated as such.
The ‘Customer Interaction Cube’ is a structure developed to categorize the different types of customer
interactions that businesses have to handle, considering the urgency, complexity and emotional input of
the interaction from the customer’s perspective. Businesses could use this to analyze their volumes of
each type of interaction, cross-referencing it with other variables such as the time of day these types of
interaction are received, and the customer demographic preferences seen elsewhere in this report in
order to support the relevant channels through the promotion of alternatives to live calls, and the
correct levels of resourcing. Doing this will not only improve the customer experience, but also reduce
the cost of service through anticipating the likely resourcing required and even proactively engaging
with the customer on lower cost channels first.
Emotional input
Urgency
Complexity
Low
Low
Low
High
High
High
© ContactBabel
The Customer Interaction Cube
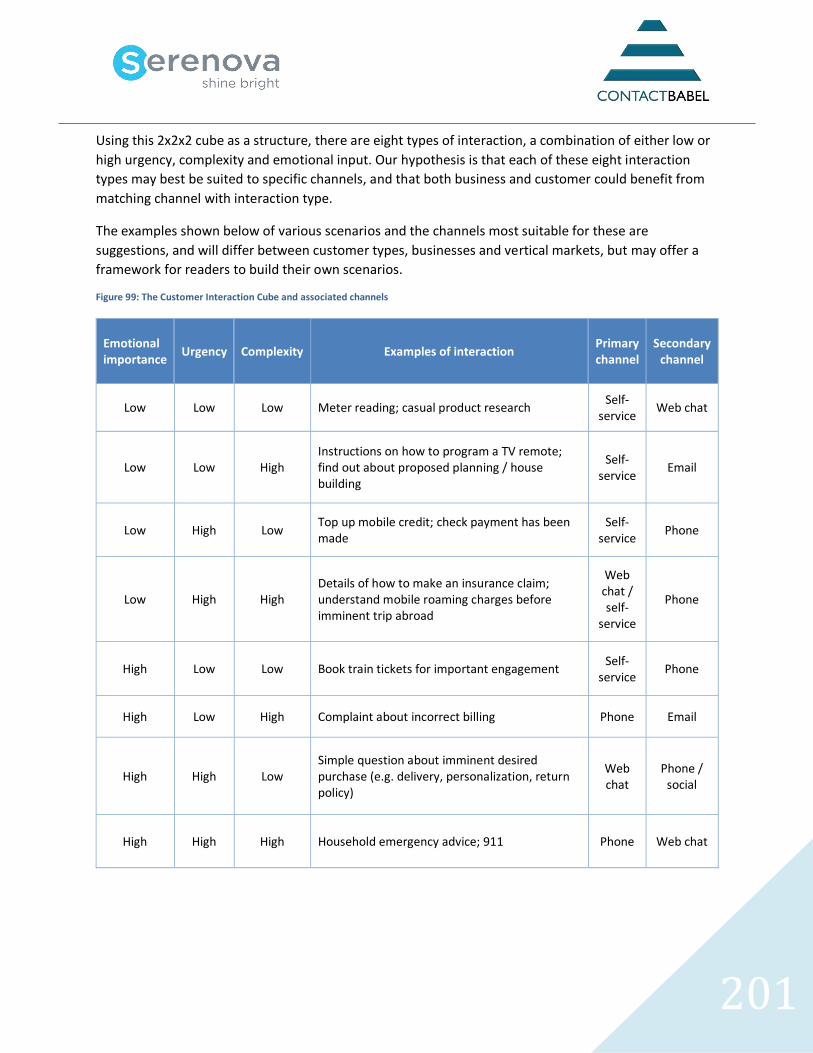
201
Using this 2x2x2 cube as a structure, there are eight types of interaction, a combination of either low or
high urgency, complexity and emotional input. Our hypothesis is that each of these eight interaction
types may best be suited to specific channels, and that both business and customer could benefit from
matching channel with interaction type.
The examples shown below of various scenarios and the channels most suitable for these are
suggestions, and will differ between customer types, businesses and vertical markets, but may offer a
framework for readers to build their own scenarios.
Figure 99: The Customer Interaction Cube and associated channels
Emotional importance
Urgency Complexity Examples of interaction Primary channel
Secondary channel
Low Low Low Meter reading; casual product research Self-
service Web chat
Low Low High Instructions on how to program a TV remote; find out about proposed planning / house building
Self-service
Low High Low Top up mobile credit; check payment has been made
Self-service
Phone
Low High High Details of how to make an insurance claim; understand mobile roaming charges before imminent trip abroad
Web chat / self-
service
Phone
High Low Low Book train tickets for important engagement Self-
service Phone
High Low High Complaint about incorrect billing Phone Email
High High Low Simple question about imminent desired purchase (e.g. delivery, personalization, return policy)
Web chat
Phone / social
High High High Household emergency advice; 911 Phone Web chat
202
There are many other variables that could be considered alongside these that will impact upon the
suitability of channels:
• Demographics
• Ownership of smartphone / broadband impacts upon channel availability
• Time of day (i.e. is this an out-of-hours enquiry? Is the customer at home, at work, or
travelling?)
• Whether the request is specific to an account, or a generic issue (i.e. is it necessary to pass
through security first?).
While the 2x2x2 cube can help businesses to estimate the current and potential volumes and resourcing
required to serve the customer base, it is important to remember that similar types of customer
interaction may require very different handling depending on circumstances. For example, a query
about product delivery may be a small part of a wide-ranging research process carried out by a
particularly thorough prospective customer, or may be asked by a customer who has just realized he’s
forgotten about an important birthday and needs immediate, accurate information.
McKinsey talks about the ‘moment of truth’ in customer interactions11, often occurring when the
customer has an unexpected problem or has a high emotional stake, when long-term loyalty and
customer advocacy can be won or lost depending on the outcome and the way in which it is handled.
Businesses and their representatives should be aware that these relatively rare occurrences offer great
opportunities. Recognizing and handling these moments of truth appropriately – moments which are
defined as such by the customer, not the business - will have a far greater long-term impact on customer
satisfaction and loyalty than the dozens of competently-handled, forgettable interactions that may have
happened previously.
Although the 2x2x2 cube gives some indication of the types of interaction that are more likely to be
‘moments of truth’, which businesses may choose to be handled by their more experienced and
empathetic agents, they are by their nature difficult to predict. Current real-time speech analytics
solutions can indicate a measure of stress in the customer’s voice, flagging this up to the agent within
the call, but agents should be in any case capable of recognizing this without technology. In any case, if
the customer has already tried two or three other channels without success, even the most competent
and empathetic agent will find it difficult to turn the moment of truth around positively.
11
http://www.mckinsey.com/business-functions/organization/our-insights/the-moment-of-truth-in-customer-
service
203
For this reason, a true omnichannel approach is vital which offers the same high level of service and
knowledge through each channel. Equally important is the freedom for agents to act in way appropriate
to the situation – for example, if a ‘high-emotion’ interaction happens on social media, which can’t be
handled on that channel (e.g. it needs to go through security, or is too complex and lengthy for a non-
voice channel), the agent should be given the license to place an outbound call to that customer in real-
time, rather than advise them to call the contact center. While this will impact upon the social media
channel’s service levels while the agent is away from it, the moment of truth offers the opportunity to
lock-in that customer’s loyalty. For contact center operations traditionally run on a structured
command-and-control basis, this may sound chaotic, but businesses have to decide if the occasional
relaxation of their own procedures is an acceptable trade-off for providing the customer with something
that they truly value. Agents need to be given carte blanche to deliver in ‘moments of truth’, and the
training and support to recognize when this is happening.
This is not to say that ‘moments of truth’ necessarily have to be handled by a live agent. The popularity
of self-service runs deep in the customer base, and the only reason that many customers abandon self-
service at the point of crisis in order to ring the contact center is because self-service cannot deliver
what they need. If companies focused their efforts on providing more sophisticated and reliable self-
service applications, there is no reason why these could not deliver at least as much customer benefit at
these moments of truth.
For example, if a passenger misses their plane, they are then likely to engage in a long and complicated
discussion with a live agent (either at the airport or in a contact center), involving alternatives,
connections and payments. If, on missing the last call for the plane, the customer were immediately
provided with an SMS or email detailing the various options available to them, which they could then
select and rebook at once, this would be more convenient for the customer and significantly reduce the
cost of service to the business. Perhaps more importantly, the customer would feel that the airline is
looking out for them, creating long-term loyalty out of the negative experience of missing a plane.
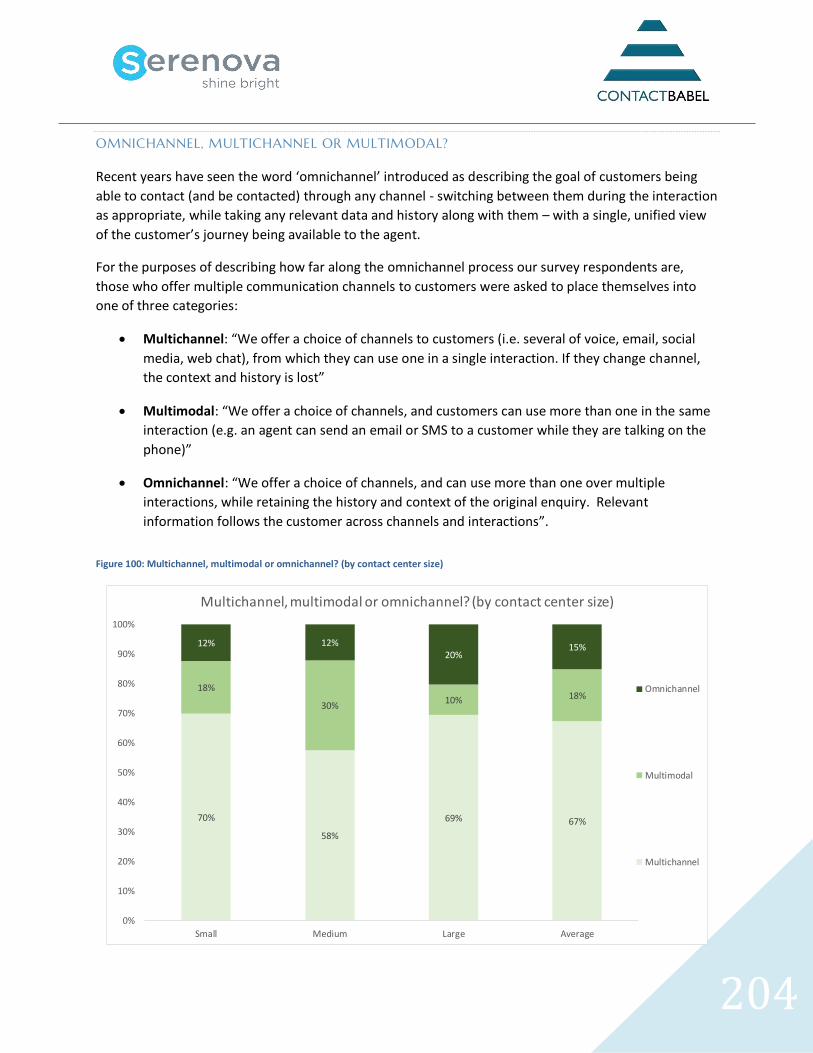
204
OMNICHANNEL, MULTICHANNEL OR MULTIMODAL?
Recent years have seen the word ‘omnichannel’ introduced as describing the goal of customers being
able to contact (and be contacted) through any channel - switching between them during the interaction
as appropriate, while taking any relevant data and history along with them – with a single, unified view
of the customer’s journey being available to the agent.
For the purposes of describing how far along the omnichannel process our survey respondents are,
those who offer multiple communication channels to customers were asked to place themselves into
one of three categories:
• Multichannel: “We offer a choice of channels to customers (i.e. several of voice, email, social
media, web chat), from which they can use one in a single interaction. If they change channel,
the context and history is lost”
• Multimodal: “We offer a choice of channels, and customers can use more than one in the same
interaction (e.g. an agent can send an email or SMS to a customer while they are talking on the
phone)”
• Omnichannel: “We offer a choice of channels, and can use more than one over multiple
interactions, while retaining the history and context of the original enquiry. Relevant
information follows the customer across channels and interactions”.
Figure 100: Multichannel, multimodal or omnichannel? (by contact center size)
70%
58%
69% 67%
18%
30%10% 18%
12% 12%20%
15%
0%
10%
20%
30%
40%
50%
60%
70%
80%
90%
100%
Small Medium Large Average
Multichannel, multimodal or omnichannel? (by contact center size)
Omnichannel
Multimodal
Multichannel
205
Only 15% of respondents described themselves as omnichannel, 18% assessing themselves as
multimodal and 67% multichannel (a very slight change on 2016’s figures of 13%, 18% and 69%
respectively).
This was not entirely a factor of contact center size - smaller, sub-50 seat operations were almost as
likely as medium-sized operations to identify multimodal - and this makes sense, as the proportion of
non-voice activity in smaller operations is generally far higher than in large contact centers.
For true omnichannel, the platform, infrastructure, applications and resources need to be available to
identify, route and switch interactions between agents and channels seamlessly, while keeping all
relevant data gathered in the course of the interaction: larger operations are more likely to have had the
investment made to deliver this sort of experience.
A key aim of omnichannel is to provide a consistency of customer experience, and this requires access
not only to the same master dataset, but also the same knowledge bases and business logic must be
applied equally. There must be real-time data flow and updates between channels and databases, as
without this, consistency is impossible.
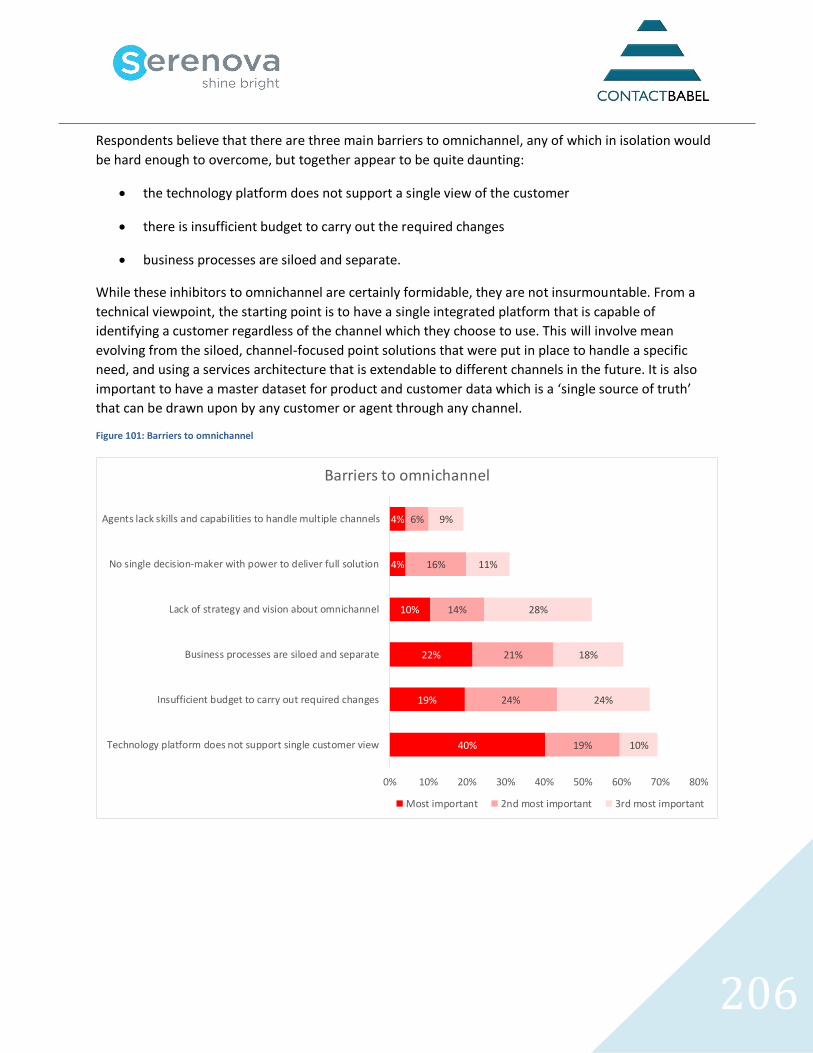
206
Respondents believe that there are three main barriers to omnichannel, any of which in isolation would
be hard enough to overcome, but together appear to be quite daunting:
• the technology platform does not support a single view of the customer
• there is insufficient budget to carry out the required changes
• business processes are siloed and separate.
While these inhibitors to omnichannel are certainly formidable, they are not insurmountable. From a
technical viewpoint, the starting point is to have a single integrated platform that is capable of
identifying a customer regardless of the channel which they choose to use. This will involve mean
evolving from the siloed, channel-focused point solutions that were put in place to handle a specific
need, and using a services architecture that is extendable to different channels in the future. It is also
important to have a master dataset for product and customer data which is a ‘single source of truth’
that can be drawn upon by any customer or agent through any channel.
Figure 101: Barriers to omnichannel
40%
19%
22%
10%
4%
4%
19%
24%
21%
14%
16%
6%
10%
24%
18%
28%
11%
9%
0% 10% 20% 30% 40% 50% 60% 70% 80%
Technology platform does not support single customer view
Insufficient budget to carry out required changes
Business processes are siloed and separate
Lack of strategy and vision about omnichannel
No single decision-maker with power to deliver full solution
Agents lack skills and capabilities to handle multiple channels
Barriers to omnichannel
Most important 2nd most important 3rd most important
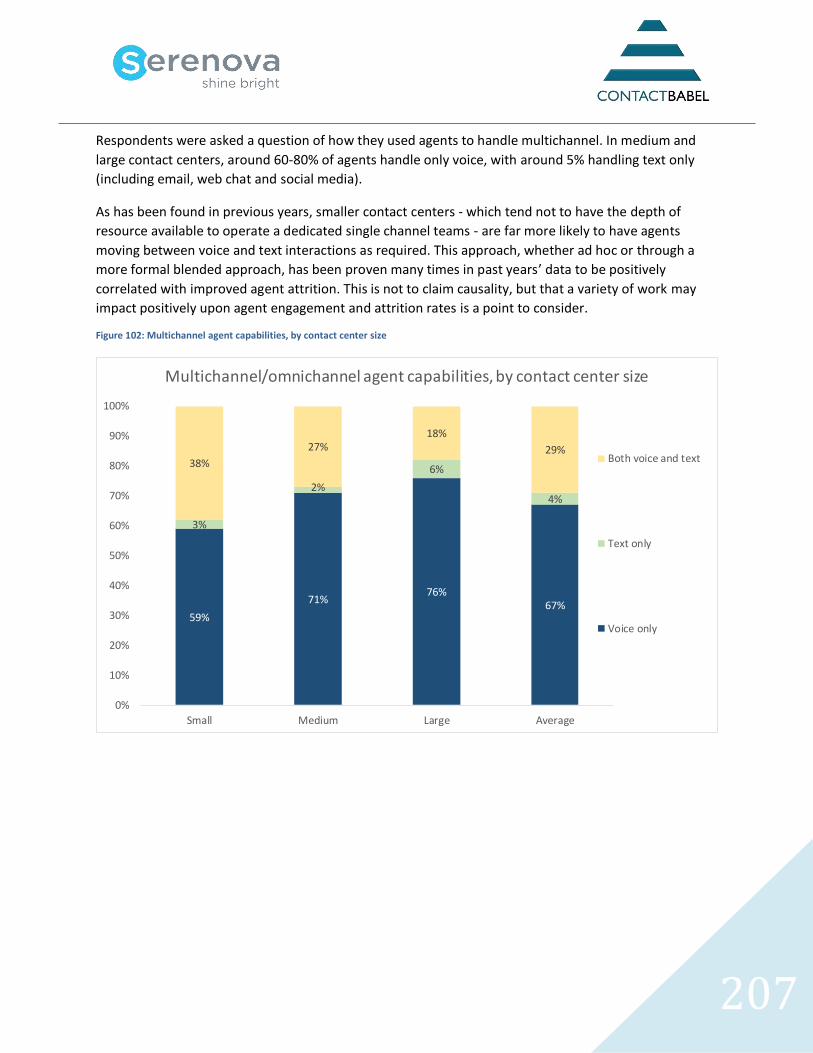
207
Respondents were asked a question of how they used agents to handle multichannel. In medium and
large contact centers, around 60-80% of agents handle only voice, with around 5% handling text only
(including email, web chat and social media).
As has been found in previous years, smaller contact centers - which tend not to have the depth of
resource available to operate a dedicated single channel teams - are far more likely to have agents
moving between voice and text interactions as required. This approach, whether ad hoc or through a
more formal blended approach, has been proven many times in past years’ data to be positively
correlated with improved agent attrition. This is not to claim causality, but that a variety of work may
impact positively upon agent engagement and attrition rates is a point to consider.
Figure 102: Multichannel agent capabilities, by contact center size
59%
71%76%
67%
3%
2%
6%
4%
38%
27%18%
29%
0%
10%
20%
30%
40%
50%
60%
70%
80%
90%
100%
Small Medium Large Average
Multichannel/omnichannel agent capabilities, by contact center size
Both voice and text
Text only
Voice only
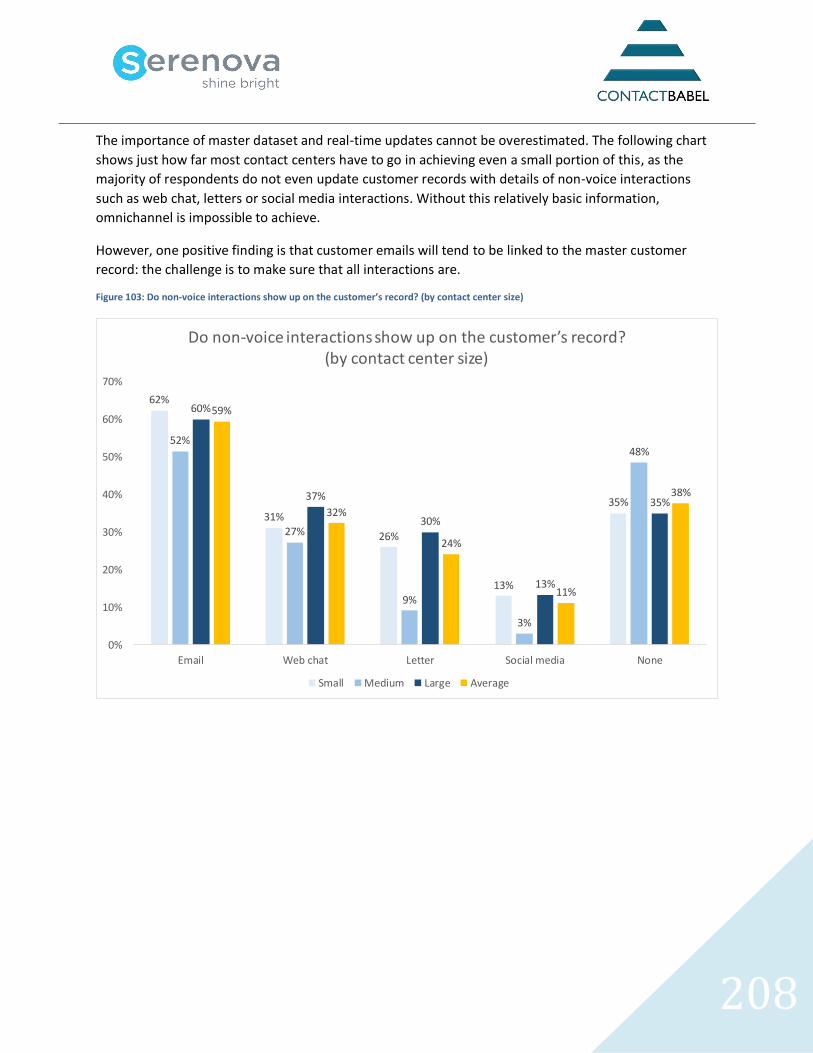
208
The importance of master dataset and real-time updates cannot be overestimated. The following chart
shows just how far most contact centers have to go in achieving even a small portion of this, as the
majority of respondents do not even update customer records with details of non-voice interactions
such as web chat, letters or social media interactions. Without this relatively basic information,
omnichannel is impossible to achieve.
However, one positive finding is that customer emails will tend to be linked to the master customer
record: the challenge is to make sure that all interactions are.
Figure 103: Do non-voice interactions show up on the customer’s record? (by contact center size)
62%
31%
26%
13%
35%
52%
27%
9%
3%
48%
60%
37%
30%
13%
35%
59%
32%
24%
11%
38%
0%
10%
20%
30%
40%
50%
60%
70%
Email Web chat Letter Social media None
Do non-voice interactions show up on the customer’s record? (by contact center size)
Small Medium Large Average
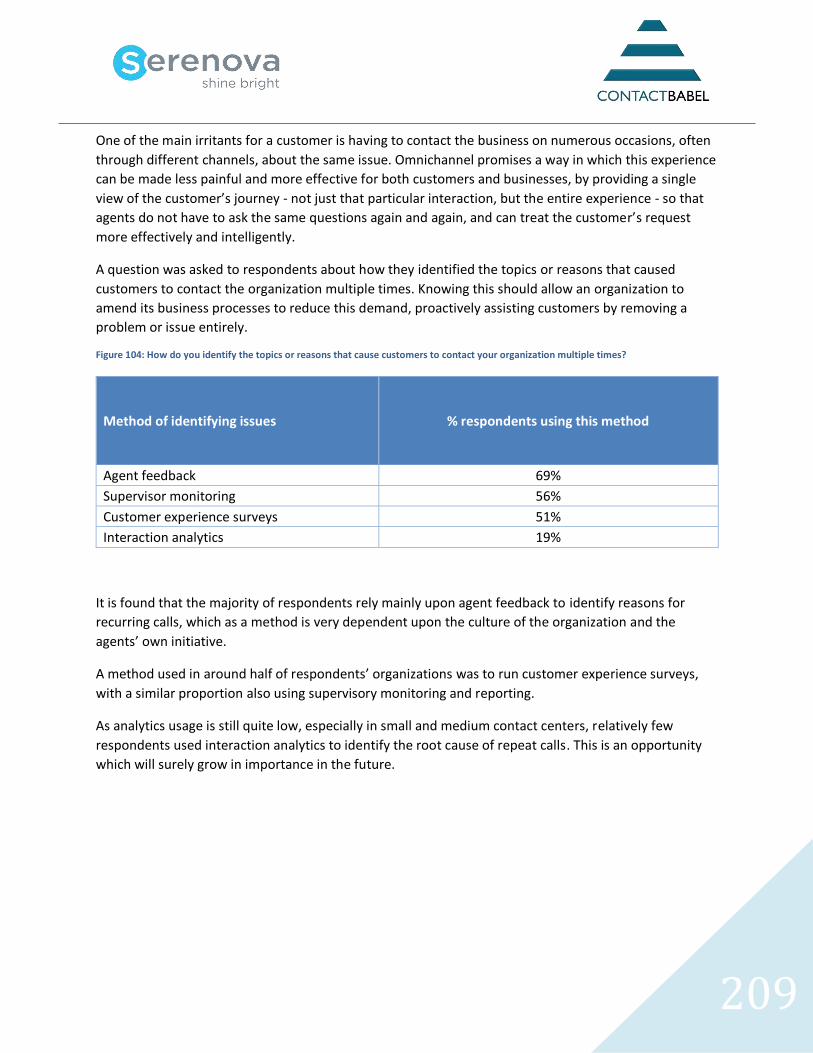
209
One of the main irritants for a customer is having to contact the business on numerous occasions, often
through different channels, about the same issue. Omnichannel promises a way in which this experience
can be made less painful and more effective for both customers and businesses, by providing a single
view of the customer’s journey - not just that particular interaction, but the entire experience - so that
agents do not have to ask the same questions again and again, and can treat the customer’s request
more effectively and intelligently.
A question was asked to respondents about how they identified the topics or reasons that caused
customers to contact the organization multiple times. Knowing this should allow an organization to
amend its business processes to reduce this demand, proactively assisting customers by removing a
problem or issue entirely.
Figure 104: How do you identify the topics or reasons that cause customers to contact your organization multiple times?
Method of identifying issues
% respondents using this method
Agent feedback 69%
Supervisor monitoring 56%
Customer experience surveys 51%
Interaction analytics 19%
It is found that the majority of respondents rely mainly upon agent feedback to identify reasons for
recurring calls, which as a method is very dependent upon the culture of the organization and the
agents’ own initiative.
A method used in around half of respondents’ organizations was to run customer experience surveys,
with a similar proportion also using supervisory monitoring and reporting.
As analytics usage is still quite low, especially in small and medium contact centers, relatively few
respondents used interaction analytics to identify the root cause of repeat calls. This is an opportunity
which will surely grow in importance in the future.
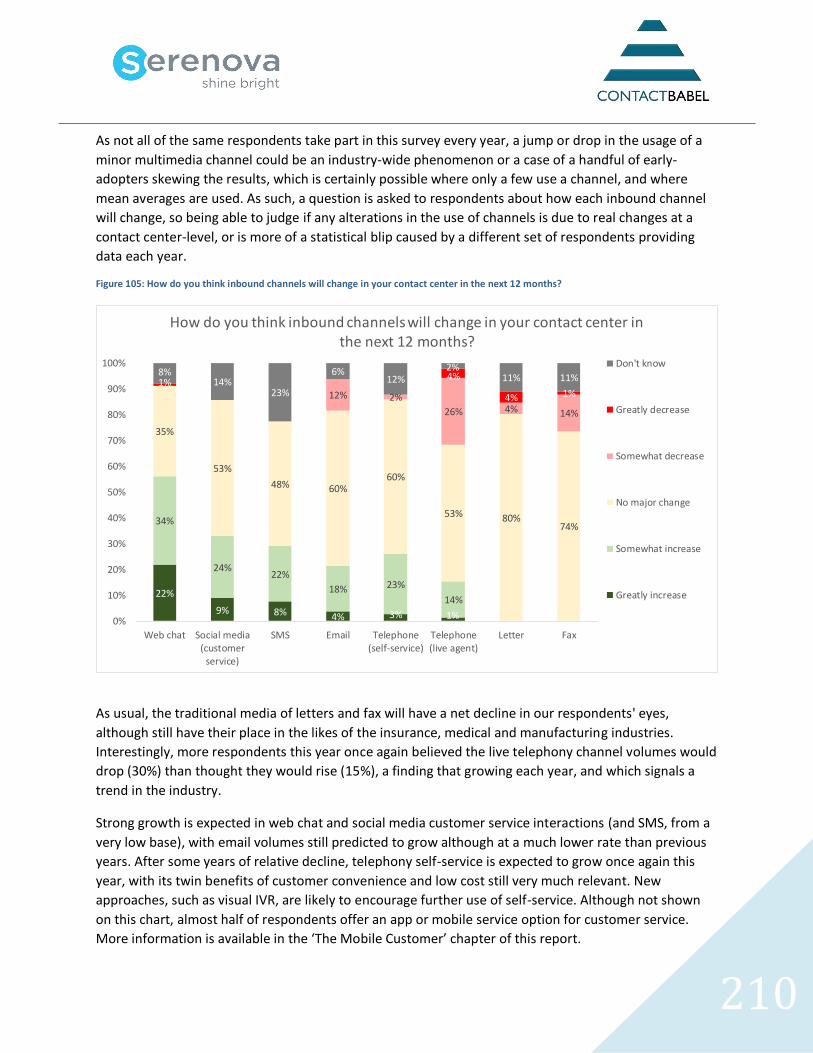
210
As not all of the same respondents take part in this survey every year, a jump or drop in the usage of a
minor multimedia channel could be an industry-wide phenomenon or a case of a handful of early-
adopters skewing the results, which is certainly possible where only a few use a channel, and where
mean averages are used. As such, a question is asked to respondents about how each inbound channel
will change, so being able to judge if any alterations in the use of channels is due to real changes at a
contact center-level, or is more of a statistical blip caused by a different set of respondents providing
data each year.
Figure 105: How do you think inbound channels will change in your contact center in the next 12 months?
As usual, the traditional media of letters and fax will have a net decline in our respondents' eyes,
although still have their place in the likes of the insurance, medical and manufacturing industries.
Interestingly, more respondents this year once again believed the live telephony channel volumes would
drop (30%) than thought they would rise (15%), a finding that growing each year, and which signals a
trend in the industry.
Strong growth is expected in web chat and social media customer service interactions (and SMS, from a
very low base), with email volumes still predicted to grow although at a much lower rate than previous
years. After some years of relative decline, telephony self-service is expected to grow once again this
year, with its twin benefits of customer convenience and low cost still very much relevant. New
approaches, such as visual IVR, are likely to encourage further use of self-service. Although not shown
on this chart, almost half of respondents offer an app or mobile service option for customer service.
More information is available in the ‘The Mobile Customer’ chapter of this report.
22%
9% 8% 4% 3% 1%
34%
24%22%
18% 23%
14%
35%
53%
48% 60%60%
53% 80%74%
12% 2%
26% 4% 14%
1%4%
4% 1%
8%14%
23%
6%12%
2%11% 11%
0%
10%
20%
30%
40%
50%
60%
70%
80%
90%
100%
Web chat Social media(customer
service)
SMS Email Telephone(self-service)
Telephone(live agent)
Letter Fax
How do you think inbound channels will change in your contact center in the next 12 months?
Don't know
Greatly decrease
Somewhat decrease
No major change
Somewhat increase
Greatly increase
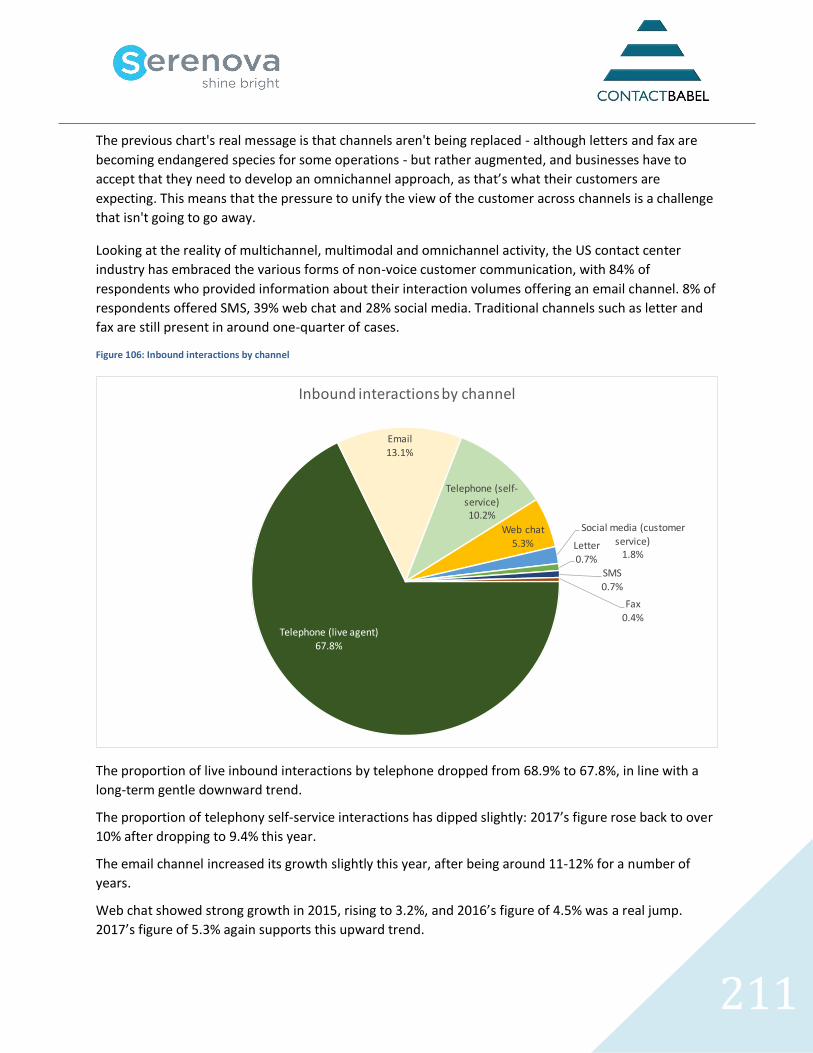
211
The previous chart's real message is that channels aren't being replaced - although letters and fax are
becoming endangered species for some operations - but rather augmented, and businesses have to
accept that they need to develop an omnichannel approach, as that’s what their customers are
expecting. This means that the pressure to unify the view of the customer across channels is a challenge
that isn't going to go away.
Looking at the reality of multichannel, multimodal and omnichannel activity, the US contact center
industry has embraced the various forms of non-voice customer communication, with 84% of
respondents who provided information about their interaction volumes offering an email channel. 8% of
respondents offered SMS, 39% web chat and 28% social media. Traditional channels such as letter and
fax are still present in around one-quarter of cases.
Figure 106: Inbound interactions by channel
The proportion of live inbound interactions by telephone dropped from 68.9% to 67.8%, in line with a
long-term gentle downward trend.
The proportion of telephony self-service interactions has dipped slightly: 2017’s figure rose back to over
10% after dropping to 9.4% this year.
The email channel increased its growth slightly this year, after being around 11-12% for a number of
years.
Web chat showed strong growth in 2015, rising to 3.2%, and 2016’s figure of 4.5% was a real jump.
2017’s figure of 5.3% again supports this upward trend.
Telephone (live agent)67.8%
13.1%
Telephone (self-
service)10.2%
Web chat5.3%
Social media (customer service)
1.8%Letter0.7%
SMS
0.7%
Fax0.4%
Inbound interactions by channel
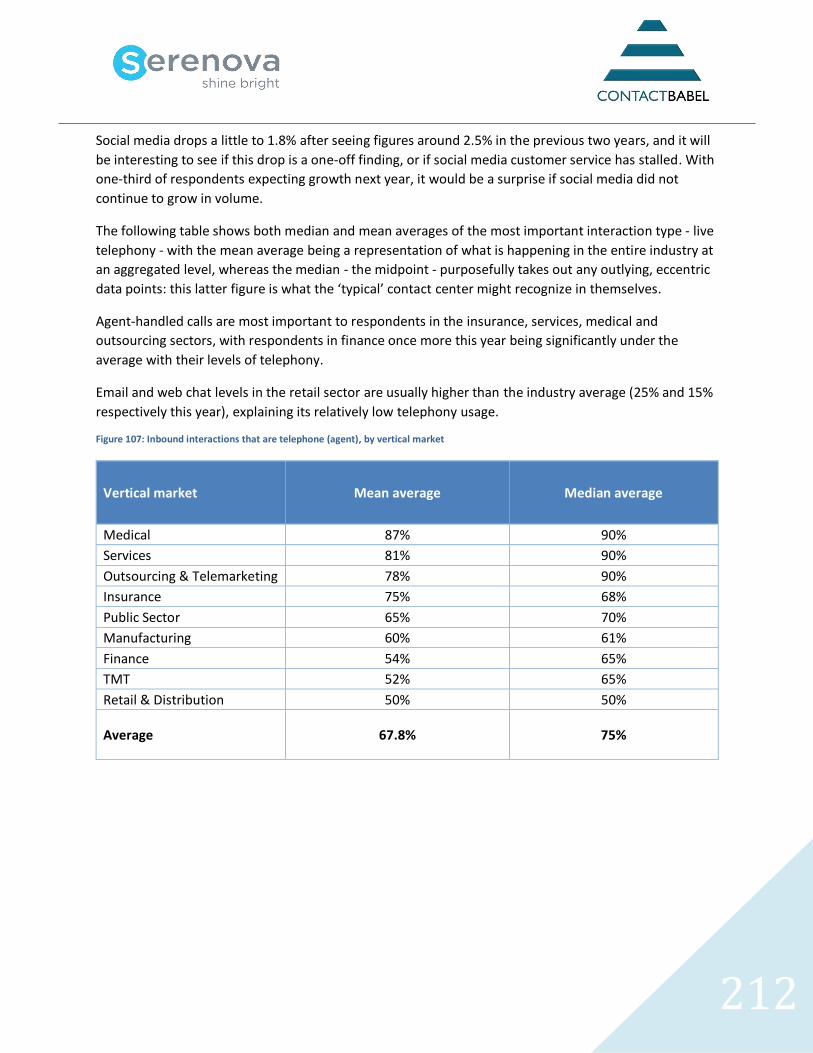
212
Social media drops a little to 1.8% after seeing figures around 2.5% in the previous two years, and it will
be interesting to see if this drop is a one-off finding, or if social media customer service has stalled. With
one-third of respondents expecting growth next year, it would be a surprise if social media did not
continue to grow in volume.
The following table shows both median and mean averages of the most important interaction type - live
telephony - with the mean average being a representation of what is happening in the entire industry at
an aggregated level, whereas the median - the midpoint - purposefully takes out any outlying, eccentric
data points: this latter figure is what the ‘typical’ contact center might recognize in themselves.
Agent-handled calls are most important to respondents in the insurance, services, medical and
outsourcing sectors, with respondents in finance once more this year being significantly under the
average with their levels of telephony.
Email and web chat levels in the retail sector are usually higher than the industry average (25% and 15%
respectively this year), explaining its relatively low telephony usage.
Figure 107: Inbound interactions that are telephone (agent), by vertical market
Vertical market
Mean average Median average
Medical 87% 90%
Services 81% 90%
Outsourcing & Telemarketing 78% 90%
Insurance 75% 68%
Public Sector 65% 70%
Manufacturing 60% 61%
Finance 54% 65%
TMT 52% 65%
Retail & Distribution 50% 50%
Average 67.8% 75%
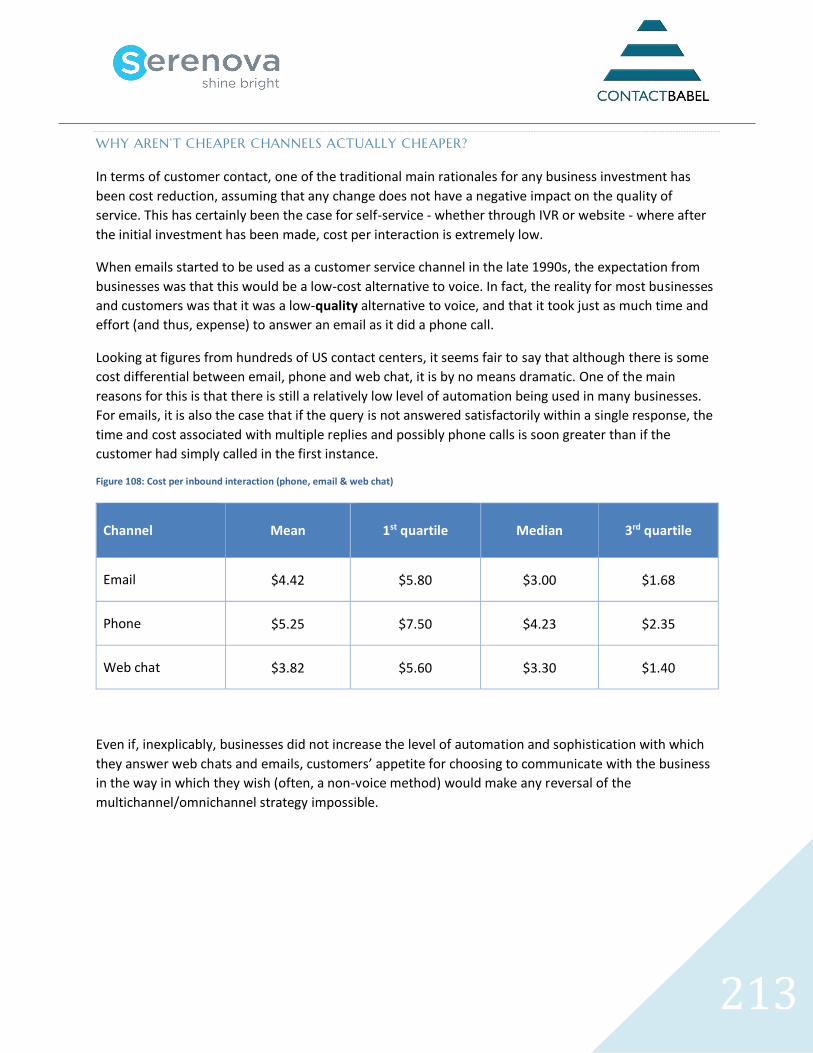
213
WHY AREN’T CHEAPER CHANNELS ACTUALLY CHEAPER?
In terms of customer contact, one of the traditional main rationales for any business investment has
been cost reduction, assuming that any change does not have a negative impact on the quality of
service. This has certainly been the case for self-service - whether through IVR or website - where after
the initial investment has been made, cost per interaction is extremely low.
When emails started to be used as a customer service channel in the late 1990s, the expectation from
businesses was that this would be a low-cost alternative to voice. In fact, the reality for most businesses
and customers was that it was a low-quality alternative to voice, and that it took just as much time and
effort (and thus, expense) to answer an email as it did a phone call.
Looking at figures from hundreds of US contact centers, it seems fair to say that although there is some
cost differential between email, phone and web chat, it is by no means dramatic. One of the main
reasons for this is that there is still a relatively low level of automation being used in many businesses.
For emails, it is also the case that if the query is not answered satisfactorily within a single response, the
time and cost associated with multiple replies and possibly phone calls is soon greater than if the
customer had simply called in the first instance.
Figure 108: Cost per inbound interaction (phone, email & web chat)
Channel
Mean
1st quartile Median 3rd quartile
Email $4.42 $5.80 $3.00 $1.68
Phone $5.25 $7.50 $4.23 $2.35
Web chat $3.82 $5.60 $3.30 $1.40
Even if, inexplicably, businesses did not increase the level of automation and sophistication with which
they answer web chats and emails, customers’ appetite for choosing to communicate with the business
in the way in which they wish (often, a non-voice method) would make any reversal of the
multichannel/omnichannel strategy impossible.
214
EMAIL MANAGEMENT
Email was the first of the non-voice multimedia channels to be used, and is still by far the most well-
used, having been mainstream for well over 10 years. Although its current penetration rate of over 13%
makes it a relative success, this should be placed in the context of the expectations of contact center
managers who in a 1998 survey confidently expected email to account for 25% of inbound traffic by
2003.
Email should stand as a salutary lesson that it is not businesses that make new channels a success, but
customers. Put bluntly, email in its first incarnation failed almost entirely. Too many businesses rushed
to push customers to this new channel - commonly supposed to be cheaper than voice - without having
the processes, solutions or staff to manage this properly. What happened next can be understood as a
‘herd inoculation’: enough customers had enough bad experiences from enough organizations that the
entire channel was discredited, even for those businesses which were providing a reasonable service
through email or just keeping a watching brief.
The reason for this rejection was the appalling level of service provided by many of the early multimedia
businesses. With response times stretching into many days, if not weeks, the companies failed to
understand that any communication with the business has a degree of urgency to it, else why would
they be trying to speak with the business at all? Of course, even when a response was eventually
provided, the issue might have gone away, or been dealt with by calling the contact center, meaning
that customers’ existing confidence in the voice channel was further reinforced at the expense of the
email channel. It is also the case that email does not fit the type of enquiries that people make in some
cases, such as the need for quick, simple and confidential information (such as an account balance), and
the increasing requirements for identity checking places a cap on the usefulness of email as a channel
for some types of business.
It took many years, much investment and the coaxing of customers to try new channels again for email
to emerge as being credible. Of course, businesses and customers now both realize that email is more
suitable for some interaction types than others (the rise of web self-service has meant email is no longer
the only online communication method available), and complex issues such as complaints, or other
enquiries requiring a formal paper trail are well-suited to email. In fact, much of the demise in the letter
and fax as channels can be traced to a direct replacement by email. Email is also an excellent outbound
channel, providing reassurance, great levels of detail and attachments, and is able to link to other
specific areas of information via hyperlinks. As an inbound channel, it has inherent weaknesses: an
inability to carry out customer authentication and to carry out a real-time 2-way conversation being
amongst them, as well as the lengthy wait to get a response. In the longer term, it is likely to be
superseded to some extent by more immediate online channels such as web chat and social media. It
does however have the advantage over virtually every channel that there is no queue time at all - the
customer writes the email and presses ‘Send’ immediately - a ‘fire and forget’ interaction.
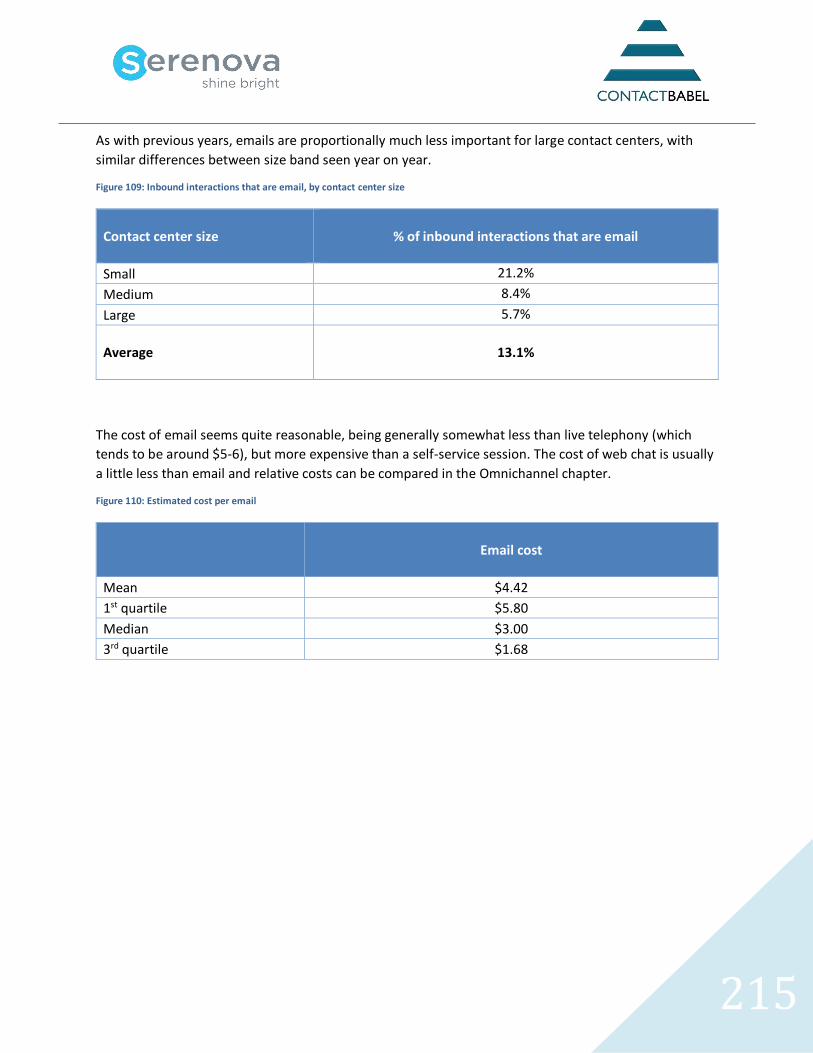
215
As with previous years, emails are proportionally much less important for large contact centers, with
similar differences between size band seen year on year.
Figure 109: Inbound interactions that are email, by contact center size
Contact center size
% of inbound interactions that are email
Small 21.2%
Medium 8.4%
Large 5.7%
Average
13.1%
The cost of email seems quite reasonable, being generally somewhat less than live telephony (which
tends to be around $5-6), but more expensive than a self-service session. The cost of web chat is usually
a little less than email and relative costs can be compared in the Omnichannel chapter.
Figure 110: Estimated cost per email
Email cost
Mean $4.42
1st quartile $5.80
Median $3.00
3rd quartile $1.68
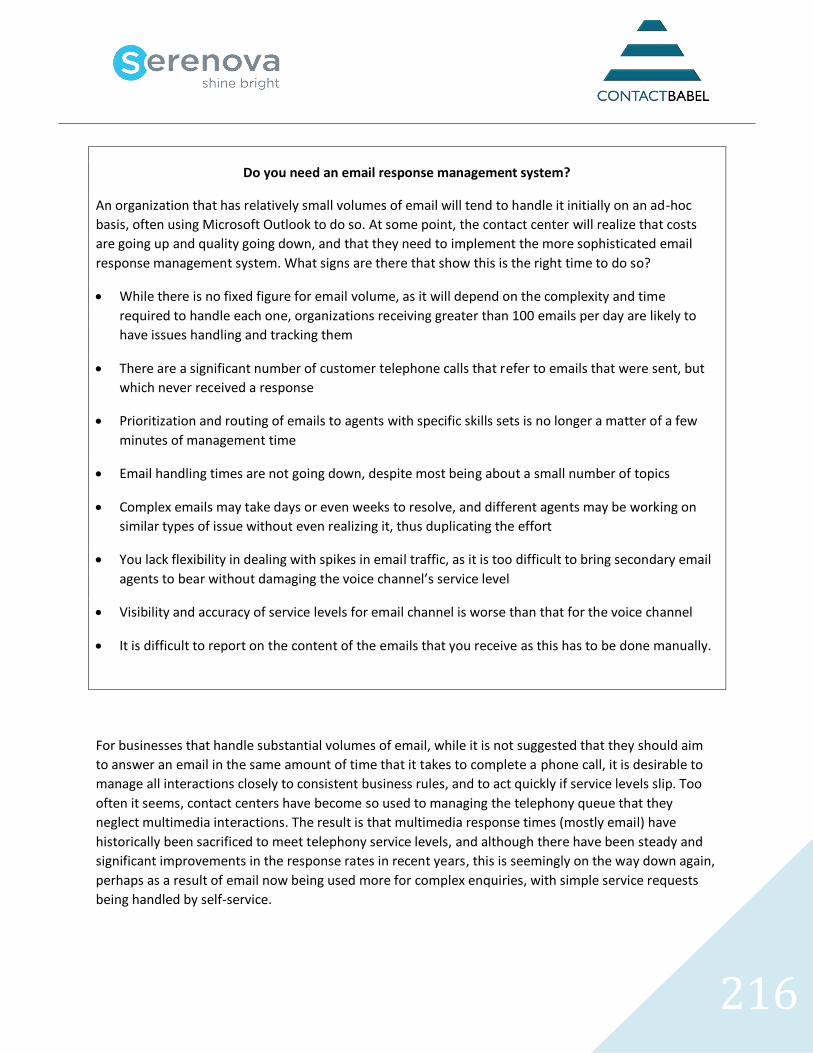
216
Do you need an email response management system?
An organization that has relatively small volumes of email will tend to handle it initially on an ad-hoc
basis, often using Microsoft Outlook to do so. At some point, the contact center will realize that costs
are going up and quality going down, and that they need to implement the more sophisticated email
response management system. What signs are there that show this is the right time to do so?
• While there is no fixed figure for email volume, as it will depend on the complexity and time
required to handle each one, organizations receiving greater than 100 emails per day are likely to
have issues handling and tracking them
• There are a significant number of customer telephone calls that refer to emails that were sent, but
which never received a response
• Prioritization and routing of emails to agents with specific skills sets is no longer a matter of a few
minutes of management time
• Email handling times are not going down, despite most being about a small number of topics
• Complex emails may take days or even weeks to resolve, and different agents may be working on
similar types of issue without even realizing it, thus duplicating the effort
• You lack flexibility in dealing with spikes in email traffic, as it is too difficult to bring secondary email
agents to bear without damaging the voice channel’s service level
• Visibility and accuracy of service levels for email channel is worse than that for the voice channel
• It is difficult to report on the content of the emails that you receive as this has to be done manually.
For businesses that handle substantial volumes of email, while it is not suggested that they should aim
to answer an email in the same amount of time that it takes to complete a phone call, it is desirable to
manage all interactions closely to consistent business rules, and to act quickly if service levels slip. Too
often it seems, contact centers have become so used to managing the telephony queue that they
neglect multimedia interactions. The result is that multimedia response times (mostly email) have
historically been sacrificed to meet telephony service levels, and although there have been steady and
significant improvements in the response rates in recent years, this is seemingly on the way down again,
perhaps as a result of email now being used more for complex enquiries, with simple service requests
being handled by self-service.
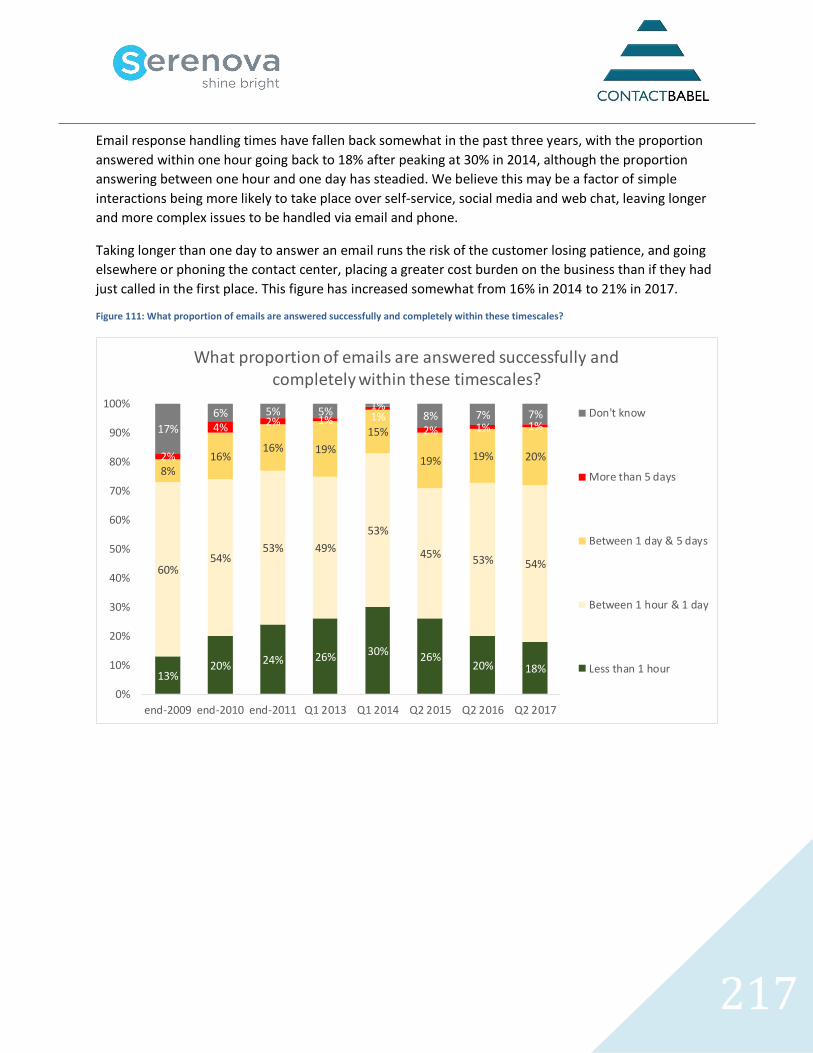
217
Email response handling times have fallen back somewhat in the past three years, with the proportion
answered within one hour going back to 18% after peaking at 30% in 2014, although the proportion
answering between one hour and one day has steadied. We believe this may be a factor of simple
interactions being more likely to take place over self-service, social media and web chat, leaving longer
and more complex issues to be handled via email and phone.
Taking longer than one day to answer an email runs the risk of the customer losing patience, and going
elsewhere or phoning the contact center, placing a greater cost burden on the business than if they had
just called in the first place. This figure has increased somewhat from 16% in 2014 to 21% in 2017.
Figure 111: What proportion of emails are answered successfully and completely within these timescales?
13%20% 24% 26% 30% 26%
20% 18%
60%54%
53% 49%
53%
45% 53% 54%
8%16%
16% 19%
15%
19% 19% 20%2%
4% 2% 1% 1%2% 1% 1%17%
6% 5% 5% 1%8% 7% 7%
0%
10%
20%
30%
40%
50%
60%
70%
80%
90%
100%
end-2009 end-2010 end-2011 Q1 2013 Q1 2014 Q2 2015 Q2 2016 Q2 2017
What proportion of emails are answered successfully and completely within these timescales?
Don't know
More than 5 days
Between 1 day & 5 days
Between 1 hour & 1 day
Less than 1 hour
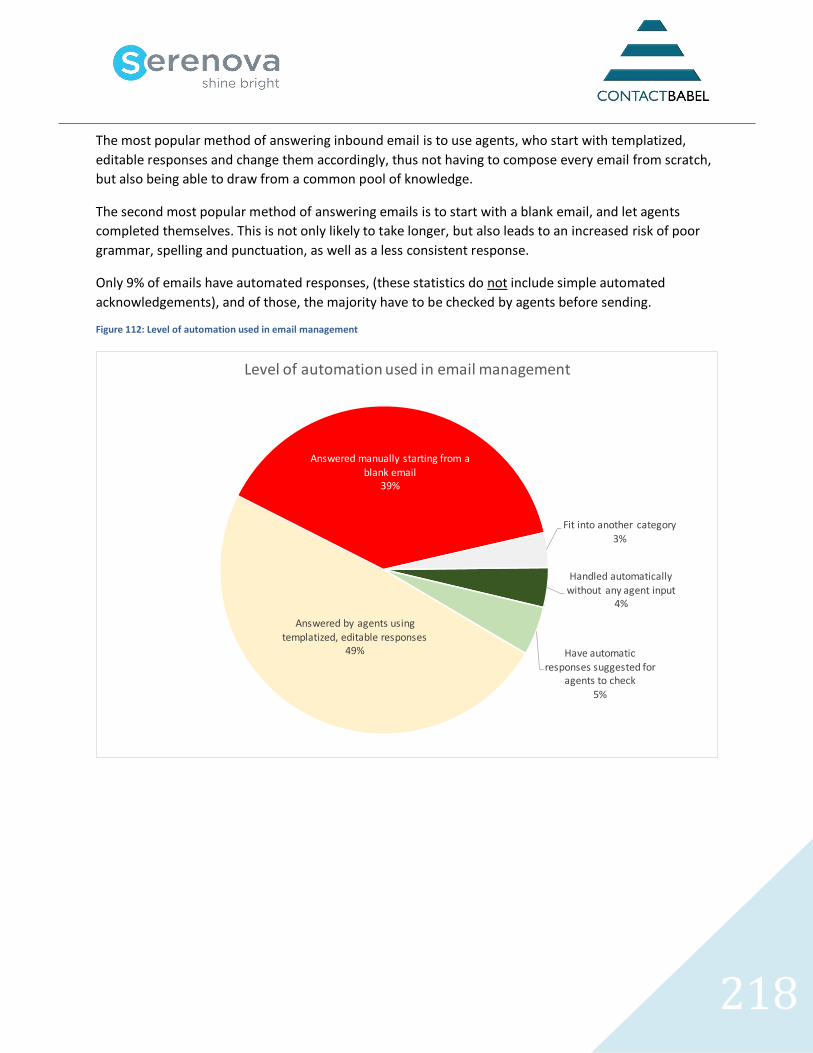
218
The most popular method of answering inbound email is to use agents, who start with templatized,
editable responses and change them accordingly, thus not having to compose every email from scratch,
but also being able to draw from a common pool of knowledge.
The second most popular method of answering emails is to start with a blank email, and let agents
completed themselves. This is not only likely to take longer, but also leads to an increased risk of poor
grammar, spelling and punctuation, as well as a less consistent response.
Only 9% of emails have automated responses, (these statistics do not include simple automated
acknowledgements), and of those, the majority have to be checked by agents before sending.
Figure 112: Level of automation used in email management
Handled automatically
without any agent input4%
Have automatic responses suggested for
agents to check5%
Answered by agents using templatized, editable responses
49%
Answered manually starting from a blank email
39%
Fit into another category3%
Level of automation used in email management
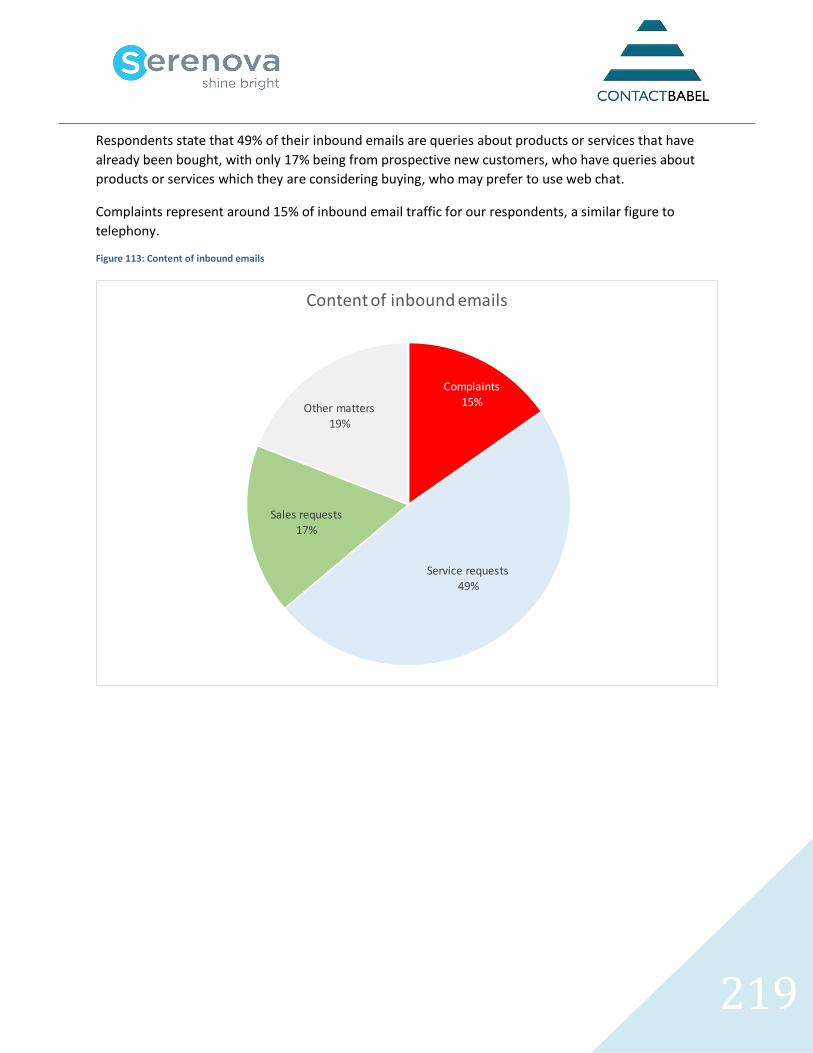
219
Respondents state that 49% of their inbound emails are queries about products or services that have
already been bought, with only 17% being from prospective new customers, who have queries about
products or services which they are considering buying, who may prefer to use web chat.
Complaints represent around 15% of inbound email traffic for our respondents, a similar figure to
telephony.
Figure 113: Content of inbound emails
Complaints15%
Service requests49%
Sales requests
17%
Other matters
19%
Content of inbound emails
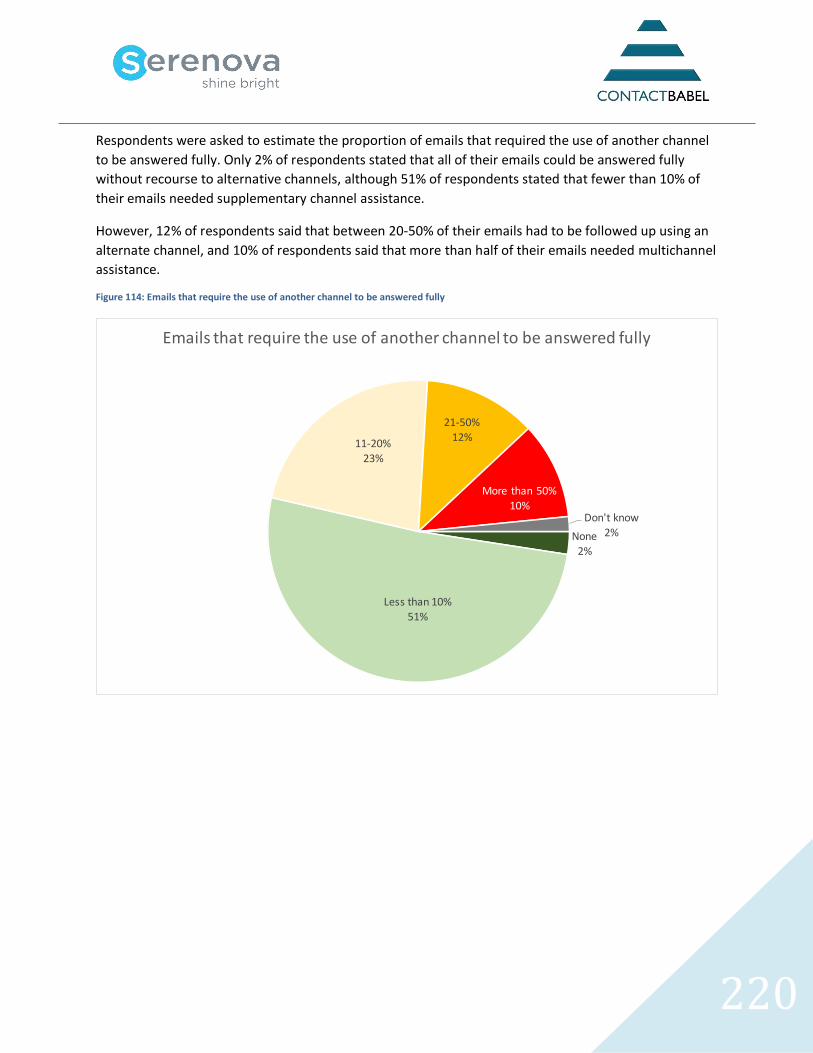
220
Respondents were asked to estimate the proportion of emails that required the use of another channel
to be answered fully. Only 2% of respondents stated that all of their emails could be answered fully
without recourse to alternative channels, although 51% of respondents stated that fewer than 10% of
their emails needed supplementary channel assistance.
However, 12% of respondents said that between 20-50% of their emails had to be followed up using an
alternate channel, and 10% of respondents said that more than half of their emails needed multichannel
assistance.
Figure 114: Emails that require the use of another channel to be answered fully
None2%
Less than 10%51%
11-20%23%
21-50%12%
More than 50%
10%Don't know
2%
Emails that require the use of another channel to be answered fully
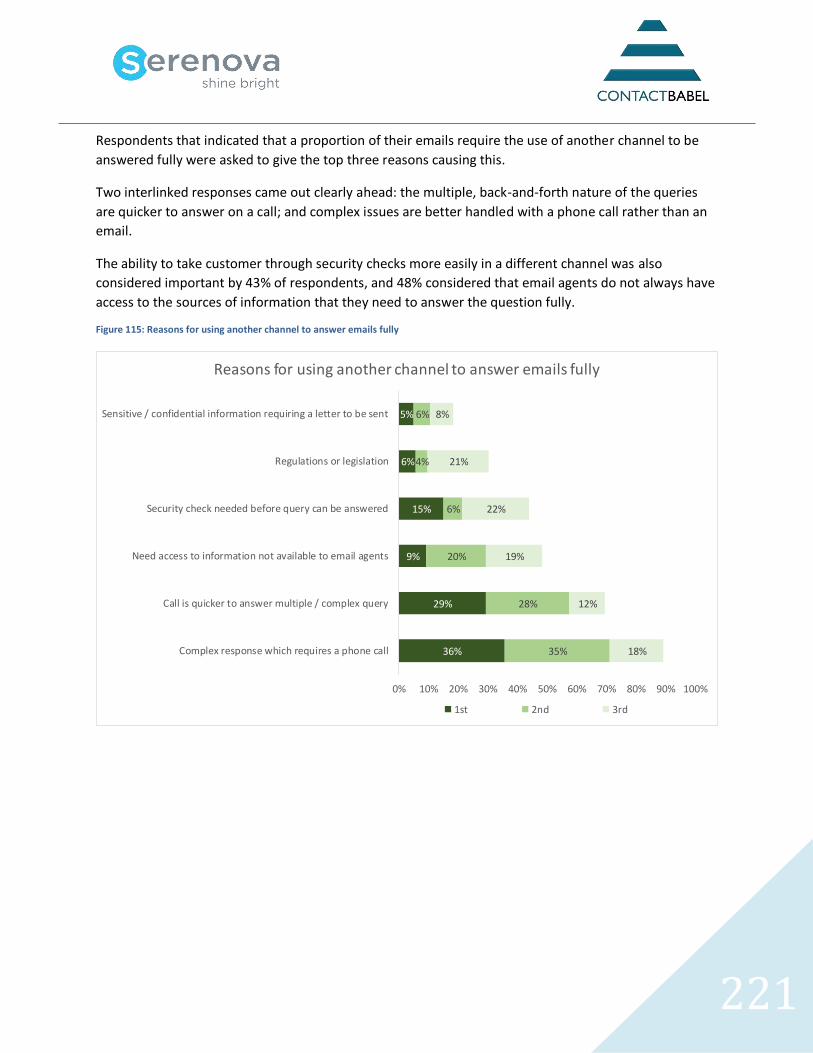
221
Respondents that indicated that a proportion of their emails require the use of another channel to be
answered fully were asked to give the top three reasons causing this.
Two interlinked responses came out clearly ahead: the multiple, back-and-forth nature of the queries
are quicker to answer on a call; and complex issues are better handled with a phone call rather than an
email.
The ability to take customer through security checks more easily in a different channel was also
considered important by 43% of respondents, and 48% considered that email agents do not always have
access to the sources of information that they need to answer the question fully.
Figure 115: Reasons for using another channel to answer emails fully
36%
29%
9%
15%
6%
5%
35%
28%
20%
6%
4%
6%
18%
12%
19%
22%
21%
8%
0% 10% 20% 30% 40% 50% 60% 70% 80% 90% 100%
Complex response which requires a phone call
Call is quicker to answer multiple / complex query
Need access to information not available to email agents
Security check needed before query can be answered
Regulations or legislation
Sensitive / confidential information requiring a letter to be sent
Reasons for using another channel to answer emails fully
1st 2nd 3rd
222
WEB CHAT
Web chat (or instant messaging / IM) sessions act by offering a live or automated text assistance option
to the process of web browsing. Like email, it has been around for many years, but only very recently
has started to grow volumes to the extent where it has become a mainstream channel for customer-
business interactions.
Web chat offers an organization a chance to cut costs through running more than one chat session at a
time with customers, using the time that a customer spends reading and replying to an agent’s response
to deal with other customers concurrently. Solution providers offer the option for an agent to deal with
4 or more sessions at the same time, but whether this is a sustainable model for the agent or provides
an acceptable quality of service for the customer is quite another question. Agents can respond to
frequently-asked questions by using ‘hot-keys’, which provide templatized answers and can escalate
queries if required.
Web chat has often been used as a ‘point of crisis’ channel, for example, to convert an online shopping
basket into a sale by providing timely service, or if a browser is paused on a webpage too long, perhaps
as they can’t find what they are looking for. In such cases, there are two main benefits to the business to
provide text chat: revenue maximization, and the avoidance of unnecessary calls.
Web chat can also act as a safety net for the customer if an online self-service attempt fails. An analogy
can be made with voice self-service, where a failed session is often ended with the customer ‘zeroing-
out’ - pressing zero to get in touch with an agent. Failed web self-service sessions may end with a phone
call being made, but web chat can avoid a number of these, which is a cost saving for the business, and
better for the customer as well.
The customer of the future - especially the younger generation - are often accomplished Instant
Messengers, and will be keen to use the web chat option with the businesses they work with. However,
web chat is in reality most useful for general information and sales purposes, as users usually aren’t
taken through security processes, so the agent can’t help with specific account queries; the same usually
applying to email. Putting some form of trusted biometric device on a PC or mobile device (such as a
thumbprint reader) which then assures the businesses’ system of the user’s identity could possibly
overcome this issue. Alternatively, and more simply, there doesn’t seem to be any reason why the web
chat agent can’t ask the standard security questions to the customer via chat, but this is rarely done
today, perhaps as some customers are wary of giving out personal details online.
223
One form of value-added web chat functionality is a Virtual Agent (also known as a chatbot), which may
appear to a browsing website visitor to be a human agent, offering web chat. Virtual agents or virtual
assistants are software applications that engage customers in conversations in order to provide them
with an answer to their queries. They may be personalized to reflect the company’s branding, and often
act as the first point of contact between the website visitor and the business.
Virtual agents look at keywords and attempt to answer the customer’s request based on these, including
sending relevant links, directing them to the right part of the website or accessing the correct part of the
knowledge base. If the virtual agent cannot answer the request successfully, it may then seamlessly
route the interaction to a live web chat agent who will take over. It is possible that the visitor will not
even realize that any switch has been made between automated and live agent, particularly if the web
chat application is sophisticated enough to pass the context and the history to the agent, although some
businesses believe it is best practice to identify clearly between virtual and real agents.
Most virtual agents encourage the visitor to engage with them using natural language, rather than
keywords. The virtual agent will parse, analyze and search for the answer which is deemed to be most
suitable, returning this to the customer instantly. Many virtual agent applications will allow customers to
give all sorts of information in any order, and either work with what it has been given, or ask the user for
more detail about what they actually meant. Having been unconsciously trained over the years to
provide their queries in a way which standard search functionality is more likely to be able to handle (for
example, a couple of quite specific keywords), customers must be encouraged and educated to use
natural language queries in order for virtual agents to be able to deliver to their full potential.
The virtual agent application is different from standard search functionality, ignoring bad punctuation or
grammar, and using longer phrases rather than just searching on keywords. Sophisticated applications
attempt to look for the actual intent behind the customer’s question, trying to deliver a single correct
answer (or at least a relatively small number of possible answers), rather than a list of dozens of
potential answers contained in documents which may happen to contain some of the keywords that the
customer has used. The virtual agent application may also try to exceed its brief by providing a list of
related questions and answers to the original question, as it is well known that one question can lead to
another. Solution providers and users train the system to pattern-match the right words or association
of words with the correct result: the application, unlike older forms of web search techniques, does not
simply guess what the customer wants, or how they will express themselves. Through ‘listening’ to what
the customers actually say - perhaps through a mixture of large quantities of audio and text – the initial
set-up configuration can achieve a good accuracy rate, which really benefits over time as a positive
feedback loop is established. Solutions that gather and differentiate customer requests and results from
multiple channels, noting the difference between them, have an even better success rate.
When the virtual agent application has low confidence that it has returned the correct result, it escalates
the customer’s query to a live chat agent, who then has access to the self-service session history,
enabling a greater chance of a successful resolution without repetition. (It is generally considered best
practice that escalations to real agents are not hidden from customers). The eventual correct response
can be fed back to the automated virtual agent (and the knowledge base underlying it), which will make
it more likely that future similar requests can be handled successfully through automated agents.
224
Proactive and reactive chat: originally, web chat was reactive, relying upon the browser to initiate a
conversation. Businesses then decided to go on the offensive, popping up chat boxes and encouraging
customers to start conversations. Some more sophisticated customers are unfazed by this, but overly-
insistent use of web chat can put some customers off entirely.
There are various levels of intelligence that can be used to support proactive chat more effectively. If the
customer has logged in, it is possible to identify them, and take into account past channel preferences,
purchase history and other relevant information in order to personalize the experience, (for example
including details of relevant offers to that customer).
It is also worth commenting that although offshore customer contact has received a mixed press, many
of the negative issues surrounding offshore are not applicable to the multimedia channel, such as the
possible mutual incomprehensibility of accents.
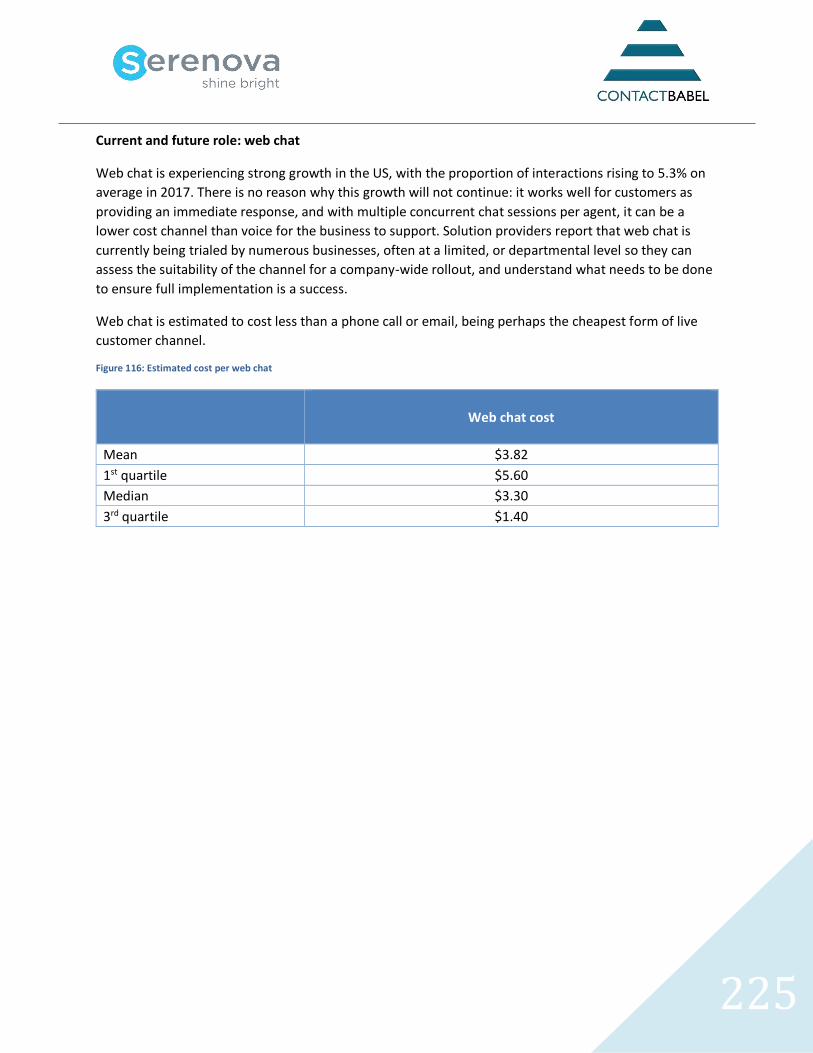
225
Current and future role: web chat
Web chat is experiencing strong growth in the US, with the proportion of interactions rising to 5.3% on
average in 2017. There is no reason why this growth will not continue: it works well for customers as
providing an immediate response, and with multiple concurrent chat sessions per agent, it can be a
lower cost channel than voice for the business to support. Solution providers report that web chat is
currently being trialed by numerous businesses, often at a limited, or departmental level so they can
assess the suitability of the channel for a company-wide rollout, and understand what needs to be done
to ensure full implementation is a success.
Web chat is estimated to cost less than a phone call or email, being perhaps the cheapest form of live
customer channel.
Figure 116: Estimated cost per web chat
Web chat cost
Mean $3.82
1st quartile $5.60
Median $3.30
3rd quartile $1.40
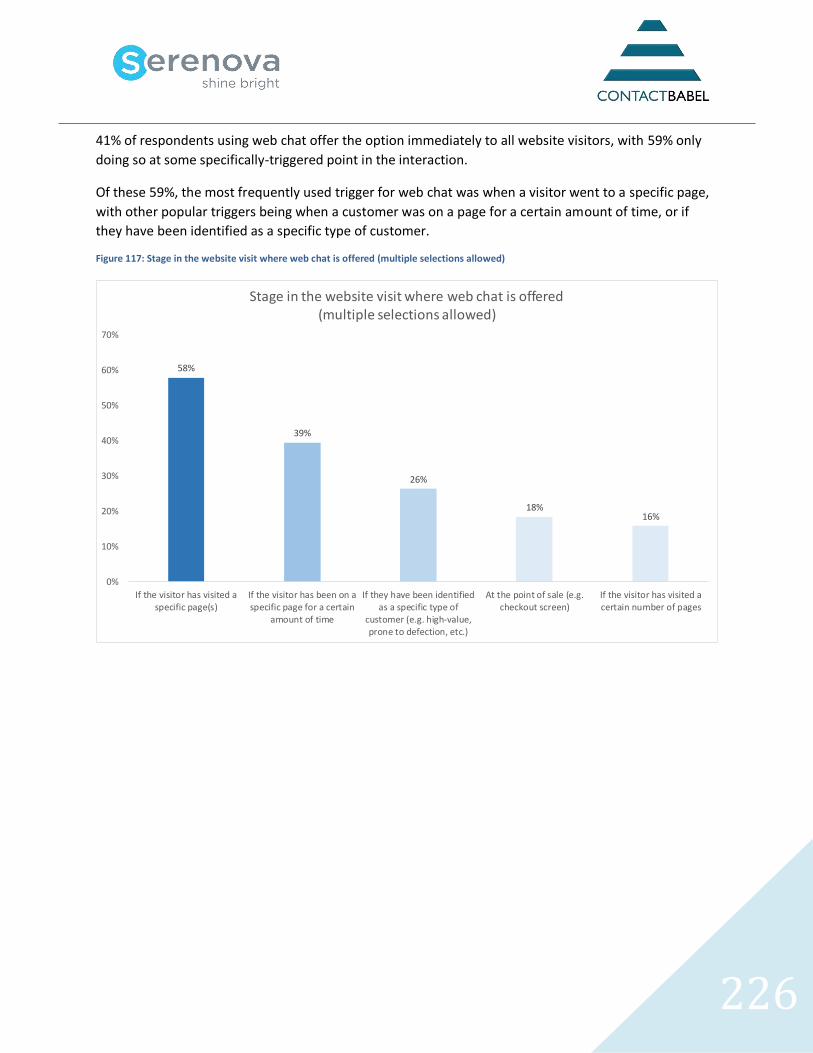
226
41% of respondents using web chat offer the option immediately to all website visitors, with 59% only
doing so at some specifically-triggered point in the interaction.
Of these 59%, the most frequently used trigger for web chat was when a visitor went to a specific page,
with other popular triggers being when a customer was on a page for a certain amount of time, or if
they have been identified as a specific type of customer.
Figure 117: Stage in the website visit where web chat is offered (multiple selections allowed)
58%
39%
26%
18%16%
0%
10%
20%
30%
40%
50%
60%
70%
If the visitor has visited aspecific page(s)
If the visitor has been on aspecific page for a certain
amount of time
If they have been identifiedas a specific type of
customer (e.g. high-value,prone to defection, etc.)
At the point of sale (e.g.checkout screen)
If the visitor has visited acertain number of pages
Stage in the website visit where web chat is offered (multiple selections allowed)
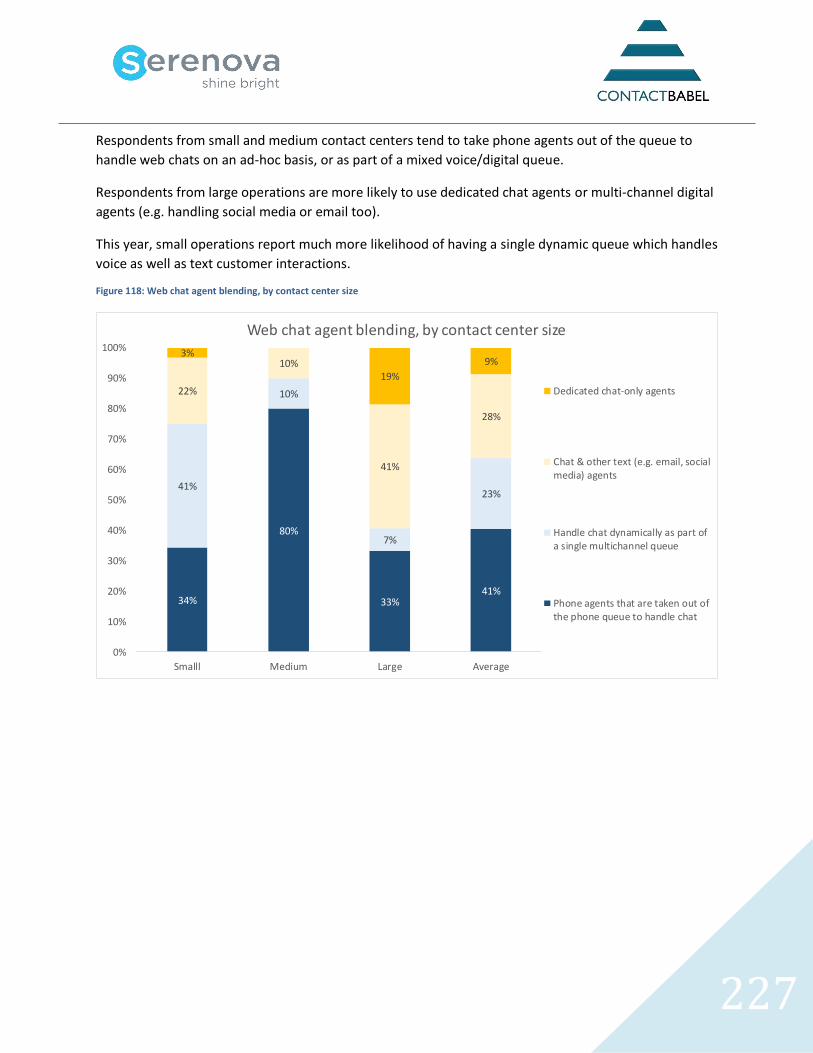
227
Respondents from small and medium contact centers tend to take phone agents out of the queue to
handle web chats on an ad-hoc basis, or as part of a mixed voice/digital queue.
Respondents from large operations are more likely to use dedicated chat agents or multi-channel digital
agents (e.g. handling social media or email too).
This year, small operations report much more likelihood of having a single dynamic queue which handles
voice as well as text customer interactions.
Figure 118: Web chat agent blending, by contact center size
34%
80%
33%41%
41%
10%
7%
23%
22%
10%
41%
28%
3%
19%
9%
0%
10%
20%
30%
40%
50%
60%
70%
80%
90%
100%
Smalll Medium Large Average
Web chat agent blending, by contact center size
Dedicated chat-only agents
Chat & other text (e.g. email, socialmedia) agents
Handle chat dynamically as part ofa single multichannel queue
Phone agents that are taken out ofthe phone queue to handle chat
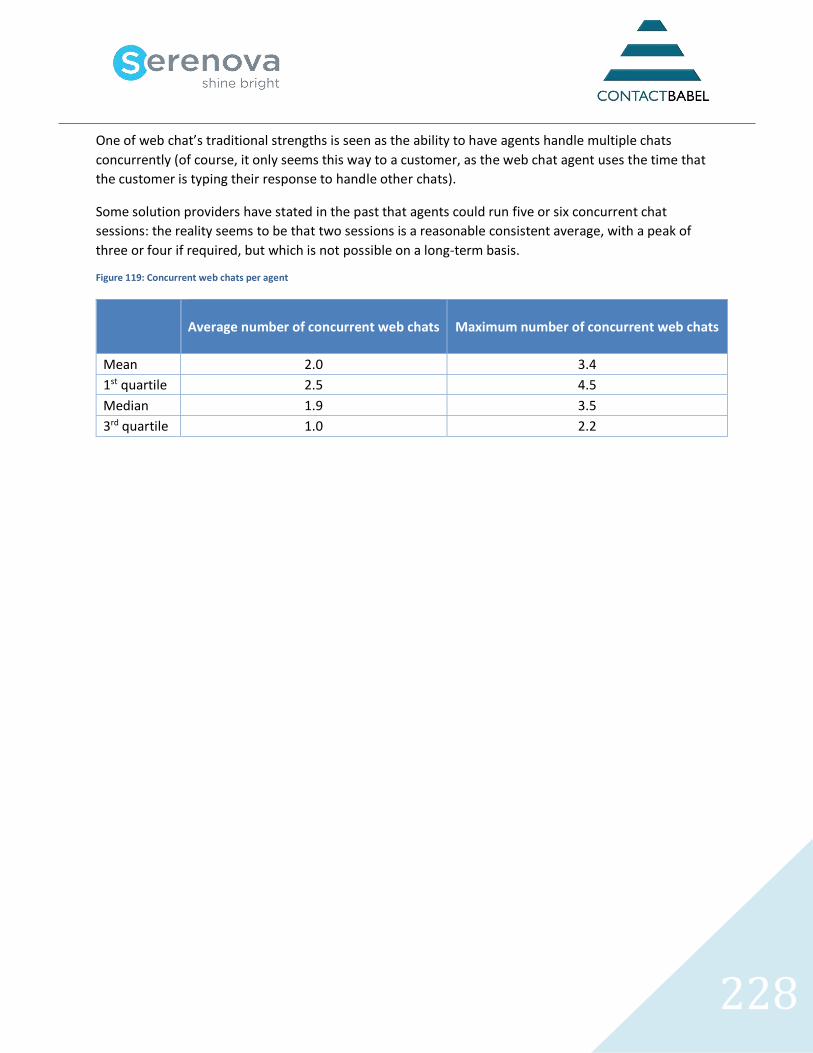
228
One of web chat’s traditional strengths is seen as the ability to have agents handle multiple chats
concurrently (of course, it only seems this way to a customer, as the web chat agent uses the time that
the customer is typing their response to handle other chats).
Some solution providers have stated in the past that agents could run five or six concurrent chat
sessions: the reality seems to be that two sessions is a reasonable consistent average, with a peak of
three or four if required, but which is not possible on a long-term basis.
Figure 119: Concurrent web chats per agent
Average number of concurrent web chats
Maximum number of concurrent web chats
Mean 2.0 3.4
1st quartile 2.5 4.5
Median 1.9 3.5
3rd quartile 1.0 2.2
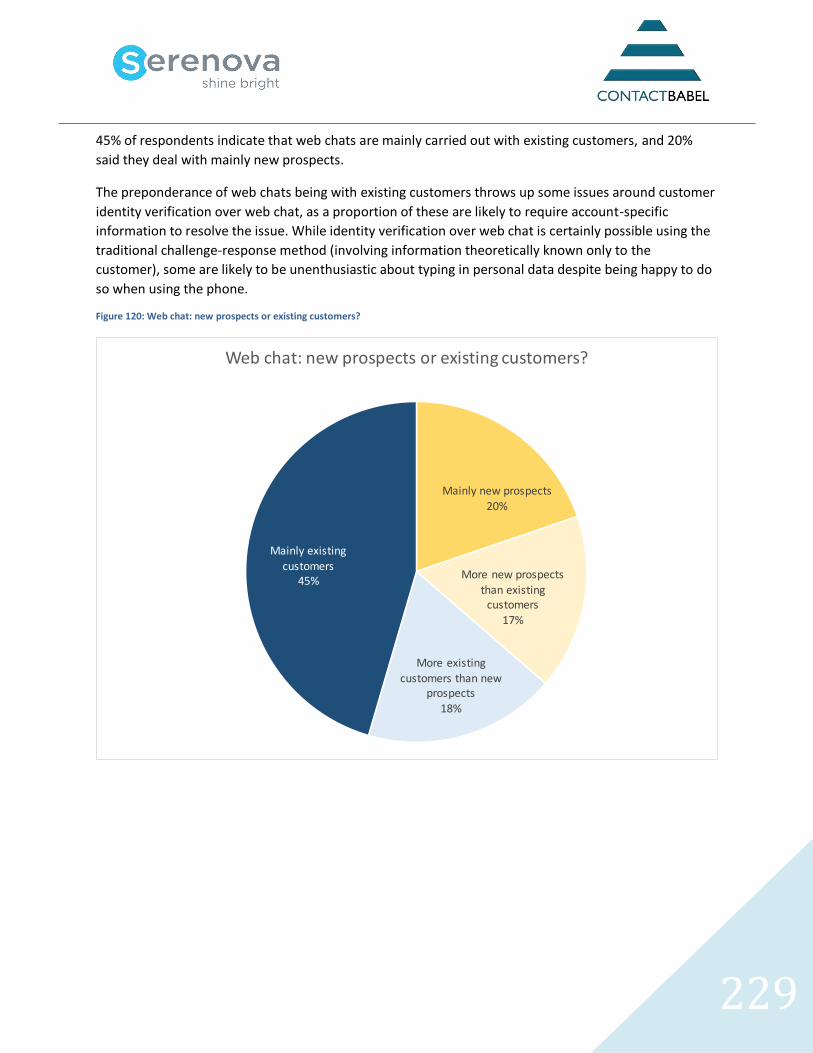
229
45% of respondents indicate that web chats are mainly carried out with existing customers, and 20%
said they deal with mainly new prospects.
The preponderance of web chats being with existing customers throws up some issues around customer
identity verification over web chat, as a proportion of these are likely to require account-specific
information to resolve the issue. While identity verification over web chat is certainly possible using the
traditional challenge-response method (involving information theoretically known only to the
customer), some are likely to be unenthusiastic about typing in personal data despite being happy to do
so when using the phone.
Figure 120: Web chat: new prospects or existing customers?
Mainly new prospects20%
More new prospects than existing
customers17%
More existing customers than new
prospects18%
Mainly existing customers
45%
Web chat: new prospects or existing customers?
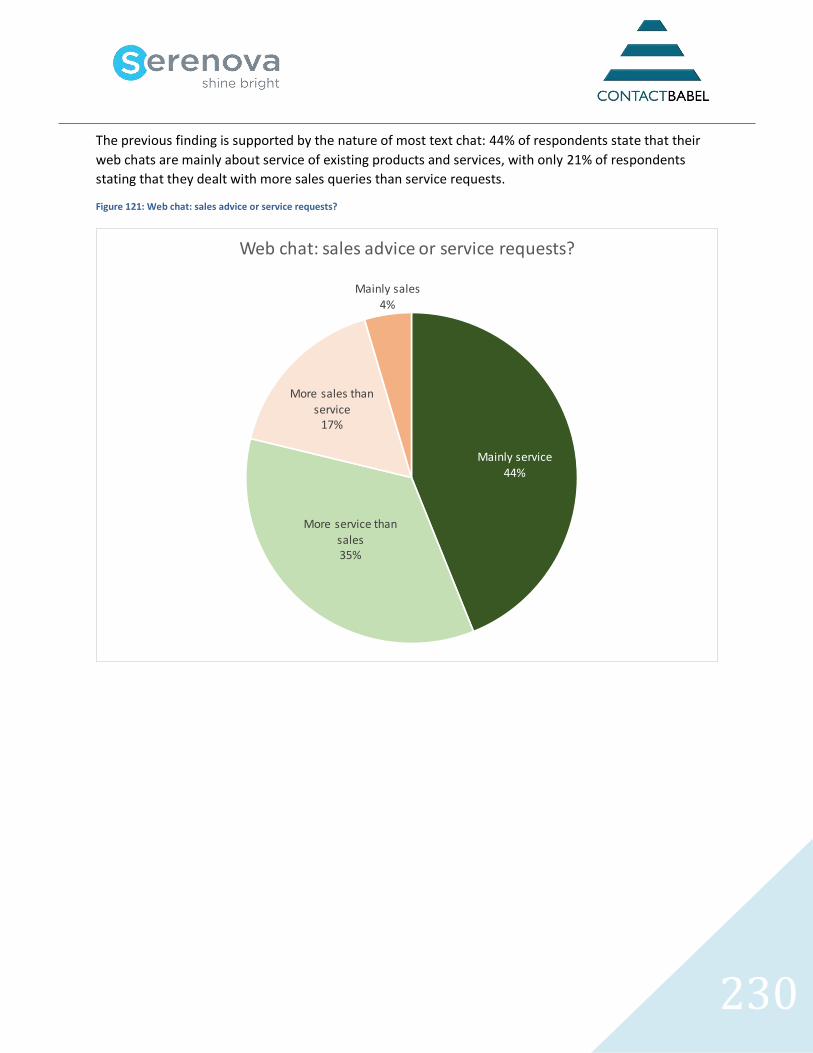
230
The previous finding is supported by the nature of most text chat: 44% of respondents state that their
web chats are mainly about service of existing products and services, with only 21% of respondents
stating that they dealt with more sales queries than service requests.
Figure 121: Web chat: sales advice or service requests?
Mainly service44%
More service than
sales35%
More sales than
service17%
Mainly sales
4%
Web chat: sales advice or service requests?
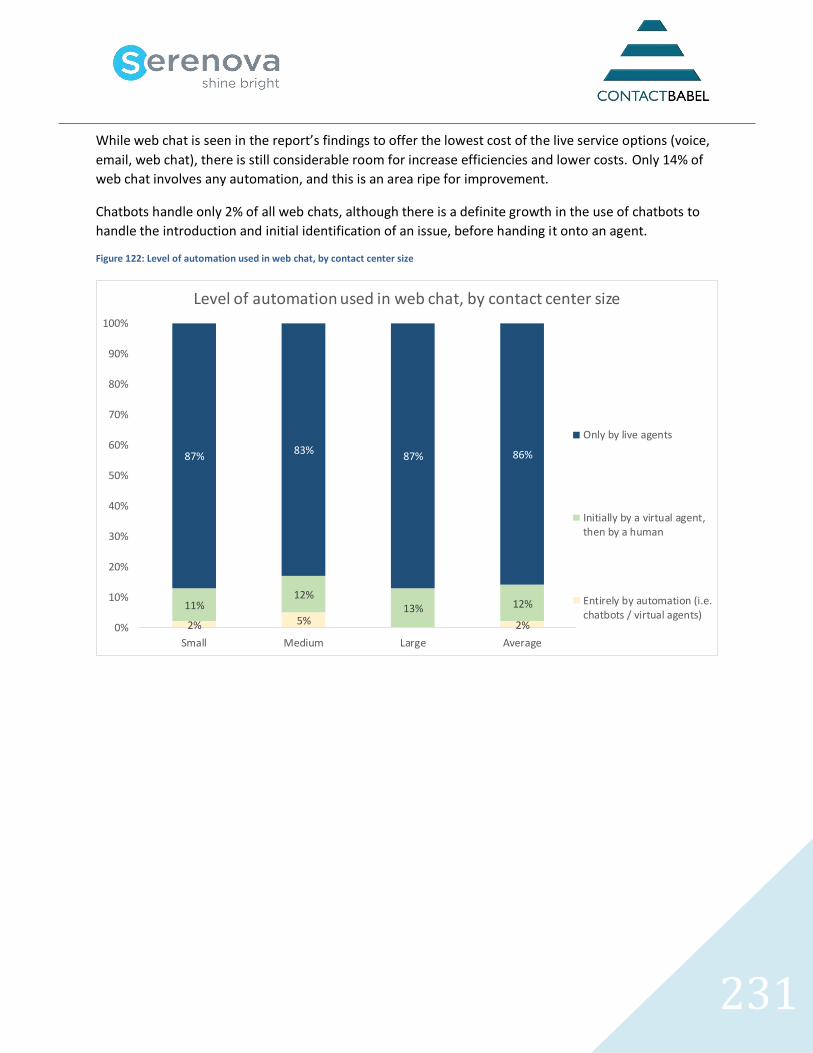
231
While web chat is seen in the report’s findings to offer the lowest cost of the live service options (voice,
email, web chat), there is still considerable room for increase efficiencies and lower costs. Only 14% of
web chat involves any automation, and this is an area ripe for improvement.
Chatbots handle only 2% of all web chats, although there is a definite growth in the use of chatbots to
handle the introduction and initial identification of an issue, before handing it onto an agent.
Figure 122: Level of automation used in web chat, by contact center size
2% 5% 2%
11%12%
13% 12%
87%83%
87% 86%
0%
10%
20%
30%
40%
50%
60%
70%
80%
90%
100%
Small Medium Large Average
Level of automation used in web chat, by contact center size
Only by live agents
Initially by a virtual agent,then by a human
Entirely by automation (i.e.chatbots / virtual agents)
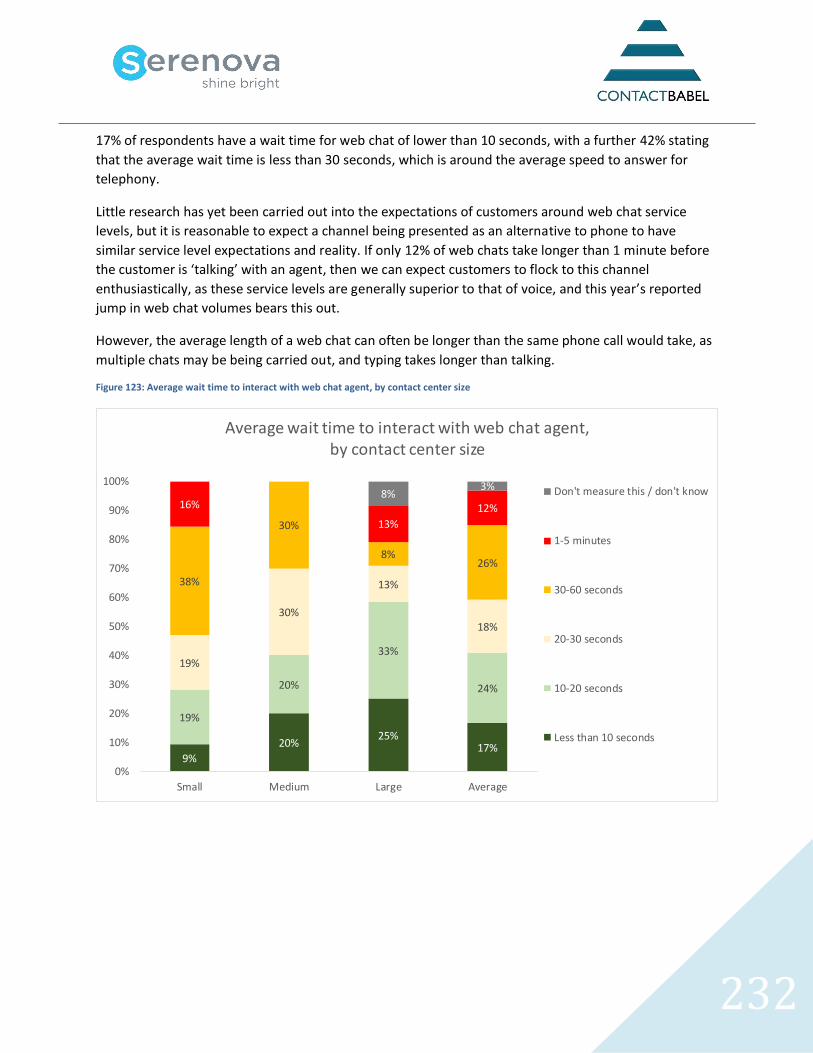
232
17% of respondents have a wait time for web chat of lower than 10 seconds, with a further 42% stating
that the average wait time is less than 30 seconds, which is around the average speed to answer for
telephony.
Little research has yet been carried out into the expectations of customers around web chat service
levels, but it is reasonable to expect a channel being presented as an alternative to phone to have
similar service level expectations and reality. If only 12% of web chats take longer than 1 minute before
the customer is ‘talking’ with an agent, then we can expect customers to flock to this channel
enthusiastically, as these service levels are generally superior to that of voice, and this year’s reported
jump in web chat volumes bears this out.
However, the average length of a web chat can often be longer than the same phone call would take, as
multiple chats may be being carried out, and typing takes longer than talking.
Figure 123: Average wait time to interact with web chat agent, by contact center size
9%
20%25%
17%
19%
20%
33%
24%
19%
30%
13%
18%
38%
30%
8%26%
16%
13%
12%8%
3%
0%
10%
20%
30%
40%
50%
60%
70%
80%
90%
100%
Small Medium Large Average
Average wait time to interact with web chat agent, by contact center size
Don't measure this / don't know
1-5 minutes
30-60 seconds
20-30 seconds
10-20 seconds
Less than 10 seconds
233
Tips for using chat and cobrowsing successfully
Understand the role that you want web chat to have within the customer contact mix. Do you see it as a replacement for email? Or is it more of a call avoidance strategy? Or is it perhaps a way to close the sale? Without understanding this, it’ll be difficult to measure its success. Some businesses will offer web chat and cobrowsing only to their premium customers, or to those who are in the final stages of purchasing but who have stalled.
Choose the most suitable metrics for what you’re trying to achieve. If web chat is about revenue, then perhaps focus on sales conversion rates, rather than average handle time, in order to encourage agents to make the most of cross-selling and up-selling opportunities.
Some customers may use web chat as an initial method to ask tentatively about products and services. The solution should provide the option to continue the conversation via a phone.
Work with the solution provider to determine what a reasonable and realistic number of concurrent web chat sessions might be. While it is theoretically possible for an agent to cope with six conversations at once, the reality is that this is unsustainable over long periods or with complex issues. It is far more realistic to expect a well-trained agent to deal with perhaps three conversations concurrently, and this should be fed into your workforce planning system. However, it may be that agents who deal with both telephony and web chat find it too difficult to deal with multiple chat sessions as well, and will deal with only one chat at a time.
As with any real-time interaction channel, monitoring traffic is vital to success. Plans need to be made to handle web chat spikes and providing estimated wait times to those in a web chat queue will allow them to choose a self-service, phone or email option instead.
Plan how web chat will integrate with existing customer service channels. It is possible to run web chat as an entirely separate, siloed channel, but customers expect to be able to move between channels seamlessly. Being able to treat web chat interactions in the same way as other communication channels means that resources can be spread across channels as and when needed.
Sophisticated web chat solutions allow for 3-way chat, so that an agent can bring subject experts into the conversation as required.
Consider using a trial, in a discrete department, product or service area. This will allow you to understand what works and what doesn’t, in a relatively low-risk environment. Changing a small number of variables will also provide a more accurate understanding of how web chat affects customer service levels, customer satisfaction and revenue. It will also provide information about the types of customer and queries that web chat is likely to be used by and for.
Make customers aware that you’re offering web chat, by promoting it through existing, higher-cost channels such as within the telephone queue’s recorded announcement.
234
Co-browsing (or web collaboration), which sometimes includes form-filling and page-pushing as a sub-
set of functionality, is a very intensive, one-to-one channel, formerly used for high-value customers or in
those cases where it is quicker and more effective for an agent to take over the reins than to talk the
customer through the process. While it has been useful for certain businesses, processes and customers,
it is difficult to make a case for it on a cost-saving basis alone, although it will encourage the completion
rate of sales, and as such, improve profitability.
Co-browsing may be used to help customers fill out forms, or to complete online transactions, and may
be done in conjunction with a concurrent telephone call or web chat. Unlike page-pushing - which is a
one-way movement of information from agent to customer - and screen sharing - where the agent takes
control of the customer’s desktop - co-browsing is a true two-way collaboration tool. Either the agent or
the customer can control the cursor or enter data into fields, and business rules can be set up so that
the agent does not see or enter sensitive information.
While it is not a cheap option, cobrowsing, particularly in association with a telephone call or web chat,
can be an effective way of closing a high-value sale. It is, however, currently used in few US
organizations.
235
SELF-SERVICE
It may seem self-evident to assume that implementing self-service will necessarily impact upon call
volumes, driving them down. After all, that is one of the most common reasons for offering a self-service
channel.
Businesses should be wary that self-service could in fact have the opposite effect, particularly in the
short-term:
• poorly designed, unnavigable or overly-complicated self-service can confuse customers, driving
them to the contact center
• a web self-service application may not offer the same level of functionality, detail or even
consistency of data that is available to a contact center agent, leading to a lower resolution rate
and an increase in calls
• customers that are driven to call by the initial failure of the self-service application are less likely
to try the self-service option in future
• a positive self-service experience may encourage the customer to interact more often with a
company. While this can be seen to lead to improved loyalty, it may also increase the number of
calls
• a self-service application that provides a customer with a large amount of information, some of
which may not be relevant to their query, may be more likely to drive the customer to ask an
agent to explain it to them
• account-specific self-service will require the customer to remember a username and password.
In the event that these are forgotten, many customers - but not all – will choose to have a
password reminder sent to them via email, but some will still call into the contact center
• even with the best-designed self-service system, there will be a period of familiarization needed,
during which time call volumes are unlikely to decrease, and may actually increase as customers
call in for assistance.
236
TELEPHONY SELF-SERVICE
Despite the rapid growth in the use of web-based services, the importance of the voice channel has not
diminished, with the proportion of inbound activity that is telephony self-service being reported as 9.4%
this year:
• Customers still find voice the most convenient, flexible and quickest communication channel in
many instances, especially in older demographics and for complex enquiries
• Customers’ expectations continue to rise. Not only do they seek out competitively-priced goods
and services, but they require quick, efficient service as well
• The general level of awareness of identity theft as a real issue has also grown, and customers
expect to see that their private and personal information is protected by those organizations
with which it is shared. The voice channel still provides customers with the greatest level of
confidence.
The challenge for businesses is to improve the customer experience, protect their customers’ private
and personal information and control their own costs. As such, the use of automated voice-based
solutions has become widespread and offers a rapid service option to customers while keeping contact
center costs down.
Voice self-service is usually delivered either by touchtone (known as DTMF – dual tone, multi-frequency)
IVR, which allows customers with a touchtone phone to access and provide information in a numerical
format. A minority of businesses, usually with large contact centers, use automated speech recognition
(ASR), which allows customers to speak their requirements to the system, allowing greater flexibility and
functionality.
IVR (interactive voice response) - whether through DTMF or speech recognition - has four main
functions:
1. to route calls to the right person or department (e.g. “Press 1 for sales, or 2 for service…”) in
auto-attendant mode
2. to identify who’s calling via either caller-line identity (where the caller’s number is
recognized, and their records brought up immediately), or through inputted information,
such as account number. The caller’s information is then “popped” onto the screen of an
agent who then understands who the customer is and what they are likely to want
3. to segment and differentiate between customers, prioritizing against business rules in order
to deliver a premium standard of service to them (e.g. minimizing time on-hold, spending
longer on the phone with them, offering high-value services, etc.)
4. to deliver a total customer service interaction without having to use a human agent, saving
the business money - historically, it has been calculated that 6 or 7 self-service IVR calls cost
about the same as a single person-to-person call.
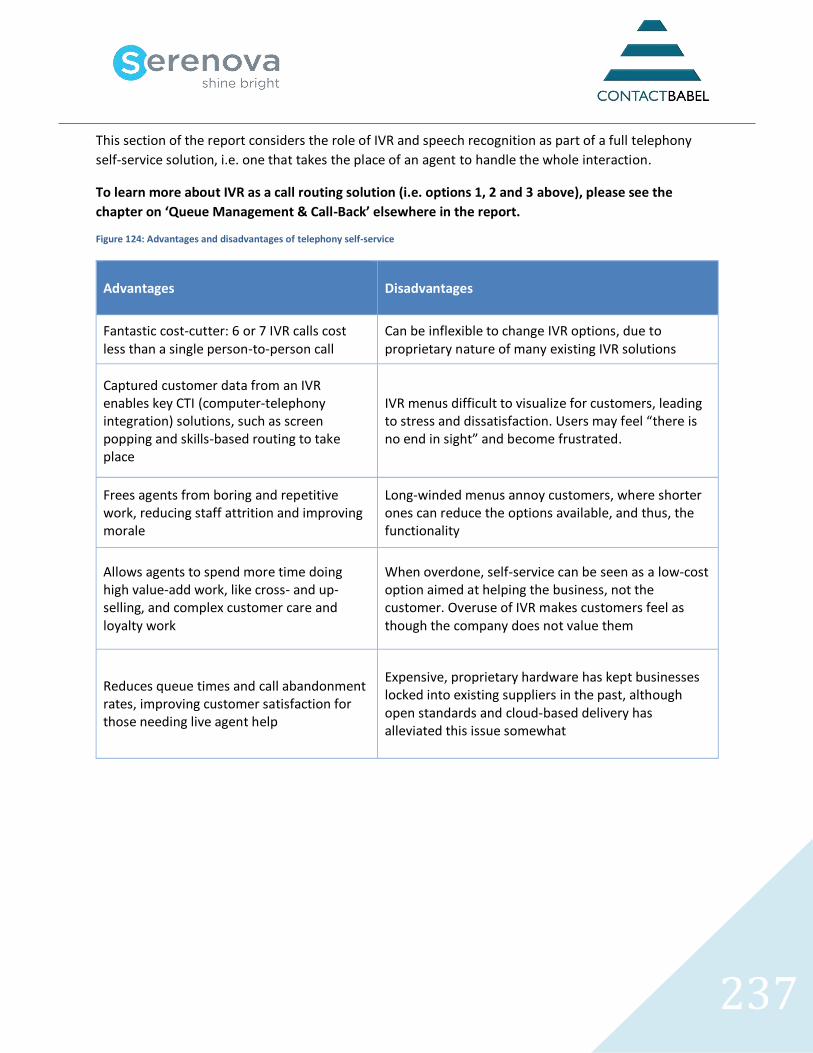
237
This section of the report considers the role of IVR and speech recognition as part of a full telephony
self-service solution, i.e. one that takes the place of an agent to handle the whole interaction.
To learn more about IVR as a call routing solution (i.e. options 1, 2 and 3 above), please see the
chapter on ‘Queue Management & Call-Back’ elsewhere in the report.
Figure 124: Advantages and disadvantages of telephony self-service
Advantages
Disadvantages
Fantastic cost-cutter: 6 or 7 IVR calls cost less than a single person-to-person call
Can be inflexible to change IVR options, due to proprietary nature of many existing IVR solutions
Captured customer data from an IVR enables key CTI (computer-telephony integration) solutions, such as screen popping and skills-based routing to take place
IVR menus difficult to visualize for customers, leading to stress and dissatisfaction. Users may feel “there is no end in sight” and become frustrated.
Frees agents from boring and repetitive work, reducing staff attrition and improving morale
Long-winded menus annoy customers, where shorter ones can reduce the options available, and thus, the functionality
Allows agents to spend more time doing high value-add work, like cross- and up-selling, and complex customer care and loyalty work
When overdone, self-service can be seen as a low-cost option aimed at helping the business, not the customer. Overuse of IVR makes customers feel as though the company does not value them
Reduces queue times and call abandonment rates, improving customer satisfaction for those needing live agent help
Expensive, proprietary hardware has kept businesses locked into existing suppliers in the past, although open standards and cloud-based delivery has alleviated this issue somewhat
238
Customers need to be persuaded to use IVR self-service, and success can be measured in two ways:
through the “play” rate (the proportion of customers that try to use IVR), and the “completion” rate
(how many can successfully interact with the company without having to involve a human agent by
“zeroing-out”, i.e. pressing the ‘zero’ key to try to connect to an agent). Customers need to be
motivated to use IVR (i.e. there’s something in it for them), and the business needs to design, maintain
and promote the self-service application to get them to keep using it.
Simply making IVR self-service available without too much thought or effort results in perhaps fewer
than 20% of possible calls being completed without human interaction. Designing the IVR self-service
experience with customers’ needs in mind, marketing it as an aid for customers, rewarding the customer
for using it and tuning the application to make it even better can mean up to 90% of relevant calls are
dealt with automatically: a massive cost saving, an improvement in the customer service experience and
a boost for the company’s reputation with its customers.
Self-service is found across most industries - there is often at least one function that self-service is
suitable for, regardless of what a company actually does - but some sectors use it more than others.
Many businesses are finding that web self-service is increasingly popular with their customers, especially
with the uptake of smartphones which allow web browsing on the move (see later in this chapter, and
‘The Mobile Customer’ chapter of this report for more information on web self-service).
Figure 125: Some functions for self-service, by vertical market
Self-service activity Typical sector offering this form of self-service
Problem reporting and resolution IT helpdesk
Account access & card payments Banking
Product information & registration Retail
Online registration Any
Order entry Retail, travel
Balance enquiry Banking, credit cards
Dealer or store location enquiries Car sales, retail
Ticket booking Cinemas, other entertainment
Real-time punctuality checks Airlines, trains
Order status and delivery checks Telecoms, Retail (esp. online), IT helpdesk
Address changes Subscription services, utilities
Form filling Any
Brochure request Travel, retail
Password reset Finance, IT
239
SPEECH TECHNOLOGY AND CLOUD-BASED SOLUTIONS
DTMF IVR has been a notable success for many businesses, and many businesses have added to this,
leveraging both the added flexibility and power of speech recognition as well as being able to share the
functionality that businesses have recently developed with their web self-service applications. Of course,
this is likely to come at an additional cost, and trying to find capital budget to invest in these solutions
may be difficult. In such cases, businesses should consider alternative application delivery methods, such
as a cloud-based solution.
One of the most consistently strong inhibitors against the uptake of speech recognition is the initial cost
involved, as well as the expected ongoing support costs, and cloud has a particular appeal to
organizations who don't wish to invest or tie-up large sums of up-front capital investment on their own
systems or software, or pay for the in-house IT resource to run them. One advantage of cloud is that the
need for significant upfront technology investment is lessened, providing on-tap access to extensive
telephony resource, albeit of a third-party nature. Additionally, the use of cloud-based solutions means
that businesses don't need continual ongoing investment to upgrade their own systems.
Like other self-service applications, automated speech has of course been more attractive for
organizations with high volumes, where the cost of handling the call can even exceed the business value
it represents. In this scenario, the need to reduce cost is imperative, but for speech-based self-service to
work well, the technology infrastructure on which it depends must be robust enough, and the number
of phone lines linked to it large enough to accommodate the maximum number of callers ever likely to
contact the service, or run the risk of turning callers away, a cost which can be very high. Cloud-based
speech services, where the telephony and technology infrastructure is centrally-owned and managed by
a third party overcomes this capital investment hurdle, and the pay-as-you-go model adopted by most
cloud suppliers means that ongoing operating costs are directly pegged to transaction volume, providing
valuable operational flexibility.
More information can be found in the ‘Cloud-based Solutions’ chapter of this report.
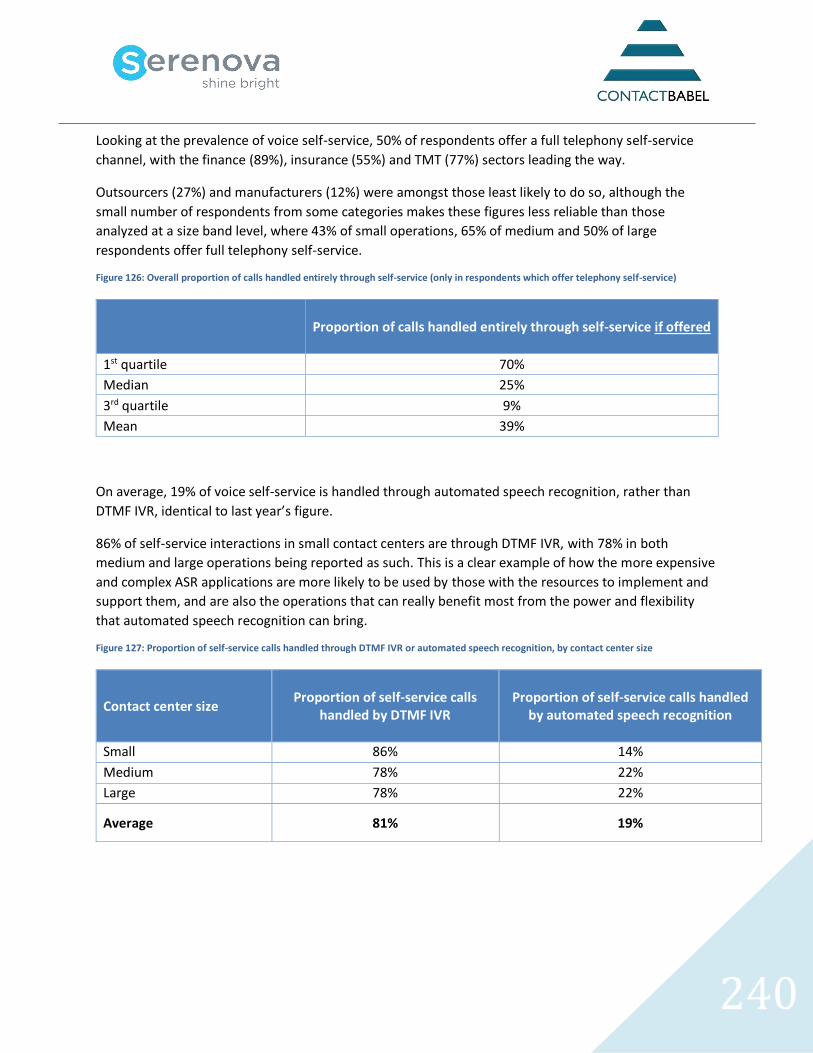
240
Looking at the prevalence of voice self-service, 50% of respondents offer a full telephony self-service
channel, with the finance (89%), insurance (55%) and TMT (77%) sectors leading the way.
Outsourcers (27%) and manufacturers (12%) were amongst those least likely to do so, although the
small number of respondents from some categories makes these figures less reliable than those
analyzed at a size band level, where 43% of small operations, 65% of medium and 50% of large
respondents offer full telephony self-service.
Figure 126: Overall proportion of calls handled entirely through self-service (only in respondents which offer telephony self-service)
Proportion of calls handled entirely through self-service if offered
1st quartile 70%
Median 25%
3rd quartile 9%
Mean 39%
On average, 19% of voice self-service is handled through automated speech recognition, rather than
DTMF IVR, identical to last year’s figure.
86% of self-service interactions in small contact centers are through DTMF IVR, with 78% in both
medium and large operations being reported as such. This is a clear example of how the more expensive
and complex ASR applications are more likely to be used by those with the resources to implement and
support them, and are also the operations that can really benefit most from the power and flexibility
that automated speech recognition can bring.
Figure 127: Proportion of self-service calls handled through DTMF IVR or automated speech recognition, by contact center size
Contact center size
Proportion of self-service calls
handled by DTMF IVR
Proportion of self-service calls handled by automated speech recognition
Small 86% 14%
Medium 78% 22%
Large 78% 22%
Average
81% 19%
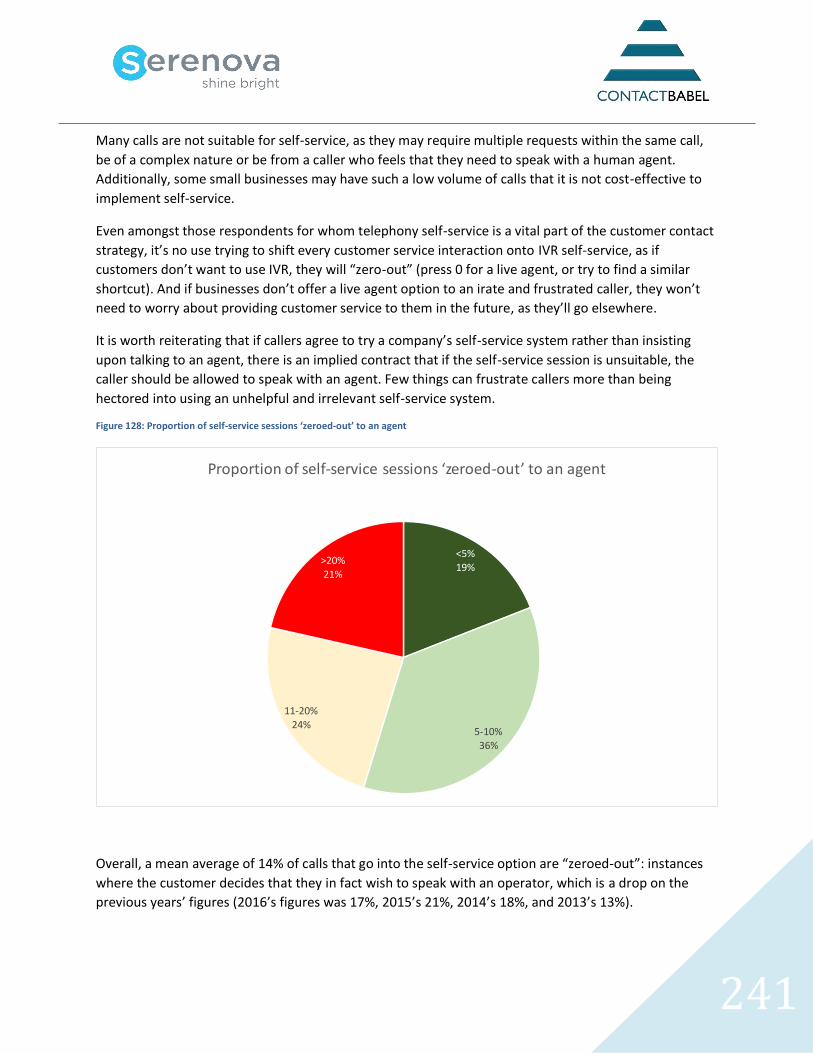
241
Many calls are not suitable for self-service, as they may require multiple requests within the same call,
be of a complex nature or be from a caller who feels that they need to speak with a human agent.
Additionally, some small businesses may have such a low volume of calls that it is not cost-effective to
implement self-service.
Even amongst those respondents for whom telephony self-service is a vital part of the customer contact
strategy, it’s no use trying to shift every customer service interaction onto IVR self-service, as if
customers don’t want to use IVR, they will “zero-out” (press 0 for a live agent, or try to find a similar
shortcut). And if businesses don’t offer a live agent option to an irate and frustrated caller, they won’t
need to worry about providing customer service to them in the future, as they’ll go elsewhere.
It is worth reiterating that if callers agree to try a company’s self-service system rather than insisting
upon talking to an agent, there is an implied contract that if the self-service session is unsuitable, the
caller should be allowed to speak with an agent. Few things can frustrate callers more than being
hectored into using an unhelpful and irrelevant self-service system.
Figure 128: Proportion of self-service sessions ‘zeroed-out’ to an agent
Overall, a mean average of 14% of calls that go into the self-service option are “zeroed-out”: instances
where the customer decides that they in fact wish to speak with an operator, which is a drop on the
previous years’ figures (2016’s figures was 17%, 2015’s 21%, 2014’s 18%, and 2013’s 13%).
<5%
19%
5-10%36%
11-20%
24%
>20%21%
Proportion of self-service sessions ‘zeroed-out’ to an agent
242
NB, 1st quartile performance for 'zeroing-out' is 4%, the median is 16% and the 3rd quartile is 25%, which
indicates that this is not simply the case of respondents coming from a relatively small number of
contact centers where self-service failure rates are high.
The following table looks in more depth at the reasons for abandoning self-service sessions.
There is a broadly positive correlation between the size of the contact center and the proportion of self-
service sessions that are abandoned in favor of speaking to an agent: the larger the contact center, the
more often customers ‘zero out’. One possible reason for this might be that larger operations are trying
to do too much with their self-service. There is some evidence to suggest that this is the case, as it is
very noticeable that respondents from larger organizations tend to have far more options in the auto-
attendant functionality of their IVR solution, and this tendency to offer a great deal of functionality and
options may well also apply to IVR’s self-service functionality as well. Overly complex or long-winded IVR
functionality will tend to encourage session abandonment, and this may well be what we see here.
Due to the potential additional flexibility and functionality offered by automated speech recognition
over DTMF IVR, we would expect the zeroing-out rate (which can be viewed as connected to customers'
rejection of the self-service option) to be lower for speech recognition than DTMF IVR. However, once
again this year, the opposite is the case:
• In contact centers where the majority of self-service is offered through speech recognition, the
mean zero-out rate is 22%.
• In contact centers where the majority of self-service is offered through DTMF IVR, the mean
zero-out rate is 12%.
Without interviewing these respondents in more depth, there is no certainty as to why this is
happening. It is possible that customers are simply more used to DTMF IVR; that speech recognition
often offers an option to speak to an agent early in the script (which is taken as the easy way out); or
that customers do not know what to say to an automated system to make it work, so look to speak with
a live agent. That customers may actually currently prefer to choose from a finite group of options is an
interesting conundrum, and one which deserves more attention from the industry.
Cost differentials in self-service and live voice support
• The cost of a live service telephone call varies considerably, but has a mean average of $5.25
• Past research found that the average cost of a telephony self-service session is $0.50-$0.90.
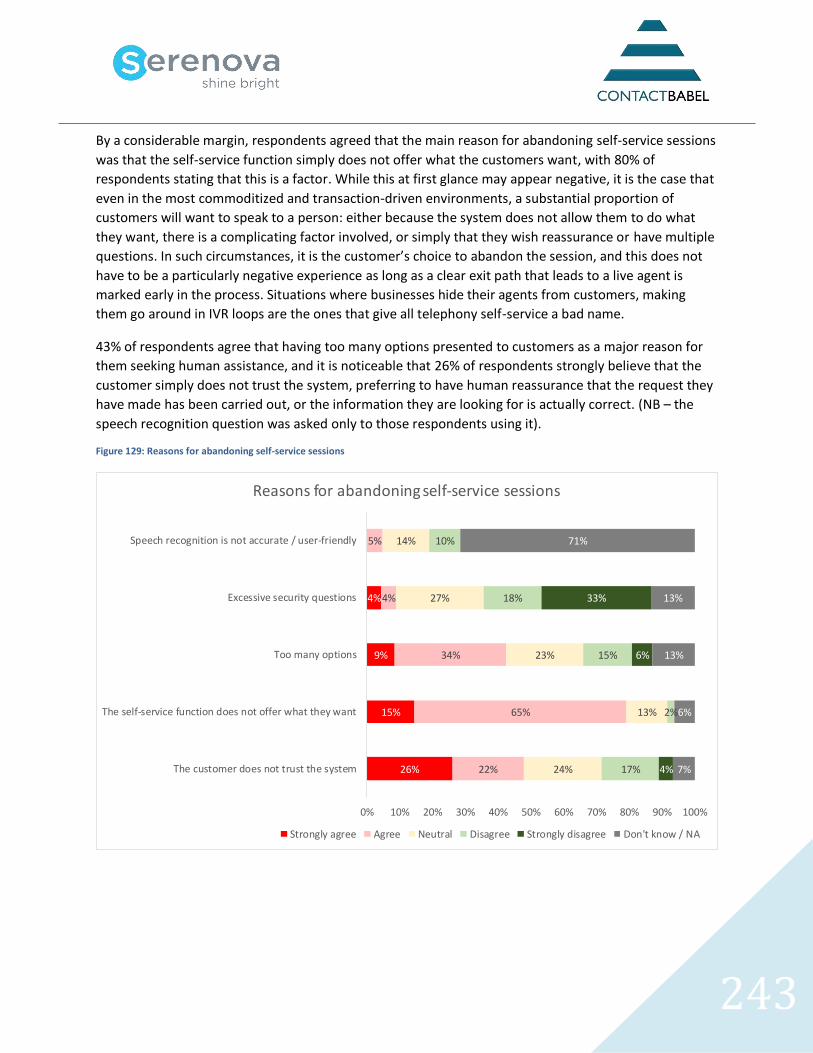
243
By a considerable margin, respondents agreed that the main reason for abandoning self-service sessions
was that the self-service function simply does not offer what the customers want, with 80% of
respondents stating that this is a factor. While this at first glance may appear negative, it is the case that
even in the most commoditized and transaction-driven environments, a substantial proportion of
customers will want to speak to a person: either because the system does not allow them to do what
they want, there is a complicating factor involved, or simply that they wish reassurance or have multiple
questions. In such circumstances, it is the customer’s choice to abandon the session, and this does not
have to be a particularly negative experience as long as a clear exit path that leads to a live agent is
marked early in the process. Situations where businesses hide their agents from customers, making
them go around in IVR loops are the ones that give all telephony self-service a bad name.
43% of respondents agree that having too many options presented to customers as a major reason for
them seeking human assistance, and it is noticeable that 26% of respondents strongly believe that the
customer simply does not trust the system, preferring to have human reassurance that the request they
have made has been carried out, or the information they are looking for is actually correct. (NB – the
speech recognition question was asked only to those respondents using it).
Figure 129: Reasons for abandoning self-service sessions
26%
15%
9%
4%
22%
65%
34%
4%
5%
24%
13%
23%
27%
14%
17%
2%
15%
18%
10%
4%
6%
33%
7%
6%
13%
13%
71%
0% 10% 20% 30% 40% 50% 60% 70% 80% 90% 100%
The customer does not trust the system
The self-service function does not offer what they want
Too many options
Excessive security questions
Speech recognition is not accurate / user-friendly
Reasons for abandoning self-service sessions
Strongly agree Agree Neutral Disagree Strongly disagree Don't know / NA
244
DEVELOPMENTS IN DTMF IVR
The rise in VoIP and SIP (session initiation protocol) has allowed IVR to run on standard servers, rather
than more expensive and proprietary telephony cards or specialist hardware, with media gateways and
IP PBXs being supported within an open standard, commoditized telephony environment.
The pure software IVR platforms used today run on standard servers, reducing the restrictions that
proprietary hardware placed upon functionality, scalability and flexibility, as well as the cost of
purchasing and maintaining dedicated hardware, and a growing proportion of companies prefer to
adopt the cloud-based method of providing IVR options to the customers.
Speech-enabling IVR increases the features available to the caller. Standards-based languages such as
CCXML and VoiceXML support speech recognition and improved access to relevant corporate data, the
integration of which into the IVR experience supports text-to-speech and the use of caller profiling to
enable personalized IVR sessions based on who the caller is, their history, their contact preferences and
any other relevant information that would further assist the self-service session.
With PCI compliance so much to the fore for many businesses, we would expect to see an increased use
of IVR to take card payments, whether within a call or at the end of it (more information on this can be
found within the ‘PCI DSS Compliance’ chapter of this report). With the focus of many solution providers
on achieving the relevant ISO security standards, it can be seen that the vendor community is very
aware of what the market requires. DTMF has the advantage of extreme simplicity, which means that it
may well have an important role to play on a sector-specific basis, even with the advent of newer and
more sophisticated solutions. In situations where callers need the same piece of information on a
recurring basis - such as checking the balance of prepaid credit cards - customers can access the
information within a few seconds by typing in the DTMF digit sequence that they have learnt off-by-
heart, and it may well be that this method of accessing information is the most convenient and quickest
for customers. In addition, interactions that require a simple list of digits, such as e-parking, may be
more suited to the unambiguous nature of DTMF (which, unlike speech recognition, is unaffected by
background noise). Of course, by far the most common application for delivering long sequences of
numbers is through making a payment via credit card, and placing a customer call into an automated
DTMF session in order to do this has numerous advantages for businesses and customers in terms of
convenience, familiarity and security.
The take-up of cloud-based IVR solutions, particularly by small-medium sized companies, is driving
growth within this sector. The ability to personalize IVR sessions, as well as the low initial start-up costs
and limited in-house maintenance required, means that businesses that traditionally were unable or
unwilling to see the benefits of IVR for their own company are now revisiting this.
Many solution providers state that they are actively increasing the power and range of the analytics
solutions not just within live contact channels such as chat and voice, but also within automated IVR
environments as well. Analytics can dynamically adapt the IVR in real-time to individual caller behavior
and preferences to improve their experience. This technology drives additional automation rate
increases, call length reductions and improved CX scores.
245
FROM DTMF IVR TO AUTOMATED SPEECH RECOGNITION
Despite the wider and more powerful functionality that speech recognition gives to an IVR system,
significant inhibitors are present. It is generally acknowledged that speech recognition can be
considerably more expensive to implement than DTMF IVR, and is also likely to require significant,
highly-paid in-house resource to fine-tune and operate it going forward. Some solution providers note
that the majority of businesses’ interest in moving from DTMF to speech recognition comes when the
existing telephony self-service legacy system is approaching end-of-life.
Speech-based IVR is particularly useful in cases where very long lists of items such as place names or
surnames may be chosen, for which the more structured DTMF IVR is unsuited. The success or
otherwise of speech-based IVRs is very affected by how callers are encouraged to use the service. It has
been the case that some speech implementations have actually made life more difficult for the
customer, who may not have the confidence that the system will understand their natural language
request and provide very short, one-word answers; if nothing is given in the way of prompts or
examples, callers may give too little or too much information as they are unsure of the sophistication or
capabilities of the system, and this may be a reason for the high self-service abandonment rates seen
earlier. Using prompts such as “describe in a few words why you are calling us, for example ‘to start a
new mortgage application’” can be extremely useful in setting ground rules for the successful use of the
system.
Some solution providers offer a semi-automated option for their speech recognition-driven IVR,
whereby the agent has a chance to hear one or two pertinent words from within the speech recognition
session before the live call is taken, giving the agent an initial insight into the context, mindset and
intent of the customer before the conversation actually begins.
In previous years, the main issue that held back speech-enabled self-service was that their business
wasn't really suited to automation. However, previous research has shown that more than half of the
contact centers that currently offer no full self-service options could see some benefit in automating at
least some part of their processes.
As such, there are likely to be issues around expenditure, operational costs and customer reaction to
address for these potential users of self-service. Respondents are more concerned than previously they
do not have the in-house IT resource to run automated speech self-service, and many believe that the
ongoing costs and effort would not be worth it. However, the biggest inhibitor was the initial
investment, which could be alleviated through a hosted model. As DTMF IVR, when badly-implemented,
is a major bugbear for customers, replacing it with a quicker and more powerful alternative (ASR) could
be seen as a benefit.
246
In all, there is still a great deal of work to be done by solution providers to deliver ASR solutions - either
as a replacement for DTMF IVR, or as a new solution - through offering innovative payment and service
delivery methods, and to create a greater market awareness of the success stories in this area. Against a
background of potential inhibitors, there is some positivity coming from the consumer base. Because
there are so many speech recognition applications now in use in daily life - for example Siri, PC-based
voice recognition software, and voice-enabled hands-free dialing - consumers are now becoming more
comfortable giving voice commands to an automated system. With every successful speech interaction,
customers’ confidence increases and speech-enabled self-service becomes a little more firmly
embedded in the customer base’s psyche.
VISUAL IVR
The audio-only nature of DTMF IVR places limitations upon how user-friendly the experience can be for
a customer. There has always been a trade-off required between functionality and usability, which
manifests itself in the number of menu options and levels that made available within the IVR system.
The rapid growth in smartphones has meant that it is now possible to offer a visual representation of
IVR menus on a device which will then be used to call the business. Because it is far quicker to read text
than to listen to text being spoken - some studies show that a caller can navigate a visual IVR menu
between four and five times quicker than a DTMF IVR menu - the customer experience is improved
without sacrificing any functionality or options. Furthermore, visual IVR can be used to send video
presentations while waiting for an agent, for educational or marketing purposes, or to answer the self-
service requirement (for example, pushing the relevant YouTube clip in order to show the caller how to
do something).
Many businesses that use DTMF IVR have made long-term investments in this technology, and retiring
the system entirely is not desirable. Giving existing IVR functionality a visual interface simply means that
the IVR’s path can be shown as a picture on a website or smartphone, with callers touching the selection
that they require without having to listen to all of the options or to go up and down levels or branches.
This has the dual benefit for the customer of being far quicker than listening to IVR menu options, and of
being significantly more likely to get them the correct information or to be routed to the department
most appropriate to their needs. Visual IVR menu systems integrate with existing DTMF structures and
reuse the same VoiceXML scripts, meaning that any changes made to the existing DTMF IVR system will
be automatically replicated regardless of channel or device.
Visual IVR offers companies the ability to develop value-added applications for their customers, rather
than simply providing a visual representation of existing IVR menus. For example, in cases where very
specific expertise is required, visual IVR can be used to help the caller self-diagnose where in the
organization they need to be going, rather than having to speak to a front-line agent who will then have
to ask them the same questions in order to route the call to the appropriate resource.
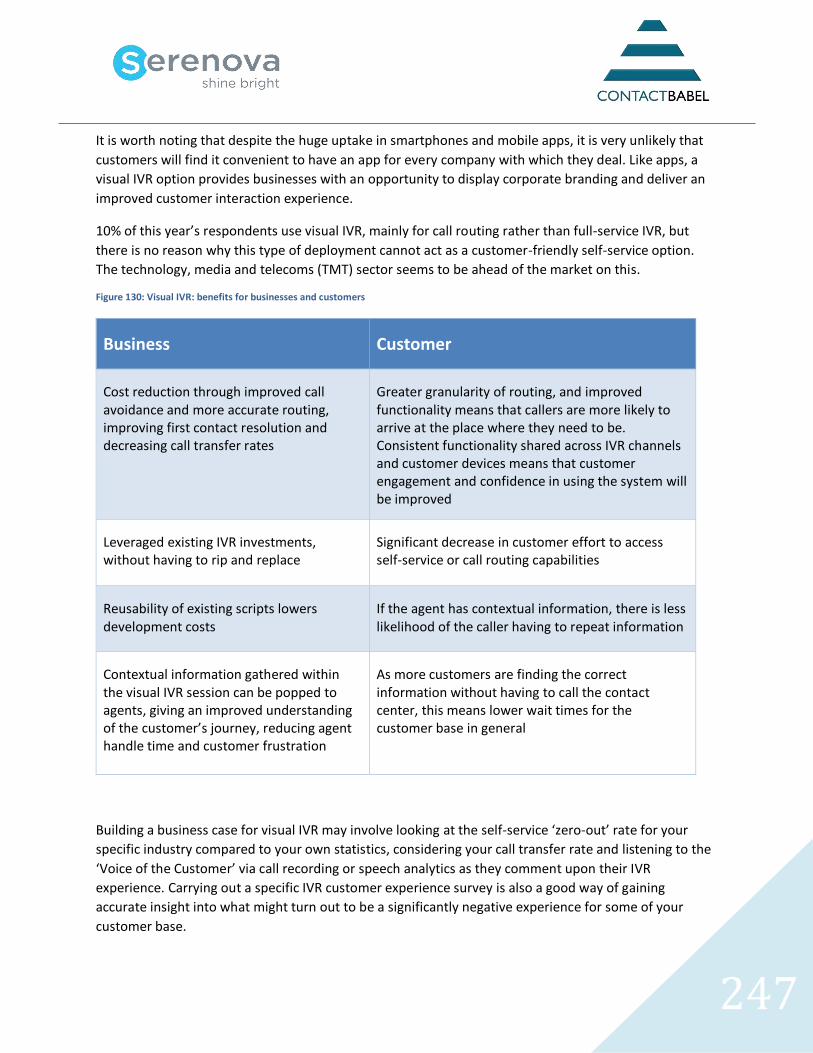
247
It is worth noting that despite the huge uptake in smartphones and mobile apps, it is very unlikely that
customers will find it convenient to have an app for every company with which they deal. Like apps, a
visual IVR option provides businesses with an opportunity to display corporate branding and deliver an
improved customer interaction experience.
10% of this year’s respondents use visual IVR, mainly for call routing rather than full-service IVR, but
there is no reason why this type of deployment cannot act as a customer-friendly self-service option.
The technology, media and telecoms (TMT) sector seems to be ahead of the market on this.
Figure 130: Visual IVR: benefits for businesses and customers
Business Customer
Cost reduction through improved call avoidance and more accurate routing, improving first contact resolution and decreasing call transfer rates
Greater granularity of routing, and improved functionality means that callers are more likely to arrive at the place where they need to be. Consistent functionality shared across IVR channels and customer devices means that customer engagement and confidence in using the system will be improved
Leveraged existing IVR investments, without having to rip and replace
Significant decrease in customer effort to access self-service or call routing capabilities
Reusability of existing scripts lowers development costs
If the agent has contextual information, there is less likelihood of the caller having to repeat information
Contextual information gathered within the visual IVR session can be popped to agents, giving an improved understanding of the customer’s journey, reducing agent handle time and customer frustration
As more customers are finding the correct information without having to call the contact center, this means lower wait times for the customer base in general
Building a business case for visual IVR may involve looking at the self-service ‘zero-out’ rate for your
specific industry compared to your own statistics, considering your call transfer rate and listening to the
‘Voice of the Customer’ via call recording or speech analytics as they comment upon their IVR
experience. Carrying out a specific IVR customer experience survey is also a good way of gaining
accurate insight into what might turn out to be a significantly negative experience for some of your
customer base.
248
WEB SELF-SERVICE
For businesses, by far the major advantage to having customers use web self-service is the fact that the
cost per support session is estimated to be between 40 and 100 times cheaper than a live call to an
agent.
Research has stated that 58% of calls to the contact center result from bad website service or a failure in
another channel. Quite apart from the current importance of this application, research shows that as
customers become more educated and experience many different qualities of online self-service, their
expectations increase across the board which puts pressure on other organizations to keep up or even
exceed the current benchmark performance.
Put basically, most customers will visit a website first; if they cannot find what they’re looking for
immediately they will try self-service; if the self-service experience does not give them what they want
immediately and accurately, they will either call the business or go elsewhere. In cases where the
customer is tied into an existing business, this will result (merely) in a higher cost of service and
decreased customer satisfaction. In cases where the web visitor is only a potential customer, a failure in
the self-service process on a website will mean the almost-certain loss of a sale. In all cases, providing
effective web self-service options - with a clear path to escalation to a live agent, along with any
contextual customer specific information - is in the best interests of the business.
In terms of pure self-service, the website can provide various options for the customer, ranging from the
most basic search and static FAQ functionality, to personalized virtual agents and dynamic FAQs.
BASIC SEARCH FUNCTIONALITY
Since corporate websites first came into being, businesses have offered search tools for customers to
look through indexed information, based on keywords found in these documents, in order to answer
their questions without the need to call the business. While such functionality has the advantage of at
least being familiar, indices grow, documents get old and out-of-date, and customers become educated
that there are more sophisticated and effective self-service solutions available, with customers’ opinions
of standard search functionality suffering as a result.
With only a blank text entry box to guide them, the onus to search successfully is with the customer,
who has to try to ‘get into the mind of the business’ and phrase the question or search terms in a way
that fits the business and its internal jargon. However, this is not always possible, and customers have a
limit to the maximum number of times that they will attempt to search, or how many pages they will
read from the numerous documents that a wide keyword search can bring back, claiming that it has
answered the query. The customer then has two possibilities: to engage the business through a high
cost channel such as telephony or email, or worse, to find an alternative supplier that can help them
without going through this high effort process.
249
Search functionality does have its place: for example, if a customer wanted to find out very specific
information about a product that had an unambiguous name (for example, ‘SDK36479 installation’), a
search on this particular term would at least bring back documents that had a high level of relevance to
this product and how to set it up. However, if the customer had a query that used keywords that were
very popular and widely found elsewhere (for example, “What are your delivery times?”), typical search
functionality might return every document that contains the word ‘delivery’, relying upon the
customer’s patience and goodwill to find the correct answer for themselves. In the case of very large
companies, this could bring back potentially hundreds or thousands of documents, many of which could
be out-of-date and have been superseded. The major problem with search functionality is that it pays
close attention to the answers, but very little to understanding the question or the customer’s thought
processes.
It is one thing to be presented with a long list of documents while sitting in front of a large screen of a
PC, where scrolling up and down the page is not an issue. For the same flawed search functionality to be
placed onto a mobile website, expecting the user to zoom in and out, scrolling up and down, and then to
potentially scan through numerous documents whose text is too small to read properly is probably a
step too far even for the most enthusiastic and loyal of your customers.
Natural language processing is a solution to the shortcomings of basic search functionality. One of the
keys to successful automated service, with a via telephony or website, is for the user to be able to
describe their issue in their own words, rather than feeling that they have to use specific terms or a
stilted, incomplete account of the issue. Natural language processing-based systems encourage users to
describe their issue more fully, asking follow-up questions if there is any degree of ambiguity in the
initial request. One of the obstacles to overcome for NLP-based systems (whether through speech
recognition or text recognition) is that many Internet users have been trained to use keywords, believing
that simplifying the description of their issue will lead to greater levels of accurate response (or at least,
fewer instances of the dreaded “Not Found” message). In fact, NLP works best with longer and more
detailed requests, and it is a challenge for businesses and solution providers to encourage and support
users of the system in using the solution in an optimal way.
250
FAQS
FAQs - frequently asked questions - are one of the most popular forms of Web self-service. At its
simplest, an FAQ list can simply be a group of static documents and/or text, categorized under wider
thematic headings, and kept up-to-date manually. Solution providers state that perhaps 80% of
questions can be answered by 20% of documents, however for most businesses, customer requirements
change on an ongoing basis so it is unlikely to be the same 20% of documents that are most useful as
time progresses.
More complex applications can use techniques such as text mining and fuzzy search (approximate string
matching) to return documents that are not just an exact or very close match to the search terms
entered by the user. Sophisticated FAQ technology will leverage natural language processing to deliver
more accuracy than standard search functionality.
It is possible to minimize the use of manual updates and supervision by making the FAQ list more
dynamic and self-learning through using responses taken from emails to customers who have asked
specific questions, which will then dynamically enter the FAQ list at an appropriately high level. Being
able to restructure the knowledge base on a regular and ongoing basis through automation is key to
maintaining the usefulness and relevance of the FAQs. Unlike the virtual agent (below), FAQs by their
nature provide the user with a list of alternatives, asking them to judge and choose the correct most
relevant answer for themselves. While this process takes longer for the customer than the provision of a
single answer, it is currently more closely aligned with the typical user experience, and thus has the
advantage of familiarity. Providers of FAQ technology report that the typical reduction seen by
customers in inbound live contact (such as email or telephony) is in the region of 25%.
251
VIRTUAL AGENTS
Virtual agents, otherwise known as virtual assistants, are software applications that engage customers in
conversations in order to provide them with an answer to their queries. They may be personalized to
reflect the company’s branding, and often act as the first point of contact between the website visitor
and the business.
Most virtual agents encourage the visitor to engage with them using natural language, rather than
keywords. The virtual agent will parse, analyze and search for the answer which is deemed to be most
suitable, returning this to the customer instantly. Many virtual agent applications will allow customers to
give all sorts of information in any order, and either work with what it has been given, or ask the user for
more detail about what they actually meant. Having been unconsciously trained over the years to
provide their queries in a way which standard search functionality is more likely to be able to handle (for
example, a couple of quite specific keywords), customer must be encouraged and educated to use
natural language queries in order for virtual agents to be able to deliver to their potential.
The virtual agent application is different from standard search functionality, ignoring bad punctuation or
grammar, and using longer phrases rather than just searching on keywords. Sophisticated applications
attempt to look for the actual intent behind the customer’s question, trying to deliver a single correct
answer (or at least a relatively small number of possible answers), rather than a list of dozens of
potential answers contained in documents which may happen to contain some of the keywords that the
customer has used. The virtual agent application may also try to exceed its brief by providing a list of
related questions and answers to the original question, as it is well known that one question can lead to
another. Solution providers and users train the system to pattern-match the right words or association
of words with the correct result: the application, unlike older forms of web search techniques, does not
simply guess what the customer wants, or how they will express themselves. Through ‘listening’ to what
the customers actually say - perhaps through a mixture of large quantities of audio and text – the initial
set-up configuration can achieve a good accuracy rate, which really benefits over time as a positive
feedback loop is established. Solutions that gather and differentiate customer requests and results from
multiple channels, noting the difference between them, have an even better success rate.
Virtual agent functionality ’understands’ the context of what the customer is asking, with the result
being more akin to that of an empathetic human who also has had access to what the customer has
been trying to do. For example, if asked “When can I expect my delivery?”, the context and the required
answer will be different depending on whether the customer has placed an order and is enquiring about
its status, or has only a hypothetical interest in turnaround times in case they decide to place an order.
When the virtual agent application has low confidence that it has returned the correct result, it is able to
escalate the customers query seamlessly to a live chat agent, who then has access to the self-service
session history, enabling a greater chance of a successful resolution without repetition. (It is generally
considered best practice that escalations to real agents are not hidden from customers). The eventual
correct response can be fed back to the automated virtual agent (and the knowledge base underlying it),
which will make it more likely that future similar requests can be handled successfully through
automated agents.
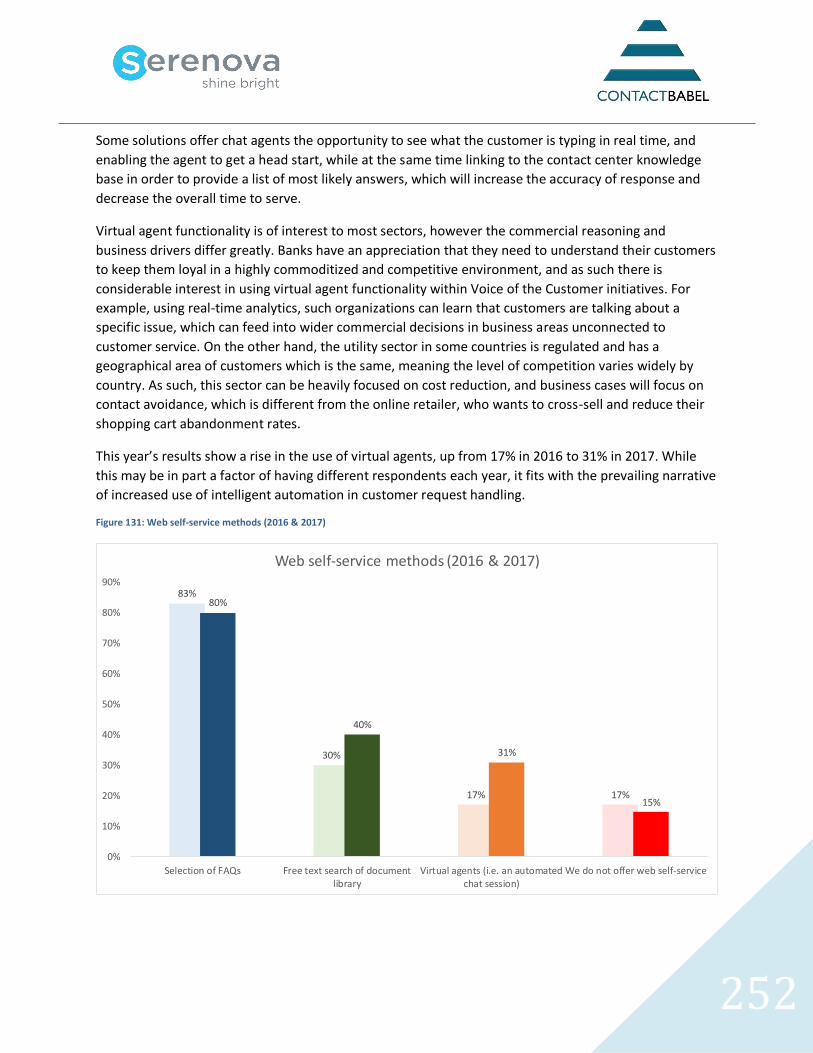
252
Some solutions offer chat agents the opportunity to see what the customer is typing in real time, and
enabling the agent to get a head start, while at the same time linking to the contact center knowledge
base in order to provide a list of most likely answers, which will increase the accuracy of response and
decrease the overall time to serve.
Virtual agent functionality is of interest to most sectors, however the commercial reasoning and
business drivers differ greatly. Banks have an appreciation that they need to understand their customers
to keep them loyal in a highly commoditized and competitive environment, and as such there is
considerable interest in using virtual agent functionality within Voice of the Customer initiatives. For
example, using real-time analytics, such organizations can learn that customers are talking about a
specific issue, which can feed into wider commercial decisions in business areas unconnected to
customer service. On the other hand, the utility sector in some countries is regulated and has a
geographical area of customers which is the same, meaning the level of competition varies widely by
country. As such, this sector can be heavily focused on cost reduction, and business cases will focus on
contact avoidance, which is different from the online retailer, who wants to cross-sell and reduce their
shopping cart abandonment rates.
This year’s results show a rise in the use of virtual agents, up from 17% in 2016 to 31% in 2017. While
this may be in part a factor of having different respondents each year, it fits with the prevailing narrative
of increased use of intelligent automation in customer request handling.
Figure 131: Web self-service methods (2016 & 2017)
83%
30%
17% 17%
80%
40%
31%
15%
0%
10%
20%
30%
40%
50%
60%
70%
80%
90%
Selection of FAQs Free text search of documentlibrary
Virtual agents (i.e. an automatedchat session)
We do not offer web self-service
Web self-service methods (2016 & 2017)
253
SELF-SERVICE CHANNELS: E2E AND ‘VIPA’S
Businesses’ interactions with customers are becoming a highly-polarized mixture of the automated and
the personalized. Moving a large proportion of interactions onto self-service works for businesses, and is
increasingly popular with a customer base that is becoming more sophisticated and demanding in what
it expects from self-service.
A few years down the line, we can expect to see self-service using increasing amounts of artificial
intelligence, with personal technology applications seeking out the best deals on offer, or interacting
with a business on behalf of customers. This leads to the conclusion that many customer-agent
interactions will be exceptional, such as a complaint, an urgent or complex issue or a technical query
that an FAQ or customer community couldn’t solve. It is also likely that whole segments of the customer
base who don’t want automation at all will be handled directly by live agents in many cases.
Many self-service scenarios suggest a world in which customers speak directly to ‘intelligent’ systems,
but the world of the ‘virtual intelligent personal assistant’ (VIPA) turns this idea on its head, postulating
an e2e world (in which systems talk to systems), where the customer delegates many of their business
interactions to a pseudo-intelligent device. The VIPA is something which isn't yet widely available, but is
being driven by improvements in technology and the desire of the customer to get the best deal with
the least effort. Perhaps the most widely-used (albeit very basic) version of the VIPA is the iPhone’s
“Siri”, which provides basic web search functionality based on speech recognition. It is still a very long
way from being a true VIPA though.
Storing information on a VIPA device - such as personal preferences, financial details and individuals’
physical profiles - is the first step, and one can be done today. Customers of the future will instruct the
device to research the best deals for products and services, and to come back to the device’s owner with
the best selection. The VIPA would ‘call’ the relevant contact center (which would in fact be either a
number of back-office company systems or possibly a live agent in some cases) and even purchase the
best deal without having to involve the owner in any way. The same principle applies to customer
service: using the ‘Internet of things’ means that, for example, utilities meters would send their own
readings to suppliers on request, and a manufacturer can detect when a part on an appliance is about to
fail, and organize a replacement part and engineer visit with the customer’s permission.
VIPAs may be used in association with intelligent agents which roam the web for answers to questions
or situations, and could act as a third-party broker between the customer and a business. Price
comparison sites act today as a type of first-generation smart assistant, but are entirely reliant on
accurate and complete data inputs being provided by suppliers and the site’s owners. If VIPA technology
could be relied upon to work, and standards of interoperability between VIPA and businesses were
implemented, then this immediate and extensive market knowledge could create a ‘perfect market’ for
commoditized products and services, with major impacts on the way business operates.
254
SOCIAL MEDIA
There are a huge number of definitions for social media, but the majority highlight certain aspects and
traits in common, including, but not limited to:
• interactivity between peers supported by a collection of online tools
• dialogue rather than monologue
• ubiquity
• free-to-air
• user-generated content
• person-to-person communication.
On the face of it, social media seems more about individuals communicating with each other, leaving
companies out of the loop. However, many organizations have been eager to step up to the plate,
setting-up Twitter, Facebook and Google+ accounts as well as YouTube channels for marketing and
customer support, with corporate blogs and customer communities also widely supported.
Social media started as a way to make marketing more effective, and social media analytics has focused
mainly on this area as well. Now, the reality of social media is dual: it accounts for inbound customer
service as well as outbound marketing, whether the business likes it or not. There is also another duality
to consider: businesses can learn through direct solicitation of customer responses, and indirectly
through the social media analytics process.
The rise of social media as a customer service channel has often been de facto, in that customers have
actively sought out the company's Facebook page or Twitter account to communicate with it, even if the
company originally had a social media presence only to disseminate information. ContactBabel expects
social media to remain a relatively minor channel for most businesses in terms of overall number of
interactions compared to telephony, but one with the potential to be strongly negative - to punch well
above its weight - and senior executives tend to treat the channel with a great deal of respect. When
combined and analyzed with other sources of feedback, this medium becomes even more powerful.
While some businesses see low levels of customer interactions via social media, others receive
thousands of mentions each day. The high-profile nature of this channel and the possible magnifying
effects of negative comments means that social media is viewed as being far more important than
baseline interaction statistics would suggest. Some savvy customers, knowing that their public complaint
or issue will be dealt with quickly, prefer to go straight to a social media channel rather than wait in a
telephone queue. Others might choose the social channel after they’ve had a bad experience on another
channel, such as waiting on hold for a phone agent.
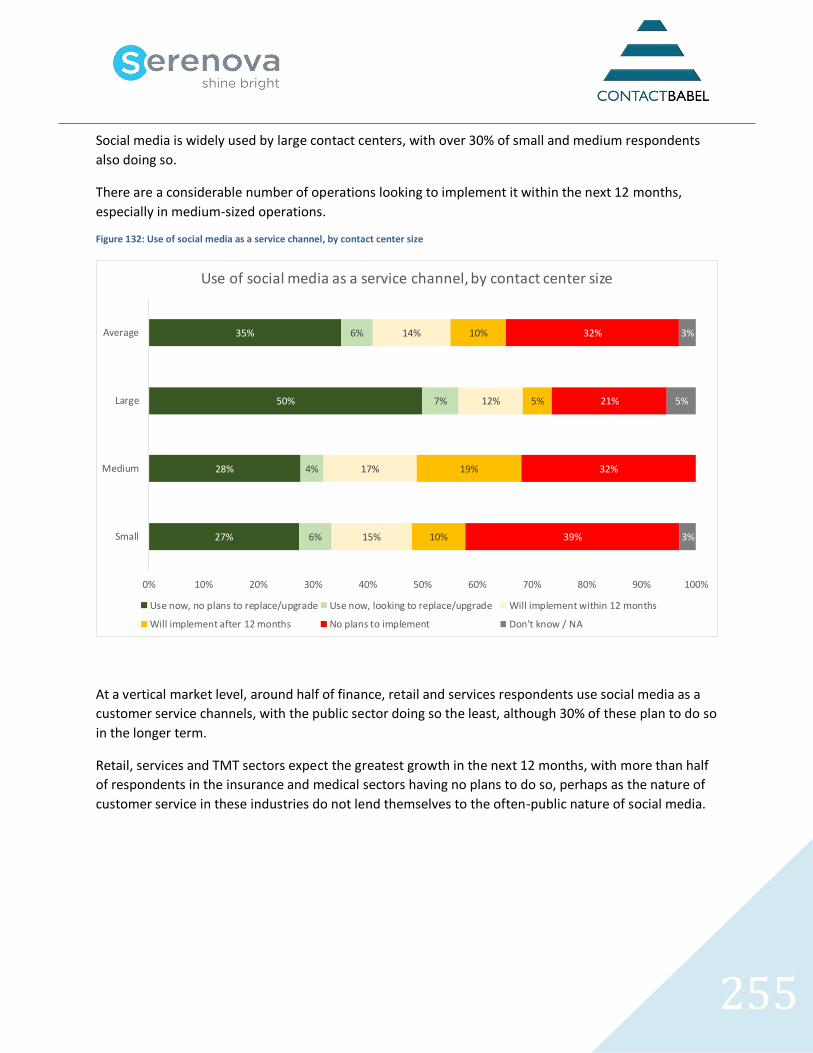
255
Social media is widely used by large contact centers, with over 30% of small and medium respondents
also doing so.
There are a considerable number of operations looking to implement it within the next 12 months,
especially in medium-sized operations.
Figure 132: Use of social media as a service channel, by contact center size
At a vertical market level, around half of finance, retail and services respondents use social media as a
customer service channels, with the public sector doing so the least, although 30% of these plan to do so
in the longer term.
Retail, services and TMT sectors expect the greatest growth in the next 12 months, with more than half
of respondents in the insurance and medical sectors having no plans to do so, perhaps as the nature of
customer service in these industries do not lend themselves to the often-public nature of social media.
27%
28%
50%
35%
6%
4%
7%
6%
15%
17%
12%
14%
10%
19%
5%
10%
39%
32%
21%
32%
3%
5%
3%
0% 10% 20% 30% 40% 50% 60% 70% 80% 90% 100%
Small
Medium
Large
Average
Use of social media as a service channel, by contact center size
Use now, no plans to replace/upgrade Use now, looking to replace/upgrade Will implement within 12 months
Will implement after 12 months No plans to implement Don't know / NA
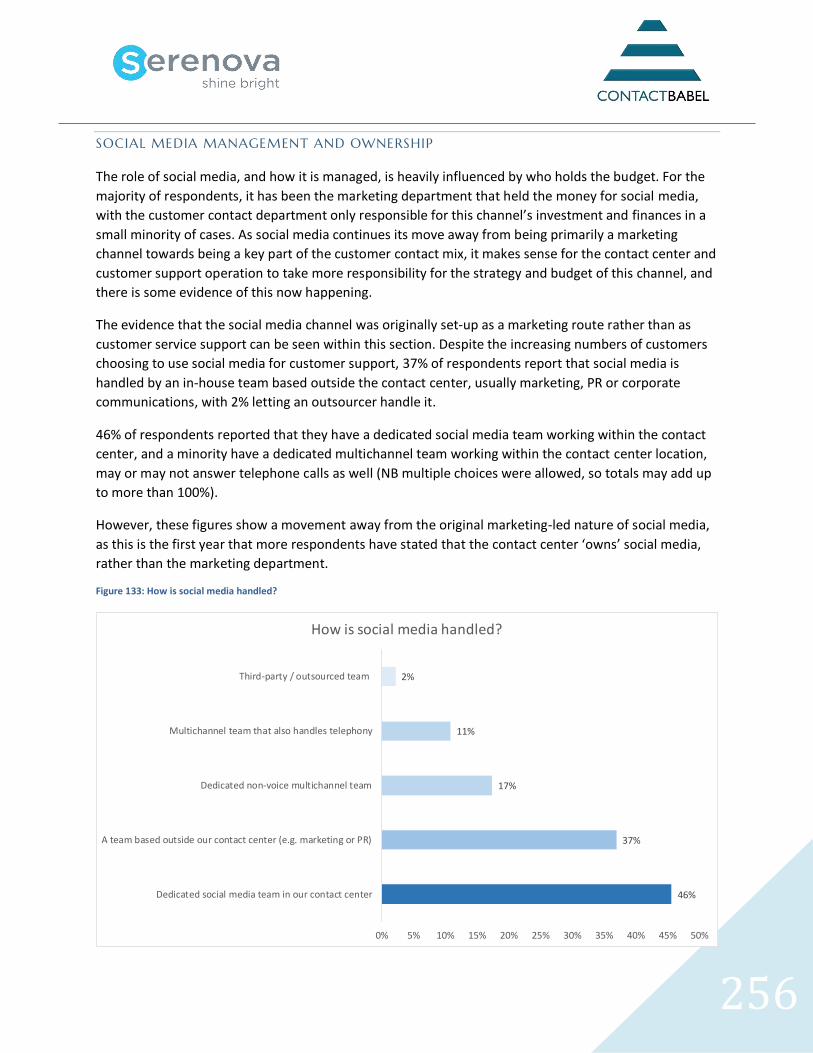
256
SOCIAL MEDIA MANAGEMENT AND OWNERSHIP
The role of social media, and how it is managed, is heavily influenced by who holds the budget. For the
majority of respondents, it has been the marketing department that held the money for social media,
with the customer contact department only responsible for this channel’s investment and finances in a
small minority of cases. As social media continues its move away from being primarily a marketing
channel towards being a key part of the customer contact mix, it makes sense for the contact center and
customer support operation to take more responsibility for the strategy and budget of this channel, and
there is some evidence of this now happening.
The evidence that the social media channel was originally set-up as a marketing route rather than as
customer service support can be seen within this section. Despite the increasing numbers of customers
choosing to use social media for customer support, 37% of respondents report that social media is
handled by an in-house team based outside the contact center, usually marketing, PR or corporate
communications, with 2% letting an outsourcer handle it.
46% of respondents reported that they have a dedicated social media team working within the contact
center, and a minority have a dedicated multichannel team working within the contact center location,
may or may not answer telephone calls as well (NB multiple choices were allowed, so totals may add up
to more than 100%).
However, these figures show a movement away from the original marketing-led nature of social media,
as this is the first year that more respondents have stated that the contact center ‘owns’ social media,
rather than the marketing department.
Figure 133: How is social media handled?
46%
37%
17%
11%
2%
0% 5% 10% 15% 20% 25% 30% 35% 40% 45% 50%
Dedicated social media team in our contact center
A team based outside our contact center (e.g. marketing or PR)
Dedicated non-voice multichannel team
Multichannel team that also handles telephony
Third-party / outsourced team
How is social media handled?
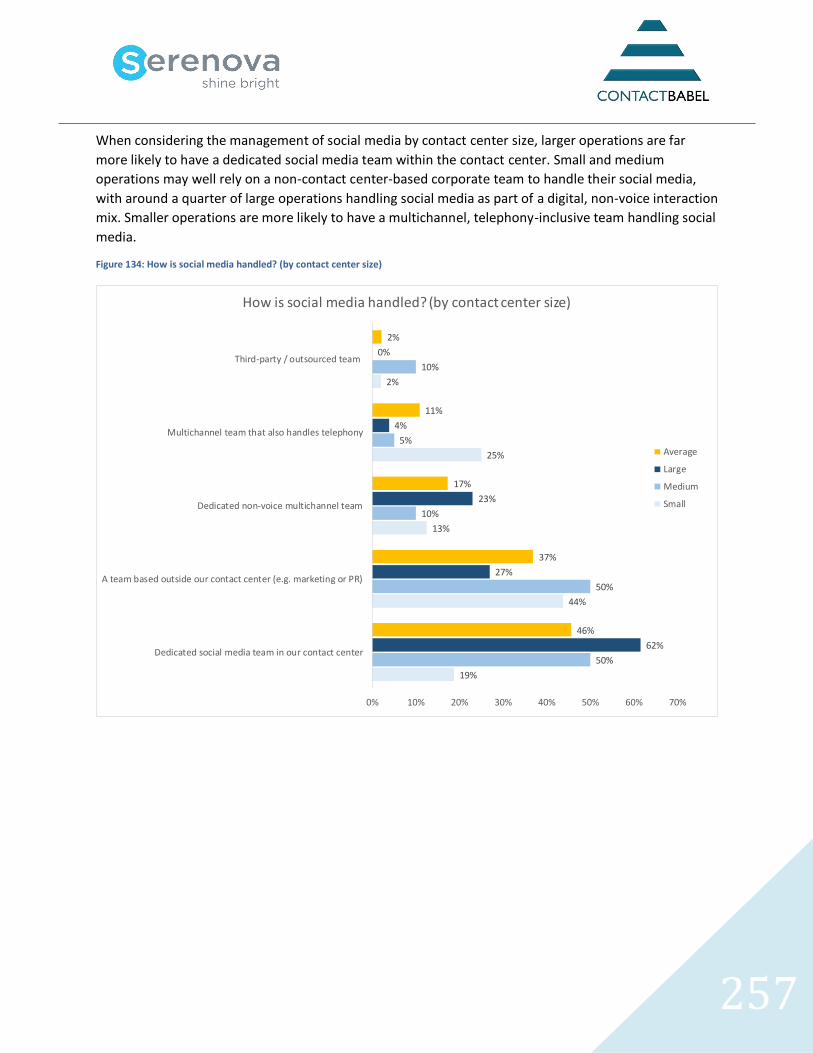
257
When considering the management of social media by contact center size, larger operations are far
more likely to have a dedicated social media team within the contact center. Small and medium
operations may well rely on a non-contact center-based corporate team to handle their social media,
with around a quarter of large operations handling social media as part of a digital, non-voice interaction
mix. Smaller operations are more likely to have a multichannel, telephony-inclusive team handling social
media.
Figure 134: How is social media handled? (by contact center size)
19%
44%
13%
25%
2%
50%
50%
10%
5%
10%
62%
27%
23%
4%
0%
46%
37%
17%
11%
2%
0% 10% 20% 30% 40% 50% 60% 70%
Dedicated social media team in our contact center
A team based outside our contact center (e.g. marketing or PR)
Dedicated non-voice multichannel team
Multichannel team that also handles telephony
Third-party / outsourced team
How is social media handled? (by contact center size)
Average
Large
Medium
Small
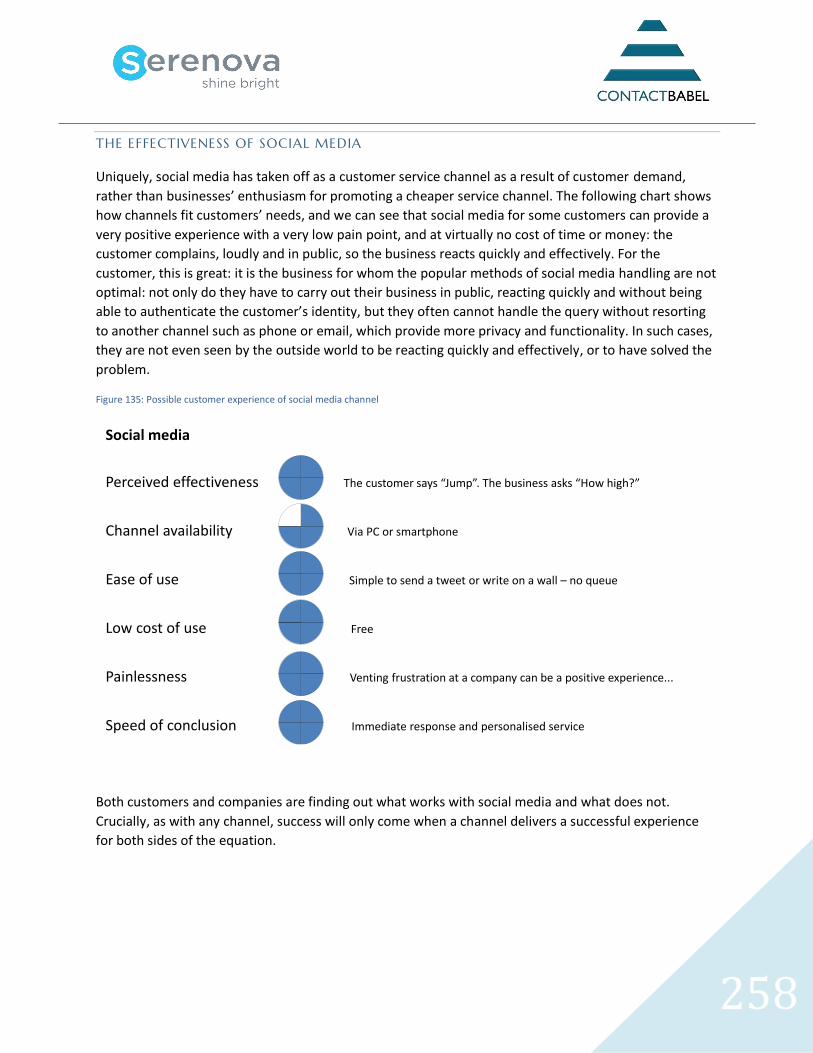
258
THE EFFECTIVENESS OF SOCIAL MEDIA
Uniquely, social media has taken off as a customer service channel as a result of customer demand,
rather than businesses’ enthusiasm for promoting a cheaper service channel. The following chart shows
how channels fit customers’ needs, and we can see that social media for some customers can provide a
very positive experience with a very low pain point, and at virtually no cost of time or money: the
customer complains, loudly and in public, so the business reacts quickly and effectively. For the
customer, this is great: it is the business for whom the popular methods of social media handling are not
optimal: not only do they have to carry out their business in public, reacting quickly and without being
able to authenticate the customer’s identity, but they often cannot handle the query without resorting
to another channel such as phone or email, which provide more privacy and functionality. In such cases,
they are not even seen by the outside world to be reacting quickly and effectively, or to have solved the
problem.
Figure 135: Possible customer experience of social media channel
Both customers and companies are finding out what works with social media and what does not.
Crucially, as with any channel, success will only come when a channel delivers a successful experience
for both sides of the equation.
Social media
Perceived effectiveness The customer says “Jump”. The business asks “How high?”
Channel availability Via PC or smartphone
Ease of use Simple to send a tweet or write on a wall – no queue
Low cost of use Free
Painlessness Venting frustration at a company can be a positive experience...
Speed of conclusion Immediate response and personalised service
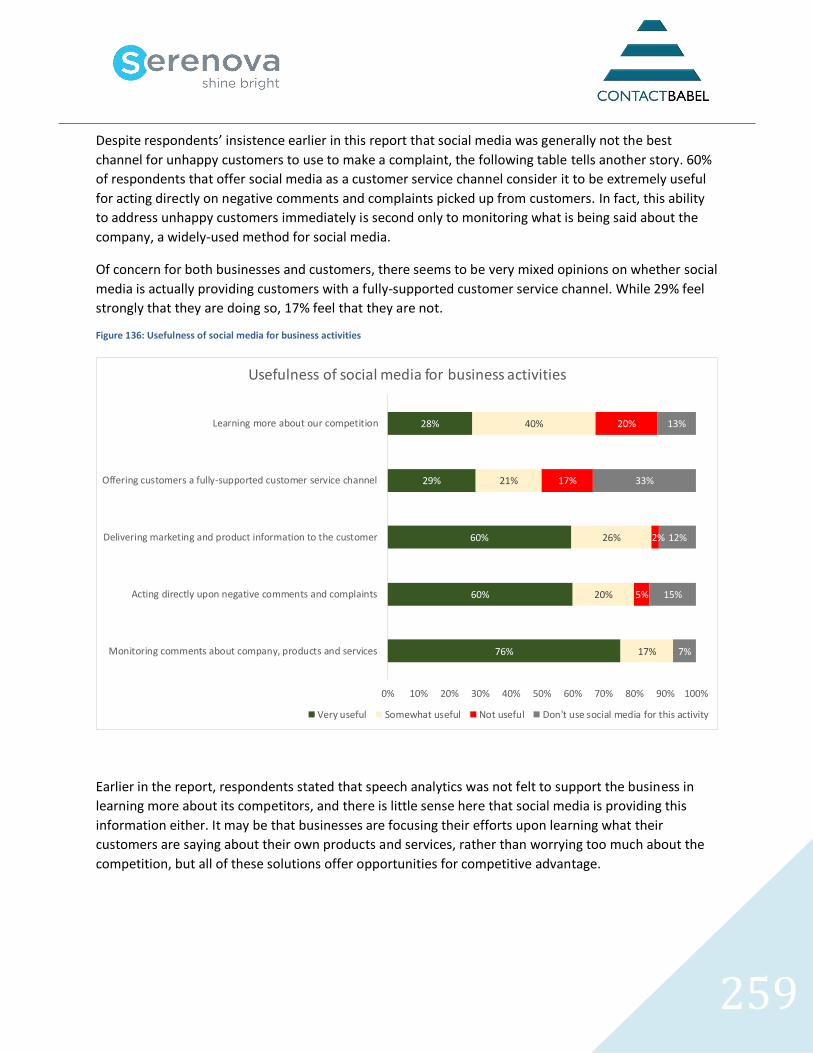
259
Despite respondents’ insistence earlier in this report that social media was generally not the best
channel for unhappy customers to use to make a complaint, the following table tells another story. 60%
of respondents that offer social media as a customer service channel consider it to be extremely useful
for acting directly on negative comments and complaints picked up from customers. In fact, this ability
to address unhappy customers immediately is second only to monitoring what is being said about the
company, a widely-used method for social media.
Of concern for both businesses and customers, there seems to be very mixed opinions on whether social
media is actually providing customers with a fully-supported customer service channel. While 29% feel
strongly that they are doing so, 17% feel that they are not.
Figure 136: Usefulness of social media for business activities
Earlier in the report, respondents stated that speech analytics was not felt to support the business in
learning more about its competitors, and there is little sense here that social media is providing this
information either. It may be that businesses are focusing their efforts upon learning what their
customers are saying about their own products and services, rather than worrying too much about the
competition, but all of these solutions offer opportunities for competitive advantage.
76%
60%
60%
29%
28%
17%
20%
26%
21%
40%
5%
2%
17%
20%
7%
15%
12%
33%
13%
0% 10% 20% 30% 40% 50% 60% 70% 80% 90% 100%
Monitoring comments about company, products and services
Acting directly upon negative comments and complaints
Delivering marketing and product information to the customer
Offering customers a fully-supported customer service channel
Learning more about our competition
Usefulness of social media for business activities
Very useful Somewhat useful Not useful Don't use social media for this activity
260
SOCIAL MEDIA ANALYTICS
As with speech analytics, text analytics can be applied historically or in real time. It can be applied to
interactions between customers and agents (as in the case of email, web chat or social media contact),
or by looking at customer feedback, whether on the business’s own website or on third-party sites.
Unlike speech analytics, text analytics does not require a speech recognition engine to identify the
words being used, but the general principles and opportunities are similar.
Historical text analysis is useful for business intelligence, whether about how the company and its
products are perceived, or the effectiveness of the customer contact operation. It is important to note
that many uses of historical text analysis work best when they are used shortly after the comment is
made, rather than weeks or months afterward: an issue that is commented upon by many customers
may need to be acted upon rapidly. For example, confusion about a marketing message, complaints
about phone queues, or a case of system failure which prevents customers from buying on a website
need to be identified and handled as quickly as possible. For longer-term issues, such as gathering
suggestions on new functionality for a product release, such urgency is less important.
Text analytics helps to dig deeper into the actual unstructured comments made by customers on
channels including social media, which are otherwise very difficult and time-consuming to categorize
and act upon, especially where there are many thousands of comments. Industry-specific vocabularies
can be used to identify and understand more of the relevant comments, and place them into the correct
context. Solutions should also be more sophisticated than simply to identify key words or phrases: the
sentiment of the whole comment should be considered (for example, “outstanding balance” may be
negative to banking customers, but positive to someone reviewing which music system to buy). Many
comments are mixed-sentiment, and may also mix positivity with some more critical comments, which
the analytics solution will have to take into account: the comments are where the real value is found,
with both positive and negative insights available to be understood.
Just as with speech analytics, text analytics solutions aim to categorize comments and interactions to
provide actionable insight about a discrete part of the business (e.g. a specific product or store; the
online sales experience; the politeness or otherwise of the contact center staff, etc.). However, text
analytics is more affordable than many speech analytics solutions, and is often applied to all possible
text, rather than just a sampling. The analytics solution should be able to identify the many different
ways that people refer to the same thing in order to categorize correctly and make sure that the actual
importance of the issue is represented fairly and accurately. Categories can be created automatically by
the analytics application, and/or through the input of business experts, and should be revisited regularly
to make sure they are still addressing the reality of the business.
261
Manually analyzing thousands of social media interactions and linking them with specific customers and
their other interactions is impossible, so there is a great potential for multichannel analysis. Adding in
channels such as social media, web chat, SMS and email will make the mix more complex, and more
potentially suitable for analysis. Including social media, email and text chat into the analytics equation is
increasingly important, and while many vendors have multichannel/omnichannel analytics within their
overall customer contact analytics solution, this functionality is often under the purview of the Customer
Experience team.
The best social analytics solutions also offer a solution that can gather all the relevant data in a thorough
way, detect and eliminate duplicates, routing the social mentions that require contact center care to the
right agents.
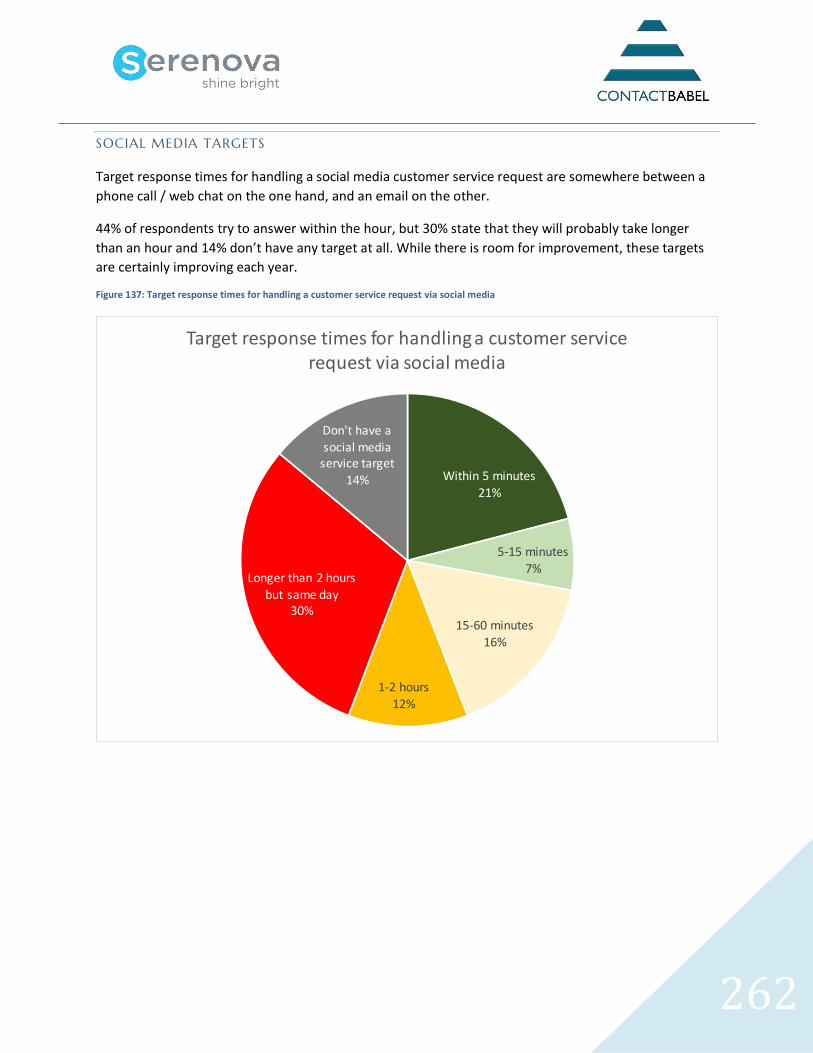
262
SOCIAL MEDIA TARGETS
Target response times for handling a social media customer service request are somewhere between a
phone call / web chat on the one hand, and an email on the other.
44% of respondents try to answer within the hour, but 30% state that they will probably take longer
than an hour and 14% don’t have any target at all. While there is room for improvement, these targets
are certainly improving each year.
Figure 137: Target response times for handling a customer service request via social media
Within 5 minutes21%
5-15 minutes7%
15-60 minutes
16%
1-2 hours12%
Longer than 2 hours but same day
30%
Don't have a social media
service target14%
Target response times for handling a customer service request via social media
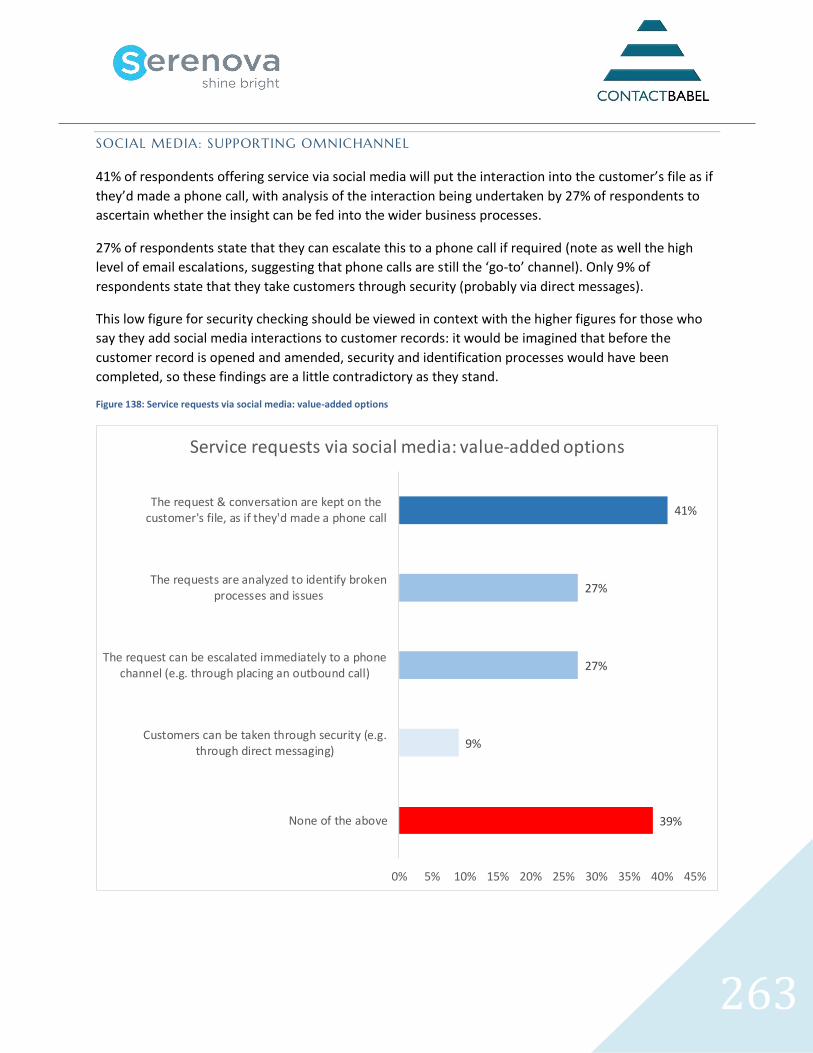
263
SOCIAL MEDIA: SUPPORTING OMNICHANNEL
41% of respondents offering service via social media will put the interaction into the customer’s file as if
they’d made a phone call, with analysis of the interaction being undertaken by 27% of respondents to
ascertain whether the insight can be fed into the wider business processes.
27% of respondents state that they can escalate this to a phone call if required (note as well the high
level of email escalations, suggesting that phone calls are still the ‘go-to’ channel). Only 9% of
respondents state that they take customers through security (probably via direct messages).
This low figure for security checking should be viewed in context with the higher figures for those who
say they add social media interactions to customer records: it would be imagined that before the
customer record is opened and amended, security and identification processes would have been
completed, so these findings are a little contradictory as they stand.
Figure 138: Service requests via social media: value-added options
39%
9%
27%
27%
41%
0% 5% 10% 15% 20% 25% 30% 35% 40% 45%
None of the above
Customers can be taken through security (e.g.through direct messaging)
The request can be escalated immediately to a phonechannel (e.g. through placing an outbound call)
The requests are analyzed to identify brokenprocesses and issues
The request & conversation are kept on thecustomer's file, as if they'd made a phone call
Service requests via social media: value-added options
264
Tips on providing customer service via social media
• Despite the pressure that social media puts onto a business, younger generations express a
preference for communicating with businesses in this way. They are also more likely to complain
about problems on social media, so supporting a social media customer care plan is vital to winning
and keeping this section of your customer base.
• Social media does not have to refer only to the likes of Twitter and Facebook. Customers are
growing increasingly more sophisticated at seeking out help themselves, with many preferring to
attempt to find their own solution via customer communities before contacting a business, although
this can be a very hit-or-miss approach.
• Be aware that age has a particularly strong role in the choice of customer communication channels.
Generally speaking, older generations will choose the phone as their primary channel, whereas
younger customers will look at online channels first. Men are also far more likely than women to
look for a self-service solution initially.
• 80% of customers trust recommendations from other customers. The downside to this, of course, is
that customers will also take a negative criticism of a product or company very seriously.
• By keeping a Twitter feed or Facebook page up-to-date, an organization can reduce inbound call
traffic at a time when a particular issue is causing a spike of calls, for example, if bad weather
threatens to close schools.
• Blending social media with other forms of customer communication can mean that agents get a
more well-rounded view of what customers are actually thinking. Knowledge sharing between
agents, especially where new information is put in a timely fashion into the knowledge base, will
assist both agents and self-service customers.
• When dealing with large volumes of social interaction, contact centers have the tools and
information they need to best engage and fully resolve customer issues
• Just because the customer has initiated a social media interaction does not mean that a business has
to stay on that channel to resolve it successfully. Customers may like to receive an outbound call
from the agent, as this may provide the opportunity to go into further detail, and to resolve the
issue entirely.
265
NEXT-GENERATION SOCIAL MEDIA: MESSENGER & WHATSAPP – THE CHAT/SOCIAL HYBRID
With 900m active users of Facebook Messenger12 and over 1bn WhatsApp users13, organizations should
at least have a watching brief over these tools where customer contact is concerned.
Messenger/WhatsApp have the benefit of familiarity with customers, and businesses may wish to
investigate including these types of interaction within their agents’ web chat screen. As many users live
their lives permanently logged into these applications, there is an ease-of-use and ubiquity associated
with them.
The applications allow historic records of interactions to be kept (which is not the case with all users of
web chat), and there is a great advantage over social media such as Twitter and Facebook: messages are
private, which not only allows customer identity verification, but also will reduce the damage to a
business through public negative messages. Unlike most web chat, these applications allow the sharing
of images.
The familiarity of these applications will work in favor of agents as well as customers, which will reduce
training time and cost. Businesses will also need to consider what is an acceptable service level for these
channels: as detailed elsewhere the report, web chat is perhaps closest to the telephony channel’s
service level target, whereas social media is more akin to email. Although Messenger/WhatsApp are
types of social media, they will be used as web chat from the customer’s perspective, and should be
resourced according to similar expectations.
WhatsApp, especially, is often used as a closed, group-based application, and there may be pushback
from segments of the customer community that do not currently associate the use of these applications
with business communication. The challenge to businesses will be to persuade customers that letting
them into their social circle is worth the effort.
The Forrester brief on Customer Service through Facebook Messenger14 contains more information
about these options.
12
http://www.statista.com/statistics/417295/facebook-messenger-monthly-active-users/ 13
http://www.statista.com/statistics/260819/number-of-monthly-active-whatsapp-users/ 14
http://blogs.forrester.com/ian_jacobs/16-05-11-facebook_messenger_the_future_of_customer_service
266
THE MOBILE CUSTOMER
Statistics that show the number of smartphone users, volume of apps downloaded and the value of
mobile transactions are rising so quickly that they would be out-of-date before this report is published.
It is sufficient to note that with very few exceptions, the mobile customer is relevant to every
organization, in every vertical market, in every geography of the world.
The rapidly decreasing cost of mobile bandwidth, coupled with the huge improvements in mobile
networks (e.g. 4G) means that businesses can be ambitious in what they are attempting within this
channel, as they can have a high level of confidence that what they can imagine today will be technically
possible within a couple of years, if not a matter of months.
Research from Netbiscuits15 shows that 91% of customers who have a poor experience with shopping on
a mobile site will abandon it: some may intend to return via a PC, but many others will search
elsewhere: there is no differentiation or allowances made for sub-optimal mobile web experiences.
Furthermore, most businesses are currently failing in this attempt, with the mobile channel lagging way
behind online websites and bricks-and-mortar shops.
Offering a mobile customer experience tends to mean offering a smartphone app and/or a mobile
version of a website, and the next section of the report looks at what this means for businesses and
customers.
15 Quoted at http://mobilemarketingmagazine.com/34-per-cent-abadon-poor-mobile-experiences
267
MOBILE WEBSITES
A mobile website differs from simply accessing a full website via a mobile browser, rather offering a
mobile-optimized alternative which is easier to use and overcomes some of the constraints around using
a smartphone to access the web, such as tiny fonts, excessive scrolling and difficult-to-press buttons.
Mobile websites usually do not try to offer every single item available on the full website, but focus
upon the information and processes that most users will want in order to act or make a decision. Ease of
use is vital: text must be fully displayed on screen, buttons must be clickable and businesses have had to
consider minimizing the use of graphics to achieve quicker load times in areas with poor mobile data
services, although this is becoming less of an issue as 4G and cheaper data becomes more widespread.
Bearing in mind that a mobile site generally cannot support every type of interaction that a customer
may want, businesses may consider that allowing mobile users to access the main website is a good
idea. Contact details should be clear, and offering a seamless route from self-service into supported
service, via email, web chat or telephony is very desirable.
It is beneficial for businesses to understand why customers are using a mobile site rather than waiting
until they are in front of a PC: the request may be related to what they are doing at that current time,
and so waiting is not appropriate. Generally, customers will be more task-focused on a mobile device
than a PC (and may not be in a position to give the interaction their entire attention for as long as is
needed), so the emphasis should be on delivering quick, simple, high-volume interactions.
For example, by looking at the current use of their full website, a bank may discover that a high
proportion of users just want to check their bank balance or view recent transactions rather than setting
up automatic bill payments or ordering foreign currency. Consequently, the mobile version of the
website may focus only on a small number of high-volume interaction types, acting as triage and a call
avoidance tactic.
268
SMARTPHONE APPS
A good app may provide a superior user experience to a mobile website, due to the greater level of
design. However, they tend to be much more expensive to build, and unlike a mobile website, a new
one has to be developed for each smartphone platform. Additionally, company apps will tend to be free
to download, so there is little opportunity to make money directly from them.
Smartphone platform market shares show that Android and iOS shipments account for over 90% of the
market16, so businesses could decide to produce only two flavors of app, which would actually support
the great majority of the smartphone market.
A native application developed for a mobile device can use some of the device’s capabilities to enhance
the customer experience. For example, a smartphone app can prompt drivers at the scene of a car
accident to provide and capture the correct information, including photos. Such an app could also use
GPS to give the exact location of the accident for use by the insurance company.
Industry estimates for building an app vary considerably depending on what they are trying to do, but
many sources indicate that a cost of $30,000 upwards (per platform) is very feasible. The cost of
developing a mobile website is less, and only needs to be done once. Whether an app is suitable for a
company depends on their budget, and their customer base. It may be that the superior branding
associated with apps is seen as being well worth the expense, even before factors like increased sales
conversion rates are taken into account.
16 http://www.idc.com/prodserv/smartphone-os-market-share.jsp
269
TIPS ON BUILDING SUCCESSFUL APPS
• Understand what the most popular self-service transactions are that your customers wish to do, and
focus initially on providing the means to do this via a mobile app. This will give you a quick win,
familiarize your customers with this channel, and encourage them to think positively about it
• If any interactions require knowledge of a customer’s location, the GPS capabilities within a
smartphone may make this particularly suitable to put onto a mobile app
• An app should be able to divert a large number of simple calls away from the contact center.
Businesses may find that mobile apps replace some of the work done by telephony IVR, with the
visual element allowing a greater depth of functionality and a quicker self-service experience for the
customer. Visual IVR could also be employed to offer greater depth and usability to self-service
• Consider the demographics of your customer base. Do your younger customers wish to carry out
different transactions or interactions than your older customer base? If so, focus mobile
functionality on the demographic that will use it most
• If there is a problem with the app, or the customer cannot do what they wish to do, it is vital to offer
a clear route into live customer service. This may be via a ‘call me’ button on the website, which can
put the customer into a virtual queue, and can provide all the transaction-based information that
the customer has already input, along with any of the other relevant customer details so that the
agent does not have to start from the beginning. A call-back option also means that the customer
does not have to spend their own mobile minutes waiting in a queue.
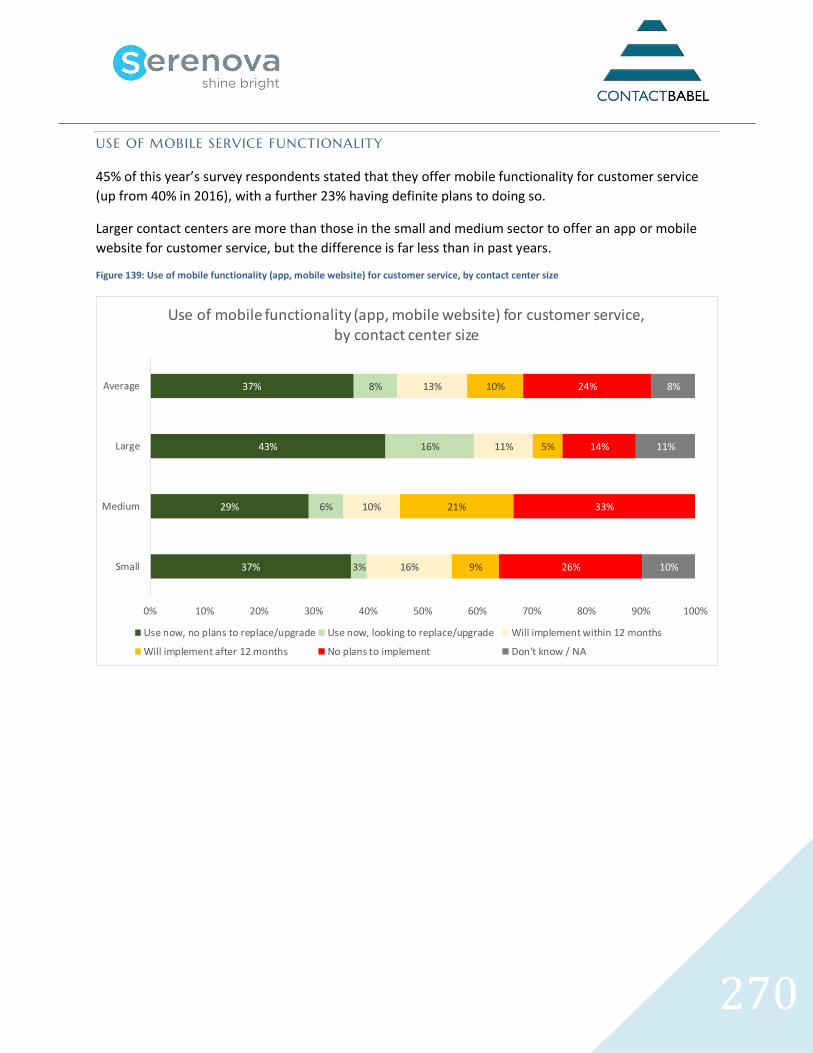
270
USE OF MOBILE SERVICE FUNCTIONALITY
45% of this year’s survey respondents stated that they offer mobile functionality for customer service
(up from 40% in 2016), with a further 23% having definite plans to doing so.
Larger contact centers are more than those in the small and medium sector to offer an app or mobile
website for customer service, but the difference is far less than in past years.
Figure 139: Use of mobile functionality (app, mobile website) for customer service, by contact center size
37%
29%
43%
37%
3%
6%
16%
8%
16%
10%
11%
13%
9%
21%
5%
10%
26%
33%
14%
24%
10%
11%
8%
0% 10% 20% 30% 40% 50% 60% 70% 80% 90% 100%
Small
Medium
Large
Average
Use of mobile functionality (app, mobile website) for customer service, by contact center size
Use now, no plans to replace/upgrade Use now, looking to replace/upgrade Will implement within 12 months
Will implement after 12 months No plans to implement Don't know / NA
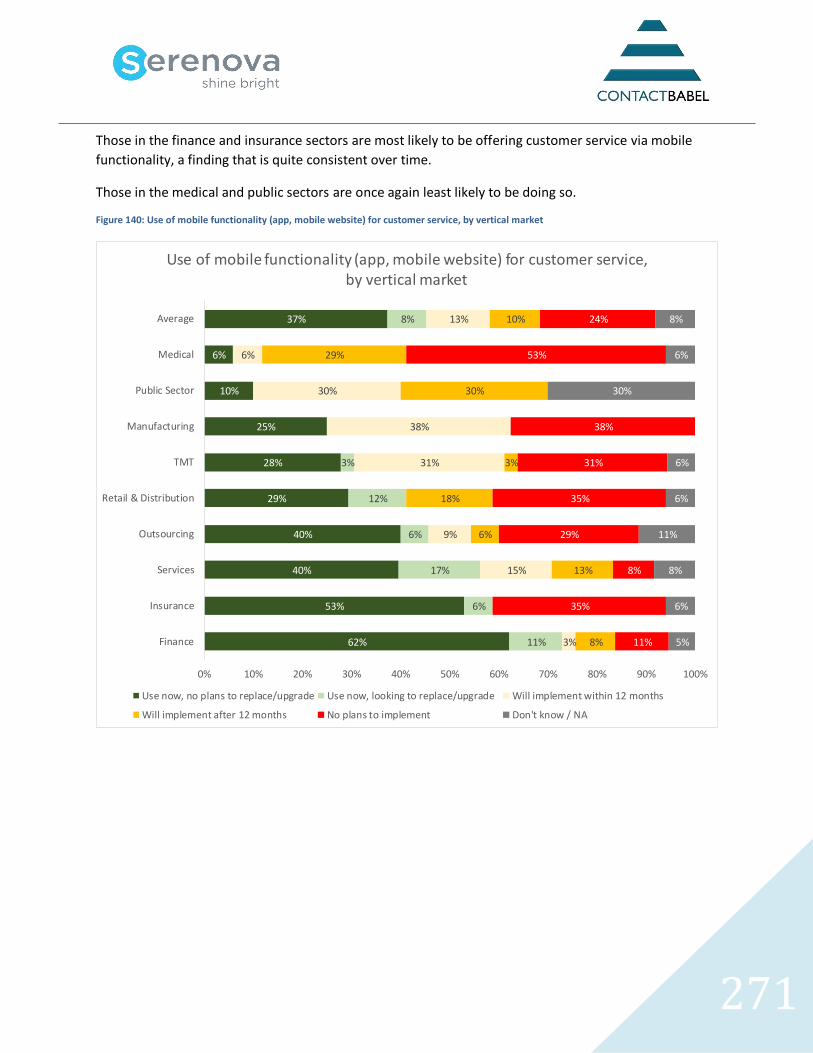
271
Those in the finance and insurance sectors are most likely to be offering customer service via mobile
functionality, a finding that is quite consistent over time.
Those in the medical and public sectors are once again least likely to be doing so.
Figure 140: Use of mobile functionality (app, mobile website) for customer service, by vertical market
62%
53%
40%
40%
29%
28%
25%
10%
6%
37%
11%
6%
17%
6%
12%
3%
8%
3%
15%
9%
31%
38%
30%
6%
13%
8%
13%
6%
18%
3%
30%
29%
10%
11%
35%
8%
29%
35%
31%
38%
53%
24%
5%
6%
8%
11%
6%
6%
30%
6%
8%
0% 10% 20% 30% 40% 50% 60% 70% 80% 90% 100%
Finance
Insurance
Services
Outsourcing
Retail & Distribution
TMT
Manufacturing
Public Sector
Medical
Average
Use of mobile functionality (app, mobile website) for customer service, by vertical market
Use now, no plans to replace/upgrade Use now, looking to replace/upgrade Will implement within 12 months
Will implement after 12 months No plans to implement Don't know / NA
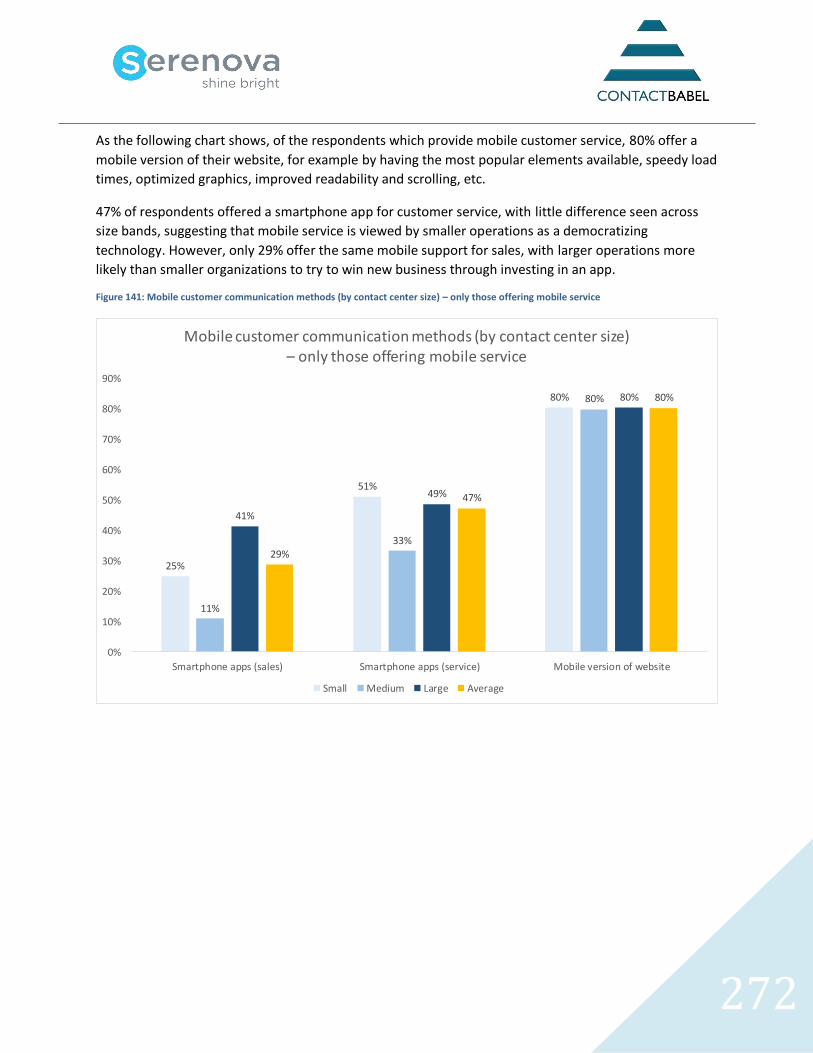
272
As the following chart shows, of the respondents which provide mobile customer service, 80% offer a
mobile version of their website, for example by having the most popular elements available, speedy load
times, optimized graphics, improved readability and scrolling, etc.
47% of respondents offered a smartphone app for customer service, with little difference seen across
size bands, suggesting that mobile service is viewed by smaller operations as a democratizing
technology. However, only 29% offer the same mobile support for sales, with larger operations more
likely than smaller organizations to try to win new business through investing in an app.
Figure 141: Mobile customer communication methods (by contact center size) – only those offering mobile service
25%
51%
80%
11%
33%
80%
41%
49%
80%
29%
47%
80%
0%
10%
20%
30%
40%
50%
60%
70%
80%
90%
Smartphone apps (sales) Smartphone apps (service) Mobile version of website
Mobile customer communication methods (by contact center size) – only those offering mobile service
Small Medium Large Average
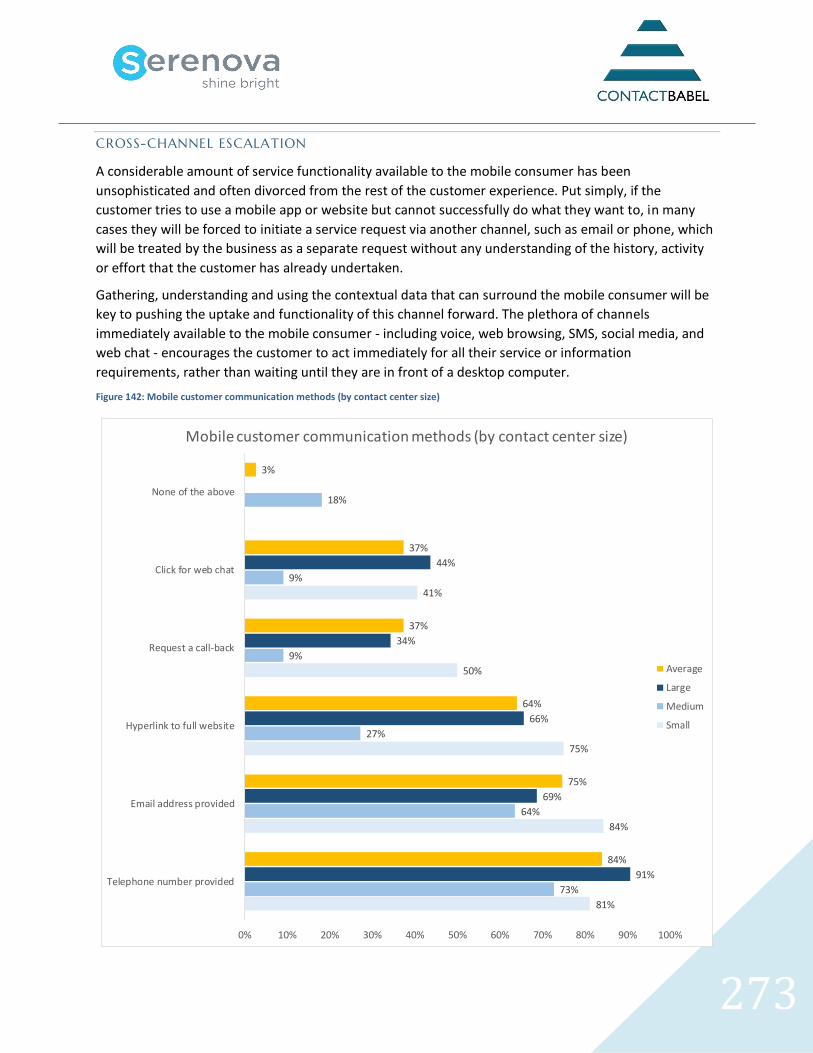
273
CROSS-CHANNEL ESCALATION
A considerable amount of service functionality available to the mobile consumer has been
unsophisticated and often divorced from the rest of the customer experience. Put simply, if the
customer tries to use a mobile app or website but cannot successfully do what they want to, in many
cases they will be forced to initiate a service request via another channel, such as email or phone, which
will be treated by the business as a separate request without any understanding of the history, activity
or effort that the customer has already undertaken.
Gathering, understanding and using the contextual data that can surround the mobile consumer will be
key to pushing the uptake and functionality of this channel forward. The plethora of channels
immediately available to the mobile consumer - including voice, web browsing, SMS, social media, and
web chat - encourages the customer to act immediately for all their service or information
requirements, rather than waiting until they are in front of a desktop computer.
Figure 142: Mobile customer communication methods (by contact center size)
81%
84%
75%
50%
41%
73%
64%
27%
9%
9%
18%
91%
69%
66%
34%
44%
84%
75%
64%
37%
37%
3%
0% 10% 20% 30% 40% 50% 60% 70% 80% 90% 100%
Telephone number provided
Email address provided
Hyperlink to full website
Request a call-back
Click for web chat
None of the above
Mobile customer communication methods (by contact center size)
Average
Large
Medium
Small
274
Where the user needs to pass through security - and also where other reasons mean that the customer
cannot complete their interaction solely through mobile browsing or using an app - businesses should
consider how they will keep the customer or prospect engaged with the business.
The easiest way to support cross-channel contact is to offer a telephone number on the mobile website
or inside the app, and 84% of respondents do so. However, the user/ customer must often start their
request again from the beginning, as many respondents will not trust the security and identification
process that the customer has already been through, nor will the browsing history be passed onto the
agent. Effectively, the customer may as well not have used the mobile channel at all, which is a negative
for them and their attitude towards this channel in future.
Providing an email address is the second most popular escalation method (75%), which does allow the
pre-population of fields in an email form (user details, account details, type of issue etc.) although only a
few respondents do this. However, email is a slow medium even when done correctly, and the user will
not get an answer in real time. Sales operations prefer to encourage mobile browsers to contact them
through a more immediate channel, to reduce the chance of losing a sale.
64% of respondents allow mobile web visitors to click through to the main website, where richer and
more detailed functionality may be available. However, as this is optimized for desktop viewing, rather
than mobile, it can be almost unusable to all but the most determined customer.
37% of respondents using the mobile channel state that they offer call-backs to customers. While this is
a positive and proactive response, the user is often left in the same situation as if they had called in the
first place, as the agent will often have to take them through security and establish what the problem is.
37% of respondents were offered a web chat option within the mobile site or app, this being the
channel most closely resembling the activity the user is already undertaking (i.e. using the mobile device
to look for information, and typing rather than speaking). Web chat is more immediate than email, and
offers a chance to move between self-service and assisted service seamlessly, with the agent being able
to push links and video to the user in real-time. The difficulty in typing on a smartphone screen means
that this is still not a perfect solution.
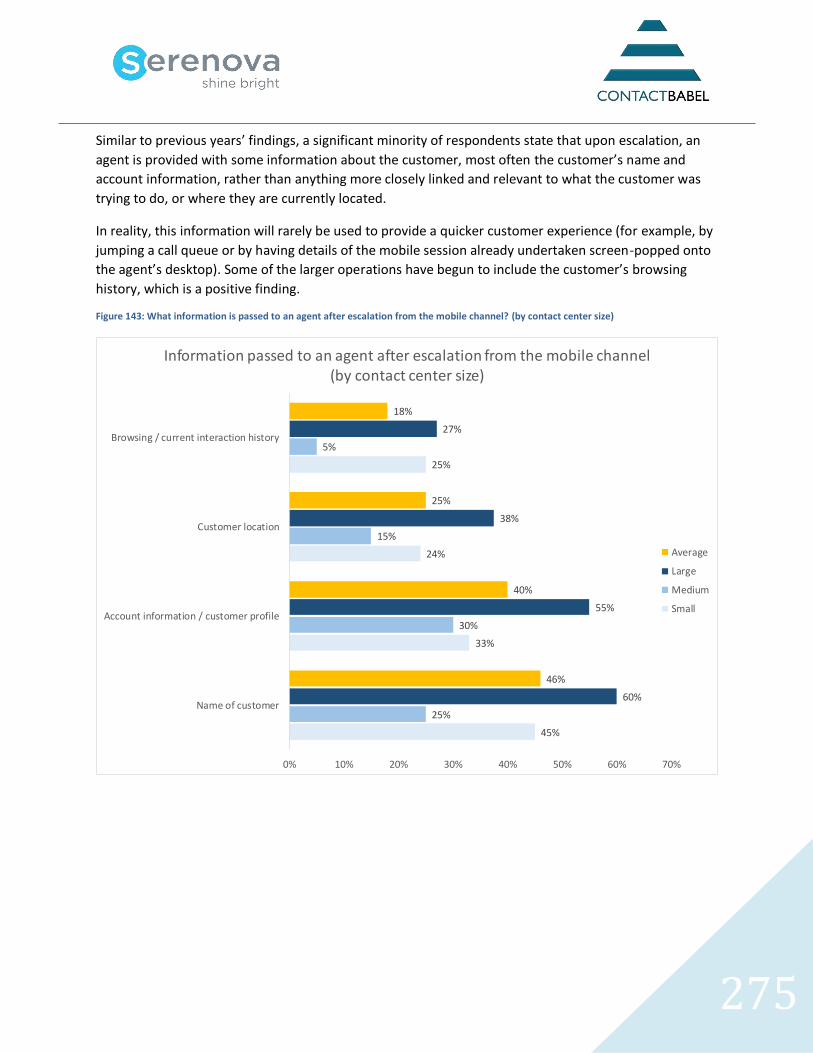
275
Similar to previous years’ findings, a significant minority of respondents state that upon escalation, an
agent is provided with some information about the customer, most often the customer’s name and
account information, rather than anything more closely linked and relevant to what the customer was
trying to do, or where they are currently located.
In reality, this information will rarely be used to provide a quicker customer experience (for example, by
jumping a call queue or by having details of the mobile session already undertaken screen-popped onto
the agent’s desktop). Some of the larger operations have begun to include the customer’s browsing
history, which is a positive finding.
Figure 143: What information is passed to an agent after escalation from the mobile channel? (by contact center size)
45%
33%
24%
25%
25%
30%
15%
5%
60%
55%
38%
27%
46%
40%
25%
18%
0% 10% 20% 30% 40% 50% 60% 70%
Name of customer
Account information / customer profile
Customer location
Browsing / current interaction history
Information passed to an agent after escalation from the mobile channel (by contact center size)
Average
Large
Medium
Small
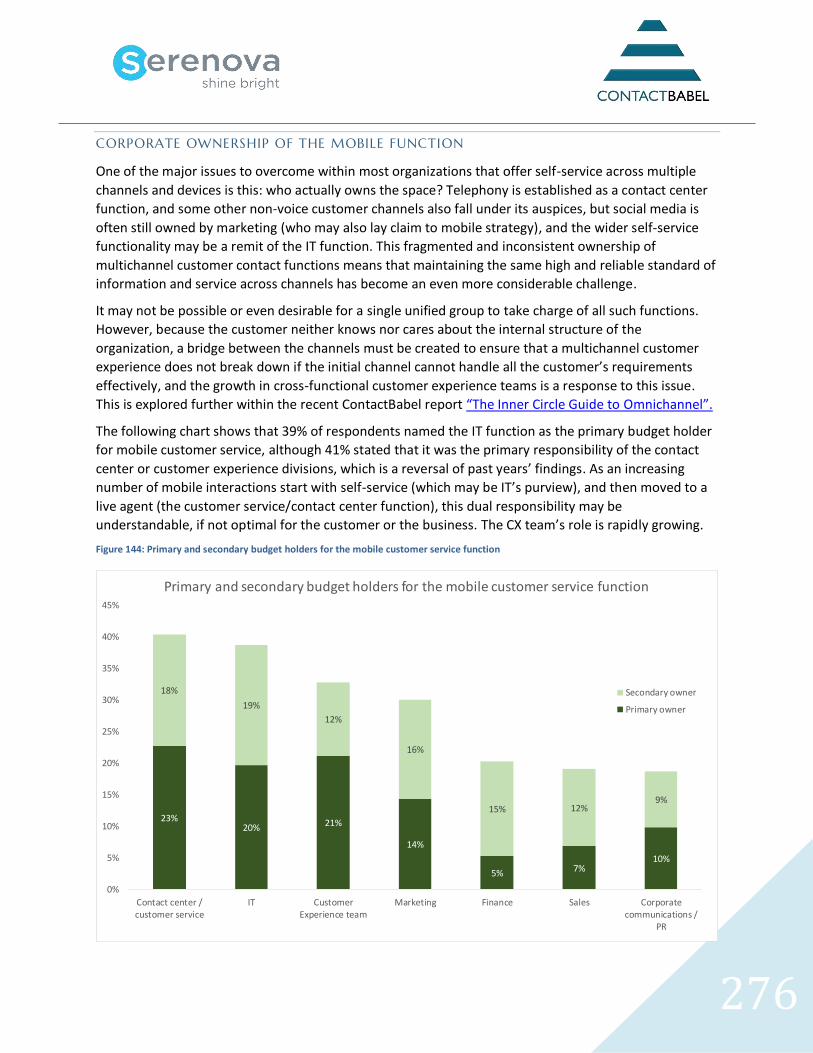
276
CORPORATE OWNERSHIP OF THE MOBILE FUNCTION
One of the major issues to overcome within most organizations that offer self-service across multiple
channels and devices is this: who actually owns the space? Telephony is established as a contact center
function, and some other non-voice customer channels also fall under its auspices, but social media is
often still owned by marketing (who may also lay claim to mobile strategy), and the wider self-service
functionality may be a remit of the IT function. This fragmented and inconsistent ownership of
multichannel customer contact functions means that maintaining the same high and reliable standard of
information and service across channels has become an even more considerable challenge.
It may not be possible or even desirable for a single unified group to take charge of all such functions.
However, because the customer neither knows nor cares about the internal structure of the
organization, a bridge between the channels must be created to ensure that a multichannel customer
experience does not break down if the initial channel cannot handle all the customer’s requirements
effectively, and the growth in cross-functional customer experience teams is a response to this issue.
This is explored further within the recent ContactBabel report “The Inner Circle Guide to Omnichannel”.
The following chart shows that 39% of respondents named the IT function as the primary budget holder
for mobile customer service, although 41% stated that it was the primary responsibility of the contact
center or customer experience divisions, which is a reversal of past years’ findings. As an increasing
number of mobile interactions start with self-service (which may be IT’s purview), and then moved to a
live agent (the customer service/contact center function), this dual responsibility may be
understandable, if not optimal for the customer or the business. The CX team’s role is rapidly growing.
Figure 144: Primary and secondary budget holders for the mobile customer service function
23%20% 21%
14%
5% 7%10%
18%
19%
12%
16%
15% 12%9%
0%
5%
10%
15%
20%
25%
30%
35%
40%
45%
Contact center /customer service
IT CustomerExperience team
Marketing Finance Sales Corporatecommunications /
PR
Primary and secondary budget holders for the mobile customer service function
Secondary owner
Primary owner
277
DEVELOPMENTS IN MOBILE
Solution providers are keen to offer technology that ties the mobile channel in more tightly with the
existing voice and data customer support channels, providing a single integrated user experience
regardless of initial channel choice and any cross-channel movement by the customer.
One of the key ways to do this is to offer live agent support more easily (for example, through clicking an
icon within an app), which provides a context-relevant, geographically-supported and personalized
customer experience. The movement between self-service and live service is currently very difficult for
many customers - it is certainly not seamless - and actually may involve abandoning the mobile channel
entirely as a failure in order to start afresh with another channel. As the customer has chosen originally
to use a mobile channel, even a successful outcome with another channel will risk leaving the customer
dissatisfied with the company, and less likely to use the mobile channel in future.
There is also the danger that because the organization is unaware that a failed mobile session has been
the root cause of a live contact, it will underestimate the reality of cross-channel interaction failures.
WebRTC will offer businesses the chance to offer easy click-to-call or click-to-video directly from the
website, which could make transition from self-service to assisted service far less painful.
On moving from self-service to assisted service, mobile service applications should gather the browsing
history, customer information and the context of the session in order to pass this to a live agent.
Smartphones are enabled with GPS tracking, so businesses should look to leverage this capability to
deliver better customer experiences where possible. In fact, the inherent capabilities of the mobile
device offer businesses huge opportunities to impress their customers, including location-specific
information, such as local broadband outages, or the ability to leverage photo-taking functionality on
the phone to provide the agent with a clearer picture of the situation (which may be particularly useful
for insurance claims or technical support, for example).
SMS and outbound calling also offer opportunities for businesses to deliver proactive customer service
through the mobile channel, creating a positive attitude. Furthermore, location-specific device
information also allows businesses to deliver timely service and relevant marketing messages which can
be positives for the customer at that specific place and time.
It is not just the customer interaction points that will become more integrated. Brick-and-mortar stores
are also becoming more integrated with their digital component, in order to provide correct real-time
inventory levels at store- and company-wide levels, thus matching the capabilities of their dot-com
competitors while being able to take advantage of being able to provide in-store services to customers.
278
Like any technology, application or channel, mobile service has to be seen to pay its way. Quite apart
from the importance of fulfilling a customer demand, there are numerous elements to consider when
looking at return on investment:
• Call avoidance due to increased use of self-service, although the difference made to the number
of IVR sessions should be taken into account: customers may simply be swapping one self-
service method for another, rather than avoiding expensive live calls
• Increasing the accuracy of routing by leveraging mobile and customer data means that calls are
more likely to go to an agent that can resolve them first-time, impacting positively upon first-
contact resolution, call transfer rates, average handle time and customer satisfaction
• Decreased call handling time in cases where mobile browsing information and other contextual
data is passed to an agent, enabling them to reduce effort duplication
• Improved customer satisfaction, and decreased customer effort is likely to lead to improved
loyalty, revenue and customer advocacy
Contextual information, such as geographical location, enables greater cross-selling and up-selling
opportunities based on improved knowledge about the customer and their circumstances.
279
VISUAL IVR
The widespread use of smartphones allows a visual representation of IVR menus: some studies show
that a caller can navigate a visual IVR menu between four and five times quicker than a DTMF IVR menu
without sacrificing any functionality or options. Visual IVR can also send video presentations to a waiting
caller, for educational or marketing purposes.
Businesses which have made significant investments in IVR can simply overlay visual IVR on top of
existing IVR functionality, showing the IVR’s path as a picture on a smartphone, with callers touching the
selection that they require. This is both quicker than listening to IVR menu options, and more likely to
give the correct information or be routed to the right place. Visual IVR menu systems integrate with
existing DTMF structures and reuse the same VoiceXML scripts, meaning that any changes made to the
IVR system will be automatically replicated.
Despite the huge uptake in smartphones and mobile apps, it is unlikely that customers will have an app
for every company with which they do business. A visual IVR option provides businesses with an
opportunity to display corporate branding and deliver an improved customer experience.
280
CONTEXTUAL DATA: THE GREAT MOBILE OPPORTUNITY
The nature of mobile devices means that businesses potentially have the opportunity to know more
about their customers and their specific requirements and preferences than ever before.
This includes:
• Customer identity: once the customer has identified themselves, such as by logging on, or
through the mobile phone number, this allows the agent to access their existing customer
history in the same way that would be done so on a phone call into the contact center.
• Geographical information: smartphones are GPS-enabled, allowing agents to see where
customers are, and to direct them to the nearest store, for example.
• Historical activity: if the customer has been browsing a mobile website or app beforehand, the
information that the customer browsed previously may be useful for the contact center agent to
have to hand, in order to see and understand what the customer has already tried to do.
• Stored data: the mobile device may have data stored that identifies the customer, such as
account number, that can speed up the interaction and make it more effective.
• Collected information: the mobile device may also be used to capture and share information
with the business such as photographs or videos. It may be possible to automate a two-way
interaction: for example, a customer may use their mobile phone to scan a QR (quick response)
code on a product. Using the information on the code, as well as the customer’s input into the
app about what they are trying to do, the customer may be directed to the correct place within
business’s self-service function in order to solve the issue that they have. This can take the
contact center out of the equation altogether, resulting in reduced costs for the business and a
quicker and more effective customer experience.
281
WEB RTC & VIDEO
While not a channel in itself, WebRTC (Web Real Time Communications) is an API definition that
supports browser-to-browser applications for voice calling, video chat, and P2P file sharing without the
need of either internal or external plugins17.
The announcement18 in April 2016 that Apple would support WebRTC within its WebKit engine that runs
the Safari browser is a major step forward for next-generation customer support, enabling voice, video
and collaborative communications directly from a website without the need for additional software.
While mainstream use of click-to-video has been a very long time coming, WebRTC offers the
opportunity to businesses to engage customers face-to-face where appropriate, offering the browsing
customer a route straight into the contact center without any breaking of channel or extra effort.
WebRTC allows customers to start a video or voice call from the web browser (which may be via a
desktop computer, but perhaps more often a smartphone, perhaps as an escalation from an existing
web chat session), which means the organization’s website can then offer video or voice contact center
functionality in a seamless manner, with customers able to request live communication with the
business without the need to download specific software or seek out the phone number and break off
from what they are doing on the website. Two-way video communication is likely to be of more interest
to mobile users, as their smartphone device already comes enabled with a camera and microphone,
unlike many desktop computers which may not have this functionality or whose users have it disabled.
One-way video, to protect users’ privacy, is perhaps a more likely option in many instances, as is click-to-
call.
Video agents are a step towards more personalized, high-quality customer contact. The customer will be
able to see to whom they are talking, through a multimedia PC or mobile device, assuming the
broadband requirements are met.
17 https://en.wikipedia.org/wiki/WebRTC 18
http://www.nojitter.com/post/240171589/apple-jumps-on-the-webrtc-bandwagon
282
There are a number of cultural and business issues to consider:
• Customers may prefer the impersonality of non-visual contact, and may be uncomfortable
with the agent seeing them in a domestic environment, which would suggest one-way video
may be more popular
• Eye contact is critical for establishing trust and 60% of the communication process is actually
visual. For sensitive purchases such as financial services, being able to see the financial
advisor can help to establish trust and put the customer at ease. The entire contact may be
captured and distributed electronically for further reference
• Verbal abuse, a major problem for some agents, may decrease in a virtual face-to-face
setting, however, agents may feel their privacy is decreased if they are on camera, especially
one-way, and the incidence of disturbing crank calls may increase
• The contact center environment will need to be altered to impress the customer, and voice
agents will need to be trained in visual communication.
This application has potential, especially in a sales environment, and with technical support, where the
agent shows the customer what they mean. Various businesses - usually banks - are already using video
kiosks to offer virtual branch banking services in areas where physical branches have closed. Currently,
customers are more likely to find that video is not being used to show a company’s agents in a live
environment, but as part of a supported multimedia service experience, with the agent sending relevant
recorded video clips either via chat or email.
283
INCREASING PROFITABILITY
Not only are contact centers under pressure to reduce their costs, but many - either directly or indirectly
- are also major revenue-generators for their businesses, and the recent drive to maximize profitability
has made many businesses look at whether their contact centers can add more to the bottom-line.
Although much responsibility for revenue generation lies with senior management, production and sales
divisions, the contact center also has an important part to play in maximizing revenues through selling
the right product to the right customer at the right time (aided by a CRM system or similar), and through
proactive and efficient outbound selling.
This chapter considers outbound automation, and also looks at cloud-based solutions, which offer
contact centers new financial and operational options which can make a very significant difference to
the bottom-line.
284
CLOUD-BASED CONTACT CENTER SOLUTIONS
‘CLOUD’: TERMS & DEF INITIONS
The modern contact center has a multitude of applications supporting it, with hardware, middleware
and networking equipment around and inside it. The traditional method of deploying these resources
has been on a CPE (customer premise equipment) basis, with the business's IT resource implementing
and maintaining it. Now, the vast majority of this equipment, functionality and supporting resource is
available in a third-party hosted environment, through one of the various types of cloud-based delivery.
Cloud-based solutions are the latest in a line of alternatives for businesses to owning and running their
own technology. Here are explanations of some of the terms that readers may have encountered in
researching cloud-based contact centers.
• Cloud is the delivery of computing and storage capacity as a service to different business,
organizations and individuals over a network. It can be said to consist of Infrastructure as a Service
(IaaS) - servers and storage space, Platform as a Service (PaaS) - operating systems and web servers,
and Software as a Service (SaaS) - the functionality of software available on demand without the
need to own or maintain it. The cloud is characterized by huge scalability and flexibility, (often, but
not always) shared resources, a utilities approach to billing (pay for what you use, for example) and
an abstraction of obvious on-site infrastructure.
There are various deployment models:
o Public cloud: applications, storage, and other resources are made available by a service
provider, often offered on a pay-per-use model. Public cloud service providers own and
operate the infrastructure and offer access via the Internet
o Private cloud: infrastructure operated solely for a single organization, whether managed
internally or by a third-party and hosted internally or externally. They require management
by the organization or a third-party
o Virtual private cloud: a deployment model that pulls in public cloud infrastructure-as-a-
service (IaaS) while running the application on premise or in a private cloud, in order to
improve disaster recovery, flexibility and scalability and to benefit from Opex-based costing
while avoiding expensive hardware purchases
of consumers say that a fast response to an inquiry or complaint is the key element to an ideal customer experience.*
of executives say silos within the organization and a lack of integrated information systems are the two biggest obstacles standing in the way of improving the customer experience.*
*The Economist Intelligence Unit Perspectives, Creating a
seamless customer experience, March 2015
United Kingdom | United States Canada
CxEngageTM is the always-on, highly
secure, true multi-tenant, and instantly
scalable Contact Center as a Service
(CCaaS) platform designed to enable
exceptional customer experiences
anywhere anytime.
• Global Scale Up & Out
• Effortless Power & Insight
• Open & Flexible
286
o Community cloud shares infrastructure between several organizations from a specific
community with common concerns (security, compliance, jurisdiction, etc.), whether
managed internally or by a third-party. The costs are spread over fewer users than a public
cloud (but more than a private cloud), so do not gain as much from cost reductions. It may
be an appropriate deployment model for departments within government or public sector
bodies, rather than within commercial organizations (for example, a department could share
Contact Center as a Service with other departments or agencies within their network)
o Hybrid cloud is a composition of two or more clouds (private, community, public or a linked
cloud/CPE solution) that remain unique entities but are bound together, offering the
benefits of multiple deployment models. By utilizing "hybrid cloud" architecture, companies
and individuals are able to obtain degrees of fault tolerance combined with locally
immediate usability without dependency on internet connectivity. Hybrid Cloud architecture
requires both on-premises resources and off-site (remote) server-based cloud
infrastructure.
• SaaS (Software as a Service) is a model of software deployment whereby a provider licenses an
application to customers for use as a service on demand. SaaS software vendors may host the
application on their own web servers or download the application to the consumer device, disabling
it after use or after the on-demand contract expires. The on-demand function may be handled
internally to share licenses within a firm or by a third-party service provider sharing licenses
between firms.
On-demand licensing and use alleviates the customer's burden of equipping a device with every
conceivable application. It also reduces traditional End User License Agreement (EULA) software
maintenance, ongoing operation patches, and patch support complexity in an organization. On-
demand licensing enables software to become an operating expense, rather than a fixed cost at the
time of purchase. It also enables licensing only the amount of software needed versus traditional
licenses per device. SaaS also enables the buyer to share licenses across their organization and
between organizations, to reduce the cost of acquiring EULAs for every device in their firm.
Using SaaS can also conceivably reduce the upfront expense of software purchases, through less
costly, on-demand pricing from cloud providers. SaaS lets software vendors control and limit use,
prohibits copies and distribution, and facilitates the control of all derivative versions of their
software.
287
• Hosted solutions have similarities to SaaS in that the application is hosted off the customer's
premises, but may not actually be managed by the service provider. A hosted solution may be an
individual instance of an application running on a single server dedicated to the customer, restricted
in scalability by its finite nature. Although this may allow greater control and flexibility, it can be
more expensive and there is less redundancy. It may be thought that all SaaS solutions are hosted,
but not all hosted applications are SaaS.
• Network-based solutions are marketed as solutions with equipment physically located in multiple
locations, permitting users to access the various services via a combination of the contact center’s
internet connection and the standard PSTN networks. This allows complete geographic
independence and disaster recovery (DR) solutions.
• Multi-tenancy refers to where a single instance of the software runs on a server, but serves many
customer organizations. Clients’ data and configuration are separated virtually but the same actual
hardware, software versions and databases are used. This deployment model is likely to be able to
offer functionality at a lower cost due to the economies of scale possible, but is less customizable
than other options
• Multi-instance occurs where separate software instances or versions (and possibly actual physical
hardware) are provided for each individual business. This deployment option is considered most
effective for complex and deep integration, but is unlikely to be offered at a similar cost to a multi-
tenant option
• Hardware virtualization masks from users the physical characteristics of the platform, hosting
multiple isolated instances of an application on one or more servers. The same image can be used
on multiple sites, whether customer-owned or hosted.
Carefully research the services you’re considering, to determine if they’re true
cloud offerings or if they’re previous offerings rebranded as cloud services.
For more information on cloud-based solutions, please download ContactBabel's in-depth, updated
report, "The Inner Circle Guide to Cloud-based Contact Center Solutions".
288
DRIVERS FOR CLOUD-BASED SOLUTIONS
The many factors influencing the uptake of cloud-based solutions can be grouped into several areas, and
it is important to remember that a factor (e.g. security) can be both a driver and an inhibitor:
Financial: how does cloud affect the investment and ongoing expenditure connected with technology
and the operations of the contact center? Cloud offers contact centers a way forward without relying on
capital investment:
• Businesses can scale down future customer premises equipment (CPE) investment, with a
resulting decrease in capital expenditure
• Services are bought using a per-concurrent-user or even per-hour pricing model, which helps to
keep operating expenses manageable and controllable
• Outright purchase of equipment isn’t for everyone, perhaps for reasons of budget or the ability
to maintain the systems
• There is the opportunity to scale up quickly as demand dictates, without purchasing lots of
redundant licenses or the hardware to support them
• Low-risk ability to start up, move, expand or trial new functionality without changing existing
business plans or budgets
• Business retain the freedom to downscale, change targets and react to meet demand, rather
than commit themselves to long-term arrangements needed to justify CPE investments.
Flexibility & Agility: how can cloud-based solutions help businesses with changing interaction volumes
and distributed operations?
• Reduced need for IT support and implementation: having hardware and software based in the
cloud means that ongoing system maintenance is significantly reduced, as it is the cloud
provider’s job to do this
• Larger pool of agents to choose from: cloud enables advanced features to be deployed across
sites without complex and possibly unreliable call flows, while offering disaster recovery and risk
minimization. For example, queueing interactions in the cloud allows for the searching and
identification of relevant agents based on skill and requirements before the call is routed
• Short-term scalability: cloud offers great flexibility in adding or shedding agents and user
licenses, of particular relevance to businesses which have substantial changes in call volumes
over a year (such as the seasonality experienced by healthcare providers in the US, retailers and
travel agents), or which have to react quickly to handle event-driven call spikes (e.g. an
emergency weather situation affecting utilities companies).
289
Functionality: what is the effect of cloud-based solutions on the functionality available to the contact
center?
• Trial new applications quickly using a low-risk pilot: using a pay-per-use model allows businesses
to start a contact center or move at low risk or increase for a temporary campaign or try out
new functionality without having to spend excessive amounts of time and money first
• Future-proof the contact center: a competitive, open cloud environment should mean that
vendors will be motivated to innovate and provide better service, enhancing and developing
their services ahead of the mainstream market.
Security: does cloud bring a greater risk to security, or the opposite? Organizations should expect that
data should be at least as secure in a third-party environment that is dedicated solely to providing a
high-quality cloud-based service, as this is one of the factors by which the solution provider will succeed
or fail.
Potential cloud clients should look for:
• multiple levels of firewall protection
• continuous intruder detection systems
• a two-person rule for changes to code or hardware
• frequent scheduled password changes
• external testing and audit trails
• data encryption used both in storage and in transit, under the control of the user
• additional layers of user authentication and privilege
• vetting of employees with access to sensitive information or hardware
• internal traffic and server monitoring.
Having peace of mind about security is extremely important. Compliance with
industry standards as well as a consistent focus on security should be top of the
list. Insist on understanding the security components, certifications, and best
practices of your cloud provider.
290
Control: can a cloud contact center change how it operates quickly enough?
• Control, visibility and reporting: loss of control is of as much concern to some businesses as fears
over integration. A service provider may not be as responsive as an in-house team, and it may
take hours or even days to make changes to the system, so service level agreements should
include agreed response times
• Cultural considerations: making the move to cloud is seen as a far bigger proposition than
deciding whether to implement or replace a particular contact center application such as call
recording or workforce management. However, many vendors offer options for customers to
keep what they feel that they need on-site - for example call recordings and sensitive data -
while moving offsite the elements of the contact center solution that businesses are most
comfortable with outsourcing.
Integration & Customization: while out-of-the-box functionality can be quick and cheap enough to get
things moving, what if businesses need more a personalized approach? Being able to continue using
relevant existing CPE systems, and access databases and back-office systems is a minimum requirement
for all businesses considering cloud-based solutions. Some solution providers note that the private cloud
option is becoming more popular, where a third party is responsible for the management of dedicated
infrastructure, especially in environments which require complex integration and customization.
Performance & Reliability: how does cloud affect the contact center’s ability to deliver its service?
Service providers will test their systems on an ongoing basis, and a few will even guarantee their
availability to 99.999% (the '5 9s target of carrier-grade availability), backed by penalties if they do not
achieve this. This level of reliability is the standard for very large contact centers which have paid
significantly for this in a CPE environment, but is likely to be an improvement on what SMEs are used to,
with their much smaller budgets.
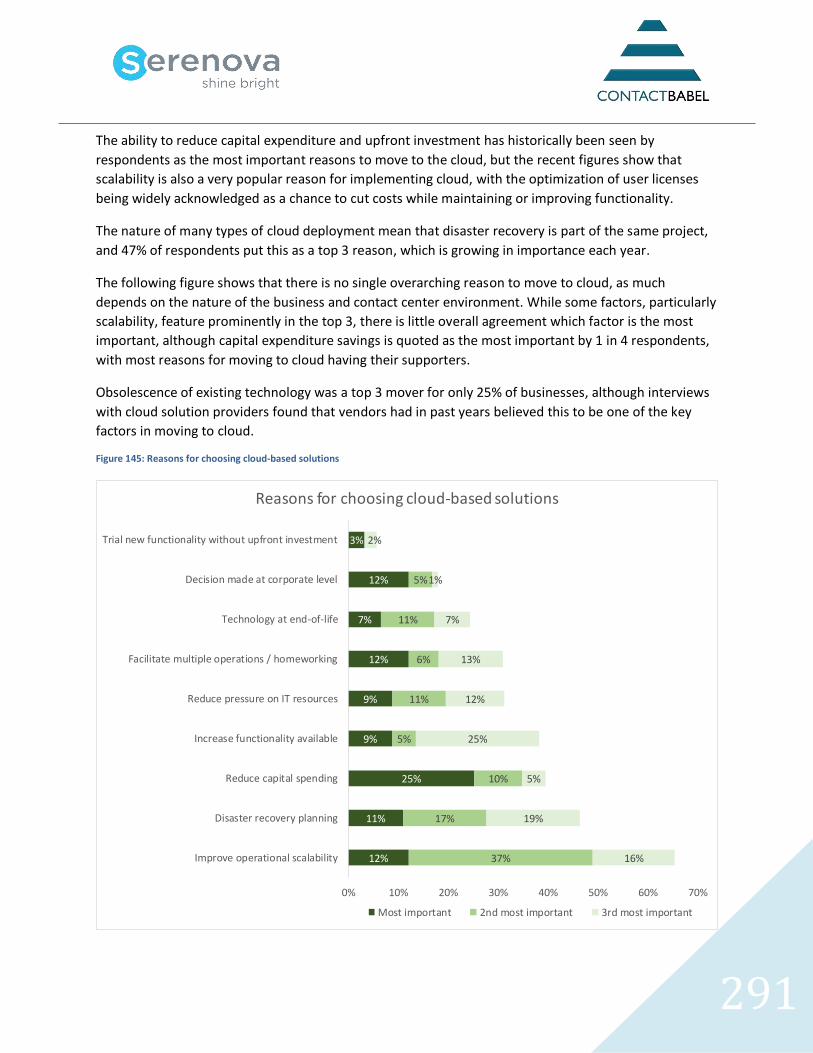
291
The ability to reduce capital expenditure and upfront investment has historically been seen by
respondents as the most important reasons to move to the cloud, but the recent figures show that
scalability is also a very popular reason for implementing cloud, with the optimization of user licenses
being widely acknowledged as a chance to cut costs while maintaining or improving functionality.
The nature of many types of cloud deployment mean that disaster recovery is part of the same project,
and 47% of respondents put this as a top 3 reason, which is growing in importance each year.
The following figure shows that there is no single overarching reason to move to cloud, as much
depends on the nature of the business and contact center environment. While some factors, particularly
scalability, feature prominently in the top 3, there is little overall agreement which factor is the most
important, although capital expenditure savings is quoted as the most important by 1 in 4 respondents,
with most reasons for moving to cloud having their supporters.
Obsolescence of existing technology was a top 3 mover for only 25% of businesses, although interviews
with cloud solution providers found that vendors had in past years believed this to be one of the key
factors in moving to cloud.
Figure 145: Reasons for choosing cloud-based solutions
12%
11%
25%
9%
9%
12%
7%
12%
3%
37%
17%
10%
5%
11%
6%
11%
5%
16%
19%
5%
25%
12%
13%
7%
1%
2%
0% 10% 20% 30% 40% 50% 60% 70%
Improve operational scalability
Disaster recovery planning
Reduce capital spending
Increase functionality available
Reduce pressure on IT resources
Facilitate multiple operations / homeworking
Technology at end-of-life
Decision made at corporate level
Trial new functionality without upfront investment
Reasons for choosing cloud-based solutions
Most important 2nd most important 3rd most important
292
CHECKLIST WHEN CHOOSING A CLOUD SOLUTION
Most cloud contact center solutions only require agents to have a standard telephone/USB headset and
an Internet connection from their desktop. Some cloud-based solution providers require software to be
downloaded upon the agent desktop, whereas others need only a standard Internet browser.
Security
There are various accreditations and certifications used by providers of cloud-based solutions, some
aimed at demonstrating the security of the datacenter (whether physical or virtual security) including
ISAE 3402 or SSAE 16 in North America (slated to be replaced by SSAE 18 at some point in 2017). Others
focus on the process of processing payment card data (PCI DSS), whereas others are around information
security controls (ISO 27001/2). Other interested parties include the Cloud Security Alliance, a not-for-
profit organization with a mission to promote the use of best practices for providing security assurance
within cloud computing as a whole. Potential customers should look for independent third-party
accreditation, proof of investment above and beyond the minimum required by regulation and regular
penetration testing.
The solution providers interviewed for this report were confident that the dedicated security procedures
and architecture in place within their solutions were likely to exceed those found in their clients'
previous contact center operations, having full-time dedicated security resources and a vested interest
in keeping client data safe. A security breach for in-house contact center is damaging and embarrassing;
for a cloud provider to suffer a similar failure would impact very severely on their credibility and the very
future of the company. However, as the National Institute of Standards and Technology (NIST) states in
its “Guidelines on Security and Privacy in Public Cloud Computing”, security should not be left simply to
the solution provider.
Solution providers note that while security concerns are still very much to the forefront of the
conversation, the questions that potential customers have are now far more sophisticated and
realistically founded compared to a few years ago. There is a great desire across the entire business to
ensure all security requirements are met, and much greater detail offered to the solution provider on
what is actually needed.
293
Functionality
Solution providers state that moving from a premise-based deployment to the cloud should not reduce
the functionality available to users. Potential cloud users are responsible for carrying out an audit of all
existing and required functionality, and how it relates to defined business processes, before asking
solution providers to guarantee that any move to cloud will include the required depth of functionality.
It is not enough simply to accept that solution providers have 'workforce management' or 'outbound'
capabilities. There is a great deal of upgrading and increased sophistication happening in the cloud
world, which in some cases is from quite basic functionality, so potential users should have a list of
specific processes and functionality that any solution should be able to deliver, and make sure that the
chosen solution can deliver that, as well as being able to view a product roadmap that is updated on a
regular basis (e.g. quarterly), which will project expected functionality a least a year in advance,
preferably more.
It is also important to understand the opportunities for scalability. Adding and shedding agents when
required is one of the big advantages that cloud computing has over its premise-based equivalent, but
potential users should put real-life scenarios in front of bidding suppliers to make sure that the required
level of scalability is possible and that no hidden costs or nasty surprises are associated with it.
Reliability
Multi-location datacenters are ubiquitous amongst cloud providers, providing redundancy and disaster
recovery as part of the deal. Stated levels of availability amongst cloud providers are typically 99.99% or
higher, and most are backed with performance-related guarantees, with reimbursement of fees if
targets are not met. While this is somewhat reassuring, it will do little to assuage the loss of revenue or
customer goodwill if the cloud-based contact center solution is unavailable for any amount of time.
Potential clients should investigate the exact levels of redundancy built into solutions, including the use
of alternative network providers and mirrored datacenters if the problem occurs outside the software
providers' purview.
Solution providers note that quality of service testing is vital to ensure that contact center network
traffic and any associated data processing has sufficient guaranteed bandwidth. For operations using
dynamic scripting, it is vital to ensure the fast and immediate reaction of input and response, and
guaranteeing network quality of service should be high on the implementation priority list.
294
Cost
Most cloud solution providers operate a per-agent/per-month option to pricing, with a minimum
number of logged-on agents per month being the baseline minimum cost. To this, the cost per minute of
calls made or delivered should be added, although many providers will offer this as part of the package,
to make fees more predictable. Additional costs for customization and integration should also be
investigated.
Integration and customization
Cloud vendors will keep APIs up-to-date, with screen-popping into a home-grown CRM system, look-up
of call recordings in a CRM system, and sending reporting and recordings to a third-party application
being mentioned as some of the more frequent integrations requested. Some providers have very close
relationships with specific CRM vendors, and as a general maxim, cloud-based contact center solutions
can be seen to be following in the footsteps of cloud-based CRM.
Some customization in existing operations may have come about as an ad-hoc 'work-around' that has
over time become the way in which things are done. It is important to revisit the business processes that
the technology is there to facilitate, to see if there are easier ways to achieve this rather than
reproducing the same method in a cloud-based environment.
295
Suggested process for choosing a cloud-based provider
The selection of most IT solutions is normally carried out in a similar way, but some steps you may wish
to consider for cloud-based solutions include:
• A selection team should be chosen with responsibility for all of the areas affected, including contact
center operations, IT, compliance, back-office, business operations and probably sales and
marketing
• While bearing in mind the underlying business processes that the technology supports, select the
specific technologies that are to be cloud-based, and also those bespoke applications that are to
remain in-house, such as specific complex reports. Take the opportunity to consider 'ideal world'
functionality as well
• Research the types of solution available in the market, and understand any actual differences
between premise-based and cloud-based functionality. Provide vendors with specific instances of
complex functionality and business processes required to meet your own particular requirements
and challenge them to prove that they can be met. This should include all instances of existing back-
office functionality that the solution needs to integrate with and where possible, a wish-list of
functionality in the future
• Investigate publicly-available referenceable sites from cloud-based providers that are similar to your
own requirements, and submit an RPF (request for proposal) to the long-list. Request a detailed
product roadmap along with timescales in order to assess whether this solution will meet your
demands along the line. You may wish to invite solution providers informally to demonstrate their
product before offering an RFP. Potential clients should look closely at the vendor's financial
position and backing to make sure that the quality of service and level of innovation can be
maintained in the future, also that they have the technological expertise in-house to keep making
these improvements
• Any response to an RFP should include service level agreements over availability, call delivery, voice
quality, speed to make requested changes, support hours and availability, details of security and
redundancy offered, prices for customization, contract length options, implementation times,
contract cancellation penalties and notice periods.
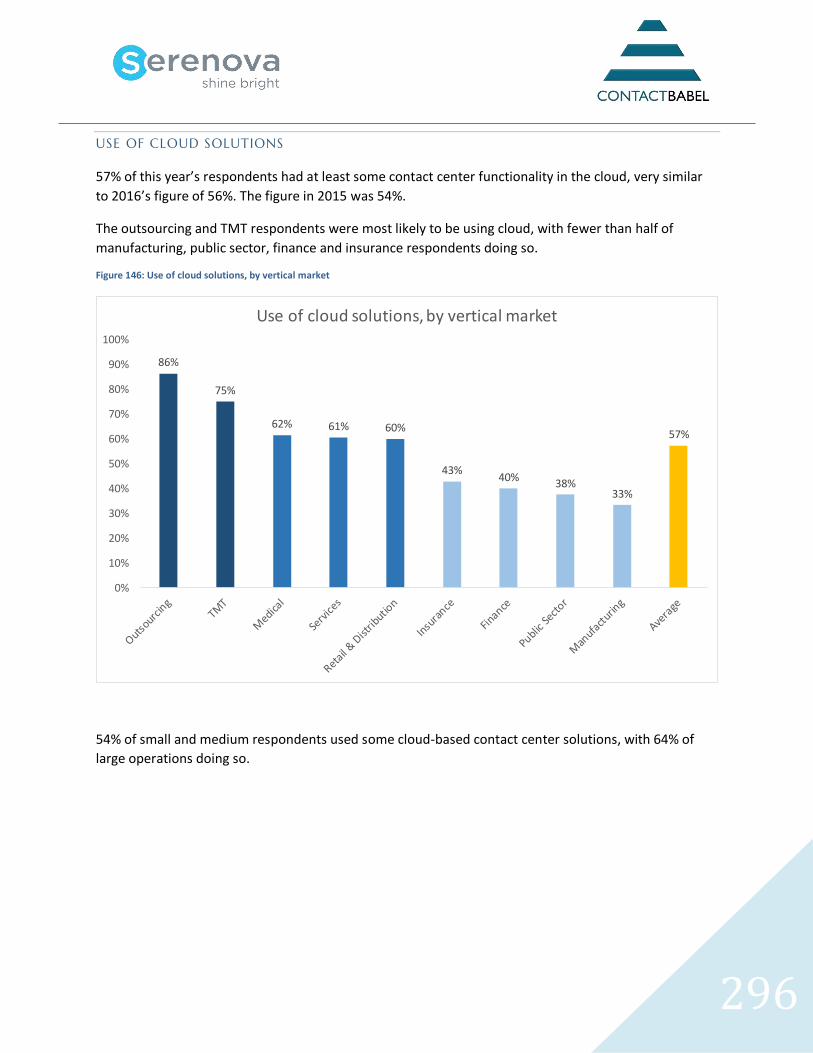
296
USE OF CLOUD SOLUTIONS
57% of this year’s respondents had at least some contact center functionality in the cloud, very similar
to 2016’s figure of 56%. The figure in 2015 was 54%.
The outsourcing and TMT respondents were most likely to be using cloud, with fewer than half of
manufacturing, public sector, finance and insurance respondents doing so.
Figure 146: Use of cloud solutions, by vertical market
54% of small and medium respondents used some cloud-based contact center solutions, with 64% of
large operations doing so.
86%
75%
62% 61% 60%
43%40%
38%33%
57%
0%
10%
20%
30%
40%
50%
60%
70%
80%
90%
100%
Use of cloud solutions, by vertical market
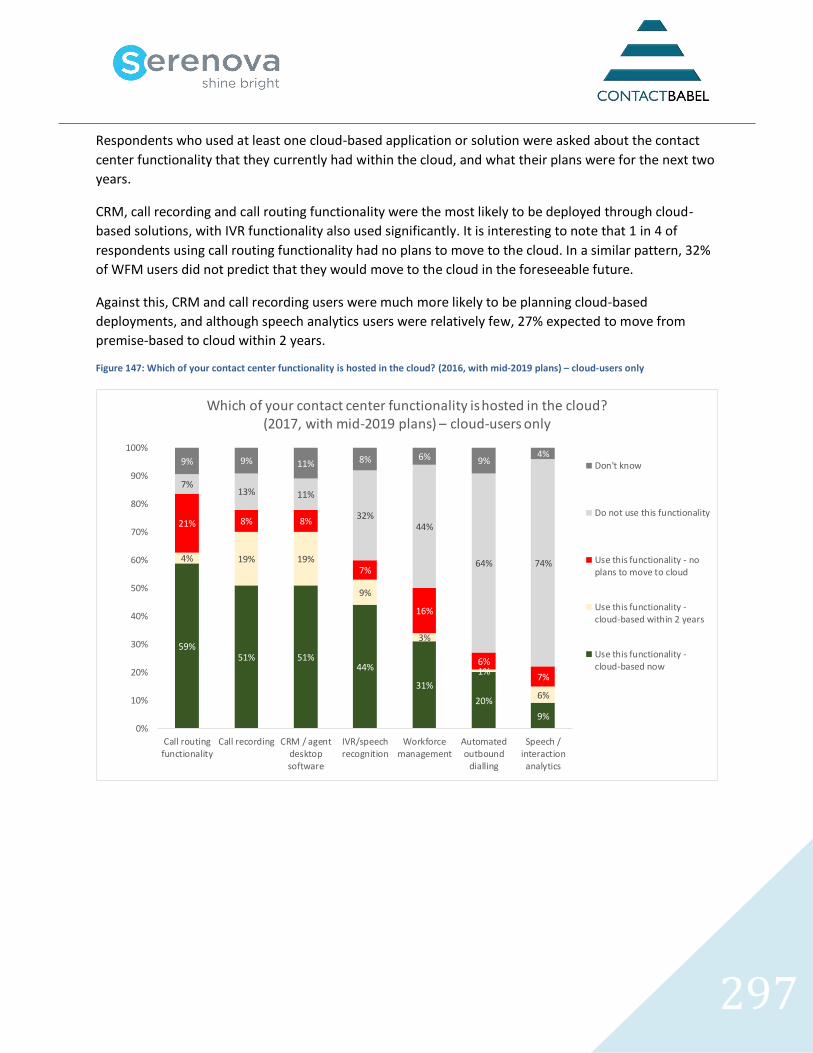
297
Respondents who used at least one cloud-based application or solution were asked about the contact
center functionality that they currently had within the cloud, and what their plans were for the next two
years.
CRM, call recording and call routing functionality were the most likely to be deployed through cloud-
based solutions, with IVR functionality also used significantly. It is interesting to note that 1 in 4 of
respondents using call routing functionality had no plans to move to the cloud. In a similar pattern, 32%
of WFM users did not predict that they would move to the cloud in the foreseeable future.
Against this, CRM and call recording users were much more likely to be planning cloud-based
deployments, and although speech analytics users were relatively few, 27% expected to move from
premise-based to cloud within 2 years.
Figure 147: Which of your contact center functionality is hosted in the cloud? (2016, with mid-2019 plans) – cloud-users only
59%51% 51%
44%
31%
20%
9%
4% 19% 19%
9%
3%
1%
6%
21% 8% 8%
7%
16%
6%
7%
7%13% 11%
32%44%
64% 74%
9% 9% 11% 8% 6% 9%4%
0%
10%
20%
30%
40%
50%
60%
70%
80%
90%
100%
Call routingfunctionality
Call recording CRM / agentdesktopsoftware
IVR/speechrecognition
Workforcemanagement
Automatedoutbound
dialling
Speech /interaction
analytics
Which of your contact center functionality is hosted in the cloud? (2017, with mid-2019 plans) – cloud-users only
Don't know
Do not use this functionality
Use this functionality - noplans to move to cloud
Use this functionality -cloud-based within 2 years
Use this functionality -cloud-based now
SERENOVA THOUGHT LEADERSHIP
Six Steps to Capture, Understand and Adopt the Voice of Your Customer in the Contact Center
Understanding the customer is key to the success of any company- but very few companies truly understand what their customers want versus what they need. which are two very different
things. That's where the 'Voice of the Customer" (VOC) comes into play. It's a process used to capture both qualitative and quantitative information from a myriad of customers. including
requirements. preferences and feedback. That information is then used to help a company deliver the best quality service/product. And to do it right. companies must track and accommodate
changing customer requirements and expectations to ensure continued success.
The contact center presents an ideal place to implement an ongoing voe process and
encourage two-way conversations. Here are six steps to capture. understand and adopt the voe
in your contact center:
•
•
•
•
•
Implement your information gathering tools. Try customer surveys. focus groups or individual interviews. Review complaints. compliments and comments in a few placessocial media. review sites (Glassdoor. Yelp. etc.) and your customer database - to gather some significant data. It's also important to ask your agents because they interact with and hear feedback straight from the customer's mouth.
Analyze the data. Read every piece of feedback to really get into the mind of your customer. Look for trends as well as outliers. Decide how to best relay that information and make it easily understandable and actionable .
Compare the results to your company or product strategy. Examine how this new data compares to your original company or product plans. Are customers saying the same things or is the feedback all over the place? Is there anything new or different? Can you realistically make the changes customers are requesting?
Take action. You've got the information and the insights-now it's time to put them to work. Use these insights as a tool to implement improvements across your company such as a change to your approach to customer service. your product offerings or even your methods of communication .
Close the loop. Show customers you took their feedback seriously and made changes based on that. This is an important opportunity to remind them that your company is focused on the customer experience and they are important and valued.
Implementing a VOC process is admittedly not quick or simple but the payoffs can be company-changing. Following these steps will empower your company with a better understanding of your customers· wants. needs and most of all. their voice. Having a
VOC process in place. both during product development and after. is critical to improving your company and strengthening relationships with your customers.
Learn more at www.serenova.com.
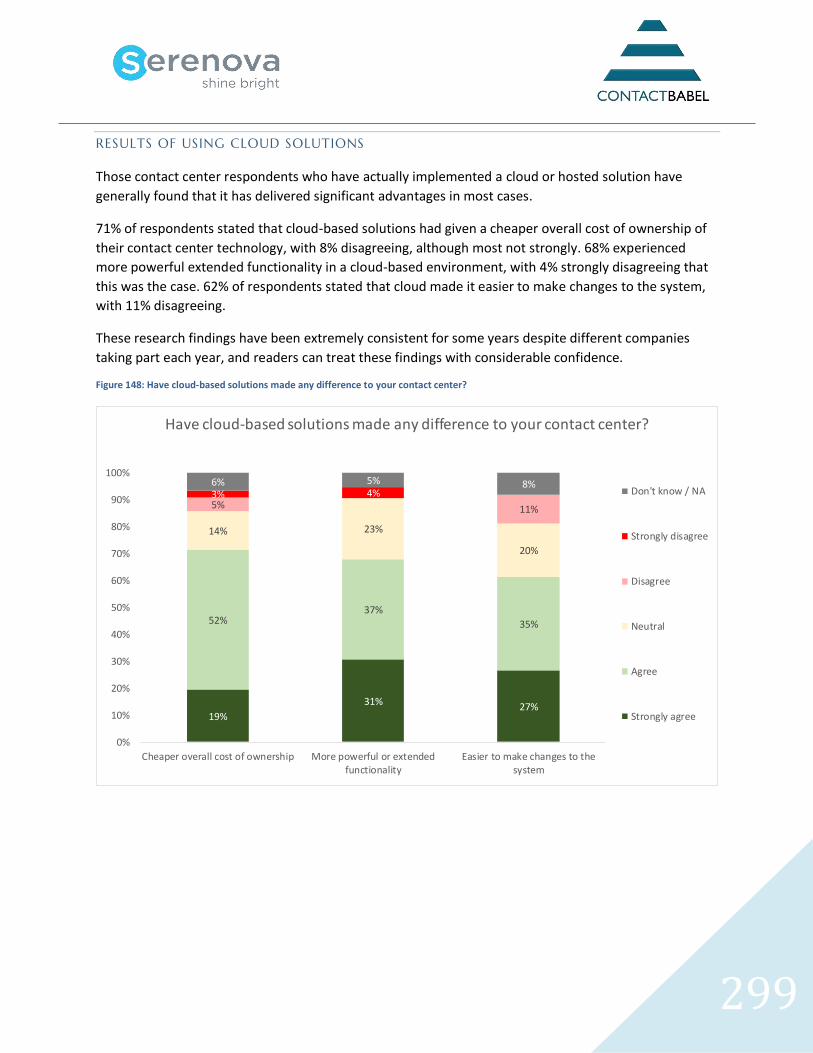
299
RESULTS OF USING CLOUD SOLUTIONS
Those contact center respondents who have actually implemented a cloud or hosted solution have
generally found that it has delivered significant advantages in most cases.
71% of respondents stated that cloud-based solutions had given a cheaper overall cost of ownership of
their contact center technology, with 8% disagreeing, although most not strongly. 68% experienced
more powerful extended functionality in a cloud-based environment, with 4% strongly disagreeing that
this was the case. 62% of respondents stated that cloud made it easier to make changes to the system,
with 11% disagreeing.
These research findings have been extremely consistent for some years despite different companies
taking part each year, and readers can treat these findings with considerable confidence.
Figure 148: Have cloud-based solutions made any difference to your contact center?
19%
31% 27%
52%37%
35%
14% 23%
20%
5% 11%
3% 4%6% 5% 8%
0%
10%
20%
30%
40%
50%
60%
70%
80%
90%
100%
Cheaper overall cost of ownership More powerful or extendedfunctionality
Easier to make changes to thesystem
Have cloud-based solutions made any difference to your contact center?
Don't know / NA
Strongly disagree
Disagree
Neutral
Agree
Strongly agree
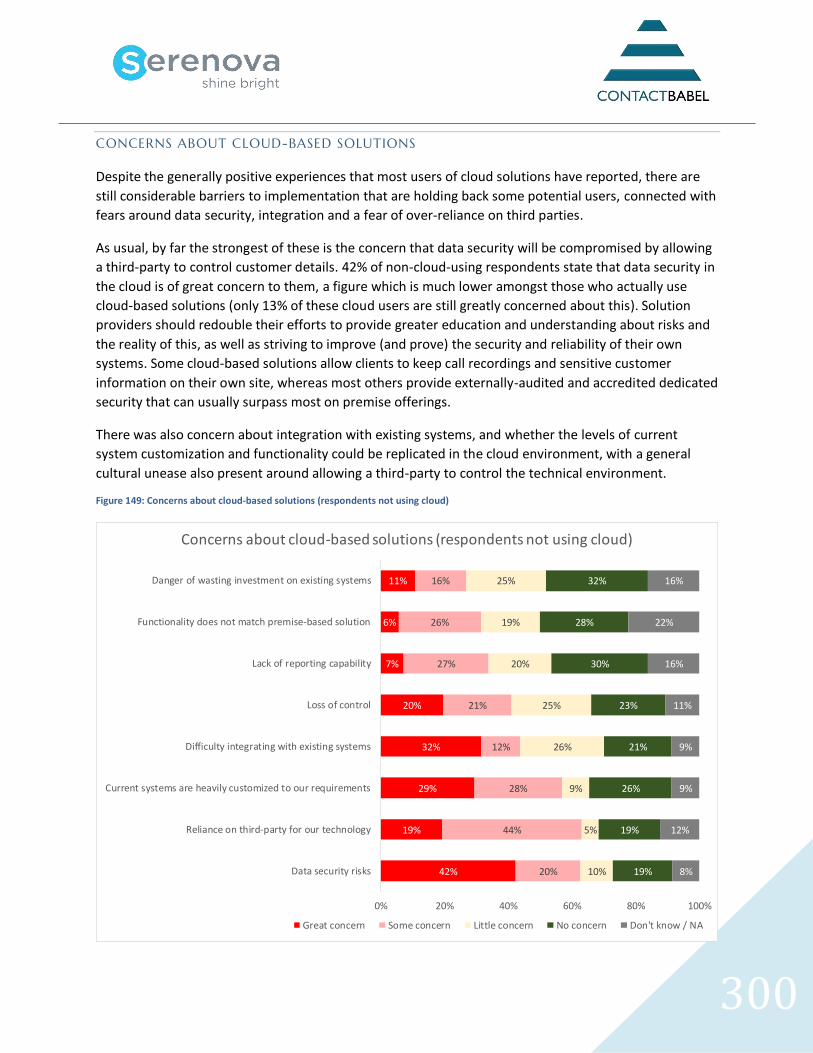
300
CONCERNS ABOUT CLOUD-BASED SOLUTIONS
Despite the generally positive experiences that most users of cloud solutions have reported, there are
still considerable barriers to implementation that are holding back some potential users, connected with
fears around data security, integration and a fear of over-reliance on third parties.
As usual, by far the strongest of these is the concern that data security will be compromised by allowing
a third-party to control customer details. 42% of non-cloud-using respondents state that data security in
the cloud is of great concern to them, a figure which is much lower amongst those who actually use
cloud-based solutions (only 13% of these cloud users are still greatly concerned about this). Solution
providers should redouble their efforts to provide greater education and understanding about risks and
the reality of this, as well as striving to improve (and prove) the security and reliability of their own
systems. Some cloud-based solutions allow clients to keep call recordings and sensitive customer
information on their own site, whereas most others provide externally-audited and accredited dedicated
security that can usually surpass most on premise offerings.
There was also concern about integration with existing systems, and whether the levels of current
system customization and functionality could be replicated in the cloud environment, with a general
cultural unease also present around allowing a third-party to control the technical environment.
Figure 149: Concerns about cloud-based solutions (respondents not using cloud)
42%
19%
29%
32%
20%
7%
6%
11%
20%
44%
28%
12%
21%
27%
26%
16%
10%
5%
9%
26%
25%
20%
19%
25%
19%
19%
26%
21%
23%
30%
28%
32%
8%
12%
9%
9%
11%
16%
22%
16%
0% 20% 40% 60% 80% 100%
Data security risks
Reliance on third-party for our technology
Current systems are heavily customized to our requirements
Difficulty integrating with existing systems
Loss of control
Lack of reporting capability
Functionality does not match premise-based solution
Danger of wasting investment on existing systems
Concerns about cloud-based solutions (respondents not using cloud)
Great concern Some concern Little concern No concern Don't know / NA
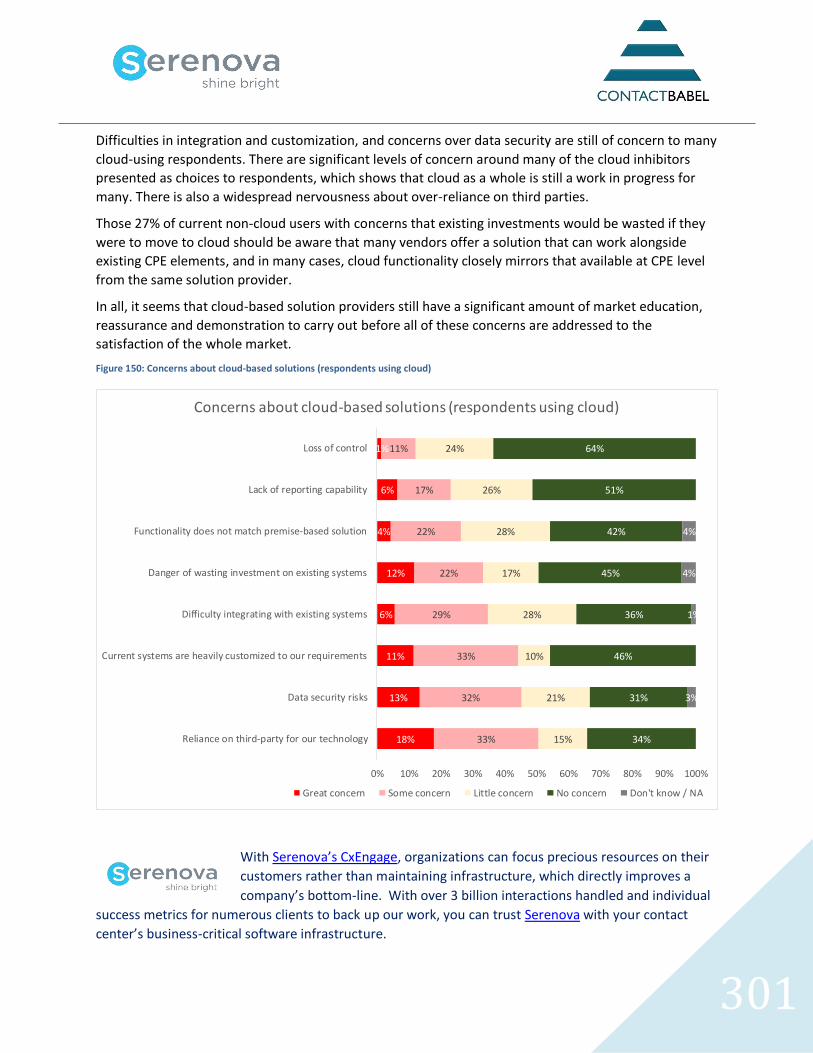
301
Difficulties in integration and customization, and concerns over data security are still of concern to many
cloud-using respondents. There are significant levels of concern around many of the cloud inhibitors
presented as choices to respondents, which shows that cloud as a whole is still a work in progress for
many. There is also a widespread nervousness about over-reliance on third parties.
Those 27% of current non-cloud users with concerns that existing investments would be wasted if they
were to move to cloud should be aware that many vendors offer a solution that can work alongside
existing CPE elements, and in many cases, cloud functionality closely mirrors that available at CPE level
from the same solution provider.
In all, it seems that cloud-based solution providers still have a significant amount of market education,
reassurance and demonstration to carry out before all of these concerns are addressed to the
satisfaction of the whole market.
Figure 150: Concerns about cloud-based solutions (respondents using cloud)
With Serenova’s CxEngage, organizations can focus precious resources on their
customers rather than maintaining infrastructure, which directly improves a
company’s bottom-line. With over 3 billion interactions handled and individual
success metrics for numerous clients to back up our work, you can trust Serenova with your contact
center’s business-critical software infrastructure.
18%
13%
11%
6%
12%
4%
6%
1%
33%
32%
33%
29%
22%
22%
17%
11%
15%
21%
10%
28%
17%
28%
26%
24%
34%
31%
46%
36%
45%
42%
51%
64%
3%
1%
4%
4%
0% 10% 20% 30% 40% 50% 60% 70% 80% 90% 100%
Reliance on third-party for our technology
Data security risks
Current systems are heavily customized to our requirements
Difficulty integrating with existing systems
Danger of wasting investment on existing systems
Functionality does not match premise-based solution
Lack of reporting capability
Loss of control
Concerns about cloud-based solutions (respondents using cloud)
Great concern Some concern Little concern No concern Don't know / NA
302
PROACTIVE CUSTOMER SERVICE
Inbound calls account for 80% of US contact center telephony activity, and with the sector as a whole
spending over $200 billion each year to service their customers, reducing inbound call volumes through
proactively servicing customers before they contact the business offers huge opportunity both for cost
reduction and improved customer experience.
Recent years have seen significant adoption of proactive customer service, especially through the digital
channels such as email and SMS. Order confirmations, delivery notifications and appointment reminders
all inform and reassure the customer, who might otherwise feel the need to call the contact center for a
reason that may prove unnecessary.
This chapter looks at two types of proactive service: digital and live. Although digital channels are
generally a far more cost-effective way of providing proactive service, there are many occasions - due to
complexity, urgency or the requirements and preferences of the specific customer - where live contact is
necessary.
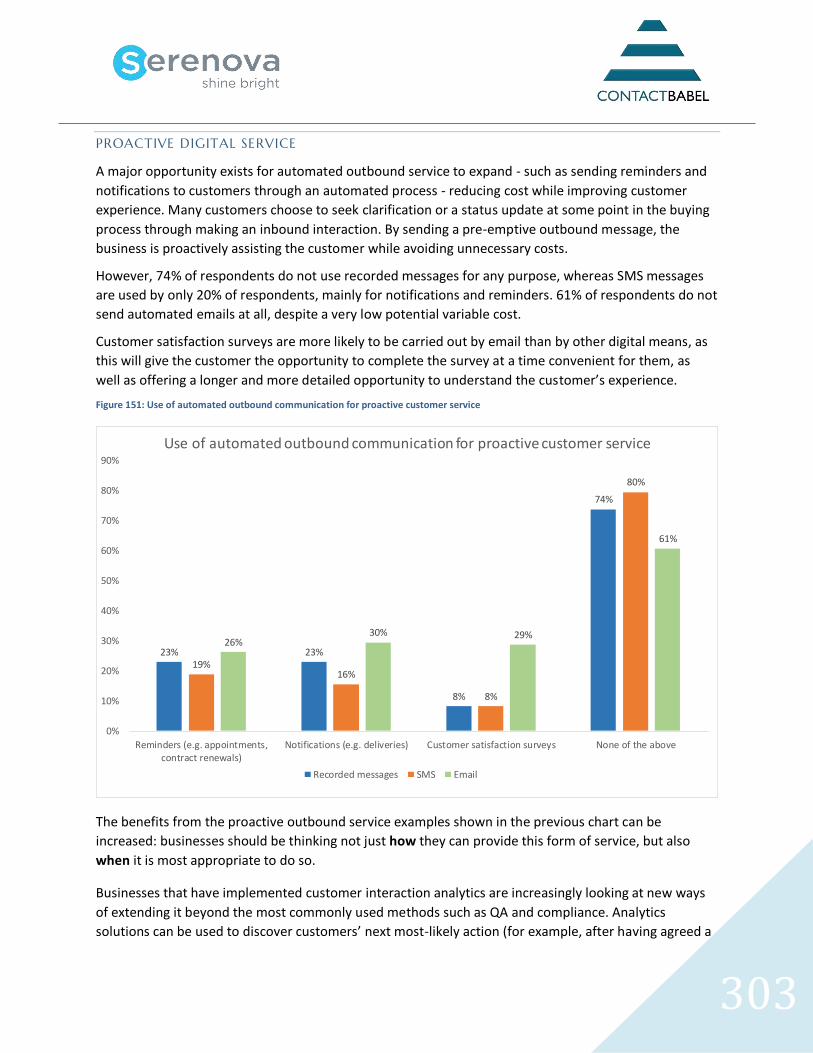
303
PROACTIVE DIGITAL SERVICE
A major opportunity exists for automated outbound service to expand - such as sending reminders and
notifications to customers through an automated process - reducing cost while improving customer
experience. Many customers choose to seek clarification or a status update at some point in the buying
process through making an inbound interaction. By sending a pre-emptive outbound message, the
business is proactively assisting the customer while avoiding unnecessary costs.
However, 74% of respondents do not use recorded messages for any purpose, whereas SMS messages
are used by only 20% of respondents, mainly for notifications and reminders. 61% of respondents do not
send automated emails at all, despite a very low potential variable cost.
Customer satisfaction surveys are more likely to be carried out by email than by other digital means, as
this will give the customer the opportunity to complete the survey at a time convenient for them, as
well as offering a longer and more detailed opportunity to understand the customer’s experience.
Figure 151: Use of automated outbound communication for proactive customer service
The benefits from the proactive outbound service examples shown in the previous chart can be
increased: businesses should be thinking not just how they can provide this form of service, but also
when it is most appropriate to do so.
Businesses that have implemented customer interaction analytics are increasingly looking at new ways
of extending it beyond the most commonly used methods such as QA and compliance. Analytics
solutions can be used to discover customers’ next most-likely action (for example, after having agreed a
23% 23%
8%
74%
19%16%
8%
80%
26%30% 29%
61%
0%
10%
20%
30%
40%
50%
60%
70%
80%
90%
Reminders (e.g. appointments,contract renewals)
Notifications (e.g. deliveries) Customer satisfaction surveys None of the above
Use of automated outbound communication for proactive customer service
Recorded messages SMS Email
304
loan over the phone, what proportion of customers will call back within five days to check the status of
the process?). If patterns emerge, businesses have the opportunity to implement automated processes
that can lead to significant unnecessary call avoidance while saving the customer a job. This can be done
for all customers, or even at a one-to-one level, for example, personalizing the IVR menu to reflect the
most frequent choices of a particular customer.
Earlier in this report, it was shown that few businesses can escalate an inbound interaction seamlessly
from a digital to a live channel, increasing the duration of the call and frustrating the customer. By
anticipating the customer’s likely requirements, the inbound interaction can be removed entirely from
the equation. Furthermore, a mix of digital and automated channels can be used to provide proactive
service in the most appropriate fashion based upon factors such as customer demographic, formerly-
expressed channel preference and even time of day.
The 2x2x2 customer interaction matrix shown in the earlier Omnichannel chapter can be of use to
businesses providing proactive service, as well as handling inbound interactions. This matrix, which
maps the complexity, urgency and emotional importance of the interactions, suggesting suitable
channels, can also be applied to outbound work. Businesses may decide that simple but emotionally
important notifications should be handled with a live outbound call, giving the customer opportunities
to clarify any questions that may arise, while making sure that the customer has definitely received the
information, a reassurance that digital channels cannot always provide.
Proactive outbound service can also be used to guide customers to further information that they may
find useful, offering links to self-service and virtual agent web chat. Findings earlier in this report
indicate that around 20% of digital interactions require further contact with live agents, so it is vital that
the solution being used offers a seamless and contextual escalation option to live service if required.
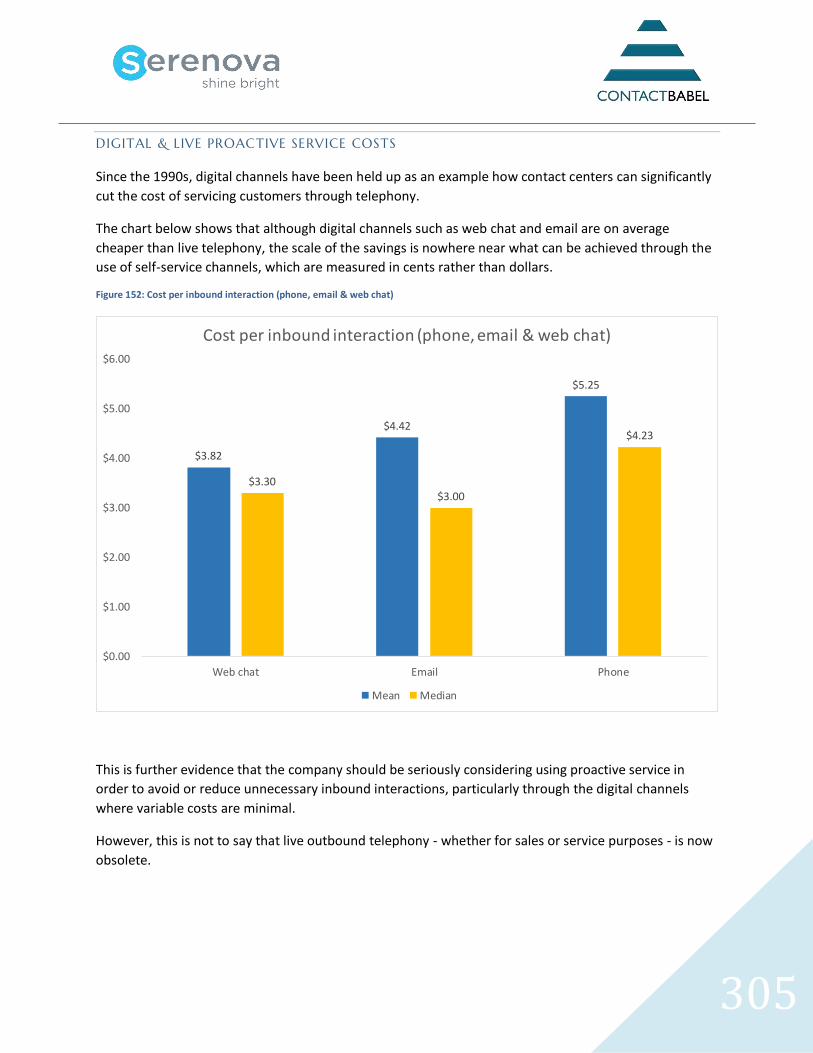
305
DIGITAL & LIVE PROACTIVE SERVICE COSTS
Since the 1990s, digital channels have been held up as an example how contact centers can significantly
cut the cost of servicing customers through telephony.
The chart below shows that although digital channels such as web chat and email are on average
cheaper than live telephony, the scale of the savings is nowhere near what can be achieved through the
use of self-service channels, which are measured in cents rather than dollars.
Figure 152: Cost per inbound interaction (phone, email & web chat)
This is further evidence that the company should be seriously considering using proactive service in
order to avoid or reduce unnecessary inbound interactions, particularly through the digital channels
where variable costs are minimal.
However, this is not to say that live outbound telephony - whether for sales or service purposes - is now
obsolete.
$3.82
$4.42
$5.25
$3.30$3.00
$4.23
$0.00
$1.00
$2.00
$3.00
$4.00
$5.00
$6.00
Web chat Email Phone
Cost per inbound interaction (phone, email & web chat)
Mean Median
306
PROACTIVE LIVE SERVICE
CURRENT OUTBOUND ACTIVITY
The traditional outbound call was simply about selling more products to new and existing customers.
However, legislation and customer pressure impacted on cold calling, and the past years have seen an
increasing proportion of outbound calling being made to existing customers, either to deliver customer
care or to inform them proactively about events and circumstances which affect them.
Outbound calling is fundamentally different from inbound, and - facing significant and growing cultural
and legislative issues - must be managed sensitively:
• the nature of outbound is intrusive and usually driven by the needs of the business rather than
the customer (except in cases of call-back requests and for proactive outbound service)
• this means that customers are more likely to be defensive and wary of the purpose of the call.
Trust needs to be built very quickly in order to overcome this negative start point: having the
right information about the customer to hand will improve the experience for both agent and
customer
• outbound work can be very hard on agents: few people actively welcome most outbound calls,
and persistent refusal, lack of interest and rudeness can be very wearing for agents, especially if
productivity-enhancing technology such as dialers are being used. Management should consider
ways of alleviating agent stress, through sensible scheduling and call blending, judicious use of
technology, focused training and improving working environments, amongst other ways
• especially where the technology exists to do so, it can be tempting to treat outbound calling
campaigns as an exercise in maximizing call volumes and (theoretically) revenues. However, this
can result in brand damage and high staff attrition rates through over-pressured and exhausted
agents delivering poorer quality interactions
• there has been a tendency to use offshore contact centers for low-value outbound sales
campaigns which would otherwise be unprofitable to run. However, the same high standards of
training and support are needed by offshore agents to do their job properly: too many
businesses simply put the agents on a dialer with an inflexible script in front of them and then
wonder why their customers and prospects become negative towards their brand
• tough legislation has emerged which is reducing the amount of cold calling which businesses can
do. Cold calling is illegal in Germany, and the Do-Not-Call register in the US and the Telephone
Preference Scheme in the UK in theory allow customers to opt out of receiving any sales calls.
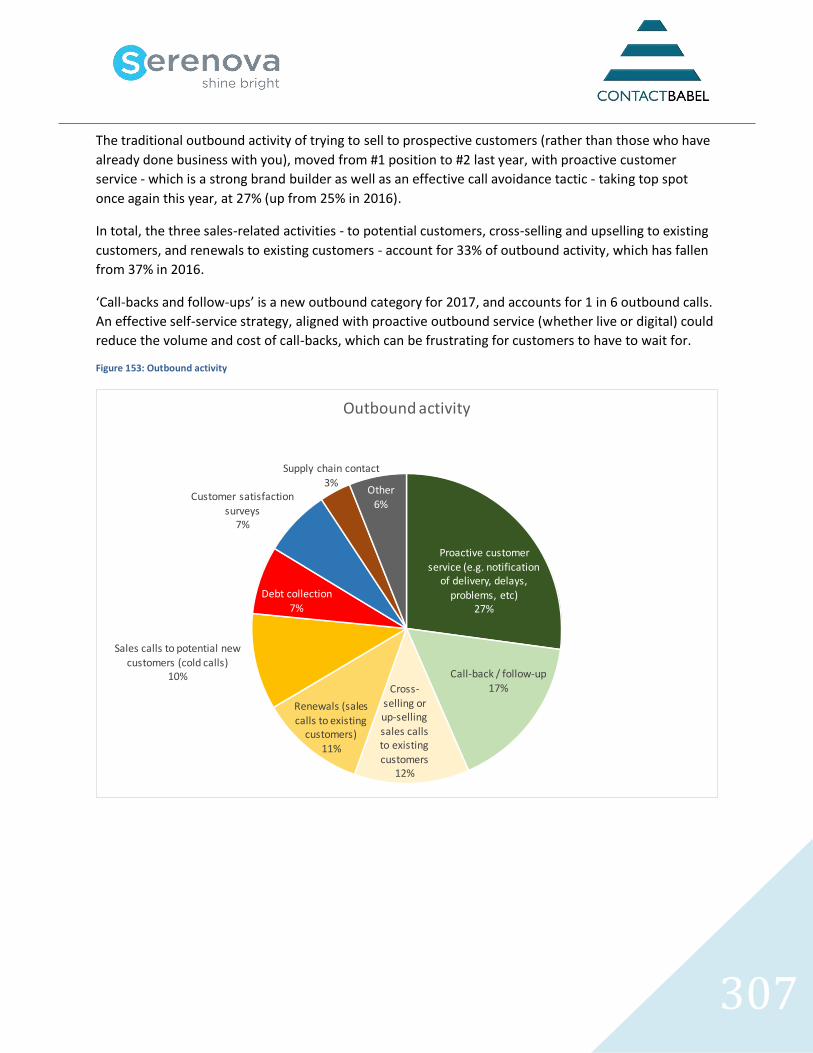
307
The traditional outbound activity of trying to sell to prospective customers (rather than those who have
already done business with you), moved from #1 position to #2 last year, with proactive customer
service - which is a strong brand builder as well as an effective call avoidance tactic - taking top spot
once again this year, at 27% (up from 25% in 2016).
In total, the three sales-related activities - to potential customers, cross-selling and upselling to existing
customers, and renewals to existing customers - account for 33% of outbound activity, which has fallen
from 37% in 2016.
‘Call-backs and follow-ups’ is a new outbound category for 2017, and accounts for 1 in 6 outbound calls.
An effective self-service strategy, aligned with proactive outbound service (whether live or digital) could
reduce the volume and cost of call-backs, which can be frustrating for customers to have to wait for.
Figure 153: Outbound activity
Proactive customer service (e.g. notification
of delivery, delays, problems, etc)
27%
Call-back / follow-up17%Cross-
selling or up-selling sales calls to existing customers
12%
Renewals (sales calls to existing
customers)11%
Sales calls to potential new customers (cold calls)
10%
Debt collection7%
Customer satisfaction surveys
7%
Supply chain contact3%
Other6%
Outbound activity
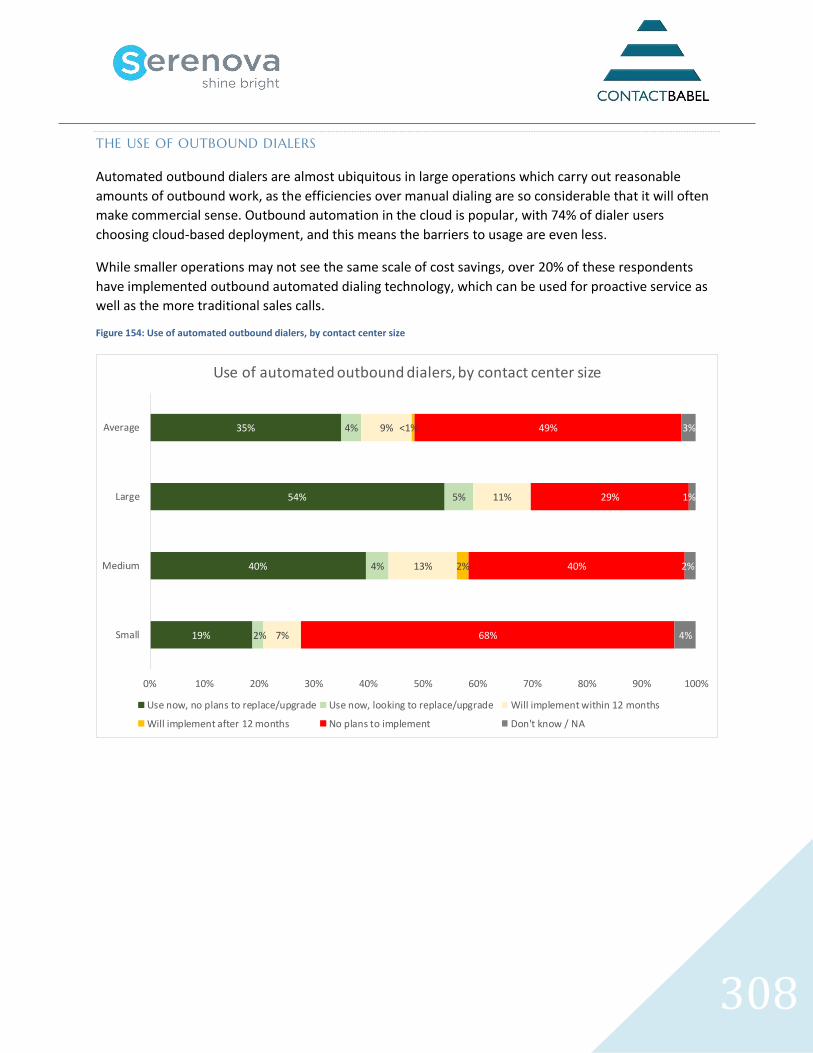
308
THE USE OF OUTBOUND DIALERS
Automated outbound dialers are almost ubiquitous in large operations which carry out reasonable
amounts of outbound work, as the efficiencies over manual dialing are so considerable that it will often
make commercial sense. Outbound automation in the cloud is popular, with 74% of dialer users
choosing cloud-based deployment, and this means the barriers to usage are even less.
While smaller operations may not see the same scale of cost savings, over 20% of these respondents
have implemented outbound automated dialing technology, which can be used for proactive service as
well as the more traditional sales calls.
Figure 154: Use of automated outbound dialers, by contact center size
19%
40%
54%
35%
2%
4%
5%
4%
7%
13%
11%
9%
2%
<1%
68%
40%
29%
49%
4%
2%
1%
3%
0% 10% 20% 30% 40% 50% 60% 70% 80% 90% 100%
Small
Medium
Large
Average
Use of automated outbound dialers, by contact center size
Use now, no plans to replace/upgrade Use now, looking to replace/upgrade Will implement within 12 months
Will implement after 12 months No plans to implement Don't know / NA
309
DIGITAL AND TELEPHONY BLENDING
Call blending is an element of outbound calling which has had to fight against the conventional wisdom
of the traditional contact center industry, which implies that the more one can segregate the contact
center into a series of production lines, the better-run the operation will be.
Call blending gives the ability to deliver both inbound and outbound calls seamlessly to the agent,
regulating outbound call volume based on inbound traffic. When inbound traffic is low, outbound calls
are automatically generated for a specified campaign. When inbound traffic picks up, the dialer
dynamically slows the number of outgoing calls to meet the inbound service level. Results can include
increased agent productivity, streamlined staffing, and improved customer service. However, this
process needs to be understood and managed carefully, as not all agents are adept at dealing with both
inbound and outbound calls.
Sales to both new and existing customers are obviously still key reasons why companies carry out
outbound calls, and the hybrid method - customer service leading to a cross-sell/up-sell opportunity - is
seen a good way of circumventing the increasing numbers of people registering for the Do Not Call
Register. However, businesses must be careful not to pester customers or abuse the relationship they
have built up with frequent calls about products and services that are not tailored to the customer.
Increasingly, turning an inbound service call into a cross-sell or upselling opportunity has become a
widely-use tactic.
A contact center handling different processes involving customer service, sales orders, and outbound
telemarketing will have different groups of agents with specific skills for these areas. Some agents are
more capable and adaptable than others, and can be used as blended agents. For example, these agents
may have a primary responsibility to handle inbound calls, but when the inbound call volume drops, the
dialer will send a message to these agents indicating that they have been switched to outbound mode
and start offering outbound calls to them. Where relevant, a CTI-type link will prompt a script for the
outbound calls to run on the agent desktop and depending on the call volume in the inbound queue, the
agents will be switched automatically, improving productivity. However, if there is a constant switching
from inbound to outbound and back again, the agent may lose concentration and the productivity may
go down.
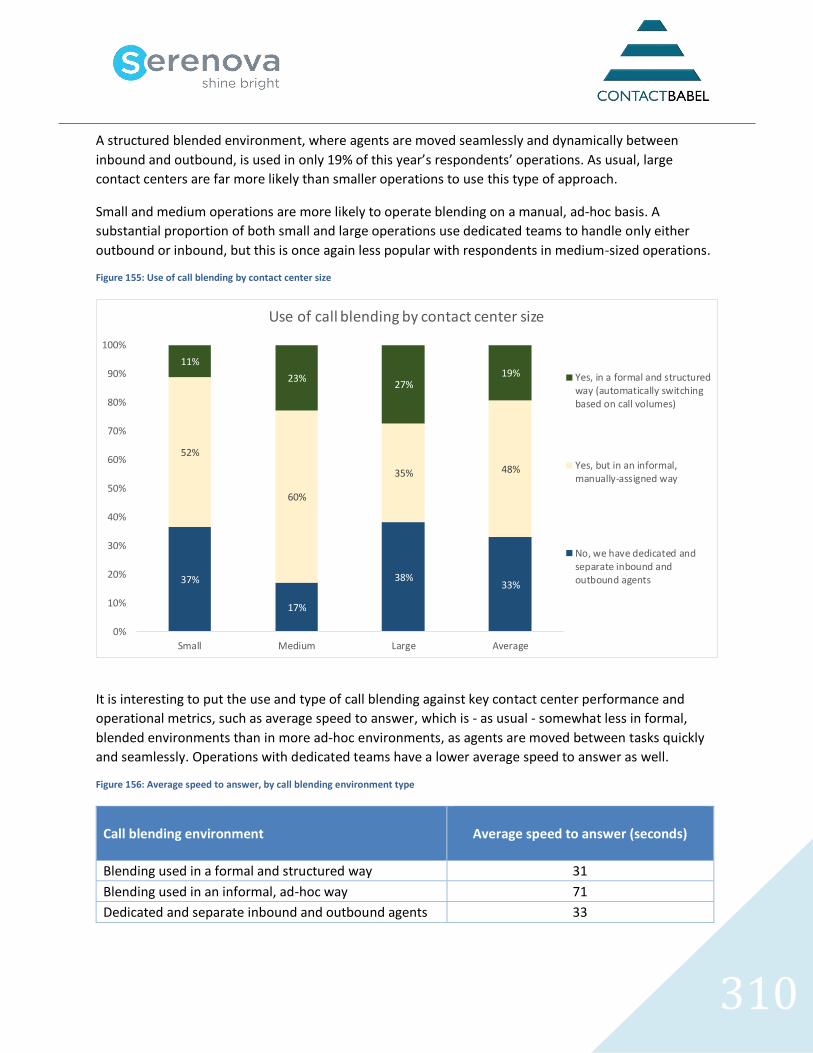
310
A structured blended environment, where agents are moved seamlessly and dynamically between
inbound and outbound, is used in only 19% of this year’s respondents’ operations. As usual, large
contact centers are far more likely than smaller operations to use this type of approach.
Small and medium operations are more likely to operate blending on a manual, ad-hoc basis. A
substantial proportion of both small and large operations use dedicated teams to handle only either
outbound or inbound, but this is once again less popular with respondents in medium-sized operations.
Figure 155: Use of call blending by contact center size
It is interesting to put the use and type of call blending against key contact center performance and
operational metrics, such as average speed to answer, which is - as usual - somewhat less in formal,
blended environments than in more ad-hoc environments, as agents are moved between tasks quickly
and seamlessly. Operations with dedicated teams have a lower average speed to answer as well.
Figure 156: Average speed to answer, by call blending environment type
Call blending environment
Average speed to answer (seconds)
Blending used in a formal and structured way 31
Blending used in an informal, ad-hoc way 71
Dedicated and separate inbound and outbound agents 33
37%
17%
38%33%
52%
60%
35% 48%
11%
23%27%
19%
0%
10%
20%
30%
40%
50%
60%
70%
80%
90%
100%
Small Medium Large Average
Use of call blending by contact center size
Yes, in a formal and structuredway (automatically switchingbased on call volumes)
Yes, but in an informal,manually-assigned way
No, we have dedicated andseparate inbound andoutbound agents
311
When considering the digital channels, respondents from small and medium contact centers tend to
take phone agents out of the queue to handle web chats on an ad-hoc basis, or as part of a mixed
voice/digital queue. Respondents from large operations are more likely than smaller contact centers to
use dedicated chat agents or multi-channel digital agents (e.g. handling social media or email).
This fits in with the model generally seen with telephony blending, and suggests that the digital channels
are also sub-optimally resourced and are likely to be incurring unnecessary costs. As such, this is more
evidence for the need to consider proactive service to stop avoidable inbound communications,
whether through digital or phone channels: while blending offers flexibility, it’s better to avoid having to
take the calls or digital interactions in the first place, by anticipating what customers will ask.
312
STAFFING MANAGEMENT
With staffing accounting for up to 75% of a contact center’s operational cost, issues such as attrition,
recruitment and training are always towards the front of any contact center manager's mind. This
section looks at how time and money are spent on the human element to contact centers.
This chapter contains detailed information around contact center HR benchmarks such as attrition and
absence.
"The 2017/18 US Contact Center HR and Operational Benchmarking Report" also gives detailed analysis
of salaries, bonuses, training methods and costs, segmented by vertical market, contact center size and
contact center activity type where relevant. Historical trends are observed with a view to predicting
what future standards will look like.
The report also contains operational benchmarks such as speed to answer, call abandonment rates, call
duration, call transfer rate, cost per call, agent occupancy, target service levels and first-call resolution
rates.
313
ATTRITION
Throughout the studies that ContactBabel has carried out over the years, whether in the US or Europe,
staff attrition has consistently been quoted as one of the major worries of contact center management.
Along with staff absences, a high level of unchecked attrition has a two-headed effect: first, it raises
recruitment and staffing costs; second, it has a ripple effect that can cripple a contact center’s ability to
provide an acceptable level of service, creating a negative customer experience, and placing massive
stress on those agents who are left.
While the recession reduced attrition considerably, this was only a temporary respite: with no structural
change to the industry, its recruitment and training methods, management techniques or job types, the
same problems have emerged as the economy recovers.
Successful and sustainable reduction of attrition has two main factors - that the successful candidates
are suited to, and competent for the work which they will undertake, and that the work and conditions
in which they find themselves will be conducive to a long-term stay. Organizational behavior research
over the last several years suggests that the emotional makeup of work teams has a dramatic effect on
critical organizational outcomes such as job performance, attrition, customer satisfaction and
leadership. Identifying a job candidate’s emotional makeup - or “affect” in academic speak - can have
long-lasting and significant implications for how effective the overall organization can be. Using
programmatic methods to measure this can also improve the overall effectiveness of the recruiting
function within the company.
Understanding the 0-to-90 day attrition data is critical to being able to reduce attrition, as a substantial
amount of annualized attrition occurs in the first 90 days after recruitment, and high 90-day attrition
rates are indicative of people who should never have been employed in the first place, and who are all
but doomed to failure by their unsuitability for the task. Businesses should collect information on the
sorts of behavior and characteristics of people likely to do well in each role - preferably analyzing the
people who are successful in the roles already - and pre-screen applicants against those criteria.
Getting a high proportion of the right sort of people through the doors and onto the induction course
can greatly reduce early attrition, as this is a problem that can be alleviated at the recruitment stage,
rather than leaving it until the candidates are already in the business before noticing the issues.
314
Staff attrition in small doses can be good for a contact center, bringing in fresh blood and enthusiasm.
However, high levels of staff attrition have some serious side-effects:
• Increases recruitment and training costs
• Decreases the average agent competency as there are so many ‘learners’
• Affects the quality of the customer experience, as the agent may not know how to answer
the query correctly first-time
• Adverse effect on contact center performance indicators, including first-time resolution, call
transfer rates, queue time and call length
• Bad for the morale of the remaining staff
• Inexperienced staff are more likely to miss cross-selling and up-selling opportunities
• Increased pressure put on team leaders and experienced agents to support new staff
• Difficult to bring on-board new systems and ideas, as the agents are struggling with what is
already in place.
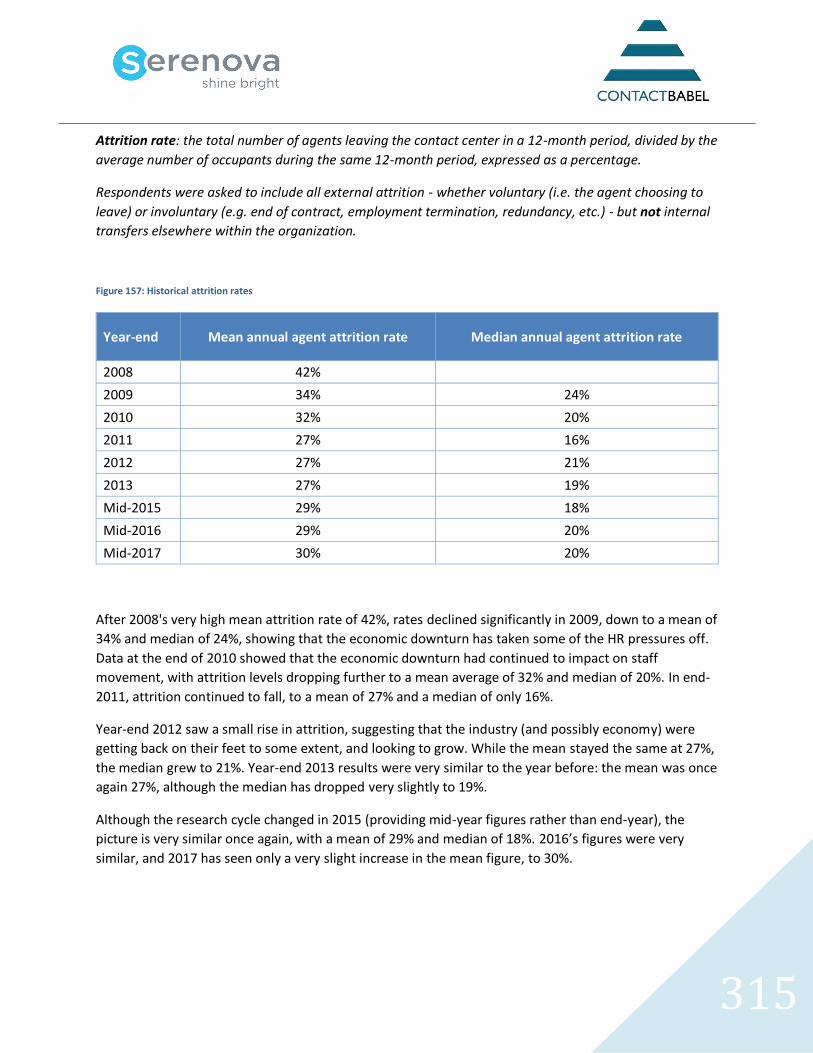
315
Attrition rate: the total number of agents leaving the contact center in a 12-month period, divided by the
average number of occupants during the same 12-month period, expressed as a percentage.
Respondents were asked to include all external attrition - whether voluntary (i.e. the agent choosing to
leave) or involuntary (e.g. end of contract, employment termination, redundancy, etc.) - but not internal
transfers elsewhere within the organization.
Figure 157: Historical attrition rates
Year-end Mean annual agent attrition rate Median annual agent attrition rate
2008 42%
2009 34% 24%
2010 32% 20%
2011 27% 16%
2012 27% 21%
2013 27% 19%
Mid-2015 29% 18%
Mid-2016 29% 20%
Mid-2017 30% 20%
After 2008's very high mean attrition rate of 42%, rates declined significantly in 2009, down to a mean of
34% and median of 24%, showing that the economic downturn has taken some of the HR pressures off.
Data at the end of 2010 showed that the economic downturn had continued to impact on staff
movement, with attrition levels dropping further to a mean average of 32% and median of 20%. In end-
2011, attrition continued to fall, to a mean of 27% and a median of only 16%.
Year-end 2012 saw a small rise in attrition, suggesting that the industry (and possibly economy) were
getting back on their feet to some extent, and looking to grow. While the mean stayed the same at 27%,
the median grew to 21%. Year-end 2013 results were very similar to the year before: the mean was once
again 27%, although the median has dropped very slightly to 19%.
Although the research cycle changed in 2015 (providing mid-year figures rather than end-year), the
picture is very similar once again, with a mean of 29% and median of 18%. 2016’s figures were very
similar, and 2017 has seen only a very slight increase in the mean figure, to 30%.
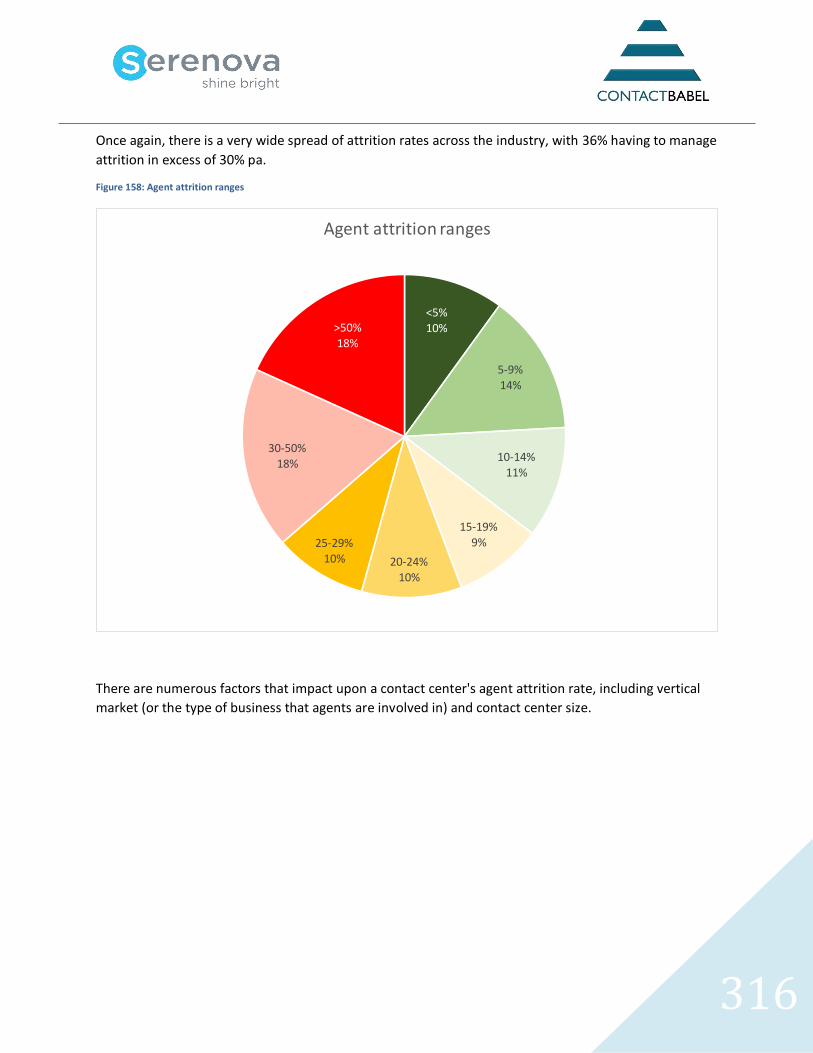
316
Once again, there is a very wide spread of attrition rates across the industry, with 36% having to manage
attrition in excess of 30% pa.
Figure 158: Agent attrition ranges
There are numerous factors that impact upon a contact center's agent attrition rate, including vertical
market (or the type of business that agents are involved in) and contact center size.
<5%10%
5-9%14%
10-14%11%
15-19%9%
20-24%10%
25-29%
10%
30-50%
18%
>50%18%
Agent attrition ranges
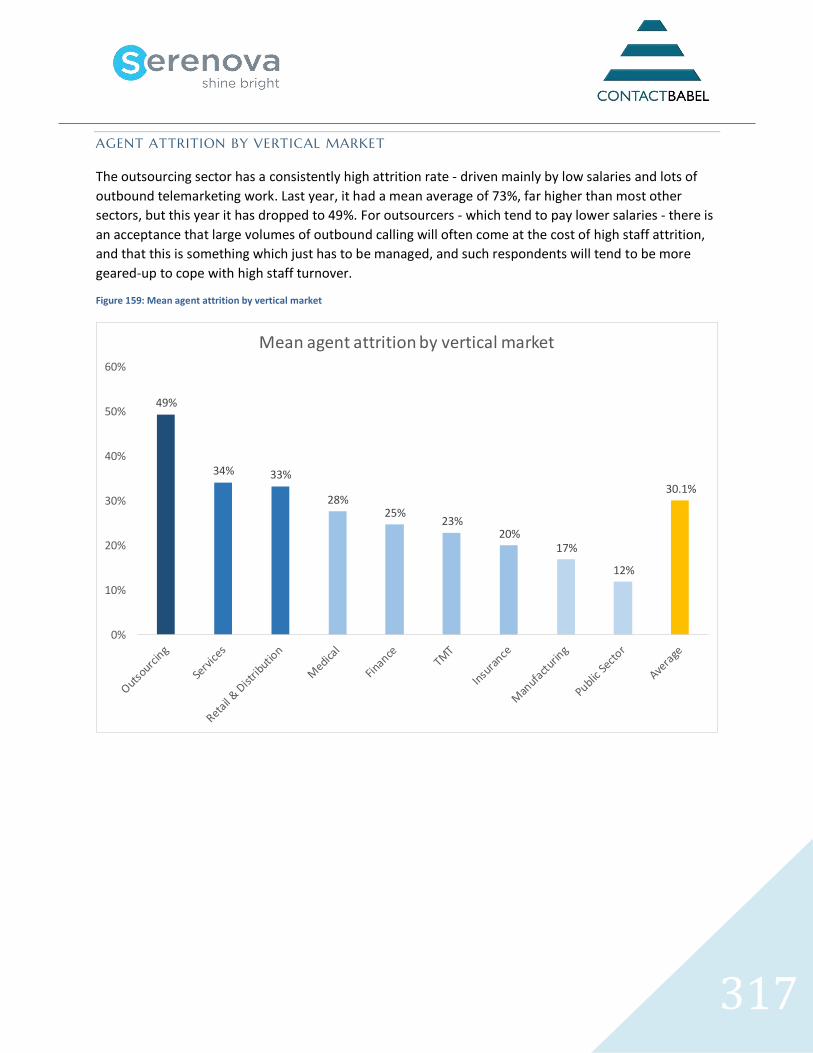
317
AGENT ATTRITION BY VERTICAL MARKET
The outsourcing sector has a consistently high attrition rate - driven mainly by low salaries and lots of
outbound telemarketing work. Last year, it had a mean average of 73%, far higher than most other
sectors, but this year it has dropped to 49%. For outsourcers - which tend to pay lower salaries - there is
an acceptance that large volumes of outbound calling will often come at the cost of high staff attrition,
and that this is something which just has to be managed, and such respondents will tend to be more
geared-up to cope with high staff turnover.
Figure 159: Mean agent attrition by vertical market
49%
34% 33%
28%25%
23%20%
17%
12%
30.1%
0%
10%
20%
30%
40%
50%
60%
Mean agent attrition by vertical market
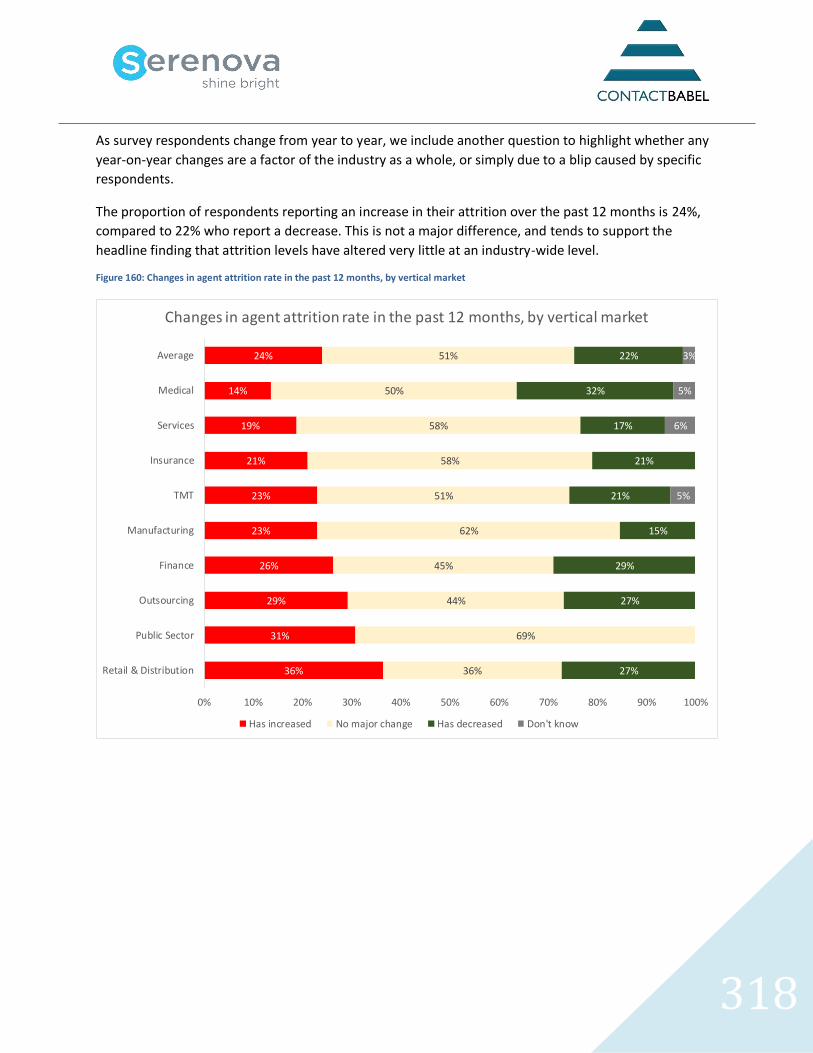
318
As survey respondents change from year to year, we include another question to highlight whether any
year-on-year changes are a factor of the industry as a whole, or simply due to a blip caused by specific
respondents.
The proportion of respondents reporting an increase in their attrition over the past 12 months is 24%,
compared to 22% who report a decrease. This is not a major difference, and tends to support the
headline finding that attrition levels have altered very little at an industry-wide level.
Figure 160: Changes in agent attrition rate in the past 12 months, by vertical market
36%
31%
29%
26%
23%
23%
21%
19%
14%
24%
36%
69%
44%
45%
62%
51%
58%
58%
50%
51%
27%
27%
29%
15%
21%
21%
17%
32%
22%
5%
6%
5%
3%
0% 10% 20% 30% 40% 50% 60% 70% 80% 90% 100%
Retail & Distribution
Public Sector
Outsourcing
Finance
Manufacturing
TMT
Insurance
Services
Medical
Average
Changes in agent attrition rate in the past 12 months, by vertical market
Has increased No major change Has decreased Don't know
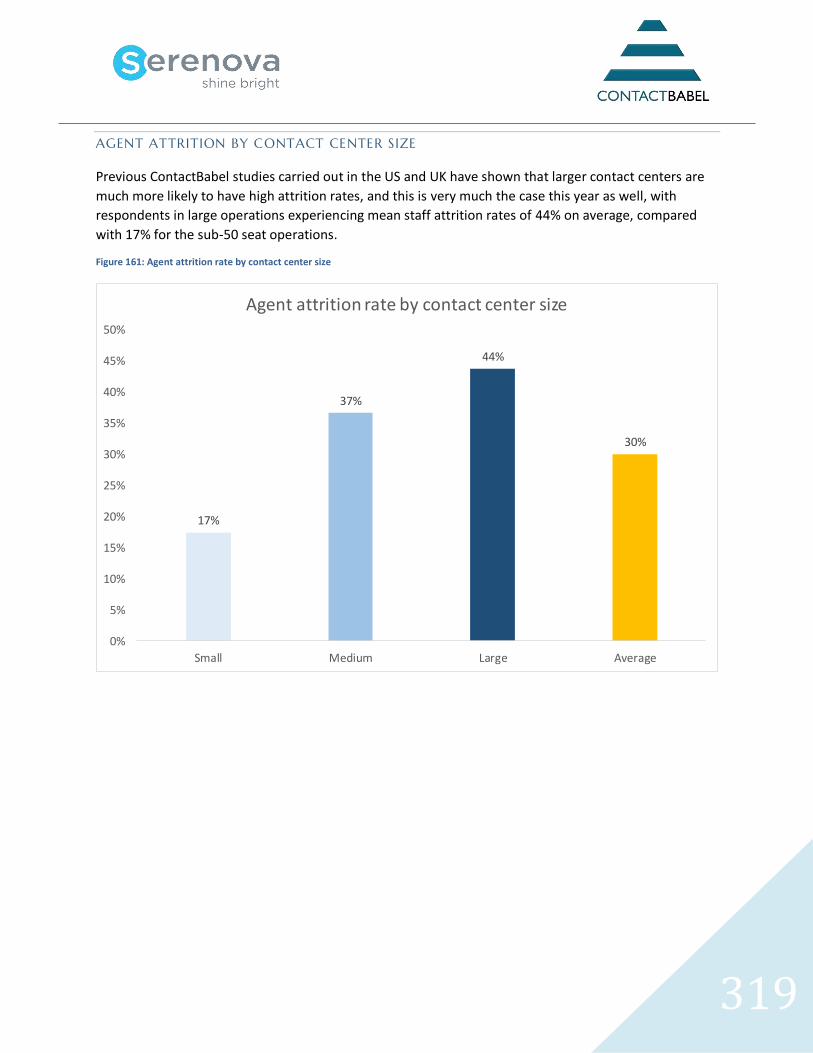
319
AGENT ATTRITION BY CONTACT CENTER SIZE
Previous ContactBabel studies carried out in the US and UK have shown that larger contact centers are
much more likely to have high attrition rates, and this is very much the case this year as well, with
respondents in large operations experiencing mean staff attrition rates of 44% on average, compared
with 17% for the sub-50 seat operations.
Figure 161: Agent attrition rate by contact center size
17%
37%
44%
30%
0%
5%
10%
15%
20%
25%
30%
35%
40%
45%
50%
Small Medium Large Average
Agent attrition rate by contact center size
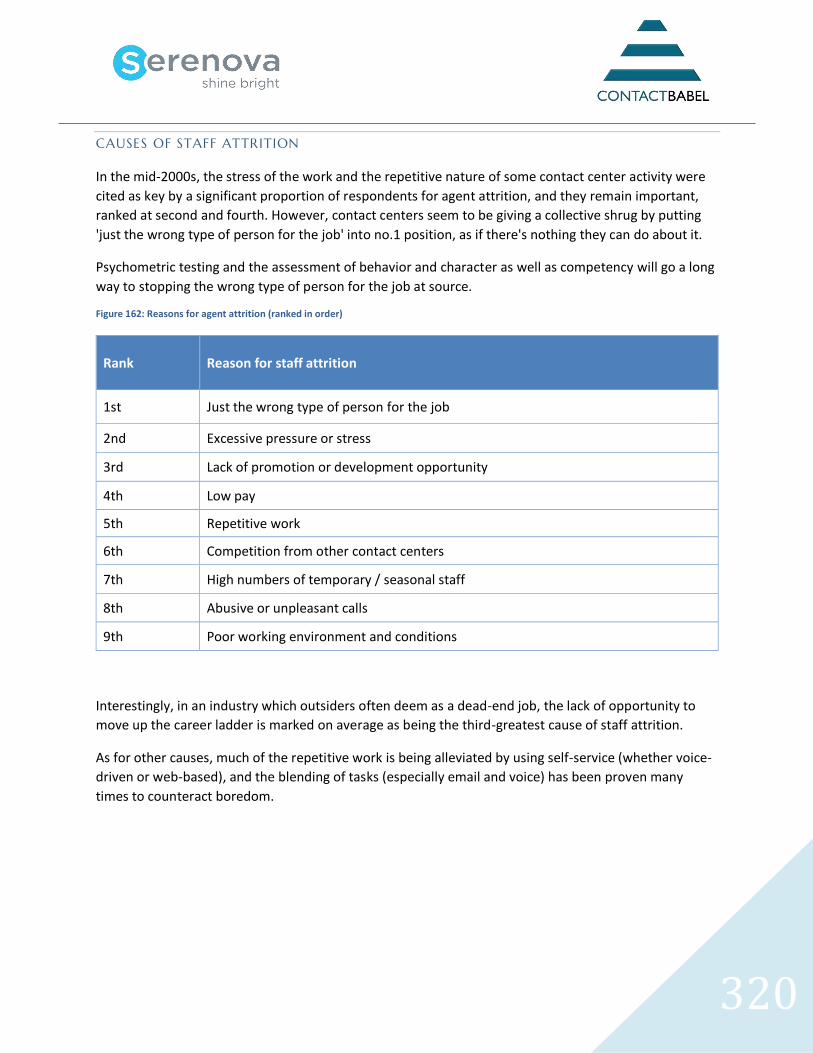
320
CAUSES OF STAFF ATTRITION
In the mid-2000s, the stress of the work and the repetitive nature of some contact center activity were
cited as key by a significant proportion of respondents for agent attrition, and they remain important,
ranked at second and fourth. However, contact centers seem to be giving a collective shrug by putting
'just the wrong type of person for the job' into no.1 position, as if there's nothing they can do about it.
Psychometric testing and the assessment of behavior and character as well as competency will go a long
way to stopping the wrong type of person for the job at source.
Figure 162: Reasons for agent attrition (ranked in order)
Rank Reason for staff attrition
1st Just the wrong type of person for the job
2nd Excessive pressure or stress
3rd Lack of promotion or development opportunity
4th Low pay
5th Repetitive work
6th Competition from other contact centers
7th High numbers of temporary / seasonal staff
8th Abusive or unpleasant calls
9th Poor working environment and conditions
Interestingly, in an industry which outsiders often deem as a dead-end job, the lack of opportunity to
move up the career ladder is marked on average as being the third-greatest cause of staff attrition.
As for other causes, much of the repetitive work is being alleviated by using self-service (whether voice-
driven or web-based), and the blending of tasks (especially email and voice) has been proven many
times to counteract boredom.
321
ABSENCE
In a tightly-run operation like a contact center where costs and performance are closely managed,
significant levels of staff absence can cause major problems with contact center performance and the
customer experience. Even just a slight increase in absence rates can mean a major difference to how
well the contact center performs on that day. Staff end up over-worked and stressed, and more likely to
take time off as a result. Morale suffers, which increases staff attrition, overwork and thus, further
absence.
There are many causes of absenteeism, including:
• The absence of a recruitment process that allows operations to identify unreliable or
unsuitable applicants
• Poor front-line leadership - many team leaders are just not able to manage their teams and
help prevent absenteeism, a fault of incorrect training and/or recruitment at this level
• Low morale in the contact center, meaning the workforce think that missing work is
acceptable.
There are also other factors that influence absence, including:
• Mandatory overtime
• Antisocial hours
• Lack of schedule flexibility and choice
• Insufficient mentoring or supervisor support, especially during the transition period after
training
• Large team sizes (20+ per team).
Short-term (no-show) absence - this is the average number of agent days lost through short-term
sickness and unauthorized absence as a percentage of contracted days annually. This is included in this
year’s report.
Long-term absence - this includes long-term sickness, maternity leave, sabbaticals and other long-term
absences where the business is able to plan for the absence. This is not included in this year’s report.
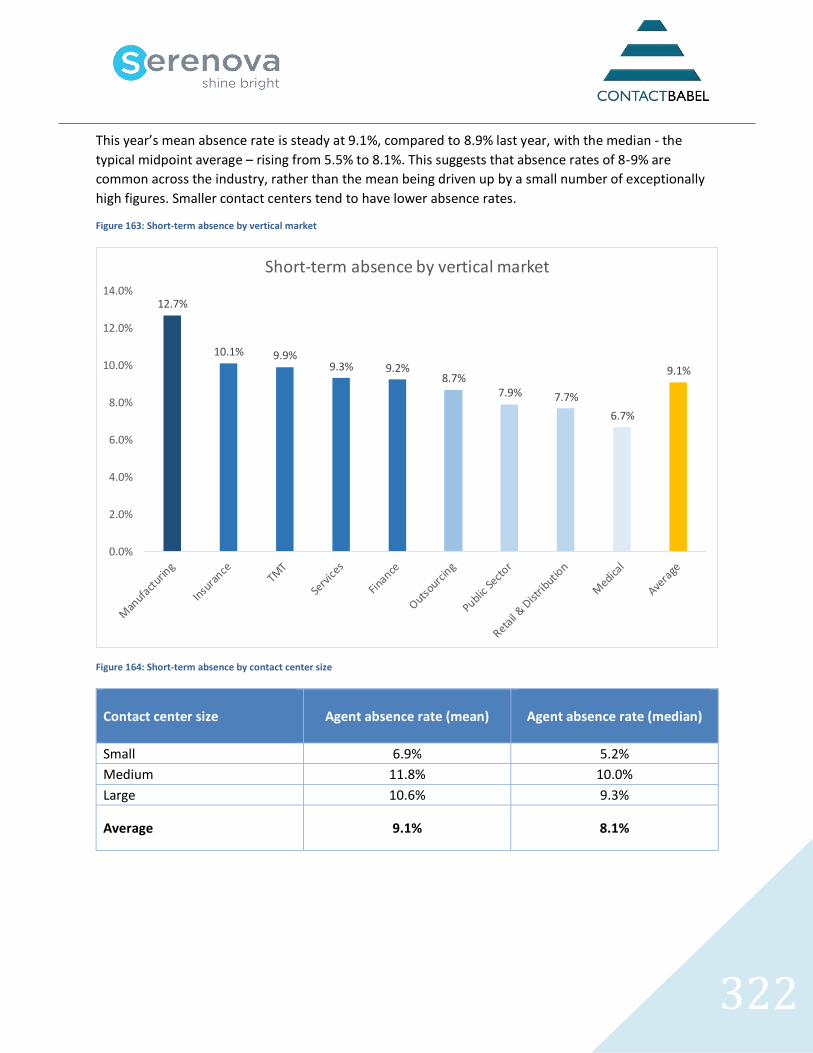
322
This year’s mean absence rate is steady at 9.1%, compared to 8.9% last year, with the median - the
typical midpoint average – rising from 5.5% to 8.1%. This suggests that absence rates of 8-9% are
common across the industry, rather than the mean being driven up by a small number of exceptionally
high figures. Smaller contact centers tend to have lower absence rates.
Figure 163: Short-term absence by vertical market
Figure 164: Short-term absence by contact center size
Contact center size
Agent absence rate (mean)
Agent absence rate (median)
Small 6.9% 5.2%
Medium 11.8% 10.0%
Large 10.6% 9.3%
Average 9.1% 8.1%
12.7%
10.1% 9.9%9.3% 9.2%
8.7%7.9% 7.7%
6.7%
9.1%
0.0%
2.0%
4.0%
6.0%
8.0%
10.0%
12.0%
14.0%
Short-term absence by vertical market
323
RECRUITMENT
There is a definite pattern to the effectiveness of recruitment methods: the closer you get to the
candidate, the more likely you are to make the right decision. The average contact center role is slowly
changing into something requiring higher skills - a high level of IT, business and communication abilities
are needed in many contact centers now and this trend will certainly continue.
While most contact centers do not admit to having problems with staff recruitment, many of the same
operations have problems with staff attrition. The case could be made that high-attrition operations do
have a problem with recruitment, but they just don’t realize it. Having filled their job roles, the
recruitment process is deemed to have been a success, but how many of these new recruits turn out to
be no-shows, or leave either before the induction course is complete or shortly into the job? These
recruits are gauged to be part of the attrition problem, when in fact, they are indicative of a recruitment
problem. As such, businesses should try harder to understand what skills and attributes successful
agents are already demonstrating in this role - empathy, resilience, reliability, sales technique, technical
capability, etc. - and seek to recruit more people with this specific factors and behaviors.
Recruitment has traditionally been about asking the question “Can the applicant do the job?”. Having
the skills to carry out the task is obviously important, but most skills can be learned, and in an
environment such as a contact center - where both tasks and environment are not suited to everyone -
other factors are perhaps more important. This is borne out by the findings earlier in this chapter, which
indicated that the main reason for staff attrition was that they were just the wrong type of person for
the job.
Firstly, the business must understand the competencies, characteristics and behaviors that are most
suitable for the contact center positions that they are trying to fill, for example:
• dependability
• customer focus
• empathy
• problem-solving
• the ability to understand and follow instructions
• a focus on a goal.
Successful agents will also require some hard skills, although many of these are more easily-learnt.
Through judging competencies objectively, and using a combination of processes (for example,
telephone and face-to-face interviews, with upfront psychometric analysis to determine the likelihood
of the prospect being a long-term success in the contact center), the business reduces the risk of high
attrition and growing costs, and can focus upon its strategic goals.
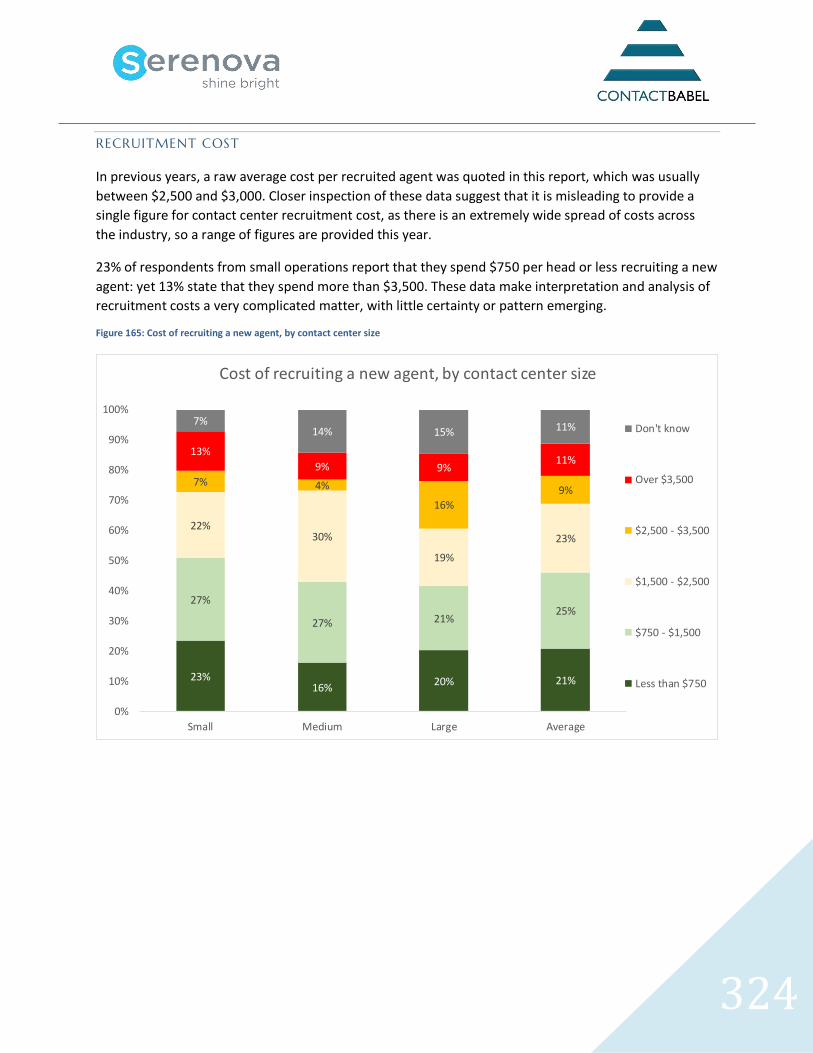
324
RECRUITMENT COST
In previous years, a raw average cost per recruited agent was quoted in this report, which was usually
between $2,500 and $3,000. Closer inspection of these data suggest that it is misleading to provide a
single figure for contact center recruitment cost, as there is an extremely wide spread of costs across
the industry, so a range of figures are provided this year.
23% of respondents from small operations report that they spend $750 per head or less recruiting a new
agent: yet 13% state that they spend more than $3,500. These data make interpretation and analysis of
recruitment costs a very complicated matter, with little certainty or pattern emerging.
Figure 165: Cost of recruiting a new agent, by contact center size
23%16%
20% 21%
27%
27% 21%25%
22%30%
19%
23%
7% 4%
16%
9%
13%
9% 9%11%
7%14% 15% 11%
0%
10%
20%
30%
40%
50%
60%
70%
80%
90%
100%
Small Medium Large Average
Cost of recruiting a new agent, by contact center size
Don't know
Over $3,500
$2,500 - $3,500
$1,500 - $2,500
$750 - $1,500
Less than $750
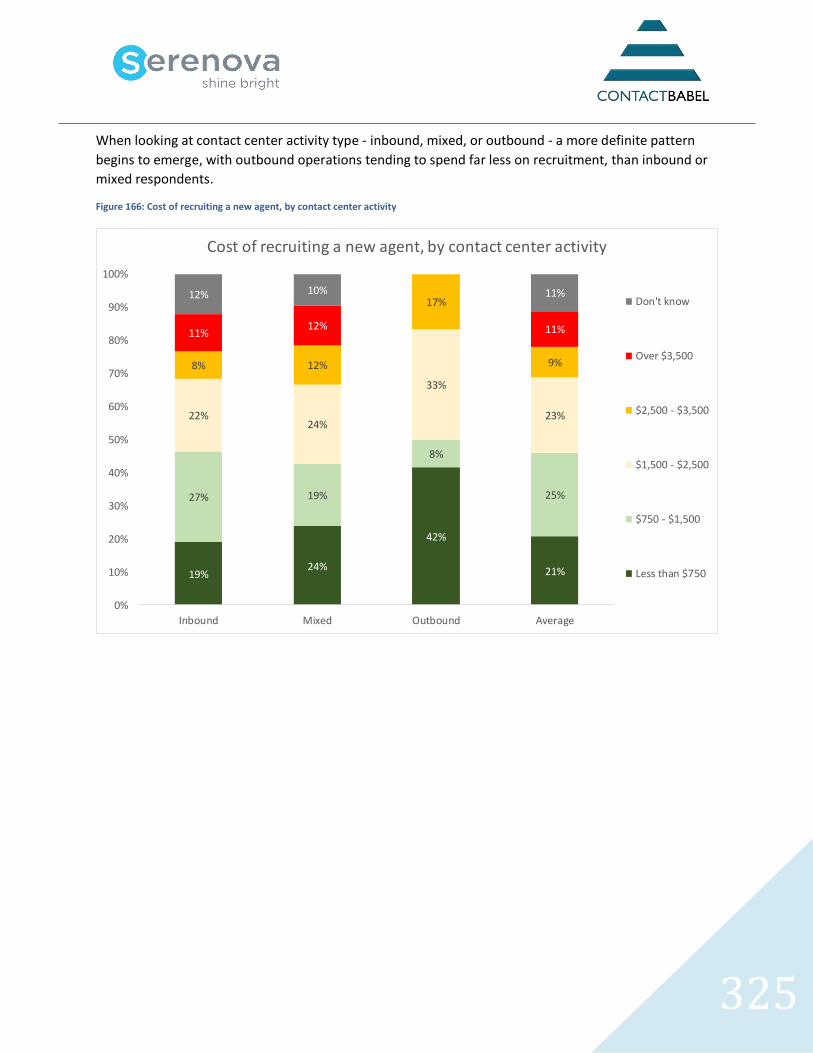
325
When looking at contact center activity type - inbound, mixed, or outbound - a more definite pattern
begins to emerge, with outbound operations tending to spend far less on recruitment, than inbound or
mixed respondents.
Figure 166: Cost of recruiting a new agent, by contact center activity
19%24%
42%
21%
27% 19%
8%
25%
22%24%
33%
23%
8% 12%
17%
9%
11%12% 11%
12% 10% 11%
0%
10%
20%
30%
40%
50%
60%
70%
80%
90%
100%
Inbound Mixed Outbound Average
Cost of recruiting a new agent, by contact center activity
Don't know
Over $3,500
$2,500 - $3,500
$1,500 - $2,500
$750 - $1,500
Less than $750
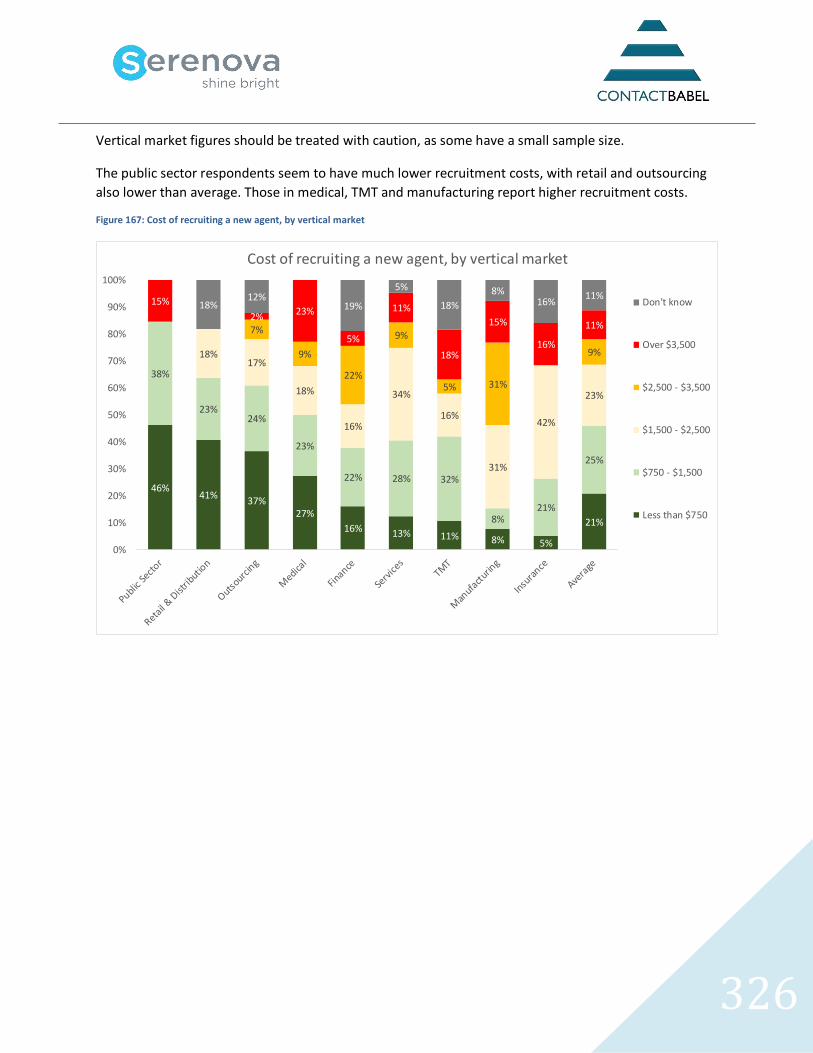
326
Vertical market figures should be treated with caution, as some have a small sample size.
The public sector respondents seem to have much lower recruitment costs, with retail and outsourcing
also lower than average. Those in medical, TMT and manufacturing report higher recruitment costs.
Figure 167: Cost of recruiting a new agent, by vertical market
46%41%
37%27%
16% 13% 11% 8% 5%
21%
38%
23%24%
23%
22% 28% 32%
8%21%
25%
18%17%
18%
16%
34%
16%
31%
42%
23%
7%
9%
22%
9%
5% 31%
9%
15%
2%23%
5%
11%
18%
15%
16%
11%
18%12%
19%
5%
18%
8%16%
11%
0%
10%
20%
30%
40%
50%
60%
70%
80%
90%
100%
Cost of recruiting a new agent, by vertical market
Don't know
Over $3,500
$2,500 - $3,500
$1,500 - $2,500
$750 - $1,500
Less than $750
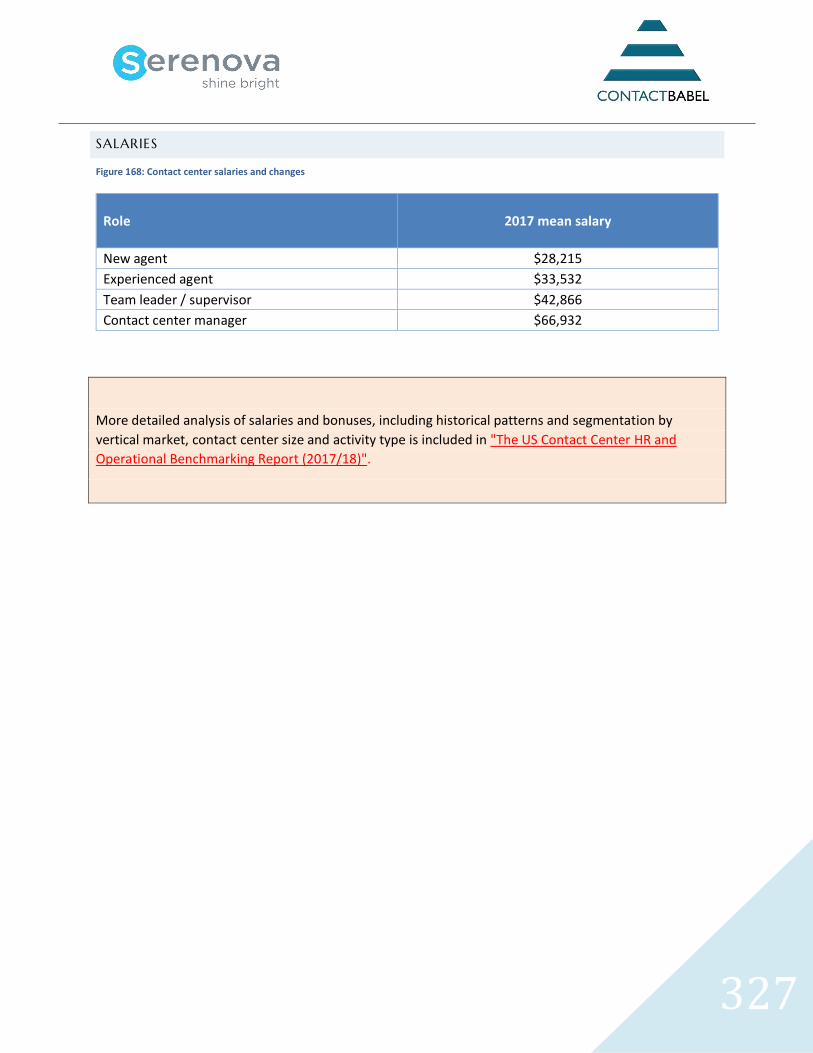
327
SALARIES
Figure 168: Contact center salaries and changes
Role
2017 mean salary
New agent $28,215
Experienced agent $33,532
Team leader / supervisor $42,866
Contact center manager $66,932
More detailed analysis of salaries and bonuses, including historical patterns and segmentation by
vertical market, contact center size and activity type is included in "The US Contact Center HR and
Operational Benchmarking Report (2017/18)".
328
STRATEGIC DIRECTIONS & INVESTMENT
Much of this report is about how contact centers are performing today, but this final chapter looks at
the strategic decisions and issues that contact centers face.
Traditionally, HR issues such as attrition have been what make contact center managers most
concerned, but the past years have seen a growing feeling that the technology in place is letting the
operation down, or at least, preventing it moving forward to the extent that it needs. Contact centers
are also aware that they have to modernize their processes as well as the technology, but as ever, cost,
time and the need to keep the operation running smoothly make this sort of strategic thinking very
difficult, especially in a situation where many contact centers still do not have much in the way of a
champion at the higher levels of the business. However, there has been a significant movement away
from seeing contact centers as simple cost centers, with the emergence of dedicated customer
experience (CX) professional roles at both senior and operational levels.
The need to measure and improve customer satisfaction, and its impact upon profitability, has become
an obsession throughout the industry, which is positive for customers and businesses. A recent
phenomenon has been the explosive growth in multichannel communications, and the rapid realization
that customer contact must not exist in a siloed environment, but as part of an omnichannel strategy.
Cloud-based solutions offer a scalable and powerful alternative to large-scale, high cost, premise-based
implementations, offering sophisticated functionality to organizations which may have otherwise
struggled to keep up.
The industry is still growing in terms of increased volumes of interaction, although headcount growth
has slowed for many operations, and more needs to be done to increase the effectiveness of agents,
particularly as the move from live voice to digital service means learning new ways of operating.
Intelligent self-service (through artificial intelligence) is of great interest, supporting the agent as well as
the customer. The effect of this, as well as new ways of approaching older new technologies such as
adding visual capabilities to IVR, will continue to take low-value work away from agents, freeing them to
do more profitable, important and difficult work.
For businesses where self-service is not seen as a viable option, great opportunities still exist to trim
unnecessary elements of the calls, from identity verification through system navigation to post-call
wrap-up: consistently high levels of wrap-up time and non-call time is worrying: often 40% or more of an
agent’s time is spent doing something other than communicating with customers. Agent desktop
optimization - putting the right things on the desktop at the right time in the conversation, without
disrupting the underlying system functionality - is gaining in popularity, especially in very large contact
centers with multiple, complex processes and legacy systems.
Interaction analytics offers businesses a major opportunity to understand why customers are calling,
and to gain real business insight that will impact at the heart of the business. Although analytics is in
place in many larger operations, most businesses are not yet using it to its full potential. We expect to
see a further movement away from simply using analytics to automate QA and compliance processes,
and for it to become the key to understanding and acting upon customer intentions.

329
Customer experience is the background against which discussions of technology and HR are placed. This
is the common ground where senior executives and contact center operations can now meet and
discuss how to head in the right direction together. Much of what respondents to this survey have
talked about is colored by improving customer experience, but there is a widespread acknowledgment
that superior CX is not simply about providing excellent service within live agent-customer
conversations, but runs deep into digital channels, especially self-service.
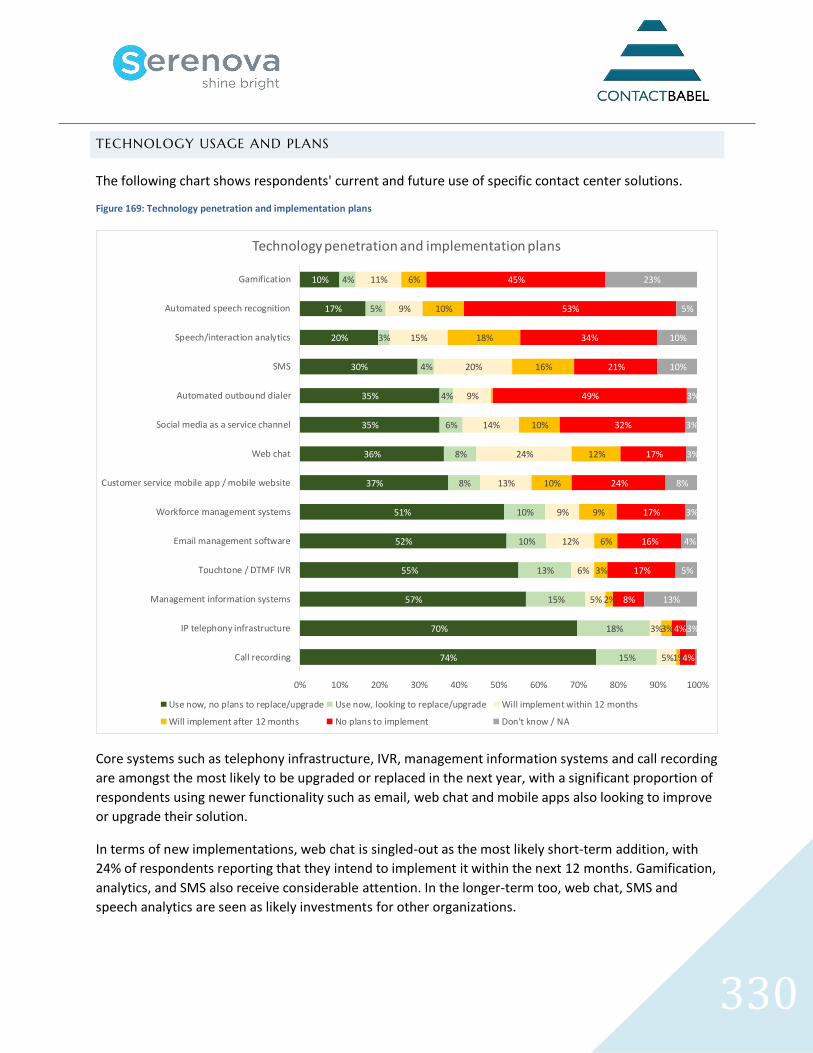
330
TECHNOLOGY USAGE AND PLANS
The following chart shows respondents' current and future use of specific contact center solutions.
Figure 169: Technology penetration and implementation plans
Core systems such as telephony infrastructure, IVR, management information systems and call recording
are amongst the most likely to be upgraded or replaced in the next year, with a significant proportion of
respondents using newer functionality such as email, web chat and mobile apps also looking to improve
or upgrade their solution.
In terms of new implementations, web chat is singled-out as the most likely short-term addition, with
24% of respondents reporting that they intend to implement it within the next 12 months. Gamification,
analytics, and SMS also receive considerable attention. In the longer-term too, web chat, SMS and
speech analytics are seen as likely investments for other organizations.
74%
70%
57%
55%
52%
51%
37%
36%
35%
35%
30%
20%
17%
10%
15%
18%
15%
13%
10%
10%
8%
8%
6%
4%
4%
3%
5%
4%
5%
3%
5%
6%
12%
9%
13%
24%
14%
9%
20%
15%
9%
11%
1%
3%
2%
3%
6%
9%
10%
12%
10%
16%
18%
10%
6%
4%
4%
8%
17%
16%
17%
24%
17%
32%
49%
21%
34%
53%
45%
3%
13%
5%
4%
3%
8%
3%
3%
3%
10%
10%
5%
23%
0% 10% 20% 30% 40% 50% 60% 70% 80% 90% 100%
Call recording
IP telephony infrastructure
Management information systems
Touchtone / DTMF IVR
Email management software
Workforce management systems
Customer service mobile app / mobile website
Web chat
Social media as a service channel
Automated outbound dialer
SMS
Speech/interaction analytics
Automated speech recognition
Gamification
Technology penetration and implementation plans
Use now, no plans to replace/upgrade Use now, looking to replace/upgrade Will implement within 12 months
Will implement after 12 months No plans to implement Don't know / NA
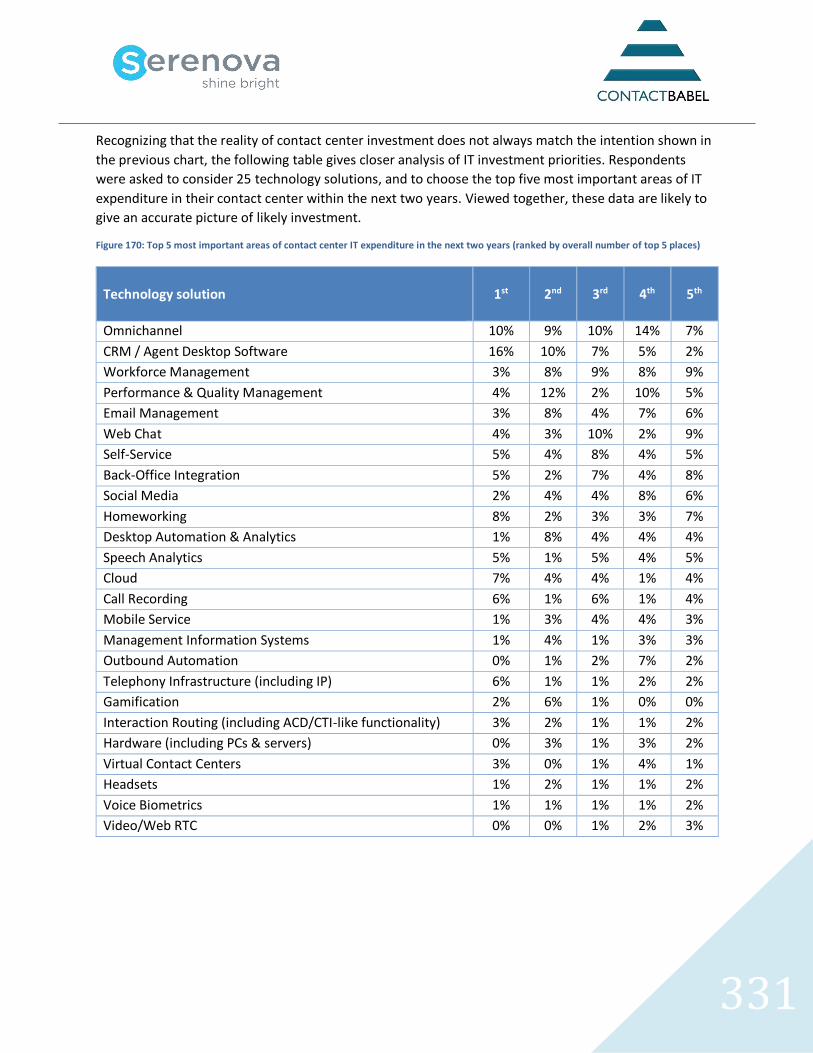
331
Recognizing that the reality of contact center investment does not always match the intention shown in
the previous chart, the following table gives closer analysis of IT investment priorities. Respondents
were asked to consider 25 technology solutions, and to choose the top five most important areas of IT
expenditure in their contact center within the next two years. Viewed together, these data are likely to
give an accurate picture of likely investment.
Figure 170: Top 5 most important areas of contact center IT expenditure in the next two years (ranked by overall number of top 5 places)
Technology solution
1st 2nd 3rd 4th 5th
Omnichannel 10% 9% 10% 14% 7%
CRM / Agent Desktop Software 16% 10% 7% 5% 2%
Workforce Management 3% 8% 9% 8% 9%
Performance & Quality Management 4% 12% 2% 10% 5%
Email Management 3% 8% 4% 7% 6%
Web Chat 4% 3% 10% 2% 9%
Self-Service 5% 4% 8% 4% 5%
Back-Office Integration 5% 2% 7% 4% 8%
Social Media 2% 4% 4% 8% 6%
Homeworking 8% 2% 3% 3% 7%
Desktop Automation & Analytics 1% 8% 4% 4% 4%
Speech Analytics 5% 1% 5% 4% 5%
Cloud 7% 4% 4% 1% 4%
Call Recording 6% 1% 6% 1% 4%
Mobile Service 1% 3% 4% 4% 3%
Management Information Systems 1% 4% 1% 3% 3%
Outbound Automation 0% 1% 2% 7% 2%
Telephony Infrastructure (including IP) 6% 1% 1% 2% 2%
Gamification 2% 6% 1% 0% 0%
Interaction Routing (including ACD/CTI-like functionality) 3% 2% 1% 1% 2%
Hardware (including PCs & servers) 0% 3% 1% 3% 2%
Virtual Contact Centers 3% 0% 1% 4% 1%
Headsets 1% 2% 1% 1% 2%
Voice Biometrics 1% 1% 1% 1% 2%
Video/Web RTC 0% 0% 1% 2% 3%
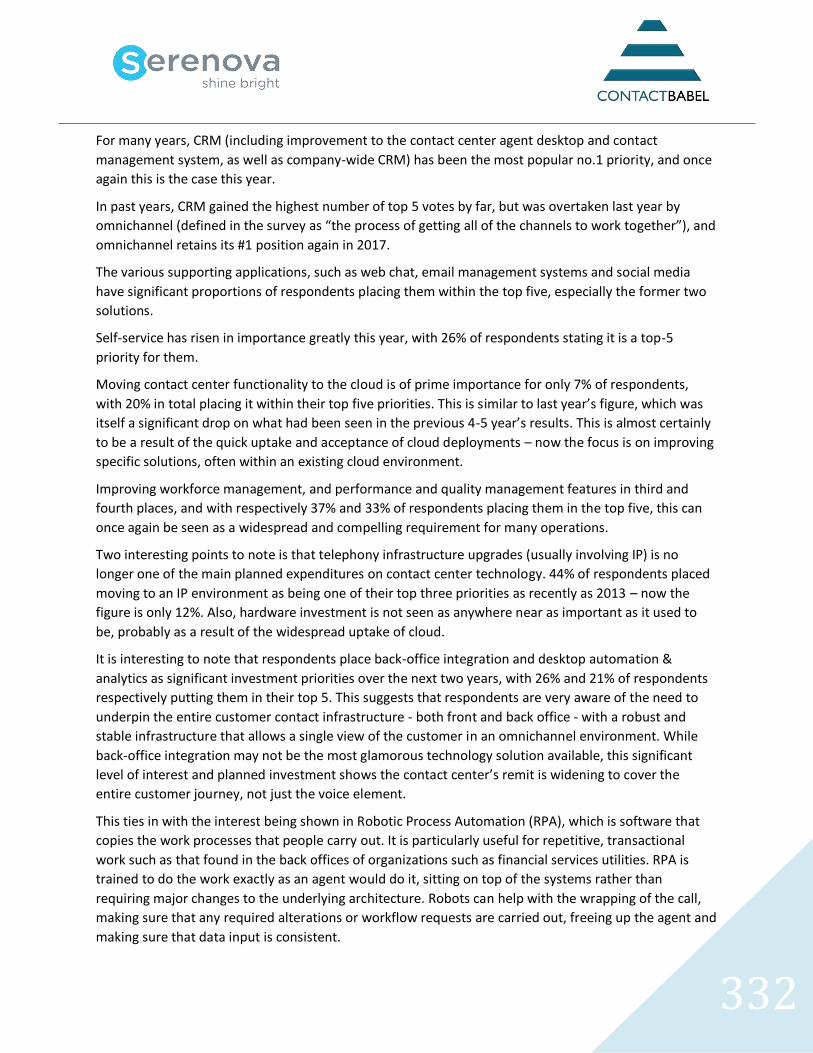
332
For many years, CRM (including improvement to the contact center agent desktop and contact
management system, as well as company-wide CRM) has been the most popular no.1 priority, and once
again this is the case this year.
In past years, CRM gained the highest number of top 5 votes by far, but was overtaken last year by
omnichannel (defined in the survey as “the process of getting all of the channels to work together”), and
omnichannel retains its #1 position again in 2017.
The various supporting applications, such as web chat, email management systems and social media
have significant proportions of respondents placing them within the top five, especially the former two
solutions.
Self-service has risen in importance greatly this year, with 26% of respondents stating it is a top-5
priority for them.
Moving contact center functionality to the cloud is of prime importance for only 7% of respondents,
with 20% in total placing it within their top five priorities. This is similar to last year’s figure, which was
itself a significant drop on what had been seen in the previous 4-5 year’s results. This is almost certainly
to be a result of the quick uptake and acceptance of cloud deployments – now the focus is on improving
specific solutions, often within an existing cloud environment.
Improving workforce management, and performance and quality management features in third and
fourth places, and with respectively 37% and 33% of respondents placing them in the top five, this can
once again be seen as a widespread and compelling requirement for many operations.
Two interesting points to note is that telephony infrastructure upgrades (usually involving IP) is no
longer one of the main planned expenditures on contact center technology. 44% of respondents placed
moving to an IP environment as being one of their top three priorities as recently as 2013 – now the
figure is only 12%. Also, hardware investment is not seen as anywhere near as important as it used to
be, probably as a result of the widespread uptake of cloud.
It is interesting to note that respondents place back-office integration and desktop automation &
analytics as significant investment priorities over the next two years, with 26% and 21% of respondents
respectively putting them in their top 5. This suggests that respondents are very aware of the need to
underpin the entire customer contact infrastructure - both front and back office - with a robust and
stable infrastructure that allows a single view of the customer in an omnichannel environment. While
back-office integration may not be the most glamorous technology solution available, this significant
level of interest and planned investment shows the contact center’s remit is widening to cover the
entire customer journey, not just the voice element.
This ties in with the interest being shown in Robotic Process Automation (RPA), which is software that
copies the work processes that people carry out. It is particularly useful for repetitive, transactional
work such as that found in the back offices of organizations such as financial services utilities. RPA is
trained to do the work exactly as an agent would do it, sitting on top of the systems rather than
requiring major changes to the underlying architecture. Robots can help with the wrapping of the call,
making sure that any required alterations or workflow requests are carried out, freeing up the agent and
making sure that data input is consistent.
333
Figure 171: Change in top 5 most important areas of contact center IT expenditure in the next two years, 2016-2017
2016 position Technology solution
2017 position
1st Omnichannel 1st
2nd CRM / Agent Desktop Software 2nd
3rd Workforce Management 3rd
4th Performance & Quality Management 4th
5th Call Recording 14th
6th Web Chat 6th
7th Desktop Automation & Analytics 11th
8th Homeworking 10th
9th Email Management 5th
10th Back-Office Integration 8th
11th Speech Analytics 12th
12th Self-Service 7th
13th Virtual Contact Centers 22nd
14th Management Information Systems 16th
15th Cloud 13th
16th Social Media 9th
17th Telephony Infrastructure (including IP) 18th
18th Mobile Service 15th
19th Outbound Automation 17th
20th Interaction Routing (including ACD/CTI-like functionality) 20th
21st Gamification 19th
22nd Hardware (including PCs & servers) 21st
23rd Headsets 23rd
24th Video/Web RTC 25th
25th Voice Biometrics 24th
Analysis was carried out to see how priorities have changed in the past 12 months, and although – as we
would expect – many solutions occupy similar relative levels of importance compared to 2016, there are
a few points to note.
The priority placed on call recording has dropped from 5th place in 2016 to 14th in 2017, despite 17% of
users stating that they were intending to upgrade their recording solutions in the next 12 months. This
suggests that a minority of contact centers are very keen to update their solutions, but the feeling across
the industry in general is that call recording is not an investment priority for most.
334
Virtual contact center investment is also less of a priority, dropping from 13th position in 2016 to 22nd in
2017. Many operations suitable for virtualization have already done so, although 3% of respondents
state that it is their #1 investment priority.
Desktop automation and analytics has dropped a few places, from 7th to 11th, although 21% of
respondents still place it in the top 5.
Amongst those solutions rising in importance, email management (9th to 5th), self-service (12th to 7th),
and social media (16th to 9th) stand out. All of these are connected with the massive movement to digital
and automated service that the industry as a whole is committing to, driven both by lower costs as well
as the requirements of their customers.
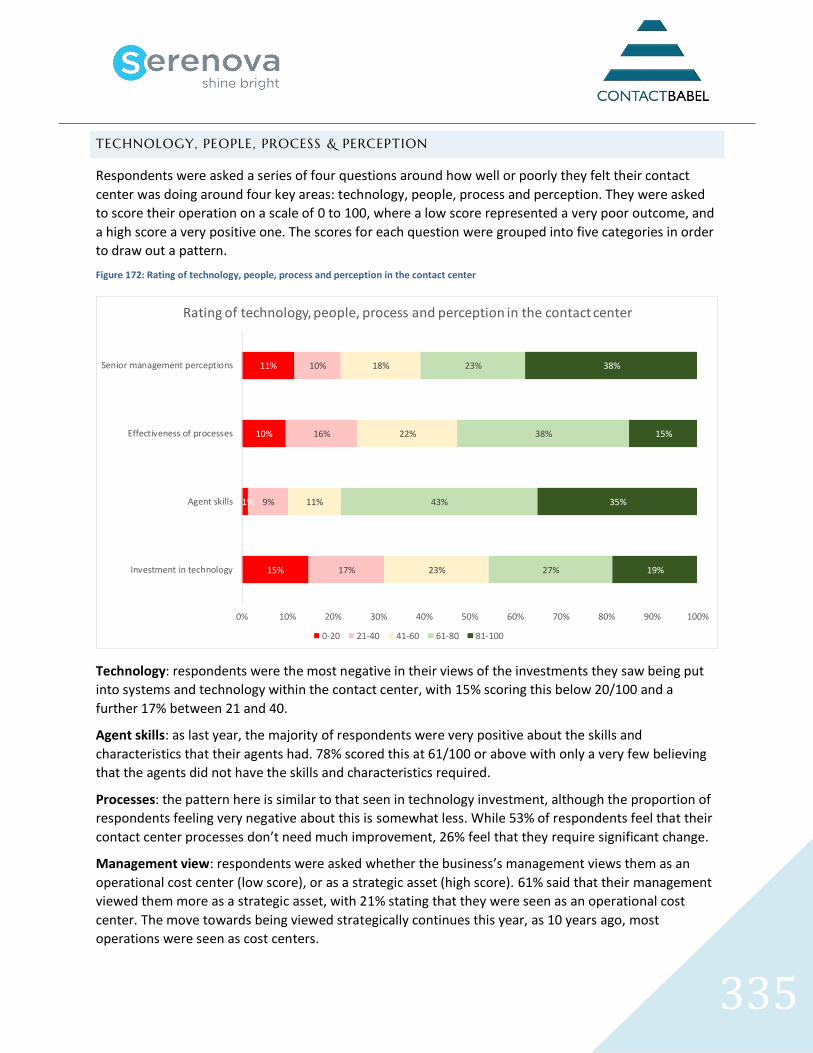
335
TECHNOLOGY, PEOPLE, PROCESS & PERCEPTION
Respondents were asked a series of four questions around how well or poorly they felt their contact
center was doing around four key areas: technology, people, process and perception. They were asked
to score their operation on a scale of 0 to 100, where a low score represented a very poor outcome, and
a high score a very positive one. The scores for each question were grouped into five categories in order
to draw out a pattern.
Figure 172: Rating of technology, people, process and perception in the contact center
Technology: respondents were the most negative in their views of the investments they saw being put
into systems and technology within the contact center, with 15% scoring this below 20/100 and a
further 17% between 21 and 40.
Agent skills: as last year, the majority of respondents were very positive about the skills and
characteristics that their agents had. 78% scored this at 61/100 or above with only a very few believing
that the agents did not have the skills and characteristics required.
Processes: the pattern here is similar to that seen in technology investment, although the proportion of
respondents feeling very negative about this is somewhat less. While 53% of respondents feel that their
contact center processes don’t need much improvement, 26% feel that they require significant change.
Management view: respondents were asked whether the business’s management views them as an
operational cost center (low score), or as a strategic asset (high score). 61% said that their management
viewed them more as a strategic asset, with 21% stating that they were seen as an operational cost
center. The move towards being viewed strategically continues this year, as 10 years ago, most
operations were seen as cost centers.
15%
1%
10%
11%
17%
9%
16%
10%
23%
11%
22%
18%
27%
43%
38%
23%
19%
35%
15%
38%
0% 10% 20% 30% 40% 50% 60% 70% 80% 90% 100%
Investment in technology
Agent skills
Effectiveness of processes
Senior management perceptions
Rating of technology, people, process and perception in the contact center
0-20 21-40 41-60 61-80 81-100
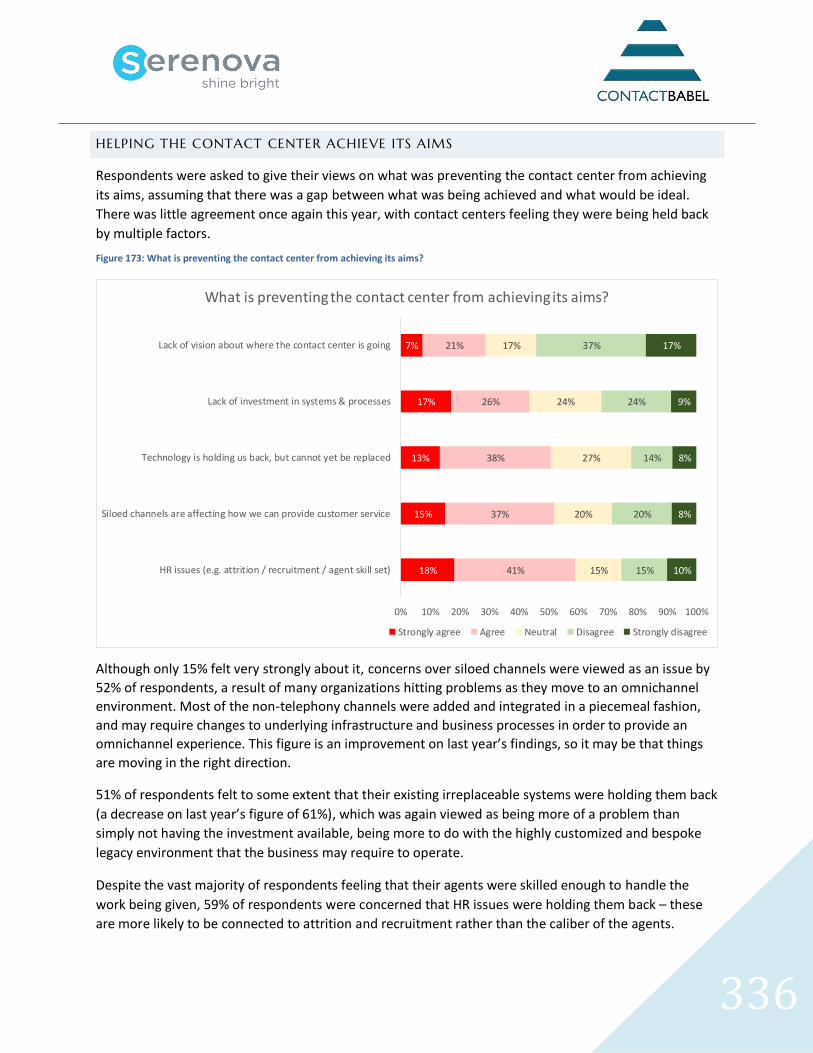
336
HELPING THE CONTACT CENTER ACHIEVE ITS AIMS
Respondents were asked to give their views on what was preventing the contact center from achieving
its aims, assuming that there was a gap between what was being achieved and what would be ideal.
There was little agreement once again this year, with contact centers feeling they were being held back
by multiple factors.
Figure 173: What is preventing the contact center from achieving its aims?
Although only 15% felt very strongly about it, concerns over siloed channels were viewed as an issue by
52% of respondents, a result of many organizations hitting problems as they move to an omnichannel
environment. Most of the non-telephony channels were added and integrated in a piecemeal fashion,
and may require changes to underlying infrastructure and business processes in order to provide an
omnichannel experience. This figure is an improvement on last year’s findings, so it may be that things
are moving in the right direction.
51% of respondents felt to some extent that their existing irreplaceable systems were holding them back
(a decrease on last year’s figure of 61%), which was again viewed as being more of a problem than
simply not having the investment available, being more to do with the highly customized and bespoke
legacy environment that the business may require to operate.
Despite the vast majority of respondents feeling that their agents were skilled enough to handle the
work being given, 59% of respondents were concerned that HR issues were holding them back – these
are more likely to be connected to attrition and recruitment rather than the caliber of the agents.
18%
15%
13%
17%
7%
41%
37%
38%
26%
21%
15%
20%
27%
24%
17%
15%
20%
14%
24%
37%
10%
8%
8%
9%
17%
0% 10% 20% 30% 40% 50% 60% 70% 80% 90% 100%
HR issues (e.g. attrition / recruitment / agent skill set)
Siloed channels are affecting how we can provide customer service
Technology is holding us back, but cannot yet be replaced
Lack of investment in systems & processes
Lack of vision about where the contact center is going
What is preventing the contact center from achieving its aims?
Strongly agree Agree Neutral Disagree Strongly disagree
337
It was positive to find that only 28% of respondents felt that there was a lack of vision about where the
contact center was going, compared to 54% that did not consider this a major problem.
When considering the attitudes of respondents from various size bands, there is general agreement,
with a few key areas of differentiation:
• larger contact centers less likely then in previous years to believe that a siloed approach to
channel management is holding them back: 80% of this size band expressed this opinion
previously, but the figure in 2017 is only 50%, suggesting a major push to integrate channels
• respondents from larger operations are less likely than previously to believe that the lack of
investment in technology is restricting their plans, although they report more problems with HR
issues, particularly around attrition (65% state that HR issues are holding them back)
• small and medium contact centers are much more likely than larger operations to believe that a
lack of vision about how their operation could work is holding them back
• medium-sized contact centers are more likely than average to say that their existing systems
and technology is holding them back, but cannot yet be replaced. Larger operations do not share
this opinion in general, which may suggest that there will be a wave of upgrades and movement
to cloud-based technology in the mid-sized sector still to come.
338
APPENDIX: ABOUT CONTACTBABEL
ContactBabel is the contact center industry expert. If you have a question about how the industry works,
or where it’s heading, the chances are we have the answer.
The coverage provided by our massive and ongoing primary research projects is matched by our
experience analyzing the contact center industry. We understand how technology, people and process
best fit together, and how they will work collectively in the future.
We help the biggest and most successful vendors develop their contact center strategies and talk to the
right prospects. We have shown the UK government how the global contact center industry will develop
and change. We help contact centers compare themselves to their closest competitors so they can
understand what they are doing well and what needs to improve.
If you have a question about your company’s place in the contact center industry, perhaps we can help
you.
Email: [email protected]
Website: www.contactbabel.com
Telephone: +44 (0)191 271 5269