Embed Size (px)
Citation preview
Article
1
The validation of an L2 English listening self-efficacy instrument using Rasch analysis Eric Shepherd Martin
Department of Education, Junior and Senior High School English Education Course, Shitennoji
University
Abstract
This paper details the development and validation of a listening self-efficacy instrument for EFL/ESL learners with beginner-
to-intermediate-level English language proficiency. Self-efficacy, or the belief in one’s ability to perform a task successfully,
is believed to determine how likely individuals will be to cope with difficulties relating to the task domain (e.g., listening,
speaking, reading, or writing), and to sustain their effort in spite of obstacles (Bandura, 1997). To date, few instruments have
been developed to evaluate English L2 listening self-efficacy. The instrument presented here was distributed among a sample
of first- and second-year Japanese university students (N = 121), and, unlike most previously developed questionnaires, was
validated through the use of Rasch analysis. The results of the administration of the questionnaire showed that learners’
responses differed predictably and considerably, thereby suggesting the utility of the instrument for future use by EFL/ESL
practitioners.
Keywords: Rasch analysis, listening, self-efficacy, motivation, university education, assessment
The construct of self-efficacy, developed by Bandura (1977), can be defined as the degree to which people
judge their capabilities to complete a specific task with the skills that they possess, and the degree to which
they believe that the performance will have positive consequences. High self-efficacy can “determine
whether coping behavior will be initiated, how much effort will be expended, and how long it will be
sustained in the face of obstacles and aversive experience” (Bandura, 1977, p. 191). According to Bandura
(1997), self-efficacy is developed via four sources. The first is through experiences of success, which are
said to be the most influential source of efficacy information. Second, self-efficacy can also be developed
when individuals assess their performance by comparing it to the performance of others (e.g., comparing
one’s test score with a peer’s). Third, positive feedback and, finally, affective arousal, have also been
demonstrated to influence people’s sense of self-efficacy.
Other self-referent constructs, such as self-esteem and self-concept, share similarities with self-efficacy,
yet self-efficacy is distinguishable from them. Although self-esteem and self-efficacy are positively
correlated, self-esteem is specifically related to a person’s perception of their own self-worth (e.g., “I am
a good person.”), while self-concept refers to people’s beliefs about how well they can perform in a domain in general (e.g., “I am good at learning languages.”). Self-efficacy, on the other hand, relates to
how well a person believes they are capable of performing tasks in a specific domain (e.g., “I can order a
pizza on the phone in English” as a task of English communication) (Wang et al., 2014).
Over the past 37 years there has been a steady increase in studies linking self-efficacy to academic
achievement (Mills, 2014). In their 1996 review of motivational research (as cited in Mills, 2014), Graham
and Weiner wrote that studies consistently indicated that students with high academic task self-efficacy
exhibited lower levels of anxiety, greater persistence in the face of obstacles, a willingness to exert greater
effort, a greater use of learning strategies, and higher levels of intrinsic academic motivation than students
with low academic task self-efficacy. Studies have also linked self-efficacy with second language
achievement. Domains of interest have included reading (Burrows, 2013; Leung et al., 2019), speaking
(Busse & Walter, 2013), writing (Ruegg, 2014), and listening (Graham, 2007; Graham & Macaro, 2008;
2 L2 Listening Self-Efficacy
Shiken 24(2). December 2020.
Mills et al., 2006, 2007; Yan, 2012; Yang, 1999). In each domain self-efficacy universally has been found
to be positively correlated with and, for EFL reading, to have a causal effect on, achievement (Burrows,
2013).
Researchers who have conducted investigations of L2 listening self-efficacy have used several
instruments to do so. For example, Yan (2012) employed 16 items using an 11-point Likert scale that
asked participants to rate their predicted ability to understand main points, details, the meanings of
unknown words, and keywords on four kinds of listening tasks on the Chinese College Entrance Test 4
(CET4). A more general instrument was created by Mills, Pajares, and Herron (2006; 2007), who used a
14-item, eight-point Likert survey in their study of university intermediate-to-advanced L2 French
learners in the United States.
However, the results of these questionnaires were validated through the use of traditional statistical
methods (e.g., correlations and factor analyses). Rasch analysis offers several advantages over other
traditional analytical methods, such as Cronbach’s alpha reliability estimates, factor analyses, and
correlation to data from other questionnaires (Apple, 2013). First, Rasch analysis can determine how
difficult individual items are to agree with (endorse), whereas other measurements assume that all items
are equally endorsable. This is especially useful for allowing test creators to identify items that potentially
ask the same question in different wording. Second, Rasch analysis can identify misfitting people and
items that might not be contributing productively to the measurement of the construct. Third, although
Rasch reliability is considered akin to Cronbach’s alpha reliability, Rasch analysis provides reliability
estimates for both persons and items, while Cronbach’s reliability estimates only show the consistency of
person responses. Finally, Rasch principal components analysis (PCA) of item residuals can demonstrate
the degree to which items cohere to a single construct, while other measurements cannot.
Recognizing these advantages, on at least two occasions researchers have used Rasch analysis to validate
instruments that were created to measure L2 self-efficacy. Burrows (2013) used Rasch analysis to validate
his Reading Self-Efficacy Questionnaire, which was piloted among 200 Japanese university students. Lake
(2013) also created self-efficacy questionnaires to measure L2 English speaking self-efficacy (nine items),
reading self-efficacy (seven items), and listening self-efficacy (10 items) among 539 all-female Japanese
L2 English learners at two universities. The present study adds to the literature by providing a detailed
account of the development and validation of an L2 English listening self-efficacy questionnaire. The
analysis provided here is intended to guide researchers in the development of future questionnaires that
investigate self-efficacy and other psychological variables related to L2 education.
Purpose of This Study
The purpose of this study was to create a Likert-type questionnaire to evaluate EFL/ESL learners’ English
listening self-efficacy. The three research questions were as follows:
1. Does the order of item endorsability present a coherent picture of greater and lesser levels of
listening self-efficacy, as predicted by theory?
2. Do the questionnaire items fit the Rasch model sufficiently to indicate that they are measuring
a coherent, unidimensional construct?
3. What task features tend to make a listening self-efficacy item more difficult to endorse?
Shepherd Martin 3
Shiken 24(2). December 2020.
Materials and Methods
Participants
Initially there were 121 participants in this study. The participants (N = 121) were education majors at a
private university in western Japan. Of these participants, 36 were first-year elementary school education
majors in a four-skills English class (21 males, 15 females); 46 were second-year junior high school
English education majors in reading and writing English classes (27 males, 19 females); and 39 were
third-year elementary school education majors in an intensive reading English class (23 females, 16 males).
Their TOEIC Reading and Listening scores ranged from 300 to 600, with an average score of just over
400 points.
Prior to data analysis, questionnaires were examined for obvious patterns of irregularity (e.g., tests in
which the participant circled the same number for every item). As a result, seven participants were
removed, leaving data from 114 participants for analysis.
Instrument
The L2 English Listening Self-Efficacy Questionnaire was developed as a six-point Likert-type
questionnaire (see Appendices A and B). It contains 16 items that describe concrete listening scenarios.
The instructions indicate that participants should imagine that English is used in each scenario, and that
they should endorse their likelihood of accomplishing the task described by each item, on a scale of 1 (I
most likely cannot do it) to 6 (I most likely can do it). The questionnaire was initially written in English
and then translated into a Japanese version, which was answered by the participants in this study.
Items for the L2 English Listening Self-Efficacy Questionnaire were created based on descriptions of
listening ability as described by the Common European Framework of Reference for Languages (Council
of Europe, 2001), and from the American Council of the Teaching of Foreign Languages (ACTFL, 1986).
The items in this instrument are worded similarly to, and contain task features similar to, the one used by
Mills, Pajares, and Herron (2006, 2007), an instrument which was also based on ACTFL descriptions.
These descriptions were examined and the following features were found to influence how easy or difficult
a task was to endorse: (a) task familiarity (i.e., how much previous experience that a learner has had with
a task), (b) topic familiarity, (c) amount of time listening, (d) the use or absence of visual aids, (e) the
need to understand main points versus details, and (f) the ability to listen more than once (see Table 1).
Using the instrument by Mills et al. (2006, 2007) as an example, items were created that contained
variations of the identified task features, and that provided concrete descriptions of situations that were
applicable to the sample group (e.g., discussions of “life in Kansai”).

4 L2 Listening Self-Efficacy
Shiken 24(2). December 2020.
Table 1
Effects of task features on listening task endorsement difficulty
Feature Easier-to-Endorse More Difficult-to-Endorse
Task Familiarity More familiar to the listener Less familiar to the listener
Topic Familiarity More familiar to the listener Less familiar to the listener
Speaker Familiarity More familiar speaker or dialect Less familiar speaker or dialect
Length of Speech Shorter Longer
Use of Visual Aids Greater use of visual aids Less-or-no use of visual aids
Degree of Understanding Listening for main points Listening for details
Repetition Listening more than once Listening only once
The above features were expected to account for a large degree of the variance in CEFR and ACTFL item
endorsability. However, the impact of individual features on item endorsability remained unclear.
Therefore, a list of items was created and items were ordered from most endorsable to least endorsable
based on the CEFR and ACTFL listening proficiency descriptors. This ordering was used in the creation
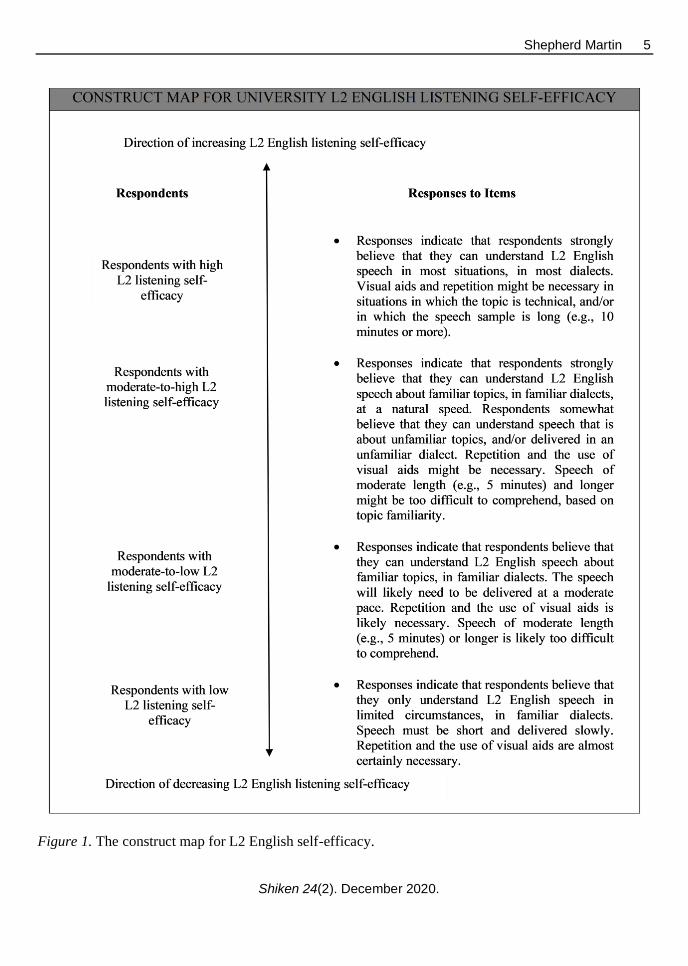
of an a priori construct map for this questionnaire, prior to administering the questionnaire (see Figure 1).
A construct map is a visual representation of the relationship between expressions of a construct (often
latent, or hypothesized) and rater, item, and test-taker performance data (Wilson, 2005). Wilson wrote
that a construct map must include two features: (a) a well-defined explanation of the content of the
construct, and (b) evidence that an underlying continuum represents the construct, and that respondents
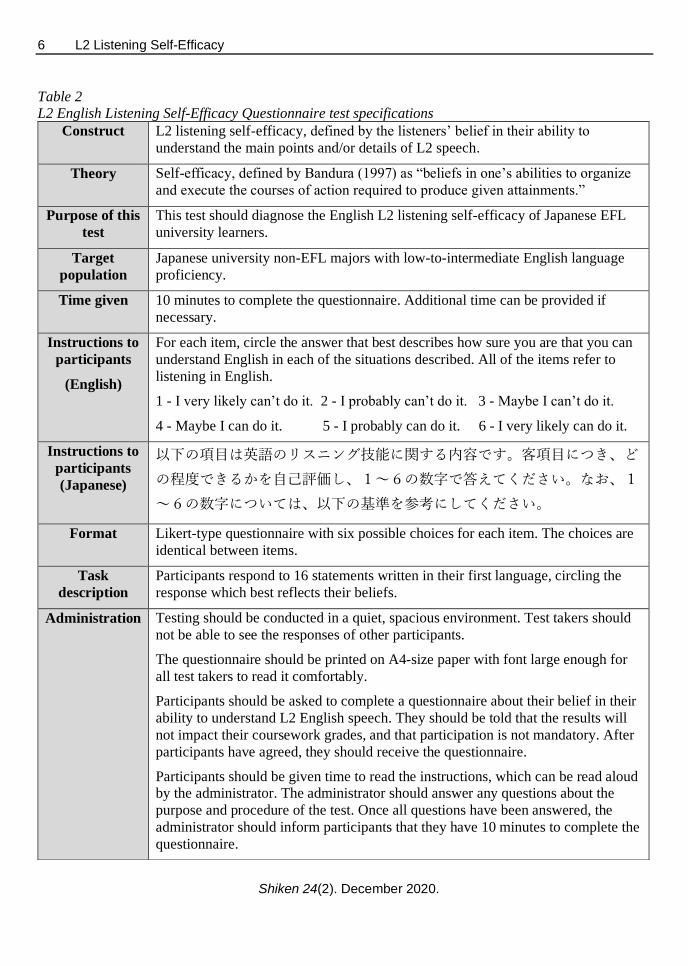
or items should be ordered upon it. A test specifications table was also created for this questionnaire (see
Table 2). It describes the guidelines for the development of the L2 English Listening Self-Efficacy
Questionnaire and for its implementation. This table was modeled on the test specification table used for
the Test of English for Academic Purposes (TEAP; Taylor, 2014).
Shepherd Martin 5
Shiken 24(2). December 2020.
Figure 1. The construct map for L2 English self-efficacy.
6 L2 Listening Self-Efficacy
Shiken 24(2). December 2020.
Table 2
L2 English Listening Self-Efficacy Questionnaire test specifications
Construct L2 listening self-efficacy, defined by the listeners’ belief in their ability to
understand the main points and/or details of L2 speech.
Theory Self-efficacy, defined by Bandura (1997) as “beliefs in one’s abilities to organize
and execute the courses of action required to produce given attainments.”
Purpose of this
test
This test should diagnose the English L2 listening self-efficacy of Japanese EFL
university learners.
Target
population
Japanese university non-EFL majors with low-to-intermediate English language
proficiency.
Time given 10 minutes to complete the questionnaire. Additional time can be provided if
necessary.
Instructions to
participants
(English)
For each item, circle the answer that best describes how sure you are that you can
understand English in each of the situations described. All of the items refer to
listening in English.
1 - I very likely can’t do it. 2 - I probably can’t do it. 3 - Maybe I can’t do it.
4 - Maybe I can do it. 5 - I probably can do it. 6 - I very likely can do it.
Instructions to
participants
(Japanese)
以下の項目は英語のリスニング技能に関する内容です。客項目につき、ど
の程度できるかを自己評価し、1~6の数字で答えてください。なお、1
~6の数字については、以下の基準を参考にしてください。
Format Likert-type questionnaire with six possible choices for each item. The choices are
identical between items.
Task
description
Participants respond to 16 statements written in their first language, circling the
response which best reflects their beliefs.
Administration Testing should be conducted in a quiet, spacious environment. Test takers should
not be able to see the responses of other participants.
The questionnaire should be printed on A4-size paper with font large enough for
all test takers to read it comfortably.
Participants should be asked to complete a questionnaire about their belief in their
ability to understand L2 English speech. They should be told that the results will
not impact their coursework grades, and that participation is not mandatory. After
participants have agreed, they should receive the questionnaire.
Participants should be given time to read the instructions, which can be read aloud
by the administrator. The administrator should answer any questions about the
purpose and procedure of the test. Once all questions have been answered, the
administrator should inform participants that they have 10 minutes to complete the
questionnaire.
Shepherd Martin 7
Shiken 24(2). December 2020.
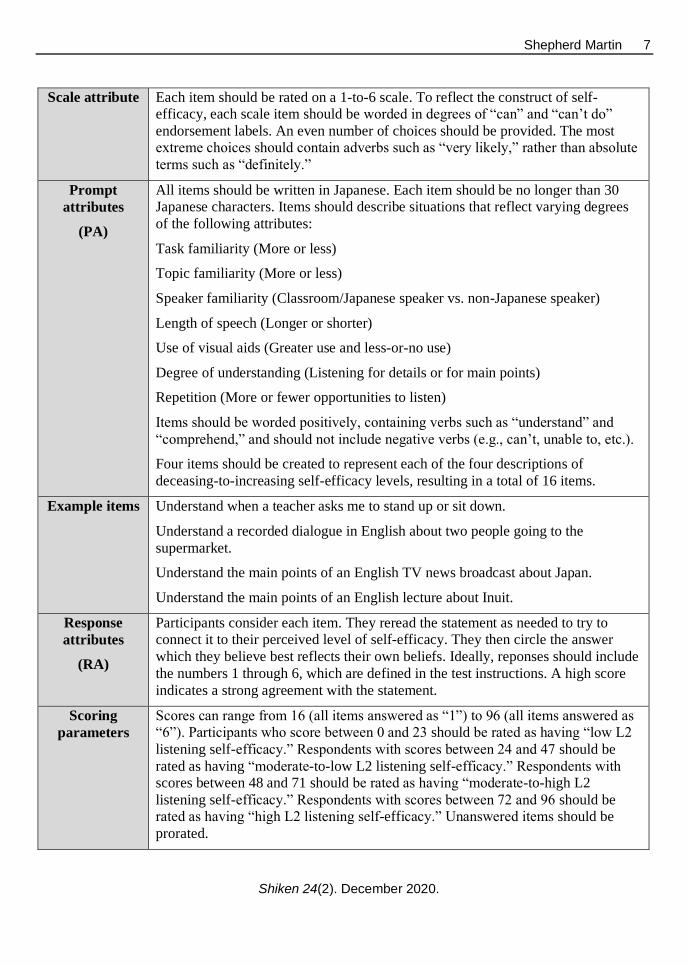
Scale attribute Each item should be rated on a 1-to-6 scale. To reflect the construct of self-
efficacy, each scale item should be worded in degrees of “can” and “can’t do”
endorsement labels. An even number of choices should be provided. The most
extreme choices should contain adverbs such as “very likely,” rather than absolute
terms such as “definitely.”
Prompt
attributes
(PA)
All items should be written in Japanese. Each item should be no longer than 30
Japanese characters. Items should describe situations that reflect varying degrees
of the following attributes:
Task familiarity (More or less)
Topic familiarity (More or less)
Speaker familiarity (Classroom/Japanese speaker vs. non-Japanese speaker)
Length of speech (Longer or shorter)
Use of visual aids (Greater use and less-or-no use)
Degree of understanding (Listening for details or for main points)
Repetition (More or fewer opportunities to listen)
Items should be worded positively, containing verbs such as “understand” and
“comprehend,” and should not include negative verbs (e.g., can’t, unable to, etc.).
Four items should be created to represent each of the four descriptions of
deceasing-to-increasing self-efficacy levels, resulting in a total of 16 items.
Example items Understand when a teacher asks me to stand up or sit down.
Understand a recorded dialogue in English about two people going to the
supermarket.
Understand the main points of an English TV news broadcast about Japan.
Understand the main points of an English lecture about Inuit.
Response
attributes
(RA)
Participants consider each item. They reread the statement as needed to try to
connect it to their perceived level of self-efficacy. They then circle the answer
which they believe best reflects their own beliefs. Ideally, reponses should include
the numbers 1 through 6, which are defined in the test instructions. A high score
indicates a strong agreement with the statement.
Scoring
parameters
Scores can range from 16 (all items answered as “1”) to 96 (all items answered as
“6”). Participants who score between 0 and 23 should be rated as having “low L2
listening self-efficacy.” Respondents with scores between 24 and 47 should be
rated as having “moderate-to-low L2 listening self-efficacy.” Respondents with
scores between 48 and 71 should be rated as having “moderate-to-high L2
listening self-efficacy.” Respondents with scores between 72 and 96 should be
rated as having “high L2 listening self-efficacy.” Unanswered items should be
prorated.
8 L2 Listening Self-Efficacy
Shiken 24(2). December 2020.
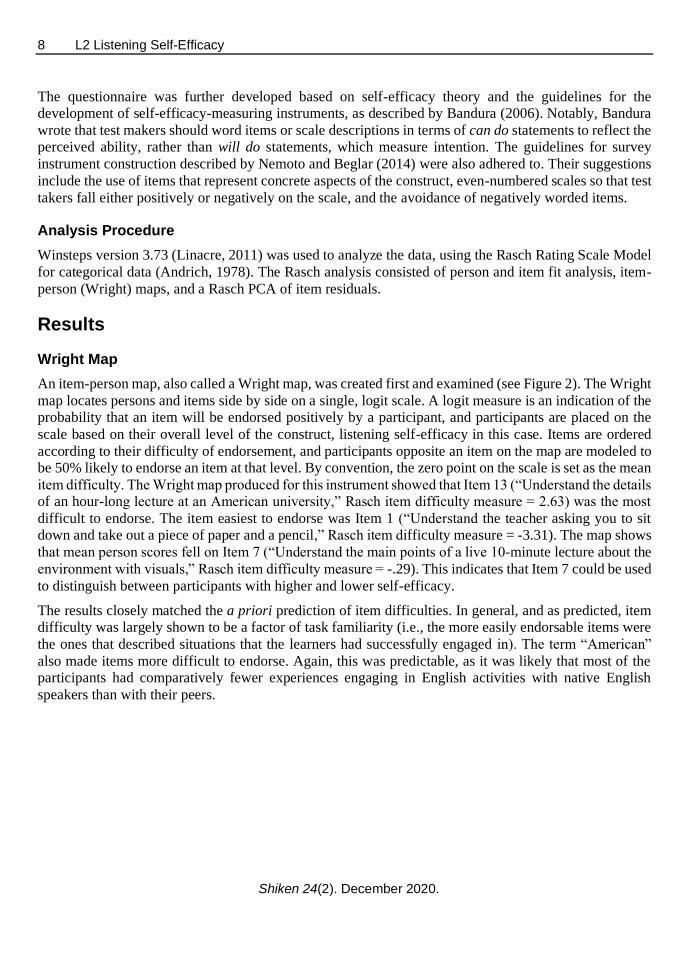
The questionnaire was further developed based on self-efficacy theory and the guidelines for the
development of self-efficacy-measuring instruments, as described by Bandura (2006). Notably, Bandura
wrote that test makers should word items or scale descriptions in terms of can do statements to reflect the
perceived ability, rather than will do statements, which measure intention. The guidelines for survey
instrument construction described by Nemoto and Beglar (2014) were also adhered to. Their suggestions
include the use of items that represent concrete aspects of the construct, even-numbered scales so that test
takers fall either positively or negatively on the scale, and the avoidance of negatively worded items.
Analysis Procedure
Winsteps version 3.73 (Linacre, 2011) was used to analyze the data, using the Rasch Rating Scale Model
for categorical data (Andrich, 1978). The Rasch analysis consisted of person and item fit analysis, item-
person (Wright) maps, and a Rasch PCA of item residuals.
Results
Wright Map
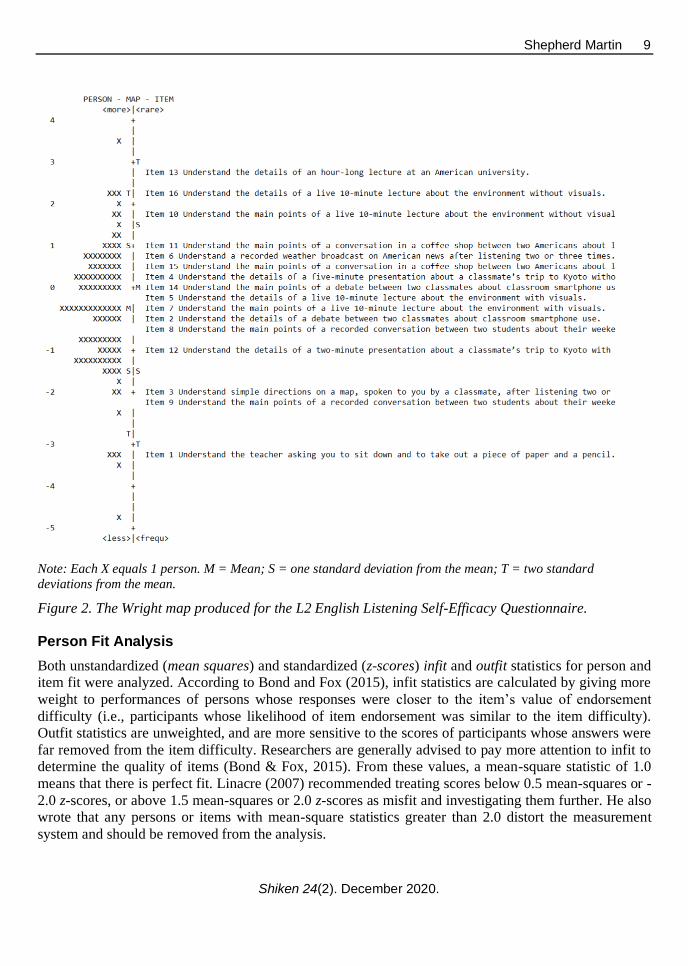
An item-person map, also called a Wright map, was created first and examined (see Figure 2). The Wright
map locates persons and items side by side on a single, logit scale. A logit measure is an indication of the
probability that an item will be endorsed positively by a participant, and participants are placed on the
scale based on their overall level of the construct, listening self-efficacy in this case. Items are ordered
according to their difficulty of endorsement, and participants opposite an item on the map are modeled to
be 50% likely to endorse an item at that level. By convention, the zero point on the scale is set as the mean
item difficulty. The Wright map produced for this instrument showed that Item 13 (“Understand the details
of an hour-long lecture at an American university,” Rasch item difficulty measure = 2.63) was the most
difficult to endorse. The item easiest to endorse was Item 1 (“Understand the teacher asking you to sit
down and take out a piece of paper and a pencil,” Rasch item difficulty measure = -3.31). The map shows
that mean person scores fell on Item 7 (“Understand the main points of a live 10-minute lecture about the
environment with visuals,” Rasch item difficulty measure = -.29). This indicates that Item 7 could be used
to distinguish between participants with higher and lower self-efficacy.
The results closely matched the a priori prediction of item difficulties. In general, and as predicted, item
difficulty was largely shown to be a factor of task familiarity (i.e., the more easily endorsable items were
the ones that described situations that the learners had successfully engaged in). The term “American”
also made items more difficult to endorse. Again, this was predictable, as it was likely that most of the
participants had comparatively fewer experiences engaging in English activities with native English
speakers than with their peers.
Shepherd Martin 9
Shiken 24(2). December 2020.
Note: Each X equals 1 person. M = Mean; S = one standard deviation from the mean; T = two standard
deviations from the mean.
Figure 2. The Wright map produced for the L2 English Listening Self-Efficacy Questionnaire.
Person Fit Analysis
Both unstandardized (mean squares) and standardized (z-scores) infit and outfit statistics for person and item fit were analyzed. According to Bond and Fox (2015), infit statistics are calculated by giving more
weight to performances of persons whose responses were closer to the item’s value of endorsement
difficulty (i.e., participants whose likelihood of item endorsement was similar to the item difficulty).
Outfit statistics are unweighted, and are more sensitive to the scores of participants whose answers were
far removed from the item difficulty. Researchers are generally advised to pay more attention to infit to
determine the quality of items (Bond & Fox, 2015). From these values, a mean-square statistic of 1.0
means that there is perfect fit. Linacre (2007) recommended treating scores below 0.5 mean-squares or -
2.0 z-scores, or above 1.5 mean-squares or 2.0 z-scores as misfit and investigating them further. He also
wrote that any persons or items with mean-square statistics greater than 2.0 distort the measurement
system and should be removed from the analysis.
10 L2 Listening Self-Efficacy
Shiken 24(2). December 2020.
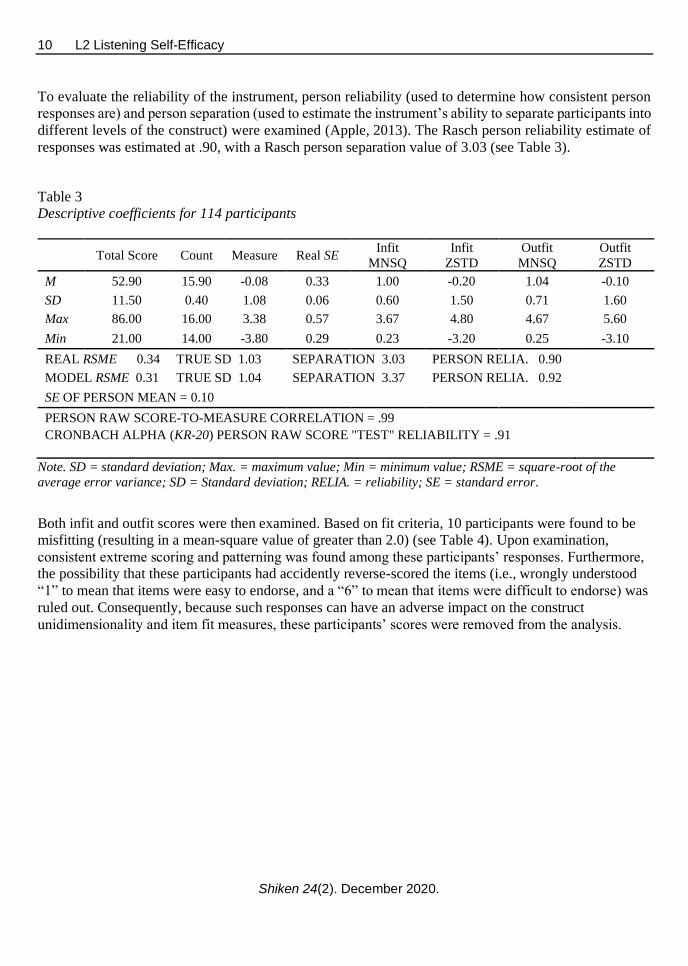
To evaluate the reliability of the instrument, person reliability (used to determine how consistent person
responses are) and person separation (used to estimate the instrument’s ability to separate participants into
different levels of the construct) were examined (Apple, 2013). The Rasch person reliability estimate of
responses was estimated at .90, with a Rasch person separation value of 3.03 (see Table 3).
Table 3
Descriptive coefficients for 114 participants
Total Score Count Measure Real SE Infit
MNSQ
Infit
ZSTD
Outfit
MNSQ
Outfit
ZSTD
M 52.90 15.90 -0.08 0.33 1.00 -0.20 1.04 -0.10
SD 11.50 0.40 1.08 0.06 0.60 1.50 0.71 1.60
Max 86.00 16.00 3.38 0.57 3.67 4.80 4.67 5.60
Min 21.00 14.00 -3.80 0.29 0.23 -3.20 0.25 -3.10
REAL RSME 0.34 TRUE SD 1.03 SEPARATION 3.03 PERSON RELIA. 0.90
MODEL RSME 0.31 TRUE SD 1.04 SEPARATION 3.37 PERSON RELIA. 0.92
SE OF PERSON MEAN = 0.10
PERSON RAW SCORE-TO-MEASURE CORRELATION = .99
CRONBACH ALPHA (KR-20) PERSON RAW SCORE "TEST" RELIABILITY = .91
Note. SD = standard deviation; Max. = maximum value; Min = minimum value; RSME = square-root of the
average error variance; SD = Standard deviation; RELIA. = reliability; SE = standard error.
Both infit and outfit scores were then examined. Based on fit criteria, 10 participants were found to be
misfitting (resulting in a mean-square value of greater than 2.0) (see Table 4). Upon examination,
consistent extreme scoring and patterning was found among these participants’ responses. Furthermore,
the possibility that these participants had accidently reverse-scored the items (i.e., wrongly understood
“1” to mean that items were easy to endorse, and a “6” to mean that items were difficult to endorse) was
ruled out. Consequently, because such responses can have an adverse impact on the construct
unidimensionality and item fit measures, these participants’ scores were removed from the analysis.
Shepherd Martin 11
Shiken 24(2). December 2020.
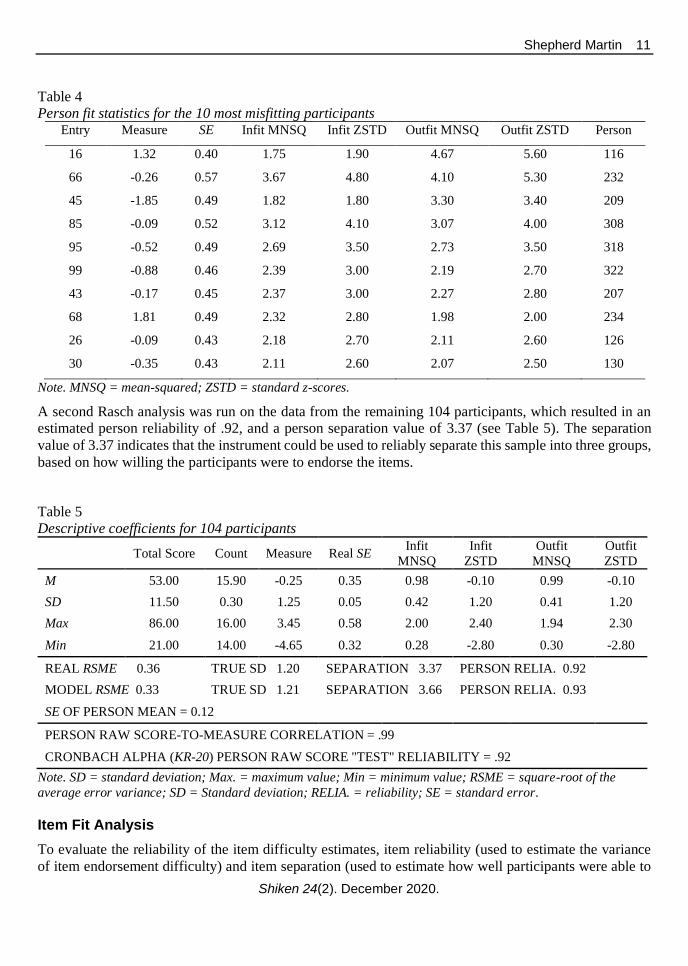
Table 4
Person fit statistics for the 10 most misfitting participants Entry Measure SE Infit MNSQ Infit ZSTD Outfit MNSQ Outfit ZSTD Person
16 1.32 0.40 1.75 1.90 4.67 5.60 116
66 -0.26 0.57 3.67 4.80 4.10 5.30 232
45 -1.85 0.49 1.82 1.80 3.30 3.40 209
85 -0.09 0.52 3.12 4.10 3.07 4.00 308
95 -0.52 0.49 2.69 3.50 2.73 3.50 318
99 -0.88 0.46 2.39 3.00 2.19 2.70 322
43 -0.17 0.45 2.37 3.00 2.27 2.80 207
68 1.81 0.49 2.32 2.80 1.98 2.00 234
26 -0.09 0.43 2.18 2.70 2.11 2.60 126
30 -0.35 0.43 2.11 2.60 2.07 2.50 130
Note. MNSQ = mean-squared; ZSTD = standard z-scores.
A second Rasch analysis was run on the data from the remaining 104 participants, which resulted in an
estimated person reliability of .92, and a person separation value of 3.37 (see Table 5). The separation
value of 3.37 indicates that the instrument could be used to reliably separate this sample into three groups,
based on how willing the participants were to endorse the items.
Table 5
Descriptive coefficients for 104 participants
Total Score Count Measure Real SE Infit
MNSQ
Infit
ZSTD
Outfit
MNSQ
Outfit
ZSTD
M 53.00 15.90 -0.25 0.35 0.98 -0.10 0.99 -0.10
SD 11.50 0.30 1.25 0.05 0.42 1.20 0.41 1.20
Max 86.00 16.00 3.45 0.58 2.00 2.40 1.94 2.30
Min 21.00 14.00 -4.65 0.32 0.28 -2.80 0.30 -2.80
REAL RSME 0.36 TRUE SD 1.20 SEPARATION 3.37 PERSON RELIA. 0.92
MODEL RSME 0.33 TRUE SD 1.21 SEPARATION 3.66 PERSON RELIA. 0.93
SE OF PERSON MEAN = 0.12
PERSON RAW SCORE-TO-MEASURE CORRELATION = .99
CRONBACH ALPHA (KR-20) PERSON RAW SCORE "TEST" RELIABILITY = .92
Note. SD = standard deviation; Max. = maximum value; Min = minimum value; RSME = square-root of the
average error variance; SD = Standard deviation; RELIA. = reliability; SE = standard error.
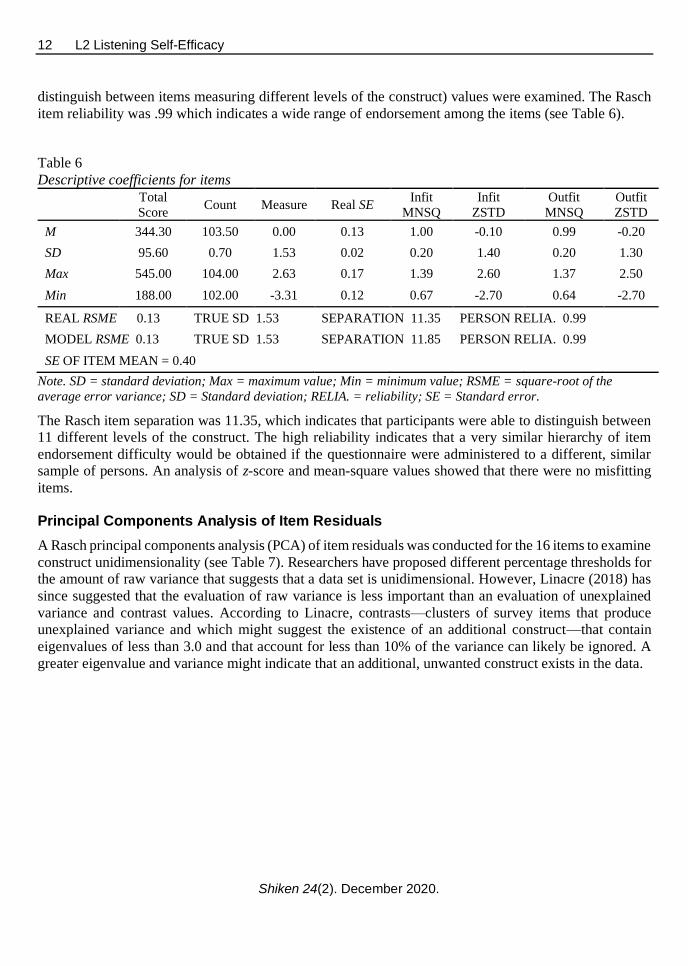
Item Fit Analysis
To evaluate the reliability of the item difficulty estimates, item reliability (used to estimate the variance
of item endorsement difficulty) and item separation (used to estimate how well participants were able to
12 L2 Listening Self-Efficacy
Shiken 24(2). December 2020.
distinguish between items measuring different levels of the construct) values were examined. The Rasch
item reliability was .99 which indicates a wide range of endorsement among the items (see Table 6).
Table 6
Descriptive coefficients for items
Total
Score Count Measure Real SE
Infit
MNSQ
Infit
ZSTD
Outfit
MNSQ
Outfit
ZSTD
M 344.30 103.50 0.00 0.13 1.00 -0.10 0.99 -0.20
SD 95.60 0.70 1.53 0.02 0.20 1.40 0.20 1.30
Max 545.00 104.00 2.63 0.17 1.39 2.60 1.37 2.50
Min 188.00 102.00 -3.31 0.12 0.67 -2.70 0.64 -2.70
REAL RSME 0.13 TRUE SD 1.53 SEPARATION 11.35 PERSON RELIA. 0.99
MODEL RSME 0.13 TRUE SD 1.53 SEPARATION 11.85 PERSON RELIA. 0.99
SE OF ITEM MEAN = 0.40
Note. SD = standard deviation; Max = maximum value; Min = minimum value; RSME = square-root of the
average error variance; SD = Standard deviation; RELIA. = reliability; SE = Standard error.
The Rasch item separation was 11.35, which indicates that participants were able to distinguish between
11 different levels of the construct. The high reliability indicates that a very similar hierarchy of item
endorsement difficulty would be obtained if the questionnaire were administered to a different, similar
sample of persons. An analysis of z-score and mean-square values showed that there were no misfitting
items.
Principal Components Analysis of Item Residuals
A Rasch principal components analysis (PCA) of item residuals was conducted for the 16 items to examine
construct unidimensionality (see Table 7). Researchers have proposed different percentage thresholds for
the amount of raw variance that suggests that a data set is unidimensional. However, Linacre (2018) has
since suggested that the evaluation of raw variance is less important than an evaluation of unexplained
variance and contrast values. According to Linacre, contrasts—clusters of survey items that produce
unexplained variance and which might suggest the existence of an additional construct—that contain
eigenvalues of less than 3.0 and that account for less than 10% of the variance can likely be ignored. A
greater eigenvalue and variance might indicate that an additional, unwanted construct exists in the data.
Shepherd Martin 13
Shiken 24(2). December 2020.
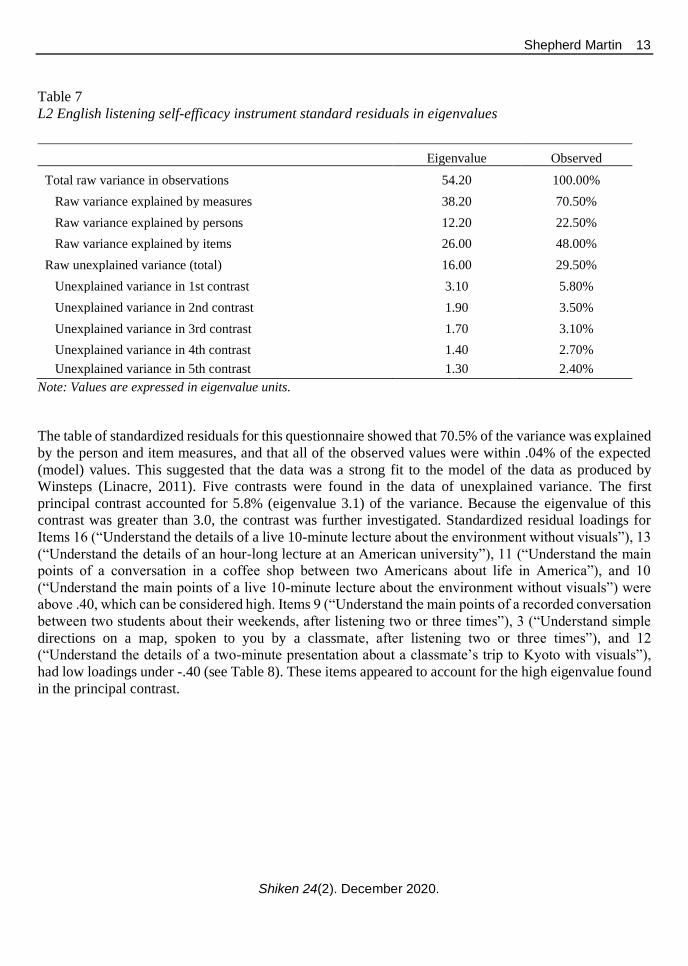
Table 7
L2 English listening self-efficacy instrument standard residuals in eigenvalues
Note: Values are expressed in eigenvalue units.
The table of standardized residuals for this questionnaire showed that 70.5% of the variance was explained
by the person and item measures, and that all of the observed values were within .04% of the expected
(model) values. This suggested that the data was a strong fit to the model of the data as produced by
Winsteps (Linacre, 2011). Five contrasts were found in the data of unexplained variance. The first
principal contrast accounted for 5.8% (eigenvalue 3.1) of the variance. Because the eigenvalue of this
contrast was greater than 3.0, the contrast was further investigated. Standardized residual loadings for
Items 16 (“Understand the details of a live 10-minute lecture about the environment without visuals”), 13
(“Understand the details of an hour-long lecture at an American university”), 11 (“Understand the main
points of a conversation in a coffee shop between two Americans about life in America”), and 10
(“Understand the main points of a live 10-minute lecture about the environment without visuals”) were
above .40, which can be considered high. Items 9 (“Understand the main points of a recorded conversation
between two students about their weekends, after listening two or three times”), 3 (“Understand simple
directions on a map, spoken to you by a classmate, after listening two or three times”), and 12
(“Understand the details of a two-minute presentation about a classmate’s trip to Kyoto with visuals”),
had low loadings under -.40 (see Table 8). These items appeared to account for the high eigenvalue found
in the principal contrast.
Eigenvalue Observed
Total raw variance in observations 54.20 100.00%
Raw variance explained by measures 38.20 70.50%
Raw variance explained by persons 12.20 22.50%
Raw variance explained by items 26.00 48.00%
Raw unexplained variance (total) 16.00 29.50%
Unexplained variance in 1st contrast 3.10 5.80%
Unexplained variance in 2nd contrast 1.90 3.50%
Unexplained variance in 3rd contrast 1.70 3.10%
Unexplained variance in 4th contrast 1.40 2.70%
Unexplained variance in 5th contrast 1.30 2.40%
14 L2 Listening Self-Efficacy
Shiken 24(2). December 2020.
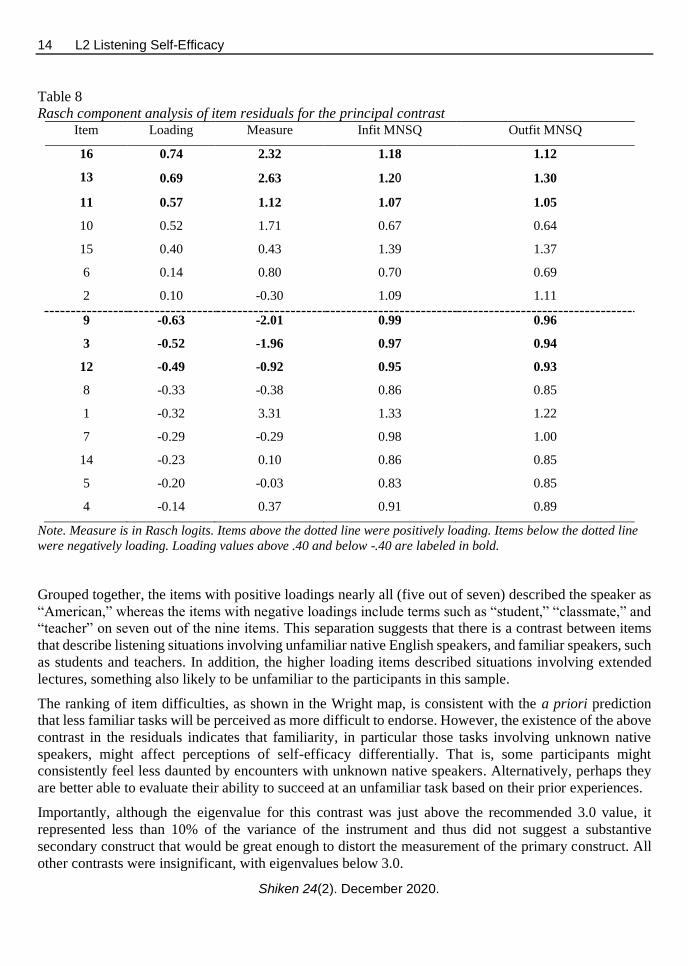
Table 8
Rasch component analysis of item residuals for the principal contrast Item Loading Measure Infit MNSQ Outfit MNSQ
16 0.74 2.32 1.18 1.12
13 0.69 2.63 1.20 1.30
11 0.57 1.12 1.07 1.05
10 0.52 1.71 0.67 0.64
15 0.40 0.43 1.39 1.37
6 0.14 0.80 0.70 0.69
2 0.10 -0.30 1.09 1.11
9 -0.63 -2.01 0.99 0.96
3 -0.52 -1.96 0.97 0.94
12 -0.49 -0.92 0.95 0.93
8 -0.33 -0.38 0.86 0.85
1 -0.32 3.31 1.33 1.22
7 -0.29 -0.29 0.98 1.00
14 -0.23 0.10 0.86 0.85
5 -0.20 -0.03 0.83 0.85
4 -0.14 0.37 0.91 0.89
Note. Measure is in Rasch logits. Items above the dotted line were positively loading. Items below the dotted line
were negatively loading. Loading values above .40 and below -.40 are labeled in bold.
Grouped together, the items with positive loadings nearly all (five out of seven) described the speaker as
“American,” whereas the items with negative loadings include terms such as “student,” “classmate,” and
“teacher” on seven out of the nine items. This separation suggests that there is a contrast between items
that describe listening situations involving unfamiliar native English speakers, and familiar speakers, such
as students and teachers. In addition, the higher loading items described situations involving extended
lectures, something also likely to be unfamiliar to the participants in this sample.
The ranking of item difficulties, as shown in the Wright map, is consistent with the a priori prediction
that less familiar tasks will be perceived as more difficult to endorse. However, the existence of the above
contrast in the residuals indicates that familiarity, in particular those tasks involving unknown native
speakers, might affect perceptions of self-efficacy differentially. That is, some participants might
consistently feel less daunted by encounters with unknown native speakers. Alternatively, perhaps they
are better able to evaluate their ability to succeed at an unfamiliar task based on their prior experiences.
Importantly, although the eigenvalue for this contrast was just above the recommended 3.0 value, it
represented less than 10% of the variance of the instrument and thus did not suggest a substantive
secondary construct that would be great enough to distort the measurement of the primary construct. All
other contrasts were insignificant, with eigenvalues below 3.0.
Shepherd Martin 15
Shiken 24(2). December 2020.
Discussion
Regarding Research Question 1, the item and person reliability and separation indices, as well as the
Wright map, both suggested that the order of item endorsement difficulties produced evidence of greater
and lesser levels of L2 English listening self-efficacy among the participants. The Wright map showed
that the person and item means were nearly matched, and that the spread of items appeared to be a close
match to the range of participants’ likelihood to endorse. The item separation values suggested that the
items represented listening scenarios that varied in their difficulty in a reasonably uniform manner, with
at least 11 levels of difficulty identified. The person separation value (3.37) suggested that participants
could be separated into three groups, based on the results of the questionnaire. These could represent
groups of participants with low, medium, and high listening self-efficacy. Finally, the Wright map also
showed that only one participant approached the highest score, and only five approached the lowest score.
This suggested that no “ceiling” or “floor” effect existed, and that the instrument was able to measure all
participants on the continuum of low-to-high listening self-efficacy, as hoped.
The second research question was whether the questionnaire items fit the Rasch model sufficiently to
indicate that they are measuring a unidimensional construct. The PCA of item residuals indicated that a
single, coherent construct was measured. One significant contrast was also found, between items that
included “American” speakers and other, classroom-based speakers (e.g., “teacher” and “classmate”).
However, that contrast, although interesting, accounted for only a small amount of unexplained variance
(5.8%), and therefore arguably did not disrupt the measurement of the main construct (self-efficacy).
Finally, the third research question asked which task features were found to make items more difficult to
endorse. Several factors were found to make items more or less difficult to endorse, most of which
arguably reflected the amount of task familiarity, or mastery experience, that the participants had in
relation to each item. The term “American” was found in five of the six most difficult-to-endorse items,
and appeared to have the greatest impact on item endorsability. I used the term “American” to describe a
native-English speaking stranger. If the participants also interpreted the “American” speaker to be a
stranger, then these items represent situations in which participants likely had little experience (low task
familiarity), and that could explain why these items were more shown to be more difficult to endorse.
Broadly, length of tasks also appeared to be a determining factor, with two-minute scenarios shown to be
more easily endorsable than the five-minute scenarios, and those easier to endorse than the 10-minute
scenarios. Beyond that, item difficulty generally was found to increase as predicted by the by task feature
table. Items that described listening for “main points” were easier to endorse than items that described
listening for “details,” items that described listening scenarios that included “visual aids” were also easier
to endorse than those without visual aids, and items that described shorter listening tasks were easier to
endorse than those with longer tasks.
Future Directions
The Rasch analysis of the questionnaire suggests that it measured a unidimensional construct, which,
based on the evidence described previously, represents L2 English listening self-efficacy. However, the
instrument could be improved in at least two ways. First, as previously mentioned, the term “American”
appeared to have some impact on the perceived endorsement difficulty of the items in the instrument. I
used the term “American” to indicate a “native English” or “non-Japanese” speaker of English. I chose
this term to make the scenarios concrete for the participants, because the participants had experience
listening to their class teacher, who spoke English with an American accent. However, this word arguably
represents a cultural bias. Another term, such as “native English speaker” or “non-Japanese speaker of
16 L2 Listening Self-Efficacy
Shiken 24(2). December 2020.
English” would help to eliminate this potential bias, and might therefore have an impact on the degree of
item difficulty.
Second, although the items appear to represent a wide range of endorsement difficulty, a wider range
might be desirable in some circumstances, such as a group of participants with generally lower listening
self-efficacy. In such contexts, researchers might require more items in the lower range with which to
better differentiate among participants. The construct map provided previously (see Figure 1) could be
used to guide the development of such items.
Third, I did not include a qualitative element to this study. In the future, a deeper insight into L2 listening
self-efficacy could be gained by asking participants which item features they believed made items easier
or more difficult to endorse.
Finally, the results suggested that the items produced 11 levels of endorsability. This suggested that
several levels only contained one or two items. Future instruments might be made more accurate if more
items are developed for the various levels.
Conclusion
Results from the validation of the instrument using Rasch analysis indicated that the instrument reliably
measured several levels of the construct. This analysis adds further support to similar instruments used in
previous studies of L2 self-efficacy (e.g., Burrows, 2013; Mills et al., 2006; 2007). These results, as well
as the description of the theoretical basis for the creation of the test items, can hopefully be used as a basis
for future investigations into L2 self-efficacy in a range of contexts and among learners of differing
proficiency levels.
Acknowledgments
I would like to thank Dr. James Sick for introducing me to Rasch analysis, and for his feedback on earlier
drafts of this manuscript.
References
American Council for the Teaching of Foreign Languages. (1986). ACTFL Proficiency Guidelines.
Revised 1986. ACTFL Materials Center.
Andrich, D. (1978). Scaling attitude items constructed and scored in the Likert tradition. Educational
and Psychological Measurement, 38, 665–680. https://doi.org/10.1177/001316447803800308
Apple, M. (2013). Using Rasch analysis to create and evaluate a measurement instrument for foreign
language classroom speaking anxiety. JALT Journal, 35(1), 5–28. Retrieved from https://jalt-
publications.org/sites/default/files/pdf/jaltjournal/jj2013a.pdf
Bandura, A. (1977). Self-efficacy: Toward a unifying theory of behavioral change. Psychological
Review, 84, 191–215. https://doi.org/10.1037/0033-295X.84.2.191
Bandura, A. (1997). Self-efficacy: The exercise of control. Cambridge University Press.
Bandura, A. (2006). Guide for constructing self-efficacy scales. In T. Urdan & F. Pajares (Eds.), Self-
efficacy beliefs of adolescents (pp. 307–337). Information Age Publishing.
Bond, T. G., & Fox., C. M. (2015). Applying the Rasch model: Fundamental measurement in human
sciences (3rd ed). Routledge.
Shepherd Martin 17
Shiken 24(2). December 2020.
Burrows, L. (2013). The effects of extensive reading and reading strategies on reading self-efficacy
(Unpublished doctoral dissertation). Temple University.
Busse, V., & Walter, C. (2013). Language motivation in higher education: A longitudinal study of
motivational changes and their causes. The Modern Language Journal, 97(2), 435–456.
https://doi.org/10.1111/j.1540-4781.2013.12004.x
Council of Europe. (2001). Common European framework of reference for languages: Learning,
teaching, assessment. Press Syndicate of the University of Cambridge.
Graham, S. (2007). Learner strategies and self-efficacy: Making the connection. Language Learning
Journal, 35(1), 81–93. https://doi.org/10.1080/09571730701315832
Graham, S., & Macaro, E. (2008). Strategy instruction in listening for lower-intermediate learners of
French. Language Learning, 58, 747–783. https://doi.org/10.1111/j.1467-9922.2008.00478.x
Lake, J. (2013). Positive L2 self: Linking positive psychology with L2 motivation. In M. T. Apple, D.
Da Silva & T. Fellner (Eds.). Language Learning Motivation in Japan. (pp. 225-244). Multilingual
Matters.
Leung, C.-Y., Mikami, H., & Yoshikawa, L. (2019). Positive psychology broadens readers’ attentional
scope during L2 reading: Evidence from eye movements. Frontiers in Psychology, 10, 1–12.
https://doi.org/10.3389/fpsyg.2019.02245
Linacre, J. M. (2007). A user’s guide to WINSTEPS: Rasch-model computer program.
MESA.
Linacre, J. M. (2011). Winsteps (Version 3.73). [Computer software]. Winsteps.com
Linacre, J. M. (2018, September 2). Detecting multidimensionality in Rasch data using Winsteps Table
23 [Video]. YouTube. https://www.youtube.com/watch?v=sna19QemE50
Mills, N. (2014). Self-efficacy in second language acquisition. In S. Mercer & M. Williams (Eds.),
Multiple perspectives on the self in SLA (pp. 6–19). Multilingual Matters.
Mills, N., Pajares, F., & Herron, C. (2006). A re-evaluation of the role of anxiety: Self-efficacy, anxiety,
and their relation to reading and listening proficiency. Foreign Language Annals, 39(2), 276–295.
https://doi.org/10.1111/j.1944-9720.2006.tb02266.x
Mills, N., Pajares, F., & Herron, C. (2007). Students: Relation to achievement and motivation.
Language Learning, 57(3), 417–442. https://doi.org/10.1111/j.1467-9922.2007.00421.x
Nemoto, T., & Beglar, D. (2014). Developing Likert-scale questionnaires. In N. Sonda & A. Krause
(Eds.), JALT2013 Conference Proceedings. JALT. Retrieved from https://jalt-
publications.org/files/pdf-article/jalt2013_001.pdf
Rahimi, M., & Abedi, S. (2014). The relationship between listening self-efficacy and metacognitive
awareness of listening strategies. Procedia: Social and Behavior Sciences, 98, 1454–1460.
https://doi.org/10.1016/j.sbspro.2014.03.565
Ruegg, R. (2014). The effect of peer and teacher feedback on changes in EFL students’ writing self-
efficacy. The Language Learning Journal, 46(2), 87–102.
https://doi.org/10.1080/09571736.2014.958190
18 L2 Listening Self-Efficacy
Shiken 24(2). December 2020.
Taylor, L. (2014). A report on the review of test specifications for the reading and listening papers of the Test of English for Academic Purposes (TEAP) for Japanese university entrants. Retrieved from
https://www.eiken.or.jp/teap/group/pdf/teap_rlspecreview_report.pdf
Wang, C., Kim, D.-H., Bai, R., & Hu, J. (2014). Psychometric properties of a self-efficacy scale for
English language learners in China. System, 44, 24–33. https://doi.org/10.1016/j.system.2014.01.015
Wilson, M. (2005). Constructing measures: An item response modeling approach. Lawrence Erlbaum
Associates.
Yan, R. (2012). Improving English listening self-efficacy of Chinese university students: Influences of learning strategy training with feedback on strategy use and performance (Unpublished doctoral
dissertation). Retrieved from https://core.ac.uk/download/pdf/6116686.pdf
Yang, N.-D. (1999). The relationship between EFL learners’ beliefs and learning strategy use. System,
27(4), 515–535. https://doi.org/10.1016/S0346-251X(99)00048-2
Shepherd Martin 19
Shiken 24(2). December 2020.
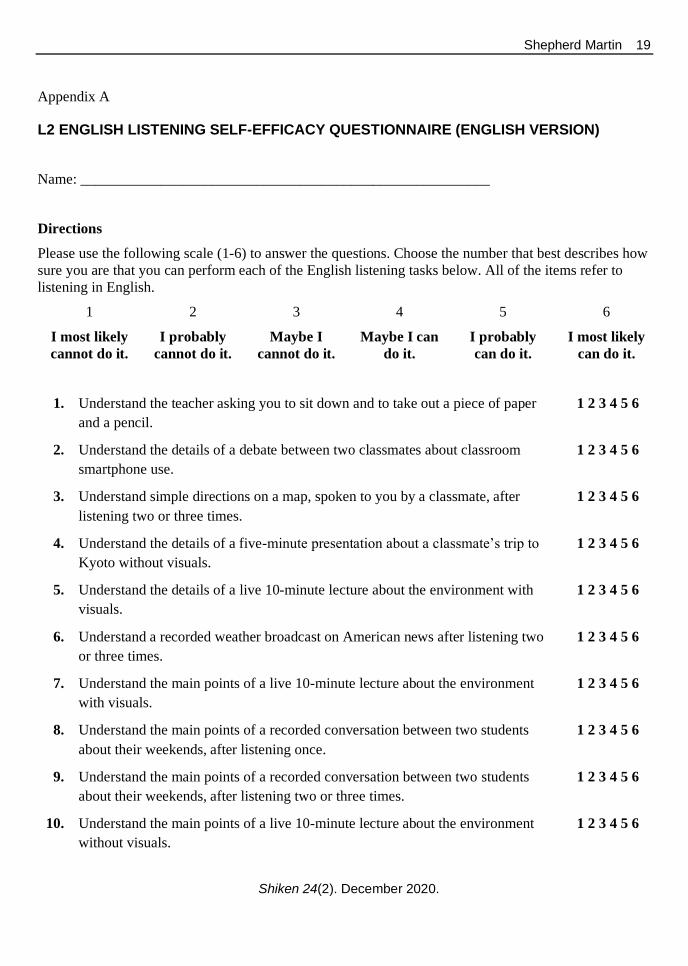
Appendix A
L2 ENGLISH LISTENING SELF-EFFICACY QUESTIONNAIRE (ENGLISH VERSION)
Name: ________________________________________________________
Directions
Please use the following scale (1-6) to answer the questions. Choose the number that best describes how
sure you are that you can perform each of the English listening tasks below. All of the items refer to
listening in English.
1
I most likely
cannot do it.
2
I probably
cannot do it.
3
Maybe I
cannot do it.
4
Maybe I can
do it.
5
I probably
can do it.
6
I most likely
can do it.
1. Understand the teacher asking you to sit down and to take out a piece of paper
and a pencil.
1 2 3 4 5 6
2. Understand the details of a debate between two classmates about classroom
smartphone use.
1 2 3 4 5 6
3. Understand simple directions on a map, spoken to you by a classmate, after
listening two or three times.
1 2 3 4 5 6
4. Understand the details of a five-minute presentation about a classmate’s trip to
Kyoto without visuals.
1 2 3 4 5 6
5. Understand the details of a live 10-minute lecture about the environment with
visuals.
1 2 3 4 5 6
6. Understand a recorded weather broadcast on American news after listening two
or three times.
1 2 3 4 5 6
7. Understand the main points of a live 10-minute lecture about the environment
with visuals.
1 2 3 4 5 6
8. Understand the main points of a recorded conversation between two students
about their weekends, after listening once.
1 2 3 4 5 6
9. Understand the main points of a recorded conversation between two students
about their weekends, after listening two or three times.
1 2 3 4 5 6
10. Understand the main points of a live 10-minute lecture about the environment
without visuals.
1 2 3 4 5 6
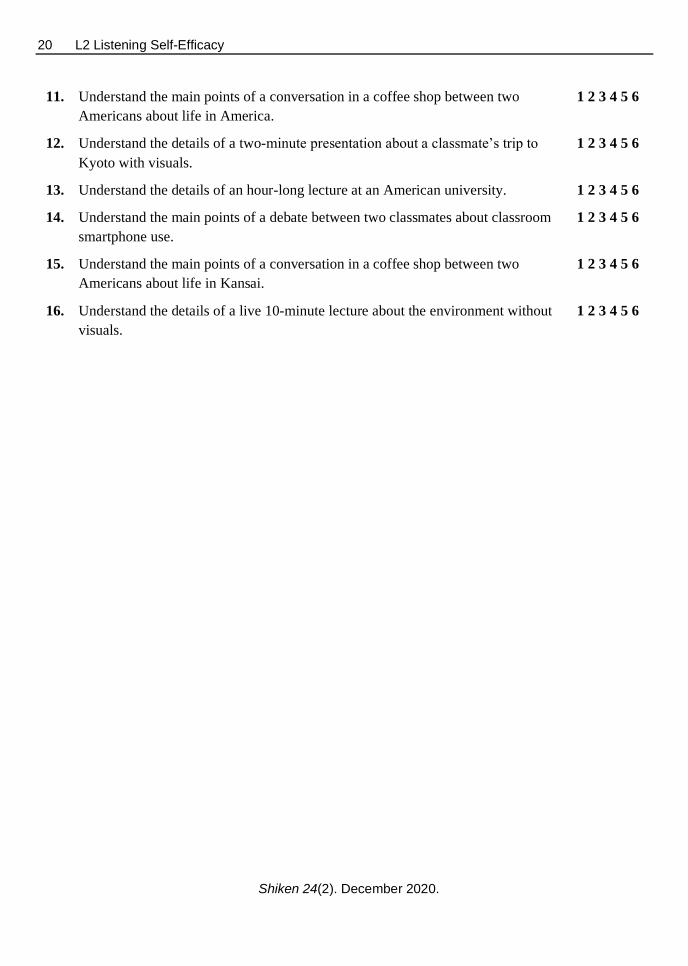
20 L2 Listening Self-Efficacy
Shiken 24(2). December 2020.
11. Understand the main points of a conversation in a coffee shop between two
Americans about life in America.
1 2 3 4 5 6
12. Understand the details of a two-minute presentation about a classmate’s trip to
Kyoto with visuals.
1 2 3 4 5 6
13. Understand the details of an hour-long lecture at an American university. 1 2 3 4 5 6
14. Understand the main points of a debate between two classmates about classroom
smartphone use.
1 2 3 4 5 6
15. Understand the main points of a conversation in a coffee shop between two
Americans about life in Kansai.
1 2 3 4 5 6
16. Understand the details of a live 10-minute lecture about the environment without
visuals.
1 2 3 4 5 6
Shepherd Martin 21
Shiken 24(2). December 2020.
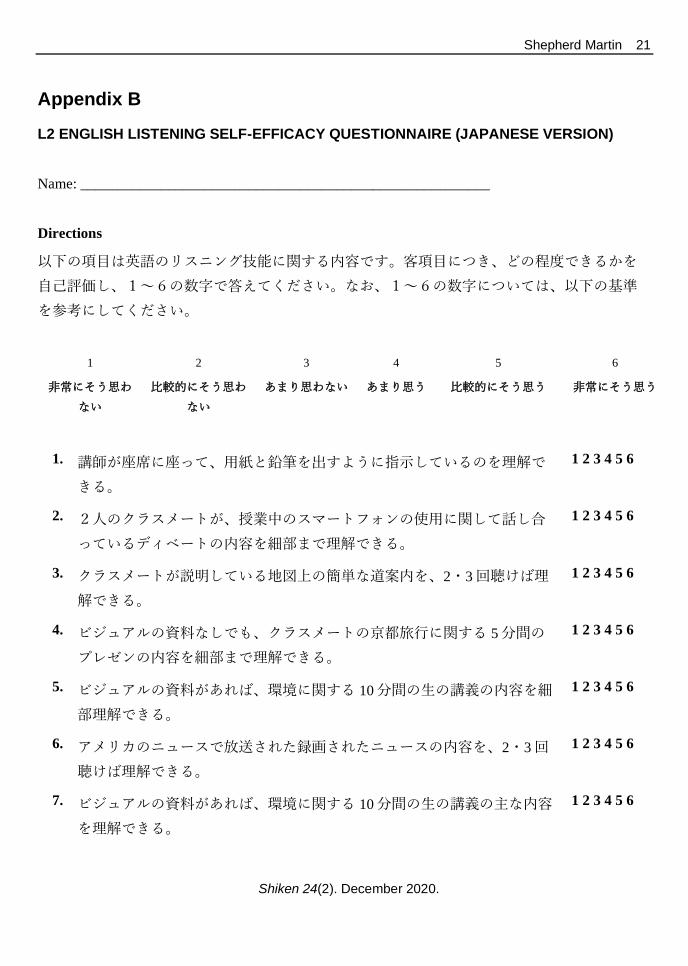
Appendix B
L2 ENGLISH LISTENING SELF-EFFICACY QUESTIONNAIRE (JAPANESE VERSION)
Name: ________________________________________________________
Directions
以下の項目は英語のリスニング技能に関する内容です。客項目につき、どの程度できるかを
自己評価し、1~6の数字で答えてください。なお、1~6の数字については、以下の基準
を参考にしてください。
1
非常にそう思わ
ない
2
比較的にそう思わ
ない
3
あまり思わない
4
あまり思う
5
比較的にそう思う
6
非常にそう思う
1. 講師が座席に座って、用紙と鉛筆を出すように指示しているのを理解で
きる。
1 2 3 4 5 6
2. 2人のクラスメートが、授業中のスマートフォンの使用に関して話し合
っているディベートの内容を細部まで理解できる。
1 2 3 4 5 6
3. クラスメートが説明している地図上の簡単な道案内を、2・3回聴けば理
解できる。
1 2 3 4 5 6
4. ビジュアルの資料なしでも、クラスメートの京都旅行に関する 5分間の
プレゼンの内容を細部まで理解できる。
1 2 3 4 5 6
5. ビジュアルの資料があれば、環境に関する 10分間の生の講義の内容を細
部理解できる。
1 2 3 4 5 6
6. アメリカのニュースで放送された録画されたニュースの内容を、2・3回
聴けば理解できる。
1 2 3 4 5 6
7. ビジュアルの資料があれば、環境に関する 10分間の生の講義の主な内容
を理解できる。
1 2 3 4 5 6
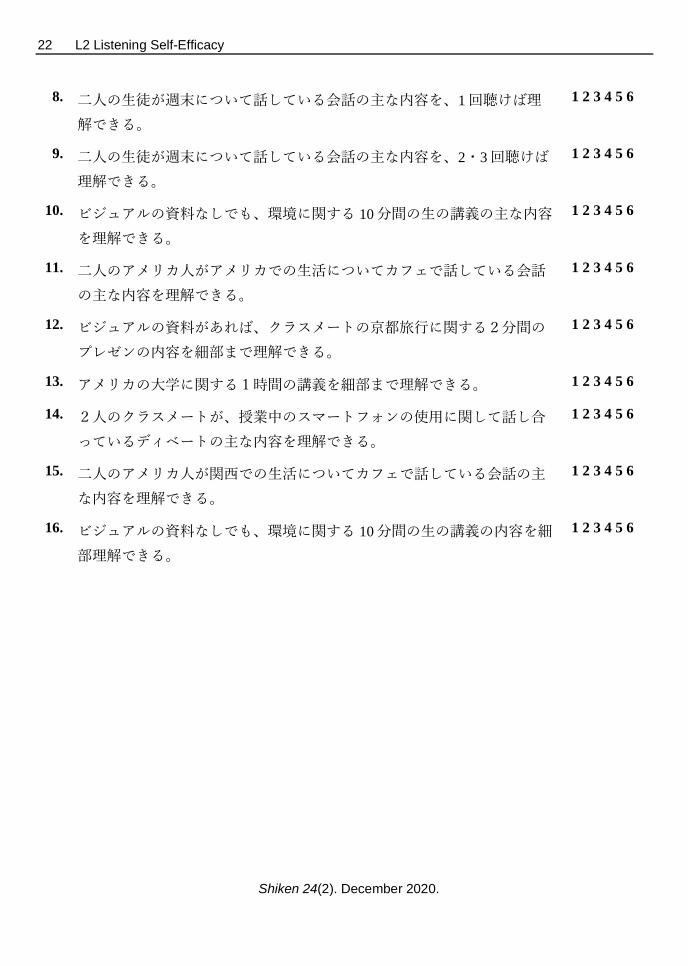
22 L2 Listening Self-Efficacy
Shiken 24(2). December 2020.
8. 二人の生徒が週末について話している会話の主な内容を、1回聴けば理
解できる。
1 2 3 4 5 6
9. 二人の生徒が週末について話している会話の主な内容を、2・3回聴けば
理解できる。
1 2 3 4 5 6
10. ビジュアルの資料なしでも、環境に関する 10分間の生の講義の主な内容
を理解できる。
1 2 3 4 5 6
11. 二人のアメリカ人がアメリカでの生活についてカフェで話している会話
の主な内容を理解できる。
1 2 3 4 5 6
12. ビジュアルの資料があれば、クラスメートの京都旅行に関する2分間の
プレゼンの内容を細部まで理解できる。
1 2 3 4 5 6
13. アメリカの大学に関する1時間の講義を細部まで理解できる。 1 2 3 4 5 6
14. 2人のクラスメートが、授業中のスマートフォンの使用に関して話し合
っているディベートの主な内容を理解できる。
1 2 3 4 5 6
15. 二人のアメリカ人が関西での生活についてカフェで話している会話の主
な内容を理解できる。
1 2 3 4 5 6
16. ビジュアルの資料なしでも、環境に関する 10分間の生の講義の内容を細
部理解できる。
1 2 3 4 5 6