Embed Size (px)
Citation preview
PLEA2012 - 28th Conference, Opportunities, Limits & Needs Towards an environmentally responsible architecture Lima, Perú 7-9 November 2012
The Ventilation Shaft: An alternative passive cooling strategy for high-rise residential buildings in
hot-humid climates
PIMOLSIRI PRAJONGSAN 1
, STEVE SHARPLES 1
1 School of Architecture, University of Liverpool, Liverpool, UK
ABSTRACT: Thailand experiences high air temperatures and humidities throughout the year. In such conditions
natural ventilation is recommended as the most effective passive cooling strategy. However, to achieve internal air
velocities that are high enough to provide indoor thermal comfort can be challenging. Most residential units in high-
rise residential buildings in Thailand have single-sided ventilation (i.e. openings in just one wall). This results in very
low indoor air velocities that are insufficient to create cooling effects and comfort conditions. In this study a
ventilation shaft, which is a vertical shaft located at the rear of a single-sided unit and with an exhaust at the
building’s flat roof, was investigated to assess its potential to increase indoor air velocities and to extend comfort
hour percentages in a single-sided unit during the summer and winter months in Bangkok.
Keywords: natural ventilation, single-sided building, high-rise residential building, thermal comfort, Hot-humid
climate, Computational Fluid Dynamics (CFD)
INTRODUCTION
Thailand is a hot-humid country with high air
temperature and humidities throughout the year. Air
temperature in Bangkok average between 21˚C during
the winter period (October to January) and 35˚C during
the summer period (February to May), with an annual
average of 29˚C according to ten-years of weather data
recorded between 1999-2010 [1]. Relative humidity (RH)
varies between 56% during winter and 89% during the
rainy season (June to September), with an annual average
of 72%. Average hourly mean wind speeds vary from
0.3m/s to 2.3m/s depending on the time of the day i.e.
maximum wind speed is commonly found during the
daytime between 11:00-17:00 while minimum wind
speed is found during night time between 02:00-07:00.
These climatic characteristics are considered to be
outside the thermal comfort range for a large portion of
the year [2]. For other periods comfort ventilation has
been suggested as the most effective passive cooling
strategy to achieve thermal comfort.
Comfort ventilation uses indoor air with high velocity
in the room’s main activity area to increase convective
heat transfer, to remove internal heat from indoor
environment and to increase the evaporative rate to
remove heat from human skin and thus improve comfort
conditions [2-7].
This physiological cooling effect due to elevated air
velocity has been confirmed to improve thermal comfort
in extensive studies including that conducted in hot-
humid climates [8-10].
A ventilation shaft strategy was proposed in a
previous study conducted by the authors [11]. Its high
potential to increase indoor air velocity in a typical
single-sided residential unit in Bangkok was found.
Average indoor air velocities significantly increased
from approximately 1%-5% of the external wind speed in
the reference room without the strategy to 22%-36% in
the test room with the shaft under particular
configurations and climatic conditions.
In this study the performance of a ventilation shaft
strategy with its optimal configurations to increase
indoor air velocity and to extend comfort hours inside a
typical residential unit in high-rise buildings in Bangkok
during summer and winter periods is reported.
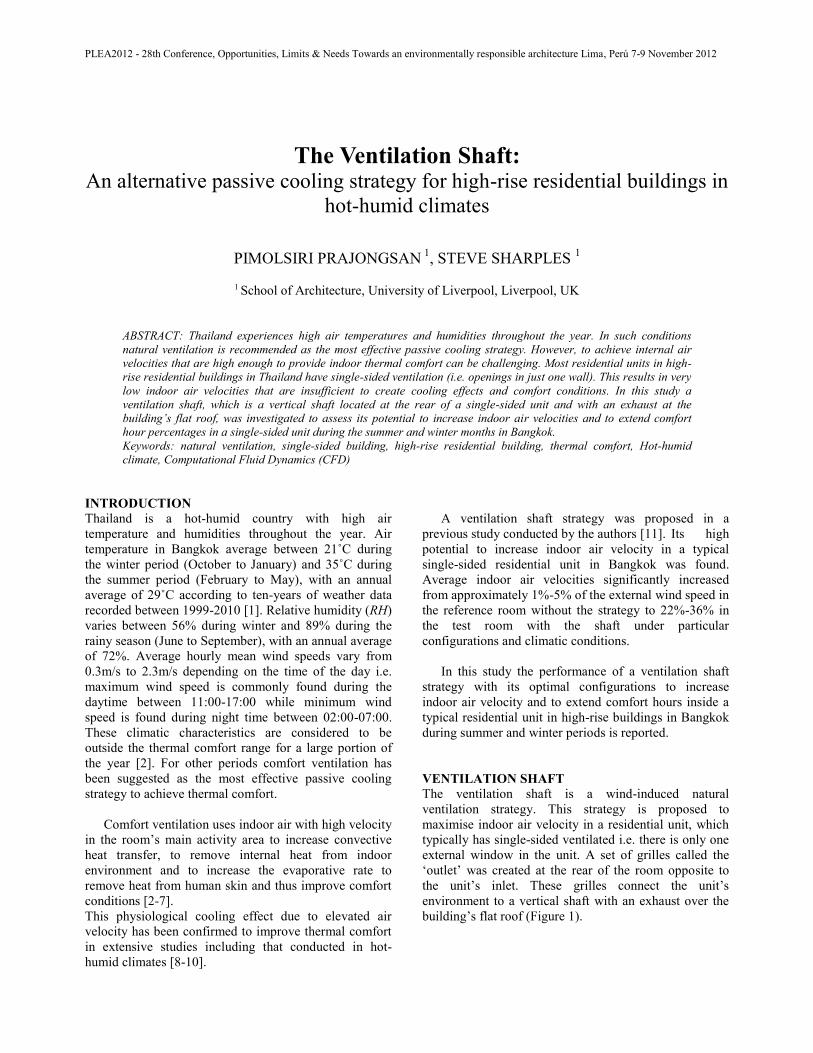
VENTILATION SHAFT
The ventilation shaft is a wind-induced natural
ventilation strategy. This strategy is proposed to
maximise indoor air velocity in a residential unit, which
typically has single-sided ventilated i.e. there is only one
external window in the unit. A set of grilles called the
‘outlet’ was created at the rear of the room opposite to
the unit’s inlet. These grilles connect the unit’s
environment to a vertical shaft with an exhaust over the
building’s flat roof (Figure 1).
PLEA2012 - 28th Conference, Opportunities, Limits & Needs Towards an environmentally responsible architecture Lima, Perú 7-9 November 2012
Figure 1: Principle and elements of the ventilation shaft
strategy; (a) the location of the unit with a vertical shaft in a
residential building, (b) cross section of the test unit with
grilles (outlet) and a shaft, (c) layout of the test room with the
unit’s main window (inlet), outlet and the shaft
The strategy is designed to increase wind pressure
differences between the inlet, which has either negative
or positive pressure depending on its location according
to the prevailing wind direction, and the outlet, which has
high negative pressure regardless of the prevailing wind
direction. This increases the wind effect to draw external
air into the unit, which results in high air velocities
between the unit’s inlet and the outlet.
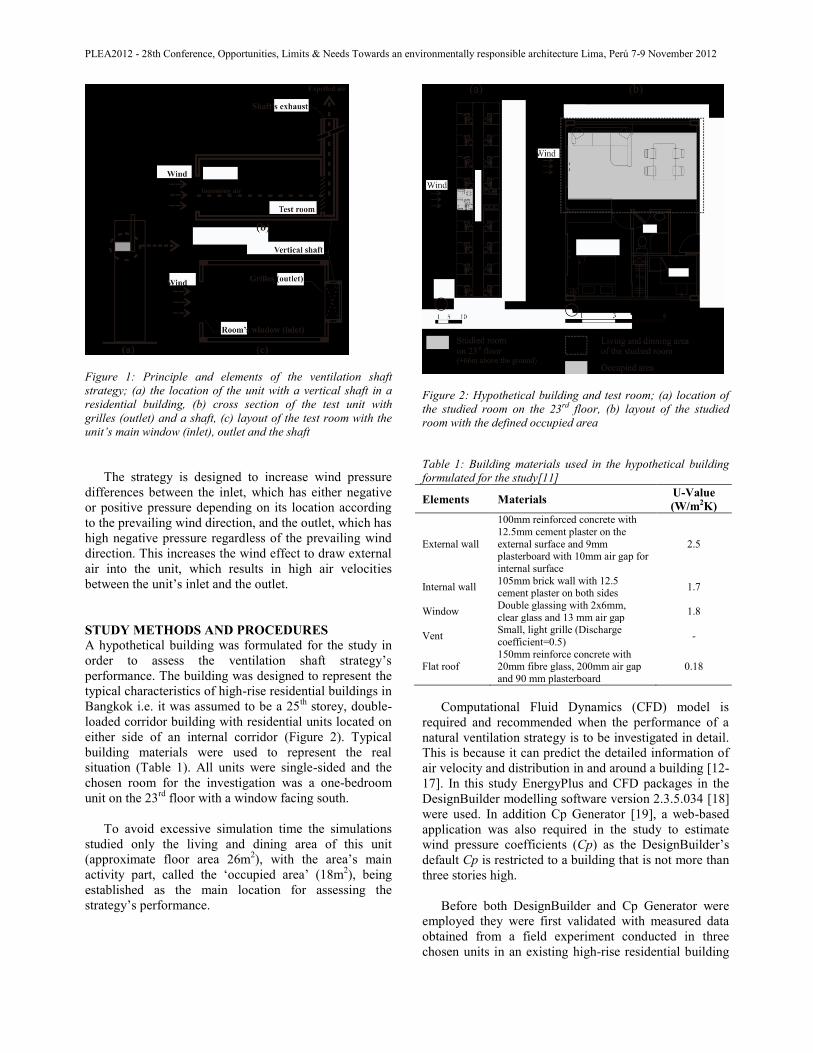
STUDY METHODS AND PROCEDURES
A hypothetical building was formulated for the study in
order to assess the ventilation shaft strategy’s
performance. The building was designed to represent the
typical characteristics of high-rise residential buildings in
Bangkok i.e. it was assumed to be a 25th
storey, double-
loaded corridor building with residential units located on
either side of an internal corridor (Figure 2). Typical
building materials were used to represent the real
situation (Table 1). All units were single-sided and the
chosen room for the investigation was a one-bedroom
unit on the 23rd
floor with a window facing south.
To avoid excessive simulation time the simulations
studied only the living and dining area of this unit
(approximate floor area 26m2), with the area’s main
activity part, called the ‘occupied area’ (18m2), being
established as the main location for assessing the
strategy’s performance.
Figure 2: Hypothetical building and test room; (a) location of
the studied room on the 23rd floor, (b) layout of the studied
room with the defined occupied area
Table 1: Building materials used in the hypothetical building
formulated for the study[11]
Elements Materials U-Value
(W/m2K)
External wall
100mm reinforced concrete with
12.5mm cement plaster on the
external surface and 9mm plasterboard with 10mm air gap for
internal surface
2.5
Internal wall 105mm brick wall with 12.5 cement plaster on both sides
1.7
Window Double glassing with 2x6mm,
clear glass and 13 mm air gap 1.8
Vent Small, light grille (Discharge
coefficient=0.5) -
Flat roof 150mm reinforce concrete with 20mm fibre glass, 200mm air gap
and 90 mm plasterboard
0.18
Computational Fluid Dynamics (CFD) model is
required and recommended when the performance of a
natural ventilation strategy is to be investigated in detail.
This is because it can predict the detailed information of
air velocity and distribution in and around a building [12-
17]. In this study EnergyPlus and CFD packages in the
DesignBuilder modelling software version 2.3.5.034 [18]
were used. In addition Cp Generator [19], a web-based
application was also required in the study to estimate
wind pressure coefficients (Cp) as the DesignBuilder’s
default Cp is restricted to a building that is not more than
three stories high.
Before both DesignBuilder and Cp Generator were
employed they were first validated with measured data
obtained from a field experiment conducted in three
chosen units in an existing high-rise residential building
PLEA2012 - 28th Conference, Opportunities, Limits & Needs Towards an environmentally responsible architecture Lima, Perú 7-9 November 2012
in Bangkok [11]. The simulated internal air temperature
(Tin), air velocity (Vin) and airflow distribution were
compared to the measured data and a good agreement
between the data sets was achieved. The average
deviation between the measured and the simulated Tin
and Vin were only 6.3% and 10%, respectively, although
most of the velocities measured found very low i.e.
~0.1m/s. The predicted airflow pattern also agreed well
with the situations occurring in the experiment.
To assess the strategy’s performance to increase the
room’s internal air velocity and to extend comfort hours,
the predicted operative temperature (Top.av) of the studied
room without the strategy (called the ‘reference room’)
was first compared to the thermal comfort range, which
was calculated based on ASHRAE’s adaptive comfort
model (Eq.1) [20]. This gave the reference room’s
comfort hour percentage during April and December,
which are the selected summer and winter month since
they have the highest and lowest average monthly dry
bulb temperature (Tout).
Top.com=18.9+0.255Tout (Eq.1)
where Top.com = the operative comfort temperature
(˚C), Tout = the mean monthly outdoor air temperature;
the upper and lower limit of the comfort range with 90%
acceptability are 2.5˚C higher and 2.2˚C lower than
Top.com, respectively.
For the test room’s comfort hour percentage, its
predicted operative temperature compensated for by
indoor air velocity (Top.com) was calculated according to
Szokolay’s physiological cooling equation (Eq.2) [9,
21]. Then the reference and the test room’s comfort hour
percentages during the summer and winter month were
compared and analysed.
dT=6Ve-1.6(Ve)2 (Eq.2)
where dT=the cooling effect compensated for by
elevated air velocity (K), Ve=an effective ventilation
velocity (Ve=V-0.2m/s; where V = the air velocity at the
body surface and the expression is valid for up to 2m/s).
High indoor air velocity is obviously the most
significant variable to improve comfort conditions and
extend comfort hours and therefore average air velocities
in the studied room’s occupied area were established as
the study’s main criterion for assessing the strategy’s
performance. The other criterion was the airflow pattern
in the occupied area. Smooth airflow throughout the
main activity area is suggested to be preferable to a
highly fluctuating one.
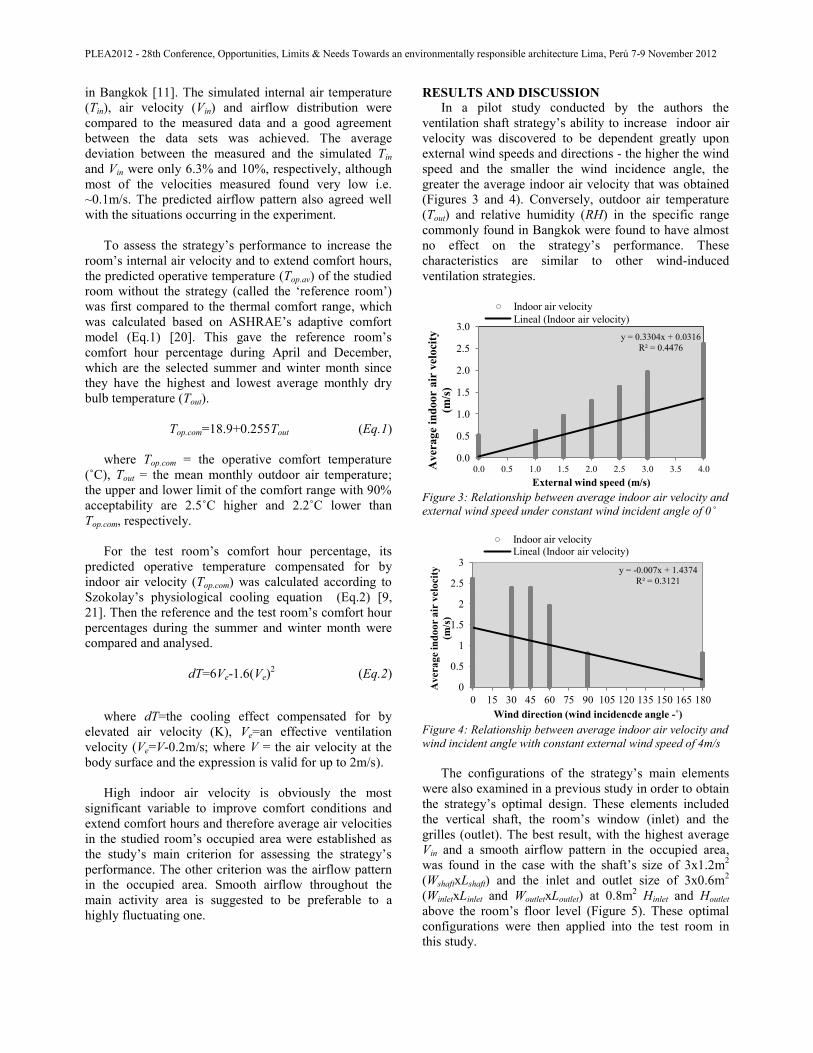
RESULTS AND DISCUSSION In a pilot study conducted by the authors the
ventilation shaft strategy’s ability to increase indoor air
velocity was discovered to be dependent greatly upon
external wind speeds and directions - the higher the wind
speed and the smaller the wind incidence angle, the
greater the average indoor air velocity that was obtained
(Figures 3 and 4). Conversely, outdoor air temperature
(Tout) and relative humidity (RH) in the specific range
commonly found in Bangkok were found to have almost
no effect on the strategy’s performance. These
characteristics are similar to other wind-induced
ventilation strategies.
Figure 3: Relationship between average indoor air velocity and
external wind speed under constant wind incident angle of 0˚
Figure 4: Relationship between average indoor air velocity and
wind incident angle with constant external wind speed of 4m/s
The configurations of the strategy’s main elements
were also examined in a previous study in order to obtain
the strategy’s optimal design. These elements included
the vertical shaft, the room’s window (inlet) and the
grilles (outlet). The best result, with the highest average
Vin and a smooth airflow pattern in the occupied area,
was found in the case with the shaft’s size of 3x1.2m2
(WshaftxLshaft) and the inlet and outlet size of 3x0.6m2
(WinletxLinlet and WoutletxLoutlet) at 0.8m2 Hinlet and Houtlet
above the room’s floor level (Figure 5). These optimal
configurations were then applied into the test room in
this study.
y = 0.3304x + 0.0316
R² = 0.4476
0.0
0.5
1.0
1.5
2.0
2.5
3.0
0.0 0.5 1.0 1.5 2.0 2.5 3.0 3.5 4.0 Aver
ag
e in
door
air
vel
oci
ty
(m/s
)
External wind speed (m/s)
Indoor air velocity
Lineal (Indoor air velocity)
y = -0.007x + 1.4374
R² = 0.3121
0
0.5
1
1.5
2
2.5
3
0 15 30 45 60 75 90 105 120 135 150 165 180
Avera
ge in
do
or a
ir v
elo
cit
y
(m/s
)
Wind direction (wind incidencde angle -˚)
Indoor air velocity Lineal (Indoor air velocity)
PLEA2012 - 28th Conference, Opportunities, Limits & Needs Towards an environmentally responsible architecture Lima, Perú 7-9 November 2012
Figure 5: Ventilation shaft’s elements i.e. the room’s window
(inlet), grilles at the back of the room (outlet) and vertical shaft
The average Top and Vin of the test room with optimal
design was then calculated under difference external
wind speed and directions using DesignBuilder’s
EnergyPlus and CFD. Figure 6 illustrates the simulated
Vin obtained from the reference and the test room. It can
be seen that the test room’s average Vin was considerably
greater than that of the reference room for every external
wind condition. The test room’s average Vins were
approximately 36%-60% of the Vout when the wind
incidence angle was 0˚ (wind direction is perpendicular
to the inlet), while those of the reference room were
relatively constant at only 1.3%-5% of Vout.
Figure 6: Indoor air velocity in the occupied area obtained
from the reference and the test room with the strategy’s optimal
design under various wind speeds with the constant wind
incidence angle of 0˚
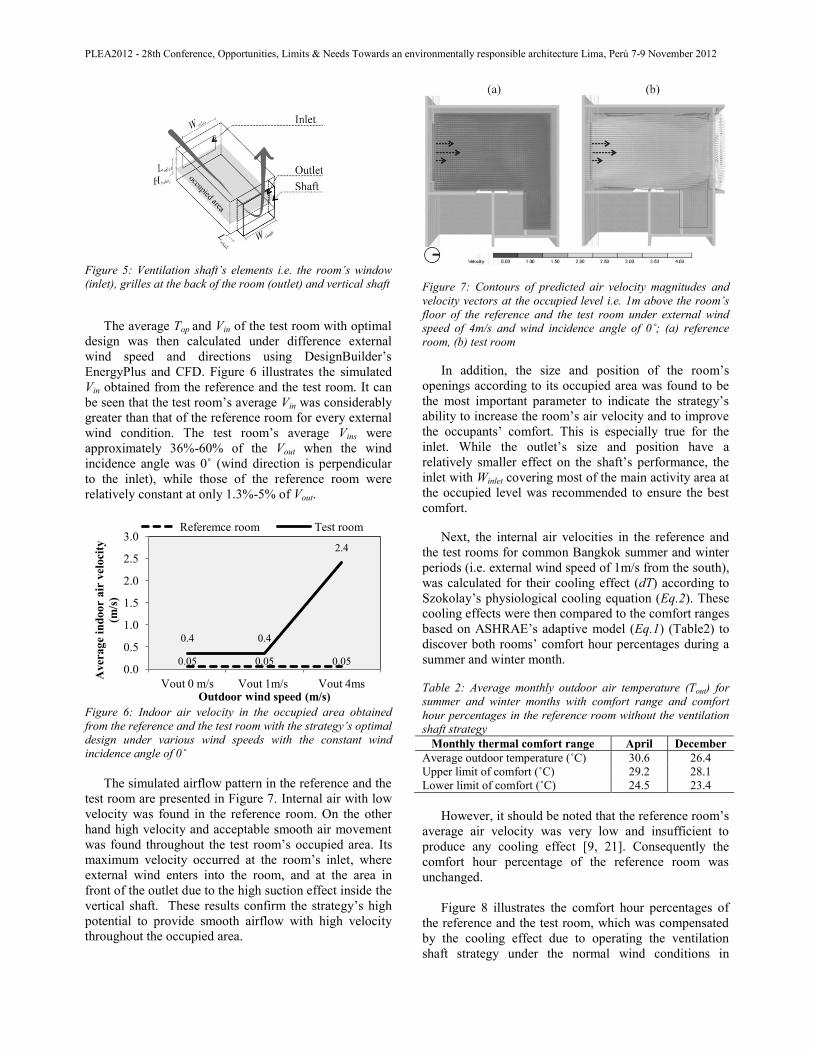
The simulated airflow pattern in the reference and the
test room are presented in Figure 7. Internal air with low
velocity was found in the reference room. On the other
hand high velocity and acceptable smooth air movement
was found throughout the test room’s occupied area. Its
maximum velocity occurred at the room’s inlet, where
external wind enters into the room, and at the area in
front of the outlet due to the high suction effect inside the
vertical shaft. These results confirm the strategy’s high
potential to provide smooth airflow with high velocity
throughout the occupied area.
Figure 7: Contours of predicted air velocity magnitudes and
velocity vectors at the occupied level i.e. 1m above the room’s
floor of the reference and the test room under external wind
speed of 4m/s and wind incidence angle of 0˚; (a) reference
room, (b) test room
In addition, the size and position of the room’s
openings according to its occupied area was found to be
the most important parameter to indicate the strategy’s
ability to increase the room’s air velocity and to improve
the occupants’ comfort. This is especially true for the
inlet. While the outlet’s size and position have a
relatively smaller effect on the shaft’s performance, the
inlet with Winlet covering most of the main activity area at
the occupied level was recommended to ensure the best
comfort.
Next, the internal air velocities in the reference and
the test rooms for common Bangkok summer and winter
periods (i.e. external wind speed of 1m/s from the south),
was calculated for their cooling effect (dT) according to
Szokolay’s physiological cooling equation (Eq.2). These
cooling effects were then compared to the comfort ranges
based on ASHRAE’s adaptive model (Eq.1) (Table2) to
discover both rooms’ comfort hour percentages during a
summer and winter month.
Table 2: Average monthly outdoor air temperature (Tout) for
summer and winter months with comfort range and comfort
hour percentages in the reference room without the ventilation
shaft strategy
Monthly thermal comfort range April December
Average outdoor temperature (˚C) 30.6 26.4
Upper limit of comfort (˚C) 29.2 28.1
Lower limit of comfort (˚C) 24.5 23.4
However, it should be noted that the reference room’s
average air velocity was very low and insufficient to
produce any cooling effect [9, 21]. Consequently the
comfort hour percentage of the reference room was
unchanged.
Figure 8 illustrates the comfort hour percentages of
the reference and the test room, which was compensated
by the cooling effect due to operating the ventilation
shaft strategy under the normal wind conditions in
0.05 0.05 0.05
0.4 0.4
2.4
0.0
0.5
1.0
1.5
2.0
2.5
3.0
Vout 0 m/s Vout 1m/s Vout 4ms
Aver
ag
e in
door
air
vel
oci
ty
(m/s
)
Outdoor wind speed (m/s)
Referemce room Test room
PLEA2012 - 28th Conference, Opportunities, Limits & Needs Towards an environmentally responsible architecture Lima, Perú 7-9 November 2012
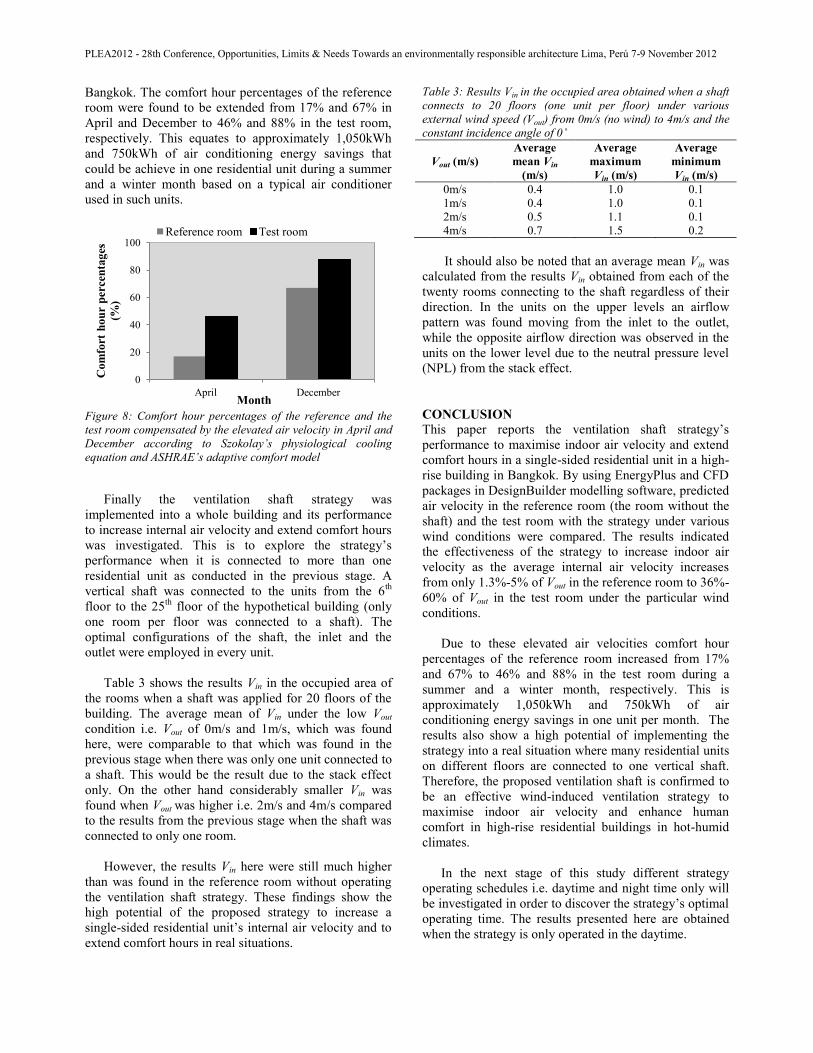
Bangkok. The comfort hour percentages of the reference
room were found to be extended from 17% and 67% in
April and December to 46% and 88% in the test room,
respectively. This equates to approximately 1,050kWh
and 750kWh of air conditioning energy savings that
could be achieve in one residential unit during a summer
and a winter month based on a typical air conditioner
used in such units.
Figure 8: Comfort hour percentages of the reference and the
test room compensated by the elevated air velocity in April and
December according to Szokolay’s physiological cooling
equation and ASHRAE’s adaptive comfort model
Finally the ventilation shaft strategy was
implemented into a whole building and its performance
to increase internal air velocity and extend comfort hours
was investigated. This is to explore the strategy’s
performance when it is connected to more than one
residential unit as conducted in the previous stage. A
vertical shaft was connected to the units from the 6th
floor to the 25th
floor of the hypothetical building (only
one room per floor was connected to a shaft). The
optimal configurations of the shaft, the inlet and the
outlet were employed in every unit.
Table 3 shows the results Vin in the occupied area of
the rooms when a shaft was applied for 20 floors of the
building. The average mean of Vin under the low Vout
condition i.e. Vout of 0m/s and 1m/s, which was found
here, were comparable to that which was found in the
previous stage when there was only one unit connected to
a shaft. This would be the result due to the stack effect
only. On the other hand considerably smaller Vin was
found when Vout was higher i.e. 2m/s and 4m/s compared
to the results from the previous stage when the shaft was
connected to only one room.
However, the results Vin here were still much higher
than was found in the reference room without operating
the ventilation shaft strategy. These findings show the
high potential of the proposed strategy to increase a
single-sided residential unit’s internal air velocity and to
extend comfort hours in real situations.
Table 3: Results Vin in the occupied area obtained when a shaft
connects to 20 floors (one unit per floor) under various
external wind speed (Vout) from 0m/s (no wind) to 4m/s and the
constant incidence angle of 0˚
Vout (m/s)
Average
mean Vin
(m/s)
Average
maximum
Vin (m/s)
Average
minimum
Vin (m/s)
0m/s 0.4 1.0 0.1
1m/s 0.4 1.0 0.1
2m/s 0.5 1.1 0.1
4m/s 0.7 1.5 0.2
It should also be noted that an average mean Vin was
calculated from the results Vin obtained from each of the
twenty rooms connecting to the shaft regardless of their
direction. In the units on the upper levels an airflow
pattern was found moving from the inlet to the outlet,
while the opposite airflow direction was observed in the
units on the lower level due to the neutral pressure level
(NPL) from the stack effect.
CONCLUSION
This paper reports the ventilation shaft strategy’s
performance to maximise indoor air velocity and extend
comfort hours in a single-sided residential unit in a high-
rise building in Bangkok. By using EnergyPlus and CFD
packages in DesignBuilder modelling software, predicted
air velocity in the reference room (the room without the
shaft) and the test room with the strategy under various
wind conditions were compared. The results indicated
the effectiveness of the strategy to increase indoor air
velocity as the average internal air velocity increases
from only 1.3%-5% of Vout in the reference room to 36%-
60% of Vout in the test room under the particular wind
conditions.
Due to these elevated air velocities comfort hour
percentages of the reference room increased from 17%
and 67% to 46% and 88% in the test room during a
summer and a winter month, respectively. This is
approximately 1,050kWh and 750kWh of air
conditioning energy savings in one unit per month. The
results also show a high potential of implementing the
strategy into a real situation where many residential units
on different floors are connected to one vertical shaft.
Therefore, the proposed ventilation shaft is confirmed to
be an effective wind-induced ventilation strategy to
maximise indoor air velocity and enhance human
comfort in high-rise residential buildings in hot-humid
climates.
In the next stage of this study different strategy
operating schedules i.e. daytime and night time only will
be investigated in order to discover the strategy’s optimal
operating time. The results presented here are obtained
when the strategy is only operated in the daytime.
0
20
40
60
80
100
April December
Com
fort
hou
r p
erce
nta
ges
(%)
Month
Reference room Test room
PLEA2012 - 28th Conference, Opportunities, Limits & Needs Towards an environmentally responsible architecture Lima, Perú 7-9 November 2012
ACKNOWLEDGEMENTS
The authors would like to express their appreciation to the Energy Policy and Planning Office, Ministry of Energy, Thailand (EPPO) for funding this study.
REFERENCES
[1] T.M. Department, Bangkok's weather data1999-2010,
in, Thai Meteorological Department, Bangkok, 2010.
[2] J. Khedari, N. Yamtraipat, N. Pratintong, J.
Hirunlarb, Thailand ventilation comfort chart, Energy
and Buildings, 32 (2000) 245-249.
[3] B. Givoni, Performance and applicability of passive
and low-energy cooling systems, Energy and Buildings,
17 (177-199) (1991).
[4] M. Santamouris, Passive cooling of buildings, James
and James Science Publishers, London, 2005.
[5] N.H. Wong, H. Feriadi, P.Y. Lim, K.W. Tham, C.
Sekhar, K.W. Cheong, Thermal comfort evaluation of
naturally ventilated public housing in Singapore,
Building and Environment, 37 (12) (2002) 1267-1277.
[6] T. Kubota, D.T.H. Chyee, S. Ahmad, The effects of
night ventilation technique on indoor thermal
environment for residential buildings in hot-humid
climate of Malaysia, Energy and Buildings, 41 (8) (2009)
829-839.
[7] R. Priyadarsini, K.W. Cheong, N.H. Wong,
Enhancement of natural ventilation in high-rise
residential buildings using stack system, Energy and
Buildings, 36 (1) (2004) 61-71.
[8] R. Ansley, Estimating summer wind driven natural
ventilation potential for indoor thermal comfort, J Wind
Eng Ind Aerod, 83 (1999) 515-525.
[9] S. Szokolay, Revising warm-humid climate house
design, in: PLEA2000, James + James (Science)
Published Limited, Cambridge, England, 2000, pp. 144-
149.
[10] E. Arens, S. Turner, H. Zhang, G. Paliaga, Moving
air for comfort, ASHRAE J, (2009).
[11] P. Prajongsan, S. Sharples, Enhacing natural
ventilation, thermal comfort and energy savings in high-
rise residential buildings in Bangkok through the use of
ventilation shafts, Building and Environment, 50 (2012)
104-113.
[12] K.A. Papakonstantinou, C.T. Kiranoudis, N.C.
Markatos, Numerical simulation of air flow field in
single-sided ventilated buildings, Energy and Buildings,
33 (1) (2000) 41-48.
[13] Q. Chen, Ventilation performance prediction for
buildings: A method overview and recent applications,
Building and Environment, 44 (4) (2009) 848-858.
[14] C. Allocca, Q. Chen, L.R. Glicksman, Design
analysis of single-sided natural ventilation, Energy and
Buildings, 35 (8) (2003) 785-795.
[15] G. Carrilho da Graça, Q. Chen, L.R. Glicksman,
L.K. Norford, Simulation of wind-driven ventilative
cooling systems for an apartment building in Beijing and
Shanghai, Energy and Buildings, 34 (1) (2002) 1-11.
[16] T.S. Larsen, P. Heiselberg, Single-sided natural
ventilation driven by wind pressure and temperature
difference, Energy and Buildings, 40 (6) (2008) 1031-
1040.
[17] C.F. Gao, W.L. Lee, Evaluating the influence of
openings configuration on natural ventilation
performance of residential units in Hong Kong, Building
and Environment, 46 (4) (2011) 961-969.
[18] DesignBuilder, DesignBuilder vesion 2.3.5.034, in,
Gloucestershire, UK., 2006.
[19] T.B. Research, Cp Generator, in, Delft, NL.
[20] ASHRAE, ASHRAE Handbook - Fundamentals,
American Society of Heating, Refrigerating and Air-
Conditioning Engineers, Inc., 2009.
[21] S. Szokolay, Introduction to Architectural Science:
the Basis of Sustainable Design, 2nd ed., Architectural
Press, 2008.