Embed Size (px)
Citation preview
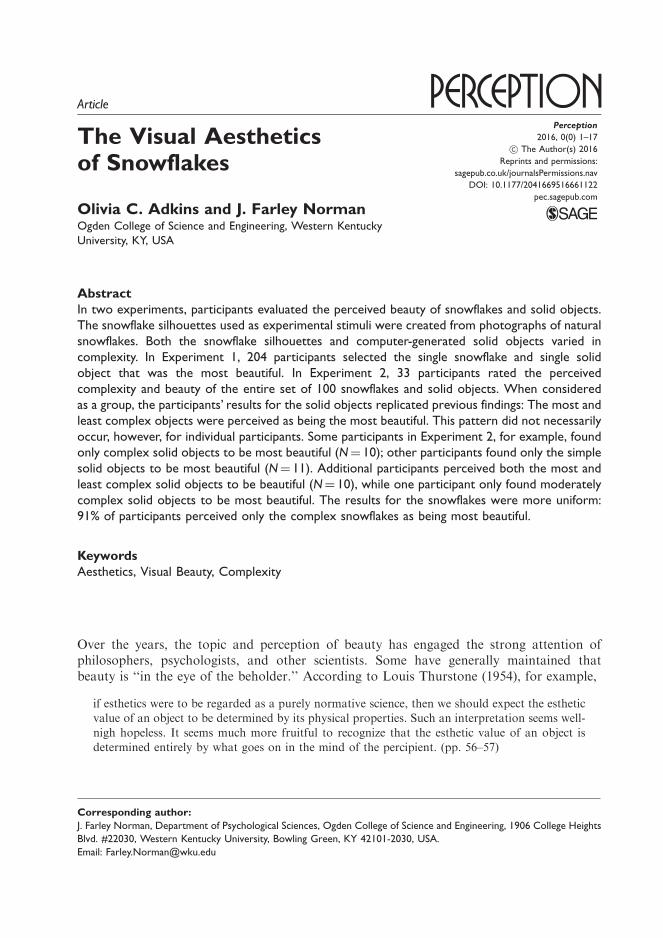
Article
The Visual Aestheticsof Snowflakes
Olivia C. Adkins and J. Farley NormanOgden College of Science and Engineering, Western Kentucky
University, KY, USA
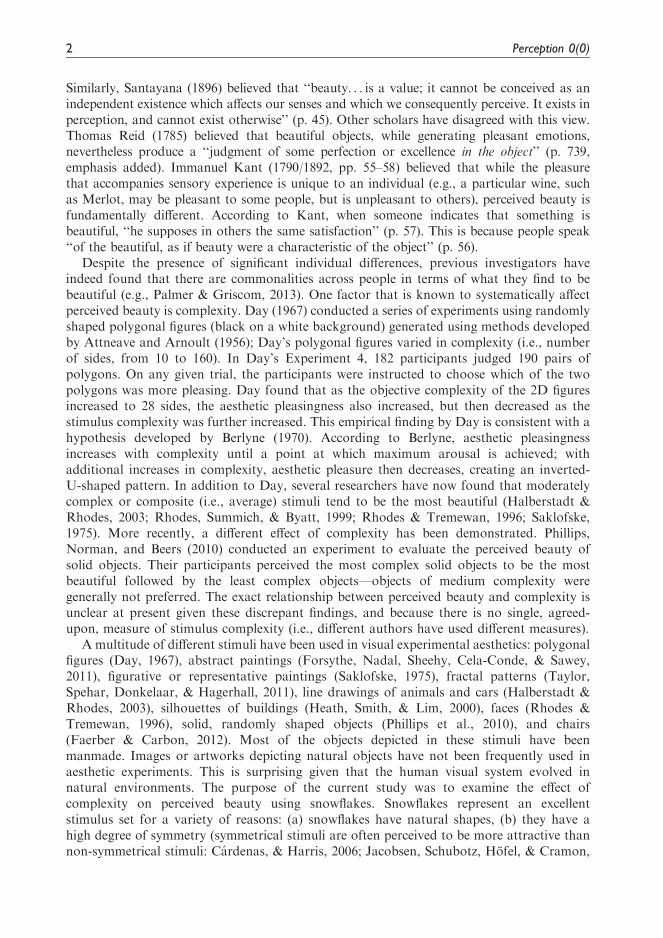
Abstract
In two experiments, participants evaluated the perceived beauty of snowflakes and solid objects.
The snowflake silhouettes used as experimental stimuli were created from photographs of natural
snowflakes. Both the snowflake silhouettes and computer-generated solid objects varied in
complexity. In Experiment 1, 204 participants selected the single snowflake and single solid
object that was the most beautiful. In Experiment 2, 33 participants rated the perceived
complexity and beauty of the entire set of 100 snowflakes and solid objects. When considered
as a group, the participants’ results for the solid objects replicated previous findings: The most and
least complex objects were perceived as being the most beautiful. This pattern did not necessarily
occur, however, for individual participants. Some participants in Experiment 2, for example, found
only complex solid objects to be most beautiful (N¼ 10); other participants found only the simple
solid objects to be most beautiful (N¼ 11). Additional participants perceived both the most and
least complex solid objects to be beautiful (N¼ 10), while one participant only found moderately
complex solid objects to be most beautiful. The results for the snowflakes were more uniform:
91% of participants perceived only the complex snowflakes as being most beautiful.
Keywords
Aesthetics, Visual Beauty, Complexity
Over the years, the topic and perception of beauty has engaged the strong attention ofphilosophers, psychologists, and other scientists. Some have generally maintained thatbeauty is ‘‘in the eye of the beholder.’’ According to Louis Thurstone (1954), for example,
if esthetics were to be regarded as a purely normative science, then we should expect the estheticvalue of an object to be determined by its physical properties. Such an interpretation seems well-
nigh hopeless. It seems much more fruitful to recognize that the esthetic value of an object isdetermined entirely by what goes on in the mind of the percipient. (pp. 56–57)
Corresponding author:
J. Farley Norman, Department of Psychological Sciences, Ogden College of Science and Engineering, 1906 College Heights
Blvd. #22030, Western Kentucky University, Bowling Green, KY 42101-2030, USA.
Email: [email protected]
Perception
2016, 0(0) 1–17
! The Author(s) 2016
Reprints and permissions:
sagepub.co.uk/journalsPermissions.nav
DOI: 10.1177/2041669516661122
pec.sagepub.com
Similarly, Santayana (1896) believed that ‘‘beauty. . . is a value; it cannot be conceived as anindependent existence which affects our senses and which we consequently perceive. It exists inperception, and cannot exist otherwise’’ (p. 45). Other scholars have disagreed with this view.Thomas Reid (1785) believed that beautiful objects, while generating pleasant emotions,nevertheless produce a ‘‘judgment of some perfection or excellence in the object’’ (p. 739,emphasis added). Immanuel Kant (1790/1892, pp. 55–58) believed that while the pleasurethat accompanies sensory experience is unique to an individual (e.g., a particular wine, suchas Merlot, may be pleasant to some people, but is unpleasant to others), perceived beauty isfundamentally different. According to Kant, when someone indicates that something isbeautiful, ‘‘he supposes in others the same satisfaction’’ (p. 57). This is because people speak‘‘of the beautiful, as if beauty were a characteristic of the object’’ (p. 56).
Despite the presence of significant individual differences, previous investigators haveindeed found that there are commonalities across people in terms of what they find to bebeautiful (e.g., Palmer & Griscom, 2013). One factor that is known to systematically affectperceived beauty is complexity. Day (1967) conducted a series of experiments using randomlyshaped polygonal figures (black on a white background) generated using methods developedby Attneave and Arnoult (1956); Day’s polygonal figures varied in complexity (i.e., numberof sides, from 10 to 160). In Day’s Experiment 4, 182 participants judged 190 pairs ofpolygons. On any given trial, the participants were instructed to choose which of the twopolygons was more pleasing. Day found that as the objective complexity of the 2D figuresincreased to 28 sides, the aesthetic pleasingness also increased, but then decreased as thestimulus complexity was further increased. This empirical finding by Day is consistent with ahypothesis developed by Berlyne (1970). According to Berlyne, aesthetic pleasingnessincreases with complexity until a point at which maximum arousal is achieved; withadditional increases in complexity, aesthetic pleasure then decreases, creating an inverted-U-shaped pattern. In addition to Day, several researchers have now found that moderatelycomplex or composite (i.e., average) stimuli tend to be the most beautiful (Halberstadt &Rhodes, 2003; Rhodes, Summich, & Byatt, 1999; Rhodes & Tremewan, 1996; Saklofske,1975). More recently, a different effect of complexity has been demonstrated. Phillips,Norman, and Beers (2010) conducted an experiment to evaluate the perceived beauty ofsolid objects. Their participants perceived the most complex solid objects to be the mostbeautiful followed by the least complex objects—objects of medium complexity weregenerally not preferred. The exact relationship between perceived beauty and complexity isunclear at present given these discrepant findings, and because there is no single, agreed-upon, measure of stimulus complexity (i.e., different authors have used different measures).
A multitude of different stimuli have been used in visual experimental aesthetics: polygonalfigures (Day, 1967), abstract paintings (Forsythe, Nadal, Sheehy, Cela-Conde, & Sawey,2011), figurative or representative paintings (Saklofske, 1975), fractal patterns (Taylor,Spehar, Donkelaar, & Hagerhall, 2011), line drawings of animals and cars (Halberstadt &Rhodes, 2003), silhouettes of buildings (Heath, Smith, & Lim, 2000), faces (Rhodes &Tremewan, 1996), solid, randomly shaped objects (Phillips et al., 2010), and chairs(Faerber & Carbon, 2012). Most of the objects depicted in these stimuli have beenmanmade. Images or artworks depicting natural objects have not been frequently used inaesthetic experiments. This is surprising given that the human visual system evolved innatural environments. The purpose of the current study was to examine the effect ofcomplexity on perceived beauty using snowflakes. Snowflakes represent an excellentstimulus set for a variety of reasons: (a) snowflakes have natural shapes, (b) they have ahigh degree of symmetry (symmetrical stimuli are often perceived to be more attractive thannon-symmetrical stimuli: Cardenas, & Harris, 2006; Jacobsen, Schubotz, Hofel, & Cramon,
2 Perception 0(0)
2006; Rhodes, Proffitt, Grady, & Sumich, 1998; Tinio & Leder, 2009), and (c) they have awide range of objective complexity. The solid object shapes used by Phillips et al. (2010) werealso used in the current study to determine whether the relationship observed betweencomplexity and perceived beauty is general (i.e., holds for both the 2D snowflakes and 3Dsolid objects) or is stimulus dependent.
Experiment 1
In an early aesthetics experiment by Fechner (1876), a method was employed that he calledthe method of choice. Fechner presented each of 347 participants with a set of 10 differentlyproportioned rectangles (the shapes ranged from square to a ratio of 5:2); he asked eachparticipant to select the single rectangle that was the most aesthetically pleasing. Theparticipants’ most common preference was for the rectangle with a ratio of ’¼ (1þˇ5)/2& 1.61, the golden section. In the following experiment, we utilized Fechner’s method ofchoice in assessing our participants’ aesthetic preferences for snowflakes.
Method
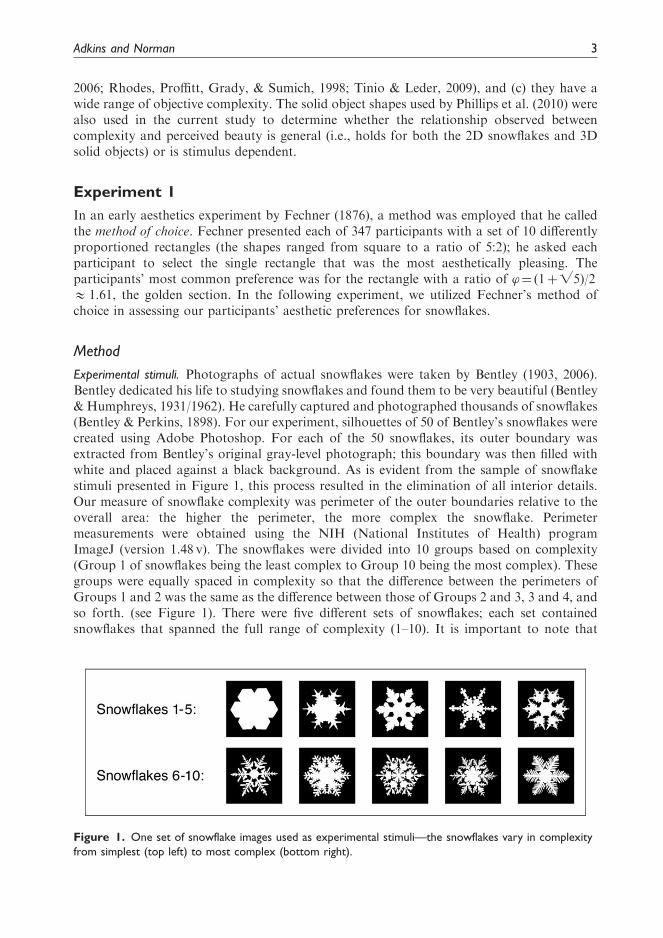
Experimental stimuli. Photographs of actual snowflakes were taken by Bentley (1903, 2006).Bentley dedicated his life to studying snowflakes and found them to be very beautiful (Bentley& Humphreys, 1931/1962). He carefully captured and photographed thousands of snowflakes(Bentley & Perkins, 1898). For our experiment, silhouettes of 50 of Bentley’s snowflakes werecreated using Adobe Photoshop. For each of the 50 snowflakes, its outer boundary wasextracted from Bentley’s original gray-level photograph; this boundary was then filled withwhite and placed against a black background. As is evident from the sample of snowflakestimuli presented in Figure 1, this process resulted in the elimination of all interior details.Our measure of snowflake complexity was perimeter of the outer boundaries relative to theoverall area: the higher the perimeter, the more complex the snowflake. Perimetermeasurements were obtained using the NIH (National Institutes of Health) programImageJ (version 1.48 v). The snowflakes were divided into 10 groups based on complexity(Group 1 of snowflakes being the least complex to Group 10 being the most complex). Thesegroups were equally spaced in complexity so that the difference between the perimeters ofGroups 1 and 2 was the same as the difference between those of Groups 2 and 3, 3 and 4, andso forth. (see Figure 1). There were five different sets of snowflakes; each set containedsnowflakes that spanned the full range of complexity (1–10). It is important to note that
Figure 1. One set of snowflake images used as experimental stimuli—the snowflakes vary in complexity
from simplest (top left) to most complex (bottom right).
Adkins and Norman 3
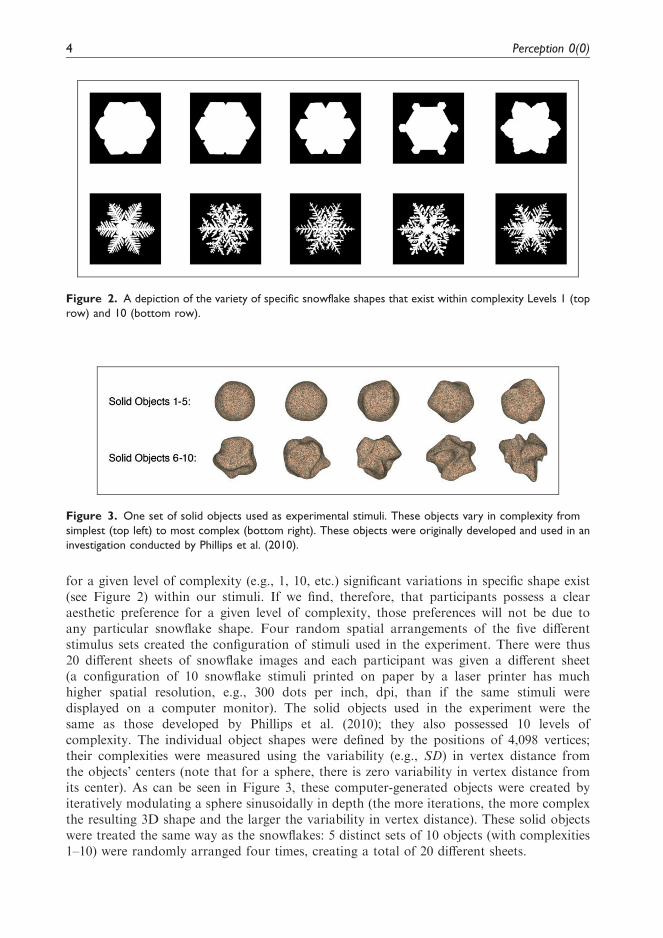
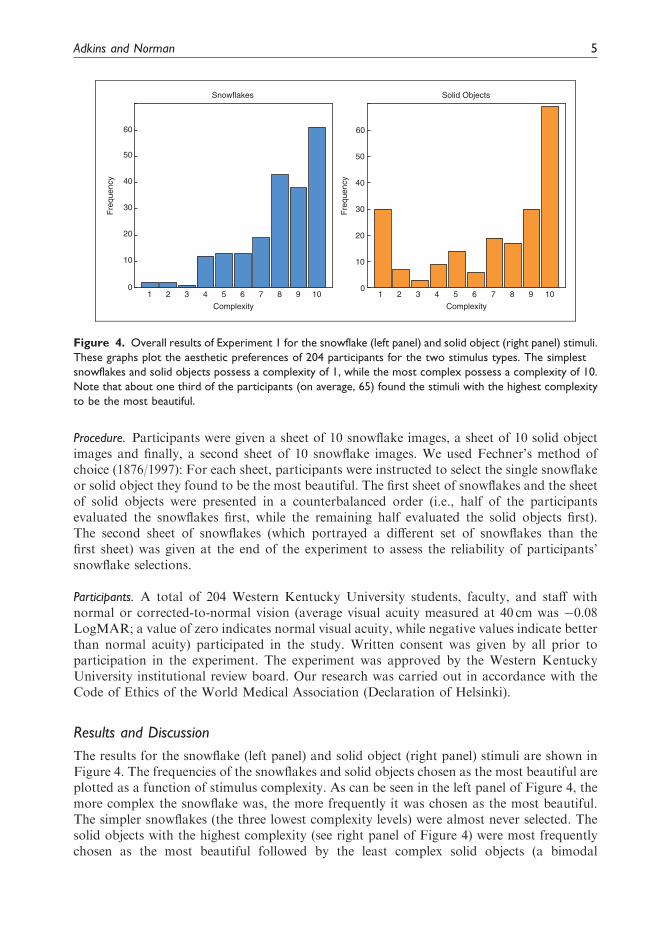
for a given level of complexity (e.g., 1, 10, etc.) significant variations in specific shape exist(see Figure 2) within our stimuli. If we find, therefore, that participants possess a clearaesthetic preference for a given level of complexity, those preferences will not be due toany particular snowflake shape. Four random spatial arrangements of the five differentstimulus sets created the configuration of stimuli used in the experiment. There were thus20 different sheets of snowflake images and each participant was given a different sheet(a configuration of 10 snowflake stimuli printed on paper by a laser printer has muchhigher spatial resolution, e.g., 300 dots per inch, dpi, than if the same stimuli weredisplayed on a computer monitor). The solid objects used in the experiment were thesame as those developed by Phillips et al. (2010); they also possessed 10 levels ofcomplexity. The individual object shapes were defined by the positions of 4,098 vertices;their complexities were measured using the variability (e.g., SD) in vertex distance fromthe objects’ centers (note that for a sphere, there is zero variability in vertex distance fromits center). As can be seen in Figure 3, these computer-generated objects were created byiteratively modulating a sphere sinusoidally in depth (the more iterations, the more complexthe resulting 3D shape and the larger the variability in vertex distance). These solid objectswere treated the same way as the snowflakes: 5 distinct sets of 10 objects (with complexities1–10) were randomly arranged four times, creating a total of 20 different sheets.
Figure 2. A depiction of the variety of specific snowflake shapes that exist within complexity Levels 1 (top
row) and 10 (bottom row).
Figure 3. One set of solid objects used as experimental stimuli. These objects vary in complexity from
simplest (top left) to most complex (bottom right). These objects were originally developed and used in an
investigation conducted by Phillips et al. (2010).
4 Perception 0(0)
Procedure. Participants were given a sheet of 10 snowflake images, a sheet of 10 solid objectimages and finally, a second sheet of 10 snowflake images. We used Fechner’s method ofchoice (1876/1997): For each sheet, participants were instructed to select the single snowflakeor solid object they found to be the most beautiful. The first sheet of snowflakes and the sheetof solid objects were presented in a counterbalanced order (i.e., half of the participantsevaluated the snowflakes first, while the remaining half evaluated the solid objects first).The second sheet of snowflakes (which portrayed a different set of snowflakes than thefirst sheet) was given at the end of the experiment to assess the reliability of participants’snowflake selections.
Participants. A total of 204 Western Kentucky University students, faculty, and staff withnormal or corrected-to-normal vision (average visual acuity measured at 40 cm was �0.08LogMAR; a value of zero indicates normal visual acuity, while negative values indicate betterthan normal acuity) participated in the study. Written consent was given by all prior toparticipation in the experiment. The experiment was approved by the Western KentuckyUniversity institutional review board. Our research was carried out in accordance with theCode of Ethics of the World Medical Association (Declaration of Helsinki).
Results and Discussion
The results for the snowflake (left panel) and solid object (right panel) stimuli are shown inFigure 4. The frequencies of the snowflakes and solid objects chosen as the most beautiful areplotted as a function of stimulus complexity. As can be seen in the left panel of Figure 4, themore complex the snowflake was, the more frequently it was chosen as the most beautiful.The simpler snowflakes (the three lowest complexity levels) were almost never selected. Thesolid objects with the highest complexity (see right panel of Figure 4) were most frequentlychosen as the most beautiful followed by the least complex solid objects (a bimodal
01 2 3 4 5 6 7 8 9 10 1 2 3 4 5 6 7 8 9 10
10
20
30
40
50
60
Complexity
Fre
quen
cy
0
10
20
30
40
50
60
Fre
quen
cy
Snowflakes
Complexity
Solid Objects
Figure 4. Overall results of Experiment 1 for the snowflake (left panel) and solid object (right panel) stimuli.
These graphs plot the aesthetic preferences of 204 participants for the two stimulus types. The simplest
snowflakes and solid objects possess a complexity of 1, while the most complex possess a complexity of 10.
Note that about one third of the participants (on average, 65) found the stimuli with the highest complexity
to be the most beautiful.
Adkins and Norman 5
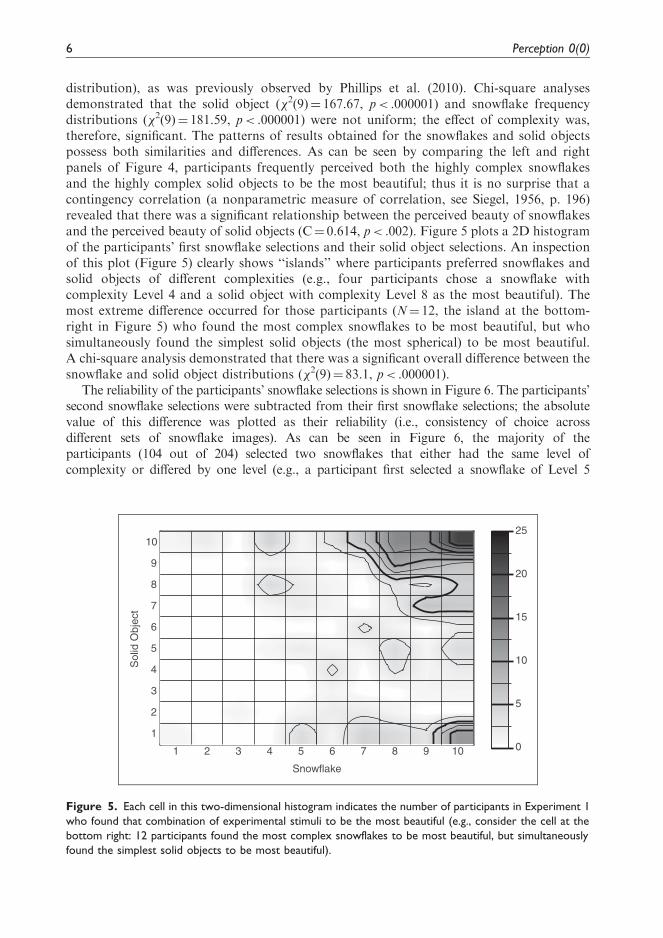
distribution), as was previously observed by Phillips et al. (2010). Chi-square analysesdemonstrated that the solid object (�2(9)¼ 167.67, p< .000001) and snowflake frequencydistributions (�2(9)¼ 181.59, p< .000001) were not uniform; the effect of complexity was,therefore, significant. The patterns of results obtained for the snowflakes and solid objectspossess both similarities and differences. As can be seen by comparing the left and rightpanels of Figure 4, participants frequently perceived both the highly complex snowflakesand the highly complex solid objects to be the most beautiful; thus it is no surprise that acontingency correlation (a nonparametric measure of correlation, see Siegel, 1956, p. 196)revealed that there was a significant relationship between the perceived beauty of snowflakesand the perceived beauty of solid objects (C¼ 0.614, p< .002). Figure 5 plots a 2D histogramof the participants’ first snowflake selections and their solid object selections. An inspectionof this plot (Figure 5) clearly shows ‘‘islands’’ where participants preferred snowflakes andsolid objects of different complexities (e.g., four participants chose a snowflake withcomplexity Level 4 and a solid object with complexity Level 8 as the most beautiful). Themost extreme difference occurred for those participants (N¼ 12, the island at the bottom-right in Figure 5) who found the most complex snowflakes to be most beautiful, but whosimultaneously found the simplest solid objects (the most spherical) to be most beautiful.A chi-square analysis demonstrated that there was a significant overall difference between thesnowflake and solid object distributions (�2(9)¼ 83.1, p< .000001).
The reliability of the participants’ snowflake selections is shown in Figure 6. The participants’second snowflake selections were subtracted from their first snowflake selections; the absolutevalue of this difference was plotted as their reliability (i.e., consistency of choice acrossdifferent sets of snowflake images). As can be seen in Figure 6, the majority of theparticipants (104 out of 204) selected two snowflakes that either had the same level ofcomplexity or differed by one level (e.g., a participant first selected a snowflake of Level 5
1 2 3 4 5 6 7 8 9 10
1
2
3
4
5
6
7
8
9
10
Snowflake
Sol
id O
bjec
t
0
5
10
15
20
25
Figure 5. Each cell in this two-dimensional histogram indicates the number of participants in Experiment 1
who found that combination of experimental stimuli to be the most beautiful (e.g., consider the cell at the
bottom right: 12 participants found the most complex snowflakes to be most beautiful, but simultaneously
found the simplest solid objects to be most beautiful).
6 Perception 0(0)
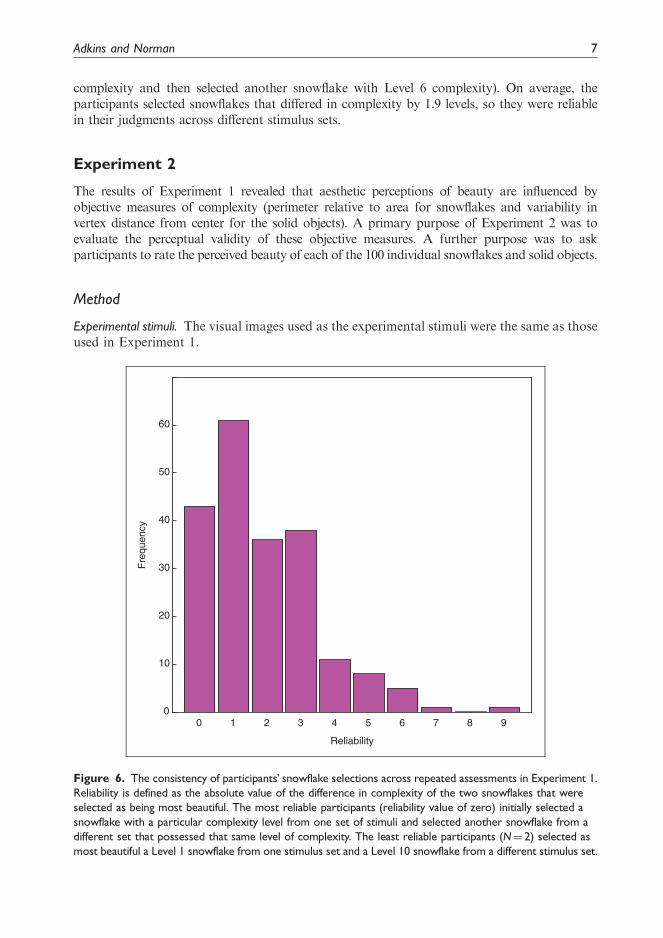
complexity and then selected another snowflake with Level 6 complexity). On average, theparticipants selected snowflakes that differed in complexity by 1.9 levels, so they were reliablein their judgments across different stimulus sets.
Experiment 2
The results of Experiment 1 revealed that aesthetic perceptions of beauty are influenced byobjective measures of complexity (perimeter relative to area for snowflakes and variability invertex distance from center for the solid objects). A primary purpose of Experiment 2 was toevaluate the perceptual validity of these objective measures. A further purpose was to askparticipants to rate the perceived beauty of each of the 100 individual snowflakes and solid objects.
Method
Experimental stimuli. The visual images used as the experimental stimuli were the same as thoseused in Experiment 1.
0 1 2 3 4 5 6 7 8 90
10
20
30
40
50
60
Reliability
Fre
quen
cy
Figure 6. The consistency of participants’ snowflake selections across repeated assessments in Experiment 1.
Reliability is defined as the absolute value of the difference in complexity of the two snowflakes that were
selected as being most beautiful. The most reliable participants (reliability value of zero) initially selected a
snowflake with a particular complexity level from one set of stimuli and selected another snowflake from a
different set that possessed that same level of complexity. The least reliable participants (N¼ 2) selected as
most beautiful a Level 1 snowflake from one stimulus set and a Level 10 snowflake from a different stimulus set.
Adkins and Norman 7
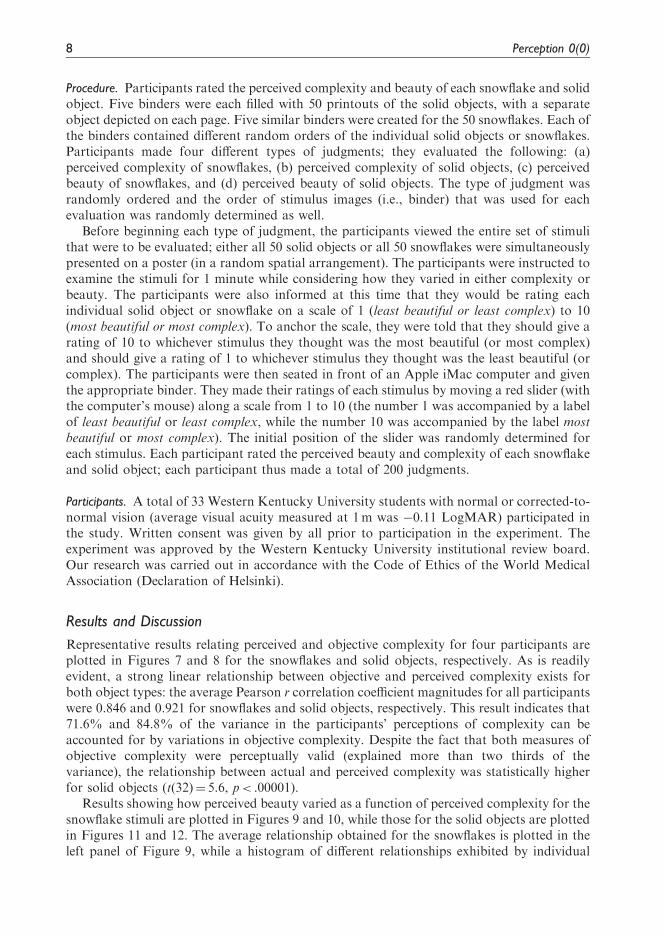
Procedure. Participants rated the perceived complexity and beauty of each snowflake and solidobject. Five binders were each filled with 50 printouts of the solid objects, with a separateobject depicted on each page. Five similar binders were created for the 50 snowflakes. Each ofthe binders contained different random orders of the individual solid objects or snowflakes.Participants made four different types of judgments; they evaluated the following: (a)perceived complexity of snowflakes, (b) perceived complexity of solid objects, (c) perceivedbeauty of snowflakes, and (d) perceived beauty of solid objects. The type of judgment wasrandomly ordered and the order of stimulus images (i.e., binder) that was used for eachevaluation was randomly determined as well.
Before beginning each type of judgment, the participants viewed the entire set of stimulithat were to be evaluated; either all 50 solid objects or all 50 snowflakes were simultaneouslypresented on a poster (in a random spatial arrangement). The participants were instructed toexamine the stimuli for 1 minute while considering how they varied in either complexity orbeauty. The participants were also informed at this time that they would be rating eachindividual solid object or snowflake on a scale of 1 (least beautiful or least complex) to 10(most beautiful or most complex). To anchor the scale, they were told that they should give arating of 10 to whichever stimulus they thought was the most beautiful (or most complex)and should give a rating of 1 to whichever stimulus they thought was the least beautiful (orcomplex). The participants were then seated in front of an Apple iMac computer and giventhe appropriate binder. They made their ratings of each stimulus by moving a red slider (withthe computer’s mouse) along a scale from 1 to 10 (the number 1 was accompanied by a labelof least beautiful or least complex, while the number 10 was accompanied by the label mostbeautiful or most complex). The initial position of the slider was randomly determined foreach stimulus. Each participant rated the perceived beauty and complexity of each snowflakeand solid object; each participant thus made a total of 200 judgments.
Participants. A total of 33 Western Kentucky University students with normal or corrected-to-normal vision (average visual acuity measured at 1m was �0.11 LogMAR) participated inthe study. Written consent was given by all prior to participation in the experiment. Theexperiment was approved by the Western Kentucky University institutional review board.Our research was carried out in accordance with the Code of Ethics of the World MedicalAssociation (Declaration of Helsinki).
Results and Discussion
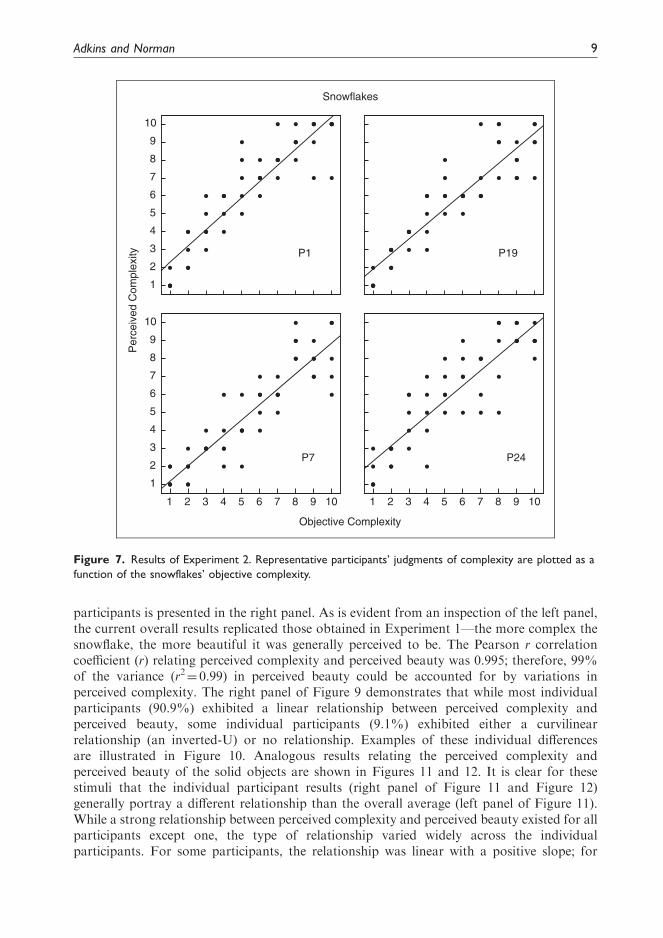
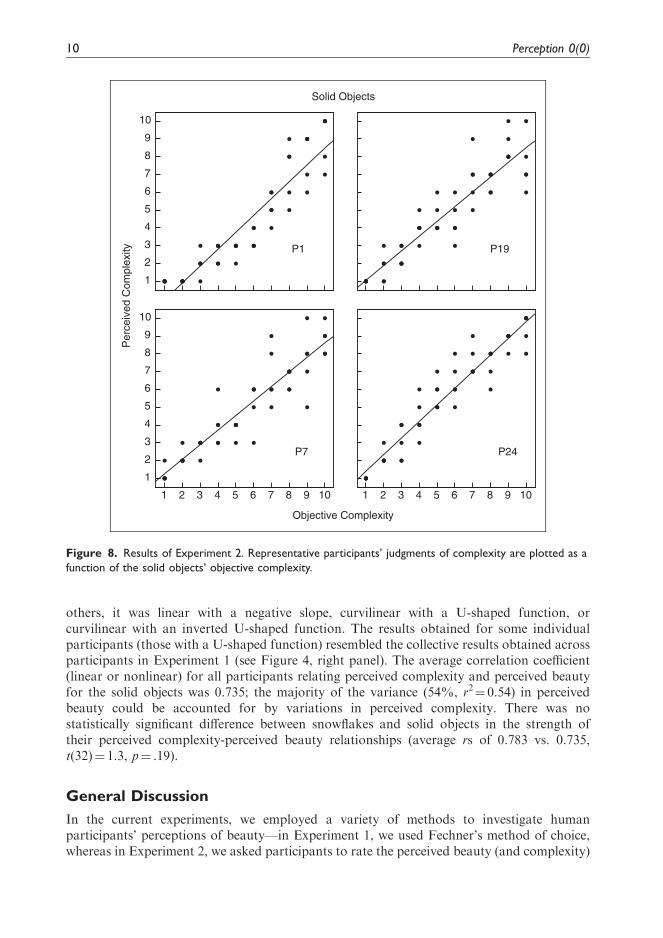
Representative results relating perceived and objective complexity for four participants areplotted in Figures 7 and 8 for the snowflakes and solid objects, respectively. As is readilyevident, a strong linear relationship between objective and perceived complexity exists forboth object types: the average Pearson r correlation coefficient magnitudes for all participantswere 0.846 and 0.921 for snowflakes and solid objects, respectively. This result indicates that71.6% and 84.8% of the variance in the participants’ perceptions of complexity can beaccounted for by variations in objective complexity. Despite the fact that both measures ofobjective complexity were perceptually valid (explained more than two thirds of thevariance), the relationship between actual and perceived complexity was statistically higherfor solid objects (t(32)¼ 5.6, p< .00001).
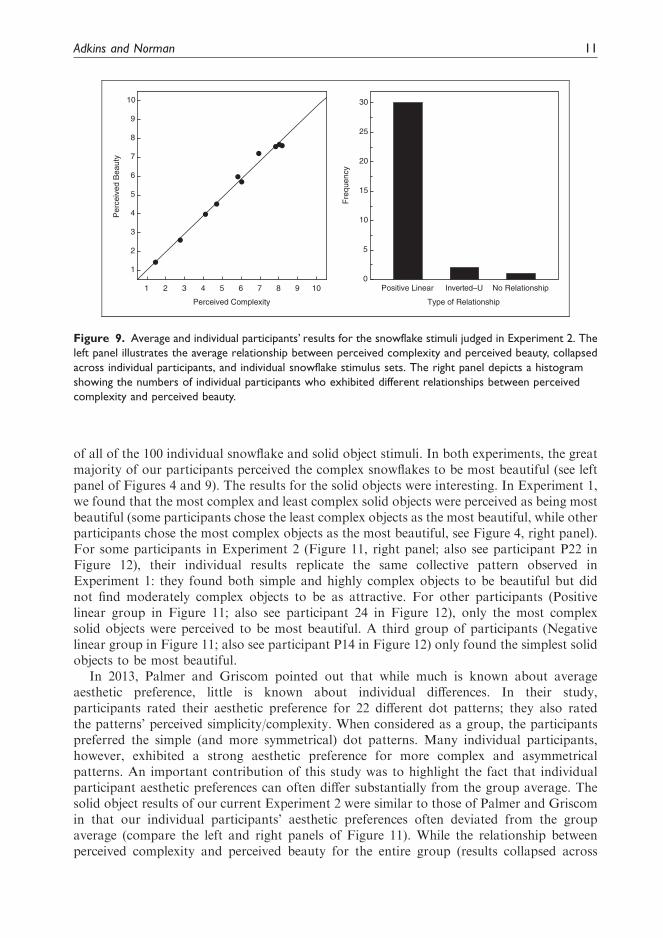
Results showing how perceived beauty varied as a function of perceived complexity for thesnowflake stimuli are plotted in Figures 9 and 10, while those for the solid objects are plottedin Figures 11 and 12. The average relationship obtained for the snowflakes is plotted in theleft panel of Figure 9, while a histogram of different relationships exhibited by individual
8 Perception 0(0)
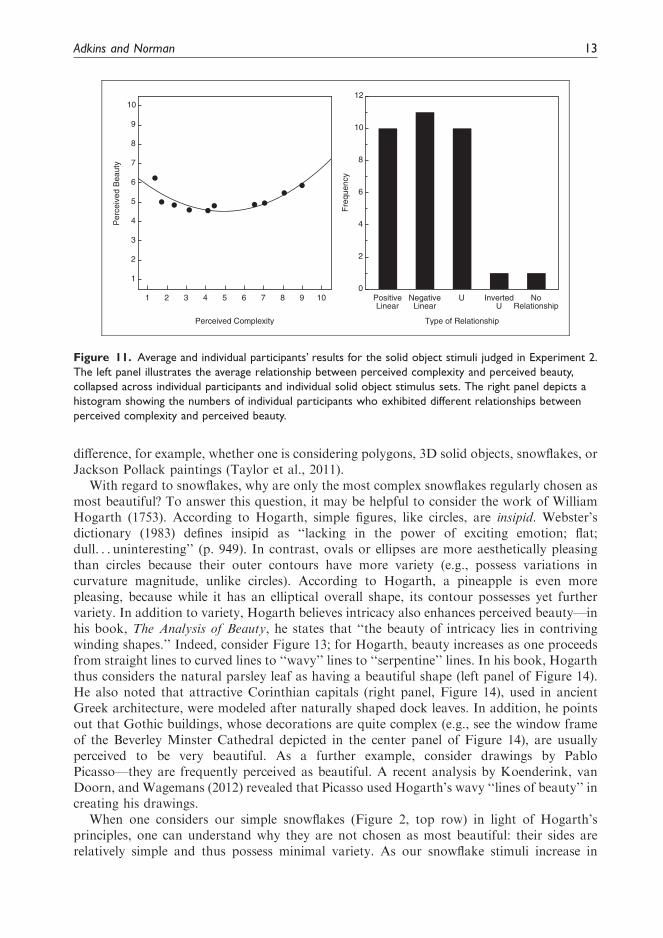
participants is presented in the right panel. As is evident from an inspection of the left panel,the current overall results replicated those obtained in Experiment 1—the more complex thesnowflake, the more beautiful it was generally perceived to be. The Pearson r correlationcoefficient (r) relating perceived complexity and perceived beauty was 0.995; therefore, 99%of the variance (r2¼ 0.99) in perceived beauty could be accounted for by variations inperceived complexity. The right panel of Figure 9 demonstrates that while most individualparticipants (90.9%) exhibited a linear relationship between perceived complexity andperceived beauty, some individual participants (9.1%) exhibited either a curvilinearrelationship (an inverted-U) or no relationship. Examples of these individual differencesare illustrated in Figure 10. Analogous results relating the perceived complexity andperceived beauty of the solid objects are shown in Figures 11 and 12. It is clear for thesestimuli that the individual participant results (right panel of Figure 11 and Figure 12)generally portray a different relationship than the overall average (left panel of Figure 11).While a strong relationship between perceived complexity and perceived beauty existed for allparticipants except one, the type of relationship varied widely across the individualparticipants. For some participants, the relationship was linear with a positive slope; for
1 2 3 4 5 6 7 8 9 10
Per
ceiv
ed C
ompl
exity
P24
Objective Complexity
1
2
3
4
5
6
7
8
9
10
P1
1 2 3 4 5 6 7 8 9 10
1
2
3
4
5
6
7
8
9
10
P7
P19
Snowflakes
Figure 7. Results of Experiment 2. Representative participants’ judgments of complexity are plotted as a
function of the snowflakes’ objective complexity.
Adkins and Norman 9
others, it was linear with a negative slope, curvilinear with a U-shaped function, orcurvilinear with an inverted U-shaped function. The results obtained for some individualparticipants (those with a U-shaped function) resembled the collective results obtained acrossparticipants in Experiment 1 (see Figure 4, right panel). The average correlation coefficient(linear or nonlinear) for all participants relating perceived complexity and perceived beautyfor the solid objects was 0.735; the majority of the variance (54%, r2¼ 0.54) in perceivedbeauty could be accounted for by variations in perceived complexity. There was nostatistically significant difference between snowflakes and solid objects in the strength oftheir perceived complexity-perceived beauty relationships (average rs of 0.783 vs. 0.735,t(32)¼ 1.3, p¼ .19).
General Discussion
In the current experiments, we employed a variety of methods to investigate humanparticipants’ perceptions of beauty—in Experiment 1, we used Fechner’s method of choice,whereas in Experiment 2, we asked participants to rate the perceived beauty (and complexity)
1 2 3 4 5 6 7 8 9 10
Per
ceiv
ed C
ompl
exity
P24
Objective Complexity
1
2
3
4
5
6
7
8
9
10
P1
1 2 3 4 5 6 7 8 9 10
1
2
3
4
5
6
7
8
9
10
P7
P19
Solid Objects
Figure 8. Results of Experiment 2. Representative participants’ judgments of complexity are plotted as a
function of the solid objects’ objective complexity.
10 Perception 0(0)
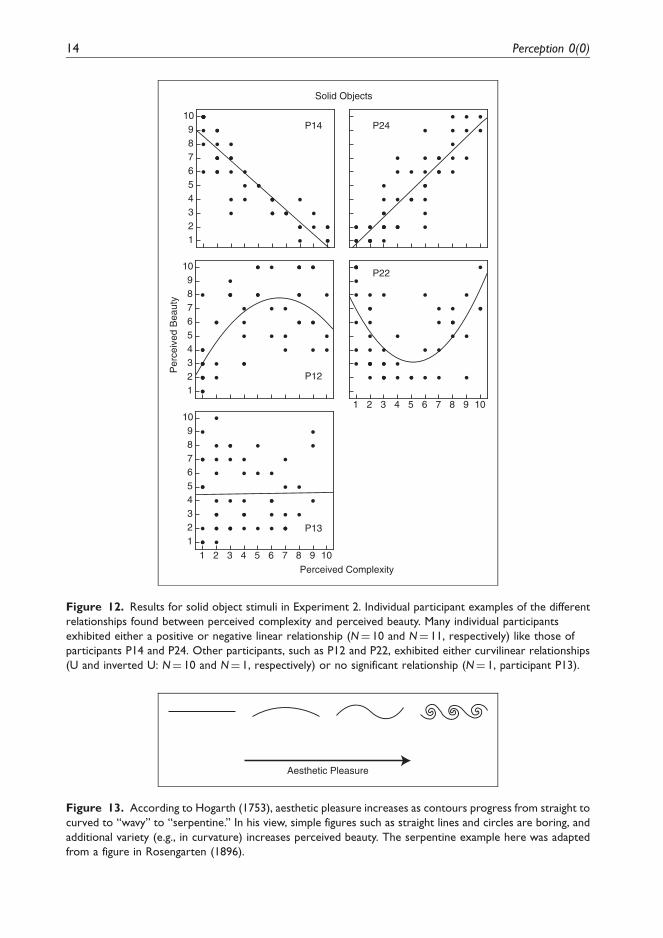
of all of the 100 individual snowflake and solid object stimuli. In both experiments, the greatmajority of our participants perceived the complex snowflakes to be most beautiful (see leftpanel of Figures 4 and 9). The results for the solid objects were interesting. In Experiment 1,we found that the most complex and least complex solid objects were perceived as being mostbeautiful (some participants chose the least complex objects as the most beautiful, while otherparticipants chose the most complex objects as the most beautiful, see Figure 4, right panel).For some participants in Experiment 2 (Figure 11, right panel; also see participant P22 inFigure 12), their individual results replicate the same collective pattern observed inExperiment 1: they found both simple and highly complex objects to be beautiful but didnot find moderately complex objects to be as attractive. For other participants (Positivelinear group in Figure 11; also see participant 24 in Figure 12), only the most complexsolid objects were perceived to be most beautiful. A third group of participants (Negativelinear group in Figure 11; also see participant P14 in Figure 12) only found the simplest solidobjects to be most beautiful.
In 2013, Palmer and Griscom pointed out that while much is known about averageaesthetic preference, little is known about individual differences. In their study,participants rated their aesthetic preference for 22 different dot patterns; they also ratedthe patterns’ perceived simplicity/complexity. When considered as a group, the participantspreferred the simple (and more symmetrical) dot patterns. Many individual participants,however, exhibited a strong aesthetic preference for more complex and asymmetricalpatterns. An important contribution of this study was to highlight the fact that individualparticipant aesthetic preferences can often differ substantially from the group average. Thesolid object results of our current Experiment 2 were similar to those of Palmer and Griscomin that our individual participants’ aesthetic preferences often deviated from the groupaverage (compare the left and right panels of Figure 11). While the relationship betweenperceived complexity and perceived beauty for the entire group (results collapsed across
1 2 3 4 5 6 7 8 9 10
1
2
3
4
5
6
7
8
9
10
Perceived Complexity
Per
ceiv
ed B
eaut
y
Positive Linear Inverted−U No Relationship0
5
10
15
20
25
30
Type of Relationship
Fre
quen
cyFigure 9. Average and individual participants’ results for the snowflake stimuli judged in Experiment 2. The
left panel illustrates the average relationship between perceived complexity and perceived beauty, collapsed
across individual participants, and individual snowflake stimulus sets. The right panel depicts a histogram
showing the numbers of individual participants who exhibited different relationships between perceived
complexity and perceived beauty.
Adkins and Norman 11
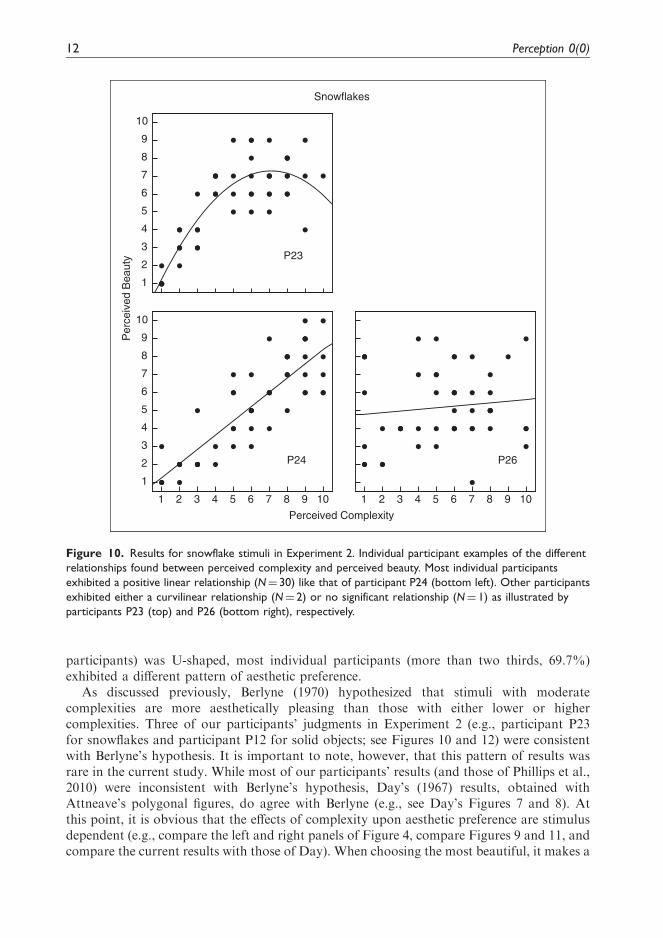
participants) was U-shaped, most individual participants (more than two thirds, 69.7%)exhibited a different pattern of aesthetic preference.
As discussed previously, Berlyne (1970) hypothesized that stimuli with moderatecomplexities are more aesthetically pleasing than those with either lower or highercomplexities. Three of our participants’ judgments in Experiment 2 (e.g., participant P23for snowflakes and participant P12 for solid objects; see Figures 10 and 12) were consistentwith Berlyne’s hypothesis. It is important to note, however, that this pattern of results wasrare in the current study. While most of our participants’ results (and those of Phillips et al.,2010) were inconsistent with Berlyne’s hypothesis, Day’s (1967) results, obtained withAttneave’s polygonal figures, do agree with Berlyne (e.g., see Day’s Figures 7 and 8). Atthis point, it is obvious that the effects of complexity upon aesthetic preference are stimulusdependent (e.g., compare the left and right panels of Figure 4, compare Figures 9 and 11, andcompare the current results with those of Day). When choosing the most beautiful, it makes a
1 2 3 4 5 6 7 8 9 10
Per
ceiv
ed B
eaut
y
P26
Perceived Complexity
1
2
3
4
5
6
7
8
9
10
P23
1 2 3 4 5 6 7 8 9 10
1
2
3
4
5
6
7
8
9
10
P24
Snowflakes
Figure 10. Results for snowflake stimuli in Experiment 2. Individual participant examples of the different
relationships found between perceived complexity and perceived beauty. Most individual participants
exhibited a positive linear relationship (N¼ 30) like that of participant P24 (bottom left). Other participants
exhibited either a curvilinear relationship (N¼ 2) or no significant relationship (N¼ 1) as illustrated by
participants P23 (top) and P26 (bottom right), respectively.
12 Perception 0(0)
difference, for example, whether one is considering polygons, 3D solid objects, snowflakes, orJackson Pollack paintings (Taylor et al., 2011).
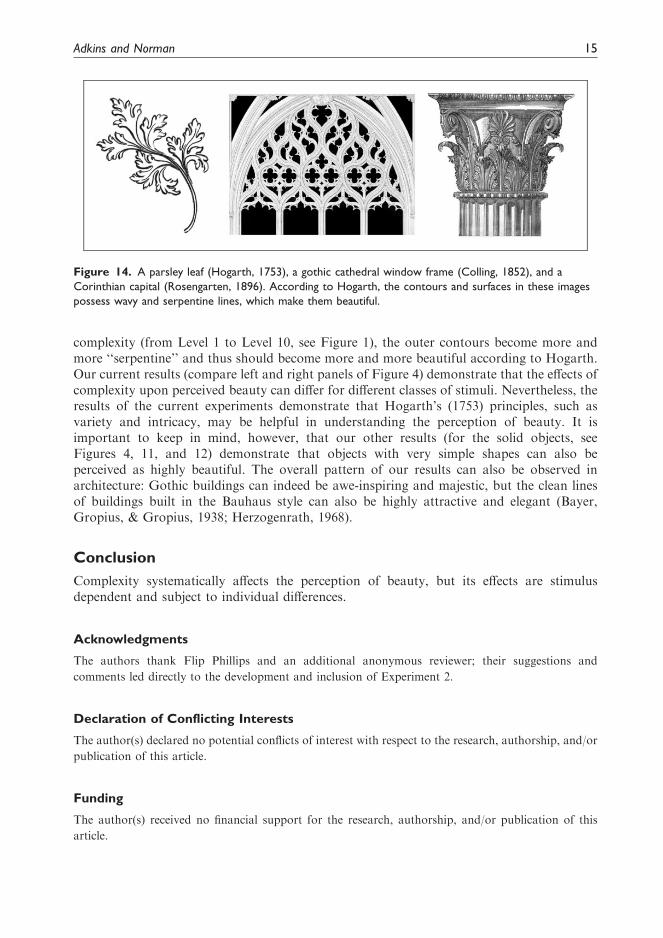
With regard to snowflakes, why are only the most complex snowflakes regularly chosen asmost beautiful? To answer this question, it may be helpful to consider the work of WilliamHogarth (1753). According to Hogarth, simple figures, like circles, are insipid. Webster’sdictionary (1983) defines insipid as ‘‘lacking in the power of exciting emotion; flat;dull. . . uninteresting’’ (p. 949). In contrast, ovals or ellipses are more aesthetically pleasingthan circles because their outer contours have more variety (e.g., possess variations incurvature magnitude, unlike circles). According to Hogarth, a pineapple is even morepleasing, because while it has an elliptical overall shape, its contour possesses yet furthervariety. In addition to variety, Hogarth believes intricacy also enhances perceived beauty—inhis book, The Analysis of Beauty, he states that ‘‘the beauty of intricacy lies in contrivingwinding shapes.’’ Indeed, consider Figure 13; for Hogarth, beauty increases as one proceedsfrom straight lines to curved lines to ‘‘wavy’’ lines to ‘‘serpentine’’ lines. In his book, Hogarththus considers the natural parsley leaf as having a beautiful shape (left panel of Figure 14).He also noted that attractive Corinthian capitals (right panel, Figure 14), used in ancientGreek architecture, were modeled after naturally shaped dock leaves. In addition, he pointsout that Gothic buildings, whose decorations are quite complex (e.g., see the window frameof the Beverley Minster Cathedral depicted in the center panel of Figure 14), are usuallyperceived to be very beautiful. As a further example, consider drawings by PabloPicasso—they are frequently perceived as beautiful. A recent analysis by Koenderink, vanDoorn, and Wagemans (2012) revealed that Picasso used Hogarth’s wavy ‘‘lines of beauty’’ increating his drawings.
When one considers our simple snowflakes (Figure 2, top row) in light of Hogarth’sprinciples, one can understand why they are not chosen as most beautiful: their sides arerelatively simple and thus possess minimal variety. As our snowflake stimuli increase in
1 2 3 4 5 6 7 8 9 10
1
2
3
4
5
6
7
8
9
10
Perceived Complexity
Per
ceiv
ed B
eaut
y
PositiveLinear
NegativeLinear
U InvertedU
NoRelationship
0
2
4
6
8
10
12
Type of Relationship
Fre
quen
cy
Figure 11. Average and individual participants’ results for the solid object stimuli judged in Experiment 2.
The left panel illustrates the average relationship between perceived complexity and perceived beauty,
collapsed across individual participants and individual solid object stimulus sets. The right panel depicts a
histogram showing the numbers of individual participants who exhibited different relationships between
perceived complexity and perceived beauty.
Adkins and Norman 13
1 2 3 4 5 6 7 8 9 10
Per
ceiv
ed B
eaut
y
P13
Perceived Complexity
123456789
10P14
123456789
10P22
1 2 3 4 5 6 7 8 9 10
123456789
10
P12
P24
Solid Objects
P13
Figure 12. Results for solid object stimuli in Experiment 2. Individual participant examples of the different
relationships found between perceived complexity and perceived beauty. Many individual participants
exhibited either a positive or negative linear relationship (N¼ 10 and N¼ 11, respectively) like those of
participants P14 and P24. Other participants, such as P12 and P22, exhibited either curvilinear relationships
(U and inverted U: N¼ 10 and N¼ 1, respectively) or no significant relationship (N¼ 1, participant P13).
Aesthetic Pleasure
Figure 13. According to Hogarth (1753), aesthetic pleasure increases as contours progress from straight to
curved to ‘‘wavy’’ to ‘‘serpentine.’’ In his view, simple figures such as straight lines and circles are boring, and
additional variety (e.g., in curvature) increases perceived beauty. The serpentine example here was adapted
from a figure in Rosengarten (1896).
14 Perception 0(0)
complexity (from Level 1 to Level 10, see Figure 1), the outer contours become more andmore ‘‘serpentine’’ and thus should become more and more beautiful according to Hogarth.Our current results (compare left and right panels of Figure 4) demonstrate that the effects ofcomplexity upon perceived beauty can differ for different classes of stimuli. Nevertheless, theresults of the current experiments demonstrate that Hogarth’s (1753) principles, such asvariety and intricacy, may be helpful in understanding the perception of beauty. It isimportant to keep in mind, however, that our other results (for the solid objects, seeFigures 4, 11, and 12) demonstrate that objects with very simple shapes can also beperceived as highly beautiful. The overall pattern of our results can also be observed inarchitecture: Gothic buildings can indeed be awe-inspiring and majestic, but the clean linesof buildings built in the Bauhaus style can also be highly attractive and elegant (Bayer,Gropius, & Gropius, 1938; Herzogenrath, 1968).
Conclusion
Complexity systematically affects the perception of beauty, but its effects are stimulusdependent and subject to individual differences.
Acknowledgments
The authors thank Flip Phillips and an additional anonymous reviewer; their suggestions and
comments led directly to the development and inclusion of Experiment 2.
Declaration of Conflicting Interests
The author(s) declared no potential conflicts of interest with respect to the research, authorship, and/or
publication of this article.
Funding
The author(s) received no financial support for the research, authorship, and/or publication of this
article.
Figure 14. A parsley leaf (Hogarth, 1753), a gothic cathedral window frame (Colling, 1852), and a
Corinthian capital (Rosengarten, 1896). According to Hogarth, the contours and surfaces in these images
possess wavy and serpentine lines, which make them beautiful.
Adkins and Norman 15
References
Attneave, F., & Arnoult, M. D. (1956). The quantitative study of shape and pattern perception.Psychological Bulletin, 53, 452–471. doi:10.1037/h0044049
Bayer, H., Gropius, W., & Gropius, I. (Eds.). (1938). Bauhaus 1919–1928. New York, NY: TheMuseum of Modern Art.
Bentley, W. A. (1903). Studies of the snow crystals during the winter of 1901–2, with additional datacollected during previous winters. Monthly Weather Review, 30, 607–616. doi:10.1175/1520-0493-
30.13.607Bentley, W. A. (2006). Bentley’s snowflakes CD-ROM and book. Mineola, NY: Dover.Bentley, W. A., & Perkins, G. H. (1898). A study of snow crystals. Appleton’s Popular Science Monthly,
53, 75–82.Bentley, W. A., & Humphreys, H. J. (1931/1962). Snow crystals. New York, NY: Dover.Berlyne, D. E. (1970). Novelty, complexity and hedonic value. Perception & Psychophysics, 8, 279–286.
doi:10.3758/BF03212593Cardenas, R. A., & Harris, L. J. (2006). Symmetrical decorations enhance the attractiveness of faces
and abstract designs. Evolution and Human Behavior, 27, 1–18. doi:10.1016/j.evolhumbehav.2005.05.002
Colling, J. K. (1852). Details of gothic architecture. London, England: David Bogue.Day, H. (1967). Evaluations of subjective complexity, pleasingness and interestingness for a series of
random polygons varying in complexity. Perception & Psychophysics, 2, 281–286. doi:10.3758/
BF03211042Faerber, S. J., & Carbon, C. (2012). The power of liking: Highly sensitive aesthetic processing for
guiding us through the world. i-Perception, 3, 553–561. doi:10.1068/i0506
Fechner, G. T. (1876). Vorschule der aesthetic [Preschool of aesthetics]. Leipzig, Germany: Breitkopfund Hartel.
Fechner, G. (1876/1997). Various attempts to establish a basic form of beauty: Experimental
aesthestics, golden section, and square. Empirical Studies of the Arts, 15, 115–130.Forsythe, A., Nadal, M., Sheehy, N., Cela-Conde, C. J., & Sawey, M. (2011). Predicting beauty: Fractal
dimension and visual complexity in art. British Journal of Psychology, 102, 49–70. doi:10.1348/000712610X498958
Halberstadt, J., & Rhodes, G. (2003). It’s not just average faces that are attractive: Computer-manipulated averageness makes birds, fish and automobiles attractive. Psychonomic Bulletin &Review, 10, 149–156. doi:10.3758/BF03196479
Heath, T., Smith, S. G., & Lim, B. (2000). Tall buildings and the urban skyline: The effect of visualcomplexity on preferences. Environment & Behavior, 32, 541–556. doi:10.1177/00139160021972658
Herzogenrath, W. (1968). 50 years Bauhaus: German exhibition. Stuttgart, Germany:
Wurttembergischer Kunstverein.Hogarth, W. (1753). The analysis of beauty. London, England: J. Reeves.Insipid. (1983). In Webster’s New Universal Unabridged Dictionary (2nd ed). New York, NY: Dorset &
Baber.Jacobsen, T., Schubotz, R. I., Hofel, L., & Cramon, D. Y. (2006). Brain correlates of aesthetic judgment
of beauty. NeuroImage, 29, 276–285. doi:10.1016/j.neuroimage.2005.07.010Kant, I. (1790/1892). Kant’s kritik of judgment. In J. H. Bernard (Trans.). London, England: Macmillan.
Koenderink, J., van Doorn, A., & Wagemans, J. (2012). Picasso in the mind’s eye of the beholder:Three-dimensional filling-in of ambiguous line drawings. Cognition, 125, 394–412. doi:10.1016/j.cognition.2012.07.019
Palmer, S. E., & Griscom, W. S. (2013). Accounting for taste: Individual differences in preference forharmony. Psychonomic Bulletin & Review, 20, 453–461. doi:10.3758/s13423-012-0355-2
Phillips, F., Norman, J. F., & Beers, A. M. (2010). Fechner’s aesthetics revisited. Seeing and Perceiving,
23, 263–271. doi:10.1163/187847510X516412Reid, T. (1785). Essays on the intellectual powers of man. Edinburgh, Scotland: John Bell and G. G. J. &
J. Robinson.
16 Perception 0(0)

Rhodes, G., Proffitt, F., Grady, J. M., & Sumich, A. (1998). Facial symmetry and the perception of
beauty. Psychonomic Bulletin & Review, 5, 659–669. doi:10.3758/BF03208842Rhodes, G., Sumich, A., & Bryant, G. (1999). Are average facial configurations attractive only because
of their symmetry? Psychological Science, 10, 52–58. doi:10.1111/1467-9280.00106
Rhodes, G., & Tremewan, T. (1996). Averageness, exaggeration and facial attractiveness. PsychologicalScience, 7, 105–110. doi:10.1111/j.1467-9280.1996.tb00338.x
Rosengarten, A. (1896). A handbook of architectural styles. (W. Collett-Sandars, Trans.). London,England: Chatto & Windus.
Saklofske, D. H. (1975). Visual aesthetic complexity, attractiveness and diversive exploration.Perceptual and Motor Skills, 41, 813–814. doi:10.2466/pms.1975.41.3.813
Santayana, G. (1896). The sense of beauty being the outlines of aesthetic theory. New York, NY: Charles
Scribner’s Sons.Siegel, S. (1956). Nonparametric statistics for the behavioral sciences. New York, NY: McGraw-Hill.Taylor, R. P., Spehar, B., Van Donkelaar, P., & Hagerhall, C. M. (2011). Perceptual and physiological
responses to Jackson Pollock’s fractals. Frontiers in Human Neuroscience, 5. doi:10.3389/fnhum.2011.00060
Thurstone, L. L. (1954). The measurement of values. Psychological Review, 61, 47–58.
Tinio, P., & Leder, H. (2009). Just how stable are stable aesthetic features? Symmetry, complexity, and thejaws of massive familiarization. Acta Psychologica, 130, 241–250. doi:10.1016/j.actpsy.2009.01.001.
Adkins and Norman 17