Embed Size (px)
Citation preview
The Water Efficiency ofRetrofit Dual Flush Toilets
December 2000
Authors
Terry Keating & Rob Lawson

Publishing Organisations:
Southern Water Environment AgencySouthern House Rio HouseYeoman Road Waterside DriveWorthing Aztec WestWest Sussex AlmondsburyBN13 3NX Bristol BS32 4UD
Tel: 0845 278 0845 Tel: 01454 624400Fax: 01454 624409
© Environment Agency December 2000
All rights reserved. No part of this document may be produced, stored in a retrieval system, or transmitted, in any form or by any means, electronic, mechanical, photocopying, recording or otherwise without the priorpermission of the Environment Agency.
Statement of UseThis document provides guidance to Environment Agency and Southern Water staff, research contractors and external agencies involved in the production of R&D outputs.
EXECUTIVE SUMMARY 1
INTRODUCTION 2
Background 2
Study Objectives 2
Project Set-up 2
Project Budget 2
Water Byelaws and Regulations 2
PROJECT METHODOLOGY 3
Survey Method 3
Recruitment Method and Customer Care 3
Monitoring Method 4
DEVICES TESTED 5
Introduction 5
Mecon Devices 5
Brann Device 5
Cistermiser Device 5
EcoFlush Device 5
RESULTS 6
Introduction 6
Overall Savings 7
Device Performance 7
Double Flushing Analysis 8
Ratio of Long to Short Flushes 8
Bounce-back 9
Effect of Property and Household Type 9
Customer and Plumber Feedback 10
DISCUSSION 11
Interpretation of results 11
Cost Implications 12
CONCLUSIONS
AND RECOMMENDATIONS 12
Conclusions 12
Recommendations 12
PLATES 13 - 15
FIGURES 16 - 19
APPENDIX A
Project Method Statement 20
APPENDIX B
Relaxation of Byelaws 21
APPENDIX C
Customer Correspondence 22
APPENDIX D
Press Articles 23
APPENDIX E
Customer Questionnaire 24
APPENDIX F
Results Tables 25 - 30
APPENDIX G
Double Flush Analysis 31 - 41
The Water Efficiency of Retrofit Dual Flush Toilets
Contents
1
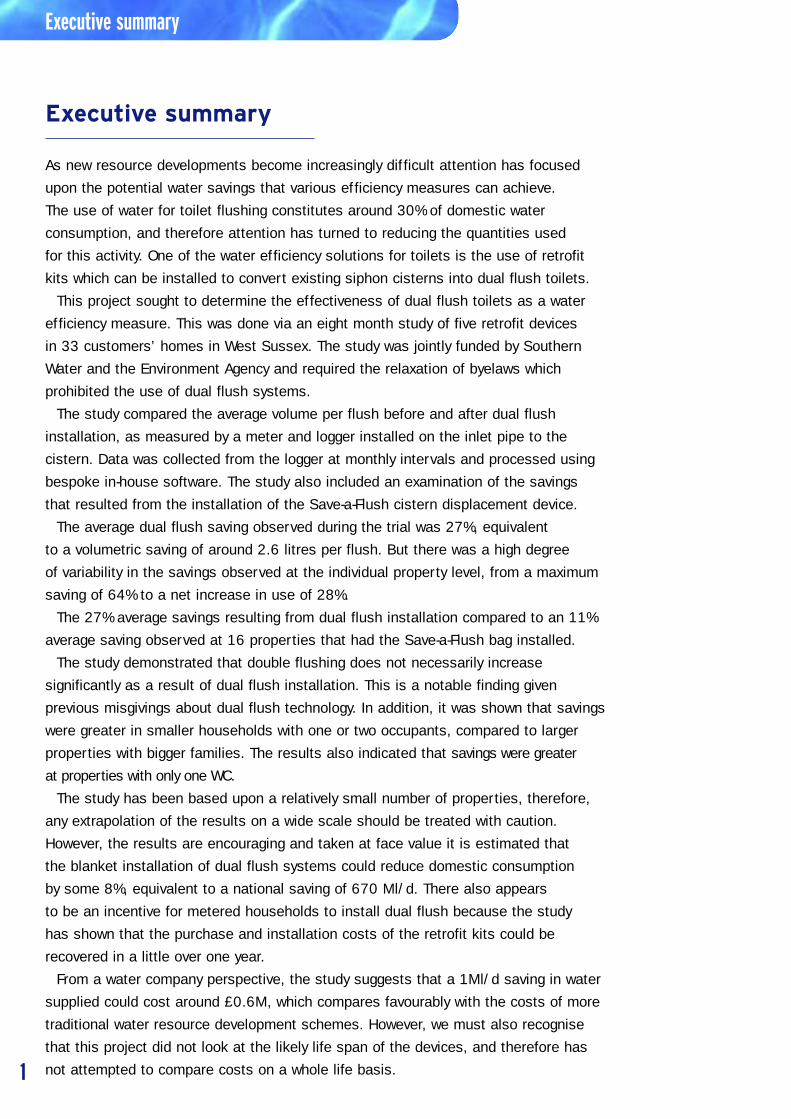
As new resource developments become increasingly difficult attention has focused
upon the potential water savings that various efficiency measures can achieve.
The use of water for toilet flushing constitutes around 30% of domestic water
consumption, and therefore attention has turned to reducing the quantities used
for this activity. One of the water efficiency solutions for toilets is the use of retrofit
kits which can be installed to convert existing siphon cisterns into dual flush toilets.
This project sought to determine the effectiveness of dual flush toilets as a water
efficiency measure. This was done via an eight month study of five retrofit devices
in 33 customers’ homes in West Sussex. The study was jointly funded by Southern
Water and the Environment Agency and required the relaxation of byelaws which
prohibited the use of dual flush systems.
The study compared the average volume per flush before and after dual flush
installation, as measured by a meter and logger installed on the inlet pipe to the
cistern. Data was collected from the logger at monthly intervals and processed using
bespoke in-house software. The study also included an examination of the savings
that resulted from the installation of the Save-a-Flush cistern displacement device.
The average dual flush saving observed during the trial was 27%, equivalent
to a volumetric saving of around 2.6 litres per flush. But there was a high degree
of variability in the savings observed at the individual property level, from a maximum
saving of 64% to a net increase in use of 28%.
The 27% average savings resulting from dual flush installation compared to an 11%
average saving observed at 16 properties that had the Save-a-Flush bag installed.
The study demonstrated that double flushing does not necessarily increase
significantly as a result of dual flush installation. This is a notable finding given
previous misgivings about dual flush technology. In addition, it was shown that savings
were greater in smaller households with one or two occupants, compared to larger
properties with bigger families. The results also indicated that savings were greater
at properties with only one WC.
The study has been based upon a relatively small number of properties, therefore,
any extrapolation of the results on a wide scale should be treated with caution.
However, the results are encouraging and taken at face value it is estimated that
the blanket installation of dual flush systems could reduce domestic consumption
by some 8%, equivalent to a national saving of 670 Ml/d. There also appears
to be an incentive for metered households to install dual flush because the study
has shown that the purchase and installation costs of the retrofit kits could be
recovered in a little over one year.
From a water company perspective, the study suggests that a 1Ml/d saving in water
supplied could cost around £0.6M, which compares favourably with the costs of more
traditional water resource development schemes. However, we must also recognise
that this project did not look at the likely life span of the devices, and therefore has
not attempted to compare costs on a whole life basis.
Executive summary
Executive summary
Introduction
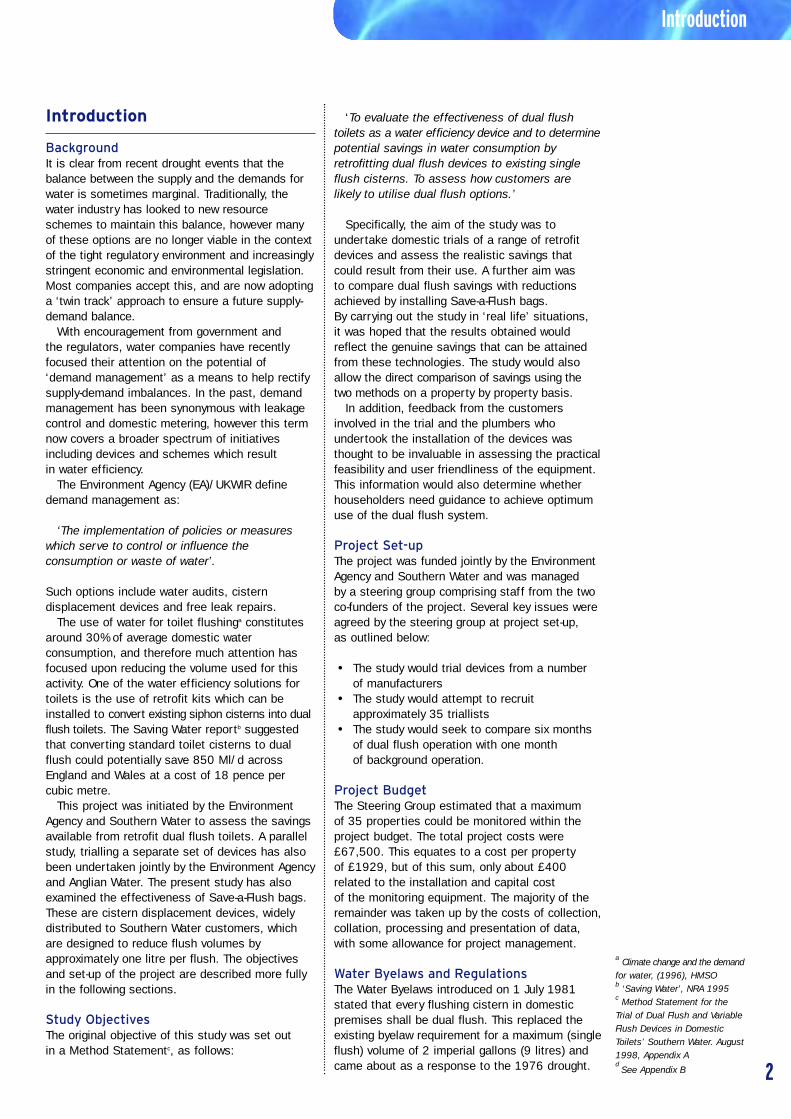
BackgroundIt is clear from recent drought events that thebalance between the supply and the demands forwater is sometimes marginal. Traditionally, thewater industry has looked to new resourceschemes to maintain this balance, however manyof these options are no longer viable in the contextof the tight regulatory environment and increasinglystringent economic and environmental legislation.Most companies accept this, and are now adoptinga ‘twin track’ approach to ensure a future supply-demand balance.
With encouragement from government and the regulators, water companies have recentlyfocused their attention on the potential of‘demand management’ as a means to help rectifysupply-demand imbalances. In the past, demandmanagement has been synonymous with leakagecontrol and domestic metering, however this termnow covers a broader spectrum of initiativesincluding devices and schemes which result in water efficiency.
The Environment Agency (EA)/UKWIR definedemand management as:
‘The implementation of policies or measureswhich serve to control or influence theconsumption or waste of water’.
Such options include water audits, cisterndisplacement devices and free leak repairs.
The use of water for toilet flushinga constitutesaround 30% of average domestic waterconsumption, and therefore much attention hasfocused upon reducing the volume used for thisactivity. One of the water efficiency solutions fortoilets is the use of retrofit kits which can beinstalled to convert existing siphon cisterns into dualflush toilets. The Saving Water reportb suggestedthat converting standard toilet cisterns to dualflush could potentially save 850 Ml/d acrossEngland and Wales at a cost of 18 pence percubic metre.
This project was initiated by the EnvironmentAgency and Southern Water to assess the savingsavailable from retrofit dual flush toilets. A parallelstudy, trialling a separate set of devices has alsobeen undertaken jointly by the Environment Agencyand Anglian Water. The present study has alsoexamined the effectiveness of Save-a-Flush bags.These are cistern displacement devices, widelydistributed to Southern Water customers, whichare designed to reduce flush volumes byapproximately one litre per flush. The objectivesand set-up of the project are described more fullyin the following sections.
Study ObjectivesThe original objective of this study was set out in a Method Statementc, as follows:
‘To evaluate the effectiveness of dual flush toilets as a water efficiency device and to determinepotential savings in water consumption by retrofitting dual flush devices to existing singleflush cisterns. To assess how customers are likely to utilise dual flush options.’
Specifically, the aim of the study was toundertake domestic trials of a range of retrofitdevices and assess the realistic savings thatcould result from their use. A further aim was to compare dual flush savings with reductionsachieved by installing Save-a-Flush bags. By carrying out the study in ‘real life’ situations, it was hoped that the results obtained wouldreflect the genuine savings that can be attainedfrom these technologies. The study would alsoallow the direct comparison of savings using the two methods on a property by property basis.
In addition, feedback from the customersinvolved in the trial and the plumbers whoundertook the installation of the devices wasthought to be invaluable in assessing the practicalfeasibility and user friendliness of the equipment.This information would also determine whetherhouseholders need guidance to achieve optimumuse of the dual flush system.
Project Set-upThe project was funded jointly by the EnvironmentAgency and Southern Water and was managed by a steering group comprising staff from the twoco-funders of the project. Several key issues wereagreed by the steering group at project set-up, as outlined below:
• The study would trial devices from a number of manufacturers
• The study would attempt to recruit approximately 35 triallists
• The study would seek to compare six months of dual flush operation with one month of background operation.
Project BudgetThe Steering Group estimated that a maximum of 35 properties could be monitored within theproject budget. The total project costs were£67,500. This equates to a cost per property of £1929, but of this sum, only about £400related to the installation and capital cost of the monitoring equipment. The majority of theremainder was taken up by the costs of collection,collation, processing and presentation of data,with some allowance for project management.
Water Byelaws and RegulationsThe Water Byelaws introduced on 1 July 1981stated that every flushing cistern in domesticpremises shall be dual flush. This replaced theexisting byelaw requirement for a maximum (singleflush) volume of 2 imperial gallons (9 litres) andcame about as a response to the 1976 drought.
Introduction
2
a Climate change and the demandfor water, (1996), HMSOb ‘Saving Water’, NRA 1995c Method Statement for theTrial of Dual Flush and VariableFlush Devices in DomesticToilets’ Southern Water. August1998, Appendix Ad
See Appendix B
New model byelaws were drafted between 1986-89 and became effective from 1st January1989. From the 1st January 1993 dual flushcisterns were prohibited unless they were as directreplacements for such a cistern purchased prior to that date. In those same byelaws the maximum(single flush) was reduced to 7.5 litres.
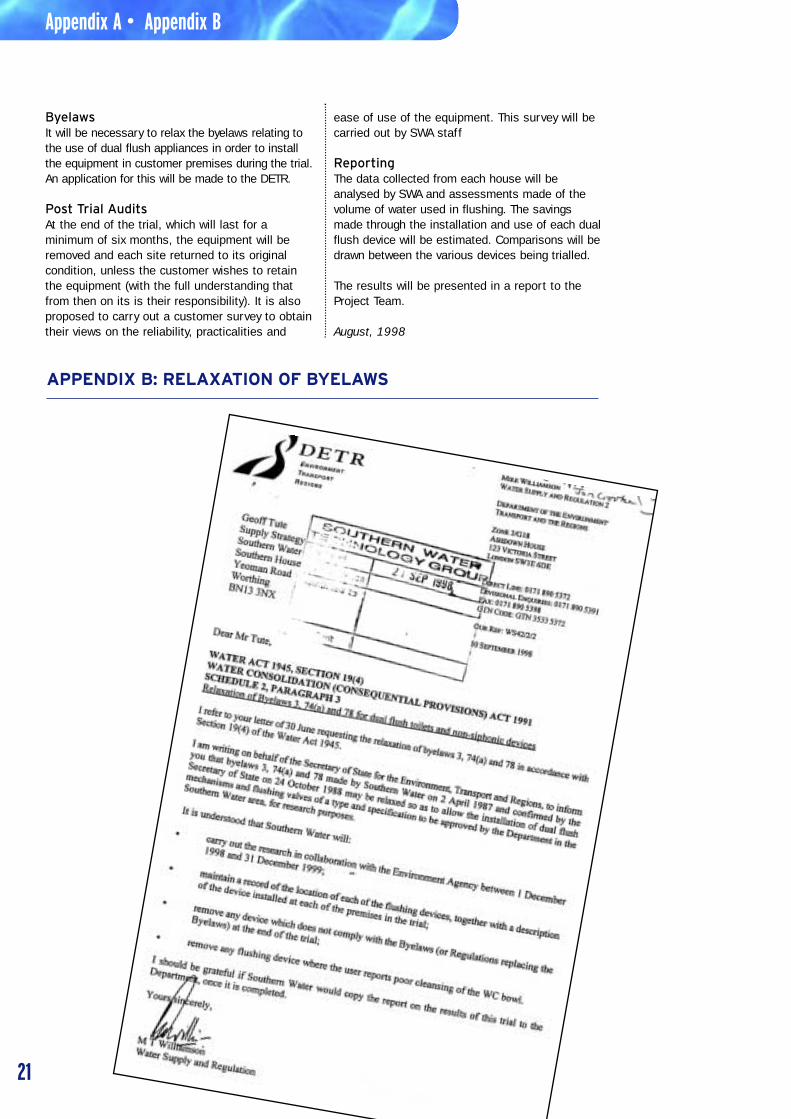
The new Water Supply (Water Fittings)Regulations 1999 came into force in July of thatyear, allowing the re-introduction of (siphonic) dualflush cisterns on new installations. However,paragraph 25 (6) states that ‘…a single flush cistern may not be replaced by a dual flush cistern’.It is understood that this restriction will apply tothe operation of the cistern mechanism, as well as the cistern itself. As a result, retrofit options for dual flush installation are still prohibited underthe 1999 Regulations. Indeed, a relaxation ofthese byelaws was required from DETR for thepurposes of carrying out this investigationd.
The question that has not been answered is whywere dual flush cisterns prohibited under the 1989byelaws? It has been suggested that users maynot have understood that a "short flush" wasobtained by ‘pushing the handle and letting go’ as opposed to ‘push and hold’ for the "long flush".As a result, it is believed that double flushing wasoften required, thereby negating any potentialwater savings. It would appear that the decision to prohibit dual flush was taken entirely on suchanecdotal evidence. No detailed studies werecarried out to support the assertion.
PROJECT METHODOLOGY
Survey MethodNumerous options were considered during projectset-up to identify the most appropriate surveymethod, relating to the way in which ‘normal’ anddual flush operation would be compared, and themeasurement of differences in flush volume.
Generally, there are two options for determiningthe effect of a water efficiency measure onconsumption: by comparing the volumes used by two similar appliances ‘side by side’, where one of the appliances has been fitted with a watersaving device, or by comparing consumption‘before and after’ the installation of a device.
The option of comparing two devices side byside is only viable where patterns of usage at bothsites are similar, and for this project this was considered a less reliable option than the ‘beforeand after’ method. When considering volumes of water used by toilets, the side by side methodwould only be viable where two toilets in oneproperty had equal usage, or where toilets at twoproperties had similar usage. Both thesescenarios are considered unlikely, and therefore the more robust‘before and after’ method was chosen for this study.
This approach was implemented by measuringtoilet flushing volumes before and after dual flush
installation at each of the properties studied.There is a possibility that the background period,before dual flush installation, would not berepresentative of usual toilet flushing rates, forexample due to higher household occupancy rates.But to account for this, the comparison of flushingvolumes before and after dual flush installation isbased upon the volume per flush. This approach isindependent of external variable factors such asoccupancy and flush rate.
Recruitment Method and Customer CareThe study aimed to monitor how retrofit dual flushdevices performed in real life situations, and thereforethe project team sought to recruit a number of SouthernWater metered domestic customers with 9 litrecapacity systems to take part in the studye.
It was agreed to focus the recruitment ofparticipants from among the residents of theHighdown Drive area of Littlehampton who hadpreviously taken part in water audits initiated by Southern Water. Potential triallists were sent a letter outlining the project and invited to attend a public meeting at which both Southern Water and the Environment Agency staff described theobjectives of the study and the manner in which it was proposed to conduct it. The Littlehamptontriallists were offered a free water butt or a £20 ScottishPower voucher as an incentive to take part in the study.
This recruitment exercise resulted in a lowernumber of participants than expected, despiteencouraging attendance and enthusiasm at thepublic meeting held to promote the scheme. Of the 198 customers contacted originally, 38 said they would be interested in taking part in the study. However, only 18 were assessed by the plumber as being suitable for installation,because of access difficulties for the meter and logger. The final number of recruits from this group was, in fact, only fifteen.
In order to increase the number of participants,another area, this time in Lancing, was targeted.Again, these customers had previously taken partin Southern Water domestic water use audits, and again an incentive was provided, although the value of the vouchers offered was increased to £50. Of the 196 customers mailed in thisexercise, 46 expressed interest in taking part in the trial, 18 of whom were included afterplumbing inspections.
The total number of triallists actually recruitedwas 38, including five members of staff from theEnvironment Agency who volunteered for the studyto help boost participant numbers and threecustomers held on a reserve list, who were to be brought into the trial if problems occurredelsewhere. In fact, by the end of the trial, all 38 customers had taken part, with usable data being obtained from 33 of them.
The recruitment method, the incentives offeredand the inclusion of Environment Agency staff inthe trial meant that the participants were not3
Introduction and Project Methodology
e Customer Correspondence ispresented in Appendix C, and press articles are given inAppendix D
necessarily representative of the wider population.Additionally, the motivation for inclusion in the trialwas not the same as would be the case for meteredcustomers who wished to save water and thereforereduce their bills. However, it is difficult to avoidthese factors in a project of this nature and despite thelimitations, the study is considered to be a validsurvey of real life use of new dual flush technology.
Customer care was of paramount importanceduring the study. All installation and download visitswere by appointment so that the customer knewwho was coming and when to expect a visit. Inaddition, the Southern Water Call Centre and thelocal police were informed of the project so thatany queries or problems could be directed back to the project team as soon as possible.
Customer queries were dealt with as quickly and efficiently as possible, and the contractedplumber was on call to deal with the rare leaksthat occurred. During the trial several participantsasked to withdraw and they were replaced withcustomers from the reserve list.
Monitoring MethodSeveral options were considered for monitoringeach flush, including level sensors within the cistern and mercury switches connected to the toilet handle. The final choice of meter andlogger on the inlet pipe was, however, the most
straightforward method and the one which hadproven to be successful in similar trialsundertaken by Anglian Water. By directlymonitoring flow into the cistern this methodisolated the appliance of interest, once moreremoving the influence of extraneous factors whichcould have confused the situation. This, combinedwith the measurement of saving per flush, isconsidered ‘best practice’ using the technologyavailable.
Monitoring of consumption during the trial wasundertaken using a domestic Kent PSM-LT watermeter cut into the inlet pipe into the cistern. Thiswas connected to a Technolog DCM data logger,configured to ‘event’ recording. The meter gave apulsed output every 0.5 litres which was receivedand recorded by the logger.
The DCM loggers are designed specifically forlogging data from domestic consumption metersand have a 64k capacity. This provided enoughstorage for between 2 and 4 months of data dependingon the number of events occurring per unit of time(i.e. the number of flushes per day). Despite thiscapability, visits to download data were generallymade every 4 to 6 weeks to ensure large amountsof data were not lost in the event of logger failure,and more importantly to maintain customer contact.
Installation of the meters and dual flush deviceswere undertaken by a local plumber, contracted toSouthern Water. Installation took place in severalstages. The initial phase involved a survey of eachcandidate property for suitability. This included anassessment of the cistern to determine whichdevices could be installed, and a review of the
configuration of the inlet pipe to assess whetherthe installation of a meter was practicable withoutsignificant disturbance to existing fittings.
Once a property had been identified as suitable,the meter and logger were installed andbackground monitoring commenced. Test datawere collected from the logger to ensure theelectronic data corresponded to the volumesmeasured by the meter. The capacity andassociated flush size of the cistern was alsorecorded. After approximately one month, theplumbers returned to the property to install thedual flush device in the cistern. The customer was instructed in the operation of the device and all original components were retained for reinstatement where possible.
The feedback from participants was invaluable in assessing the performance and user friendliness of the various devices. A questionnairef was used on each download visit to monitor the ongoing satisfaction of thehouseholder with their particular device. Details of any significant changes in residency or periods of absence were also recorded at this time.
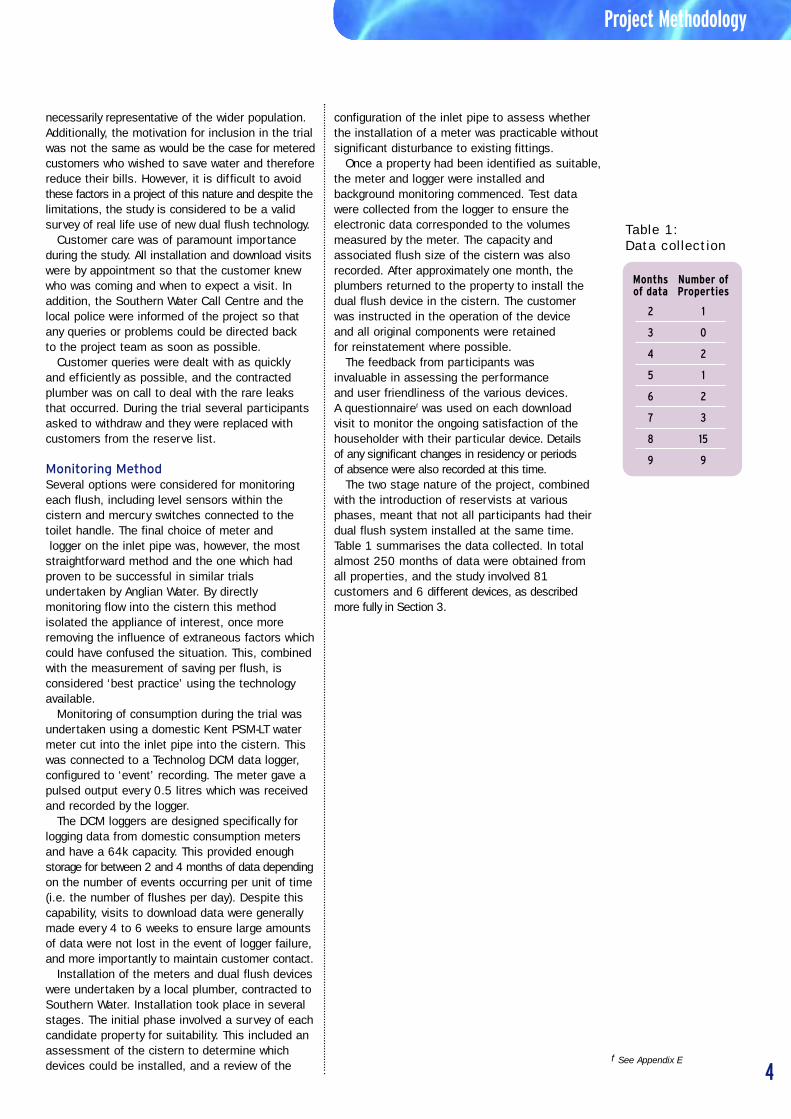
The two stage nature of the project, combinedwith the introduction of reservists at variousphases, meant that not all participants had theirdual flush system installed at the same time.Table 1 summarises the data collected. In totalalmost 250 months of data were obtained from all properties, and the study involved 81customers and 6 different devices, as describedmore fully in Section 3.
Project Methodology
4
Months Number ofof data Properties
2 1
3 0
4 2
5 1
6 2
7 3
8 15
9 9
Table 1: Data collection
f See Appendix E
DEVICES TESTED
IntroductionThe devices chosen for the trial were selectedfrom a number that were offered for inspection by their manufacturer. Three suppliers were initiallychosen to allow comparison in performance betweendevices in terms of cost, ease of installation andoperation and durability. The chosen supplierswere Mecon, Peter Brann and Cistermiser.
Mecon DevicesMecon is a small Irish company specialising in the development of dual flush retrofit devices.The company offered two devices for trial, thestandard dual flush device and an interrupterdevice, which had not been trialled before.
The standard device (Plate 1) is operated by two small delayed action floats in a chamberattached to the cistern wall. The flush operation is controlled by the user via a pull-tag. This devicecan be configured to default to either a long or a short flush. Both options were trialled.
The interrupter unit (Plate 2) comprises a push-button unit installed in the blanked handlehole in the cistern wall. The operation of the pushbutton introduces air into the siphon, curtailing the flush. Mecon therefore effectively providedthree different devices for trial.
Brann DeviceThe device, developed by Mr Peter Brann, was alsoin its prototype stage at the beginning of the trial.It also operates by breaking the siphon via theintroduction of air, as controlled by a dial which fitsaround a special handle (Plate 3). The unit hasthree flush settings, corresponding to threedifferent length tubes which break the siphonwhen the water level in the cistern falls below thelevel of the bottom of the tube.
Cistermiser DeviceCistermiser are a well known manufacturer of urinalcontrols and other sanitary control devices. Thecompany offered a dual flush version of a standardsingle flush hands-free operated device, whichused a drop valve instead of the usual siphon toactuate the flush (Plate 4). The unit comprises theflap valve mechanism connected to two infra-redsensors which operate either a short or long flushwhen a hand is passed in front of the sensor.
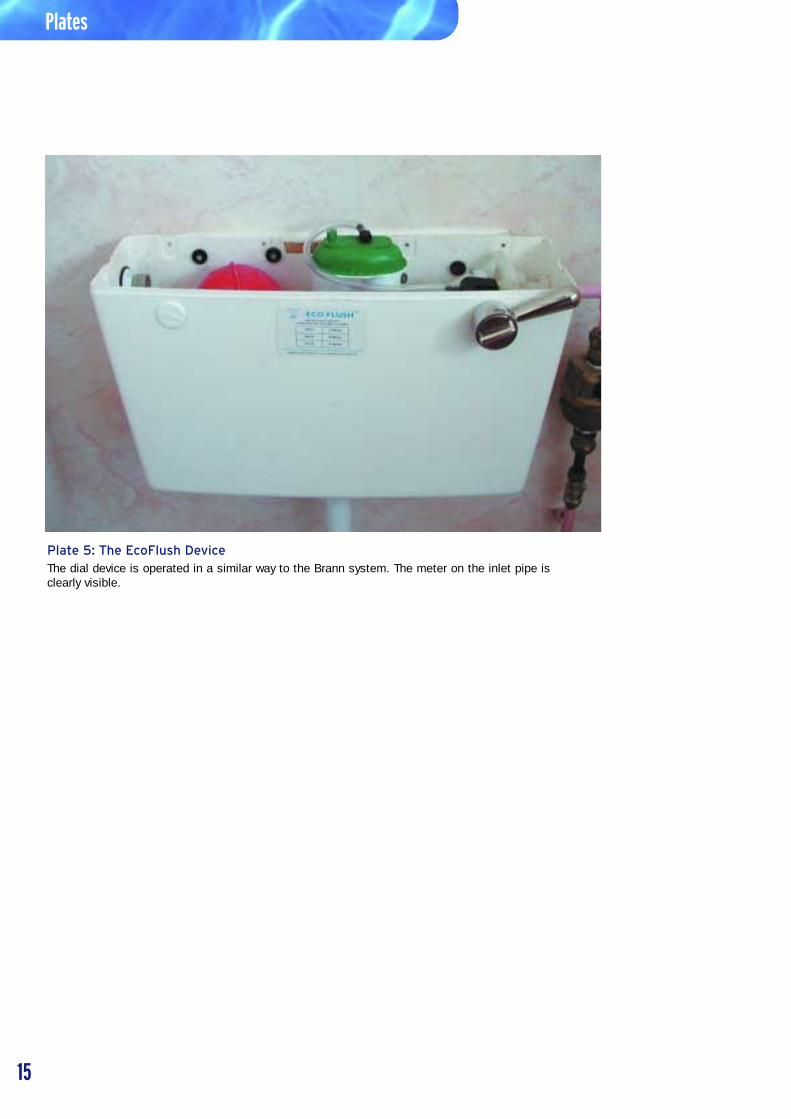
EcoFlush DeviceAn opportunity to include a fourth device in thestudy arose in December 1999. The EcoFlushDevice, from Gesek is operated in a similar way to the Brann device, and also has three flush size settings (Plate 5).
5
Devices Tested
RESULTS
IntroductionThis section summarises the results of the study.The overall savings observed will be presented,followed by more detailed analyses which examinethe relative performance of each device used inthe study. The effects of occupancy rates and thenumber of toilets in each property on savings willalso be reported.
In the past, double flushing has been considereda problem associated with dual flush toilets. Thefindings of a separate study into the doubleflushing rates observed in this trial will also bepresented. Further analysis will investigate theratio of long to short flushes observed at selectedproperties and whether there was any evidence fora reduction in savings (‘bounce-back’) during theperiod of the study. The final parts of this section
will present the qualitative observations of theparticipants and plumbers involved in the study onthe devices tested.
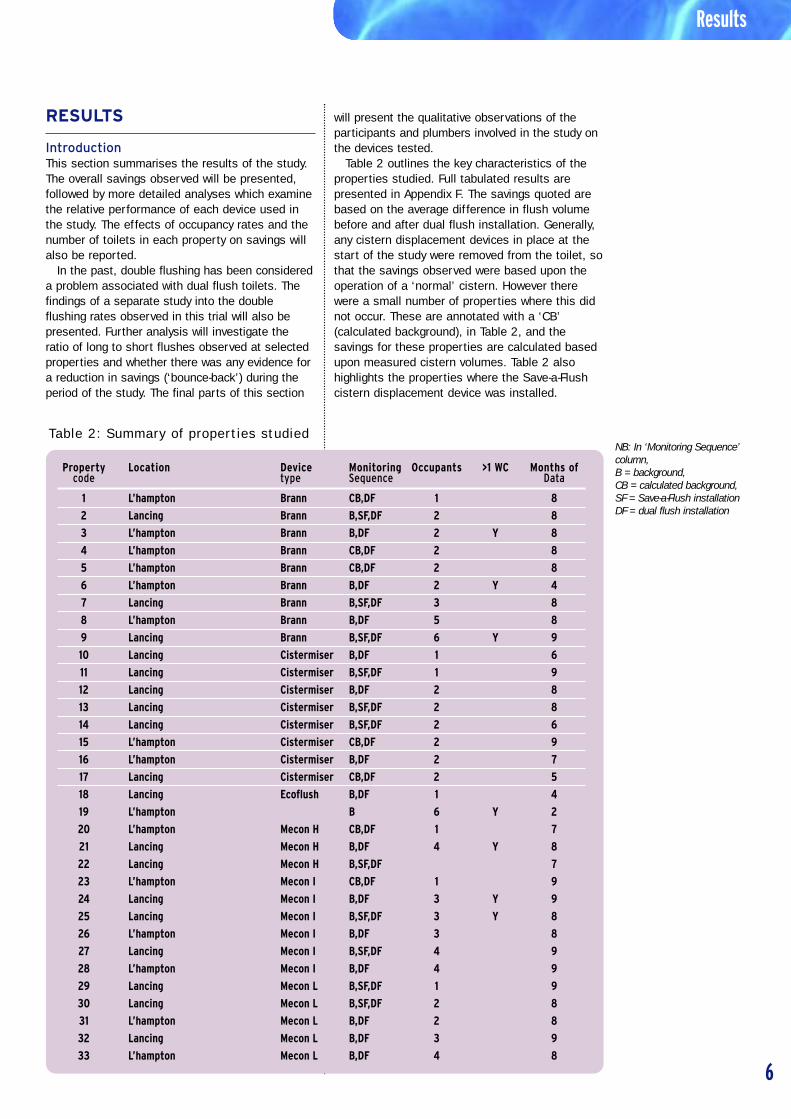
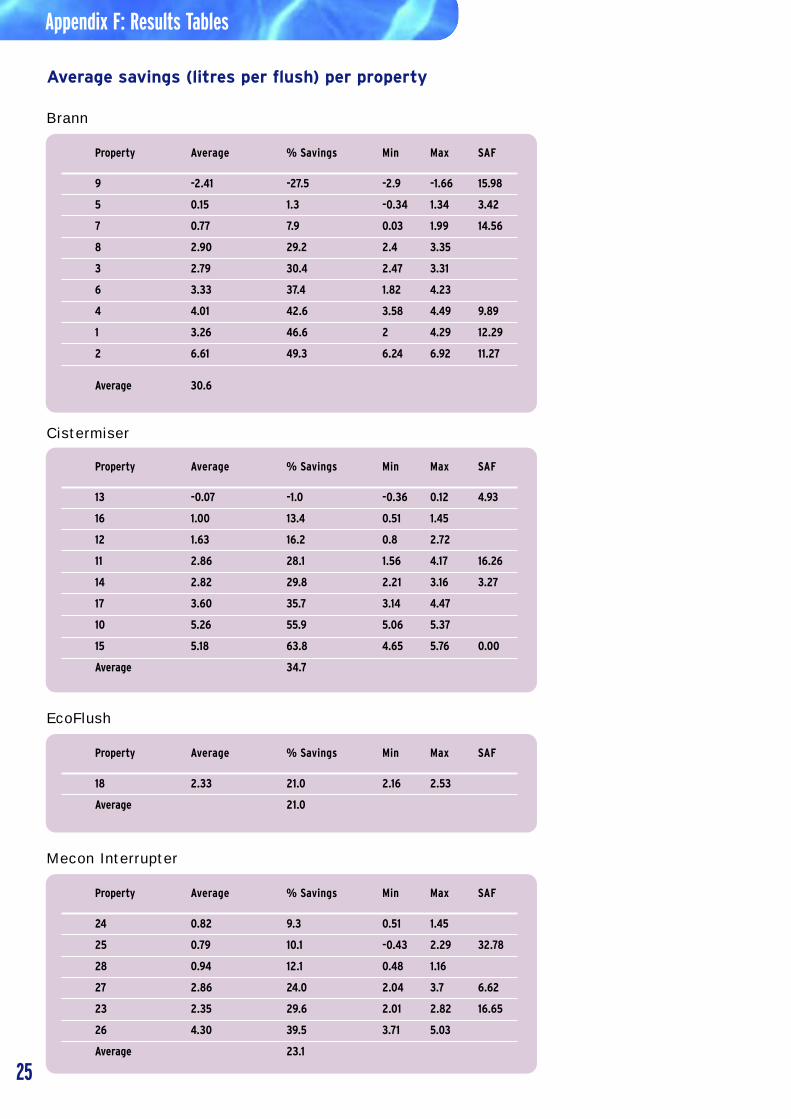
Table 2 outlines the key characteristics of theproperties studied. Full tabulated results are presented in Appendix F. The savings quoted arebased on the average difference in flush volumebefore and after dual flush installation. Generally,any cistern displacement devices in place at thestart of the study were removed from the toilet, sothat the savings observed were based upon theoperation of a ‘normal’ cistern. However therewere a small number of properties where this didnot occur. These are annotated with a ‘CB’(calculated background), in Table 2, and thesavings for these properties are calculated basedupon measured cistern volumes. Table 2 alsohighlights the properties where the Save-a-Flushcistern displacement device was installed.
Results
6
Property Location Device Monitoring Occupants >1 WC Months of code type Sequence Data
1 L’hampton Brann CB,DF 1 8
2 Lancing Brann B,SF,DF 2 8
3 L’hampton Brann B,DF 2 Y 8
4 L’hampton Brann CB,DF 2 8
5 L’hampton Brann CB,DF 2 8
6 L’hampton Brann B,DF 2 Y 4
7 Lancing Brann B,SF,DF 3 8
8 L’hampton Brann B,DF 5 8
9 Lancing Brann B,SF,DF 6 Y 9
10 Lancing Cistermiser B,DF 1 6
11 Lancing Cistermiser B,SF,DF 1 9
12 Lancing Cistermiser B,DF 2 8
13 Lancing Cistermiser B,SF,DF 2 8
14 Lancing Cistermiser B,SF,DF 2 6
15 L’hampton Cistermiser CB,DF 2 9
16 L’hampton Cistermiser B,DF 2 7
17 Lancing Cistermiser CB,DF 2 5
18 Lancing Ecoflush B,DF 1 4
19 L’hampton B 6 Y 2
20 L’hampton Mecon H CB,DF 1 7
21 Lancing Mecon H B,DF 4 Y 8
22 Lancing Mecon H B,SF,DF 7
23 L’hampton Mecon I CB,DF 1 9
24 Lancing Mecon I B,DF 3 Y 9
25 Lancing Mecon I B,SF,DF 3 Y 8
26 L’hampton Mecon I B,DF 3 8
27 Lancing Mecon I B,SF,DF 4 9
28 L’hampton Mecon I B,DF 4 9
29 Lancing Mecon L B,SF,DF 1 9
30 Lancing Mecon L B,SF,DF 2 8
31 L’hampton Mecon L B,DF 2 8
32 Lancing Mecon L B,DF 3 9
33 L’hampton Mecon L B,DF 4 8
Table 2: Summary of properties studiedNB: In ‘Monitoring Sequence’column, B = background, CB = calculated background, SF = Save-a-Flush installation DF = dual flush installation
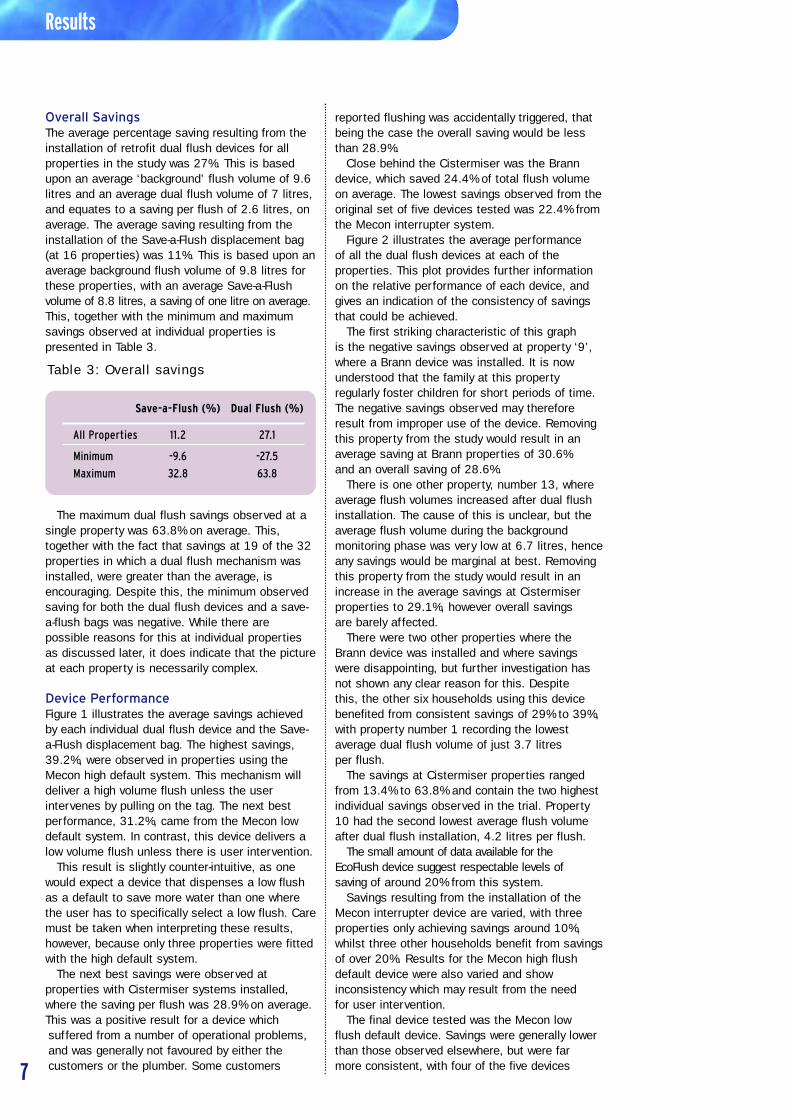
Overall Savings The average percentage saving resulting from theinstallation of retrofit dual flush devices for allproperties in the study was 27%. This is basedupon an average ‘background’ flush volume of 9.6litres and an average dual flush volume of 7 litres,and equates to a saving per flush of 2.6 litres, onaverage. The average saving resulting from theinstallation of the Save-a-Flush displacement bag(at 16 properties) was 11%. This is based upon anaverage background flush volume of 9.8 litres forthese properties, with an average Save-a-Flushvolume of 8.8 litres, a saving of one litre on average.This, together with the minimum and maximumsavings observed at individual properties is presented in Table 3.
.
The maximum dual flush savings observed at asingle property was 63.8% on average. This,together with the fact that savings at 19 of the 32properties in which a dual flush mechanism wasinstalled, were greater than the average, isencouraging. Despite this, the minimum observedsaving for both the dual flush devices and a save-a-flush bags was negative. While there arepossible reasons for this at individual propertiesas discussed later, it does indicate that the pictureat each property is necessarily complex.
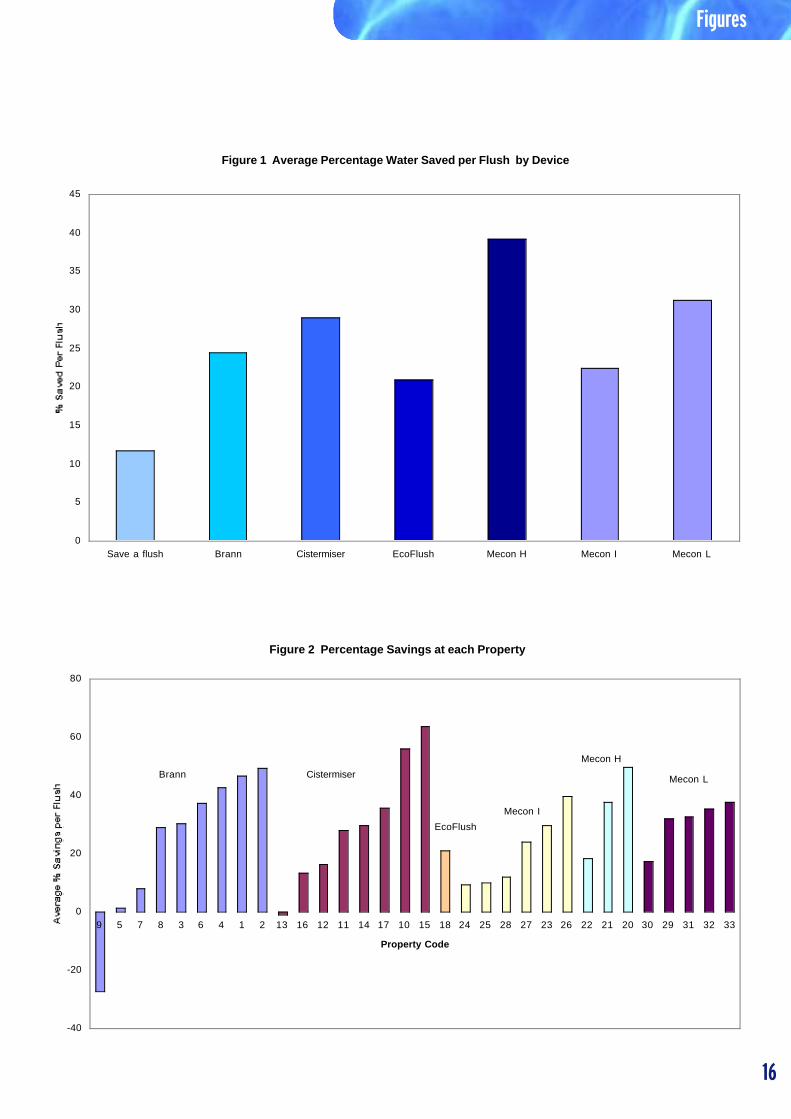
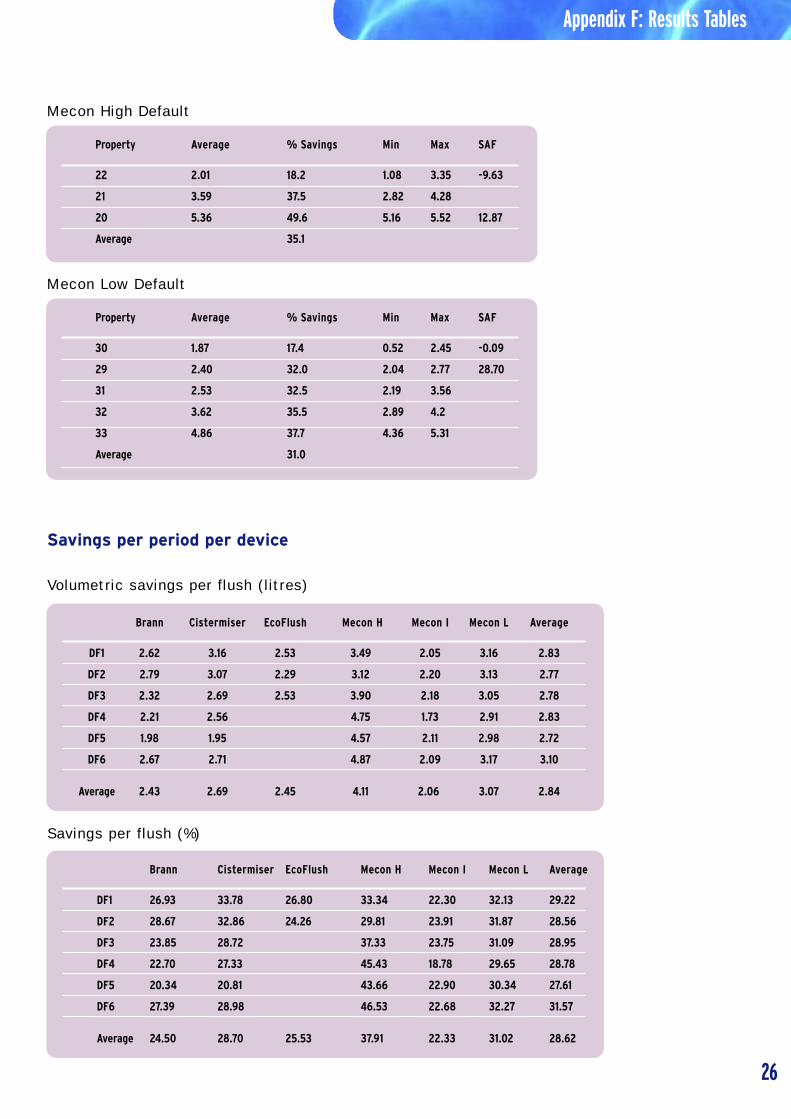
Device PerformanceFigure 1 illustrates the average savings achievedby each individual dual flush device and the Save-a-Flush displacement bag. The highest savings,39.2%, were observed in properties using theMecon high default system. This mechanism willdeliver a high volume flush unless the userintervenes by pulling on the tag. The next bestperformance, 31.2%, came from the Mecon lowdefault system. In contrast, this device delivers alow volume flush unless there is user intervention.
This result is slightly counter-intuitive, as onewould expect a device that dispenses a low flushas a default to save more water than one wherethe user has to specifically select a low flush. Caremust be taken when interpreting these results,however, because only three properties were fittedwith the high default system.
The next best savings were observed atproperties with Cistermiser systems installed,where the saving per flush was 28.9% on average. This was a positive result for a device whichsuffered from a number of operational problems,and was generally not favoured by either thecustomers or the plumber. Some customers
reported flushing was accidentally triggered, thatbeing the case the overall saving would be lessthan 28.9%.
Close behind the Cistermiser was the Branndevice, which saved 24.4% of total flush volumeon average. The lowest savings observed from theoriginal set of five devices tested was 22.4% fromthe Mecon interrupter system.
Figure 2 illustrates the average performance of all the dual flush devices at each of theproperties. This plot provides further informationon the relative performance of each device, andgives an indication of the consistency of savingsthat could be achieved.
The first striking characteristic of this graph is the negative savings observed at property ‘9’,where a Brann device was installed. It is nowunderstood that the family at this propertyregularly foster children for short periods of time.The negative savings observed may thereforeresult from improper use of the device. Removingthis property from the study would result in anaverage saving at Brann properties of 30.6% and an overall saving of 28.6%.
There is one other property, number 13, whereaverage flush volumes increased after dual flushinstallation. The cause of this is unclear, but theaverage flush volume during the backgroundmonitoring phase was very low at 6.7 litres, henceany savings would be marginal at best. Removingthis property from the study would result in anincrease in the average savings at Cistermiserproperties to 29.1%, however overall savings are barely affected.
There were two other properties where theBrann device was installed and where savingswere disappointing, but further investigation hasnot shown any clear reason for this. Despite this, the other six households using this devicebenefited from consistent savings of 29% to 39%,with property number 1 recording the lowestaverage dual flush volume of just 3.7 litres per flush.
The savings at Cistermiser properties rangedfrom 13.4% to 63.8% and contain the two highestindividual savings observed in the trial. Property10 had the second lowest average flush volumeafter dual flush installation, 4.2 litres per flush.
The small amount of data available for the EcoFlush device suggest respectable levels of saving of around 20% from this system.
Savings resulting from the installation of theMecon interrupter device are varied, with threeproperties only achieving savings around 10%,whilst three other households benefit from savingsof over 20%. Results for the Mecon high flushdefault device were also varied and showinconsistency which may result from the need for user intervention.
The final device tested was the Mecon low flush default device. Savings were generally lowerthan those observed elsewhere, but were far more consistent, with four of the five devices7
Results
Save-a-Flush (%) Dual Flush (%)
All Properties 11.2 27.1
Minimum -9.6 -27.5
Maximum 32.8 63.8
Table 3: Overall savings
Results
8
delivering average savings within 6% of each other.This demonstrates that this device is able toachieve dependable levels of savings in a range ofhousehold situations.
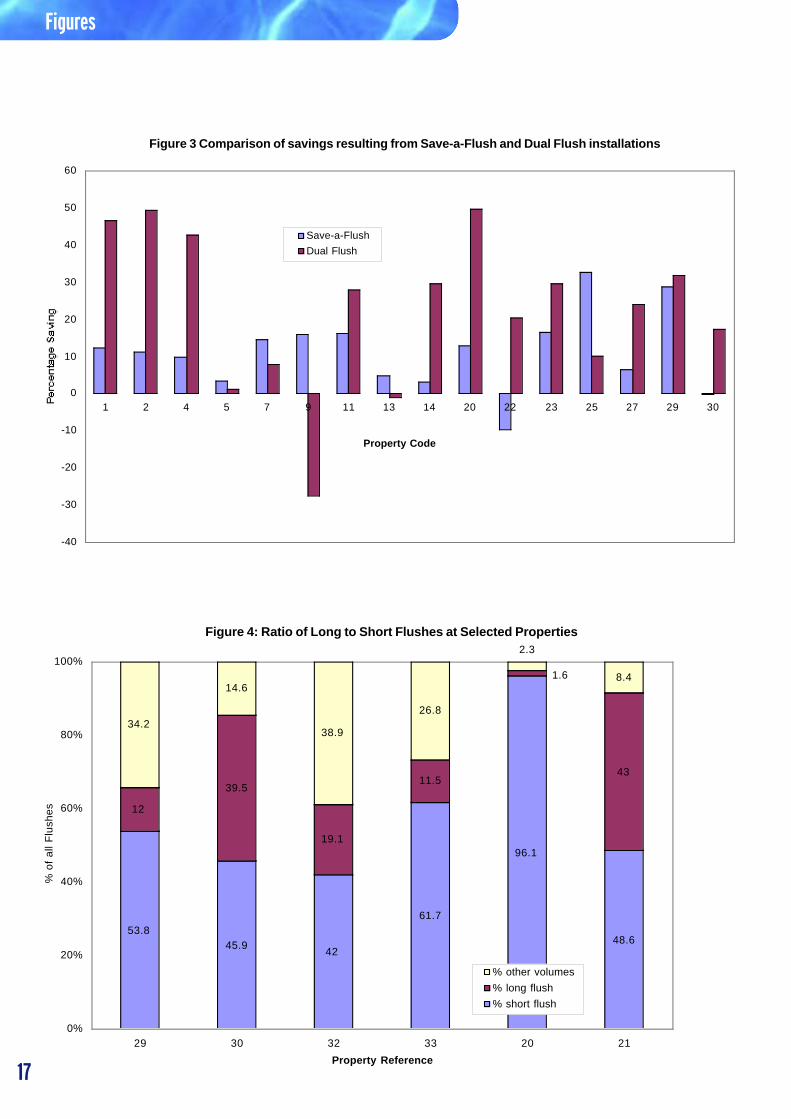
Figure 3 compares the savings achieved inthose properties where both the Save-a-Flush bag and the dual flush device were tested. The figure illustrates that the dual flush devicesaved more water per flush than the displacementdevice at 11 out of the 16 properties examined.But this is to be expected, as the particular Save-a-Flush bags used were designed to saveone litre per flush only. However, in five propertiesthe Save-a-Flush bag performed better than the dualflush device.
The reasons for this are generally specific toeach cistern. For example, at Property 25, themeasured saving per flush arising from the Save-a-Flush installation was over 2.5 litres, but a properly installed Save-a-Flush bag shouldonly reduce the flush volume by one litre. It is now thought that a saving of this volumeoccurred because the Save-a-Flush bag wasobstructing the full movement of the ball-cock,thus preventing full refill of the cistern. Elsewhere(e.g. Property 13), it appears that a ‘fit & forget’displacement device is more appropriate to aparticular household than a dual flush installation.
Double Flushing AnalysisOne of the principal arguments against the use of dual flush toilets is the perceived highdegree of double flushing that is necessaryg.Double flushing occurs when the initial low volumeflush is insufficient to clear the pan and a second(or third) flush is used. It is possible that a highprevalence of double flushing could negate thewater saving benefits of dual flush systems.
There are a number of parameters which can be drawn from the data collected to assessthe occurrence of double flushing. The mostobvious is the flush volume, but this iscomplicated particularly when variable flushvolumes occur. Another option is to analyse the change in flush patterns that occur when the interval between flushes is varied.
Each 0.5 litre volume that passed through themeter on the inlet pipe was recorded by the loggeras a single event, or ‘pulse’. The analysis employedby Southern Water assumed the termination of asingle, complete flush when 300 seconds hadelapsed without an event being recorded after theprevious pulse. Therefore a standard single flushof 9 litres appeared in the logger output as 18consecutive 0.5 litre pulses followed by at least300 seconds of zero flow. This is complicatedwhen one considers that a similar sized event (interms of volume) would occur when two 4.5 litreflushes were separated by less than 300 seconds.
This second scenario could be considered adouble flush, but would not be registered as suchwhen using a 300 second separation to define singleflush events. However, if the two 4.5 litre flushes
were 120 seconds apart (for example), and theinterval between pulses was reduced to 60 seconds,then these events would be recorded separately.
Therefore, by varying the interval, which defines the separation of flush events, it ispossible to determine the percentage of flushesthat occur between certain intervals. In fact,comparisons were made between flush sizedistributions, as defined using a separation of 60seconds and 300 seconds.
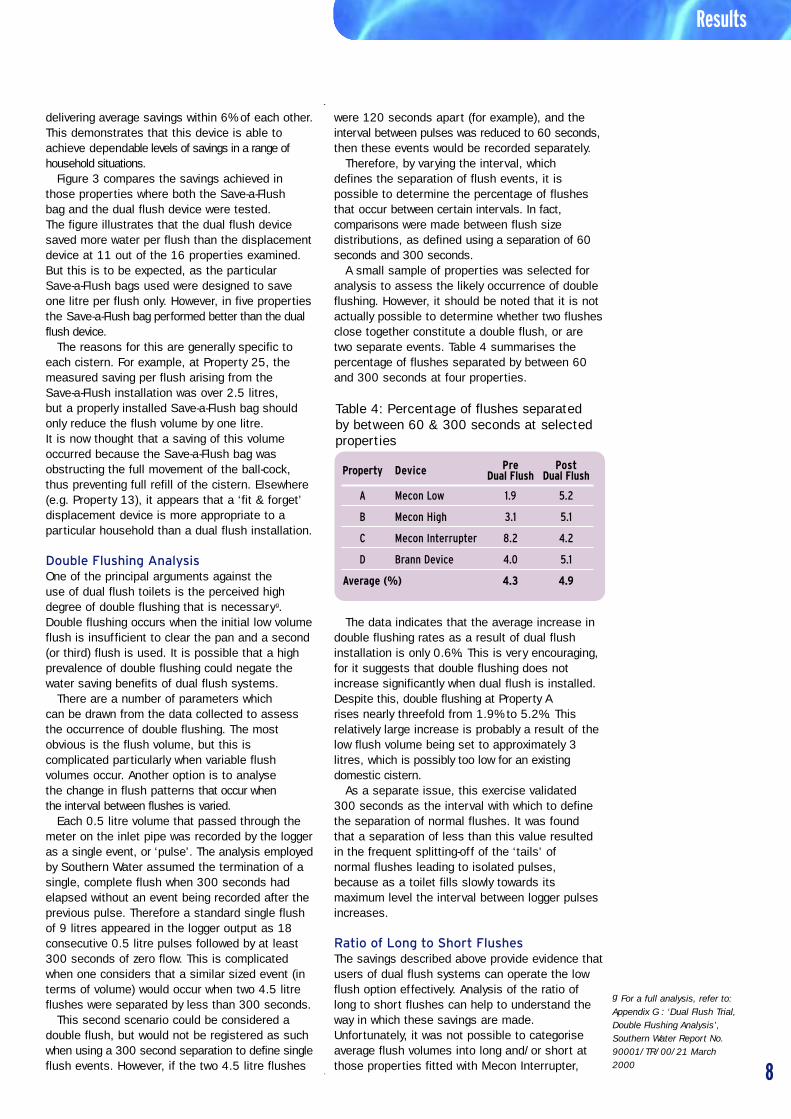
A small sample of properties was selected foranalysis to assess the likely occurrence of doubleflushing. However, it should be noted that it is notactually possible to determine whether two flushesclose together constitute a double flush, or aretwo separate events. Table 4 summarises thepercentage of flushes separated by between 60and 300 seconds at four properties.
The data indicates that the average increase indouble flushing rates as a result of dual flushinstallation is only 0.6%. This is very encouraging,for it suggests that double flushing does notincrease significantly when dual flush is installed.Despite this, double flushing at Property A rises nearly threefold from 1.9% to 5.2%. Thisrelatively large increase is probably a result of thelow flush volume being set to approximately 3litres, which is possibly too low for an existingdomestic cistern.
As a separate issue, this exercise validated 300 seconds as the interval with which to definethe separation of normal flushes. It was foundthat a separation of less than this value resultedin the frequent splitting-off of the ‘tails’ of normal flushes leading to isolated pulses,because as a toilet fills slowly towards itsmaximum level the interval between logger pulsesincreases.
Ratio of Long to Short FlushesThe savings described above provide evidence thatusers of dual flush systems can operate the lowflush option effectively. Analysis of the ratio oflong to short flushes can help to understand theway in which these savings are made.Unfortunately, it was not possible to categoriseaverage flush volumes into long and/or short atthose properties fitted with Mecon Interrupter,
g For a full analysis, refer to:Appendix G : ‘Dual Flush Trial,Double Flushing Analysis’,Southern Water Report No.90001/TR/00/21 March2000
Property Device Pre PostDual Flush Dual Flush
A Mecon Low 1.9 5.2
B Mecon High 3.1 5.1
C Mecon Interrupter 8.2 4.2
D Brann Device 4.0 5.1
Average (%) 4.3 4.9
Table 4: Percentage of flushes separated by between 60 & 300 seconds at selectedproperties
Brann and Ecoflush units because of the range of volumes being measured.
However, Figure 4 illustrates the proportion oftotal flushes at six selected properties that couldbe defined as either long or short. There is a highdegree of variability in the ratio of long to shortflushes, but in these six properties, short flushesconstitute at least 42% of all events. Amongst allthe properties in this study, number 20 recordedthe highest overall saving per flush at 50%, with96% of all flushes defined as short. This shouldbe compared with the property (number 33), havingthe next highest proportion of low flushes, whichhad a saving of 38% overall.
Bounce-backOne of the problems of undertaking a study of thisnature is the effect the experiment itself has uponthe participants. For example, it would be normalto expect the triallists to make extra efforts to usethe devices correctly, or even to an extreme, at theoutset of the project and this could have resultedin over-estimates of the long term savings thatcould be achieved. Indeed, the principal reason formonitoring over six months was the hope that anyinitial effects of the installation would wear off, andthat some bounce-back in the level of savingsinitially observed would be measurable.
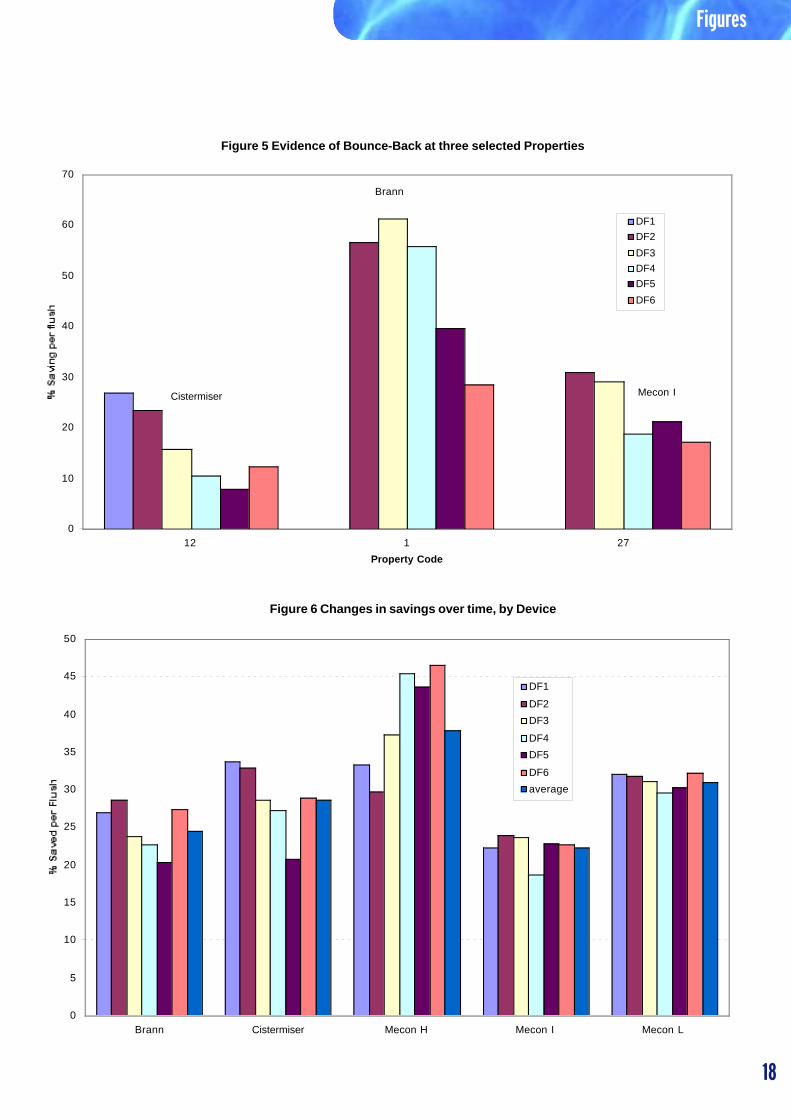
Figure 5 illustrates examples of bounce-back atthree properties. The initial savings observed ateach of these locations diminishes over each ofthe dual flush periods, each of approximately onemonth in duration. However, it is encouraging thatthese three installations are the only ones thatclearly demonstrate any significant bounce-back.When the changes in savings are viewed over time,as grouped by device, there is only limited evidenceof bounce-back, as illustrated in Figure 6.
Savings made by the Brann and Cistermiser devicesdo diminish over time, although the average savingmade by the Brann device over the whole period iswithin 10% of the savings made within one monthof installation. Of all devices, Cistermiser appearsto suffer most from bounce-back, with average savingsfalling from 34% to 21% in five months, beforerecovering to 29% in the final month of the study.
The average savings resulting from the Meconinterrupter and low flush default devices remainconsistent throughout the monitoring period,however savings from the Mecon high defaultdevice actually increase over time, rising from 33%to 47% over the study period. This may be aneffect of the low sample of properties using thisdevice, or could reflect a learning process ascustomers adapt to the function of a new system.
It is concluded that bounce-back is present insome individual properties, but it is less apparentwhen all the results are analysed together, andtherefore it can be considered a relatively minorphenomenon, over the duration of this trial.Whether higher rates of bounce-back would occurover longer periods is less certain.
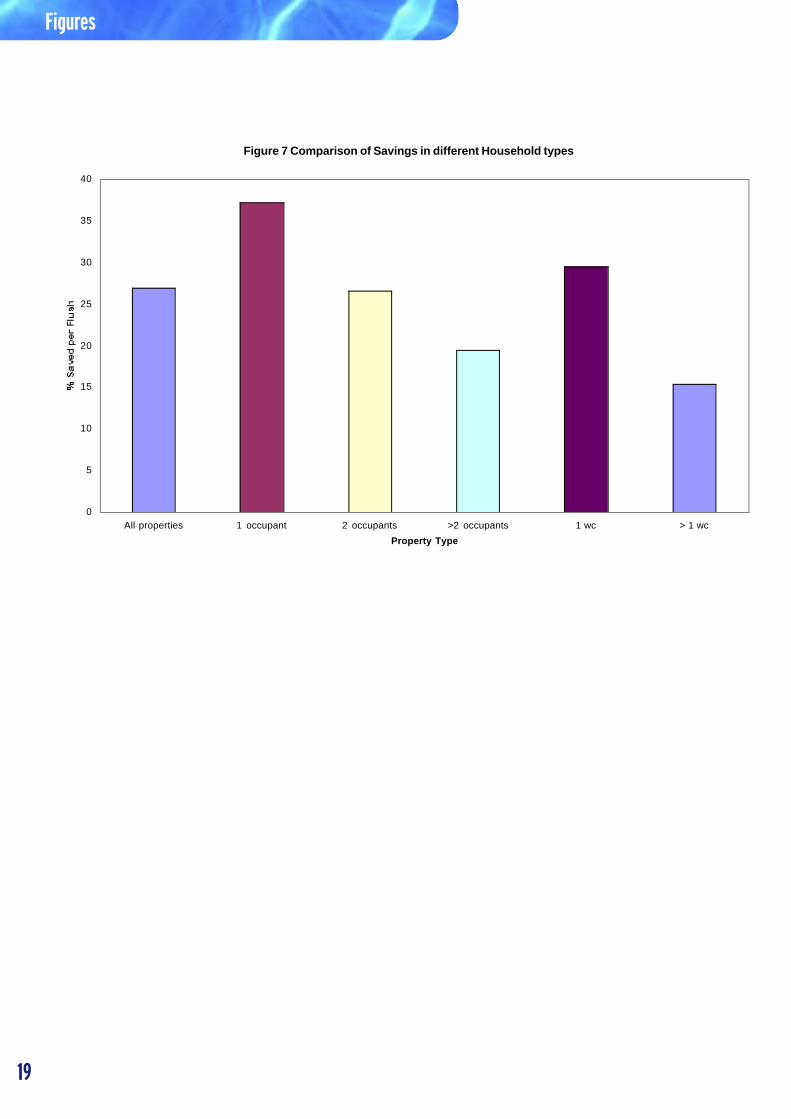
Effect of Property and Household TypeThe study aimed to recruit a number ofhouseholds of differing types and sizes to assessthe effect of dual flush in different environments.Two key variables have been used to examine theeffect of household type and size: (1) number ofoccupants and (2) number of toilets in each household.Figure 7 compares the average savings achievedoverall (in all properties) with the savings made in:
• Single occupancy properties,
• Properties with two occupants,
• Properties with more than two occupants,
• Properties with one toilet,
• Properties with more than one toilet.The data suggests there is an inverse relationship
between occupancy rate and savings resulting fromdual flush installation. Single occupancy propertiessaved an average of 37% as a result of dual flushinstallation, whilst households with two occupantssaved 27% and multiple occupancy residencessaved 20%.
This is intuitively correct, as one would expectsavings to diminish as more people had to adaptto the operation of a new system. Indeed, thisresult suggests that perhaps it would have beenbetter to provide operating instructions to allresidents, rather than just those individualspresent when the installation was carried out.
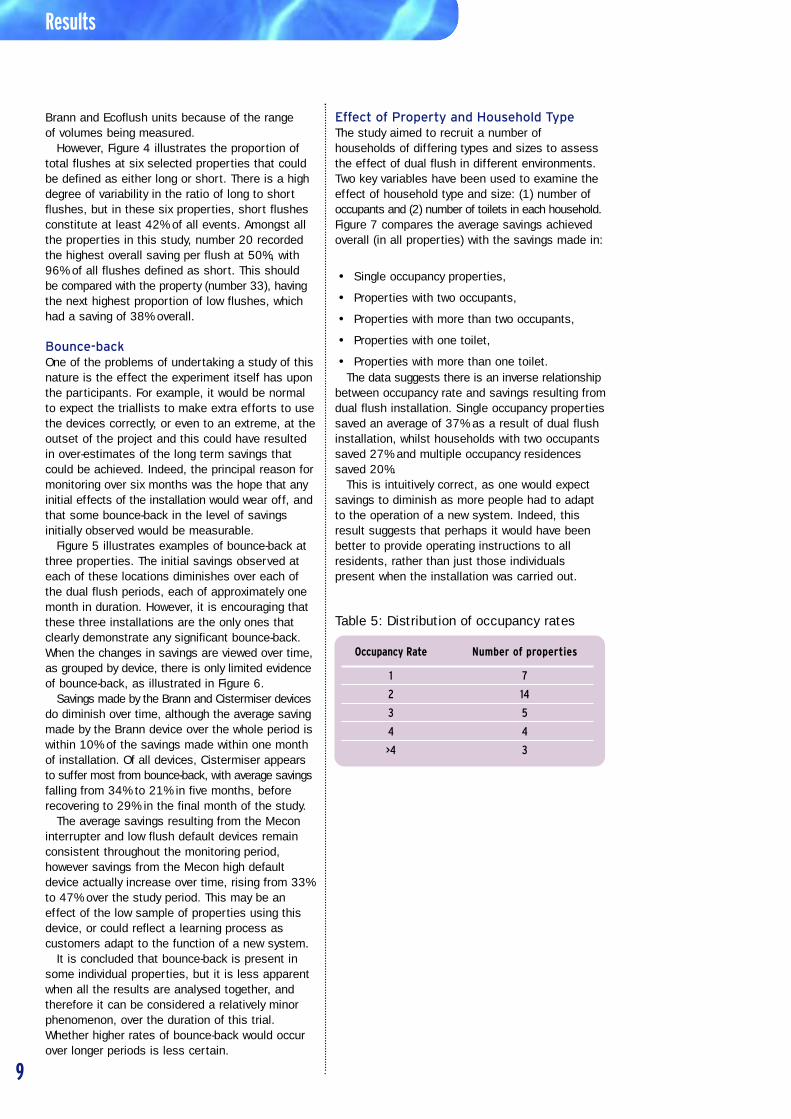
Table 5: Distribution of occupancy rates
9
Results
Occupancy Rate Number of properties
1 7
2 14
3 5
4 4
>4 3
10
It should be noted that the sample population in this study is slightly biased towards retiredcouples and individuals. This is partly a result of the two areas selected for the study havingrelatively large proportions of elderly residents,but also because there is perhaps a tendency for trials such as this to attract volunteers fromthese particular population groups. Table 5summarises the distribution of occupancy ratesamongst the participants.
Most of the residents in the single and twoperson occupancy households could be considered as retired or elderly. In fact 21 out of the 33 properties (63% of the sample) are in this category. The remaining householdsin the study could generally be considered as
family households with one or more children of varying ages from toddlers to teenagers.
The second analysis undertaken to determinethe effect of property type upon dual flush savings reviewed the effect of having more than one toilet in the house, when only one of the appliances had been fitted with dual flush. In the sample population there were seven properties with more than one toilet and Figure 7 illustrates that the savings at these locations were almost half the savings made at properties with only one WC.
The dual flush installation was undertaken in the most convenient of the toilets in eachproperty, and there was no pattern to theselection of the one to be converted. As a result, some of the retrofitted WCs were inthe main bathroom for example, whilst others werein a downstairs cloakroom or an en-suitebathroom. Because of this, usage rates werevariable, but the savings quoted are per flush, andtherefore any reduced usage of a second toiletwould not have an impact on potential savings. It is suggested that the principal reason forreduced savings in properties with multiple WC’s is the difficulty in adapting to the dual flush system, when at least one other toilet in the property is operated with a normal single flush.
The above analyses have considered the effects of household size and number of toilets as separate issues, but the two are likely to be closely linked. It may be summarisedtherefore, that savings resulting from dual flushinstallation are likely to be greatest in smallerproperties with one or two occupants, and be reduced in larger properties where a family may be resident and where only one of thetoilets has been converted to dual flush.
Increased savings should be possible in largerhouses with one or more toilets, if all appliancesare fitted with dual flush, for example in newlybuilt properties.
Customer and Plumber FeedbackThe savings that dual flush systems can achieve
are closely linked to the user friendliness of eachdevice and the ease with which consumers are able to adapt to its operation. Similarly, the ease of installation is an important factor in considering the cost-effectiveness of dual flush as a demand management measure. This sectionreviews the feedback received from the trialparticipants and the plumbers who undertook theinstallations. The findings presented here can beconsidered to be as equally important as thequantitative data presented previously.
Pro-forma questionnaires and data sheets were used to note participants comments on the operation of their dual flush system. Table 6 contains examples of comments made over the course of the trial. These comments are not exhaustive and could be considered as ‘exception reports’ where the customers had specific comments. The questionnaires were also used to collectstandard information on the cistern size andoccupancy rates from participants in the trial.
Generally, the Brann system was the mostsuccessful in terms of user friendliness, perhaps because most people were happy to leave the flush size set to medium. This mayexplain the relatively low savings achieved by the device, compared to others, and may indicatethat further operating guidance is necessary. The plumbers felt the Brann device wascomparatively easy to install and the device isconsidered to be relatively robust. The EcoFlushdevice was similar in installation, appearance and operation to the Brann device, but benefited from a more professional finish.
Despite its relatively high savings, theCistermiser device came in for the most criticism.Several people commented that the device wasoften triggered inadvertently when cleaning aroundthe toilet or even getting in and out of the shower,and that the closure of the flap valve led to loudnoises in their plumbing systems. Participantswere also uncomfortable with the need to replacethe batteries in the system, and would rather thesystem could be fitted and forgotten. Thecomplexity of the Cistermiser device, and the needto remove the siphon from the cistern also meantthe system took the longest to install of all thedevices. It is possible the complex nature of thedevice may affect its robustness and longevity.
The Mecon devices received variable responses.It was commonly felt that the fabrication of thehigh/low default flush devices was not sufficientlysturdy, and the devices often did not give apositive response when operated. Somecomments, as summarised in Table 6, referto snagging or kinking of the string component
and the durability of the device is thereforequestionable. The plumbers felt the system was awkward to install and were not confident that the various components would remain asinstalled. They recommended the use of standard fittings to connect the hose into the
Results
head of the siphon, as used in the Brann and EcoFlush systems.
The Mecon interrupter was considered, by the plumbers, to be one of the neatest systemson trial, although there was concern about howwidely it could be installed, given the requirementfor two holes in the cistern wall. A number ofparticipants commented that they often forgot to press the button, and it is felt that theperformance of this device is particularlydependent upon the commitment of the user.Despite this, the device appeared to be relatively robust.
Table 7 summarises the qualitative assessmentof the devices on trial. It indicates that the Brannsystem comes top in all categories, tying with theMecon Interrupter device for robustness/durabilityand aesthetic appearance. The Mecon High/Lowdefault devices score poorly, as does theCistermiser system.
By way of comparison, only two of the 16customers who had Save-a-Flush bags installedwere unhappy with their operation, due in bothcases to perceived inadequate flush volumes.
DISCUSSION
Interpretation of resultsThe results presented in the previous section areencouraging for they suggest, albeit based on a
small number of properties, that the installation ofretrofit dual flush devices could reduce the volumeof water used for toilet flushing by approximately27% on average. Toilet flushing accounts foraround 30% of the water used in the home, hencethe blanket installation of retrofit dual flushdevices could reduce domestic consumption byapproximately 8%, equivalent to a saving of some670 Ml/d across England and Wales. This is lessthan that estimated by the former NRA but,nevertheless, represents a significant saving.
For comparison, Save-a-Flush bags could reducedomestic consumption by some 2.4%, which isequivalent to around 200 Ml/d nationwide.
11
Results • Discussion
Property Code Type Comments
1 Brann Low setting adequate
2 Brann No problems. Saved consumption.
3 Brann Very good idea
5 Brann Leave on medium flush - never use full flush.
6 Brann Occasionally had to double flush with Save-a-flush. Brann is excellent system
7 Brann Usually leave on Medium flush Young children double flush on low flush.
8 Brann Save-a-flush made flush too short. Leave on medium flush
9 Brann Children tend to double flush
14 Cistermiser Usually use low flush, however low flush leaves a residue in bowl
15 Cistermiser Very loud noise as valve opens and closes, I don't like it. Save-a-flush was better.
16 Cistermiser Flush was too small with Save–a–flush bag. Sometimes cistermiser
flushes spontaneously.
17 Cistermiser Always need to use full flush to get rid of paper.
20 Mecon H Occasionally the tab gets trapped
22 Mecon H String keeps kinking and snagging on cistern.
24 Mecon I Sometimes double flush but generally a good idea
25 Mecon I Automatic device would be better.
27 Mecon I Forget to press the button. Save-a-flush was better.
28 Mecon I Forget to press the button because can't see it.
30 Mecon H Low flush doesn't appear to be working
31 Mecon L Short flush is adequate
32 Mecon L Have to use more bleach - low flush should be longer. Occasionally double flush
33 Mecon L Rarely use maximum flush.
Table 6: Examples of customer comments
Category Best Device Worst Device
Ease of installation Brann Mecon H/L
User friendliness Brann Mecon H/L/Cistermiser
Robustness & durability Brann/Mecon Int. Mecon H/L
Aesthetic appearance Brann/Mecon Int. Cistermiser/Mecon H/L
Universality Brann Mecon Int./Cistermiser
Table 7: Summary of qualitative assessment of dual flush devices(based on triallists and plumbers reports)
Cost ImplicationsThe total cost of each operational device is the sum of the unit cost of the system itselfplus the cost of installation. The approximate cost of the Brann and Mecon kit is £10 per unit.Following discussion with the plumbers contractedto undertake the fitting of the systems in this trial, the cost of installing these kits, based upon 1000 units, is estimated to be around £10 per unit, giving a total cost for eachoperational device of approximately £20.
Assuming the flushing frequency recorded in this trial (approximately 5 flushes per person per day), a saving of 2.6 litres per flush, a typical occupancy ratio of 2.5 persons per property, and typical water and wastewatercharges of 150 p/m3, then the purchase and installation costs of a device in measuredhouseholds could be recovered in a little over one year.From a water company perspective, a 1Ml/d saving, based on the above assumptions, would require the installation of over 30,000 devices, costing in excess of £0.6M.
In contrast, the Save-a-Flush bags save one litre per flush or some 13 litres per property per day based on the above assumptions.Consequently, a 1Ml/d saving would require the installation of some 80,000 bags. However the Save-a-Flush bag is distributed via mail shot, which has typically resulted in a 30% take-up, therefore over a quarter of a million deliveries would be required. Since
the unit cost of buying and posting each bag is 80p, the total cost of the 1Ml/d saving would be of the order of £0.2M.
Consequently, the cost of installing dual flush systems to save 1 Ml/d of water is almost three times greater than the cost of saving the same volume through Save-a-Flush installation
In order for the ‘twin track’ approach towards water resources to be effective, water efficiency strategies such as dual flushretrofit need to be considered in the same context as other water resource schemes. Such schemes typically cost between £0.75M and £1.5M per megalitre, hence dual flushinstallation bears comparison with these moretraditional schemes, when reviewed objectively.
CONCLUSIONS & RECOMMENDATIONS
ConclusionsThe study has successfully demonstrated that genuine savings can be made through the installation of certain displacement devices and retrofit dual flush systems in real life domestic situations. That is not to say that savings were achieved at every single property
but that, on average reductions in flush volumes were observed.
Savings varied from device to device, and it appears that users do require well designed,device specific instructions in order to optimisesavings. This was evident with the Brann system, where many users simply left the flush size on the medium setting. However, appropriateoperating instructions could maximise savings in large households, where reductions in flushvolume are depressed.
The results from this study suggests that double flushing does not necessarily increase as a result of dual flush installation. Thisfinding, together with the overall results, contradict the long held belief that dual flushtoilets do not save water because of double flushing.
The costs per megalitre of Save-a-Flush and dual flush installation are favourable when compared to standard estimates of newresources, although total savings may be relatively modest. Save-a-Flush is about 60-70%cheaper than dual flush, however potential savings are also much lower.
This investigation has taken much effort and commitment from all of the project team at Southern Water and the Environment Agency,but has only been possible with the co-operationof the customers who took part in the trial.
RecommendationsThe preferred device in this study was the Brann unit, but the data and comments supplied by users suggests there was a tendency to leave the dial on the medium setting. It is recommended that the device be further tested with only two settings available.
This study has been based upon a relatively small number of properties that do not necessarily represent the wide demographic or socio-economic characteristics at the company level or indeed, national level.Further, it is possible that the recruitment method may have resulted in a sample population with particular motives or predisposition to save water.
As a result, it is recommended that furtherstudies should be carried out using a morestatistically representative sample of properties. It is likely that this will require a significantly larger sample size, but may only be possible as a collaborative project between a number of parties.
The study has demonstrated that the perceived double flushing problem associated with dual flush systems is not significantlydifferent from that associated with single flush systems. The findings presented here may therefore help to promote changes in the Water Supply (Water Fittings) regulations1999, which remain a barrier to the widerintroduction of retrofit dual flush cisterns.
Discussion • Conclusions & Recommendations
12h Water & Sewage Bills, 1999-2000, OFWAT
13
Plates Plates
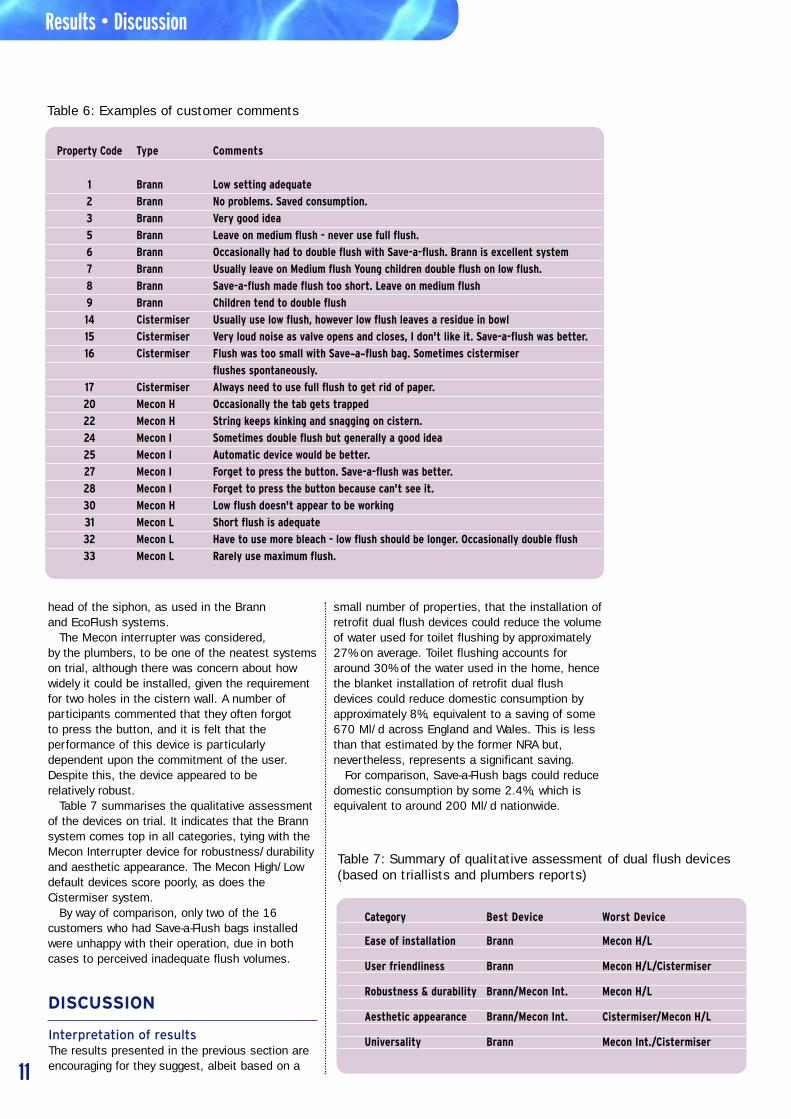
Plate 1: The Mecon high/low default Flush DeviceThe photograph illustrates the device as seen by the user, with pull-tag which is operated to attenuatethe flush. A label provides instructions.
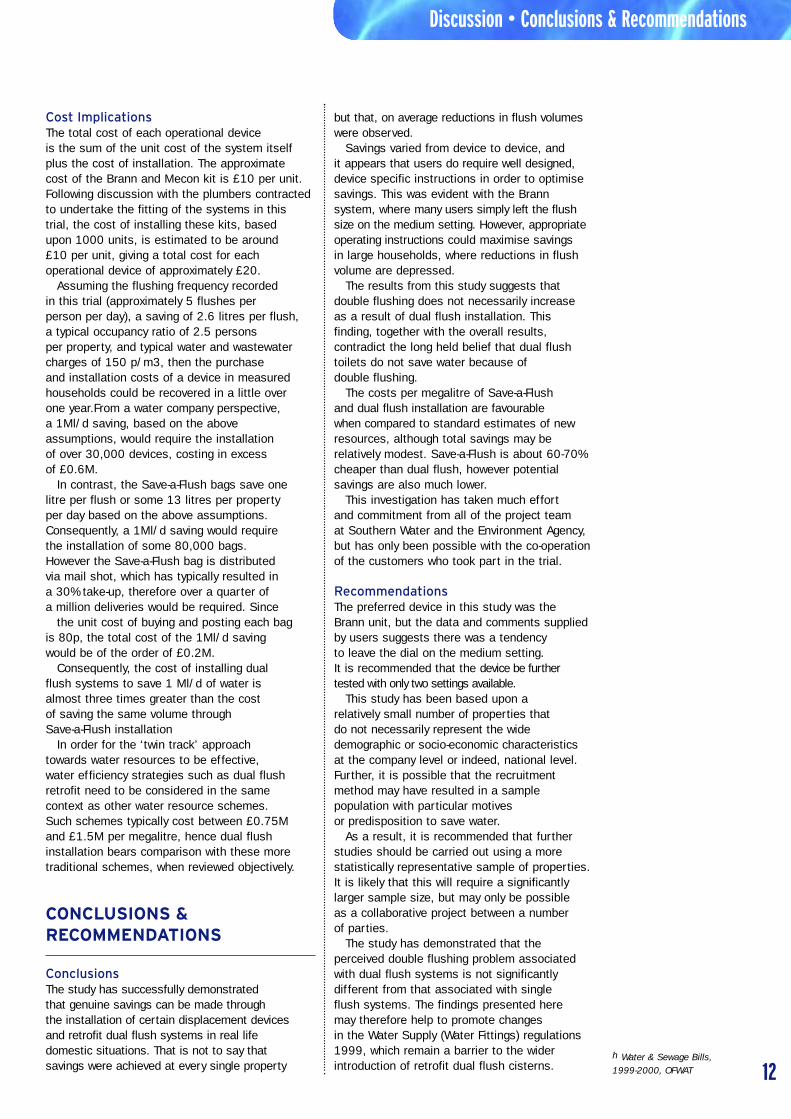
Plate 2: The Mecon Interrupter DeviceThe device is operated by the green button on the left of the cistern wall. This introduces air into thesiphon, arresting the flush when pressed. The logger is just visible underneath the bottom of the cistern
Plates
14
Plates
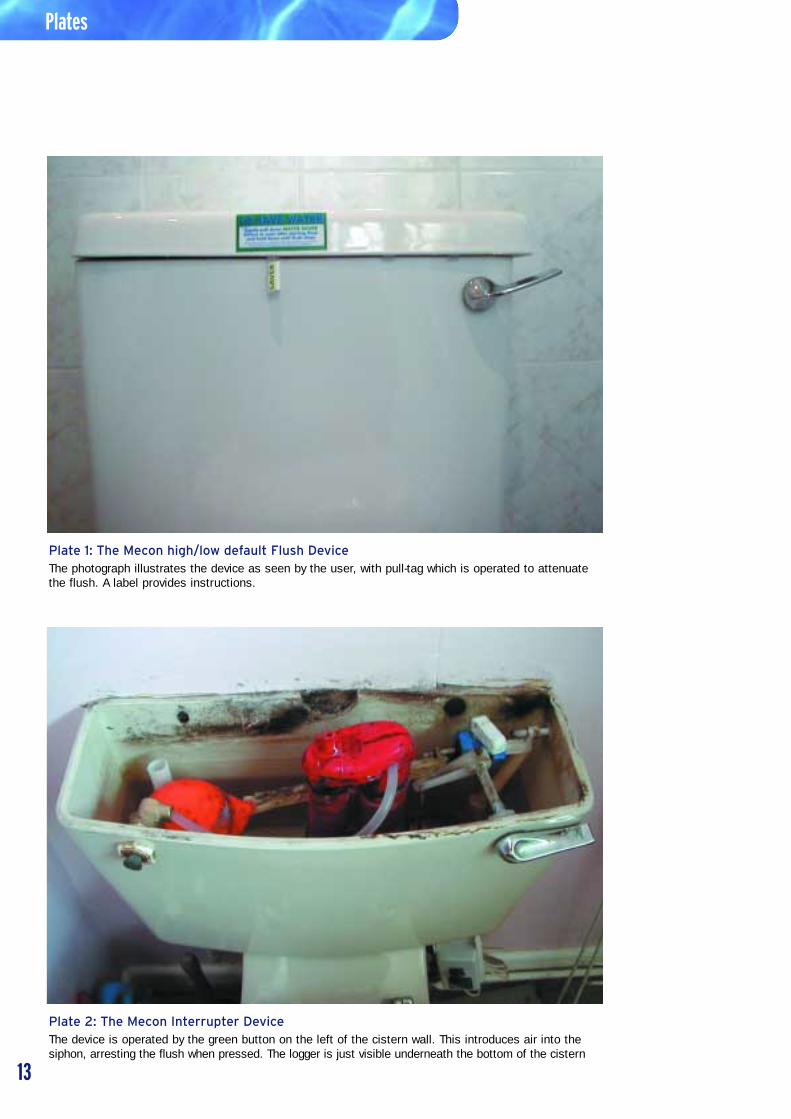
Plate 3: The Peter Brann DeviceThe dial selector around the toilet handle determines the size of the flush, based upon the length of thethree tubes which extend below the device (not visible). The siphon is broken when the water level inthe cistern falls below the bottom of the tube selected.
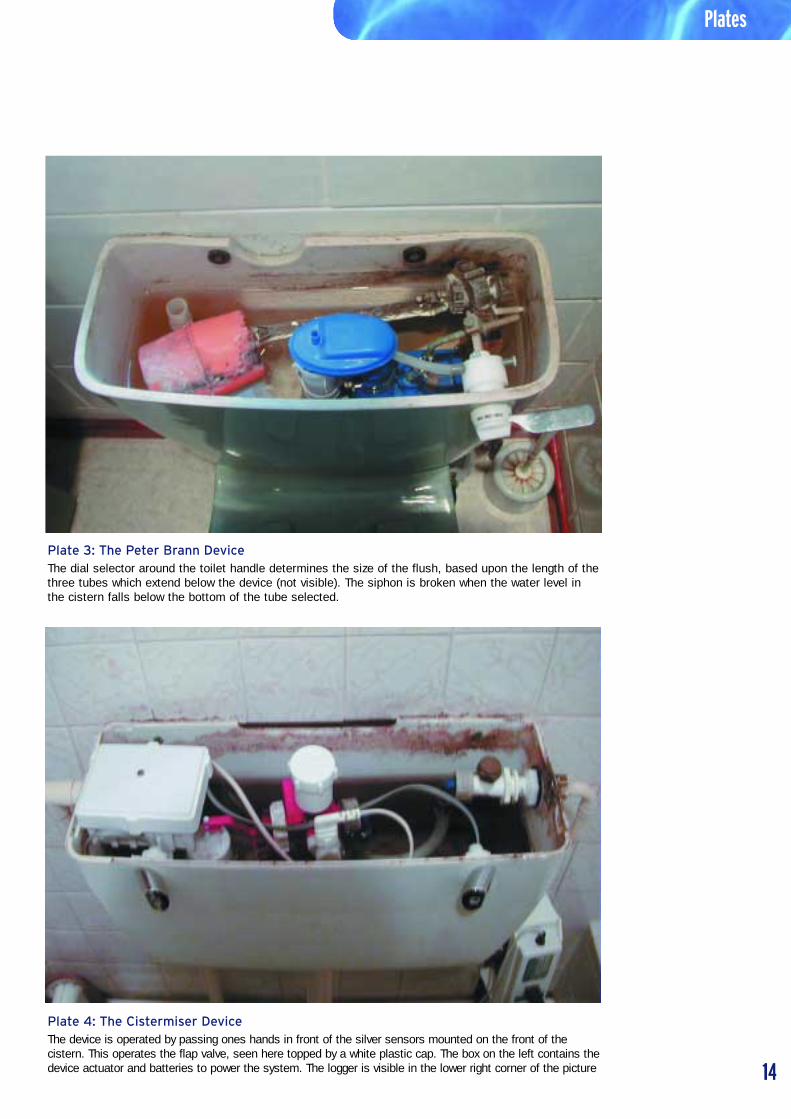
Plate 4: The Cistermiser DeviceThe device is operated by passing ones hands in front of the silver sensors mounted on the front of thecistern. This operates the flap valve, seen here topped by a white plastic cap. The box on the left contains thedevice actuator and batteries to power the system. The logger is visible in the lower right corner of the picture
15
Plates Plates
Plate 5: The EcoFlush DeviceThe dial device is operated in a similar way to the Brann system. The meter on the inlet pipe is clearly visible.
Figures
16
Figures
Figure 1 Average Percentage Water Saved per Flush by Device
0
5
10
15
20
25
30
35
40
45
Save a flush Brann Cistermiser EcoFlush Mecon H Mecon I Mecon L
% S
av
ed
Pe
r F
lus
h
Figure 2 Percentage Savings at each Property
-40
-20
0
20
40
60
80
9 5 7 8 3 6 4 1 2 13 16 12 11 14 17 10 15 18 24 25 28 27 23 26 22 21 20 30 29 31 32 33
Property Code
Ave
rag
e %
Sav
ing
s p
er F
lush
Brann Cistermiser
EcoFlush
Mecon I
Mecon H
Mecon L
Figures Figures
Figure 3 Comparison of savings resulting from Save-a-Flush and Dual Flush installations
-40
-30
-20
-10
0
10
20
30
40
50
60
1 2 4 5 7 9 11 13 14 20 22 23 25 27 29 30
Property Code
Pe
rce
nta
ge
Sa
vin
g
Save-a-Flush
Dual Flush
Figure 4: Ratio of Long to Short Flushes at Selected Properties
53.845.9
42
61.7
96.1
48.6
12
39.5
19.1
11.543
34.2
14.6
38.9
26.8
8.41.6
2.3
0%
20%
40%
60%
80%
100%
29 30 32 33 20 21
Property Reference
% o
f al
l F
lush
es
% other volumes
% long flush
% short flush
% o
f a
ll F
lush
es
17
FiguresFigures
Figure 5 Evidence of Bounce-Back at three selected Properties
0
10
20
30
40
50
60
70
12 1 27
Property Code
% S
avin
g p
er f
lush
DF1
DF2
DF3
DF4
DF5
DF6
Cistermiser
Brann
Mecon I
Figure 6 Changes in savings over time, by Device
0
5
10
15
20
25
30
35
40
45
50
Brann Cistermiser Mecon H Mecon I Mecon L
% S
aved
per
Flu
sh
DF1
DF2
DF3
DF4
DF5
DF6
average
18
19
Figures Figures
Figure 7 Comparison of Savings in different Household types
0
5
10
15
20
25
30
35
40
All properties 1 occupant 2 occupants >2 occupants 1 wc > 1 wc
Property Type
% S
av
ed
pe
r F
lus
h
Appendix A: Project Method Statement
20
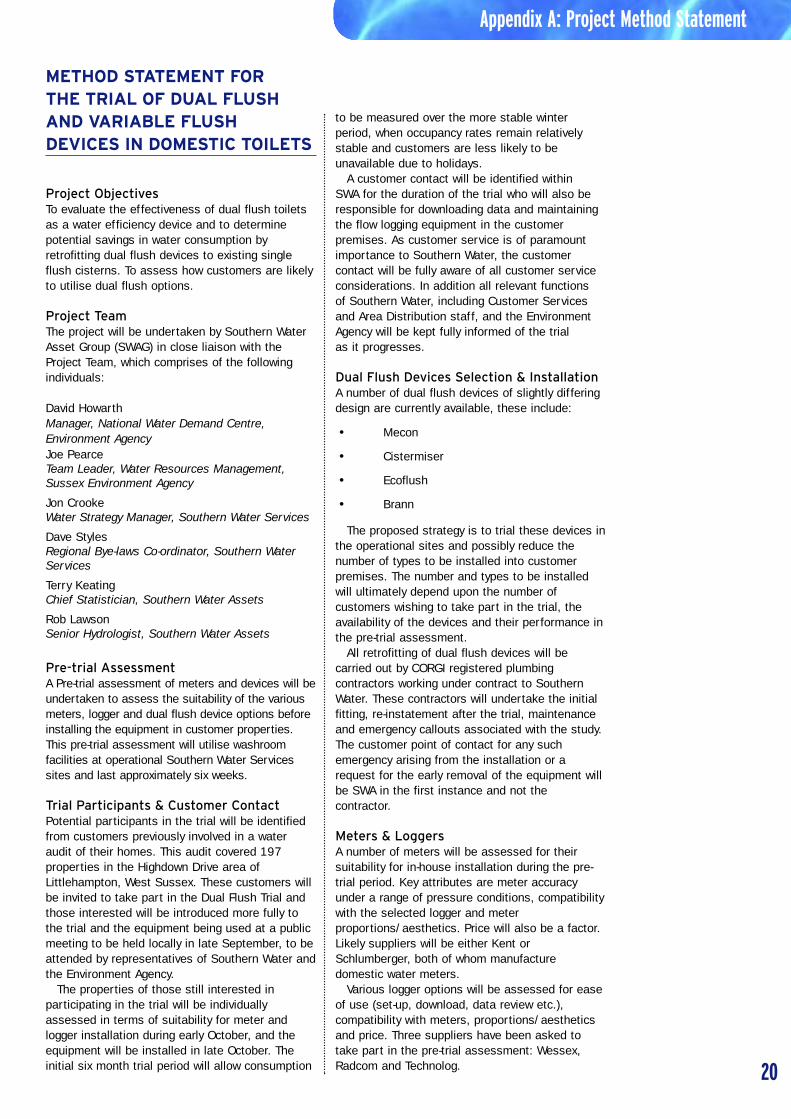
METHOD STATEMENT FOR THE TRIAL OF DUAL FLUSHAND VARIABLE FLUSHDEVICES IN DOMESTIC TOILETS
Project ObjectivesTo evaluate the effectiveness of dual flush toiletsas a water efficiency device and to determinepotential savings in water consumption byretrofitting dual flush devices to existing singleflush cisterns. To assess how customers are likelyto utilise dual flush options.
Project TeamThe project will be undertaken by Southern WaterAsset Group (SWAG) in close liaison with theProject Team, which comprises of the followingindividuals:
David HowarthManager, National Water Demand Centre,Environment AgencyJoe PearceTeam Leader, Water Resources Management,Sussex Environment Agency
Jon CrookeWater Strategy Manager, Southern Water Services
Dave StylesRegional Bye-laws Co-ordinator, Southern WaterServices
Terry KeatingChief Statistician, Southern Water Assets
Rob LawsonSenior Hydrologist, Southern Water Assets
Pre-trial AssessmentA Pre-trial assessment of meters and devices will beundertaken to assess the suitability of the variousmeters, logger and dual flush device options beforeinstalling the equipment in customer properties.This pre-trial assessment will utilise washroomfacilities at operational Southern Water Servicessites and last approximately six weeks.
Trial Participants & Customer ContactPotential participants in the trial will be identifiedfrom customers previously involved in a wateraudit of their homes. This audit covered 197properties in the Highdown Drive area ofLittlehampton, West Sussex. These customers willbe invited to take part in the Dual Flush Trial andthose interested will be introduced more fully tothe trial and the equipment being used at a publicmeeting to be held locally in late September, to beattended by representatives of Southern Water andthe Environment Agency.
The properties of those still interested inparticipating in the trial will be individuallyassessed in terms of suitability for meter andlogger installation during early October, and theequipment will be installed in late October. Theinitial six month trial period will allow consumption
to be measured over the more stable winterperiod, when occupancy rates remain relativelystable and customers are less likely to beunavailable due to holidays.
A customer contact will be identified within SWA for the duration of the trial who will also beresponsible for downloading data and maintainingthe flow logging equipment in the customerpremises. As customer service is of paramountimportance to Southern Water, the customercontact will be fully aware of all customer serviceconsiderations. In addition all relevant functions of Southern Water, including Customer Servicesand Area Distribution staff, and the EnvironmentAgency will be kept fully informed of the trial as it progresses.
Dual Flush Devices Selection & InstallationA number of dual flush devices of slightly differingdesign are currently available, these include:
• Mecon
• Cistermiser
• Ecoflush
• Brann
The proposed strategy is to trial these devices inthe operational sites and possibly reduce thenumber of types to be installed into customerpremises. The number and types to be installedwill ultimately depend upon the number ofcustomers wishing to take part in the trial, theavailability of the devices and their performance inthe pre-trial assessment.
All retrofitting of dual flush devices will becarried out by CORGI registered plumbingcontractors working under contract to SouthernWater. These contractors will undertake the initialfitting, re-instatement after the trial, maintenanceand emergency callouts associated with the study.The customer point of contact for any suchemergency arising from the installation or arequest for the early removal of the equipment willbe SWA in the first instance and not thecontractor.
Meters & LoggersA number of meters will be assessed for theirsuitability for in-house installation during the pre-trial period. Key attributes are meter accuracyunder a range of pressure conditions, compatibilitywith the selected logger and meterproportions/aesthetics. Price will also be a factor.Likely suppliers will be either Kent orSchlumberger, both of whom manufacturedomestic water meters.
Various logger options will be assessed for easeof use (set-up, download, data review etc.),compatibility with meters, proportions/aestheticsand price. Three suppliers have been asked totake part in the pre-trial assessment: Wessex,Radcom and Technolog.
Appendix A: Project Method Statement
21
Appendix A • Appendix B
ByelawsIt will be necessary to relax the byelaws relating tothe use of dual flush appliances in order to installthe equipment in customer premises during the trial.An application for this will be made to the DETR.
Post Trial AuditsAt the end of the trial, which will last for aminimum of six months, the equipment will beremoved and each site returned to its originalcondition, unless the customer wishes to retainthe equipment (with the full understanding thatfrom then on its is their responsibility). It is alsoproposed to carry out a customer survey to obtaintheir views on the reliability, practicalities and
ease of use of the equipment. This survey will becarried out by SWA staff
ReportingThe data collected from each house will beanalysed by SWA and assessments made of thevolume of water used in flushing. The savingsmade through the installation and use of each dualflush device will be estimated. Comparisons will bedrawn between the various devices being trialled.
The results will be presented in a report to theProject Team.
August, 1998
Appendix A: Project Method Statement
APPENDIX B: RELAXATION OF BYELAWS
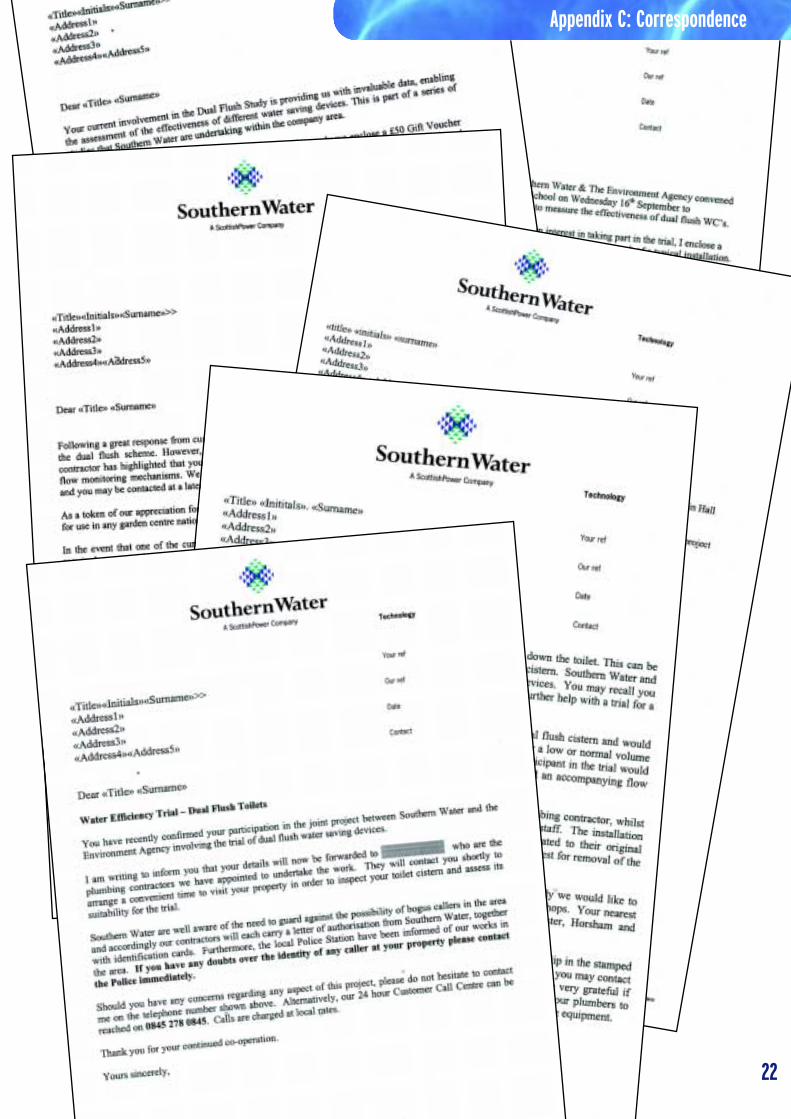
Appendix C: Correspondence
22
23
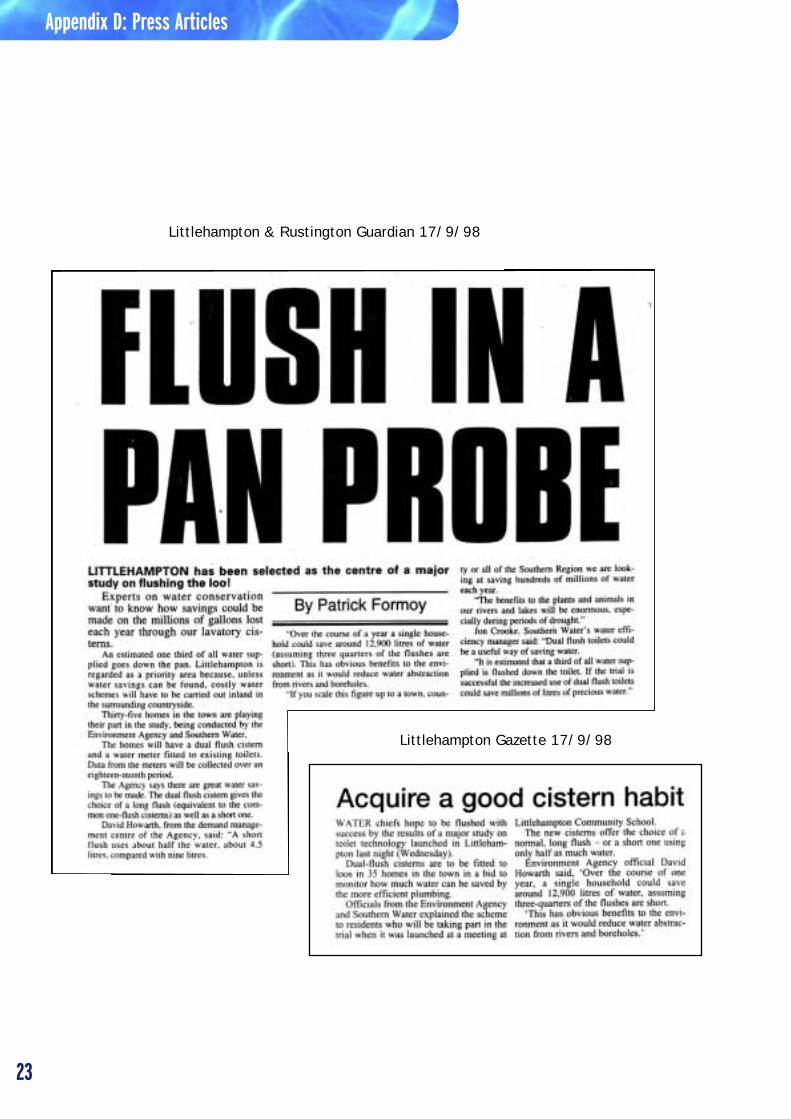
Appendix D: Press Articles Appendix D: Press Articles
Littlehampton & Rustington Guardian 17/9/98
Littlehampton Gazette 17/9/98
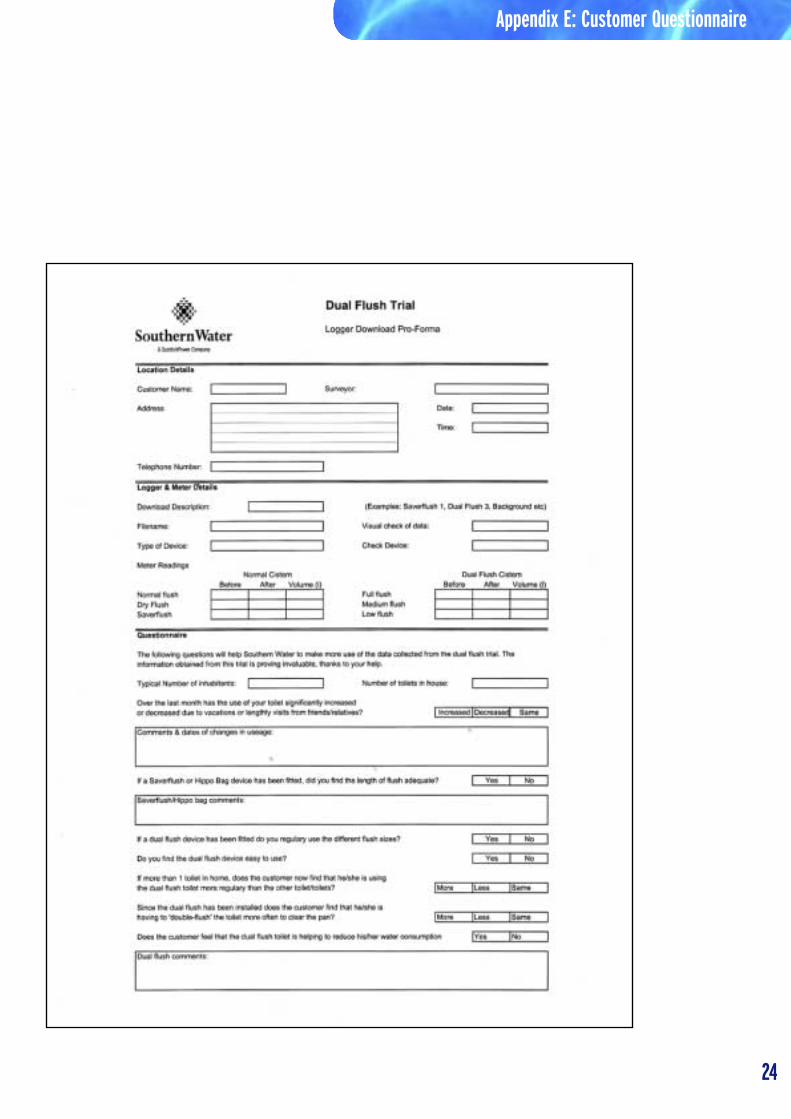
Appendix E: Customer Questionnaire
24
Appendix E: Customer Questionnaire
25
Appendix F: Results Tables
Property Average % Savings Min Max SAF
24 0.82 9.3 0.51 1.45
25 0.79 10.1 -0.43 2.29 32.78
28 0.94 12.1 0.48 1.16
27 2.86 24.0 2.04 3.7 6.62
23 2.35 29.6 2.01 2.82 16.65
26 4.30 39.5 3.71 5.03
Average 23.1
Mecon Interrupter
Appendix F: Results Tables
Property Average % Savings Min Max SAF
9 -2.41 -27.5 -2.9 -1.66 15.98
5 0.15 1.3 -0.34 1.34 3.42
7 0.77 7.9 0.03 1.99 14.56
8 2.90 29.2 2.4 3.35
3 2.79 30.4 2.47 3.31
6 3.33 37.4 1.82 4.23
4 4.01 42.6 3.58 4.49 9.89
1 3.26 46.6 2 4.29 12.29
2 6.61 49.3 6.24 6.92 11.27
Average 30.6
Average savings (litres per flush) per property
Brann
Property Average % Savings Min Max SAF
13 -0.07 -1.0 -0.36 0.12 4.93
16 1.00 13.4 0.51 1.45
12 1.63 16.2 0.8 2.72
11 2.86 28.1 1.56 4.17 16.26
14 2.82 29.8 2.21 3.16 3.27
17 3.60 35.7 3.14 4.47
10 5.26 55.9 5.06 5.37
15 5.18 63.8 4.65 5.76 0.00
Average 34.7
Cistermiser
Property Average % Savings Min Max SAF
18 2.33 21.0 2.16 2.53
Average 21.0
EcoFlush
Appendix F: Results Tables
26
Appendix F: Results Tables
Property Average % Savings Min Max SAF
22 2.01 18.2 1.08 3.35 -9.63
21 3.59 37.5 2.82 4.28
20 5.36 49.6 5.16 5.52 12.87
Average 35.1
Mecon High Default
Property Average % Savings Min Max SAF
30 1.87 17.4 0.52 2.45 -0.09
29 2.40 32.0 2.04 2.77 28.70
31 2.53 32.5 2.19 3.56
32 3.62 35.5 2.89 4.2
33 4.86 37.7 4.36 5.31
Average 31.0
Mecon Low Default
Brann Cistermiser EcoFlush Mecon H Mecon I Mecon L Average
DF1 2.62 3.16 2.53 3.49 2.05 3.16 2.83
DF2 2.79 3.07 2.29 3.12 2.20 3.13 2.77
DF3 2.32 2.69 2.53 3.90 2.18 3.05 2.78
DF4 2.21 2.56 4.75 1.73 2.91 2.83
DF5 1.98 1.95 4.57 2.11 2.98 2.72
DF6 2.67 2.71 4.87 2.09 3.17 3.10
Average 2.43 2.69 2.45 4.11 2.06 3.07 2.84
Volumetric savings per flush (litres)
Brann Cistermiser EcoFlush Mecon H Mecon I Mecon L Average
DF1 26.93 33.78 26.80 33.34 22.30 32.13 29.22
DF2 28.67 32.86 24.26 29.81 23.91 31.87 28.56
DF3 23.85 28.72 37.33 23.75 31.09 28.95
DF4 22.70 27.33 45.43 18.78 29.65 28.78
DF5 20.34 20.81 43.66 22.90 30.34 27.61
DF6 27.39 28.98 46.53 22.68 32.27 31.57
Average 24.50 28.70 25.53 37.91 22.33 31.02 28.62
Savings per flush (%)
Savings per period per device
27
Appendix F: Results Tables
Average flush volume (litres) Savings per flush (litres)
BG SAF DF BG v DF SAF v DF BG v SAF
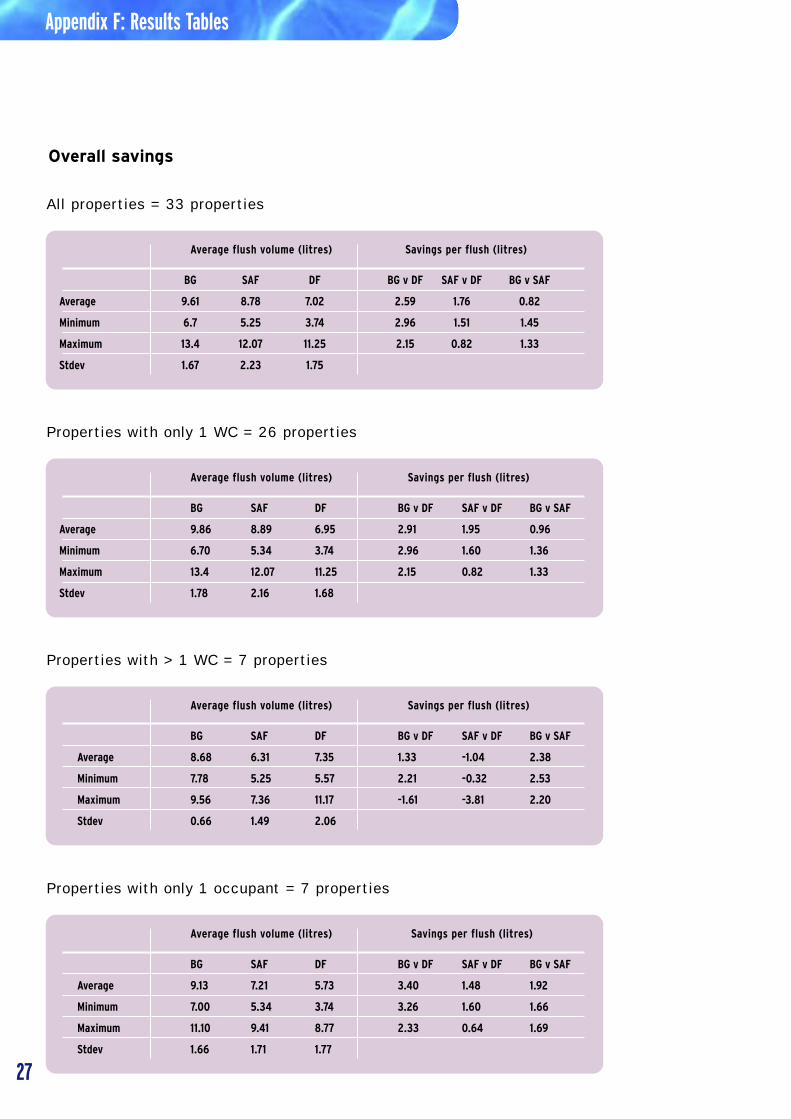
Average 9.86 8.89 6.95 2.91 1.95 0.96
Minimum 6.70 5.34 3.74 2.96 1.60 1.36
Maximum 13.4 12.07 11.25 2.15 0.82 1.33
Stdev 1.78 2.16 1.68
Average flush volume (litres) Savings per flush (litres)
BG SAF DF BG v DF SAF v DF BG v SAF
Average 9.61 8.78 7.02 2.59 1.76 0.82
Minimum 6.7 5.25 3.74 2.96 1.51 1.45
Maximum 13.4 12.07 11.25 2.15 0.82 1.33
Stdev 1.67 2.23 1.75
All properties = 33 properties
Properties with only 1 WC = 26 properties
Overall savings
Properties with > 1 WC = 7 properties
Properties with only 1 occupant = 7 properties
Average flush volume (litres) Savings per flush (litres)
BG SAF DF BG v DF SAF v DF BG v SAF
Average 8.68 6.31 7.35 1.33 -1.04 2.38
Minimum 7.78 5.25 5.57 2.21 -0.32 2.53
Maximum 9.56 7.36 11.17 -1.61 -3.81 2.20
Stdev 0.66 1.49 2.06
Average flush volume (litres) Savings per flush (litres)
BG SAF DF BG v DF SAF v DF BG v SAF
Average 9.13 7.21 5.73 3.40 1.48 1.92
Minimum 7.00 5.34 3.74 3.26 1.60 1.66
Maximum 11.10 9.41 8.77 2.33 0.64 1.69
Stdev 1.66 1.71 1.77
28
Appendix F: Results Tables
Average flush volume (litres) Savings per flush (litres)
BG SAF DF BG v DF SAF v DF BG v SAF
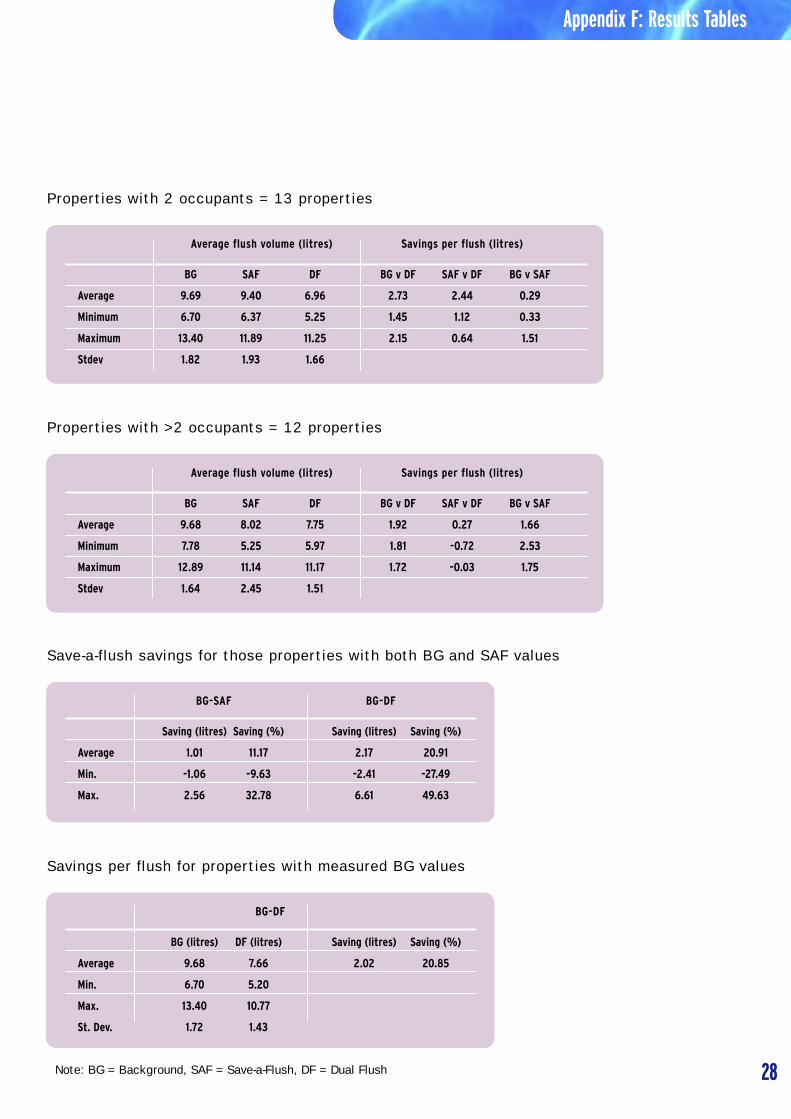
Average 9.69 9.40 6.96 2.73 2.44 0.29
Minimum 6.70 6.37 5.25 1.45 1.12 0.33
Maximum 13.40 11.89 11.25 2.15 0.64 1.51
Stdev 1.82 1.93 1.66
Properties with 2 occupants = 13 properties
Average flush volume (litres) Savings per flush (litres)
BG SAF DF BG v DF SAF v DF BG v SAF
Average 9.68 8.02 7.75 1.92 0.27 1.66
Minimum 7.78 5.25 5.97 1.81 -0.72 2.53
Maximum 12.89 11.14 11.17 1.72 -0.03 1.75
Stdev 1.64 2.45 1.51
Properties with >2 occupants = 12 properties
Note: BG = Background, SAF = Save-a-Flush, DF = Dual Flush
BG-SAF BG-DF
Saving (litres) Saving (%) Saving (litres) Saving (%)
Average 1.01 11.17 2.17 20.91
Min. -1.06 -9.63 -2.41 -27.49
Max. 2.56 32.78 6.61 49.63
Save-a-flush savings for those properties with both BG and SAF values
BG-DF
BG (litres) DF (litres) Saving (litres) Saving (%)
Average 9.68 7.66 2.02 20.85
Min. 6.70 5.20
Max. 13.40 10.77
St. Dev. 1.72 1.43
Savings per flush for properties with measured BG values
29
Appendix F: Results Tables
Average flush volume (litres) Savings per flush (litres)
BG SAF DF BG v DF SAF v DF BG v SAF
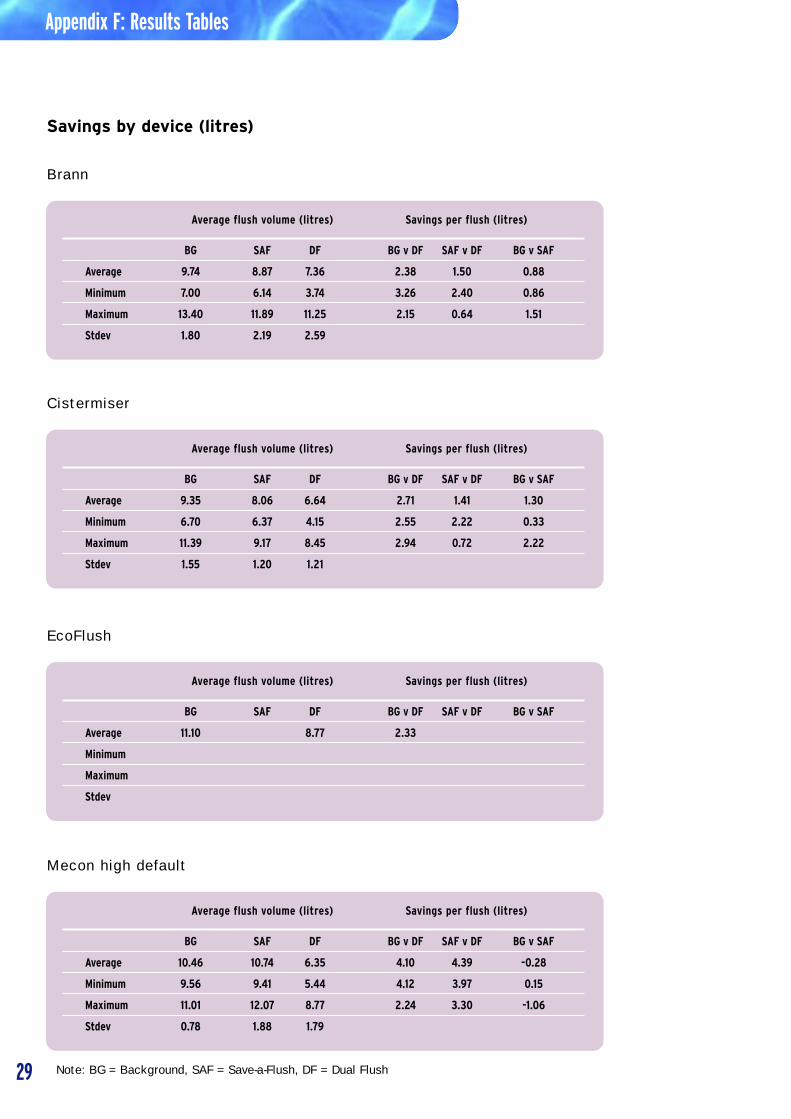
Average 9.74 8.87 7.36 2.38 1.50 0.88
Minimum 7.00 6.14 3.74 3.26 2.40 0.86
Maximum 13.40 11.89 11.25 2.15 0.64 1.51
Stdev 1.80 2.19 2.59
Brann
Average flush volume (litres) Savings per flush (litres)
BG SAF DF BG v DF SAF v DF BG v SAF
Average 9.35 8.06 6.64 2.71 1.41 1.30
Minimum 6.70 6.37 4.15 2.55 2.22 0.33
Maximum 11.39 9.17 8.45 2.94 0.72 2.22
Stdev 1.55 1.20 1.21
Cistermiser
Average flush volume (litres) Savings per flush (litres)
BG SAF DF BG v DF SAF v DF BG v SAF
Average 11.10 8.77 2.33
Minimum
Maximum
Stdev
EcoFlush
Average flush volume (litres) Savings per flush (litres)
BG SAF DF BG v DF SAF v DF BG v SAF
Average 10.46 10.74 6.35 4.10 4.39 -0.28
Minimum 9.56 9.41 5.44 4.12 3.97 0.15
Maximum 11.01 12.07 8.77 2.24 3.30 -1.06
Stdev 0.78 1.88 1.79
Mecon high default
Savings by device (litres)
Note: BG = Background, SAF = Save-a-Flush, DF = Dual Flush
30
Appendix F: Results Tables
Average flush volume (litres) Savings per flush (litres)
BG SAF DF BG v DF SAF v DF BG v SAF
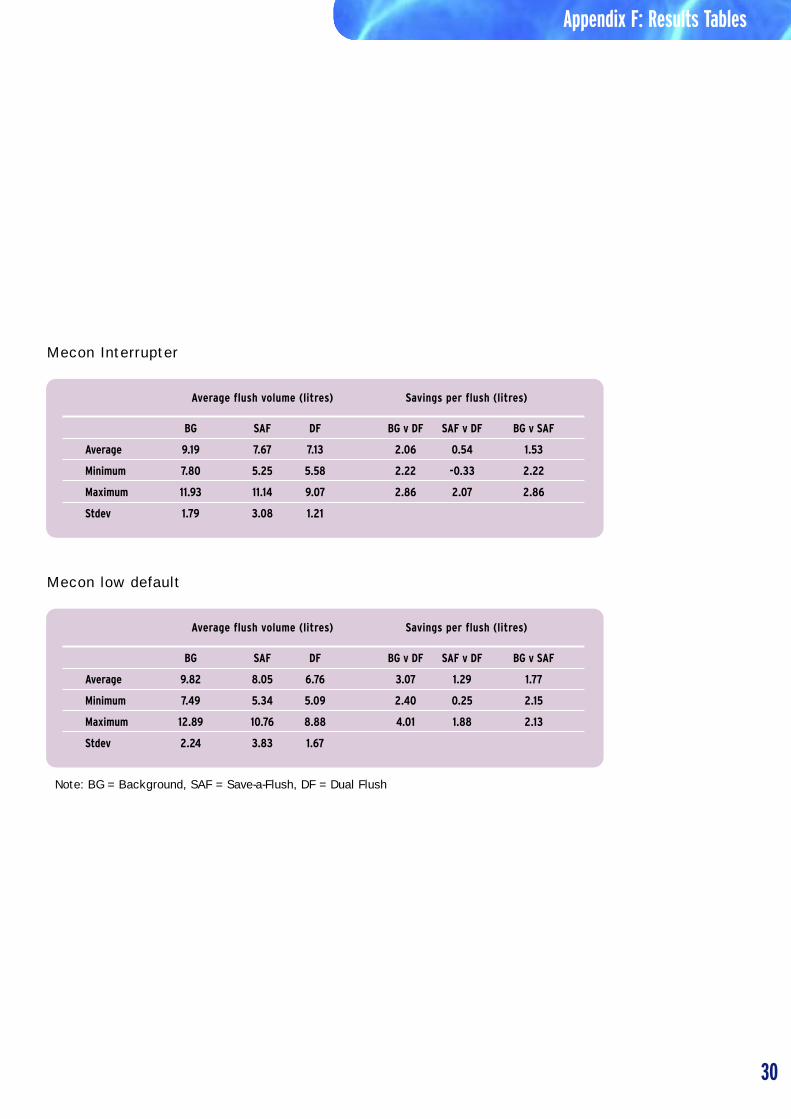
Average 9.19 7.67 7.13 2.06 0.54 1.53
Minimum 7.80 5.25 5.58 2.22 -0.33 2.22
Maximum 11.93 11.14 9.07 2.86 2.07 2.86
Stdev 1.79 3.08 1.21
Mecon Interrupter
Average flush volume (litres) Savings per flush (litres)
BG SAF DF BG v DF SAF v DF BG v SAF
Average 9.82 8.05 6.76 3.07 1.29 1.77
Minimum 7.49 5.34 5.09 2.40 0.25 2.15
Maximum 12.89 10.76 8.88 4.01 1.88 2.13
Stdev 2.24 3.83 1.67
Mecon low default
Note: BG = Background, SAF = Save-a-Flush, DF = Dual Flush
31
DOUBLE FLUSH ANALYSIS
SOUTHERN WATER REPORT90001/TR/00/21
Background
One of the principal arguments against the use ofdual flush toilets is the perceived high degree ofdouble flushing that is necessary. Double flushingtypically occurs when the initial low volume flush isinsufficient to clear the pan and a second (or third)flush becomes necessary. It is possible that a highprevalence of double flushing may negate thewater saving benefits of dual flush systems. Thedual flush trial offers an opportunity to assess theoccurrence of double flushing in the propertiesbeing studied.
Method of Analysis
There are a number of parameters which can be drawn from the data collected, to indicate theoccurrence of double flushing. The most obvious is flush volume, however this is complicated whenvariable flush volumes need to be considered.Another option is to analyse the change in flush patterns that occur when the intervalbetween flushes is varied. This method isdescribed fully below.
Flush volumes are measured by a meter on thecistern inlet pipe, which is connected to a datalogger. The meter delivers a pulse to the loggerevery time half a litre of water passes through it,therefore the data recorded are a stream of halflitre pulses. When the toilet is flushed once, anumber of consecutive half litre pulses areobserved, constituting the total flush volume.Therefore a 9 litre flush will be made up of 18 halflitre pulses.
In order to separate out individual flush eventsfrom the data, it is necessary to define an intervalbetween pulses, which effectively separates oneflush from another. Thus, once a period of say 5minutes (300 seconds) has passed after the lastpulse of the 18 pulses in a 9 litre flush, that eventcan be defined as a complete flush. If a secondflush were made before the full 300 seconds hadelapsed then this flush would be included in thesingle event. This second flush may be a genuinedouble flush, or it is possible it could result from aseparate toilet use.
In the example above, which corresponds to theoperation of a normal cistern, it would be easy toidentify double flushes as any event greater than 9litres, however, this simple example is complicatedwhen variable flush volumes are considered. Witha dual flush cistern, there may be a low flushsetting with a volume of 4.5 litres and full flush
volume of 9 litres. As a result, two low flusheswould be indistinguishable from a single full flush,if they were separated by less than 300 seconds,our arbitrary interval. However, if the two 4.5 litreflushes were two minutes (120 seconds) apart,and the interval between pulses was reduced to60 seconds, then these events would be recordedseparately.
Therefore, by varying the interval, which definesthe separation of flush events, it is possible todetermine the nature of flushes that occur closetogether. It is also possible to determine thepercentage of flushes that occur between certainintervals. Despite this, it is impossible to knowwhether two flushes, however close togetherconstitute a true double flush, or are, in fact, twoseparate single events.
Sample Selection
A small sample of properties was selected foranalysis to assess the occurrence of doubleflushing. The selection was undertaken afterreviewing histograms showing the distribution offlush volume for each property. Properties weregenerally selected for analysis if the graphsappeared to indicate some occurrence of doubleflushing, however one property that showed nosigns of double flushing was also selected as acontrol. Care was taken to ensure each of the fivedevice types being trialled was analysed.
Property A (Littlehampton) – Mecon Low Default Device
This is a single toilet property with two adults andone small child resident. An initial review of thedata suggested this installation experienced a highdegree of double flushing. The cistern has beenfitted with a Mecon device set to low flush default,i.e. the cistern will deliver a low volume flushunless the user intervenes by pulling the tag onthe device. The time at which the tag is pulled willdetermine the size of the larger flush. The defaultlow flush volume is 3.0 litres and the full flushvolume of the cistern is 10.8 litres.
Figures 1a and 1b illustrate the distribution offlush sizes when separated by 300 seconds and60 seconds respectively. Comparison of the two
Appendix G: Double Flush Analysis
Monitoring Period Percentage of events 60-300 Percentage of events 60-300seconds apart seconds apart when 0.5 litre
events are removed
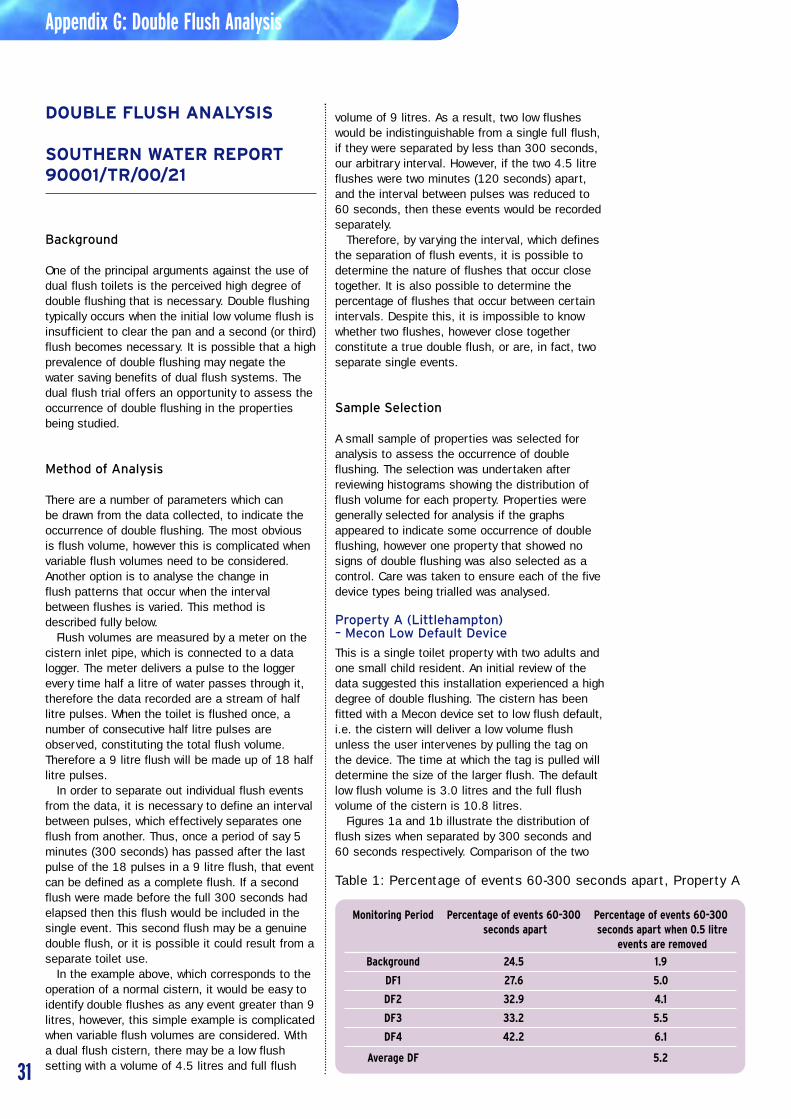
Background 24.5 1.9
DF1 27.6 5.0
DF2 32.9 4.1
DF3 33.2 5.5
DF4 42.2 6.1
Average DF 5.2
Table 1: Percentage of events 60-300 seconds apart, Property A
32
figures indicate that there are significantly morelow flushes of 0 – 2.5 litres at the lower intervalthan at the higher interval, in all monitoringperiods. There are fewer flushes in the range 2.5– 5.0 litres (the range in which low volume flusheswould fall) at 60 second interval, and similarproportions for the other classes.
The significant increase in very low flushvolumes when using the 60 second interval meritsfurther investigation. Figures 2a and 2b are similarto the previous histograms, but split the flush sizedistribution into half litre classes. It is clear from acomparison of the plots that the 60 second graphincludes a significant number of events of 0.5 litremagnitude. Inspection of the raw data suggeststhat these ‘events’ are probably the last pulse onthe long tail of a regular flush, separated by morethan 60 seconds from the rest of the flush.Consequently, it can be concluded that for thisproperty, an interval of 60 seconds is too small toaccurately separate flush events.
By comparing the total number of events derivedusing the two different intervals, it is possible toestimate the percentage of events that occur between60 and 300 seconds apart. Table 1 summarisesthe percentages for each of the monitoringperiods.
These high percentages suggest a very highproportion of double flushing, however the largenumber of spurious 0.5 litre events must be takeninto account, as illustrated in the second columnof data. These data indicate that, even with thespurious events removed, there are more closelyspaced events during dual flush (DF) monitoringperiods than during the background monitoring.This suggests an increase in double flushing from1.9 % of all flushes to 5.2 % on average duringthe dual flush period. Despite this, this propertystill demonstrates an average saving per flush of3.7 litres. This is likely to be due to the relativesize of the standard full flush volume and the lowflush volume, 10.8 litre and 2.9 litre respectively,with the result that two low flushes are stillsignificantly smaller than a single full flush.
As a result, the small number of flushes greaterthan 12 litre observed in Figure 2a, which may belarge double flushes (they are not as notable inFigure 2b) are more than cancelled out by the 40–60 % of 3 litre flushes. Although this issatisfactory in terms of volumetric saving, theinconvenience to the user should not be forgotten.
Property B (Lancing) – Mecon High Default Device
This is a property with more than one toilet andfour regular occupants (two adults, two children).Initial review of the data suggested a lowpercentage of double flushing. The cistern hasbeen fitted with a Mecon high default device, i.e.the cistern will deliver a large (standard) flushvolume unless the user intervenes. The time atwhich the tag is pulled will determine the exactsize of the lower flush volume. The full flush
volume was measured at 9.0 litres and theindicative low flush volume was 3.8 litres. Thisproperty did not show any signs of significantdouble flushing on first examination of the data,and was therefore selected as a control.
Figures 3a and 3b illustrate the distribution offlush sizes when separated by 300 seconds and60 seconds respectively. Comparison of the twofigures indicate little overall variation in flush sizedistribution at the two different intervals,particularly in the two most populous classesbetween 2.5 litres and 5.0 litres and between 7.5litres and 10 litres. As in Property A, there is anincrease in small flushes between 0 and 2.5 litreswith the 60 second interval. There is also a smallincrease in the number of larger flushes whenapplying the 300 second interval.
Figure 4 illustrates the distribution of flush sizesusing a 60 second interval, and confirms that theincrease in very small flushes when using a 60second interval is a result of 0.5 litre pulses, asobserved at Property A. Table 2 summarises theadjusted percentage of flushes that occur between60 and 300 seconds apart, taking into accountthe occurrence of these spurious events.
The data suggest that double flushing hasincreased by 2% after the dual flush installation,although the variation in the above data betweendual flush monitoring periods is significant. It maybe possible that this is a result of the variation inusage habits as determined by school terms orother lifestyle factors. Despite the apparent rise indouble flushing rates, the average overall savingat this property is 2.8 litres per flush. This loweraverage saving than Property A is likely to be aresult of the high default installation in thiscistern. This indicates that device type/set-up maybe a more important factor in determining savingsthan double flushing rates.
Property C (Littlehampton) – MeconInterrupter DeviceThis is a single toilet property with three adultoccupants. The cistern has been fitted with a MeconInterrupter device, which stops the flush when theuser presses a button installed on the front of thecistern. In this way, the user has total control of theflush size up to the maximum volume, which in thiscase was measured as 10.2 litres. Because of this
Appendix G: Double Flush Analysis
Monitoring Period Percentage of events 60-300 seconds apart
Background 3.1
DF1 8.2
DF2 4.2
DF3 6.5
DF4 1.4
Table 2: Percentage of events 60-300 seconds apart, Property B
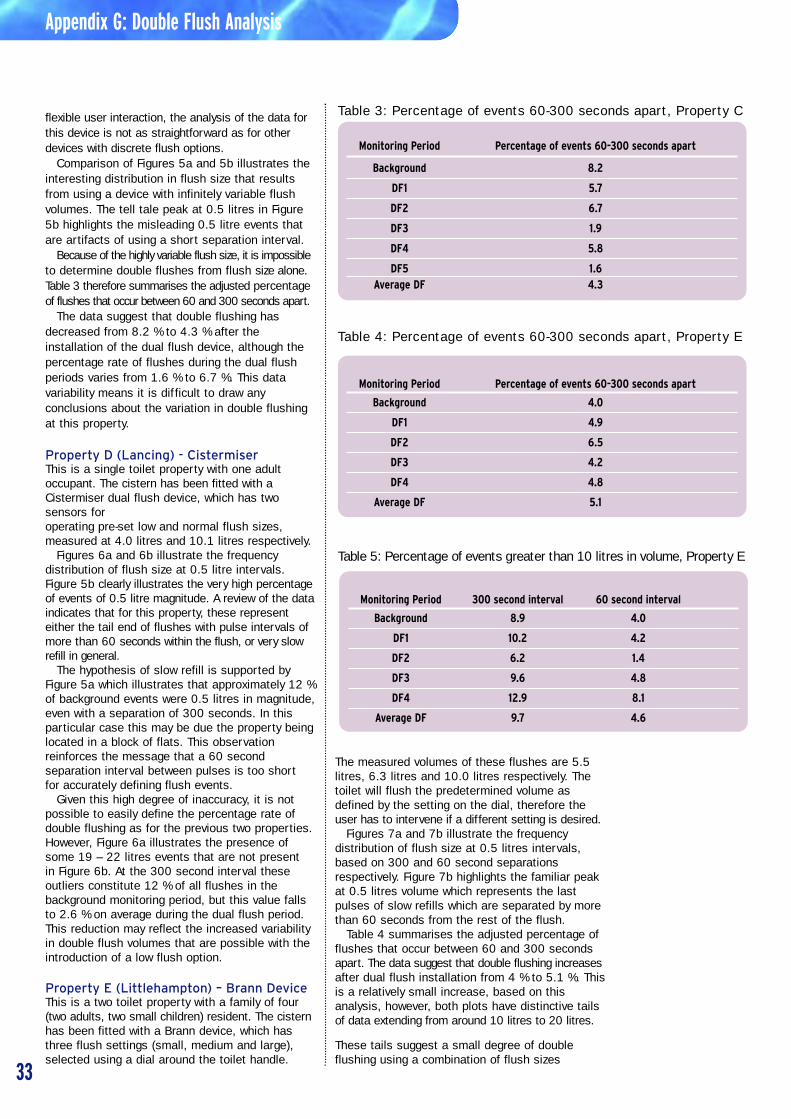
33
flexible user interaction, the analysis of the data forthis device is not as straightforward as for otherdevices with discrete flush options.
Comparison of Figures 5a and 5b illustrates theinteresting distribution in flush size that resultsfrom using a device with infinitely variable flushvolumes. The tell tale peak at 0.5 litres in Figure5b highlights the misleading 0.5 litre events thatare artifacts of using a short separation interval.
Because of the highly variable flush size, it is impossibleto determine double flushes from flush size alone.Table 3 therefore summarises the adjusted percentageof flushes that occur between 60 and 300 seconds apart.
The data suggest that double flushing hasdecreased from 8.2 % to 4.3 % after theinstallation of the dual flush device, although thepercentage rate of flushes during the dual flushperiods varies from 1.6 % to 6.7 %. This datavariability means it is difficult to draw anyconclusions about the variation in double flushingat this property.
Property D (Lancing) - CistermiserThis is a single toilet property with one adultoccupant. The cistern has been fitted with aCistermiser dual flush device, which has twosensors for operating pre-set low and normal flush sizes,measured at 4.0 litres and 10.1 litres respectively.
Figures 6a and 6b illustrate the frequencydistribution of flush size at 0.5 litre intervals.Figure 5b clearly illustrates the very high percentageof events of 0.5 litre magnitude. A review of the dataindicates that for this property, these representeither the tail end of flushes with pulse intervals ofmore than 60 seconds within the flush, or very slowrefill in general.
The hypothesis of slow refill is supported byFigure 5a which illustrates that approximately 12 %of background events were 0.5 litres in magnitude,even with a separation of 300 seconds. In thisparticular case this may be due the property beinglocated in a block of flats. This observationreinforces the message that a 60 secondseparation interval between pulses is too short for accurately defining flush events.
Given this high degree of inaccuracy, it is notpossible to easily define the percentage rate ofdouble flushing as for the previous two properties.However, Figure 6a illustrates the presence ofsome 19 – 22 litres events that are not present in Figure 6b. At the 300 second interval theseoutliers constitute 12 % of all flushes in thebackground monitoring period, but this value fallsto 2.6 % on average during the dual flush period.This reduction may reflect the increased variabilityin double flush volumes that are possible with theintroduction of a low flush option.
Property E (Littlehampton) – Brann DeviceThis is a two toilet property with a family of four(two adults, two small children) resident. The cisternhas been fitted with a Brann device, which hasthree flush settings (small, medium and large),selected using a dial around the toilet handle.
The measured volumes of these flushes are 5.5litres, 6.3 litres and 10.0 litres respectively. Thetoilet will flush the predetermined volume asdefined by the setting on the dial, therefore theuser has to intervene if a different setting is desired.
Figures 7a and 7b illustrate the frequencydistribution of flush size at 0.5 litres intervals,based on 300 and 60 second separationsrespectively. Figure 7b highlights the familiar peakat 0.5 litres volume which represents the lastpulses of slow refills which are separated by morethan 60 seconds from the rest of the flush.
Table 4 summarises the adjusted percentage offlushes that occur between 60 and 300 secondsapart. The data suggest that double flushing increasesafter dual flush installation from 4 % to 5.1 %. Thisis a relatively small increase, based on thisanalysis, however, both plots have distinctive tailsof data extending from around 10 litres to 20 litres.
These tails suggest a small degree of doubleflushing using a combination of flush sizes
Appendix G: Double Flush Analysis
Monitoring Period 300 second interval 60 second interval
Background 8.9 4.0
DF1 10.2 4.2
DF2 6.2 1.4
DF3 9.6 4.8
DF4 12.9 8.1
Average DF 9.7 4.6
Table 5: Percentage of events greater than 10 litres in volume, Property E
Monitoring Period Percentage of events 60-300 seconds apart
Background 8.2
DF1 5.7
DF2 6.7
DF3 1.9
DF4 5.8
DF5 1.6Average DF 4.3
Table 3: Percentage of events 60-300 seconds apart, Property C
Monitoring Period Percentage of events 60-300 seconds apart
Background 4.0
DF1 4.9
DF2 6.5
DF3 4.2
DF4 4.8
Average DF 5.1
Table 4: Percentage of events 60-300 seconds apart, Property E
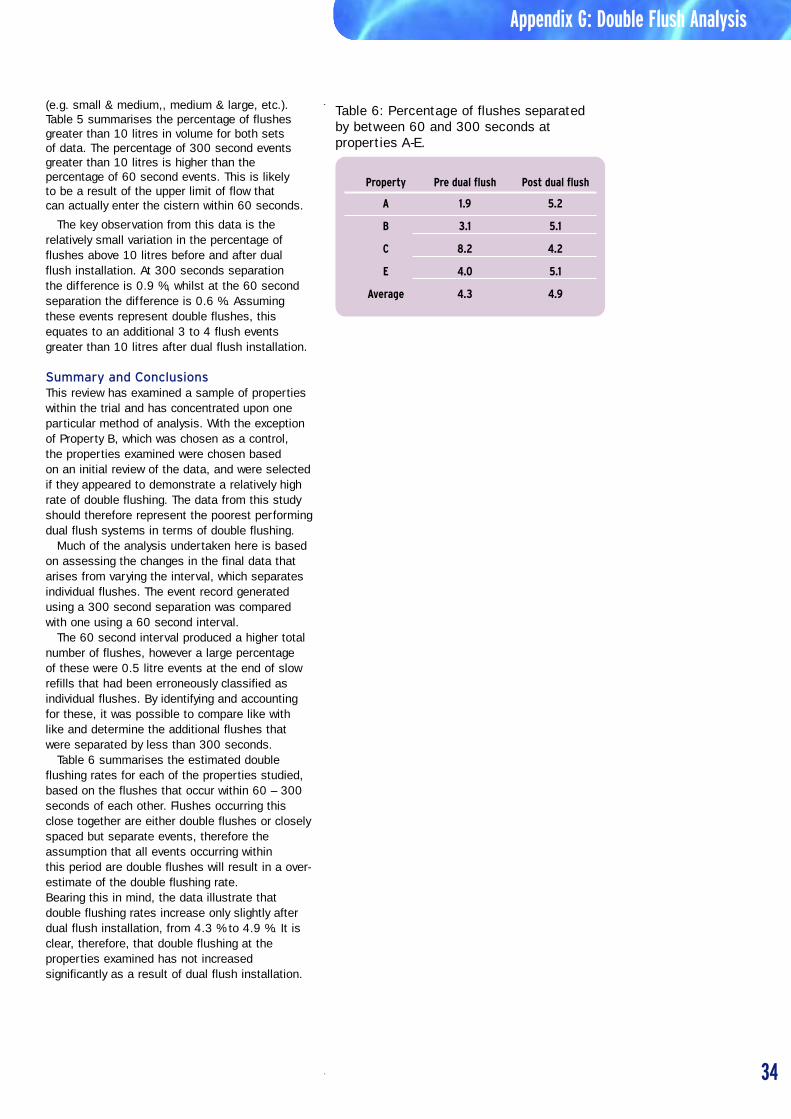
34
(e.g. small & medium,, medium & large, etc.).Table 5 summarises the percentage of flushesgreater than 10 litres in volume for both sets of data. The percentage of 300 second eventsgreater than 10 litres is higher than thepercentage of 60 second events. This is likely to be a result of the upper limit of flow that can actually enter the cistern within 60 seconds.
The key observation from this data is therelatively small variation in the percentage offlushes above 10 litres before and after dual flush installation. At 300 seconds separation the difference is 0.9 %, whilst at the 60 secondseparation the difference is 0.6 %. Assumingthese events represent double flushes, thisequates to an additional 3 to 4 flush eventsgreater than 10 litres after dual flush installation.
Summary and Conclusions This review has examined a sample of propertieswithin the trial and has concentrated upon oneparticular method of analysis. With the exceptionof Property B, which was chosen as a control, the properties examined were chosen based on an initial review of the data, and were selectedif they appeared to demonstrate a relatively highrate of double flushing. The data from this studyshould therefore represent the poorest performingdual flush systems in terms of double flushing.
Much of the analysis undertaken here is basedon assessing the changes in the final data thatarises from varying the interval, which separatesindividual flushes. The event record generatedusing a 300 second separation was comparedwith one using a 60 second interval.
The 60 second interval produced a higher totalnumber of flushes, however a large percentage of these were 0.5 litre events at the end of slowrefills that had been erroneously classified asindividual flushes. By identifying and accountingfor these, it was possible to compare like with like and determine the additional flushes thatwere separated by less than 300 seconds.
Table 6 summarises the estimated doubleflushing rates for each of the properties studied,based on the flushes that occur within 60 – 300seconds of each other. Flushes occurring thisclose together are either double flushes or closelyspaced but separate events, therefore theassumption that all events occurring within this period are double flushes will result in a over-estimate of the double flushing rate.Bearing this in mind, the data illustrate thatdouble flushing rates increase only slightly afterdual flush installation, from 4.3 % to 4.9 %. It isclear, therefore, that double flushing at theproperties examined has not increasedsignificantly as a result of dual flush installation.
Appendix G: Double Flush Analysis
Property Pre dual flush Post dual flush
A 1.9 5.2
B 3.1 5.1
C 8.2 4.2
E 4.0 5.1
Average 4.3 4.9
Table 6: Percentage of flushes separated by between 60 and 300 seconds at properties A-E.
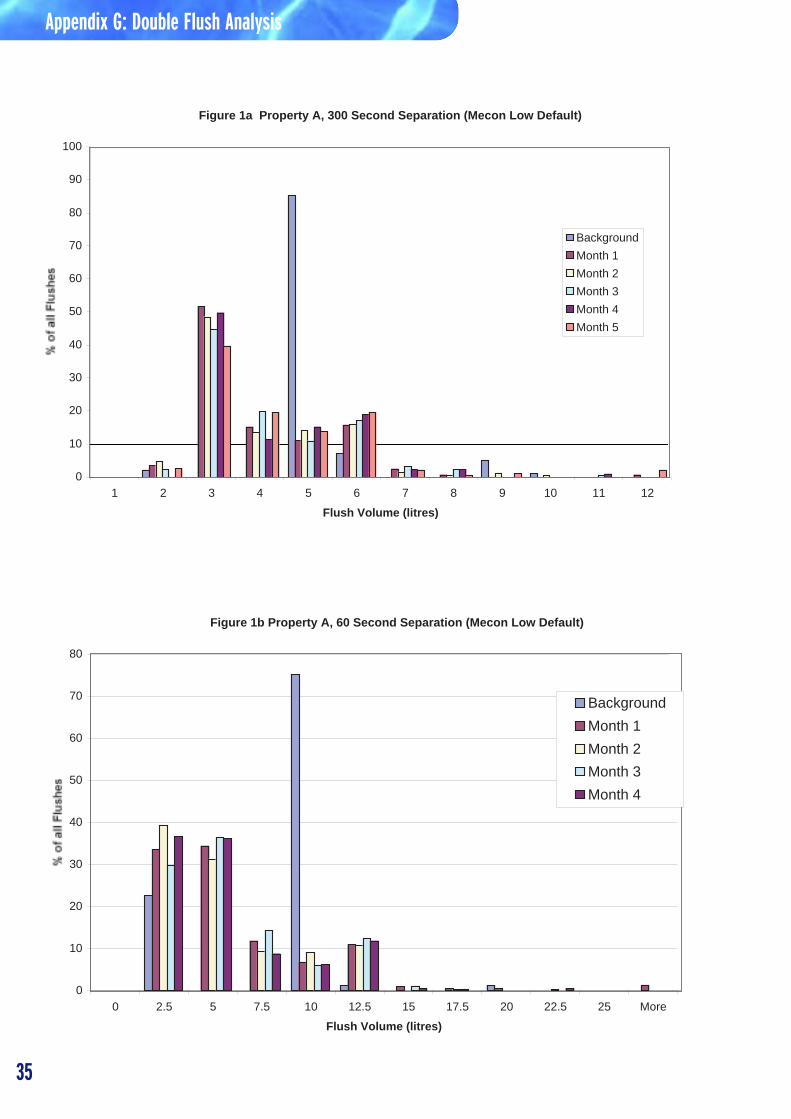
Appendix G: Double Flush Analysis
Figure 1a Property A, 300 Second Separation (Mecon Low Default)
0
10
20
30
40
50
60
70
80
90
100
1 2 3 4 5 6 7 8 9 10 11 12
Flush Volume (litres)
Background
Month 1
Month 2
Month 3
Month 4
Month 5
Figure 1b Property A, 60 Second Separation (Mecon Low Default)
0
10
20
30
40
50
60
70
80
0 2.5 5 7.5 10 12.5 15 17.5 20 22.5 25 More
Flush Volume (litres)
Background
Month 1
Month 2
Month 3
Month 4
35
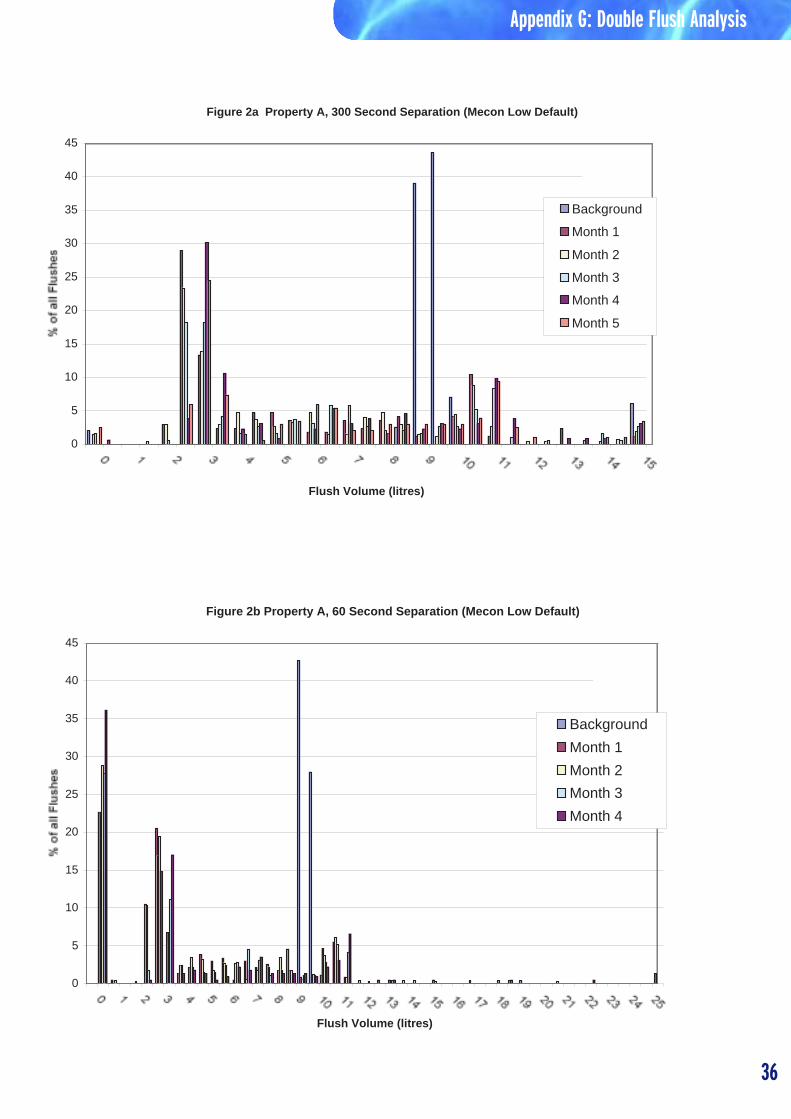
Figure 2a Property A, 300 Second Separation (Mecon Low Default)
0
5
10
15
20
25
30
35
40
45
Flush Volume (litres)
Background
Month 1
Month 2
Month 3
Month 4
Month 5
Figure 2b Property A, 60 Second Separation (Mecon Low Default)
0
5
10
15
20
25
30
35
40
45
Flush Volume (litres)
Background
Month 1
Month 2
Month 3
Month 4
Appendix G: Double Flush Analysis
36
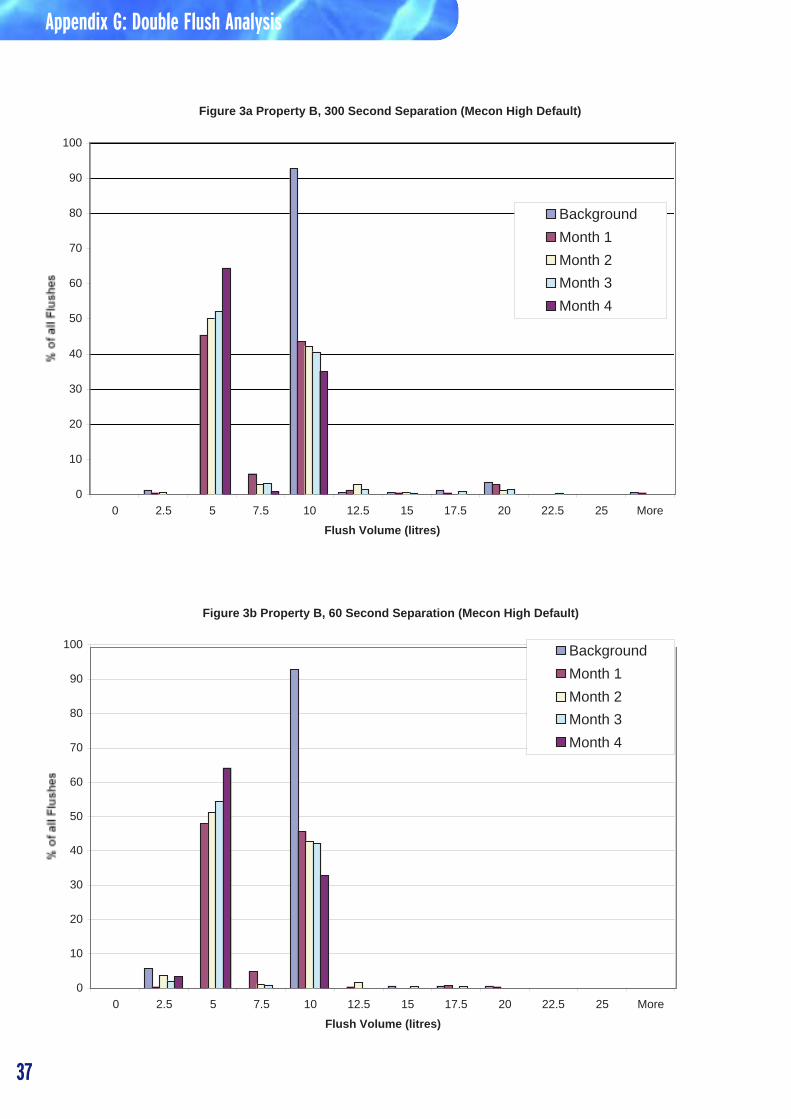
Figure 3a Property B, 300 Second Separation (Mecon High Default)
0
10
20
30
40
50
60
70
80
90
100
0 2.5 5 7.5 10 12.5 15 17.5 20 22.5 25 More
Flush Volume (litres)
Background
Month 1
Month 2
Month 3
Month 4
Figure 3b Property B, 60 Second Separation (Mecon High Default)
0
10
20
30
40
50
60
70
80
90
100
0 2.5 5 7.5 10 12.5 15 17.5 20 22.5 25 More
Flush Volume (litres)
Background
Month 1
Month 2
Month 3
Month 4
Appendix G: Double Flush Analysis
37
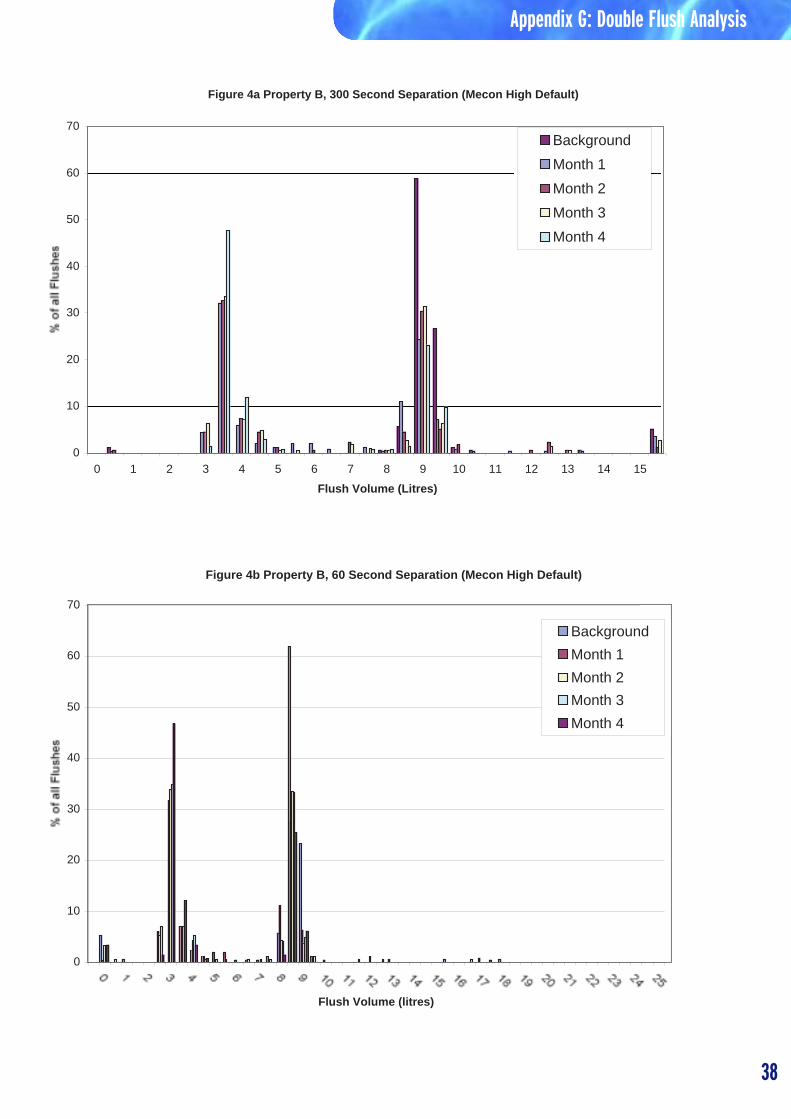
Appendix G: Double Flush Analysis
Figure 4a Property B, 300 Second Separation (Mecon High Default)
0
10
20
30
40
50
60
70
0 1 2 3 4 5 6 7 8 9 10 11 12 13 14 15
Flush Volume (Litres)
Background
Month 1
Month 2
Month 3
Month 4
Figure 4b Property B, 60 Second Separation (Mecon High Default)
0
10
20
30
40
50
60
70
Flush Volume (litres)
Background
Month 1
Month 2
Month 3
Month 4
38
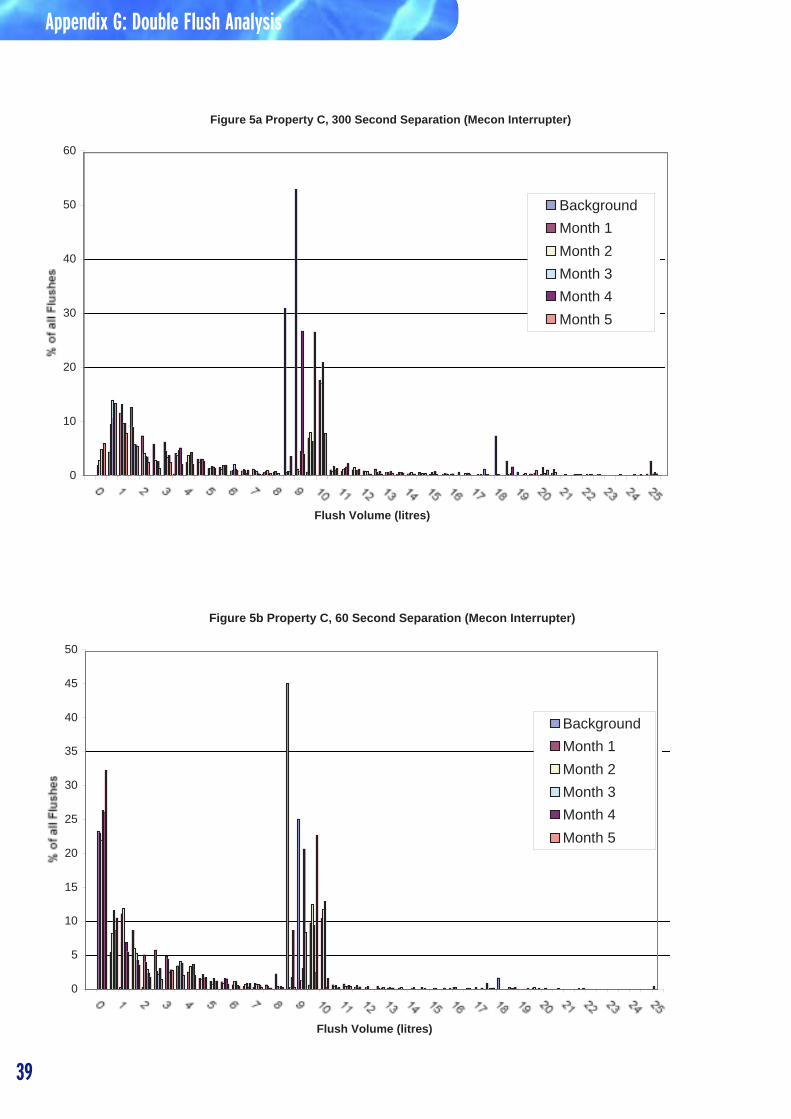
Figure 5a Property C, 300 Second Separation (Mecon Interrupter)
0
10
20
30
40
50
60
Flush Volume (litres)
Background
Month 1
Month 2
Month 3
Month 4
Month 5
Figure 5b Property C, 60 Second Separation (Mecon Interrupter)
0
5
10
15
20
25
30
35
40
45
50
Flush Volume (litres)
Background
Month 1
Month 2
Month 3
Month 4
Month 5
39
Appendix G: Double Flush Analysis
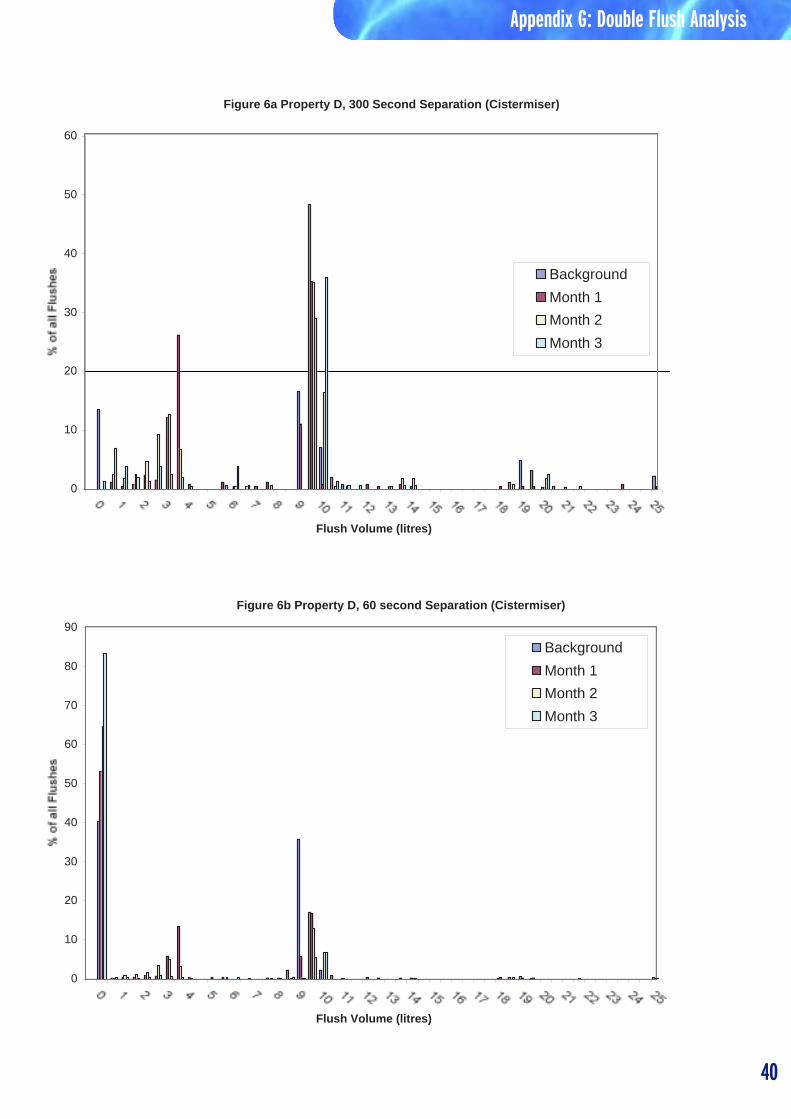
Appendix G: Double Flush Analysis
Figure 6a Property D, 300 Second Separation (Cistermiser)
0
10
20
30
40
50
60
Flush Volume (litres)
Background
Month 1
Month 2
Month 3
Figure 6b Property D, 60 second Separation (Cistermiser)
0
10
20
30
40
50
60
70
80
90
Flush Volume (litres)
Background
Month 1
Month 2
Month 3
40
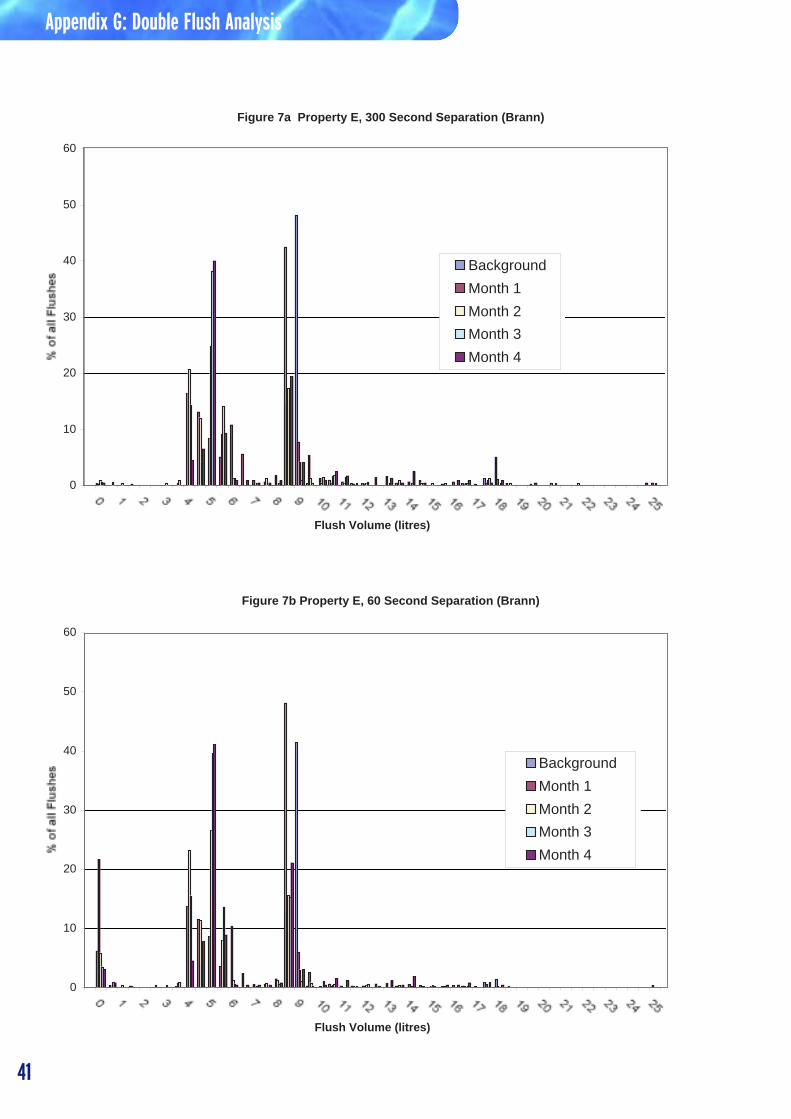
Figure 7a Property E, 300 Second Separation (Brann)
0
10
20
30
40
50
60
Flush Volume (litres)
Background
Month 1
Month 2
Month 3
Month 4
Figure 7b Property E, 60 Second Separation (Brann)
0
10
20
30
40
50
60
Flush Volume (litres)
Background
Month 1
Month 2
Month 3
Month 4
41
Appendix G: Double Flush Analysis


Southern Water, Southern House, Yeoman Road, Worthing BN13 3NX
Telephone: 0845 278 0845
www.southernwater.co.uk