Embed Size (px)
Citation preview
Transit corridors servicing the trade
of landlocked developing countries
THE WAY TO THE OCEAN
Transport and Trade
FacilitationSeries No. 4
U N I T E D N AT I O N S C O N F E R E N C E O N T R A D E A N D D E V E L O P M E N T

UNITED NATIONS CONFERENCE ON TRADE AND DEVELOPMENT
THE WAY TO THE OCEAN
Technical report by the UNCTAD secretariat
UNITED NATIONS New York and Geneva, 2013
ii
NOTE
The designations employed and the presentation of the material in this publication do not imply the expression of any opinion whatsoever on the part of the Secretariat of the United Nations concerning the legal status of any country, territory, city or area, or of its authorities, or concerning the delineation of its frontiers or boundaries.
UNCTAD/DTL/TLB/2012/1
@ Copyright United Nations 2013 All rights reserved
iii
THE WAY TO THE OCEAN
Transit corridors servicing the trade of landlocked developing countries
Summary
The present paper looks at selected East African transit corridors which provide access to seaports as gateways to link landlocked developing countries (LLDCs) with overseas trading partners.
The report suggests three complementary courses of action to improve transit transport efficiency and sustainability:
(a) Building institutional capacity through corridor management arrangements, including formal agreements, where and as appropriate;
(b) Improving the reliability and predictability of transit operations by trust-building measures between public regulators and private operators, such as risk-management customs systems, which allow for fewer en route checks, shorter delays and smaller convoys;
(c) Developing and operating transport nodes, or freight hubs, with a particular focus on theconsolidation of small flows, to create critical masses required to achieve economies of scale, higher return on investment on both infrastructure and transport services, and lead to the development of effective intermodal transit operations.
These actions are to be viewed as precursors to an economically viable and environmentally sustainable operation of the transit corridor. They will bring on a “change of culture" that encourages the confidence of shippers and carriers, operating in a setting that rewards compliant behaviour, builds trust and attracts investment, promotes larger-scale trade operations, improves transport service quality and reliability, and enables strong cooperation among stakeholders along transit corridors, including ports, serving transit trade to and from landlocked countries.
This report may be, in this context, considered as an early contribution to the analysis of the recent progress in the field of transit transport for the trade of LLDCs, in the context of the preparation for the Almaty Programme of Action review process taking place in 2013.
iv
CONTENTS
Summary ................................................................................................................................. iii
I. INTRODUCTION ..............................................................................................................1
II. CHALLENGES FACING LANDLOCKED DEVELOPING COUNTRIES ....................1 A. Economic situation and trade performance............................................................................... 1
B. Transport costs and trade competitiveness................................................................................ 4
III TRADE CORRIDORS IN EAST AFRICA ......................................................................8 A. Landlocked developing countries in Africa .............................................................................. 8
B. The port of Dar es Salaam and the Central Corridor ............................................................... 11
1. Port..................................................................................................................................... 11
2. Rail..................................................................................................................................... 12
3. Road ................................................................................................................................... 13
4. Inland container depots and customs clearance .................................................................... 13
C. The port of Mombasa and the Northern Corridor..................................................................... 14
1. Port..................................................................................................................................... 14
2. Rail..................................................................................................................................... 15
3. Road ................................................................................................................................... 15
4. Inland container depots and customs clearance .................................................................... 16
D. The port of Djibouti and the Djibouti–Ethiopia Corridor ........................................................ 17
1. Port..................................................................................................................................... 17
2. Rail..................................................................................................................................... 19
3. Road ................................................................................................................................... 20
4. Inland container depots and customs clearance .................................................................... 20
E. Lessons learned ..................................................................................................................... 21
IV. HARMONIZE PROCEDURES AND REGULATIONS.................................................21 A. Develop consolidation centres ............................................................................................... 23
B. Build operational arrangements.............................................................................................. 23
V. RECOMMENDED COURSES OF ACTION..................................................................24 A. Reliance and cooperation....................................................................................................... 25
B. Critical mass.......................................................................................................................... 26
C. Operational needs and tailored arrangements ......................................................................... 27
v
LIST OF TABLES AND FIGURES
TABLES
Table 1. UNCTAD Liner Shipping Connectivity Index for East African countries ...............8
Table 2. Export value 2006–2011: world, Africa and East African landlocked developing
countries (US$ millions) ...........................................................................................9
Table 3. Exports as a percentage of gross domestic product in 2011 (US$ millions).............9
Table 4. Import/export documents, time and cost: East African landlocked developing
countries versus best practice ..................................................................................10
Table 5. Port choice for Ethiopian importers/exporters ........................................................18
Table 6. Characteristics of border posts on the Northern and Central Corridors ..................22
FIGURES
Figure 1. Landlocked developing countries..............................................................................2�
Figure 2. Gross domestic product per capita (US$) 1970–2011...............................................3�
Figure 3. Growth in exports: world, developing economies and landlocked developing
Countries ...................................................................................................................4

1
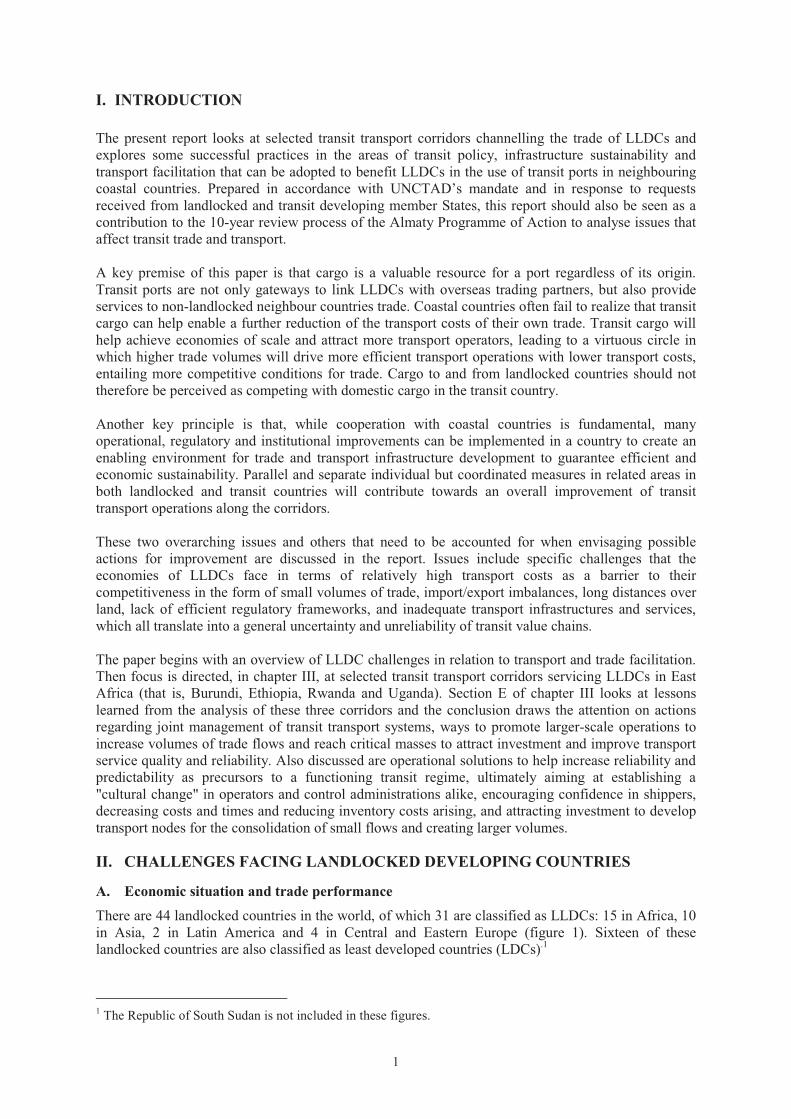
I. INTRODUCTION
The present report looks at selected transit transport corridors channelling the trade of LLDCs and explores some successful practices in the areas of transit policy, infrastructure sustainability and transport facilitation that can be adopted to benefit LLDCs in the use of transit ports in neighbouring coastal countries. Prepared in accordance with UNCTAD’s mandate and in response to requests received from landlocked and transit developing member States, this report should also be seen as a contribution to the 10-year review process of the Almaty Programme of Action to analyse issues that affect transit trade and transport.
A key premise of this paper is that cargo is a valuable resource for a port regardless of its origin. Transit ports are not only gateways to link LLDCs with overseas trading partners, but also provide services to non-landlocked neighbour countries trade. Coastal countries often fail to realize that transit cargo can help enable a further reduction of the transport costs of their own trade. Transit cargo will help achieve economies of scale and attract more transport operators, leading to a virtuous circle in which higher trade volumes will drive more efficient transport operations with lower transport costs, entailing more competitive conditions for trade. Cargo to and from landlocked countries should not therefore be perceived as competing with domestic cargo in the transit country.
Another key principle is that, while cooperation with coastal countries is fundamental, many operational, regulatory and institutional improvements can be implemented in a country to create an enabling environment for trade and transport infrastructure development to guarantee efficient and economic sustainability. Parallel and separate individual but coordinated measures in related areas in both landlocked and transit countries will contribute towards an overall improvement of transit transport operations along the corridors.
These two overarching issues and others that need to be accounted for when envisaging possible actions for improvement are discussed in the report. Issues include specific challenges that the economies of LLDCs face in terms of relatively high transport costs as a barrier to their competitiveness in the form of small volumes of trade, import/export imbalances, long distances over land, lack of efficient regulatory frameworks, and inadequate transport infrastructures and services, which all translate into a general uncertainty and unreliability of transit value chains.
The paper begins with an overview of LLDC challenges in relation to transport and trade facilitation. Then focus is directed, in chapter III, at selected transit transport corridors servicing LLDCs in East Africa (that is, Burundi, Ethiopia, Rwanda and Uganda). Section E of chapter III looks at lessons learned from the analysis of these three corridors and the conclusion draws the attention on actions regarding joint management of transit transport systems, ways to promote larger-scale operations to increase volumes of trade flows and reach critical masses to attract investment and improve transport service quality and reliability. Also discussed are operational solutions to help increase reliability and predictability as precursors to a functioning transit regime, ultimately aiming at establishing a "cultural change" in operators and control administrations alike, encouraging confidence in shippers, decreasing costs and times and reducing inventory costs arising, and attracting investment to develop transport nodes for the consolidation of small flows and creating larger volumes.
II. CHALLENGES FACING LANDLOCKED DEVELOPING COUNTRIES
A. Economic situation and trade performance There are 44 landlocked countries in the world, of which 31 are classified as LLDCs: 15 in Africa, 10 in Asia, 2 in Latin America and 4 in Central and Eastern Europe (figure 1). Sixteen of these landlocked countries are also classified as least developed countries (LDCs).1
1 The Republic of South Sudan is not included in these figures.
2
Figure 1: Landlocked developing countriesa
Source: UNCTAD. a Not including the Republic of South Sudan.
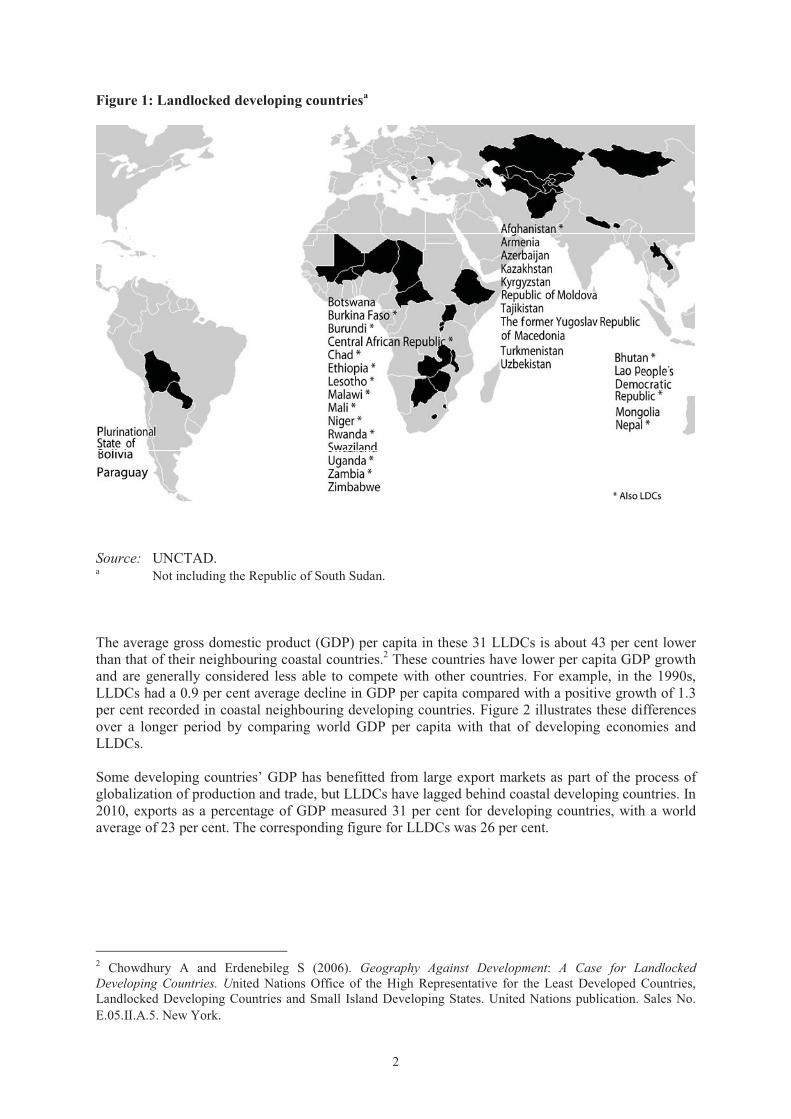
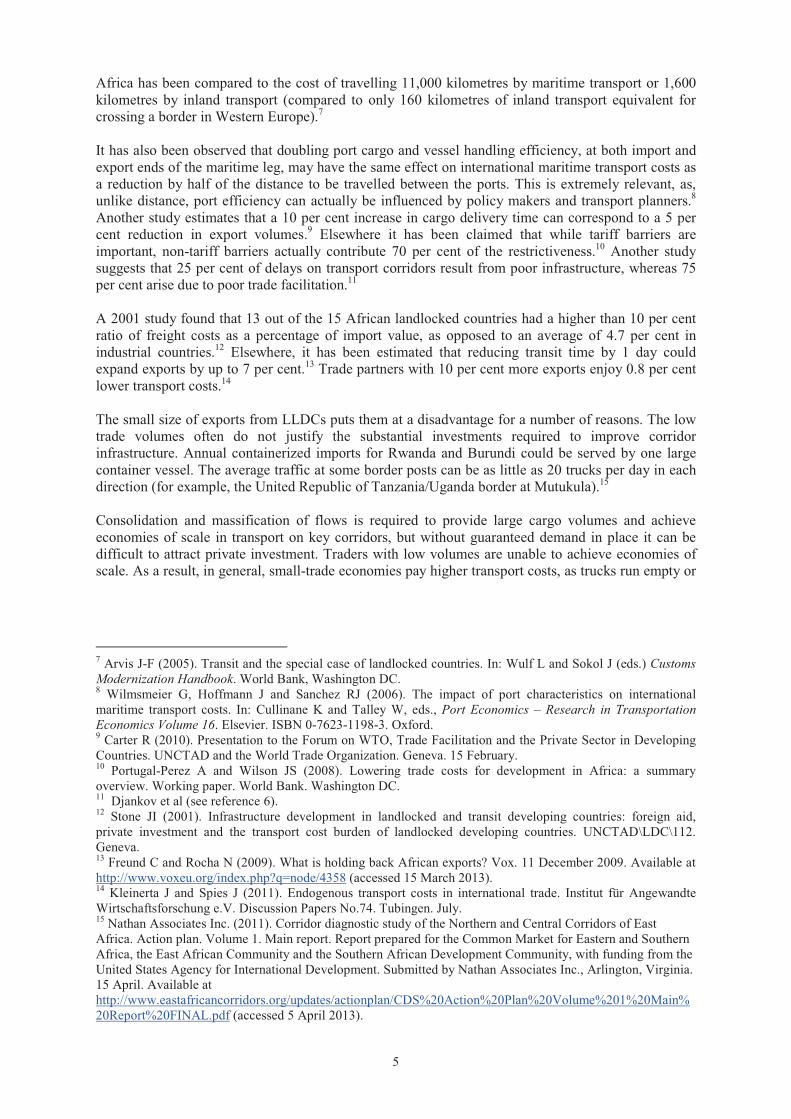
The average gross domestic product (GDP) per capita in these 31 LLDCs is about 43 per cent lower than that of their neighbouring coastal countries.2 These countries have lower per capita GDP growth and are generally considered less able to compete with other countries. For example, in the 1990s, LLDCs had a 0.9 per cent average decline in GDP per capita compared with a positive growth of 1.3 per cent recorded in coastal neighbouring developing countries. Figure 2 illustrates these differences over a longer period by comparing world GDP per capita with that of developing economies and LLDCs.
Some developing countries’ GDP has benefitted from large export markets as part of the process of globalization of production and trade, but LLDCs have lagged behind coastal developing countries. In 2010, exports as a percentage of GDP measured 31 per cent for developing countries, with a world average of 23 per cent. The corresponding figure for LLDCs was 26 per cent.
2 Chowdhury A and Erdenebileg S (2006). Geography Against Development: A Case for Landlocked Developing Countries. United Nations Office of the High Representative for the Least Developed Countries, Landlocked Developing Countries and Small Island Developing States. United Nations publication. Sales No. E.05.II.A.5. New York.
3
Figure 2. Gross domestic product per capita (US$) 1970–2011
0
2000
4000
6000
8000
10000
12000
1970
1972
1975
1978
1981
1984
1987
1990
1993
1996
1999
2002
2005
2008
2011
GDP
Per
Cap
ita (U
S$)
World Developing economies Landlocked developing countries
Source: UNCTAD.
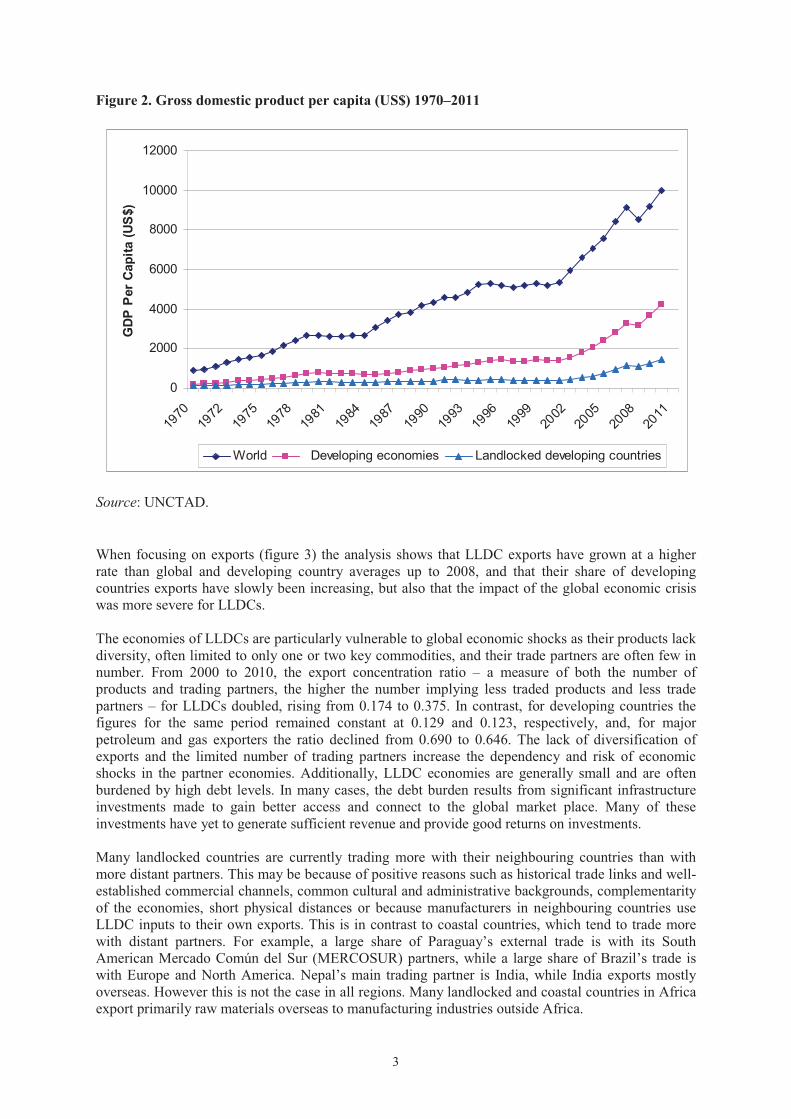
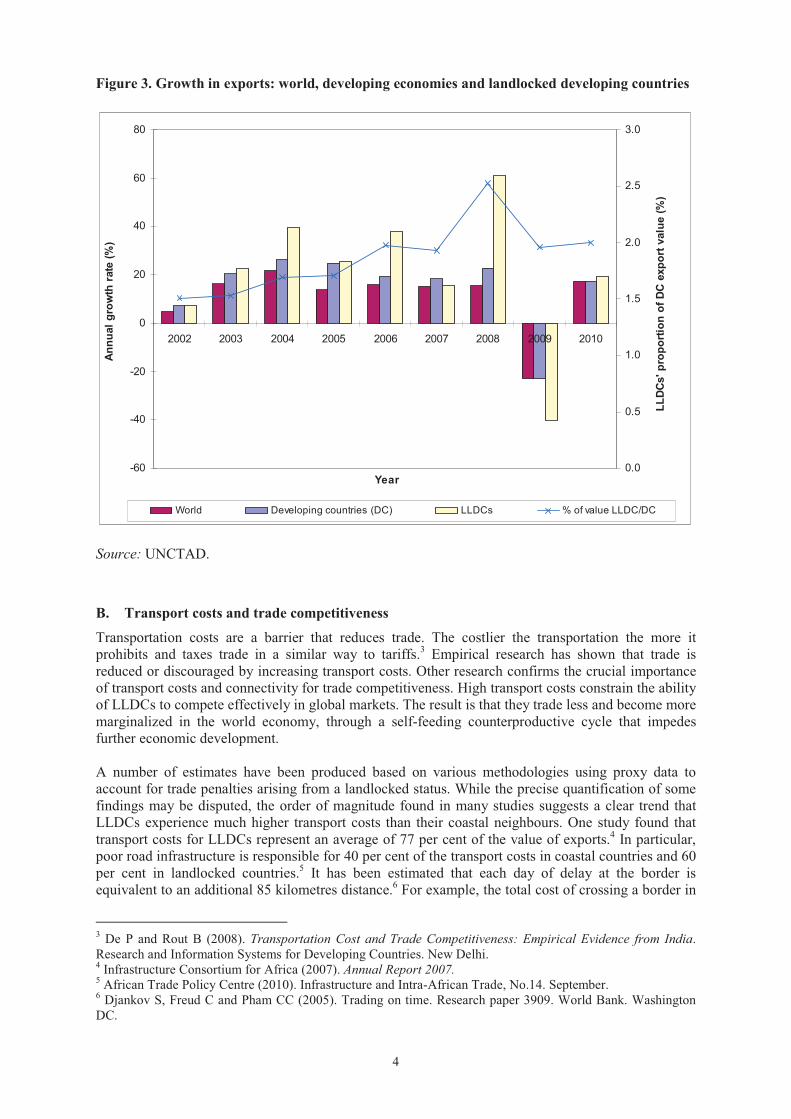
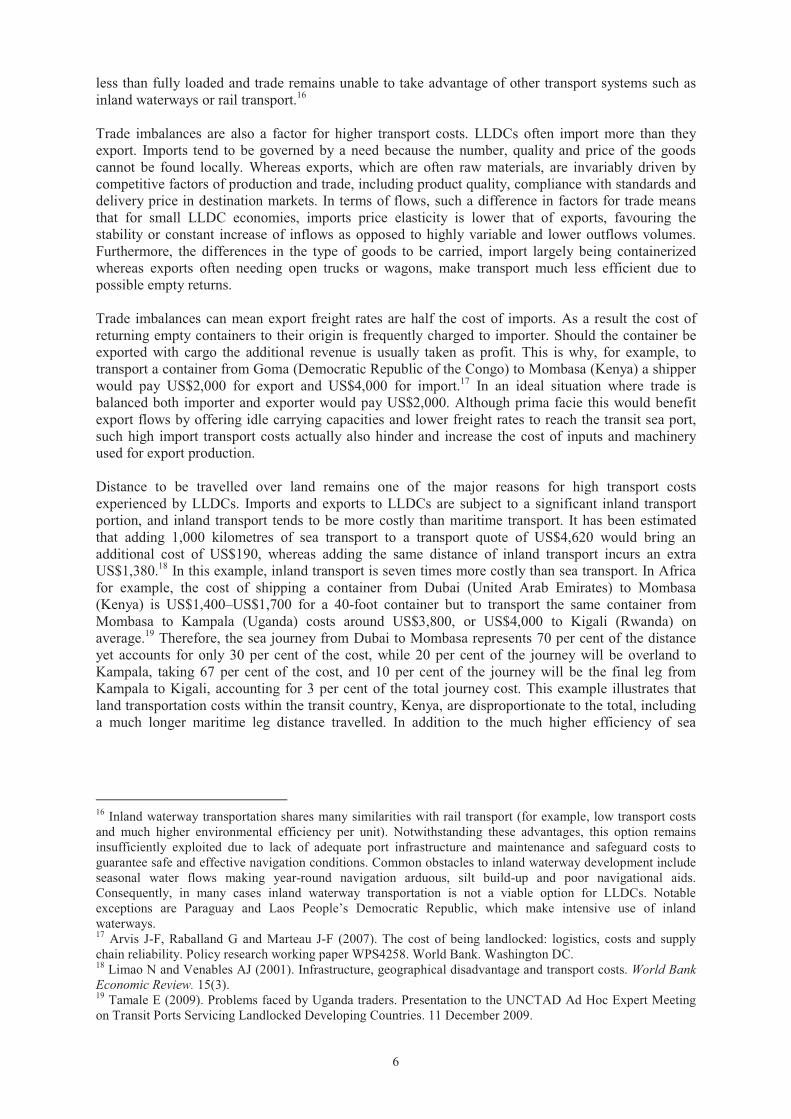
When focusing on exports (figure 3) the analysis shows that LLDC exports have grown at a higher rate than global and developing country averages up to 2008, and that their share of developing countries exports have slowly been increasing, but also that the impact of the global economic crisis was more severe for LLDCs.
The economies of LLDCs are particularly vulnerable to global economic shocks as their products lack diversity, often limited to only one or two key commodities, and their trade partners are often few in number. From 2000 to 2010, the export concentration ratio – a measure of both the number of products and trading partners, the higher the number implying less traded products and less trade partners – for LLDCs doubled, rising from 0.174 to 0.375. In contrast, for developing countries the figures for the same period remained constant at 0.129 and 0.123, respectively, and, for major petroleum and gas exporters the ratio declined from 0.690 to 0.646. The lack of diversification of exports and the limited number of trading partners increase the dependency and risk of economic shocks in the partner economies. Additionally, LLDC economies are generally small and are often burdened by high debt levels. In many cases, the debt burden results from significant infrastructure investments made to gain better access and connect to the global market place. Many of these investments have yet to generate sufficient revenue and provide good returns on investments.
Many landlocked countries are currently trading more with their neighbouring countries than with more distant partners. This may be because of positive reasons such as historical trade links and well-established commercial channels, common cultural and administrative backgrounds, complementarity of the economies, short physical distances or because manufacturers in neighbouring countries use LLDC inputs to their own exports. This is in contrast to coastal countries, which tend to trade more with distant partners. For example, a large share of Paraguay’s external trade is with its South American Mercado Común del Sur (MERCOSUR) partners, while a large share of Brazil’s trade is with Europe and North America. Nepal’s main trading partner is India, while India exports mostly overseas. However this is not the case in all regions. Many landlocked and coastal countries in Africa export primarily raw materials overseas to manufacturing industries outside Africa.
4
Figure 3. Growth in exports: world, developing economies and landlocked developing countries
-60
-40
-20
0
20
40
60
80
2002 2003 2004 2005 2006 2007 2008 2009 2010
Year
Annu
al g
row
th r
ate
(%)
0.0
0.5
1.0
1.5
2.0
2.5
3.0
LLDC
s' p
ropo
rtion
of D
C e
xpor
t val
ue (%
)
World Developing countries (DC) LLDCs % of value LLDC/DC
Source: UNCTAD.
B. Transport costs and trade competitiveness
Transportation costs are a barrier that reduces trade. The costlier the transportation the more it prohibits and taxes trade in a similar way to tariffs.3 Empirical research has shown that trade is reduced or discouraged by increasing transport costs. Other research confirms the crucial importance of transport costs and connectivity for trade competitiveness. High transport costs constrain the ability of LLDCs to compete effectively in global markets. The result is that they trade less and become more marginalized in the world economy, through a self-feeding counterproductive cycle that impedes further economic development.
A number of estimates have been produced based on various methodologies using proxy data to account for trade penalties arising from a landlocked status. While the precise quantification of some findings may be disputed, the order of magnitude found in many studies suggests a clear trend that LLDCs experience much higher transport costs than their coastal neighbours. One study found that transport costs for LLDCs represent an average of 77 per cent of the value of exports.4 In particular, poor road infrastructure is responsible for 40 per cent of the transport costs in coastal countries and 60 per cent in landlocked countries.5 It has been estimated that each day of delay at the border is equivalent to an additional 85 kilometres distance.6 For example, the total cost of crossing a border in
3 De P and Rout B (2008). Transportation Cost and Trade Competitiveness: Empirical Evidence from India. Research and Information Systems for Developing Countries. New Delhi. 4 Infrastructure Consortium for Africa (2007). Annual Report 2007.5 African Trade Policy Centre (2010). Infrastructure and Intra-African Trade, No.14. September. 6 Djankov S, Freud C and Pham CC (2005). Trading on time. Research paper 3909. World Bank. Washington DC.
5
Africa has been compared to the cost of travelling 11,000 kilometres by maritime transport or 1,600 kilometres by inland transport (compared to only 160 kilometres of inland transport equivalent for crossing a border in Western Europe).7
It has also been observed that doubling port cargo and vessel handling efficiency, at both import and export ends of the maritime leg, may have the same effect on international maritime transport costs as a reduction by half of the distance to be travelled between the ports. This is extremely relevant, as, unlike distance, port efficiency can actually be influenced by policy makers and transport planners.8Another study estimates that a 10 per cent increase in cargo delivery time can correspond to a 5 per cent reduction in export volumes.9 Elsewhere it has been claimed that while tariff barriers are important, non-tariff barriers actually contribute 70 per cent of the restrictiveness.10 Another study suggests that 25 per cent of delays on transport corridors result from poor infrastructure, whereas 75 per cent arise due to poor trade facilitation.11
A 2001 study found that 13 out of the 15 African landlocked countries had a higher than 10 per cent ratio of freight costs as a percentage of import value, as opposed to an average of 4.7 per cent in industrial countries.12 Elsewhere, it has been estimated that reducing transit time by 1 day could expand exports by up to 7 per cent.13 Trade partners with 10 per cent more exports enjoy 0.8 per cent lower transport costs.14
The small size of exports from LLDCs puts them at a disadvantage for a number of reasons. The low trade volumes often do not justify the substantial investments required to improve corridor infrastructure. Annual containerized imports for Rwanda and Burundi could be served by one large container vessel. The average traffic at some border posts can be as little as 20 trucks per day in each direction (for example, the United Republic of Tanzania/Uganda border at Mutukula).15
Consolidation and massification of flows is required to provide large cargo volumes and achieve economies of scale in transport on key corridors, but without guaranteed demand in place it can be difficult to attract private investment. Traders with low volumes are unable to achieve economies of scale. As a result, in general, small-trade economies pay higher transport costs, as trucks run empty or
7 Arvis J-F (2005). Transit and the special case of landlocked countries. In: Wulf L and Sokol J (eds.) Customs Modernization Handbook. World Bank, Washington DC. 8 Wilmsmeier G, Hoffmann J and Sanchez RJ (2006). The impact of port characteristics on international maritime transport costs. In: Cullinane K and Talley W, eds., Port Economics – Research in Transportation Economics Volume 16. Elsevier. ISBN 0-7623-1198-3. Oxford. 9 Carter R (2010). Presentation to the Forum on WTO, Trade Facilitation and the Private Sector in Developing Countries. UNCTAD and the World Trade Organization. Geneva. 15 February. 10 Portugal-Perez A and Wilson JS (2008). Lowering trade costs for development in Africa: a summary overview. Working paper. World Bank. Washington DC.11 Djankov et al (see reference 6). 12 Stone JI (2001). Infrastructure development in landlocked and transit developing countries: foreign aid, private investment and the transport cost burden of landlocked developing countries. UNCTAD\LDC\112. Geneva. 13 Freund C and Rocha N (2009). What is holding back African exports? Vox. 11 December 2009. Available at http://www.voxeu.org/index.php?q=node/4358 (accessed 15 March 2013). 14 Kleinerta J and Spies J (2011). Endogenous transport costs in international trade. Institut für Angewandte Wirtschaftsforschung e.V. Discussion Papers No.74. Tubingen. July. 15 Nathan Associates Inc. (2011). Corridor diagnostic study of the Northern and Central Corridors of East Africa. Action plan. Volume 1. Main report. Report prepared for the Common Market for Eastern and Southern Africa, the East African Community and the Southern African Development Community, with funding from the United States Agency for International Development. Submitted by Nathan Associates Inc., Arlington, Virginia. 15 April. Available at http://www.eastafricancorridors.org/updates/actionplan/CDS%20Action%20Plan%20Volume%201%20Main%20Report%20FINAL.pdf (accessed 5 April 2013).
6
less than fully loaded and trade remains unable to take advantage of other transport systems such as inland waterways or rail transport.16
Trade imbalances are also a factor for higher transport costs. LLDCs often import more than they export. Imports tend to be governed by a need because the number, quality and price of the goods cannot be found locally. Whereas exports, which are often raw materials, are invariably driven by competitive factors of production and trade, including product quality, compliance with standards and delivery price in destination markets. In terms of flows, such a difference in factors for trade means that for small LLDC economies, imports price elasticity is lower that of exports, favouring the stability or constant increase of inflows as opposed to highly variable and lower outflows volumes. Furthermore, the differences in the type of goods to be carried, import largely being containerized whereas exports often needing open trucks or wagons, make transport much less efficient due to possible empty returns.
Trade imbalances can mean export freight rates are half the cost of imports. As a result the cost of returning empty containers to their origin is frequently charged to importer. Should the container be exported with cargo the additional revenue is usually taken as profit. This is why, for example, to transport a container from Goma (Democratic Republic of the Congo) to Mombasa (Kenya) a shipper would pay US$2,000 for export and US$4,000 for import.17 In an ideal situation where trade is balanced both importer and exporter would pay US$2,000. Although prima facie this would benefit export flows by offering idle carrying capacities and lower freight rates to reach the transit sea port, such high import transport costs actually also hinder and increase the cost of inputs and machinery used for export production.
Distance to be travelled over land remains one of the major reasons for high transport costs experienced by LLDCs. Imports and exports to LLDCs are subject to a significant inland transport portion, and inland transport tends to be more costly than maritime transport. It has been estimated that adding 1,000 kilometres of sea transport to a transport quote of US$4,620 would bring an additional cost of US$190, whereas adding the same distance of inland transport incurs an extra US$1,380.18 In this example, inland transport is seven times more costly than sea transport. In Africa for example, the cost of shipping a container from Dubai (United Arab Emirates) to Mombasa (Kenya) is US$1,400–US$1,700 for a 40-foot container but to transport the same container from Mombasa to Kampala (Uganda) costs around US$3,800, or US$4,000 to Kigali (Rwanda) on average.19 Therefore, the sea journey from Dubai to Mombasa represents 70 per cent of the distance yet accounts for only 30 per cent of the cost, while 20 per cent of the journey will be overland to Kampala, taking 67 per cent of the cost, and 10 per cent of the journey will be the final leg from Kampala to Kigali, accounting for 3 per cent of the total journey cost. This example illustrates that land transportation costs within the transit country, Kenya, are disproportionate to the total, including a much longer maritime leg distance travelled. In addition to the much higher efficiency of sea
16 Inland waterway transportation shares many similarities with rail transport (for example, low transport costs and much higher environmental efficiency per unit). Notwithstanding these advantages, this option remains insufficiently exploited due to lack of adequate port infrastructure and maintenance and safeguard costs to guarantee safe and effective navigation conditions. Common obstacles to inland waterway development include seasonal water flows making year-round navigation arduous, silt build-up and poor navigational aids. Consequently, in many cases inland waterway transportation is not a viable option for LLDCs. Notable exceptions are Paraguay and Laos People’s Democratic Republic, which make intensive use of inland waterways. 17 Arvis J-F, Raballand G and Marteau J-F (2007). The cost of being landlocked: logistics, costs and supply chain reliability. Policy research working paper WPS4258. World Bank. Washington DC. 18 Limao N and Venables AJ (2001). Infrastructure, geographical disadvantage and transport costs. World Bank Economic Review. 15(3). 19 Tamale E (2009). Problems faced by Uganda traders. Presentation to the UNCTAD Ad Hoc Expert Meeting on Transit Ports Servicing Landlocked Developing Countries. 11 December 2009.
7
shipping compared to rail or road carriage, reasons for even higher land transports costs in transit countries have been attributed to roadblocks, congestion and poor road and rail infrastructure.20
In recent years the World Bank series of Doing Business reports have ranked over 180 countries, including 38 LLDCs, on the ease of doing business based on 10 categories: starting a business; dealing with construction permits; employing workers; registering property; obtaining credit; protecting investors; paying taxes; trading across borders; enforcing contracts and closing a business. Landlocked countries ranked lower than coastal countries in seven of these categories suggesting that many of the challenges they face could be ameliorated through better national policies.
The speed, predictability, continuity and assured sequence of trade operations are of major concern for importers and exporters. It has been estimated that one extra day of delay can cost as much as the equivalent to an ad valorem tariff of 0.6 to 2.3 per cent of the value of goods.21 Companies can also lose business due to the poor quality of services such as volatile arrival times, damaged cargo or inadequate knowledge of transport procedures by either freight forwarders, transport operators and/or customs officials in LLDCs and/or transit countries. As much as 50 per cent of cargo dwell time for goods in Cameroon has been associated with the low capacity of clearing and forwarding agents.22
Buyers of goods need to hedge against the consequences of not having cargo delivered in a timely manner by using alternative transport modes, even if more expensive, or by increasing inventories. In Bangladesh garment producers routinely ship 10 per cent of their production by air to meet schedules. In the case of many LLDCs, consignees often sell their goods upon arrival. This means that importers are entirely dependent on the efficiency of the transport process. In addition, goods are usually paid for when the shipment leaves the port of export and thus long transport times mean long periods of tied-up capital. The opportunity costs mean less capital moving in the economy and less enterprise. It has been estimated that in developing countries inventory can reach as much as one year of expected sales.23 The money spent in purchasing goods could be better used by investing in the local economy. One study has estimated the cost of additional inventory for developing countries as 2 per cent of GDP.24
Additionally, reductions in costs for transport operators are not always passed on to the users of those services due to market imperfections. Port dwell times can be extremely unpredictable and measuring average times can be misleading, causing importers to hold unnecessarily high levels of inventory. It has therefore been suggested that the relevant measure for the shipper is not the average dwell time but the 95th or 99th percentile, that is, how long it usually takes once cases falling outside the standard bell curve are excluded. It is reliability rather than average time that is key.25 In order to guarantee certain processing standards, systemic change is required. Small efficiency improvements will lower the average but will not provide assurance to shippers of a predictable maximum time against which to balance their inventory requirements.
The World Bank’s Logistics Performance Index (LPI) ranks countries on the categories of time, cost and reliability of import and export supply chains, infrastructure quality, performance of core services, and the friendliness of trade clearance procedures. The results showed that time and cost for both importing and exporting are far higher for landlocked countries than their coastal neighbours. Moreover, this difference is amplified in poorer parts of the world. For example, European coastal
20 Abdi H-N (2004). The influence of rural logistics and rural transport costs on farm income and poverty in Kenya: the case of Kisumu and Nyandarua districts, Kenya. Report for the World Bank. Available at http://siteresources.worldbank.org/INTTLF/Resources/Kenya_Rural_Logitcis (accessed 15 March 2013). 21 Hummels DL and Schaur G (2012). Time as a trade barrier. National Bureau of Economic Research working paper No. 17758. Cambridge, MA. 22 Guichet Unique du Commerce Extérieur (Cameroun) (2004). 23 Guasch JL and Kogan J (2001). Inventories in developing countries: levels and determinants, a red flag on competitiveness and growth. Research policy paper 2552. World Bank. Washington DC. 24 Guasch and Kogan (see reference 23). 25 Arvis et al (see reference 17).
8
countries achieved an LPI score of 3.68 compared with 3.58 for landlocked countries, whereas African coastal countries scored 2.46 against 2.39 for landlocked countries.26
Some African ports charge up to ten times more for services than the ports of developed countries. At the port of Mombasa demurrage is charged at US$40 per day per container. For warehouses at the port US$200 is charged per container when exiting. Shipping lines routinely charge US$1,000–US$2,000 deposit that is forfeited if goods are not collected within a specified period of time and there is also an extra charge should the container return from the LLDC empty.27
A review of the transit overheads of Togo and Burkina Faso showed that freight forwarders fees represent 15 per cent of total costs, and for other African countries this share can be as high as 30 per cent. These costs result from the complexity of operations, the high costs of intervention and the multiple border clearances. Therefore, it is imperative that these processes are simplified in order to reduce the costs of these services.
III. TRADE CORRIDORS IN EAST AFRICA
A. Landlocked developing countries in Africa
Africa is comprised of 54 countries, 16 of which are landlocked: Botswana, Burkina Faso, Burundi, the Central African Republic, Chad, Ethiopia, Lesotho, Malawi, Mali, the Niger, Rwanda, South Sudan,28 Swaziland, Uganda, Zambia and Zimbabwe. LLDCs in Africa face additional challenges not experienced in other parts of the world. Most of the sixteen LLDCs in Africa are also included among the world’s LDCs, and their coastal neighbours often possess lower quality transport infrastructure because they are also developing countries.
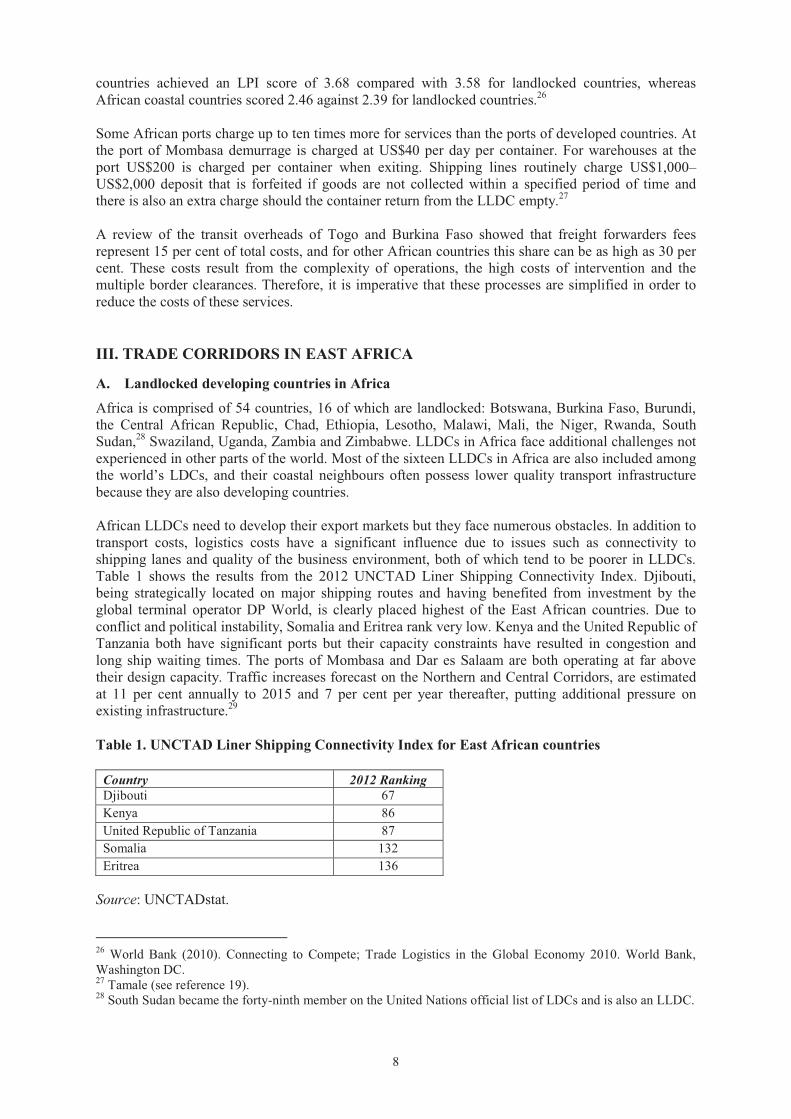
African LLDCs need to develop their export markets but they face numerous obstacles. In addition to transport costs, logistics costs have a significant influence due to issues such as connectivity to shipping lanes and quality of the business environment, both of which tend to be poorer in LLDCs. Table 1 shows the results from the 2012 UNCTAD Liner Shipping Connectivity Index. Djibouti, being strategically located on major shipping routes and having benefited from investment by the global terminal operator DP World, is clearly placed highest of the East African countries. Due to conflict and political instability, Somalia and Eritrea rank very low. Kenya and the United Republic of Tanzania both have significant ports but their capacity constraints have resulted in congestion and long ship waiting times. The ports of Mombasa and Dar es Salaam are both operating at far above their design capacity. Traffic increases forecast on the Northern and Central Corridors, are estimated at 11 per cent annually to 2015 and 7 per cent per year thereafter, putting additional pressure on existing infrastructure.29
Table 1. UNCTAD Liner Shipping Connectivity Index for East African countries
Country 2012 Ranking Djibouti 67 Kenya 86 United Republic of Tanzania 87 Somalia 132 Eritrea 136
Source: UNCTADstat.
26 World Bank (2010). Connecting to Compete; Trade Logistics in the Global Economy 2010. World Bank, Washington DC. 27 Tamale (see reference 19). 28 South Sudan became the forty-ninth member on the United Nations official list of LDCs and is also an LLDC.
9
In addition, African LLDCs tend to trade less with their neighbours meaning a greater percentage of their trade is affected by transit issues and their exports tend to be lower value so transport costs represent a greater portion of the final value. Despite large investments in Africa, notably the US$14 billion in transport infrastructure projects invested by the World Bank during 1970–2007, transport costs as a share of the value of imported goods remain amongst the highest in the world.30 The countries of Burundi, Ethiopia, Rwanda and Uganda have been chosen as examples worth highlighting in this section for the use of trade corridors in facilitating trade to and from LLDCs.
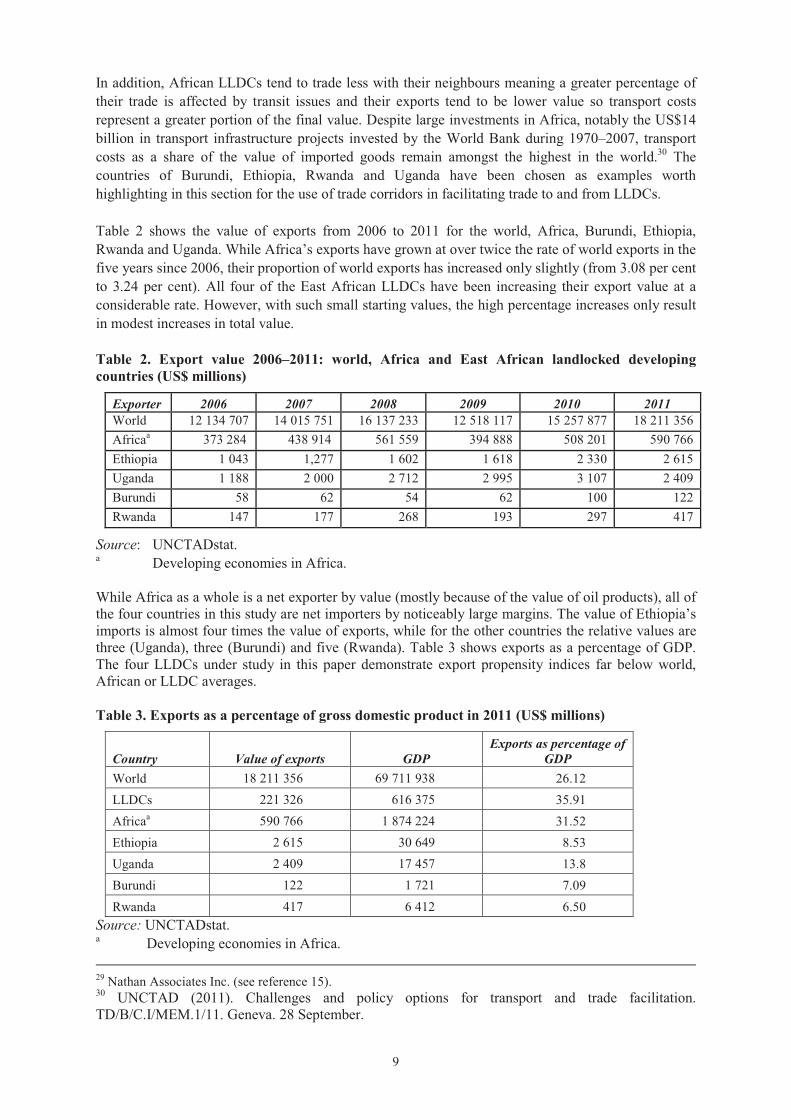
Table 2 shows the value of exports from 2006 to 2011 for the world, Africa, Burundi, Ethiopia, Rwanda and Uganda. While Africa’s exports have grown at over twice the rate of world exports in the five years since 2006, their proportion of world exports has increased only slightly (from 3.08 per cent to 3.24 per cent). All four of the East African LLDCs have been increasing their export value at a considerable rate. However, with such small starting values, the high percentage increases only result in modest increases in total value.
Table 2. Export value 2006–2011: world, Africa and East African landlocked developing countries (US$ millions)
Exporter 2006 2007 2008 2009 2010 2011 World 12 134 707 14 015 751 16 137 233 12 518 117 15 257 877 18 211 356 Africaa 373 284 438 914 561 559 394 888 508 201 590 766 Ethiopia 1 043 1,277 1 602 1 618 2 330 2 615 Uganda 1 188 2 000 2 712 2 995 3 107 2 409 Burundi 58 62 54 62 100 122 Rwanda 147 177 268 193 297 417
Source: UNCTADstat. a Developing economies in Africa.
While Africa as a whole is a net exporter by value (mostly because of the value of oil products), all of the four countries in this study are net importers by noticeably large margins. The value of Ethiopia’s imports is almost four times the value of exports, while for the other countries the relative values are three (Uganda), three (Burundi) and five (Rwanda). Table 3 shows exports as a percentage of GDP. The four LLDCs under study in this paper demonstrate export propensity indices far below world, African or LLDC averages.
Table 3. Exports as a percentage of gross domestic product in 2011 (US$ millions)
Country Value of exports GDP Exports as percentage of
GDP World 18 211 356 69 711 938 26.12 LLDCs 221 326 616 375 35.91 Africaa 590 766 1 874 224 31.52 Ethiopia 2 615 30 649 8.53 Uganda 2 409 17 457 13.8 Burundi 122 1 721 7.09 Rwanda 417 6 412 6.50
Source: UNCTADstat. a Developing economies in Africa. 29 Nathan Associates Inc. (see reference 15). 30 UNCTAD (2011). Challenges and policy options for transport and trade facilitation. TD/B/C.I/MEM.1/11. Geneva. 28 September.
10
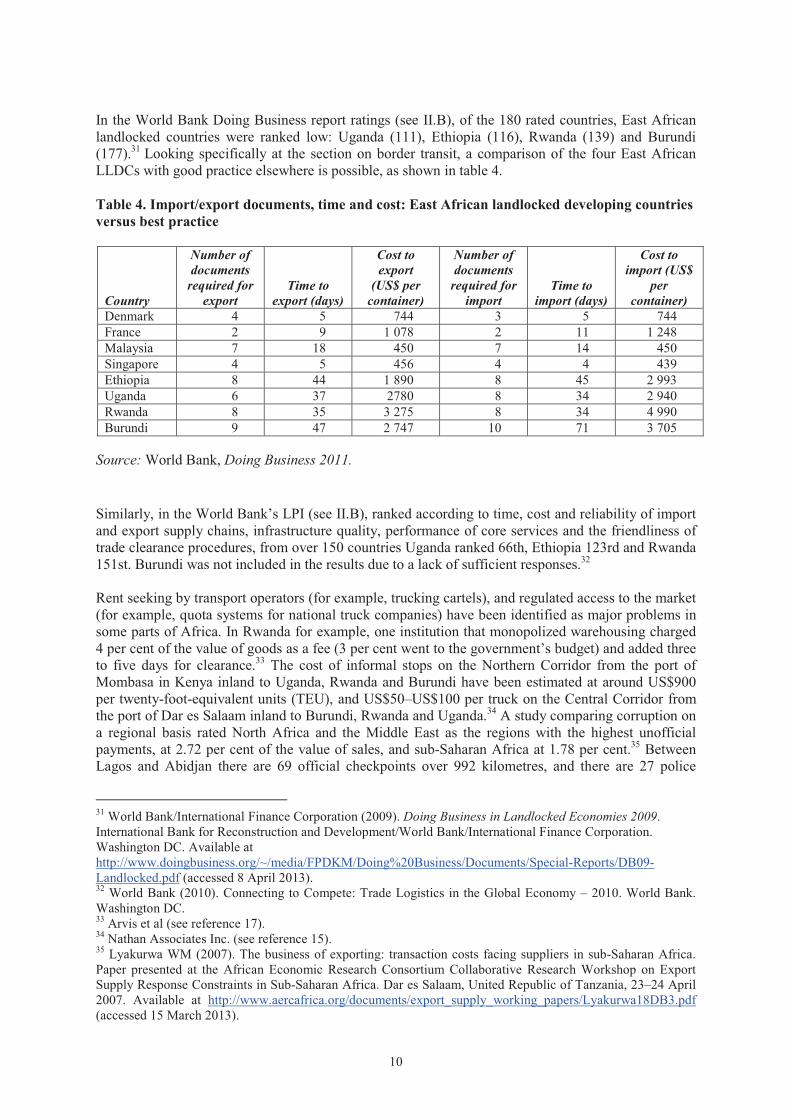
In the World Bank Doing Business report ratings (see II.B), of the 180 rated countries, East African landlocked countries were ranked low: Uganda (111), Ethiopia (116), Rwanda (139) and Burundi (177).31 Looking specifically at the section on border transit, a comparison of the four East African LLDCs with good practice elsewhere is possible, as shown in table 4.
Table 4. Import/export documents, time and cost: East African landlocked developing countries versus best practice
Country
Number of documents
required for export
Time to export (days)
Cost to export
(US$ per container)
Number of documents
required for import
Time to import (days)
Cost to import (US$
per container)
Denmark 4 5 744 3 5 744 France 2 9 1 078 2 11 1 248 Malaysia 7 18 450 7 14 450 Singapore 4 5 456 4 4 439 Ethiopia 8 44 1 890 8 45 2 993 Uganda 6 37 2780 8 34 2 940 Rwanda 8 35 3 275 8 34 4 990 Burundi 9 47 2 747 10 71 3 705
Source: World Bank, Doing Business 2011.
Similarly, in the World Bank’s LPI (see II.B), ranked according to time, cost and reliability of import and export supply chains, infrastructure quality, performance of core services and the friendliness of trade clearance procedures, from over 150 countries Uganda ranked 66th, Ethiopia 123rd and Rwanda 151st. Burundi was not included in the results due to a lack of sufficient responses.32
Rent seeking by transport operators (for example, trucking cartels), and regulated access to the market (for example, quota systems for national truck companies) have been identified as major problems in some parts of Africa. In Rwanda for example, one institution that monopolized warehousing charged 4 per cent of the value of goods as a fee (3 per cent went to the government’s budget) and added three to five days for clearance.33 The cost of informal stops on the Northern Corridor from the port of Mombasa in Kenya inland to Uganda, Rwanda and Burundi have been estimated at around US$900 per twenty-foot-equivalent units (TEU), and US$50–US$100 per truck on the Central Corridor from the port of Dar es Salaam inland to Burundi, Rwanda and Uganda.34 A study comparing corruption on a regional basis rated North Africa and the Middle East as the regions with the highest unofficial payments, at 2.72 per cent of the value of sales, and sub-Saharan Africa at 1.78 per cent.35 Between Lagos and Abidjan there are 69 official checkpoints over 992 kilometres, and there are 27 police
31 World Bank/International Finance Corporation (2009). Doing Business in Landlocked Economies 2009. International Bank for Reconstruction and Development/World Bank/International Finance Corporation. Washington DC. Available at http://www.doingbusiness.org/~/media/FPDKM/Doing%20Business/Documents/Special-Reports/DB09-Landlocked.pdf (accessed 8 April 2013). 32 World Bank (2010). Connecting to Compete: Trade Logistics in the Global Economy – 2010. World Bank. Washington DC. 33 Arvis et al (see reference 17). 34 Nathan Associates Inc. (see reference 15). 35 Lyakurwa WM (2007). The business of exporting: transaction costs facing suppliers in sub-Saharan Africa. Paper presented at the African Economic Research Consortium Collaborative Research Workshop on Export Supply Response Constraints in Sub-Saharan Africa. Dar es Salaam, United Republic of Tanzania, 23–24 April 2007. Available at http://www.aercafrica.org/documents/export_supply_working_papers/Lyakurwa18DB3.pdf(accessed 15 March 2013).
11
controls in 922 kilometres between the port of Mombasa in Kenya and the border with Uganda.36 The remedy adopted in many cases to build trust between the public and private sectors has been through ever more stringent security checks that have formalized costs but in some cases produced greater delays.
B. The port of Dar es Salaam and the Central Corridor
1. Port
The port of Dar es Salaam evolved from a small fishing village and trading centre to become the United Republic of Tanzania’s main port. Although the country has other ports, such as Tanga in the north, close to the border with Kenya, and in Lake Victoria to the west, around 95 per cent of the country’s international trade passes through Dar es Salaam. Dar es Salaam is also the main transit port for Burundi and Rwanda as well as a viable alternative for landlocked Uganda, Malawi, Zambia and the eastern part of the Democratic Republic of Congo. The port container terminal is operated under concession by the Tanzania International Container Services Company, in which global terminal operator Hutchison Port Holdings holds a majority of share.
In 2011 the port handled over 9 million tons including container throughput of 432,859 TEU. The main imports are vehicles, cement, fertilizer, cotton, iron and steel, foodstuffs, machinery and oil, while dominant exports are sisal, tea, cotton, oilseed, oil cake, timber, cashew nuts, tobacco, copper and coffee.
Imports at the port of Dar es Salaam account for 82 per cent of the total port throughput. Around 40 per cent of throughput is liquid bulk, 31 per cent containers, 19 per cent dry bulk and 10 per cent general cargo. Approximately 85 per cent of exports were containerized and 40 per cent of total traffic is transit traffic for other countries, however this is split into two corridors. The Central Corridor, heading west, which takes 36 per cent of the transit traffic, while 64 per cent goes on the Dar es Salaam Corridor south towards Zambia. As such, Zambia dominates the transit traffic at the port, accounting for 44 per cent, with 20 per cent for the Democratic Republic of the Congo, 11 per cent for Burundi, 9 per cent for Rwanda, 4 per cent for Malawi and 1 per cent for Uganda.
One of the major issues facing the port of Dar es Salaam in recent years has been congestion, one indicator of which is a high berth occupancy rate. In 2001 the average berth occupancy rate at the port container terminal was 43.5 per cent and in 2008 this figure had doubled to 87.3 per cent. The general cargo terminal experienced an increase in its berth occupancy rate from 33.4 per cent to 47.2 per centover the same period. In 2011 the average berth occupancy rates were 83 per cent at the container terminal and 43.3 per cent at the general cargo terminal.
A study on container import dwell times conducted by Tanzania Port Authority showed that domestic goods spent on average 26.6 days in port in 2001 against 8 in 2011.37 While this bodes well for domestic cargo, the situation for cargo destined to its landlocked neighbours has moved in the opposite direction. Dwell times for cargo destined for Zambia increased from 16.3 days in 2001 to 19.7 days in 2011. Burundi-destined cargo experienced a similar dwell time increase from 12.4 days to 16.3 days. Uganda container traffic experienced an increase from 11.2 days to 14.1 days. The largest increase over the period was for cargo destined to Malawi which had seen an average dwell time of 5.1 days in 2001 increase to 20.5 days in 2011. Containers destined for Rwanda remained about the same at 13 days in 2001 and 2011.
36 Ancharaz V, Kandiero T and Mlambo K (2010). The first Africa region review for EAC/COMESA. Working paper 109. African Development Bank Group. Tunis. Available at http://www.afdb.org/fileadmin/uploads/afdb/ Documents/Publications/WORKING%20109%20%20PDF%20d%2022.pdf (accessed 18 March 2013). 37 Brief on Dar es Salaam port by Tanzania Ports Authority, August 2009.
12
2. Rail
The port is served by two railway lines. One is a 1,000 millimetre-gauge track operated by Tanzania Railway Ltd. (a joint venture company owned 51 per cent by Rites of India and 49 per cent by the United Republic of Tanzania Government) and the other a 1,067 millimetre-gauge track operated by Tazara (Tanzania–Zambia Railway Authority). Rail assets are owned and managed by the government-owned company RAHCO. The following rail infrastructures are notable:
� The Tanzania Railway Ltd. line serves the Central Corridor and extends west from the port of Dar es Salaam to Tabora, where it branches north to Mwanza port on Lake Victoria, providing transportation services to the north and north-western parts of the country as well as landlocked Uganda.
� The Tanzania Railway Ltd. western route continues to Kigoma along Lake Tanganyika and provides freight cargo transportation to the western regions of the United Republic of Tanzania as well as the landlocked countries of Burundi, Rwanda and the eastern part of the Democratic Republic of the Congo.
� At present there is no rail connection to Burundi and Rwanda, but studies have been undertaken to determine the feasibility (see below). There is also a Tanzania Railway Ltd. northern route which connects Dar es Salaam port to Tanga port and then through Korogwe and Moshi to connect to the Kenyan railway system.
� The Tazara line, which serves the corridor of the same name, runs south-west from Dar es Salaam to the capital of Zambia, Lusaka. The different gauge of this line matches the Zambia Railways network which is in turn connected to Zimbabwe and South Africa. A trans-shipment station was built in 1998 at the break of gauge station of Kidatu, near Dar es Salaam.
Despite the existence of this significant rail infrastructure, rail transport remains underutilized. Acycle of low cargo volumes leads to underinvestment in infrastructure, which leads to its deterioration and a corresponding low utilization rate. While transport costs associated with using the railway are generally considered lower than that of road transportation, shippers prefer the more costly alternative as they consider it to be more reliable. In 2000, 333,398 tons of cargo passed through the port utilizing the rail network, compared to 1,089,128 tons via road. In 2008 the corresponding figures were 244,151 tons for rail and 1,980,404 tons for road. Thus rail usage declined by around 27 per cent while road transport increased by over 80 per cent.38
A closer examination of the use of railways in the United Republic of Tanzania reveals that over the period 2001–2008 cargo carried on the Tazara line (servicing traffic to and from Zambia to the port of Dar es Salaam) grew from 35,000 tons to 132,000 tons while for the Tanzania Railway Ltd. (service traffic along the Central Corridor to Burundi, Rwanda and Uganda) cargo dropped from 168,000 tons to 112,000 tons over the same period.
Reasons for the decline of Ugandan cargo seem mixed. Uganda has an alternative route to the sea through Kenya and recently took a stake in a concession to operate part of Kenya’s railway network.39
The decline of rail operations on the Central Corridor has been particularly disruptive to the trade of landlocked countries. The rail line previously carried almost all of the transit traffic to Burundi, Rwanda and eastern parts of the Democratic Republic of the Congo. Cargo now has to take longer and more expensive routes, either by road to Dar es Salaam or by road to Uganda and then rail to the port of Mombasa via the Northern Corridor. However, even though the Central Corridor to Dar es Salaam is shorter to destinations such as Kigali and Bujumbura, it is faster to ship via Mombasa because of its shorter dwell time.40
38 Brief on Dar es Salaam port by Tanzania Ports Authority, August 2009. 39 Rift Valley Railway is 51 per cent owned by Egyptian Citadel Capital via its Ambiance Ventures Subsidiary. The remaining stakes are held by Trans-Century Ltd. of Kenya (34 per cent) and Uganda’s Bomi Holding Ltd. (15 per cent). 40 Nathan Associates Inc. (see reference 15).
13
3. Road
The road corridor stretches from the port of Dar es Salaam inland through the United Republic of Tanzania, where it splits to enter Burundi at Kobero/Kabanga and Rwanda at Rusumo. The corridors continue to Bujumbura in Burundi and Goma in Rwanda. Investment in the road network has already been forthcoming, through the Central Corridor Road Project, which provided funding for the rehabilitation of 517 kilometres, construction of 527 kilometres and maintenance on a further 200 kilometres. However, an assessment conducted in 2010 found that 189 kilometres of the corridor require capacity upgrades even on a scenario without traffic growth. It was found that 732 kilometres of the corridor needed rehabilitation and 774 kilometres required upgrading from gravel to paved surface. 41
A recent study has compared costs and times for different options on the Central Corridor.42 As an indicative example, importing to Mwanza costs US$2,875 and takes 411 hours by rail, compared to US$2,629 and 362 hours by road. Exporting by rail from Mwanza costs US$3,481 and takes 517 hours versus US$3,028 and 396 hours by road.
In 1999 an inland container depot (ICD) was built at Isaka to serve western regions of the United Republic of Tanzania and the landlocked countries of Burundi and Rwanda, acting as an interchange between the rail line from Dar es Salaam and the road links to the Rwandan capital, Kigali and Bujumbura in Burundi. However, since the decline of rail infrastructure and thus traffic on this route, the site is no longer in use. A proposal is being developed to revive the Isaka ICD and a feasibility study has been funded by the World Bank.
In the United Republic of Tanzania, trucks are adapted to carry extra fuel tanks to ensure that there is enough fuel on board to drive to the border of their landlocked neighbours and return home without refuelling, a distance of around 2,500 kilometres. This means importers are not only paying to transport the cost of their goods but, if the truck returns with cargo, they are also paying the fuel costs for exporters to get their goods to market. If the truck returns empty, the importer is paying to transport fuel inland instead of by a dedicated national fuel distribution system. While the price of fuel may be cheaper at coastal cities, this practice of self fuel transportation is inefficient compared to the economies of scale national fuel distribution networks involving dedicated tanker trucks or pipelines can offer. The practice also reinforces the high price of inland fuel though low demand. Truck owners cite the actual or perceived poor fuel quality at inland locations as the main reason, plus a reluctance to entrust fuel money to the driver. Better national fuel distribution and payment systems could help reduce transport costs.
4. Inland container depots and customs clearance
In both Burundi and Rwanda, customs clearance is not performed at the border but inland. In Rwanda, state-owned company Magasins Generaux du Rwanda (Magerwa) runs four small ICDs in Kigali, but in 2008 a private company, SDV Transami Rwanda, was allowed to open one as well.43 In Burundi, customs clearance is performed at a small ICD in Bujumbura. The use of ICDs or dry ports and the operational aspects of customs clearance locations will be discussed in more detail in a later section of this paper.44
41 Results reported in Nathan Associates Inc. (see reference 15). 42 Nathan Associates Inc. (see reference 15). 43 World Cargo News (2008). Dry port for Rwanda. 23 November. http://www.worldcargonews.com/htm/w20081123.753218.htm (accessed 18 March 2013). 44 There is no universally accepted definition of a “dry port”. The term is generally used interchangeably with ICD and is sometimes used to highlight the landlocked nature of a country that does not have its own sea ports. The primary meaning of both terms is the extension of the bill of landing to an inland destination where customs clearance is performed. Thus, the ICD or dry port acts as a gateway port for the inland region. Overuse of the term in recent years has resulted in a multiplicity of understandings despite it being technically interchangeable with ICD (see UNCTAD, 1991, Handbook on the Operation and Management of Dry Ports, UNCTAD/RDP/LDC/7, Geneva), the term dry port tends to be used instead of ICD to refer to a larger site with
14
Transit along the Central Corridor was initially governed by bilateral agreements between the United Republic of Tanzania and the landlocked countries utilizing the corridor. However, in 2006 a multilateral agreement was signed by the United Republic of Tanzania, Uganda, Rwanda, Burundi and the Democratic Republic of the Congo, including the establishment of the Central Corridor Transit Transportation Facilitation Agency. The goals of this agency are to support planning for infrastructure development, improve efficiency for users, work to harmonize procedures and also to promote the corridor.
C. The port of Mombasa and the Northern Corridor
1. Port
The port of Mombasa has had a rich history as a strategic trading post for many centuries. It links the vast African interior through the fertile Rift Valley to other civilisations across the ocean. Today the port of Mombasa is Kenya’s second largest city and main gateway to international markets. It continues its importance of linking the hinterland to the sea by playing a significant role in the trade of landlocked countries, mostly Uganda and to some extent Rwanda and Burundi. The port has a total of 16 berths, five of which are for container ships. Containers are currently handled in the specialized container terminal as well as a conventional terminal. The specialized container terminal has 650 metres of berthing length at 10.2 metres depth, supported by four container gantry cranes and a container yard served by both rubber-tyred and rail-mounted gantry cranes. The conventional terminal has a total of 800 metres berthing length with three dedicated container berths, mostly used by Maersk. No cranes are used at this terminal; all container moves are done by geared ships. With a design capacity of 250,000 TEU, the port current container throughput (695,600 TEU in 2010) far exceeds its ability, leading to significant congestion and long dwell times. However due to land constraints, the current terminals have no room to expand. 45 Congestion has been eased recently by the use of near-port ICDs functioning as satellite terminals where containers can be moved by shuttle trucks immediately after being discharged from vessels. A recent consultancy report for the Kenyan government suggested another fast-track measure of converting general cargo berths to a container terminal under a “build-operate-transfer” contract with a private terminal operator.46
Crane productivity is low, at about 10 moves per hour. This is caused partly by the constrained and therefore highly congested container yard, with ship-to-shore (STS) cranes often having to wait for yard tractors.47 A recent study found that average dwell time at the port is 9 days for imports and 13 days for exports, however the average can be misleading, as import times exhibit a range of 3.0 to 15.1 days, while exports can spend anywhere between 5.0 and 35.1 days in the port. Berth occupancy in 2009 was around 90 per cent.48
Investment has already been committed for a new container terminal, which will have three berths totalling 900 metres. The first phase of the new terminal is expected to be operational in 2013–2014. The new terminal will be concessioned, which will introduce competition with the current container terminal operated by the Kenyan Ports Authority. A loan of US$239 million has been agreed from the Japan International Cooperation Agency to finance the work. The design capacity for the first stage of the terminal is 450,000 TEU and when fully completed will be able to accommodate 1.2 million TEU. many services offered such as storage, containerization and related logistics activities. It is therefore often used when a site is promoted by public bodies desiring economic benefits for their region through the establishment of such a site. While the transport mode is not an essential part of the definition, a high capacity mode is commonly assumed (most often rail but also inland navigation), as an integral aim of the site is to lower transport costs. Analysis is further complicated when sites are labelled incorrectly by operators, for instance short-range ICDs near the port of Mombasa are incorrectly called container freight stations by the port authority operating them. 45 Privatised Mombasa is a real possibility. Containerisation International, July 2011, p. 12. 46 Privatised Mombasa is a real possibility (see reference 45). 47 Nathan Associates Inc. (see reference 15). 48 Nathan Associates Inc. (see reference 15).
15
The entrance channel will also be dredged and the turning basin widened to accommodate vessels up to 4,600 TEU.
In 2011, the port of Mombasa handled 19.6 million tons of cargo, which included total containerized traffic of around 770,000 TEU, in addition to general cargo, dry bulk and liquid bulk. The port’s throughput has been growing at a rate of 8.8 per cent between the years of 2002 and 2009 and 12.5 per cent in 2011. Throughput at Mombasa is weighted heavily in favour of imports, which represent 87 per cent. Imports are divided into 39 per cent liquid bulk, 28 per cent dry bulk and 25 per cent containers, with 8 per cent general cargo making up the rest. Looking at general cargo, the main imports (greater than 10 per cent) are iron and steel, and cereals and grains, while the major exports are tea, coffee and soda ash. The major dry bulk imports are maize, clinker and wheat, while the vast majority of liquid bulk imports are the category of petroleum, oil and lubricants.49 Of this throughput, 4.98 million tons was transit cargo, 80 per cent for Uganda, with small amounts spread between other countries – Burundi, the Democratic Republic of the Congo, Rwanda, Somalia, Sudan and the United Republic of Tanzania.
2. Rail
The port is served by a railway line that runs from the port of Mombasa to Kasese in Uganda. The rail line is narrow gauge (one metre), compatible with the Tanzanian railway. The rail line runs from Mombasa to Nairobi, then to Nakuru where the line is split, with a spur running to Kisumu on the shores of Lake Victoria. The main line continues to cross the border at Malaba and then on to Kampala in Uganda. The line continues to Kasese near the Democratic Republic of the Congo border, but this line has been closed. A line also exists to the United Republic of Tanzania but has been closed. According to the Kenya Ports Authority, rail freight beyond the junction at Nakuru struggles to compete with road due to track conditions, therefore cargo is often transferred to trucks for the onward journey to Uganda and other locations.
Railways in Kenya and Uganda used to be state-owned corporations, however in 2005 Rift Valley Railways, a privately owned organization, was granted a 25-year concession to run the railway line across both countries. Due to years of underinvestment, rail traffic has declined considerably to a situation where rail currently takes only 6 to 7 per cent of the mode share of cargo throughput at the port of Mombasa.50 However, the new concessionaire Rift Valley Railways, owned 51 per cent by an Egyptian financial services group, has plans to invest US$290 million in the railway. Track repair has already commenced, although it is expected that additional funding will be required from the Kenyan and Ugandan governments, which own the infrastructure.51
In 2010, Kenya and Uganda signed a bilateral agreement for the development and joint operation of a new standard-gauge railway connecting Mombasa to Kampala, a distance of 2,300 kilometres. Kenya Railways and Uganda Railways identified consultants to undertake the preliminary design of the infrastructure, and the United Republic of Tanzania, Rwanda and Burundi agreed to develop the line in their own countries. Work began on the project in 2012 and is expected to be complete in 2013.
3. Road
Road access on the Northern Corridor extends from the port of Mombasa to Bujumbura in Burundi. It crosses the border with Uganda at Malaba (alongside the rail line), onwards to Kampala, and then enters Rwanda at Gatuna, then through Kigali, and crosses the border with Burundi at Akanyaru on the way to Bujumbura. An assessment conducted in 2010 evaluated the capacity and condition of this
49 Nathan Associates Inc. (see reference 15). 50Kenya Ports Authority handbook 2010–2011. Available at http://issuu.com/landmarine/docs/kenyaports_2010?mode=embed&layout=http%3A%2F%2Fskin.issuu.com%2Fv%2Fcolor%2Flayout.xml&backgroundColor=FFFFFF&showFlipBtn=true (accessed 19 March 2013). 51 Nathan Associates Inc. (see reference 15).
16
roadway.52 It found that 1,339 kilometres of the corridor require capacity upgrades even on a scenario without traffic growth; 864 kilometres of the corridor was in need of rehabilitation and 319 kilometres required upgrading from gravel to paved surface.
A recent study has compared costs and times for different options on the Northern Corridor.53
Importing goods to Nairobi costs US$1,867 and takes 316 hours by rail, compared to US$2,315 and 396 hours by road. Importing goods to Kampala costs US$2,991 and takes 462 hours by rail, versus US$3,019 and 323 hours by road. Transport of exports is more expensive than for imports and takes longer in all cases, except from Nairobi by road due to the reduction of 168 hours in the ICD that occurs when importing. Rail to Mombasa from Nairobi costs US$2,242 and takes 412 hours versus US$2,315 and 324 hours by road, while Kampala costs US$3,228 and takes 555 hours by rail against US$3,405 and 395 hours by road. The study also reconfirmed that the greatest proportion of total time for both import and export cargo along the Northern Corridor was spent at the port.
4. Inland container depots and customs clearance
Three ICDs exist in Kenya, all owned by Kenya Ports Authority. The most relevant site is Embakasi ICD at Nairobi. It has a size of 29 hectares, and while its theoretical container throughput capacity is given as 180,000 TEU, it handled 32,225 TEU in 2009. The other two sites are small. Eldoret ICD, 127 kilometres from the Ugandan border, was built in 1994 but is not currently in use. A recent consultant report for the Government of Kenya recommended that this ICD be transferred to private management.54 Kisumu ICD on the shore of Lake Victoria handled 2,000 TEU in 2009 against a design capacity of 15,000 TEU. Import containers that will be transported by rail are separated at the port after unloading from the ship, taken to the rail yard and then sent by rail to the ICD at Nairobi, where customs clearance is performed. A bill of landing directly to the ICD is possible, and as the port and the ICD are both owned by Kenya Ports Authority, the process is considered to be integrated and secure.
Ugandan customs can be cleared either at the border or at small ICDs in Kampala. However, a new facility named Tororo Dry Port is under consideration about 1 kilometre inside the border at Malaba. The 200-hectare site will cost US$120 million to develop. The site is owned and developed by Great Lakes Ports Ltd. of Kenya, which has plans for a US$50 million handling facility just outside the port of Mombasa, with the aim to pass all Uganda-bound imports from the port of Mombasa through this facility and then to the dry port, in order to facilitate a smoother process.55 The upgrading of the rail terminal in Kampala linking to Mombasa started in 2012.56 57
The Northern Corridor has benefited from the long existence of a corridor association for promotion and development. It began with bilateral agreements between the States, but in 1985 a multilateral agreement, entitled the Northern Corridor Transit Agreement and designed by UNCTAD, was signed by Kenya, Uganda, Rwanda and Burundi, with the Democratic Republic of the Congo joining in 1987. In addition to guaranteeing transit rights on the corridor, the agreement also aimed to harmonize documentation and procedures and promote the use of the corridor. For this purpose, the Northern Corridor Transit Transport Coordination Authority was established.
52 Nathan Associates Inc. (see reference 15). 53 Nathan Associates Inc. (see reference 15). 54 Privatised Mombasa is a real possibility. Containerisation International, July 2011, p. 12. 55 Oluoch F (2010). Tororo dry port to begin operations by 2012. The East African. 1 November. Available at http://www.theeastafrican.co.ke/business/-/2560/1043662/-/ce1umjz/-/index.html (accessed 20 March 2013). 56 Nathan Associates Inc. (see reference 15). 57 Kwesiga B (2012). RVR starts rehabilitation of Tororo-Pakwach railway line. Chimpreports. 1 December. Available at http://www.chimpreports.com/index.php/mobile/business/7196-rvr-starts-rehabilitation-of-tororo-pakwach-railway-line.html (accessed 19 March 2013).
17
D. The port of Djibouti and the Djibouti–Ethiopia Corridor
1. Port
Djibouti is situated on the Horn of Africa at the intersection of the Red Sea and the Gulf of Aden through which 12 miles of open water separate it from Yemen, in the Middle East. The port has served as a vital trade link between Africa and Asia for millennia. With the opening of the Suez Canal, it is located along the major East–West shipping lane and only at three days sailing time from Dubai, a major trans-shipment port in the region. In 2009, the port of Djibouti, now operated by DP World, opened a new facility called the Dorelah Container Terminal, which is separated from the old port by approximately 11 kilometres by road or 3 kilometres by sea. The new facility is four times larger than the previous facility with a capacity to handle 1.5 million TEU annually and includes a 1,000-metre berth, six quay cranes and has a water depth of 18 metres, which can accommodate the world’s largest container vessels. In 2010 the estimated port throughput was around 600,000 TEU. The Government of Djibouti plans to upgrade the port in two more phases so that annual capacity will increase to 2 million and 3 million TEU, respectively.
The port of Djibouti’s main customers are from Ethiopia, which ceded its coastline to the newly formed country of Eritrea in 1993, making Ethiopia landlocked. Ethiopia’s population of 90 million is about 120 times larger than that of Djibouti’s 750,000 people. In terms of area mass Ethiopia has approximately 1.1 million square kilometres and is about 47 times larger than Djibouti, which is around 23,000 square kilometres, giving Ethiopia an average population density twice that of Djibouti and second only to Nigeria in sub-Saharan Africa. Ethiopia imports around 98 per cent of its goods through the port of Djibouti and this means Ethiopian traders comprise around 85 per cent of the customers for the port by volume. In 2008, Ethiopia imported goods worth Br 76.6 billion (US$5.7 billion) and exported commodities worth Br 28.3 billion (US$2.1billion).58
Ethiopia is dependent upon the port of Djibouti as a transit port. A lack of a viable alternative has given rise to claims by Ethiopian traders of high port charges, reduced free time for imported cargo and inadequate storage facilities. These factors have a detrimental impact upon the price of import and export commodities and Ethiopia’s competitiveness in the global marketplace.59 A newly constructed container terminal at Dorelah is expected to achieve greater economies of scale which will lead to lower cargo handling fees on both local and transit cargo. Annually, it is estimated that Ethiopian traders pay over US$700 million in port fees each year.60 This represents about 16 per cent of the total imports and is a significant drain on financial resources. In addition, in 2008 the port of Djibouti reduced the free storage of transit cargo from 15 to 8 days. This had the effect of increasing storage costs to importers by around US$20 per day for a forty-foot equivalent unit (FEU). Due to occasional food shortages in Ethiopia and a lack of available vehicles, the government has at times prioritized the use of trucks for carrying aid and fertilizer thus causing other goods to be stored in costly warehouses and contributing to their cost to the consumer. Port delays due to a lack of unloading facilities for bulk cargo are also hampering the situation.
The role of containerization facilities is of great significance to LLDCs. In Ethiopia during 2009 a total of 124,000 TEU were imported and 33,000 TEU (full) exported.61 Therefore, for every one container exported full approximately 3 are shipped empty. Often with LLDCs this is because of an imbalance of trade. However, in Ethiopia there are many exports but these are first driven to the port
58Capital Ethiopia (2009). More dry ports a must. 30 November. Available at http://www.capitalethiopia.com/index.php?view=article&id=11850%3Amore-dry-ports-a-must&option=com_content&Itemid=4 (accessed 22 August 2011). 59 Sisay D (2009). Ethiopian economy highly affected by Djibouti port tariffs. Afrik-News. 25 November. Available at http://en.afrik.com/article16538.html (accessed 21 March 2013). 60 Deresse A (2009). Dry port at Mojo to start operations in a few weeks. Addis Fortune. 4 June. Available at http://www.addisfortune.com/Dry%20Port%20at%20Mojo%20to%20Start%20Operations%20in%20Few%20Weeks.htm (accessed 22 August 2011). 61 Kunaka C (2011). Dry ports and trade logistics in Africa. In: Bergqvist R, Cullinane KPB and Wilmsmeier G, eds. Dry Ports: A Global Perspective. Ashgate. London.
18
of Djibouti by truck where they may wait up to nine days for an available container before being exported.62 The result is that full trucks compete with empty container trucks for road space (along 918 kilometres) thereby increasing congestion (both on the roads and within the port), pollution and costs. The main reason cited for this practice is the demurrage charges levied by the shipping lines upon containers. These are charges by container owners (sometimes the shipping line) for not being able to use their containers for other cargo. To avoid these charges importers return their containers swiftly to the port rather than wait for any prospective return cargo. Better use of ICDs could help to reduce this problem.
In 2010 concern mounted between the Governments of Djibouti and Ethiopia over the container “stuffing” at the port of Djibouti. Annually some 135,000 containers are stuffed or unstuffed, this being done previously by mainly Ethiopian freight forwarders. Under new regulations the activity has been awarded to the Maersk Djibouti Container Freight Station in apparent contradiction to the 2002 Ethiopian–Djibouti port agreement on providing notification of price and regulatory changes at the port. Pressure for an alternative port to Djibouti is increasing.63
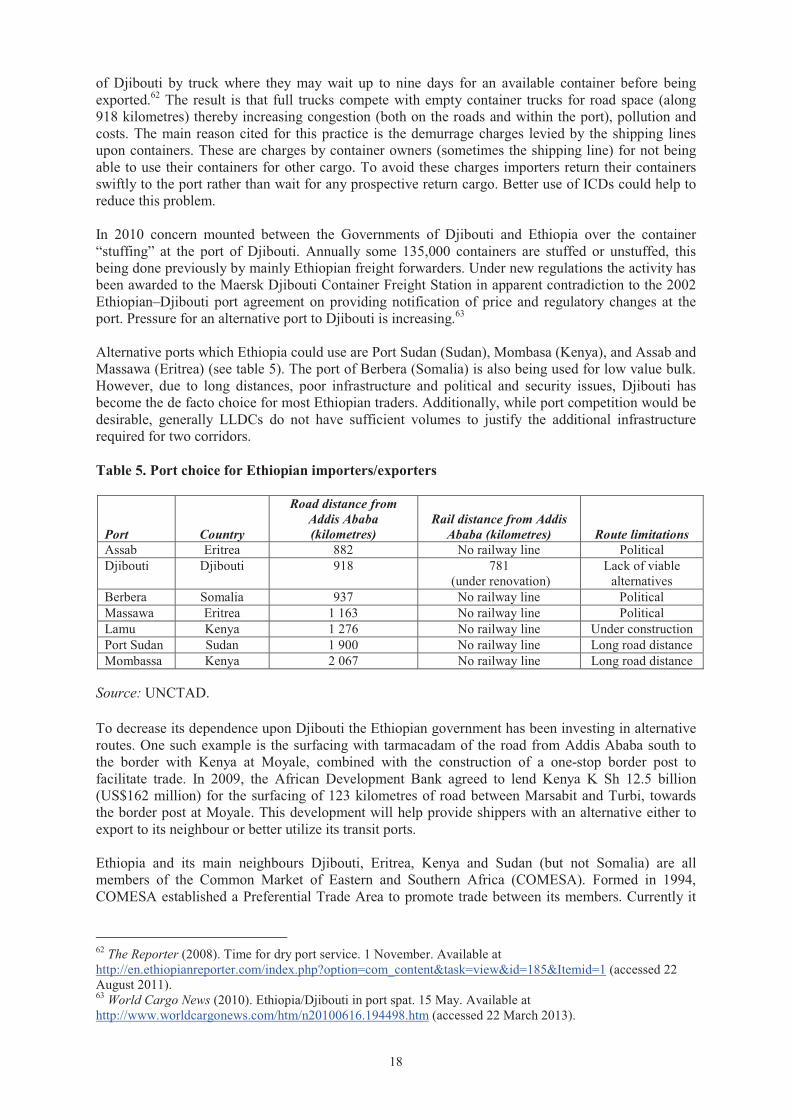
Alternative ports which Ethiopia could use are Port Sudan (Sudan), Mombasa (Kenya), and Assab and Massawa (Eritrea) (see table 5). The port of Berbera (Somalia) is also being used for low value bulk. However, due to long distances, poor infrastructure and political and security issues, Djibouti has become the de facto choice for most Ethiopian traders. Additionally, while port competition would be desirable, generally LLDCs do not have sufficient volumes to justify the additional infrastructure required for two corridors.
Table 5. Port choice for Ethiopian importers/exporters
Port Country
Road distance from Addis Ababa (kilometres)
Rail distance from Addis Ababa (kilometres) Route limitations
Assab Eritrea 882 No railway line Political Djibouti Djibouti 918 781
(under renovation) Lack of viable
alternatives Berbera Somalia 937 No railway line Political Massawa Eritrea 1 163 No railway line Political Lamu Kenya 1 276 No railway line Under constructionPort Sudan Sudan 1 900 No railway line Long road distance Mombassa Kenya 2 067 No railway line Long road distance
Source: UNCTAD.
To decrease its dependence upon Djibouti the Ethiopian government has been investing in alternative routes. One such example is the surfacing with tarmacadam of the road from Addis Ababa south to the border with Kenya at Moyale, combined with the construction of a one-stop border post to facilitate trade. In 2009, the African Development Bank agreed to lend Kenya K Sh 12.5 billion (US$162 million) for the surfacing of 123 kilometres of road between Marsabit and Turbi, towards the border post at Moyale. This development will help provide shippers with an alternative either to export to its neighbour or better utilize its transit ports.
Ethiopia and its main neighbours Djibouti, Eritrea, Kenya and Sudan (but not Somalia) are all members of the Common Market of Eastern and Southern Africa (COMESA). Formed in 1994, COMESA established a Preferential Trade Area to promote trade between its members. Currently it
62 The Reporter (2008). Time for dry port service. 1 November. Available at http://en.ethiopianreporter.com/index.php?option=com_content&task=view&id=185&Itemid=1 (accessed 22 August 2011). 63 World Cargo News (2010). Ethiopia/Djibouti in port spat. 15 May. Available at http://www.worldcargonews.com/htm/n20100616.194498.htm (accessed 22 March 2013).
19
consists of an area of 12.8 million square kilometres with a population of 406 million and a per capita GDP of US$1,811. The secretariat for the African Union is also based in Addis Ababa, Ethiopia.
Despite being landlocked, Ethiopia has it own national maritime fleet, Ethiopian Shipping Lines (ESL), which has a fleet of seven vessels consisting of multipurpose, ro/ro, general cargo and bulk geared vessels built in the 1980s, plus two geared vessels built in 2007. Geared vessels, which have their own cranes for loading and unloading, offer the opportunity for the fleet to call at smaller ports where the port infrastructure may be underdeveloped. The sacrifice for this flexibility comes in terms of carrying capacity. The space occupied by the on-board cranes means less cargo can be carried and thus reduced economies of scale are present. The new Dorelah Container Terminal port development at Djibouti is equipped with modern post-panamax cranes capable of serving the largest container vessels afloat. This means that the ESL fleet is not utilizing the full benefit of the Dorelah Container Terminal with its geared vessels. This factor seemed to have prompted ESL to ask the management of the port of Djibouti, DP World, for dedicated access to two berths at the old Djibouti port.64 However, despite Ethiopia representing around 85 per cent of Djibouti port traffic, the request was rejected as DP World wanted to confine all its container operations to the new Dorelah Container Terminal.
The prospects of ESL seem to be a choice between either upgrading its fleet to suit the Dorelah Container Terminal, or utilizing other ports where its fleet has an advantage. The problems with the first option are the cost and the long-term commitment to using Dorelah Container Terminal. Upgrading to these larger ships will help reinforce Ethiopia’s dependence on Djibouti as a transit port, something the government is keen to avoid. The problem with the second option is that economies of scale cannot be fully achieved and thus shippers using ESL ships will incur higher transport costs than those using services provided by other liner companies. The number of viable alternative ports to ply the vessels is also very limited (see table 5). Although the option of deploying the fleet elsewhere does exist, it brings into serious question the need for a national fleet. To manage these and other issues the Ethiopian Government in 2008 established a Maritime Affairs Authority reporting to the Ministry of Transport and Communications (the old Sea Transport Authority was closed after Ethiopia became landlocked).
2. Rail
Ethiopia has only one railroad, a narrow-gauge track that connects the capital Addis Ababa with the port of Djibouti, a distance of 781 kilometres with a vertical elevation rising to 2,300 metres above sea level. Ethiopian industrial centres are located along the railway line at Dire Dawa, Awash, Metehara, Mojo, Debre Zeit, Akaki, and Addis Ababa. The maximum slope reaches a gradient of 3 per cent and there are 79 curves with a radius smaller than 200 metres which seriously limits the carrying capacity of the trains.65 The railway is jointly owned by the governments of Ethiopia and Djibouti, with approximately 681 kilometres lying within Ethiopia and 100 kilometres within Djibouti. However, there are currently no rail services between Djibouti and Addis Ababa – the railway line is functional only as far as Dire Dawa (approximately half way between these two cities). Selective rehabilitation works courtesy of a €40 million European Union grant starting in 2007, but more funding would be required to upgrade the line in its entirety. Due to the present rail limitations 95 per cent of cargo from Djibouti to Addis Ababa is transported via road, a journey which takes about two days and, at 918 kilometres, is 136 kilometres longer than via rail. Rail traffic in 2007 was 250,000 tons per annum but it has been estimated that with an upgraded rail line the operations could
64 Adis Fortune (2009). DP World Djibouti rejects ESL request for dedicated berth. 6 July. Available at http://www.addisfortune.com/DP%20World%20Djibouti%20Rejects%20ESL%20Request%20for%20Dedicated%20Berth.htm (accessed 22 August 2011). 65 Louis Berger SA, Afroconsult (2003). Pre-feasibility study of the regional transport sector in the Berbera corridor. European Commission – Delegation of the European Commission in Kenya. http://eeas.europa.eu/delegations/somalia/documents/more_info/berbera_corridor_pre_feasibilitystudy_executivesummary_en.pdf (accessed 22 March 2013).
20
expect to transport 1.5 million tons annually.66 Economic analysis of road and rail costs, which cater for the assumption that 80 per cent of trucks return empty from Addis Ababa to Djibouti, reveal that transportation by truck costs US$42.8 per ton. Estimates of rail cost per ton range from US$35.6 to US$15.3 after a complete upgrade.67 The upgraded railway will still be narrow gauge (1,000 millimetre) and thus restrict cargo volumes that can be carried as well as compatibly with other railway systems.
Plans have since been announced to build a new national rail network based on standard gauge (1,435 millimetre), encompassing some 5,000 kilometres of track which would also join in the north to Port Sudan, thus reducing the dependence on the port of Djibouti.68 In the south a rail connection to the Kenyan port of Lamu is also planned. The Ethiopian government has been involved in negotiations with the governments of China and India to obtain loans and engineering expertise for the numerous projects that will make up the envisaged network.69
3. Road
The Ethiopian road transport network accounts for 90–95 per cent of interurban freight and passenger movements.70 The Ethiopian Government has given a high priority to road infrastructure development. For example, in 2005 government expenditure for roads was 11.2 per cent, compared to 4.8 per cent for health and 4.5 per cent for water and sanitation.71 During the period 1991 to 2009, almost 29,000 kilometres of new roads were constructed, bringing the total network to around 46,000 kilometres. This is expected to grow to 136,000 kilometres by 2015 under an ambitious five-year road building plan.72
In late 2011, a US$743 million road development loan financed by the African Development Bank was signed to improve links with neighbouring Kenya.73 The Mombasa–Nairobi–Addis Ababa Road Corridor Project is one such project financed by the Bank which aims to rehabilitate 198 kilometres ofbituminous road from Hawassa to Ageremariam (including the construction of bridges, execution of drainage structures, and road side amenities) on the Ethiopian side to the border of Kenya.74
4. Inland container depots and customs clearance
Unlike the Northern and Central Corridors discussed above, the Djibouti–Ethiopia corridor does not have a corridor institutional body. The governments of Ethiopia and Djibouti have signed bilateral agreements guaranteeing transit access, and any issues are dealt with on the basis of ad hoc bilateral committees.75
66 Infrastructure Consortium for Africa (2007). Briefing memorandum: the Djibouti–Ethiopia Railway. Available at http://www.icafrica.org/fileadmin/documents/Transport_Meeting/S4-Djibouti-Ethiopia_Railway-Final-EN.pdf (accessed 22 March 2013). 67 Infrastructure Consortium for Africa (see reference 66). 68 Blunt E (2009). Ethiopia looks to revive past railway glories. BBC News. 22 June. http://news.bbc.co.uk/2/hi/8110012.stm (accessed 22 March 2013). 69 Munford M (2010). India’s complacency leads to Chinese takeover of huge Ethiopian rail project. The Telegraph. 21 June. Available at http://blogs.telegraph.co.uk/news/montymunford1/100044214/india%E2%80%99s-complacency-leads-to-chinese-takeover-of-huge-ethiopian-rail-project/ (accessed 22 March 2013). 70 Worku I (2011). Road sector development and economic growth in Ethiopia. Ethiopian Development Research Institute working paper 004. September. Available at http://www.edri-eth.org/Documents/EDRI_WP004_RoadSector.pdf (accessed 22 March 2013). 71 See http://ifrtd.gn.apc.org/en/regions/country_pages/Ethiopia.php (accessed 22 March 2013). 72 See http://www.sudantribune.com/spip.php?article36043 (accessed 22 March 2013). 73 See http://www.sudantribune.com/Ethiopia-Kenya-sign-743-million,40678 (accessed 22 March 2013). 74 See http://www.afdb.org/fileadmin/uploads/afdb/Documents/Project-and-Operations/Kenya-Ethiopia%20-%20AR%20Road%20III%20Project.pdf (accessed 22 March 2013). 75 Ntamutumba C (2010). Study for the establishment of a permanent regional corridor development working group in the Port Management Association of Eastern and Southern Africa (PMAESA) region. PMAESA. Available at
21
Until recently, Ethiopian cargo was cleared directly at the port of Djibouti by Ethiopian customs, requiring no further inspections afterwards. While the absence of road blocks en route is advantageous, a potential downside for shippers is that customs fees must be paid when the cargo clears the port rather than when it arrives at the final destination.76 Added inconvenience and cost arise from the need to travel to the port to solve any issues, such as paying fees rather than face losing the cargo altogether.77 However, this situation is undergoing a transition due to the development of ICDs by the Ethiopian Government.
In recent years Ethiopia has established two new dry ports, one at Semera near Djibouti (550 kilometres to the east of Addis Ababa) to cater for cargo moving to the north of the country, which opened in 2009, and another at Mojo (73 kilometres east of Addis Ababa) for cargo moving to the south and west, which opened in 2008. A feasibility study recommended that the country needs additional facilities to deal with its containerized imports and new dry ports are being planned at Dire Dawa, Jijiga, Bahir Dar, and Woreta. Both dry ports were financed by the Ethiopian government, through Ethiopian Dry Ports Enterprise, a public company established in 2007 to develop and manage the dry ports. The dry port at Mojo was built with a capacity of 28,280 containers, but is in the process of being expanded to a capacity of 110,373 containers annually. In 2009, it handled 9,568 containers.78 With the advent of the Mojo dry port, rather than customs clearance being done at the port of Djibouti, Ethiopian Customs will process the cargo for transit. The cargo can then proceed to Mojo where final clearance is performed.
E. Lessons learned
The three corridors considered in this report share some similarities: (a) They are served by a single major port that accounts for over 90 per cent of the host transit
country’s imports and exports; (b) LLDCs also rely heavily upon the ports, which serve the largest share of their overseas trade; (c) Import volumes are far greater than export volumes; (d) Rail connections are poor, albeit with improvement plans underway; (e) There is overreliance upon road transport and no inland waterway connection to the ports.
IV. HARMONIZE PROCEDURES AND REGULATIONS
All countries in the East African Community (EAC) (Burundi, Kenya, Rwanda, Uganda and the United Republic of Tanzania) have agreed to implement an authorized economic operator (AEO) system, based on World Customs Organization (WCO) standards, with mutual recognition of this qualification amongst all member States. The countries of the EAC are working with the WCO in a project sponsored by the Swedish International Development and Cooperation Agency. The Japan International Cooperation Agency has been providing training to customs officials in Uganda, and an accreditation system has been developed there but not yet implemented. Rwanda has begun implementation of a fast-track system for compliant operators.79
The EAC countries are working towards developing harmonized transit and customs procedures, however this still needs to be implemented in practice. While progress has been made on harmonizing customs documents, each country still requires its own documentation. Additionally, while electronic
http://www.trademarksa.org/sites/default/files/publications/Establishing%20a%20Permanent%20Regional%20Corridor%20Development%20Working%20Group%20in%20the%20PMEASA%20Region.pdf (accessed 22 March 2013). 76 Ntamutumba (see reference 75). 77 The Reporter (see reference 62). 78 Gebreselassie G (2011). Dry ports enterprise buys 48 million Br equipment. All Africa. 27 June. Available at http://allafrica.com/stories/201106281059.html (accessed 22 March 2013). 79 Nathan Associates Inc. (see reference 15).
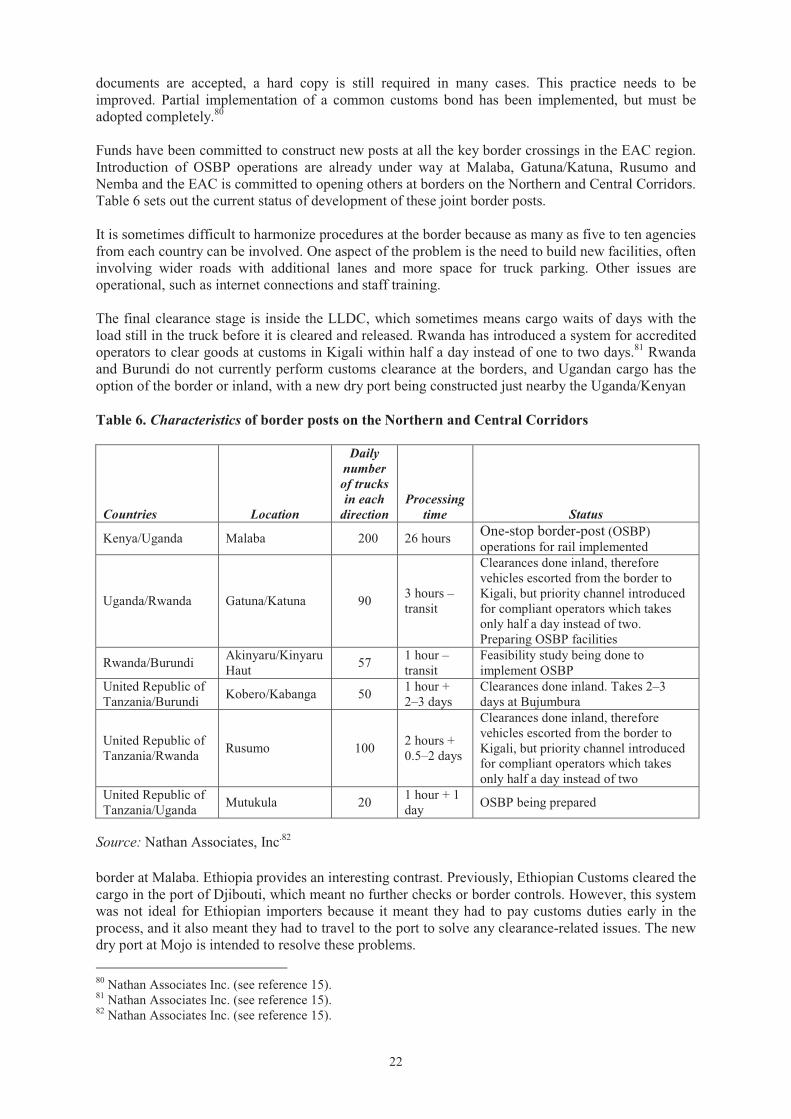
22
documents are accepted, a hard copy is still required in many cases. This practice needs to be improved. Partial implementation of a common customs bond has been implemented, but must be adopted completely.80
Funds have been committed to construct new posts at all the key border crossings in the EAC region. Introduction of OSBP operations are already under way at Malaba, Gatuna/Katuna, Rusumo and Nemba and the EAC is committed to opening others at borders on the Northern and Central Corridors. Table 6 sets out the current status of development of these joint border posts.
It is sometimes difficult to harmonize procedures at the border because as many as five to ten agencies from each country can be involved. One aspect of the problem is the need to build new facilities, often involving wider roads with additional lanes and more space for truck parking. Other issues are operational, such as internet connections and staff training.
The final clearance stage is inside the LLDC, which sometimes means cargo waits of days with the load still in the truck before it is cleared and released. Rwanda has introduced a system for accredited operators to clear goods at customs in Kigali within half a day instead of one to two days.81 Rwanda and Burundi do not currently perform customs clearance at the borders, and Ugandan cargo has the option of the border or inland, with a new dry port being constructed just nearby the Uganda/Kenyan
Table 6. Characteristics of border posts on the Northern and Central Corridors
Countries Location
Daily number of trucks in each
direction Processing
time Status
Kenya/Uganda Malaba 200 26 hours One-stop border-post (OSBP) operations for rail implemented
Uganda/Rwanda Gatuna/Katuna 90 3 hours – transit
Clearances done inland, therefore vehicles escorted from the border to Kigali, but priority channel introduced for compliant operators which takes only half a day instead of two. Preparing OSBP facilities
Rwanda/Burundi Akinyaru/Kinyaru Haut 57 1 hour –
transit Feasibility study being done to implement OSBP
United Republic of Tanzania/Burundi Kobero/Kabanga 50 1 hour +
2–3 days Clearances done inland. Takes 2–3 days at Bujumbura
United Republic of Tanzania/Rwanda Rusumo 100 2 hours +
0.5–2 days
Clearances done inland, therefore vehicles escorted from the border to Kigali, but priority channel introduced for compliant operators which takes only half a day instead of two
United Republic of Tanzania/Uganda Mutukula 20 1 hour + 1
day OSBP being prepared
Source: Nathan Associates, Inc.82
border at Malaba. Ethiopia provides an interesting contrast. Previously, Ethiopian Customs cleared the cargo in the port of Djibouti, which meant no further checks or border controls. However, this system was not ideal for Ethiopian importers because it meant they had to pay customs duties early in the process, and it also meant they had to travel to the port to solve any clearance-related issues. The new dry port at Mojo is intended to resolve these problems. 80 Nathan Associates Inc. (see reference 15). 81 Nathan Associates Inc. (see reference 15). 82 Nathan Associates Inc. (see reference 15).
23
In July 2008, member States of the EAC agreed to harmonize limits on axle and gross vehicle weight, as well as a new administrative regime for decriminalizing overloading. However, member States have not introduced legislation to implement these agreed changes in their respective countries. Given the difficulties in implementing such agreements in other regions of the world, including the most developed ones, this fact is perhaps not surprising.
As well as the actual axle load regulations, a major source of delay is checking actual compliance of the established limits, either through official weighbridges or other unofficial check stops. There are nine weighbridges in the United Republic of Tanzania, nine in Kenya, four in Uganda, and none in either Rwanda or Burundi. Checking compliance is still based on 100 per cent inspection rates rather than a trust-based system with authorized operators, which would produce a level of self-regulation. In an ideal situation, trucks would only be weighed at the port and the final clearance location. It has been suggested that the transit regime “is conceived as a chain of control rather than the freedom of transit given to compliant operators in exchange of guarantees”.83 This excessive checking and security applies to all, irrespective of their reliability or track record. An AEO-type system would improve this situation, whereby trusted operators are given a fast-track system.
Unlike the Djibouti–Ethiopia corridor, in both Kenya and the United Republic of Tanzania, road hauliers can only be licensed either for domestic or transit traffic. It would nevertheless seem more efficient to seek a reduction of empty returns and better asset utilization by allowing triangulation of traffic routes. However, it must be recognized that this is a complex issue in terms of interests of national industries and those of governments wanting to protect these industries. It has also been noted that while a deregulated market access has been positive in many respects, a lack of accompanying qualitative regulation has reduced quality.84 These issues are also related to the progress towards a customs union within the EAC, as removing the customs controls internal to the EAC and opening transport services markets would allow transport industries to operate more efficiently in wider and larger market bases and would lead to better transport management avoiding unnecessary breaks in the transport chain.
A. Develop consolidation centres
The three corridor studies above show that dry ports and intermodal terminals are only part of the solution aimed at reducing the problems experienced by shippers of transit cargo. Such facilities need to be evaluated on a case-by-case basis, according to the transport and supply chain functions required in each location. Small consolidation centres are required to consolidate less-than-a-container loads into full-container loads, which then feed into larger intermodal terminals for high-capacity rail lines to ports. Using key intermodal nodes as ICDs to perform customs clearance is ideal, as rail transport can address many of the transit issues and risks created by road transport.
Potential sites could include Isaka and Mwanza in the United Republic of Tanzania, Nairobi and Eldoret in Kenya, and Tororo and Kampala in Uganda, with onward road connections to smaller road-based ICDs with consolidation and containerization services in Rwanda and Burundi. These locations could, in theory, underpin a functioning system in which the attributes of each mode are harnessed to suit each leg of the transport chain, but in order to develop these benefits, small sites built to support local markets are required, developing over time into a system of tiered nodes integrated into a supply chain. Logistics capacity needs to be developed in the region so that transport services are aligned with the requirements of the industry.
B. Build operational arrangements
An issue that deserves close attention is the relationship between an LLDC and its transit neighbour. Good neighbourly relations are paramount to increasing trade. To some extent the negotiating position
83 Arvis et al (see reference 17, p.14). 84 Nathan Associates Inc. (see reference 15).
24
of LLDCs to influence change may dependent upon the amount of trade. For example, depending on the prevailing political situation, up to around 75 per cent of the trade of Burkina Faso and Mali transits through Abidjan (Côte d’Ivoire), yet this figure represents only 10 per cent of total traffic at the port. Similarly, almost 90 per cent of the international trade of Burundi, Rwanda, and Uganda is handled by the port of Mombasa, but combined this represents not more than 15 per cent of the port’s traffic. The majority of Nepal’s foreign trade transits through only one port (Kolkata) and shippers are therefore "captive" customers.85
A strong bargaining position should be obtainable at 10 per cent or 15 per cent, for it shows trade is possible and could grow significantly if encouraged. Furthermore, it could be argued that transit cargo subsidizes the infrastructure investment costs of the transit country, which benefits domestic and transit cargo, that is to say, a win–win outcome. However, at the macro level, low trade volumes limit the bargaining power of LLDC governments to negotiate special treatment of their cargo with their transit neighbours. This is evident in the United Republic of Tanzania, where the state railway corporation charges 30 per cent more for a Rwanda-bound transit container which travels the 990 kilometres from Dar es Salaam to Isaka than for a domestic container travelling 1,230 kilometres on the same railway line from Dar es Salaam to Mwanza.86 At the microlevel, LLDC shippers tend to have small scale business, making bargaining with global logistics providers futile. Shipping companies are able to charge more to call at transit ports and governments are likely to be unable to obtain other compensatory treatment that could partially offset the cost. Moreover, given the high volume of imports vis-á-vis exports, containers tend to be returned empty and costs are often transferred to the importing party (usually the LLDC shipper). This could explain why, for example, in the case of similar products, it costs twice the price to import goods from Côte d’Ivoire to the East Coast of the United States than it does to import goods to the West Coast of the United States from Japan (both countries are equidistant from the United States).87 Because trade between the United States of America and Japan is more balanced, importers and exporters share more equally the costs of providing liner services. When trade is unbalanced one party (usually the importers) subsidizes the other (usually the exporter). In the example used, goods from the United States would appear to be more popular in Côte d’Ivoire than vice versa.
In contrast, LLDCs with large volumes should be in a position of leverage vis-á-vis transit countries. Shippers in these LLDCs should be able to improve their competitiveness by securing preferential treatment for their cargo in transit countries which could result in increased volumes, economies of scale and improved overall predictability of cargo arrivals. This would benefit both the transit country and the landlocked country through increased economies of scale. For example, trade for Zimbabwe is an important revenue generator for transit ports in both Mozambique and South Africa. Transit cargo through the port of Djibouti is larger than domestic trade and should place Ethiopia at an advantageous bargaining position, but evidence found during this research shows that this is not in fact the situation.
V. RECOMMENDED COURSES OF ACTION
Key areas for action to improve the overall operation of a transit corridor include: (a) the development of institutional capacity to jointly manage intermodal operations; (b) making the most efficient use of existing infrastructure or developing new transport nodes; (c) increasing the reliability and predictability of costs and times through trust-building measures between public regulators and private operators.
85 Malakar SB (2009). Presentation to the UNCTAD Ad Hoc Expert Meeting on Transit Ports Servicing Landlocked Developing Countries, 11 December 2009. 86 Data collected from the Northern Corridor Transit Transport Coordination Authority and the Tanzania Railways Corporation, 2005, as reported in Arvis et al (see reference 17). 87 Hummels D and Skiba A (2002). A virtuous circle? Regional tariff liberalization and scale economies in transport. Purdue University, West Lafayette.
25
A. Reliance and cooperation
One of the major disadvantages LLDCs face is that they are dependent on the transport networks of neighbouring transit countries and have very little influence over the transit transport mode, route, price or management. In order to control the operation of a system it usually helps to own it. In the business sector companies attempt to control their suppliers of goods or services through ownership. Ownership, however, is not a means to achieve other goals (for example, to improve trade competiveness or reduce transport costs). Ownership can be replaced with trust and still offer the same benefits such as reliability and predictability. The transport chain can involve numerous stakeholders from the public sector (for example, agriculture or fisheries quality control, phytosanitary control and customs) and the private sector (for example, banks, insurance, customs brokers, shipping companies, port authorities, terminal operators and the like), as well as the exporters and importers themselves. The actors involved in the transport chain have varied and sometimes conflicting interests. Government agencies monitor trade to collect duties, control cargo quotas and ensure safety measures; private companies, on the other hand, tend to focus on the turnaround of the goods and wish to see cargo moved as quickly as possible. Customs duties and sales taxes levied on imports are still a major source of revenue for many developing countries that may lack the ability to raise taxes elsewhere. Goods arriving at a border can be easily detained until the revenue is forthcoming and the apprehension about losing revenue in transit countries is still a major obstacle to easing the movement of goods to and from neighbouring LLDCs.
Active interference in the passage of LLDC cargo by transit countries is rare, and transit countries are legally mandated by existing international instruments to allow passage. However, coastal countries have two key reasons to take an increased interest in regional or bilateral transit arrangements. First, LLDCs may themselves become important transit countries when coastal countries want to trade by land with other countries in the region. Second, efficient transit regimes may help the transit country’s own transport service providers and, above all, their ports by generating additional business. It can reduce the coastal country’s international transport costs due to economies of scale and it can improve transport connectivity because the extra traffic volumes will help to attract additional shipping services. This concentration of demand can underpin growth in logistics capacity, which can in turn support local industry related to processing and value-added services for transit cargo, with a related benefit of attracting foreign investment into the country. Coastal transit countries and LLDCs must thus recognize their interdependency and share a mutual interest.
To obtain efficient and effective transport services at a reasonable cost, cooperation among all stakeholders both sides of the border is more important. Indeed, building institutional capacity through the strengthening of corridor management structures is widely believed to increase levels of stakeholder involvement in helping to resolve problems and overcome obstacles through commonly agreed and designed solutions. Bringing numerous stakeholders together across a large distance involving many countries remains a complex process that can limit the ability to harmonize key operational aspects or attract infrastructure investment in the corridor. Many transit corridors in Africa have already been branded and developed formal institutional arrangements to promote the development of the corridor and bring stakeholders together to improve the operational performance of the transport system, including infrastructure upgrading requirements.
Institutional arrangements relating to transit corridors in Africa have similar rationales for their establishment, namely to facilitate dialogue between stakeholders and harmonize transit procedures in order to increase corridor performance, among other aspects, through lower transit times and cost for users. However, different arrangements exist, such as treaties, multilateral agreements, memoranda of understanding, constitutions and company registration. Management partnerships including business mergers, joint ventures or exclusive contracts exist in the private sector. All three corridors considered here have international transit agreements in place, governing transit rights for traffic to LLDCs. The Northern Corridor (Mombasa) and Central Corridor (Dar es Salaam) also have corridor associations with stakeholder management groups to resolve operational issues, whereas the Djibouti–Ethiopia corridor does not. The latter corridor is governed by a committee of experts and an interministerial committee, solving issues on a case-by-case basis through ad hoc
26
committees. The Djibouti–Ethiopia corridor could benefit from a more permanent institutional arrangement, particularly as it has been noted that Ethiopian shippers feel that they are disadvantaged by the port of Djibouti.
Most transit agreements focus on the cross-border movement of goods, vehicles and drivers (sometimes also passengers and baggage) and come under variations of the title of “transit or cross-border road (rail, and the like) transport agreements”. They are based on the concept of “freedom of transit” introducing notions of reciprocity, national treatment and the control of transit traffic. Some of them deal exclusively with pure transit issues and leave the technicalities of transport questions to be dealt with in separate annexes, protocols or documents. Transit possibilities, including routes and corridors or modes of transport, are often described in great detail, especially in bilateral transit agreements. Specific descriptions can deal with points of entry, points of exit, and transit routes and corridors (rail and road).
Bilateral or regional transit agreements may not necessarily be limited to issues concerning international transit of goods; they may also cover aspects of inward and outward transit, in the context of bilateral trade. They may further cover aspects that go beyond the transit of goods and, for example, encompass issues related to infrastructure, transport services, and the movement of vehicles, transport units and drivers or crew through a territory. In this context, transit touches upon documentary and procedural matters at border crossings, upon requirements that ensure the smooth mobility of vehicles, drivers, and cargo, and upon the availability, quality and safety of infrastructure.
B. Critical mass
It has been suggested that transport costs for LLDCs in Africa should not be much more than for transit countries, but the prices charged to users are higher for a variety of reasons, such as inefficient market structure, rent seeking and other detrimental practices, including inefficiency of individuals,overregulation and corruption. Rent seeking by transport operators (for example, trucking cartels), and regulated access to the market (for example, quota systems for national truck companies) have been identified as major problems in some parts of Africa.
An increasing share of global trade consists of manufactured goods and components that are being used within globalized production processes. High transport costs and long delivery times for imports lead to higher production costs of final goods; in other words, these high transport costs will greatly affect choices made by high import content, assembly-type industries regarding the locations of their production sites. This means that LLDCs are less likely to attract investments, whether national or foreign, to develop manufacturing, trading or distribution industries.
Physical infrastructure performance remains the basis for any corridor, but many operational considerations affect the economic viability, such as the availability of logistics services, management of rolling stock and location of demand in relation to key nodes in the transport chain. Consolidation and massification of flows is required to provide large cargo volumes and achieve economies of scale in transport on key corridors, but without guaranteed demand in place it can be difficult to attract private investment.
The locations, size and handling equipment of freight terminals should be adapted to a functioning system in which the attributes of each mode are harnessed to suit each leg of the transport chain. Small sites built to support local markets are required, developing over time into a system of tiered nodes integrated into a supply chain. Logistics capacity needs to be developed at the regional level so that transport services are aligned with the requirements of the industry. Traders with low volumes are unable to achieve economies of scale. As a result, in general small trade economies pay higher transport costs as trucks run empty or less than fully loaded, and trade remains unable to take advantage of other transport systems such as inland waterways or rail transport.
Poor access to export finance, credit and insurance industries can result in excessive operational and transaction costs in developing countries. Small shippers can face difficulties when raising cash
27
deposits for customs bonds and then endure long delays in waiting for the bonds to be released due to inefficient administrative procedures. One consequence of this is that shippers may be unable to purchase more stock until the bonds are released, thereby effectively putting a stop to their business. The long term consequence of this can lead to fewer shippers, thereby reducing competition and increasing the cost to the consumer. Shippers in developed nations have been able to resolve such problems through more advanced finance systems and accredited operator programmes introduced by the customs authorities. Additional currency risk relates to having to purchase services in another country because such services are not available in the landlocked country, such as container stuffing or destuffing at the transit port rather than the inland origin or destination.
Attracting finance for infrastructure development or productive investments can be a difficulty for many LLDCs. There are only a few international lenders that are capable of financing, for example, the building of a railway line, an inland freight station or a seaport terminal. These lenders’ main area of business tends to be involved in utilizing the raw commodity rather than finance per se. The ability to offer an all-encompassing package can look very attractive to developing countries compared to the alternative of organizing matters separately or receiving no revenue at all. However, the limited number of companies providing an all-encompassing service can strengthen these buyers’ position in driving down the price they pay to LLDCs for their goods. In addition, investors often want exclusivity over any concession for decades to help guarantee profitability.
Furthermore, even when some issues such as port congestion may require immediate investment to remedy, finance is rarely a solution in itself. The raising of sufficient revenue for sustainable maintenance, with the associated proper cost recovery schemes, technological know-how and managerial skills, needs to be addressed and secured. Policies advocating infrastructure development through private concessions are often sustainable where the private sector can generate a regular profit. The implementation of policies relating to regulation and transit procedures creates more complex needs and preconditions in terms of enabling environment and technical and institutional capacities conducive to effective operations.
C. Operational needs and tailored arrangements
Improving the reliability and predictability of transit time and cost in a given transport corridor can be more important than reducing transport charges. Securing frequency of transport services allows for better planning and organization of resources. This will lead to lower inventory holdings which will achieve greater savings than a small reduction in transit time. Importers within developing countries often maintain high inventory levels – entailing high storage costs – to compensate for the unpredictability in arrival times of goods. Supermarket chains in developing countries generally maintain inventories of three months or more.
The AEO concept based on WCO standards enables a fast-track system for compliant operators. Such a concept operating on a regional basis could provide significant benefits for all members by streaming operations. Such a scheme also has the advantage of encouraging compliance through competition rather than penalization.
Some of the above proposed actions may become ideal precursors to a functioning transit regime that would, if fully implemented, result in lower costs and time for transit cargo, and increased reliability and predictability, allowing a lighter regulatory regime in future. The aim is to contribute towards a changing culture that encourages confidence in shippers, producing a virtuous cycle that rewards compliant behaviour, builds trust and attracts investment.