Embed Size (px)
Citation preview
Journal of Surface Analysis Vol.17, No. 1 (2010) pp. 2−14 K. Endo et al. Theoretical Mass Spectra of PE, PP, PS and PET Polymers by QMD Methods Using the Model Molecules
Paper
Theoretical Mass Spectra of PE, PP, PS and PET Polymers by QMD Methods Using the Model Molecules
Kazunaka Endo,a Koichiro Hayashi,b Tomonori Ida,b Daisuke Matsumoto,b Nobuhiko Katoc
aCenter of Colloid and Interface Science, Research Institute for Science and Technology, Tokyo University of Science (Private address: Kamitakatsu-shinmachi 2-25, Tsuchiura-city 300-0819, Japan)
bDepartment of Chemistry (Faculty of Science), Graduate School of Natural Science and Technology, Kanazawa University, Kanazawa 920-1192, Japan
cApplied Physics, Seikei University, Musashino-city, Tokyo 180-8633, Japan [email protected]
(Received: February 24, 2010; Accepted: May 10, 2010)
We used a quantum molecular dynamics {QMD (MD with MO)} due to the force function of MO
with the velocity Verlet algorithm using the model oligomers of PE, PP, PS, and PET polymers to obtain theoretical mass spectra of the polymers. The QMD calculation was performed in the thermal energy range of 0.69 ∼ 0.95 eV, and the sampling position data by a time step of 0.5 fs were performed up to 5000 steps. The fragments at the final step of 60 trajectories in the QMD were obtained as positive, negative, and neutral charged ones from the net atomic charge analysis at geometry-optimization of the MO SCF calculations. We can compare the positive ion fragments of polymer models with the experimental distribution of polymers in mass spectra and secondary ionization mass spectra after a few tens of keV of primary heavy metal ion bombardment. We also showed the chemical structures of fragments for PE, PP, PS, and PET polymers in positive ion spectra, unavailable from experimental methods.
1. Introduction Polyethylene (PE), polypropylene (PP), polystyrene
(PS), and polyethylene terephthalate (PET) are thermoplastic polymers used in a wide variety of applications, including packaging, textiles. Although PET waste is mostly recycled, another plastic polymers end up in landfills, and in incinerations, which result in many environmental problems. In a few decades, few scientists have been interested in efficient recovery of material waste and energy such upgrading methods as the thermal decomposition and gasification. For materializing such methods, we need fundamental investigations to understand the thermal decomposition mechanism of the polymers, in order especially to obtain microscopic pictures in the process.
Molecular dynamics (MD) and quantum molecular dynamics [QMD (MD with MO or DFT method)] computer simulations have become powerful tools to obtain quantities that can be directly compared with
experimental results as well as yield microscopic pictures about the reaction mechanisms. Some advanced MD approach with empirical force fields [1-5] has been quite successful in providing quantitative agreement with high-energy particle bombardment of organic film adsorbed on a metal substrate [6-9], and the bombardment of a polyethylene crystal [10]. Another MD method with reactive force fields [11-15] developed to simulate chemical reactions in large atomic and molecular systems, and to model thermally-induced chemical transformations in large molecules in condensed phases [16-20], and thermal decomposition reactions in polymers [21, 22].
On the other hand, we obtained the solution of motion equations automatically by QMD method, because the potential functions can be determined from the MO or DFT calculations. In the QMD calculations [23-26], by considering the main assumption for the cleavage of chemical bonds of organic substances as the thermal
Copyright (c) 2010 by The Surface Analysis Society of Japan
-2-
Journal of Surface Analysis Vol.17, No. 1 (2010) pp. 2−14 K. Endo et al. Theoretical Mass Spectra of PE, PP, PS and PET Polymers by QMD Methods Using the Model Molecules
decomposition process after the heavy metal ion bombardment in secondary ionization mass spectra (SIMS), we compared the calculated fragments to the atomic mass unit of polymers with the experimental results of SIMS.
In the present study, we demonstrate theoretical mass spectra of the (PE, PP, PS, PET) polymers as an ultimate work calculated by the QMD using the model oligomers under the main assumption of the thermal decomposition process corresponding to the thermal sputtering one (as a process of sputtering) proposed by Sigmund [27]. In the QMD calculation, we are able to visualize decomposition, reiterative recombination with a hydrogen atom, and cross-linking of fragments through the animation of the thermal decomposition process. From the atomic charge analysis in the QMD final step output for 60 trajectories, the fragment distribution was obtained as {(98.1, 0.9, 1.0%), (93.0, 1.9, 5.1 %), (93.0, 2.6, 4.4 %), and (87.8, 5.2, 7.0%)} for neutral, positive, and negative charged fragments of PE, PP, PS, and PET oligomer models, respectively. 2. Computational Methods
For our QMD calculation, we used the velocity Verlet algorithm [28] for the integration of equation of motion with time step of 0.5 fs. The potential energy is given from the interatomic force function as the differential calculus of the potential energy by quantum chemical calculation. The force function is evaluated automatically from the Hartree-Fock SCF MO calculations of model molecules. The thermal decomposition of model oligomers was simulated by using the velocity scaling method [29, 30] with the temperature control method [31].
In our MO calculations, we tested to use ab initio method [32] with 6-31G** basis and semiempirical AM1 method [33] of decamer {H-(CH2CH2)10-H} model at the ground state for the simulation of PE model decomposition. Thus, we concluded to perform the MD calculation with AM1 method, since the computational time of QMD with the AM1 method is much shorter in the time range of 10-2 order than that with the ab initio MO method. In our QMD calculation, we adopted 5000 molecular dynamics (MD) step as the maximum, as referred to the thermal decomposition MD calculations [21, 22]. In our calculation, we need to perform the
calculation time of 6.9 hours for the (AM1) MOSCF calculation of 5 s and MD calculation of 5000 steps (for 1 trajectory).
The thermal decomposition of PE, PP, PS, and PET polymers has been simulated using the model molecules {H-(CH2CH2)10-H, H-(CH2-CH(CH3))8-H, H-(CH2CH(C6H5))6-H, and H-{CH2CH2-O(CO)-(C6H4)-(CO)O}4-H} by QMD using the AM1 method at the ground state. The sampling position data was carried out up to 2.5 ps (5000 MD step) with a time step of 0.5 fs (The 1 MD step is a motion of the model molecule with time of 0.5 fs). The theoretical positive, negative, and neutral charged fragment distributions to the atomic mass unit for the polymer model were estimated from the net atomic charge analysis of the fragments at the geometry-optimization of n times SCF MO calculations at the 5000 MD step for total 60 trajectories. We adopted the positive and negative ions of more than ± 0.05 as the threshold of both charge values. For neutral charge fragments, we considered single molecule as the threshold. The calculated distribution of the decomposed fragments to the atomic mass unit may be compared with the experimental results due to the thermal decomposition gas mass spectrometry (MS). In the case of the polymer thermal sputtering process after bombardments of primary heavy metal ion with a few tens keV kinetic energy in TOF-SIMS, cleavage of polymer bonds on the outer most surface is assumed as an example due to thermally decomposed reactions. Thus we are able to compare the calculated positive- or negative-ion fragment spectra of the polymer model with the experimental ones in the TOF-SIMS. 3. Results and Discussion
The aim of this article is to describe possibility of our QMD simulation. The one is to visualize decomposition, reiterative recombination with a hydrogen atom, and cross-linking of fragments sputtered from the outer most surface layer of polymers in the thermal sputtering process after the heavy metal ion bombardment in SIMS. The other is that the calculated fragments of polymer models from the atomic charge analysis almost correspond to the experimental results of polymers in the SIMS.
In mass spectrometry, several investigators [34-36]
-3-
Journal of Surface Analysis Vol.17, No. 1 (2010) pp. 2−14 K. Endo et al. Theoretical Mass Spectra of PE, PP, PS and PET Polymers by QMD Methods Using the Model Molecules
-4-
already described the model of desorption-ionization (DI) processes for organic molecules, and the detailed example and discussion was indicated by Lenaerts and co-workers [37]. Fast thermal processes are assumed to be responsible for generating primarily neutrals in the selvedge. Electrons and protons that are also present in the selvedge give rise to, respectively, electron ionization (EI) and adduct ionization (AI) of these neutrals. The radical molecular ions are believed to produce the majority of the fragments, according to the rules of EI mass spectrometry of organic molecules (cleavages, rearrangements, and so on). On the other hand, we assumed that, in simplified emission process of a fragment ion from a solid polymer surface, an impact cascade and excited area are created around the point of primary particle impact through energy and momentum transfer from the bombarding particle to the solid polymer, when a polymer sample is bombarded by a source of heavy metal ions of a few tens of keV of kinetic energy. The neutral molecular species on the outer most surface layer are considered to be cleaved in thermal sputtering process through thermal diffusion due to the impact cascade and excited area in solid polymer. Thus, neutral, positive, and negative charged fragment species are emitted, if a sufficient amount of energy is transferred. Here we can consider that the results of the polymer dissociation correspond to the thermal decomposition in the mass spectrometry. a) Thermal decomposed process
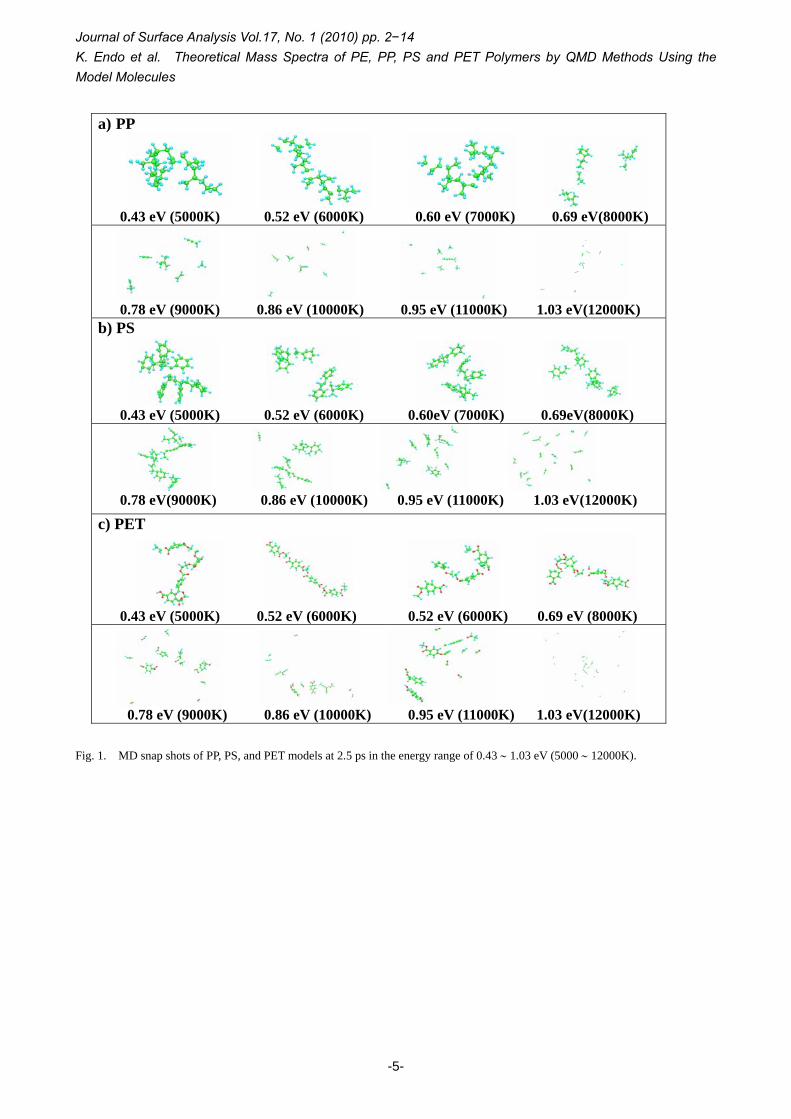
It is very interesting that we are able to visualize decomposition, reiterative recombination with a hydrogen atom, and cross-linking of fragments through the animation in the QMD calculation, unavailable from experimental methods. We examined energy-dependency for thermal decomposition of polymers to obtain the optimum energy ranges at the maximum 5000 step. Fig. 1 showed the MD snap shots of PP, PS, and PET models at 2.5 ps (the finial step) in the energy control range of 0.43 ∼ 1.03 eV (5000 ∼ 12000 K), and similar result of PE was omitted. It can be seen from the results that smaller fragments increase with sampling MD data of larger temperature control. Thus, we found out in the range of 0.69 ∼ 0.86 eV (8000 ∼ 10000 K) for (PE, PP), and 0.78 ∼ 0.95 eV (9000 ∼ 11000 K) for (PS, PET)
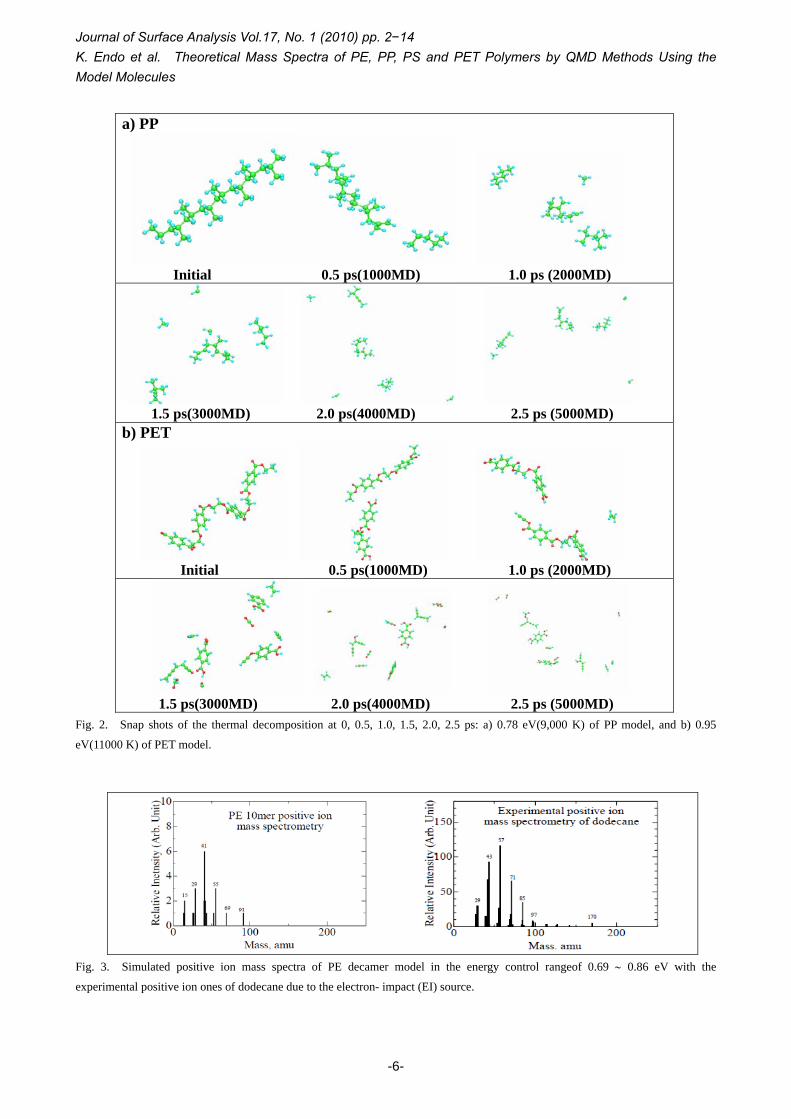
polymers, respectively, as the optimum energy ranges of the decomposed fragments by considering the normal distribution of 13 (or 14) ∼ 200 atomic mass unit for each polymer model. Fig. 2 indicates two examples for the snap shots of the thermal decomposition at 0, 0.5, 1.0, 1.5, 2.0, and 2.5 ps with 0.78 eV (9,000 K), and 0.95 eV (11000 K) energy controls of PP, and PET models, respectively.
For an example of PP snap shots ( a) PP in the figure) under the total thermal energy control of 0.78 eV, the model molecule C24H50 at initial state decomposes into C19H38 and C5H12 at 0.5 ps, and cleaved fragments (CH4, C5H12, C7H16, C11H18) at 1.0 ps seem to determine such fragments in the following MD steps. In the MD step of 1.5ps, the fragmentation becomes (2CH2, CH4, C5H12, C6H14, and C10H16), and at 2, and 2.5 ps, the fragments (2CH2, CH4, C5H12, C6H10, and C10H16) occur only through four deprotonations of C6H14. In some animations up to 5000 MD (2.5 ps), we could confirm decomposition, reiterative recombination with a hydrogen atom, and cross-linking of fragments, although we didn’t show the detailed figure. In other total energy control of 0.69 and 0.86 eV, we can see in Fig. 1a) PP that smaller fragments increase with sampling MD data of larger temperature control, as described in explanation of Fig. 1.
In the case of PET snap shots ( b) PET in Fig. 2) under the total energy control of 0.95 eV, the initial molecule H-{CH2CH2O(CO)(C6H4)(CO)O}4-H cleaves two fragments {CH2CH2O(CO)(C6H4)(CO)O}2CH2CH2, HO(CO)(C6H4)(CO)OCH2CH2O(CO)(C6H4)(CO)OH} at 0.5 ps, and decomposes three components {CH2CH2, HO(CO)(C6H4)(CO)O-CH2CH2O-(CO)(C6H4)(CO)OH, HO(CO)(C6H4)(CO)O-CH2CH2O(CO)(C6H4)(CO)OCCH} except for H2 at 1.0 ps through deprotonation and recombination with a hydrogen atom, respectively. In the following MD steps (1.5, 2.0, 2.5 ps), the benzene ring decomposes one at 1.5 ps, two at 2.0 ps, and thus the fragments at 2.5 ps become {3CO, CO2, C2H2, CH2CH2, CH2CO, HCOOH, H2CCCCHCCH, HCCCH-C(OH)CCH, HO(CO)(C6H4)OCCH, HO(CO)(C6H4)-(CO)-OH}. For total energy control of 0.77, 0.86 and 0.95 eV, we calculated 20 trajectories every three energy controls in the QMD.
Journal of Surface Analysis Vol.17, No. 1 (2010) pp. 2−14 K. Endo et al. Theoretical Mass Spectra of PE, PP, PS and PET Polymers by QMD Methods Using the Model Molecules
a) PP
0.43 eV (5000K) 0.52 eV (6000K) 0.60 eV (7000K) 0.69 eV(8000K)
0.78 eV (9000K) 0.86 eV (10000K) 0.95 eV (11000K) 1.03 eV(12000K)
b) PS
0.43 eV (5000K) 0.52 eV (6000K) 0.60eV (7000K) 0.69eV(8000K)
0.78 eV(9000K) 0.86 eV (10000K) 0.95 eV (11000K) 1.03 eV(12000K)
c) PET
0.43 eV (5000K) 0.52 eV (6000K) 0.52 eV (6000K) 0.69 eV (8000K)
0.78 eV (9000K) 0.86 eV (10000K) 0.95 eV (11000K) 1.03 eV(12000K)
Fig. 1. MD snap shots of PP, PS, and PET models at 2.5 ps in the energy range of 0.43 ∼ 1.03 eV (5000 ∼ 12000K).
-5-
Journal of Surface Analysis Vol.17, No. 1 (2010) pp. 2−14 K. Endo et al. Theoretical Mass Spectra of PE, PP, PS and PET Polymers by QMD Methods Using the Model Molecules
-6-
a) PP
Initial 0.5 ps(1000MD) 1.0 ps (2000MD)
1.5 ps(3000MD) 2.0 ps(4000MD) 2.5 ps (5000MD)
b) PET
Initial 0.5 ps(1000MD) 1.0 ps (2000MD)
1.5 ps(3000MD) 2.0 ps(4000MD) 2.5 ps (5000MD)
Fig. 2. Snap shots of the thermal decomposition at 0, 0.5, 1.0, 1.5, 2.0, 2.5 ps: a) 0.78 eV(9,000 K) of PP model, and b) 0.95
eV(11000 K) of PET model.
Fig. 3. Simulated positive ion mass spectra of PE decamer model in the energy control rangeof 0.69 ∼ 0.86 eV with the
experimental positive ion ones of dodecane due to the electron- impact (EI) source.
Journal of Surface Analysis Vol.17, No. 1 (2010) pp. 2−14 K. Endo et al. Theoretical Mass Spectra of PE, PP, PS and PET Polymers by QMD Methods Using the Model Molecules
b) Fragmentation of polymers simulated by QMD calculations
One purpose of this study is to provide the theoretical mass spectra of polymers from the QMD calculation using the model oligomers, in order to predict the experimental ones. The fragments at the final step in the QMD were classified into positive, negative, and neutral charged ones from the atomic charge analysis at geometry-optimization of the MO SCF calculations. We, then, calculated all the fragments for (PE, PP), and (PS, PET) models in the energy ranges of (0.69 ∼ 0.86 eV), and (0.77 ∼ 0.95 eV), respectively, and thus obtained as
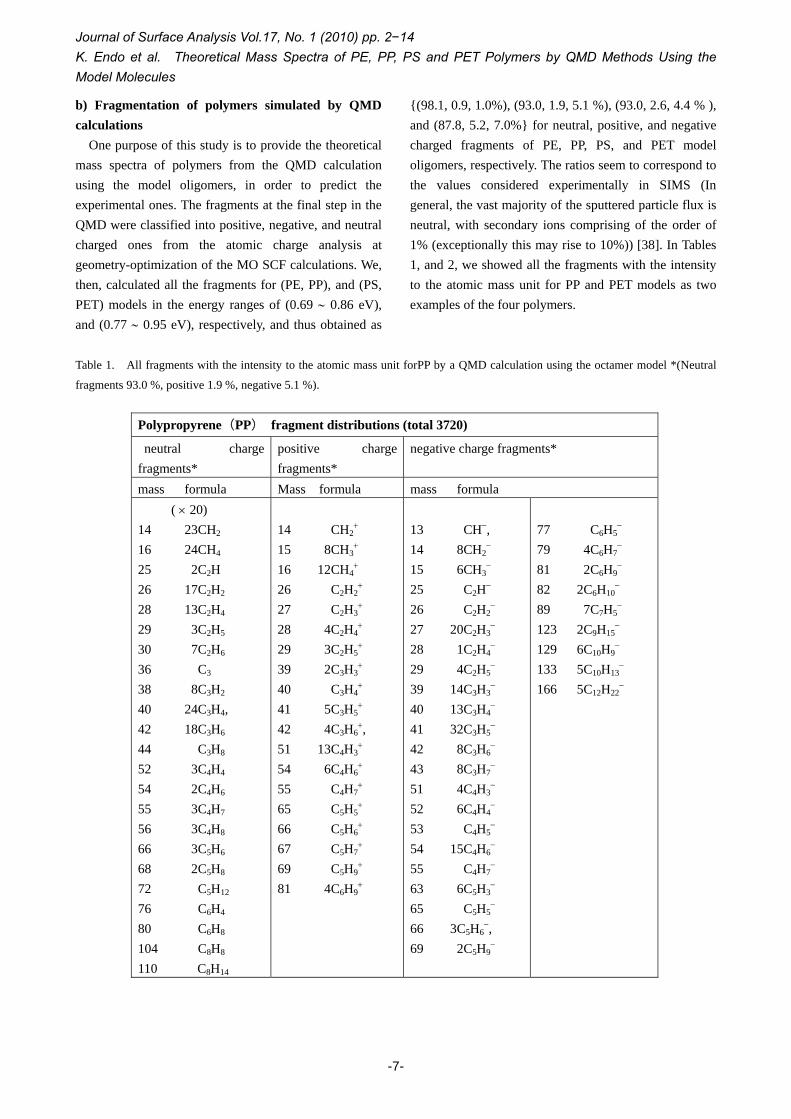
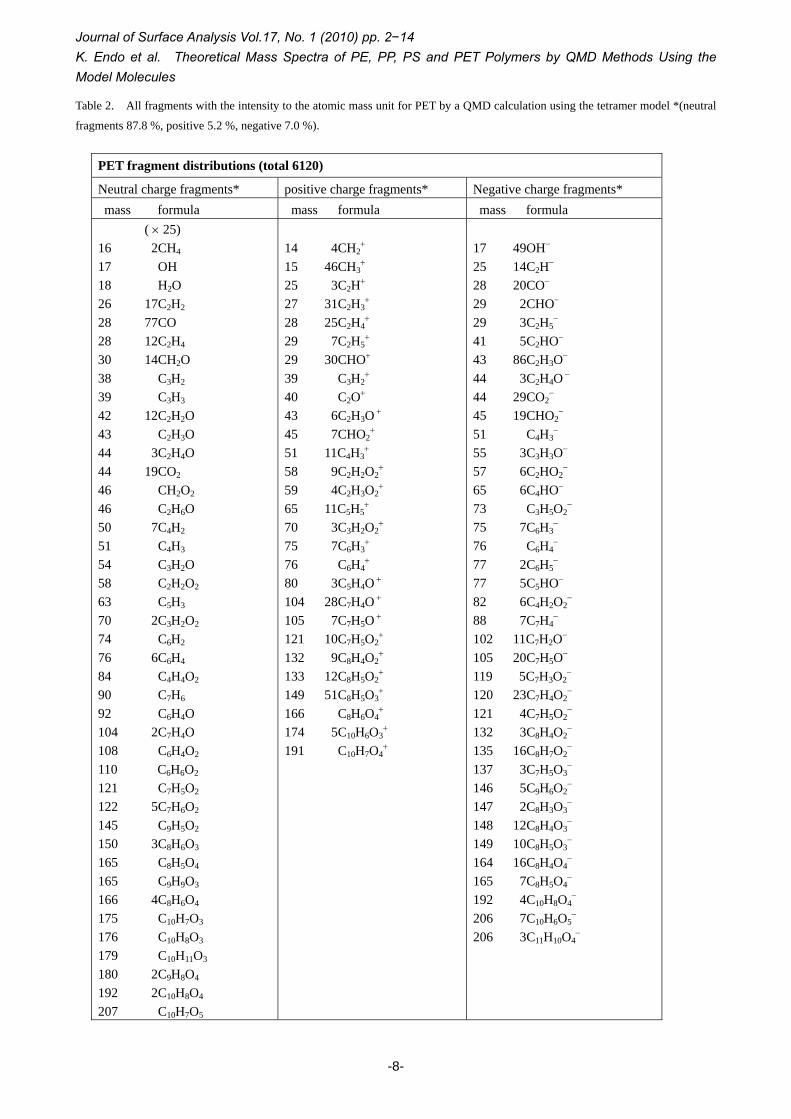
{(98.1, 0.9, 1.0%), (93.0, 1.9, 5.1 %), (93.0, 2.6, 4.4 % ), and (87.8, 5.2, 7.0%} for neutral, positive, and negative charged fragments of PE, PP, PS, and PET model oligomers, respectively. The ratios seem to correspond to the values considered experimentally in SIMS (In general, the vast majority of the sputtered particle flux is neutral, with secondary ions comprising of the order of 1% (exceptionally this may rise to 10%)) [38]. In Tables 1, and 2, we showed all the fragments with the intensity to the atomic mass unit for PP and PET models as two examples of the four polymers.
Table 1. All fragments with the intensity to the atomic mass unit forPP by a QMD calculation using the octamer model *(Neutral
fragments 93.0 %, positive 1.9 %, negative 5.1 %).
Polypropyrene(PP) fragment distributions (total 3720)
neutral charge fragments*
positive charge fragments*
negative charge fragments*
mass formula Mass formula mass formula ( × 20)
14 23CH2
16 24CH4 25 2C2H 26 17C2H2
28 13C2H4
29 3C2H5 30 7C2H6
36 C3
38 8C3H2
40 24C3H4, 42 18C3H6
44 C3H8
52 3C4H4 54 2C4H6
55 3C4H7 56 3C4H8
66 3C5H6
68 2C5H8
72 C5H12
76 C6H4 80 C6H8 104 C8H8 110 C8H14
14 CH2
+
15 8CH3+
16 12CH4+
26 C2H2+
27 C2H3+
28 4C2H4+
29 3C2H5+
39 2C3H3+
40 C3H4+
41 5C3H5+
42 4C3H6+,
51 13C4H3+
54 6C4H6+
55 C4H7+
65 C5H5+
66 C5H6+
67 C5H7+
69 C5H9+
81 4C6H9+
13 CH−, 14 8CH2
− 15 6CH3
− 25 C2H− 26 C2H2
− 27 20C2H3
− 28 1C2H4
− 29 4C2H5
−
39 14C3H3−
40 13C3H4−
41 32C3H5−
42 8C3H6−
43 8C3H7−
51 4C4H3−
52 6C4H4−
53 C4H5−
54 15C4H6−
55 C4H7−
63 6C5H3−
65 C5H5−
66 3C5H6−,
69 2C5H9−
77 C6H5
− 79 4C6H7
−
81 2C6H9−
82 2C6H10−
89 7C7H5−
123 2C9H15−
129 6C10H9−
133 5C10H13−
166 5C12H22−
-7-
Journal of Surface Analysis Vol.17, No. 1 (2010) pp. 2−14 K. Endo et al. Theoretical Mass Spectra of PE, PP, PS and PET Polymers by QMD Methods Using the Model Molecules
Table 2. All fragments with the intensity to the atomic mass unit for PET by a QMD calculation using the tetramer model *(neutral
fragments 87.8 %, positive 5.2 %, negative 7.0 %).
PET fragment distributions (total 6120)
Neutral charge fragments* positive charge fragments* Negative charge fragments* mass formula mass formula mass formula
( × 25) 16 2CH4
17 OH 18 H2O 26 17C2H2
28 77CO 28 12C2H4
30 14CH2O
38 C3H2
39 C3H3
42 12C2H2O 43 C2H3O 44 3C2H4O 44 19CO2 46 CH2O2 46 C2H6O 50 7C4H2 51 C4H3 54 C3H2O
58 C2H2O2
63 C5H3
70 2C3H2O2 74 C6H2
76 6C6H4 84 C4H4O2
90 C7H6
92 C6H4O 104 2C7H4O 108 C6H4O2
110 C6H6O2
121 C7H5O2 122 5C7H6O2 145 C9H5O2 150 3C8H6O3 165 C8H5O4 165 C9H9O3 166 4C8H6O4 175 C10H7O3 176 C10H8O3 179 C10H11O3
180 2C9H8O4
192 2C10H8O4
207 C10H7O5
14 4CH2
+
15 46CH3+
25 3C2H+ 27 31C2H3
+
28 25C2H4+
29 7C2H5+
29 30CHO+ 39 C3H2
+ 40 C2O+ 43 6C2H3O +
45 7CHO2+
51 11C4H3+
58 9C2H2O2+
59 4C2H3O2+
65 11C5H5+
70 3C3H2O2+
75 7C6H3+
76 C6H4+
80 3C5H4O + 104 28C7H4O + 105 7C7H5O +
121 10C7H5O2+
132 9C8H4O2+
133 12C8H5O2+
149 51C8H5O3+
166 C8H6O4+
174 5C10H6O3+
191 C10H7O4+
17 49OH− 25 14C2H− 28 20CO− 29 2CHO−
29 3C2H5−
41 5C2HO−
43 86C2H3O−
44 3C2H4O −
44 29CO2−
45 19CHO2−
51 C4H3−
55 3C3H3O−
57 6C2HO2−
65 6C4HO−
73 C3H5O2−
75 7C6H3−
76 C6H4−
77 2C6H5−
77 5C5HO− 82 6C4H2O2
−
88 7C7H4−
102 11C7H2O−
105 20C7H5O−
119 5C7H3O2−
120 23C7H4O2−
121 4C7H5O2−
132 3C8H4O2−
135 16C8H7O2−
137 3C7H5O3−
146 5C9H6O2−
147 2C8H3O3−
148 12C8H4O3−
149 10C8H5O3−
164 16C8H4O4−
165 7C8H5O4−
192 4C10H8O4−
206 7C10H6O5−
206 3C11H10O4−
-8-
Journal of Surface Analysis Vol.17, No. 1 (2010) pp. 2−14 K. Endo et al. Theoretical Mass Spectra of PE, PP, PS and PET Polymers by QMD Methods Using the Model Molecules
Table 3. Chemical formulae of positive ion fragments for PE, and PP models from a QMD method.
mass number (amu) chemical formula (All fragments have linear structures.)
14, 15, 16 CH2+, CH3
+, CH4+
26, 27, 28, 29 C2H2+, C2H3
+, C2H4+, C2H5
+
39, 40 C3H3+, C3H4
+
41, 42, 43 C3H5+, C3H6
+, C3H7+
51, 53, 54, 55 C4H3+, C4H5
+, C4H6+, C4H7
+
65, 66, 67, 69 C5H5+, C5H6
+, C5H7+, C5H9
+
81, 91 C6H9+, C7H7
+
Table 4. Chemical formulae of positive ion fragments for PS model from a QMD method.
mass number (amu) chemical formula* (structure)
27, 40, 50, 51, 54, 65 *C2H3+, *C3H4
+ , *C4H2+, *C4H3
+, *C4H6+ , *C5H5
+
76, 77, 79 C6H4+ ( ), C6H5
+ ( ), *C6H7+
89, 91, 103 C7H5+ ( ), *C7H7
+, C8H7+ ( )
115, 117, 119, 129 *C9H7+ , C9H9
+ ( or ), C9H11+ ( ), C10H9
+ ( )
*The fragments have linear structures. Table 5. Chemical formulae of positive ion fragments for PET model from a QMD method.
mass number (amu) chemical formula* (Structures)
14, 15, 27, 28, 29 CH2+, CH3
+, *C2H3+, *C2H4
+, *C2H5+
29, 43, 45 CHO+, *C2H3O +, CHO2+
51, 65 *C4H3+, *C5H5
+
58, 59, 70 *C2H2O2+ , *C2H3O2
+, *C3H2O2+
75,76,77 *C6H3+, *C6H4
+, *C6H5+
80, 104, 105 *C5H4O +, C7H4O+ ( ), C7H5O+ ( )
121, 133 C7H5O2+ ( ), C8H5O2
+ ( )
149, 174 C8H5O3+ ( ), C10H6O3
+ ( )
*The fragments have linear structures.
-9-
Journal of Surface Analysis Vol.17, No. 1 (2010) pp. 2−14 K. Endo et al. Theoretical Mass Spectra of PE, PP, PS and PET Polymers by QMD Methods Using the Model Molecules
-10-
a) PE
b) PP
c) PS
d) PET
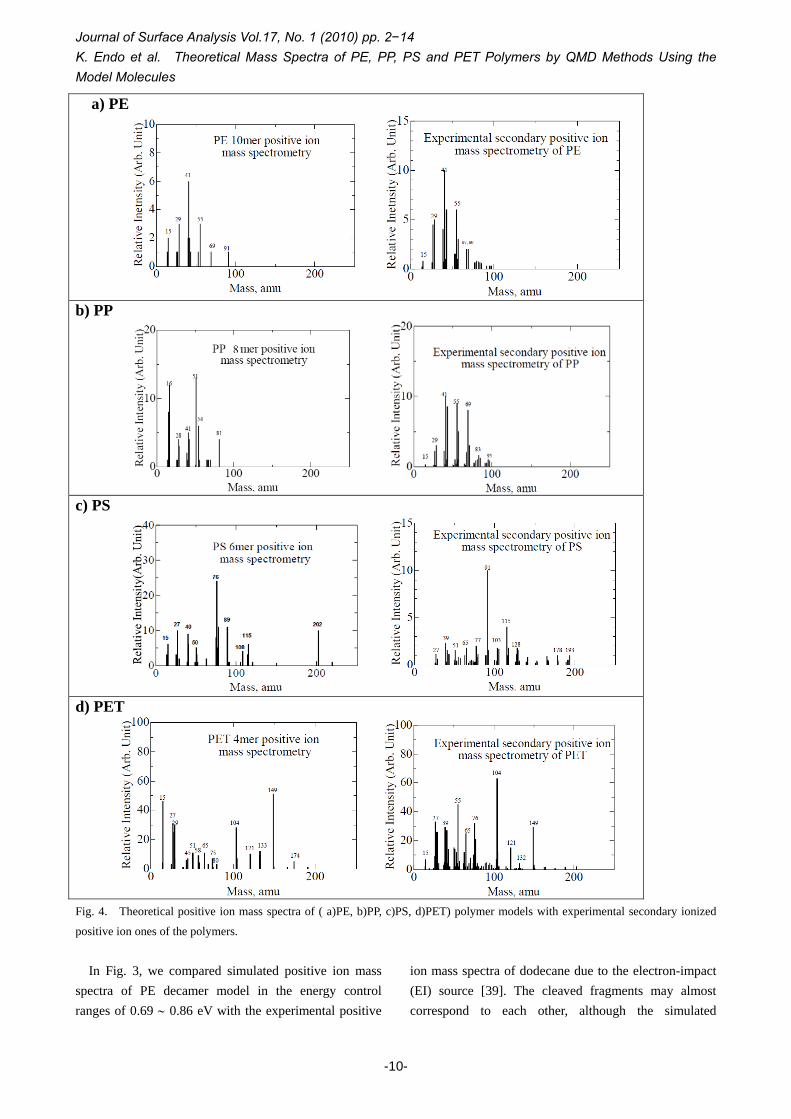
Fig. 4. Theoretical positive ion mass spectra of ( a)PE, b)PP, c)PS, d)PET) polymer models with experimental secondary ionized
positive ion ones of the polymers.
In Fig. 3, we compared simulated positive ion mass
spectra of PE decamer model in the energy control ranges of 0.69 ∼ 0.86 eV with the experimental positive
ion mass spectra of dodecane due to the electron-impact (EI) source [39]. The cleaved fragments may almost correspond to each other, although the simulated
Journal of Surface Analysis Vol.17, No. 1 (2010) pp. 2−14 K. Endo et al. Theoretical Mass Spectra of PE, PP, PS and PET Polymers by QMD Methods Using the Model Molecules
5. References distribution is considered to be due to larger total energy control in comparison with the EI MS result. For the SIMS spectra, Fig. 4 indicated calculated positive ion mass spectra for (PE, PP), and (PS, PET) models with the experimental ones of the polymers in a static SIMS [40], although we did not show similar mass spectra for the negative charged fragments. In the figure, fragment products (in atomic mass unit) obtained in the QMD are roughly in accordance with the experimental ones of the four polymers. Then, we are able to approximately predict the experimental mass spectra for other polymers from our QMD method.
[1] M. S. Stave, D. E. Sanders, T. J. Raeker, A. E. DePristo, J. Chem. Phys. 93,4413(1990).
[2] T. J. Raeker, A. E. DePristo, Int. Rev. Phys.Chem. 10,1(1991).
[3] C.L. Kelchner, D. M. Halstead, L. S. Perkins, N. M. Wallace, A. E. DePristo, Surf. Sci. 310,425(1994).
[4] D. W. Brenner, Phys. Rev. B 42,9458(1990). [5] D. W. Brenner, J. A. Harrison, C. T. White, R. J.
Colton, Thin Solid Films, 206,220(1991). [6] R. S. Taylor, B. J. Garrison, Langmuir, 11,1220
(1995). [7] K. S. S. Liu, C. W. Yong, B. J. Garrison, J. C.
Vickerman, J. Phys. Chem. B 103,3195(1999). At the end, an interesting point is to show the chemical
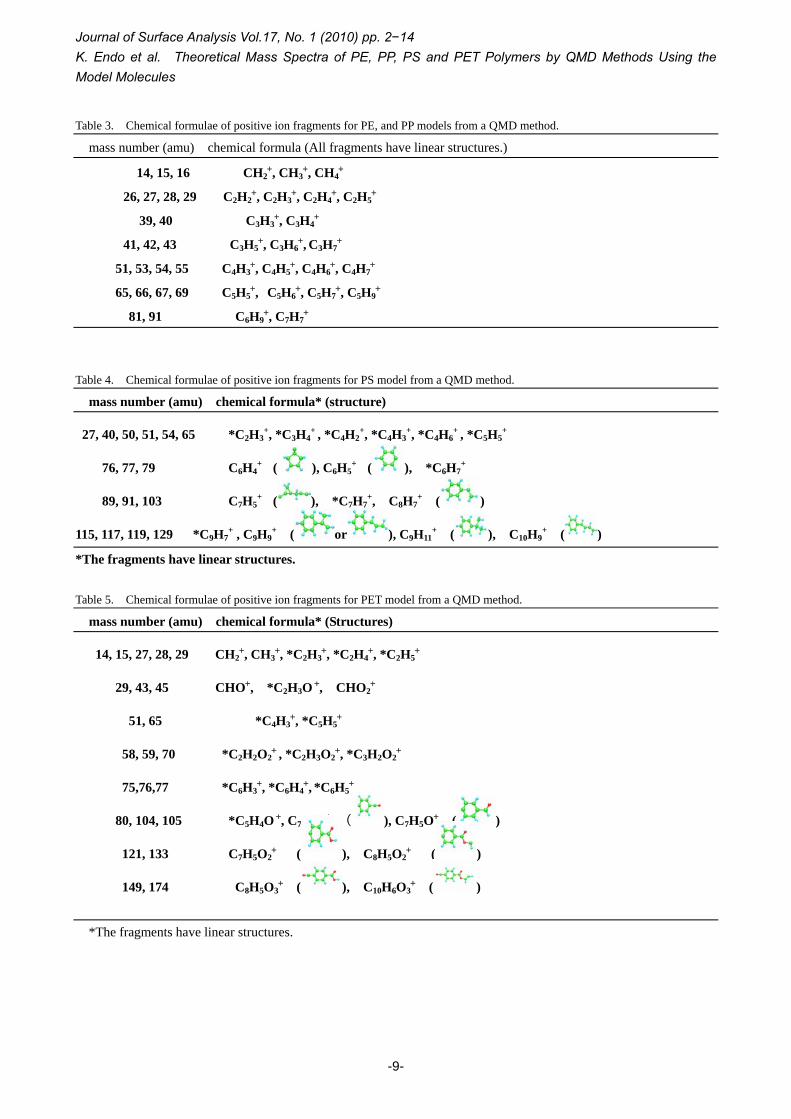
structures of positive ion fragments for PE, PP, PS, and PET polymers, unavailable from experimental methods. In Tables 3 ∼ 5, we showed the chemical formulae and structures of positive ion fragments for (PE, PP), PS, and PET polymers. It can be seen as the characteristic results in the tables that the fragments of (C5H5
+(65), C6H7+(77),
C7H7+(91), C9H7
+(115)), and (C4H3+(51), C5H5
+(65), C6H4
+(76), C6H5+(77)) have one dimensional linear
structures for PS and PET polymers, respectively.
[8] R. Chatterjee, Z. Postawa, N. Winograd, B. J. Garrison, J. Phys. Chem. B 103,151(1999).
[9] A. Delcorte, X. V. Eynde, P. Bertrand, J. C. Vickerman, B. J. Garrison, J. Phys. Chem. B 104,2673(2000).
[10] K. Beardmore, R. Smith, Nucl. Instrum. Methods B 102,223(1995).
[11] A. C. T. van Duin, S. Dasgupta, F. Lorant, W. A. Goddard,III, J. Phys. Chem., A105,9396(2001).
4. Conclusion [12] D. W. Brenner, Phys. Status Solidi B 217,23(2000). [13] A. K. Rappe, M. A. Pietsch, D. C. Wiser, J. R. Hart,
L. M. Bormann-Rochotte, W. M. Skiff, Mol. Eng. 7,385(1997).
For our QMD calculation, we used the velocity Verlet algorithm with a SCF MO calculation every MD step. The theoretical positive, negative, and neutral charged fragments were evaluated from the net atomic charge analysis of the fragments at geometry-optimization of the SCF calculations for the final MD step of total 60 trajectories in QMD. The theoretical positive charged fragments in atomic mass unit almost correspond to the experimental ones of polymers in MS and SIMS after a few tens of keV of primary heavy metal ion bombardment. Especially, we classified in the fragment distribution with neutral, positive, and negative electric charges to the atomic mass unit as {(98.1, 0.9, 1.0%), (93.0, 1.9, 5.1 %), (93.0, 2.6, 4.4 % ), and (87.8, 5.2, 7.0%} for PE, PP, PS, and PET model molecules, respectively. The ratios seem to correspond to the values considered experimentally in SIMS (In general, the vast majority of the sputtered particle flux is neutral, with secondary ions comprising of the order of 1% (exceptionally this may rise to 10%)).
[14] S. B. Sinnott, R. Andrews, D. Quan, A. M. Rao, Z. Mao, E. C. Dickey, F. Derbyshire, Chem. Phys. Lett. 315,25(1999).
[15] S. J. Stuart, A. B. Tutein, J. A. Harrison, J. Chem. Phys. 112,6472(2000).
[16] M. R. Nyden, in: A. F. Grand, C. A. Wilkie(Eds.), Fire Retardancy of Polymeric Materials, Marcel Dekker, New York, 2000, pp. 501-532.
[17] S. I. Stoliarov, P. R. Westmoreland, M. R. Nyden, G. P. Forney, Polymer 44,883(2003).
[18] M. R. Nyden, G. P. Forney, J. E. Brown, Macromolecules 25,1658(1992).
[19] M. R. Nyden, T. R. Coley, S. Mumby, Polym. Eng. Sci. 37,1496(1997).
[20] M. R. Nyden, in: Proceedings of the Inetrnational Aircraft Fire and Cabin Safety Research Conference, Atlantic City, NJ, 1998.
[21] M. R. Nyden, S. I. Stoliarov, P. R. Westmoreland, Z. X. Guo, C. Jee, Mater. Sci. Eng. A365,114(2004).
-11-
Journal of Surface Analysis Vol.17, No. 1 (2010) pp. 2−14 K. Endo et al. Theoretical Mass Spectra of PE, PP, PS and PET Polymers by QMD Methods Using the Model Molecules
[22] K. Chenoweth, S. Cheung, A. C. T. van Duin, W. A. Goddard,III, E. M. Kober, J. Am. Chem. Soc. 127,7192(2005).
[23] T. Ida, H. Sugimoto, D. Matsumoto, K. Endo, J. Surf. Anal. 12,153(2005).
[24] K. Endo, C. Masumoto, D. Matsumoto, T. Ida, M. Mizuno, N. Kato, Appl. Surf. Sci. 255, 856(2008).
[25] K. Kato, K, Endo, D. Matsumoto, T. Ida, K. Saito, K. Fukushima, N. Kato, Appl. Surf. Sci. 255, 1040(2008).
[26] K. Endo, D, Matsumoto, K. Kato, Y. Takagi, T, Ida,M. Mizuno, K. Saito, K. Fukushima, N. Kato, Appl. Surf. Sci. 255,1048(2008).
[27] P. Sigmund, Sputtering by Particle Bombardment I, R. Behrisch, ed, Top. Appl. Phys. (Springer) 47, 9(1981)
[28] W. C. Swope, H. C. Andersen, P. H. Berens, and K. R. Wilson, J. Chem. Phys. 76, 637 (1982).
[29] J. M. Haile, G. S. Gupta, J. Chem. Phys.79, 3067 (1983).
[30] H. C. Andersen, J. Chem. Phys. 72, 2384 (1980). [31] H. J. C. Berendsen, J. P. M. Postma, W. F. van
Gunsteren, A. DiNola, J. R. Haak, J. Chem. Phys. 81, 3684 (1984).
[32] M. J. Frisch, G. W. Trucks, H. B. Schlegel, G. E. Scuseria, M. A. Robb, J. R. Cheeseman, J. A. Montgomery Jr., T. Vreven, K. N. Kudin, J. C. Burant, J. M. Millam, S. S. Iyengar, J. Tomasi, V. Barone, B. Mennucci, M. Cossi, G. Scalmani, N. Rega, G. A. Petersson, H. Nakatsuji, M. Hada, M. Ehara, K. Toyota, R. Fukuda, J. Hasegawa, M. Ishida, T. Nakajima, Y. Honda, O. Kitao, H. Nakai, M. Klene, X. Li, J. E. Knox, H. P. Hratchian, J. B. Cross, V. Bakken, C. Adamo, J. Jaramillo, R. Gomperts, R. E. Stratmann, O. Yazyev, A. J. Austin, R. Cammi, C. Pomelli, J. W. Ochterski, P. Y. Ayala, K. Morokuma, G. A. Voth, P. Salvador, J. J. Dannenberg, V. G. Zakrzewski, S. Dapprich, A. D. Daniels, M. C. Strain, O. Farkas, D. K. Malick, A. D. Rabuck, K. Raghavachari, J. B. Foresman, J. V. Ortiz, Q. Cui, A. G. Baboul, S. Clifford, J. Cioslowski, B. B. Stefanov, G. Liu, A. Liashenko, P. Piskorz, I. Komaromi, R. L. Martin, D. J. Fox, T. Keith, M. A. Al-Laham, C. Y. Peng, A. Nanayakkara, M. Challacombe, P. M. W. Gill, B. Johnson, W. Chen, M. W. Wong, C. Gonzalez, and J. A. Pople:
Gaussian 03, Revision D.02, (Gaussian, Inc., Wallingford CT, 2004).
[33] M. J. S. Dewar, E. G. Zoebisch, Theochem 180, 1 (1988): M. J. S. Dewar, E. G. Zoebisch, E. F. Healy, J. J. P. Stewart, J. Am. Chem. Soc. 107, 3902 (1985).
[34] R. G. Cooks, K. L. Busch, Int. J. Mass Spectrom. Ion Proc. 53,111(1983).
[35] S. J. Pachuta, R. G. Cooks, Chem. Rev. 87,647 (1987).
[36] L. Van Vaeck, A. Adriaens, R. Gijbels, Mass Spectrom. Rev.18,1(1999).
[37] J. Lenaerts, L. Van Vaeck, R. Gijbels, Mass Spectrometry 17,2115(2003).
[38] D. Briggs, “Surface analysis of polymers by XPS and static SIMS” Cambridge University Press 1998, published by the press syndicate of the University of Cambridge, The Pitt Building, Trumpi- ngton Street, Cambridge CB2 IRP, United Kingdom.
[39] W. Reusch, “Virtual Textbook of Organic Chemistry” ©1999 William Reusch, All rights reserved (most recent revision 7/16/2007). The mass spectrum was prepared by JEOL. in ”http://www.cem.msu.edu/~reusch/VirtualText/Spectrpy/MassSpec/masspec1.htm#ms1”
[40] J. G. Newman, B. A. Carlson, R. S. Michael, J. F. Mounlder, T.A. Hohlt, “Static SIMS Handbook of Polymer Analysis,” Perkin-Elmer Corp., Physical Electronics Division; Elden Prairie, Minnesota, 1991.
査読コメント 査読者 1. 河野禎市郎(旭化成)
従来の MD 計算では TOF-SIMS スペクトル予測は
不可能であったが,本論文は QMD によりイオン化
も含めた計算に取り組んでおり,TOF-SIMS スペク
トル予測の実用化に向けた貢献は大きく,掲載に十
分値すると思われます.ただし新たな取り組みであ
ることから,当該領域の読者に馴染みの薄い部分も
あるため,以下の項目については,説明を厚くした
方が良いと思われます. [査読者 1-1]
MD 計算は,何故 5000MD step か? 実用上計算時間が理由と思われますが,結果の信
頼性がある程度確保されることが前提ですので,簡
-12-
Journal of Surface Analysis Vol.17, No. 1 (2010) pp. 2−14 K. Endo et al. Theoretical Mass Spectra of PE, PP, PS and PET Polymers by QMD Methods Using the Model Molecules
単に根拠等を示してください. [著者] 通常,分子動力学計算では,5000 ステップ計算を
行えば,その現象の経過を議論できると云うベース
からです.従って 2 章に以下を加えました. In our QMD calculation, we adopted 5000 molecular dynamics (MD) step as the maximum, as referred to the thermal decomposition MD calculations [21, 22]. In our calculation, we need to perform the calculation time of 6.9 hours for the (AM1) MOSCF calculation of 5 s and MD calculation of 5000 steps (for 1 trajectory). [査読者 1-2] イオン化計算は 5000MD step でのみで行っている
ため,protonation や recombination によるイオン化は,
本手法では予測できないのではないでしょうか?そ
の説明を入れる必要があると思います. また 5000step までは,proton か hydrogen atom か区
別できないため,protonation という言葉は厳密には
recombination with a hydrogen atom とすべきと思いま
す. [著者]
この QMD 計算の動画では分解や再結合の様子が
見ることができますが,それがイオン化であるかど
うかは動画で判断できません.分解したフラグメン
トに関して電荷の観点から陽性,中性,陰性のイオ
ン性を区別することは,分子軌道計算で atomic charge analysis を行わない限りできませんので,将
来如何なるMD計算のフラグメント charge analysisも,MO 計算の charge analysis に帰着すると考えて
います.今回の趣旨に解答できていないかもしれま
せんが,abstract にも書きましたように MO 計算によ
ってフラッグメントの電荷解析ができると書かせて
頂いている次第です. それから,protonation はすべて recombination with a
hydrogen atom に直しました. [査読者 1-3]
net atomic charge analysis の結果から,イオン,中
性の判断をする際の閾値を示してください. [著者] イオン及び中性の閾値に関しましては,2 章に以
下の文を加えました. We adopted the positive and negative ions of more
than ± 0.05 as the threshold of both charge values. For neutral charge fragments, we considered single molecule
as the threshold. [査読者 1-4]
optimum energy rangeにおけるoptimumを具体的に
示してください.くわえて,0.69~0.86, 0.77 から
0.95eV のエネルギーが optimum と判断し,その他が
optimum でないと判断する理由を明示してください. [著者]
この項目に明確にお答えることは,難しいです.
ここで,用いた MD 法と MO 法に依存していますの
で,モデル分子の熱分解過程を 5000 ステップで見る
には,分解したフラッグメントの atomic mass unitが実験で得られる質量スペクトルのそれに対応する
ように計算致します.その試みが,3 章の a) Thermal decomposed process に 述 べ た 「 We examined energy-dependency for thermal decomposition of polymers to obtain the optimum energy ranges at the maximum 5000 step.」です.3 章を以下のように書換
えました. Thus, we found out in the range of 0.69 ∼ 0.86 eV (8000 ∼ 10000 K) for (PE, PP), and 0.78 ∼ 0.95 eV (9000 ∼ 11000 K) for (PS, PET) polymers, respectively, as the optimum energy ranges of the decomposed fragments by considering the normal distribution of 13 (or 14) ∼ 200 atomic mass unit for each polymer model. [査読者 1-5]
Fig.4 で PP, PS および PET の一部のピーク以外は,
実測と計算で異なるように見えます.これは,
cascade 領域からのフラグメンテーション,イオン化
が計算では考慮されていないためでしょうか? [著者]
この QMD 計算の MO 計算部分は基底状態のみで
すので,何個かの励起状態を考慮すれば実測値に合
うフラッグメンテーションが得られると思います.
励起状態計算を自動で取入れるには計算が 100 倍以
上になりますからディスクトップ計算では無理で,
Supercomputer が計算しないと無理でしょう. 基底状態計算の記述は 2 章にあります.
The thermal decomposition of PE, PP, PS, and PET polymers has been simulated using the model molecules {H-(CH2CH2)10-H, H-(CH2-CH(CH3))8-H, H-(CH2CH(C6H5))6-H, and H-{CH2CH2-O(CO)-(C6H4)-(CO)O}4-H} by QMD using the AM1 method at the ground state.
-13-
Journal of Surface Analysis Vol.17, No. 1 (2010) pp. 2−14 K. Endo et al. Theoretical Mass Spectra of PE, PP, PS and PET Polymers by QMD Methods Using the Model Molecules
-14-
査読者 2. 鈴木峰晴(アルバック・ファイ) 有機物の TOF-SIMS 分析の基礎(データベース)
となる計算結果であり,掲載に値するものと判断し
ます.ただし,一般的な読者のために下記を検討し
ていただくようコメントします. [査読者 2-1] 本文中で”recombination”という単語が数回用い
られています.有機材料の TOF-SIMS 分析やスパ
ッタリングでは,現在 cross-linking という用語で解
離後の再結合を表し,本来の fragment とは異なる
情報にも注意が払われています.本論文で
は,”recombination”に関して説明されていないよう
に読めますので,簡単でいいので是非説明を追加し
ていただきたい. [著者]
recombinationはすべて cross-linkingに変更しま
した. [査読者 2-2]
“MD”単位について,分子動力学に通じている方な
ら理解可能と思われますが,一般読者に理解しやす
いように,どのような event に関する単位なのか解
説しておいていただけると助かります.本文中での
記述が scientific にそぐわなければ,reference 中で
の note でも結構です.知りたいのは,1 MD と 2 MDでは,何がパラメータなのか,ということです. [著者]
1MDは分子動力学計算の1ステップの意味です.
2 章にそれぞれ以下の文章を加えました. In our QMD calculation, we adopted 5000 molecular dynamics (MD) step as the maximum, as referred to the thermal decomposition MD calculations [21, 22]. The sampling position data was carried out up to 2.5 ps (5000 MD step) with a time step of 0.5 fs (The 1 MD step is a motion of the model molecule with time of 0.5 fs). [査読者 2-3] 本論文では,thermal energy (temperature)とし
てエネルギーを扱っていますが,TOF-SIMS やスパ
ッタリングを想定したときの荷電粒子のエネルギー
との関係は,どのように考えればよろしいでしょう
か. [著者] 著者らの仮定は,「重金属の一次イオンの照射以後,
試料内部で起こる衝突カスケードにより,熱エネル
ギーが試料最表面の結合部分に伝達してその結合部
分がスパッタされるという所が,ポリマーモデルの
熱分解と同じように考えられる.」としていますので,
荷電粒子のエネルギーとは直接結びつきません.し
かし,最表面で熱分解を起こすために荷電粒子の大
きな照射エネルギーが引金になるわけです.本文に
は以下の様な仮定が数回記述してあります. In the case of the polymer thermal sputtering process after bombardments of primary heavy metal ion with a few tens keV kinetic energy in TOF-SIMS, cleavage of polymer bonds on the outer most surface is assumed as an example due to thermally decomposed reactions. Thus we are able to compare the calculated positive- or negative-ion fragment spectra of the polymer model with the experimental ones in the TOF-SIMS. [査読者 2-4] 上記 2-3 のコメントとも関係しますが,本論文の
結果を温度効果 T と考えると,TOF-SIMS やスパッ
タリングでは,入射フラックス I,fragmentation cross-section F , フ ラ グ メ ン ト の ionization cross-section S,装置関数 A,フラグメントイオン
のイオン化率(相対感度係数)R,その他のパラメ
ータ X というように考えると,実際のマススペクト
ルもしくはスパッタされた粒子分布は,それらの積
と考えればよろしいですか.もしそうであれば,今
回のような計算結果は,装置や測定条件を加味しな
い fragmentationの基礎データと考えられると思い
ます. [著者]
2-3 の回答で書きました様な仮説で結び付けてい
ますので,熱拡散によってスパッタされたフラッグ
メンテーションとしかいえません.


![sfo{qmd tyf ah]6](https://img.pdfslide.net/doc/110x75/616cb36573273911d61d0729/sfoqmd-tyf-ah6.jpg)