Embed Size (px)
Citation preview
Theoretical Model for Photochemical or ThermallyActivated Immobilization of Macromolecules
Robert K. Graupner* and Mingdi Yan*
Department of Chemistry, Portland State University, P.O. Box 751, Portland, Oregon 97207
Received March 1, 2004. In Final Form: June 26, 2004
The covalent immobilization of macromolecules on surfaces and within 3-dimensional networks isquantitatively described using a model based on Poisson statistics. This model determines the immobilizeddensity or layer thickness as a function of molecular weight of the macromolecule or radiant exposure priorto and following the surface deposition of the macromolecule. Measurements of immobilized layer thicknessprovide first-order rate constants for decomposition of the surface-bound linker molecules and an estimateof the surface-bound linker density. The model predicts the relative density of immunocomplexed antibodiesas a function of the irradiation time used to immobilize antigens. By providing the average number of bondsto the immobilized molecule, the model enables studies of the effect of multiple bonds on the activity ofbiomolecules. Experimental data by the authors and from the literature validate the model.
Introduction
Covalent photochemical immobilization of polymers andbiomolecules has been widely studied for application tobiological research,1 biosensors,2,3,4 and engineered sur-faces.5,6 Photochemical immobilization processes allow forthe covalent attachment of macromolecules in regionsdefined by optical masks using standard photolithographictechnology.The immobilizationmethod involvesanchoringa linker molecule with a photoactive or thermally labilemoiety to a surface, and then depositing the targetmolecules to be immobilized by the linkers. SubsequentUV irradiation or thermal treatment decomposes themoiety to form a highly reactive intermediate capable ofinsertion into chemical bonds of neighboring targetmolecules, immobilizing them to the surface. The pho-toactive moieties include benzophenones, aryldiaziridines,and azides.7 Despite the technological importance of thismethod, no theoretical models that describe the relation-ship between immobilized surface density or film thicknessand the variables of linker surface density, radiantexposure, and molecular weight appear in the literature.In the absence of theory, researchers have relied uponempirical relationships to predict results of immobilizationprocesses for different process conditions. We here derivea mathematical model based on Poisson statistics thatsuccessfully describes immobilization data acquired bothin our lab and from the literature.
Experimental Section
The linker used in this study is a silane-functionalizedperfluorophenyl azide (PFPA-silane) synthesized as described
by Bartlett and Yan.8 As-received silicon wafers included a ∼70nm thermally grown silicon dioxide layer. This layer was eitherleft intact or removed by soaking in 1% hydrofluoric acid solution9
until the wafer surface became hydrophobic, after which thesamples were rinsed in water. All samples were chemicallycleaned in piranha solution, 7:3 v/v H2SO4/35% H2O2 (warning:this mixture can react violently and must be handled withextreme care), for 1 h at 80-90 °C, boiled for 1 h in MilliQ waterof 18 MΩ minimum resistivity, and then dried under a streamof nitrogen. The wafers were functionalized by soaking at roomtemperature in a 1% (w/w) solution of PFPA-silane in toluene for12 h with continuous stirring, after which they were rinsed intoluene and dried with nitrogen. During this process, thehydrolyzed PFPA-silane condensed with surface silanols on thesilicon dioxide surface and with adjacent PFPA-silane moleculesto form the linker-coated surface.10 The thickness of the oxide-PFPA-silane surface was measured with a Gaertner L116Aellipsometer assuming an index of refraction of 1.462. Polystyrene(PS) solutions (10 mg/mL) were prepared by dissolving mono-disperse PS of Mw ) 393 × 103 from Scientific Polymer Productsin toluene. The polymer was spin-coated from the PS solution at2000 rpm. The samples were irradiated with UV light from aHanovia 450 W medium-pressure Hg lamp in a water-cooledjacket. A Schott Glass WG 280 filter eliminated the shortwavelength UV. The intensity during exposure was monitoredwith a model UVX radiometer and UVX-36 sensor manufacturedby UVP Inc. (Upland, CA). Following exposure, the samples wererinsed with toluene and then sonicated in a Branson model 1510for 30 min in toluene to remove the nonimmobilized PS. Thesamples were then measured with the ellipsometer using a two-layer model to calculate the thickness of the immobilized PS.
Theoretical Basis
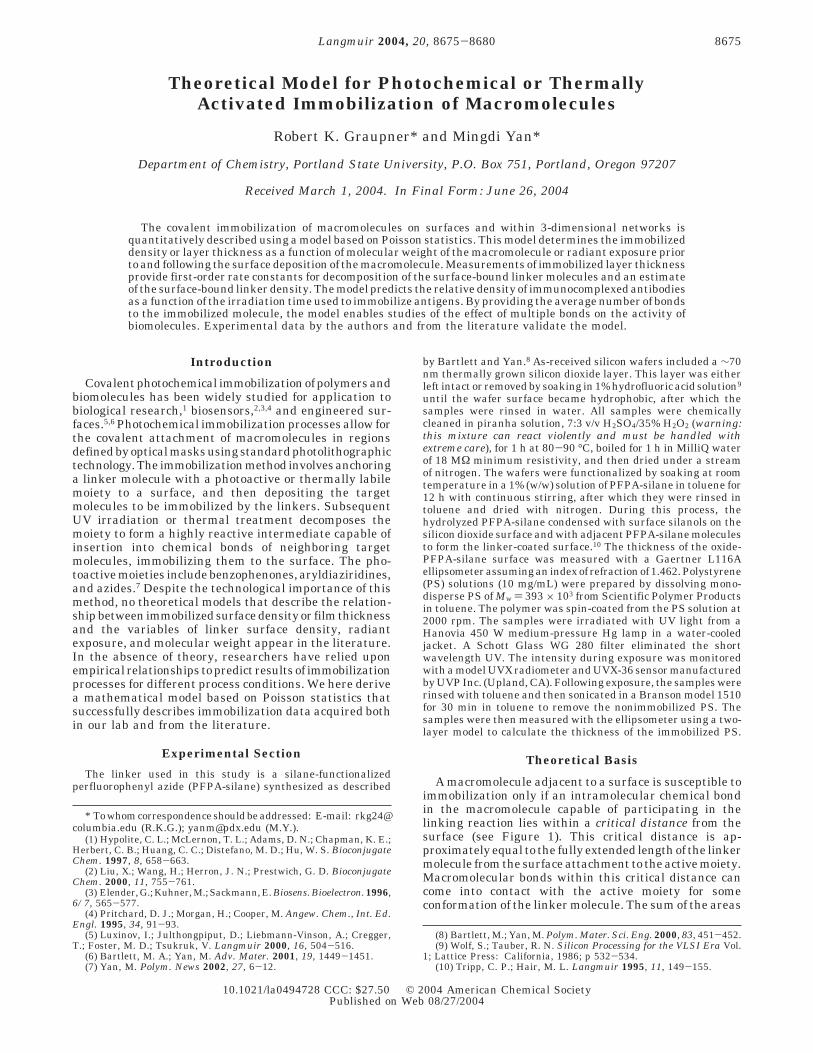
A macromolecule adjacent to a surface is susceptible toimmobilization only if an intramolecular chemical bondin the macromolecule capable of participating in thelinking reaction lies within a critical distance from thesurface (see Figure 1). This critical distance is ap-proximately equal to the fully extended length of the linkermolecule from the surface attachment to the active moiety.Macromolecular bonds within this critical distance cancome into contact with the active moiety for someconformation of the linker molecule. The sum of the areas
* To whom correspondence should be addressed: E-mail: [email protected] (R.K.G.); [email protected] (M.Y.).
(1) Hypolite, C. L.; McLernon, T. L.; Adams, D. N.; Chapman, K. E.;Herbert, C. B.; Huang, C. C.; Distefano, M. D.; Hu, W. S. BioconjugateChem. 1997, 8, 658-663.
(2) Liu, X.; Wang, H.; Herron, J. N.; Prestwich, G. D. BioconjugateChem. 2000, 11, 755-761.
(3) Elender, G.; Kuhner, M.; Sackmann, E. Biosens. Bioelectron. 1996,6/7, 565-577.
(4) Pritchard, D. J.; Morgan, H.; Cooper, M. Angew. Chem., Int. Ed.Engl. 1995, 34, 91-93.
(5) Luxinov, I.; Julthongpiput, D.; Liebmann-Vinson, A.; Cregger,T.; Foster, M. D.; Tsukruk, V. Langmuir 2000, 16, 504-516.
(6) Bartlett, M. A.; Yan, M. Adv. Mater. 2001, 19, 1449-1451.(7) Yan, M. Polym. News 2002, 27, 6-12.
(8) Bartlett, M.; Yan, M. Polym. Mater. Sci. Eng. 2000, 83, 451-452.(9) Wolf, S.; Tauber, R. N. Silicon Processing for the VLSI Era Vol.
1; Lattice Press: California, 1986; p 532-534.(10) Tripp, C. P.; Hair, M. L. Langmuir 1995, 11, 149-155.
8675Langmuir 2004, 20, 8675-8680
10.1021/la0494728 CCC: $27.50 © 2004 American Chemical SocietyPublished on Web 08/27/2004
on the surface satisfying such a distance requirement fora single macromolecule is the bonding area, denoted byAb. The bonding area depends on the distance of themolecule from the surface, the molecular conformation,and the number and types of chemical bonds in themacromolecule. An excited linker molecule located withinthe bonding area has a probability, F, dependent on themacromolecular structure and conformation of the linker,of establishing a chemical bond with the macromolecule.The average number, µ, of linkers bonded to the macro-molecule is given by
where ∆N is the surface density of linker moleculesdecomposed after deposition of the macromolecule and fis the probability of bonding averaged over all conforma-tions of the linker molecule. Assuming bond formationbetween linkers and the macromolecule to be statisticallyindependent events, we can apply the Poisson distribu-tion11 pn ) exp(-µ) µn/n! to determine the probability thatn linkers are bonded to the macromolecule. This use ofthe Poisson distribution is similar to that employed tostudy the interaction between immobilized biomoleculesusing Atomic Force Microscopy.12,13,14 The macromoleculeis immobilized for n > 0, giving the probability ofimmobilization P(µ) as
Moving from a single molecule to a collection ofmolecules in a surface coating requires averaging over
the properties of all molecules contacting the surface, i.e.,molecules for which Ab * 0, to yield the average probabilityof immobilization ⟨P(µ)⟩. The thickness, τ, of an im-mobilized molecular layer equals the molecular volume ofthe immobilized molecule, Vm, times the number ofimmobilized molecules per unit area. The number ofimmobilized molecules per unit area is the number density,D, of molecules contacting the surface in the depositedlayer times ⟨P(µ)⟩ giving
The bracketed values of µ and Ab are averages taken overall molecules contacting the surface. This averagingprocess assumes that the properties determining bondformation are the same for the isolated molecule as for amolecule in a deposited layer. Because these propertiesare likely to be different, due to the mutual interactionof adjoining molecules, care should be used in applyingparameters determined from thick polymer layers tomonolayers or layers that incompletely cover the surfaceand vice versa. The approximation used in eq 3 replacesthe average of the immobilization probabilities with theprobability of immobilization of a molecule with theaverage value of µ. The relative error introduced by thisapproximation is
To estimate the relative error, the averages (bracketedterms) on the right side of the above expression wereevaluated by numerical integration using common prob-ability distributions to approximate the unknown actualprobability distribution of µ. Using normal and log-normalprobability distributions, with coefficients of variation lessthan 40%, the maximum relative error is less than 6%,indicating a useful approximation. The error approacheszero for smaller values of the coefficients of variation.
The linker surface density with an initial value N0follows eq 5 given first-order kinetics for photolysis,thermal decomposition, or, for benzophenone, an irrevers-ible reaction.15 The variables T and t represent the timedurations for the decomposition of linkers that occurrespectively prior to (pre-deposition decomposition) andafter (post-deposition decomposition) the deposition of themacromolecule on the surface, respectively. The rateconstant R is a function of the intensity and spectraldistribution of the incident radiation for photolysis. Forthermal decomposition, R is a function of the temperature.
Combining eqs 3-5 yields an equation for immobilizedmacromolecule thickness, τ, as a function of the decom-position time durations t and T
where µmax ) (f⟨Ab⟩N0) is the maximum possible averagenumber of bonds per macromolecule, occurring when T )0 and Rt . 1. The maximum immobilized macromolecular
(11) van Kampen, N. G. Stochastic Processes in Physics andChemistry; North-Holland: Amsterdam, 1981; pp 35-36.
(12) Williams, J. M.; Han, T.; Beebe, T. Langmuir 1996, 12, 1291-1295.
(13) Wenzler, L. A.; Moyes, G. L.; Raikar, G. N.; Hansen, R. L.; Harris,J. M.; Beebe, T. P. Langmuir 1997, 13, 3761-3768.
(14) Lo, Y.; Huefner, N. D.; Chan, W. S.; Stevens, F.; Harris, J. M.;Beebe, T. P. Langmuir 1999, 15, 1373-1382.
(15) Brauchle, C.; Burland, D. M.; Bjorklund, G. C. J. Phys. Chem.1981, 85, 123.
Figure 1. Illustration of the definition of the bonding area Ab.The areas A1 and A2 are the regions within which the criticalbond-to-surface distance requirement for a reaction with a linkeris satisfied for the 2 C-H bonds of each methyl group. Theother four C-H bonds, above the plane, exceed the criticaldistance and are not capable of bonding with the linkers. Onlylinkers located within the shaded areas have the potential ofbonding to the macromolecule. When located closer to thesurface than shown, the bonding areas will increase andadditional bonding areas will occur for bonds that previouslyexceeded the critical distance. For convenience, all linkers areindicated in the fully extended conformation normal to thesurface, although a distribution of conformations is expected.
µ ) ⟨F⟩ ∆NAb ) f∆NAb (1)
P(µ) ) (1 - probability of no attachment) )(1 - p0) ) 1 - exp (-µ) (2)
τ ) ⟨P(µ)⟩DVm ≈ P(⟨µ⟩)DVm ) [1 - exp (-⟨µ⟩)]DVm(3)
⟨µ⟩ ) f∆N⟨Ab⟩ (4)
[P(⟨µ⟩) - ⟨P(µ)⟩]/⟨P(µ)⟩ )[1 - exp(-⟨µ⟩)/⟨(1 - exp(-µ))⟩] - 1
∆N ) N0 exp (-RT) (1 - exp (-Rt)) (5)
τ(T,t) )DVm(1 - exp(- µmax exp(-RT)(1 - exp(-Rt)))) (6)
8676 Langmuir, Vol. 20, No. 20, 2004 Graupner and Yan
thickness value τmax is DVm(1 - exp(-µmax)) when T ) 0and Rt . 1. Experimentally determined values of µmaxand τmax together with estimates for f provide a lower limitfor the value of N0. The number density of immobilizedmacromolecules equals (τmax/Vm). Each immobilized mac-romolecule is bonded to an average of µmax/(1 -exp(-µmax)) linkers. This quantity exceeds the value ofµmax because we are now considering an average over onlythe immobilized molecules, while the average µmax includesthose macromolecules which were not immobilized, forwhich the number of bonds is zero. Each successful bondrequires (1/f) linkers bound to the surface. Taking theproduct of these factors yields
The right side of eq 7 is the number density of linkers thatsatisfy the critical distance range used to define Ab. Thisquantity underestimates the actual linker density, N0,because those linkers outside of Ab, for any macromolecule,are not counted.
The immobilized thickness (eq 6) is a function ofmolecular weight Mr through the dependence of both (DVm)and ⟨Ab⟩ on molecular weight. The molecular volume Vm) (Mr/NAFbulk), where Fbulk is the mass density of the bulkmaterial and NA is Avogadro’s number, is proportional toMr. Assuming that the surface is completely covered bythe overlying macromolecular layer, D is inversely pro-portional to the average surface area coverage permacromolecule. This average surface area coverage isdependent on the conformation of the macromolecule,which depends on the solvent properties and the affinityof the macromolecule for the surface.16 We treat theglobular, Gaussian coil, and lipid monolayer17 conforma-tions using scaling laws.18
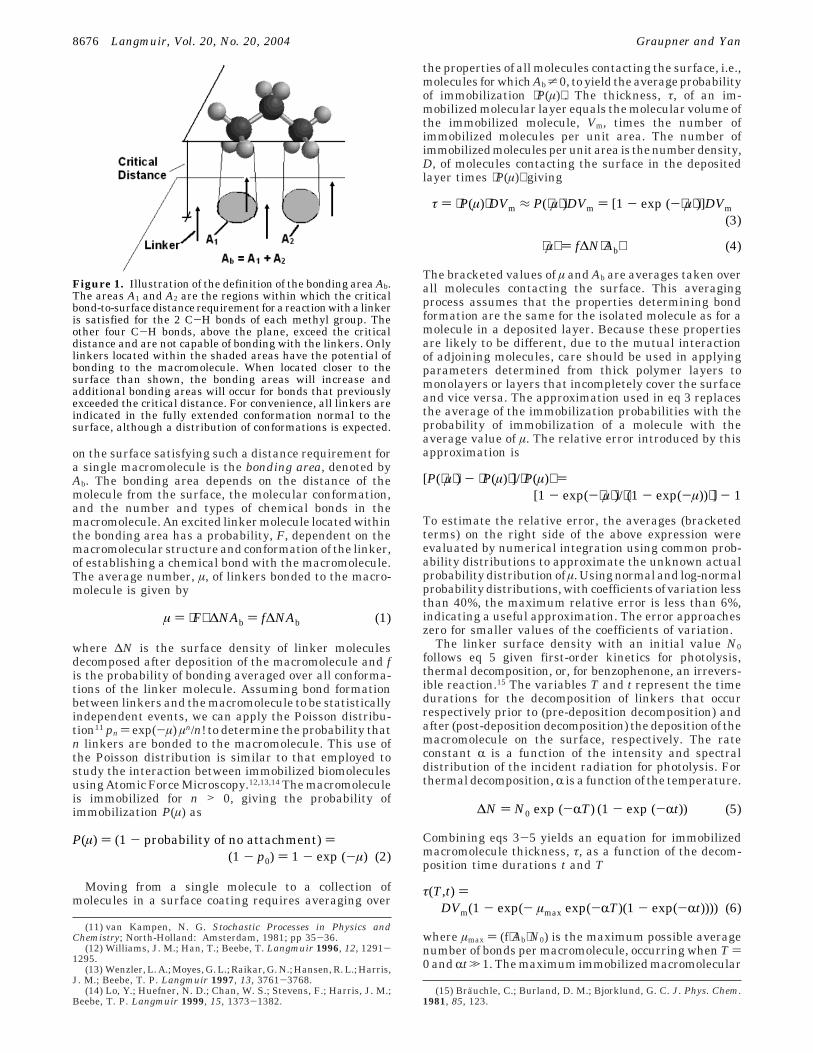
In the globular conformation, the radius of a denselypacked molecule is proportional to the cube root of thelength of the molecule,19 producing a (Mr)2/3 variation in⟨Ab⟩, a (Mr)-2/3 variation of D, and a (Mr)1/3 variation of(DVm) with molecular weight.
Analysis of the Gaussian coil conformation requires theassumption that ⟨Ab⟩ and the area coverage (1/D), whichare proportional to the molecular length in the train20
conformation, are proportional to the radius of gyrationRG
where k is a constant particular to the polymer andsolvent.21 This assumption was motivated by the observa-tion that a molecule on the surface in the shape of a ringwith radius RG would have area coverage equal to 2πwRG,where w is the effective thickness of the molecule. In thegeneral case, the multiplicative constant differs from 2πbecause the variety of coil orientations and overlap with
other molecules reduce the average area coverage to lessthan that predicted for a ring-shaped molecule, but stillwith the (Mr)0.5 functional dependence. Equation 8 usesthe 0.5 exponent for ideal Gaussian coils rather than the3/5 exponent from excluded volume theory.22 This isjustified by application of the Flory Theorem23 to theconcentrated solution that forms prior to complete solventevaporation during film deposition. Using eq 8, the factor(DVm) varies as (Mr)0.5. The (Mr)-0.5 dependence of D isdue to the increasing exclusion of chains from makingcontact to the linker-coated surface as the lengths of thechainscontacting thesurface increases.Theaboveanalysisholds for Gaussian coils with RG less than the depositedfilm thickness. When RG is larger than the deposited filmthickness, the analysis becomes complicated since we needto consider the conformation of a chain confined betweenparallel planes,24 which leads to a different functional formof the dependence on Mr.
The lipid monolayer conformation decouples the areacoverage (1/D) from the molecular weight. The areacoverage is determined by the size of the “headgroup” ofthe amphiphilic molecule which alone is in contact withthe surface, while molecular weight sums the head andtail group weights. If the molecular weight of the “head-group” is held constant, while the molecular weight, Mtail,of “tail group” varies, the factor (DVm) is linear in Mtail forMtail ≈ Mr.
Using this information, the functional dependence ofimmobilized thickness on molecular weight for Rt . 1 is
In the above, (DVm)0 and (µmax)0 are the values of (DVm)and µmax at Mr ) M0. Table 1 provides the values of theexponents to use in eq 9 for three molecular conformations.
The model for thickness does not distinguish betweenmolecules immobilized by a single linker bond from thoseimmobilized by multiple bonds. Models for other propertiesmay require consideration of the number of bonds thatlink molecules to the surface. As an example, the immu-nocomplexation of immobilized antigens with antibodiesmay be hindered by multiple bonds which fix the antigensclose to the surface, inhibiting molecular recognition.25 A
(16) Fleer, G. J.; Cohen Stuart, M. A.; Scheutjens, J. M. H. M.;Cosgrove, T.; Vincent, B. Polymers at Interfaces; Chapman & Hall:London, 1993; p 101.
(17) Shen, W. W.; Boxer, S. G.; Knoll, W.; Frank, C. W. Biomacro-molecules 2001, 2, 70-79.
(18) De Gennes, P. Scaling Concepts in Polymer Physics; CornellUniversity: Ithaca, NY, 1979; p26.
(19) Grosberg, A. Y.; Khokhlov, A. R. Statistical Physics of Macro-molecules; AIP Press: New York, 1994; p 130.
(20) Fleer, G. J.; Cohen Stuart, M. A.; Scheutjens, J. M. H. M.;Cosgrove, T.; Vincent, B. Polymers at Interfaces; Chapman & Hall:London, 1993; p 31.
(21) Fleer, G. J.; Cohen Stuart, M. A.; Scheutjens, J. M. H. M.;Cosgrove, T.; Vincent, B. Polymers at Interfaces; Chapman & Hall:London, 1993; p 463.
(22) Grosberg, A. Y.; Khokhlov, A. R. Statistical Physics of Macro-molecules; AIP Press: New York, 1994; p 119.
(23) Grosberg, A. Y.; Khokhlov, A. R. Statistical Physics of Macro-molecules; AIP Press: New York, 1994; p 154.
(24) Grosberg, A. Y.; Khokhlov, A. R. Statistical Physics of Macro-molecules; AIP Press: New York, 1994; p 121.
(25) Leckband, D. Annu. Rev. Biophys. Biomol. Struct. 2000, 29, 1-26.
N0 g (τmax µmax)/[(fVm) (1 - exp(-µmax))] ≈(τmax µmax)/(fVm) (7)
⟨Ab⟩,(1/D) ∝ RG ) k(Mr)0.5 (8)
Table 1. Value of Exponents in eq 9 for MolecularConformations
τ(0, Rt . 1) )(DVm)0 (Mr/M0)
w (1 - exp(- (µmax)0(Mr/M0)x)) (9)
Theoretical Model for Immobilization of Macromolecules Langmuir, Vol. 20, No. 20, 2004 8677
simple model for the maximum density, σ, of immuno-complexed antibodies can be constructed by assuming thatonly those antigens immobilized with a single bond to thesurface will complex with antibodies. The density ofantigens immobilized with a single bond is proportionalto the Poisson distribution, p1, giving
where Cantigen is the surface density of antigens satisfyingthe critical distance range for immobilization and ⟨µ⟩ isdefined by eq 4. Eliminating ⟨µ⟩ and ∆N using eqs 4-5with T ) 0, eq 10 becomes
Results and DiscussionTo validate the above model, we need a procedure to
extract the parameters µmax, R, and (DVm) from experi-mental data. In the general case, the parameters aredetermined by varying their values to obtain the best fitof eq 6 to the experimental data. Normalization of layerthickness data reduces the number of adjustable param-eters to two by elimination of (DVm) and reduces the effectof systematic errors. Layer thickness values from experi-ments in which the time, T, of pre-deposition decomposi-tion varied are normalized by dividing the immobilizedlayer thickness of each sample by the immobilized layerthickness of the sample for which T ) 0. The two-parameter eq 12 fits the normalized data, where t0 is theconstant decomposition time used following deposition ofthe macromolecule.
In the absence of pre-deposition decomposition (T ) 0 forall samples), normalization consists of dividing the im-mobilized thickness values by the thickness obtained fromthe longest irradiation time, tmax. The normalized data forT ) 0 can be fit by the two parameter equation:
The parameters µmax and R are obtained by finding thevalues that give the least-squares fit of eq 12 or eq 13 todata from a single experiment. Once determined, bothµmax and R apply to the analysis of other experimentaldata from similarly prepared samples using the samemacromolecule. Following determination of µmax and R,eq 6 has a single unknown parameter (DVm) which isdetermined by the best fit of eq 6 to the data withoutnormalization.
A more direct method for determination of µmax and Rexists for experiments where T is varied and Rt . 1. Inthis case, eq 6 can be written as
Equation 14 predicts that a plot of G(τ) versus T is astraight line with a slope of -R and a y-intercept of ln-(µmax). To apply eq 14 to experimental data requires avalue for DVm. When µmax g 4, the value of DVm can beapproximated by the immobilized thickness for T ) 0because eq 6 predicts that τ(T ) 0, Rt .1) g 0.98 DVm.
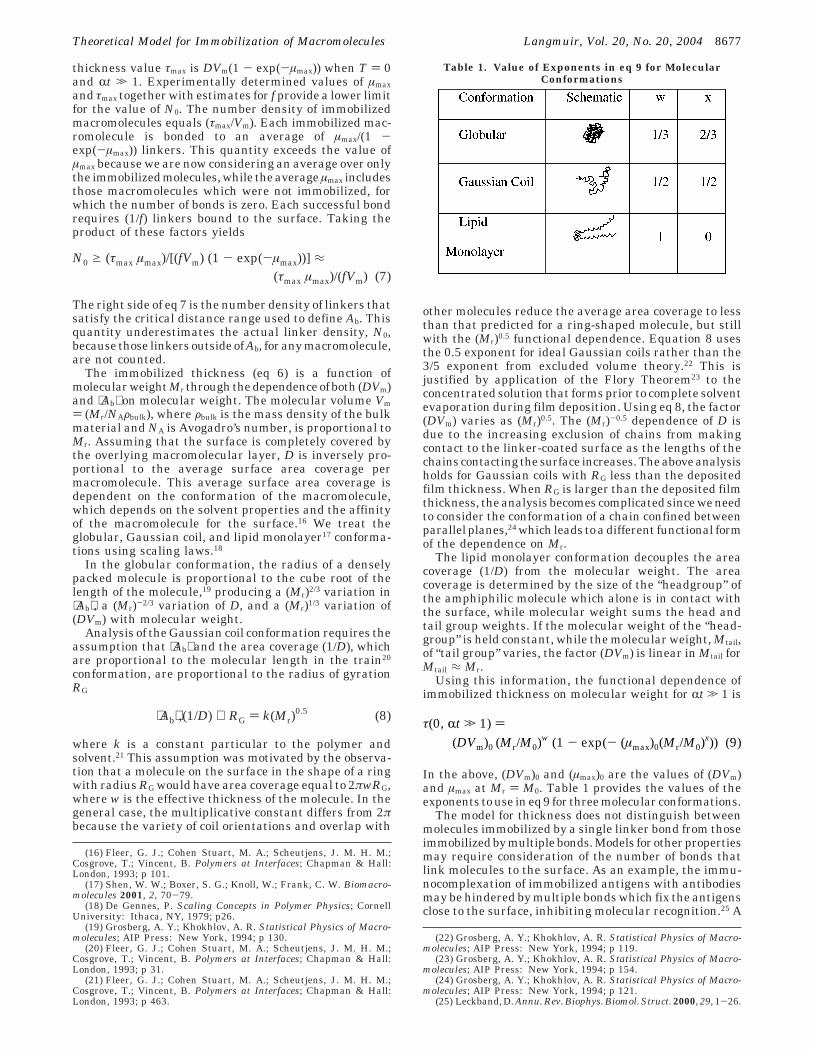
This approach was used for PS immobilized on 5 nm thickoxide. A different approach was necessary for the samepolymer immobilized on 70 nm thick oxide since µmax <4. Here, the value of DVm was chosen to maximize thecorrelation coefficient (r2) of the G(τ) versus T linearregression. TheG(τ) versusT plots for these data are shownin Figure 2. There, radiant exposure instead of T is usedas the independent variable to eliminate errors caused byvariation of the UV output of the lamp during irradiation.
Both samples received identical treatment and wereprocessed together.Theslopesof theregression lines, equalto the values of -R, are approximately equal. Thedifference in line intercepts is caused by ∼2× higher valueof µmax ) 4.9 for the 5 nm oxide thickness compared withµmax ) 2.5 for the 70 nm oxide. Using eq 7 with the valuef ) 0.38, obtained from analysis of solution photolysisproducts,26 the corresponding surface linker densities areN0 g 0.13 nm-2 and N0 g 0.08 nm-2 respectively, comparedwith a maximum silanol density for silica of roughly 5nm-2.27 The increased value for N0 on the 5 nm oxidesample may be due to the larger number of silanol groups,capable of reacting with the PFPA-silane, on the chemi-cally oxidized surface of the 5 nm sample compared withthe thermally oxidized surface of the 70 nm oxide.28,29
Figure 3 shows the ability of the model to fit experimentaldata using parameters obtained from Figure 2. Thesamples in data sets a) and b) were subjected to varyingpre-deposition decomposition times, T, and were fit by eq12. The samples in data set c) had varying post-depositionexposures and were fit by eq 13.
The model extends to cases of thermal decompositionfollowed by photolysis with the addition of a second rateconstant resulting in the following equation:
where the subscripts identify rate constants and timedurations for thermal decomposition (th) and photolysis(ph) processes. The applicability of this model is illustrated
(26) Keana, F. W.; Cai, S. X. J. Org. Chem. 1990, 55, 3640-3647.(27) Iler, R. K. The Chemistry of Silica; Wiley: New York, 1979; p
630.(28) Iler, R. K. The Chemistry of Silica; Wiley: New York, 1979; pp
638-645.(29) Okorn-Schmidt, H. F. IBM J. Res. Develop 1999, 43, 351-365.
σ ) Cantigenp1 ) Cantigen⟨µ⟩ exp(-⟨µ⟩) (10)
σ(t) )Cantigenµmax (1 - exp(-Rt)) exp(- µmax(1 - exp(-Rt)))
(11)
τ(T,t0)/τ(0,t0) ) (1 - exp(-µmax exp(-RT)(1 -exp(-Rt0))))/(1 - exp(µmax(1 - exp(-Rt0)))) (12)
τ(0,t)/τ (0,tmax) ) (1 - exp(-µmax (1 - exp(-Rt))))/(1 - exp(-µmax (1 - exp(-Rtmax)))) (13)
G(τ) ≡ ln(-ln(1 - (τ/DVm))) ) ln(µmax) - RT (14)
Figure 2. Use of a linear regression on G(τ) to obtain valuesof ln(µmax) from the y intercept and R from the slope forimmobilized 393 000 MW monodisperse polystyrene. r2 > 0.998for both curves.
τ(tth, tph ) )DVm (1 - exp(- µmax (1 - exp(-Rthtth - Rphtph))))
(15)
8678 Langmuir, Vol. 20, No. 20, 2004 Graupner and Yan
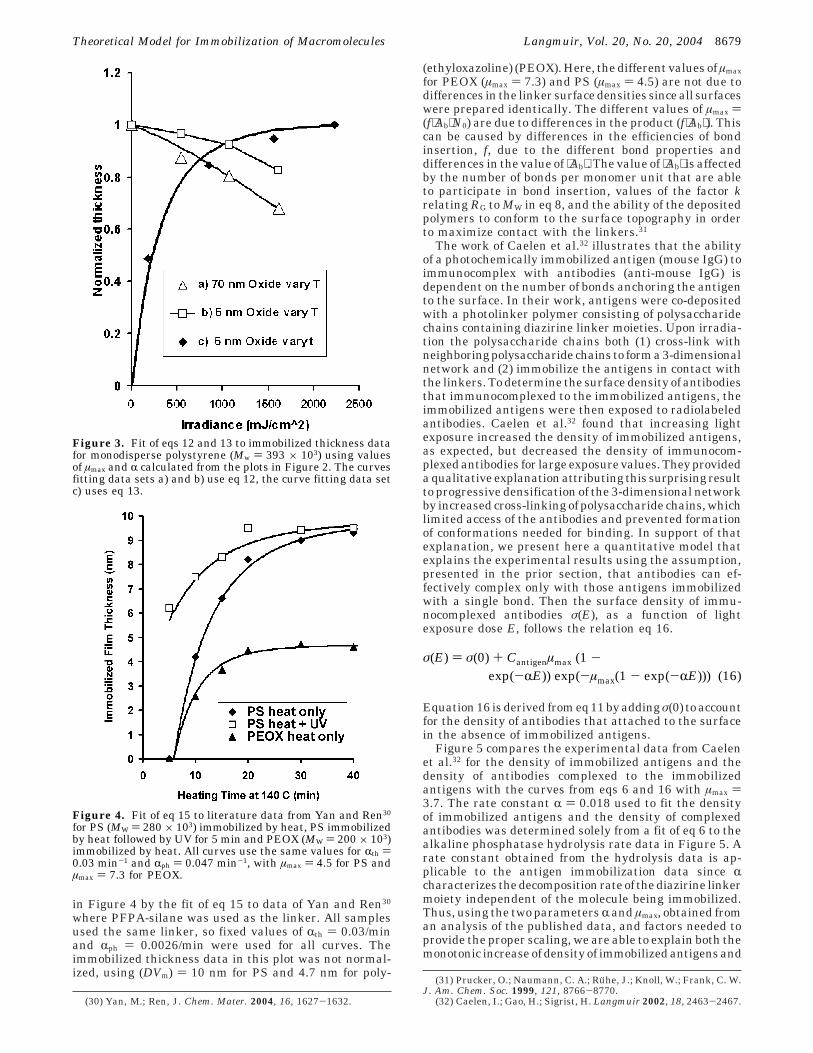
in Figure 4 by the fit of eq 15 to data of Yan and Ren30
where PFPA-silane was used as the linker. All samplesused the same linker, so fixed values of Rth ) 0.03/minand Rph ) 0.0026/min were used for all curves. Theimmobilized thickness data in this plot was not normal-ized, using (DVm) ) 10 nm for PS and 4.7 nm for poly-
(ethyloxazoline) (PEOX). Here, the different values of µmaxfor PEOX (µmax ) 7.3) and PS (µmax ) 4.5) are not due todifferences in the linker surface densities since all surfaceswere prepared identically. The different values of µmax )(f⟨Ab⟩N0) are due to differences in the product (f⟨Ab⟩). Thiscan be caused by differences in the efficiencies of bondinsertion, f, due to the different bond properties anddifferences in the value of ⟨Ab⟩. The value of ⟨Ab⟩ is affectedby the number of bonds per monomer unit that are ableto participate in bond insertion, values of the factor krelating RG to MW in eq 8, and the ability of the depositedpolymers to conform to the surface topography in orderto maximize contact with the linkers.31
The work of Caelen et al.32 illustrates that the abilityof a photochemically immobilized antigen (mouse IgG) toimmunocomplex with antibodies (anti-mouse IgG) isdependent on the number of bonds anchoring the antigento the surface. In their work, antigens were co-depositedwith a photolinker polymer consisting of polysaccharidechains containing diazirine linker moieties. Upon irradia-tion the polysaccharide chains both (1) cross-link withneighboring polysaccharide chains to form a 3-dimensionalnetwork and (2) immobilize the antigens in contact withthe linkers. To determine the surface density of antibodiesthat immunocomplexed to the immobilized antigens, theimmobilized antigens were then exposed to radiolabeledantibodies. Caelen et al.32 found that increasing lightexposure increased the density of immobilized antigens,as expected, but decreased the density of immunocom-plexed antibodies for large exposure values. They provideda qualitative explanation attributing this surprising resultto progressive densification of the 3-dimensional networkby increased cross-linking of polysaccharide chains, whichlimited access of the antibodies and prevented formationof conformations needed for binding. In support of thatexplanation, we present here a quantitative model thatexplains the experimental results using the assumption,presented in the prior section, that antibodies can ef-fectively complex only with those antigens immobilizedwith a single bond. Then the surface density of immu-nocomplexed antibodies σ(E), as a function of lightexposure dose E, follows the relation eq 16.
Equation 16 is derived from eq 11 by adding σ(0) to accountfor the density of antibodies that attached to the surfacein the absence of immobilized antigens.
Figure 5 compares the experimental data from Caelenet al.32 for the density of immobilized antigens and thedensity of antibodies complexed to the immobilizedantigens with the curves from eqs 6 and 16 with µmax )3.7. The rate constant R ) 0.018 used to fit the densityof immobilized antigens and the density of complexedantibodies was determined solely from a fit of eq 6 to thealkaline phosphatase hydrolysis rate data in Figure 5. Arate constant obtained from the hydrolysis data is ap-plicable to the antigen immobilization data since Rcharacterizes the decomposition rate of the diazirine linkermoiety independent of the molecule being immobilized.Thus, using the two parameters R and µmax, obtained froman analysis of the published data, and factors needed toprovide the proper scaling, we are able to explain both themonotonic increase of density of immobilized antigens and
(30) Yan, M.; Ren, J. Chem. Mater. 2004, 16, 1627-1632.
(31) Prucker, O.; Naumann, C. A.; Ruhe, J.; Knoll, W.; Frank, C. W.J. Am. Chem. Soc. 1999, 121, 8766-8770.
(32) Caelen, I.; Gao, H.; Sigrist, H. Langmuir 2002, 18, 2463-2467.
Figure 3. Fit of eqs 12 and 13 to immobilized thickness datafor monodisperse polystyrene (Mw ) 393 × 103) using valuesof µmax and R calculated from the plots in Figure 2. The curvesfitting data sets a) and b) use eq 12, the curve fitting data setc) uses eq 13.
Figure 4. Fit of eq 15 to literature data from Yan and Ren30
for PS (MW ) 280 × 103) immobilized by heat, PS immobilizedby heat followed by UV for 5 min and PEOX (MW ) 200 × 103)immobilized by heat. All curves use the same values for Rth )0.03 min-1 and Rph ) 0.047 min-1, with µmax ) 4.5 for PS andµmax ) 7.3 for PEOX.
σ(E) ) σ(0) + Cantigenµmax (1 -exp(-RE)) exp(-µmax(1 - exp(-RE))) (16)
Theoretical Model for Immobilization of Macromolecules Langmuir, Vol. 20, No. 20, 2004 8679
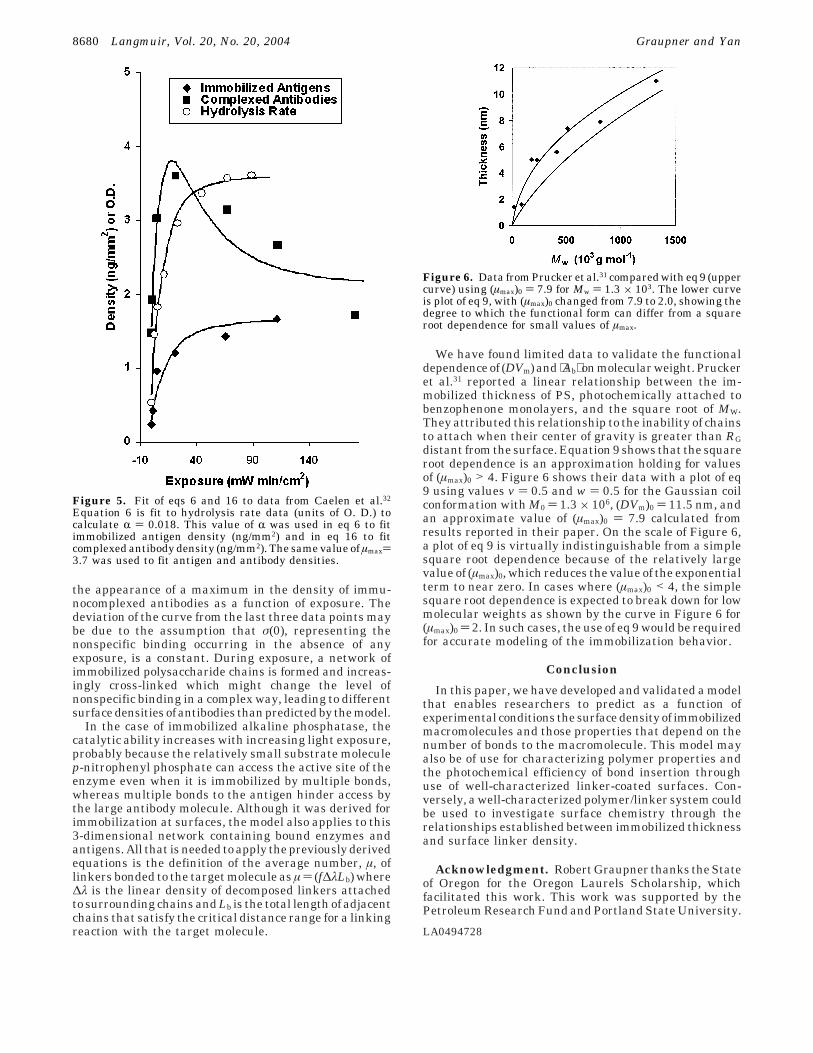
the appearance of a maximum in the density of immu-nocomplexed antibodies as a function of exposure. Thedeviation of the curve from the last three data points maybe due to the assumption that σ(0), representing thenonspecific binding occurring in the absence of anyexposure, is a constant. During exposure, a network ofimmobilized polysaccharide chains is formed and increas-ingly cross-linked which might change the level ofnonspecific binding in a complex way, leading to differentsurface densities of antibodies than predicted by the model.
In the case of immobilized alkaline phosphatase, thecatalytic ability increases with increasing light exposure,probably because the relatively small substrate moleculep-nitrophenyl phosphate can access the active site of theenzyme even when it is immobilized by multiple bonds,whereas multiple bonds to the antigen hinder access bythe large antibody molecule. Although it was derived forimmobilization at surfaces, the model also applies to this3-dimensional network containing bound enzymes andantigens. All that is needed to apply the previously derivedequations is the definition of the average number, µ, oflinkers bonded to the target molecule as µ ) (f∆λLb) where∆λ is the linear density of decomposed linkers attachedto surrounding chains and Lb is the total length of adjacentchains that satisfy the critical distance range for a linkingreaction with the target molecule.
We have found limited data to validate the functionaldependence of (DVm) and ⟨Ab⟩ on molecular weight. Pruckeret al.31 reported a linear relationship between the im-mobilized thickness of PS, photochemically attached tobenzophenone monolayers, and the square root of MW.They attributed this relationship to the inability of chainsto attach when their center of gravity is greater than RGdistant from the surface. Equation 9 shows that the squareroot dependence is an approximation holding for valuesof (µmax)0 > 4. Figure 6 shows their data with a plot of eq9 using values v ) 0.5 and w ) 0.5 for the Gaussian coilconformation with M0 ) 1.3 × 10⁶, (DVm)0 ) 11.5 nm, andan approximate value of (µmax)0 ) 7.9 calculated fromresults reported in their paper. On the scale of Figure 6,a plot of eq 9 is virtually indistinguishable from a simplesquare root dependence because of the relatively largevalue of (µmax)0, which reduces the value of the exponentialterm to near zero. In cases where (µmax)0 < 4, the simplesquare root dependence is expected to break down for lowmolecular weights as shown by the curve in Figure 6 for(µmax)0 ) 2. In such cases, the use of eq 9 would be requiredfor accurate modeling of the immobilization behavior.
Conclusion
In this paper, we have developed and validated a modelthat enables researchers to predict as a function ofexperimental conditions the surface density of immobilizedmacromolecules and those properties that depend on thenumber of bonds to the macromolecule. This model mayalso be of use for characterizing polymer properties andthe photochemical efficiency of bond insertion throughuse of well-characterized linker-coated surfaces. Con-versely, a well-characterized polymer/linker system couldbe used to investigate surface chemistry through therelationships established between immobilized thicknessand surface linker density.
Acknowledgment. Robert Graupner thanks the Stateof Oregon for the Oregon Laurels Scholarship, whichfacilitated this work. This work was supported by thePetroleum Research Fund and Portland State University.
LA0494728
Figure 5. Fit of eqs 6 and 16 to data from Caelen et al.32
Equation 6 is fit to hydrolysis rate data (units of O. D.) tocalculate R ) 0.018. This value of R was used in eq 6 to fitimmobilized antigen density (ng/mm2) and in eq 16 to fitcomplexed antibody density (ng/mm2). The same value of µmax)3.7 was used to fit antigen and antibody densities.
Figure 6. Data from Prucker et al.31 compared with eq 9 (uppercurve) using (µmax)0 ) 7.9 for Mw ) 1.3 × 10³. The lower curveis plot of eq 9, with (µmax)0 changed from 7.9 to 2.0, showing thedegree to which the functional form can differ from a squareroot dependence for small values of µmax.
8680 Langmuir, Vol. 20, No. 20, 2004 Graupner and Yan