Embed Size (px)
Citation preview

http://pie.sagepub.com/Mechanical Engineering
Engineers, Part E: Journal of Process Proceedings of the Institution of Mechanical
http://pie.sagepub.com/content/227/2/89The online version of this article can be found at:
DOI: 10.1177/0954408912469165
2013 227: 89Proceedings of the Institution of Mechanical Engineers, Part E: Journal of Process Mechanical EngineeringRoberto Canepa, Meihong Wang, Chechet Biliyok and Antonio Satta
and exhaust gas recirculation capture2Thermodynamic analysis of combined cycle gas turbine power plant with post-combustion CO
Published by:
http://www.sagepublications.com
On behalf of:
Institution of Mechanical Engineers
can be found at:EngineeringProceedings of the Institution of Mechanical Engineers, Part E: Journal of Process MechanicalAdditional services and information for
http://pie.sagepub.com/cgi/alertsEmail Alerts:
http://pie.sagepub.com/subscriptionsSubscriptions:
http://www.sagepub.com/journalsReprints.navReprints:
http://www.sagepub.com/journalsPermissions.navPermissions:
http://pie.sagepub.com/content/227/2/89.refs.htmlCitations:
What is This?
- May 9, 2013Version of Record >>
at TOBB Ekonomi ve Teknoloji Üniversitesi on April 29, 2014pie.sagepub.comDownloaded from at TOBB Ekonomi ve Teknoloji Üniversitesi on April 29, 2014pie.sagepub.comDownloaded from
Special Issue Article
Thermodynamic analysis of combinedcycle gas turbine power plant with post-combustion CO2 capture and exhaust gasrecirculation
Roberto Canepa1, Meihong Wang2,3, Chechet Biliyok2 andAntonio Satta1
Abstract
Natural gas is expected to make up a significant proportion of the future global energy mix. Therefore, reducing
greenhouse gas emissions from gas-fired processes is very essential for most countries, before emission reduction
targets can be met. This article aims to carry out thermodynamic analysis of combined cycle gas turbine power plant
with post-combustion CO2 capture through modelling and simulation. The combined cycle gas turbine power plant and
the CO2 capture plant were simulated in Aspen Plus�. The combined cycle gas turbine power plant model was validated
with simulation data from GateCycle� and the CO2 capture plant model was validated with experimental data from the
pilot plant at the University of Texas at Austin. The CO2 capture plant was scaled up from pilot plant to commercial scale
to process flue gas from a 250 MWe combined cycle gas turbine power plant. The integrated model for combined cycle
gas turbine and CO2 capture plant was further used for performance study. Exhaust gas recirculation has been proposed
to increase CO2 concentration in flue gas and reduce the flue gas flow rate. Its effect on combined cycle gas turbine
power plant performance and capture plant sizing has been investigated. The analysis indicated that exhaust gas recir-
culation can reduce penalty on thermal efficiency without any major modification to the original power plant.
Keywords
Combined cycle, gas turbine, combined cycle gas turbine, CO2 capture, post-combustion, exhaust gas recirculation,
power plant, process modelling
Date received: 25 August 2012; accepted: 22 October 2012
Introduction
Background
Post-combustion CO2 capture using monoethanola-mine (MEA) solvent is the most promising andmature technology to reduce greenhouse gas emissionsfrom power plants.1 Compared to other availableapproaches, its implementation requires minimalmodifications to the power plant and is therefore seenas the best option for retrofit purpose.When retrofittedto capture, the power plant electric power outputwill besignificantly reduced because of steam extractionrequired for solvent regeneration and because of auxil-iary power required by the capture plant.
Although amine technology for carbon capture is aproven technology in oil, gas and chemical industrieswith many decades of successful operations, thedesign of a capture plant of the scale required toachieve up to 90% capture in a fossil fuel fired
power plant is one important step forward. Forinstance, one of the largest capture plants availabletoday, built by Mitsubishi Heavy Industries, is ableto process up to 450 t of CO2 per day.
2
From CO2 capture perspective, combined cycle gasturbine (CCGT) power plants present the advantageof higher thermodynamic efficiency, but with the dis-advantage of a lower CO2 content in exhaust gaswhen compared with coal fired power plants. This,in combination with higher specific flue gas flow
Proc IMechE Part E:
J Process Mechanical Engineering
227(2) 89–105
! IMechE 2012
Reprints and permissions:
sagepub.co.uk/journalsPermissions.nav
DOI: 10.1177/0954408912469165
uk.sagepub.com/jpme
1DIME-MASET, University of Genova, Genova, Italy2Process Systems Engineering Group, School of Engineering, CranEeld
University, Bedfordshire, UK3School of Engineering, University of Hull, Hull, UK
Corresponding author:
Roberto Canepa, DIME-MASET, University of Genova, Via Montallegro
1, 16145 Genova, Italy.
Email: [email protected]
at TOBB Ekonomi ve Teknoloji Üniversitesi on April 29, 2014pie.sagepub.comDownloaded from
rate, results in a higher capacity requirement for theCO2 capture plant and a more expensive process interms of higher reboiler and pump duties. The disad-vantage of lower CO2 concentration in flue gas can beovercome through exhaust gas recirculation (EGR):exhaust gases, after transferring heat to the steamcycle through the heat recovery steam generator(HRSG), are partially cooled down and recirculatedback to gas turbine (GT) intake. In this study, theimpact of EGR on both the CCGT power plant andthe CO2 capture plant will be investigated.
Previous research
The performance of power plants with post-combus-tion CO2 capture has been studied by a number ofresearchers through modelling and simulation.Hetland et al.3 and Kvamsdal et al.4 designed andoptimised a post-combustion CO2 capture plant forintegration with a 450MWe offshore CCGT powerplant, and considered the pre-conditioning of theexhaust gas. Particular attention was given on off-shore operation-related problems, such as sea forcesand the need to maintain a neutral water balance.Karimi et al.5 analyzed a 430MWe CCGT powerplant integrated with post-combustion CO2 captureon both full and partial load conditions. Partial loadinvestigations comprise the effect of inlet guide vanesand the use of throttle valve at the steam extractionpoint. Lawal et al.6 described the development andvalidation of a dynamic model for coal-fired powerplant integrated with CO2 capture plant. The scale-up of the capture plant from pilot scale to full scalewas also discussed.
A number of studies explored CO2 capture bymeans of amine solvent. Kvamsdal et al.7 and Lawalet al.8 presented the dynamic modelling and simula-tion of the absorber. Lawal et al.8 also showed thatrate-based modelling of the absorber is more accuratethan equilibrium-based ones. Lawal et al.9 extendedthe analysis to the stand-alone regenerator column.Stand-alone modelling brings inaccuracy due to theclosed loop with solvent recycle of the real process.Lawal et al.10 and Biliyok et al.11 described the closedloop modelling of the whole capture plant and showedhow it allows a better performance estimation overthe stand-alone modelling. A detailed rate-basedmodelling and validation of the absorber columnwas made by Kvamsdal et al.12 and Zhang et al.13
Notably Zhang et al.13 examined the impacts of keyrate-based modelling options like Elm discretisation,Fow model options and showed the superiority of therate-based models over the traditional equilibrium-stage models.
EGR has been investigated by many authors. Liet al.14 showed that CO2 content in the flue gas canbe increased by EGR from 3.8 to 8.7mol%, reducingthe total thermal energy consumption of the reboilerby 60%. Bolland and Mathieu15 compared two
concepts for increasing CO2 capture efficiency inCCGT power plant. The first involves EGR whilethe second is based on a semi-closed GT cycle usingCO2 as the working Fuid and combustion withpure oxygen. It is shown that the system efficiencywith EGR is always higher by 2–3% points thanthe CO2-based combined cycle in comparableconditions.
Motivation and novelty
The design of a capture facility for CCGT powerplant on a commercial scale is a necessary step for-ward to prove the viability of carbon capture technol-ogy. Current CO2 capture projects involve pilot plantson a much smaller scale than would be required com-mercially. The pilot plant built by Doosan PowerSystems at SSE’s Ferrybridge power station in WestYorkshire,16 the first of its size to be integrated into alive power plant in the UK, is able to capture 100 t ofCO2 per day, equivalent to 5MWe of power gener-ation, which is only a small fraction of the totalexhaust gas from the 2000MWe plant. Despite this,the project has required more than �20 million invest-ment. Full scale demonstration projects are expectedto cost over a billion dollars17 and moreover thesefacilities are limited in the range of studies that canbe carried out. By accurately modelling the power andthe capture plants, and by integration of the models,useful insights on design and operation can bederived.
EGR is viewed as a potential effective way todecrease the high thermal efficiency penalty causedby chemical absorption. From this perspective, adetailed analysis of EGR effect on CCGT powerplant and CO2 capture plant is required to assess itsimpact on power plant performance and sizing. Basedon the oxygen chamber combustion stability and com-pleteness, a reasonable EGR ratio is identified andapplied to the power plant. Therefore, the absorberand regenerator columns were sized to account for thenew CO2 concentration and flue gas flow rate.
The novelty of this article can be summarised as:(a) scale-up of CO2 capture plant for a specific CCGTpower plant and (b) study of the impact of EGR onperformance of CCGT power plant with CO2 capture.
Outline
Model development and validation of the CCGTpower plant is presented in ‘Simulation and model val-idation of CCGT power plant’. This is followed bymodel development and validation of the CO2 captureplant in ‘Simulation and validation of CO2 captureplant’ and also includes the capture plant scale-upfrom pilot plant scale (where it was validated) to fullscale. The next section describes the integrationbetween the CCGT power plant and the captureplant. EGR impact on CCGT power plant and capture
90 Proc IMechE Part E: J Process Mechanical Engineering 227(2)
at TOBB Ekonomi ve Teknoloji Üniversitesi on April 29, 2014pie.sagepub.comDownloaded from
plant performance is studied in ‘Impact of EGR’.Finally, conclusions are drawn in the last section.
Simulation and model validation ofCCGT power plant
CCGT power plant description
A CCGT plant comprising of one Westinghouse 501FGT, one single pressure HRSG and one condensingsteam turbine, is selected. The required data for theWestinghouse 501F GT were obtained from theGateCycle (General Electric Company) softwarelibrary. GT exhaust gases, through the HRSG, pro-vide heating to the steam turbine cycle without anysupplementary boiler firing. The steam, at 52 bar,leaves the third section of the HRSG superheated to810K and then expands through the high pressuresteam turbine (HP-ST). To allow the bleeding ofsteam at 3 bar to feed the deaerator, the condensingturbine has been split in two other section: intermedi-ate pressure steam turbine (IP-ST) and low pressuresteam turbine (LP-ST) in which the steam enter at 5and 3 bar, respectively. Thermodynamic simulationsof the CCGT power plant have been performedusing the commercial software Aspen Plus� (AspenTechnology Inc.)
Model development for GT
The PR–BM property method (Peng–Robinson equa-tion of state with Boston–Mathias modifications) isused for the gas cycle and the STEAMNBS propertymethod is used for steam cycle, for accurate evalu-ation of the steams properties.
The combustor in GT has been modelled with anRGibbs reactor block. It determines the equilibriumcomposition using the Gibbs free energy minimisationsystem. As an alternative, it is also possible to definethe extent of equilibrium to be reached. Reactor tem-perature and pressure have to be specified but thereaction stoichiometry is not required.
The compressor and turbine in GT were simulatedas Compr blocks. The Aspen Plus� block Compr canbe used to model polytropic centrifugal or positivedisplacement compressors and isentropic compressorsor turbines. The accuracy of the results depends onthe efficiencies specified. However, to properly analyseGT cycles, some modifications of this block arerequired.18 In particular, flue gas temperature at GToutlet and power output are highly connected to tur-bine blade cooling. Turbine blade cooling, usuallyachieved by air bled from the compressor, is requiredto permit high turbine inlet temperature and thereforehigh efficiency engine operation. This relatively largecooling flow (approximately 20% of the inlet air flow)has two negative effects: first it reduces the tempera-ture of the gas expanding through the turbine, andtherefore its power output, second it adds losses con-nected with the mixing of the cooling air with theturbine working fluid. Both of these effects are takeninto account as suggested in Jonsson et al.19 The cool-ing air is taken from compressor outlet and mixedwith the combustion products before entering the tur-bine (Figure 1). The cooling fluid mass flow rate _mc iscalculated with the following equation
_mccp,c_mgcp,g
¼ bTcmb exit � Tb
Tb � Tcmpr exit
� �s
ð1Þ
Compressor
Cooling
Turbine
Combustor
Fuel
Ambient air
HRSG
to CO2removal plant
Figure 1. GT in CCGT configuration schematic figure.
CCGT: combined cycle gas turbine.
Canepa et al. 91
at TOBB Ekonomi ve Teknoloji Üniversitesi on April 29, 2014pie.sagepub.comDownloaded from
where Tb represents a generic blade surface tempera-ture, cp,c the average specific heat capacity of gasesbetween the blade temperature and the compressorexit temperature and cp,g the average specific heat cap-acity of gases between the blade temperature andcombustor exit temperature. The pressure losseslinked with the cooling ð�pcÞ are evaluated using thefollowing momentum balance equation for the mixing
�pcptbn inlet
¼ �_mc
_mgK ð2Þ
The three model parameters (b, K and s) have beenadjusted to properly represent the analyzed GT. Themain assumptions and the results of the model tuningare reported in Table 1, while model performance isshown in Table 2.
Model development for CCGT power plant andvalidation
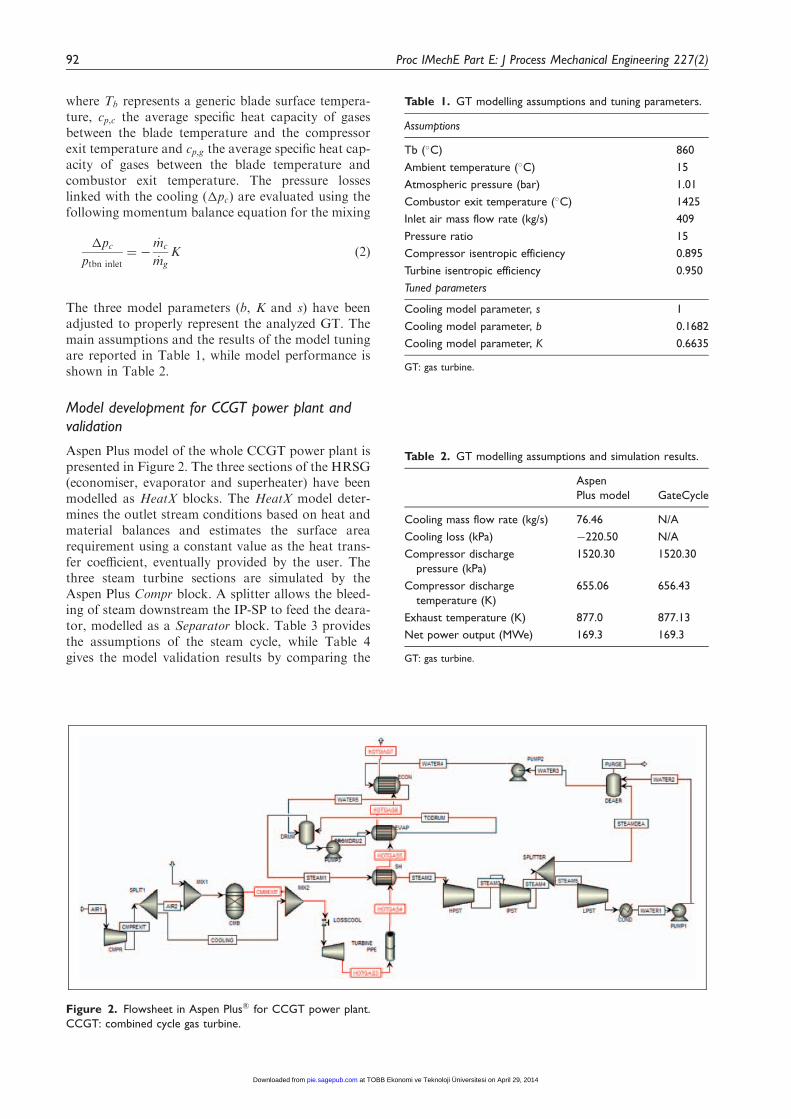
Aspen Plus model of the whole CCGT power plant ispresented in Figure 2. The three sections of the HRSG(economiser, evaporator and superheater) have beenmodelled as HeatX blocks. The HeatX model deter-mines the outlet stream conditions based on heat andmaterial balances and estimates the surface arearequirement using a constant value as the heat trans-fer coefficient, eventually provided by the user. Thethree steam turbine sections are simulated by theAspen Plus Compr block. A splitter allows the bleed-ing of steam downstream the IP-SP to feed the deara-tor, modelled as a Separator block. Table 3 providesthe assumptions of the steam cycle, while Table 4gives the model validation results by comparing the
Figure 2. Flowsheet in Aspen Plus� for CCGT power plant.
CCGT: combined cycle gas turbine.
Table 1. GT modelling assumptions and tuning parameters.
Assumptions
Tb (�C) 860
Ambient temperature (�C) 15
Atmospheric pressure (bar) 1.01
Combustor exit temperature (�C) 1425
Inlet air mass flow rate (kg/s) 409
Pressure ratio 15
Compressor isentropic efficiency 0.895
Turbine isentropic efficiency 0.950
Tuned parameters
Cooling model parameter, s 1
Cooling model parameter, b 0.1682
Cooling model parameter, K 0.6635
GT: gas turbine.
Table 2. GT modelling assumptions and simulation results.
Aspen
Plus model GateCycle
Cooling mass flow rate (kg/s) 76.46 N/A
Cooling loss (kPa) �220.50 N/A
Compressor discharge
pressure (kPa)
1520.30 1520.30
Compressor discharge
temperature (K)
655.06 656.43
Exhaust temperature (K) 877.0 877.13
Net power output (MWe) 169.3 169.3
GT: gas turbine.
92 Proc IMechE Part E: J Process Mechanical Engineering 227(2)
at TOBB Ekonomi ve Teknoloji Üniversitesi on April 29, 2014pie.sagepub.comDownloaded from
simulation results with those obtained fromGateCycle software with the same inputs.
Flue gas pre-processing
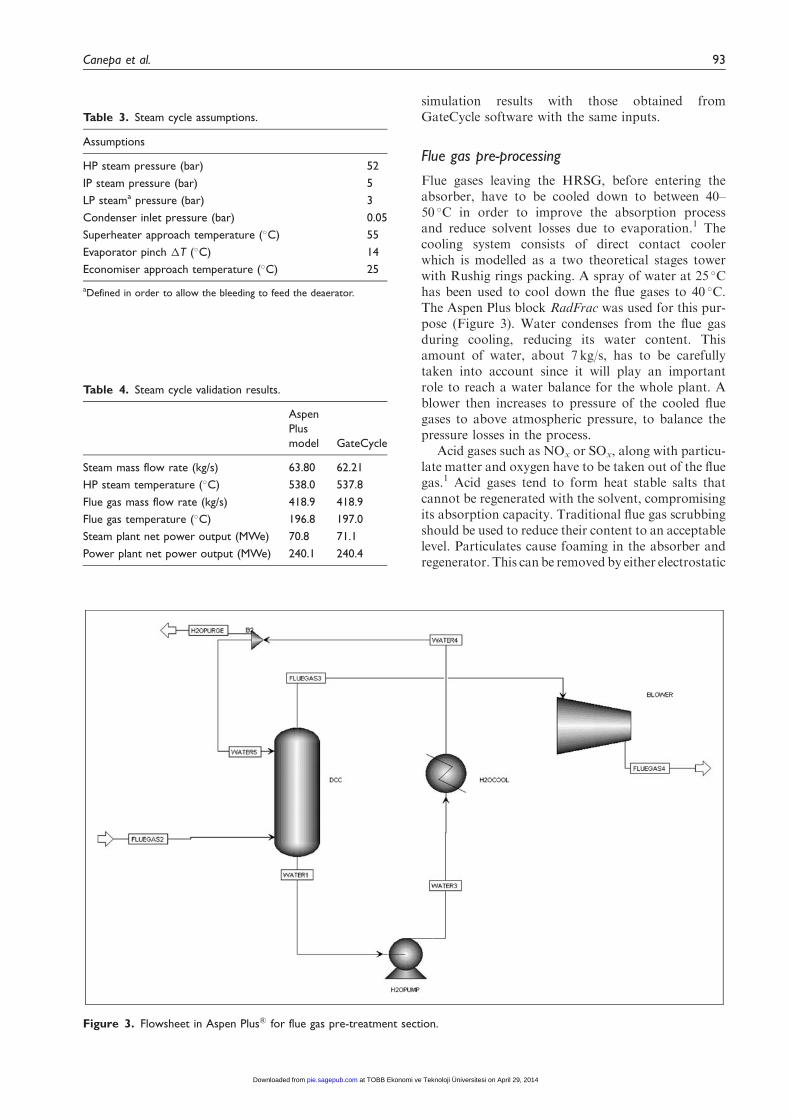
Flue gases leaving the HRSG, before entering theabsorber, have to be cooled down to between 40–50 �C in order to improve the absorption processand reduce solvent losses due to evaporation.1 Thecooling system consists of direct contact coolerwhich is modelled as a two theoretical stages towerwith Rushig rings packing. A spray of water at 25 �Chas been used to cool down the flue gases to 40 �C.The Aspen Plus block RadFrac was used for this pur-pose (Figure 3). Water condenses from the flue gasduring cooling, reducing its water content. Thisamount of water, about 7 kg/s, has to be carefullytaken into account since it will play an importantrole to reach a water balance for the whole plant. Ablower then increases to pressure of the cooled fluegases to above atmospheric pressure, to balance thepressure losses in the process.
Acid gases such as NOx or SOx, along with particu-late matter and oxygen have to be taken out of the fluegas.1 Acid gases tend to form heat stable salts thatcannot be regenerated with the solvent, compromisingits absorption capacity. Traditional flue gas scrubbingshould be used to reduce their content to an acceptablelevel. Particulates cause foaming in the absorber andregenerator. This can be removed by either electrostatic
Figure 3. Flowsheet in Aspen Plus� for flue gas pre-treatment section.
Table 3. Steam cycle assumptions.
Assumptions
HP steam pressure (bar) 52
IP steam pressure (bar) 5
LP steama pressure (bar) 3
Condenser inlet pressure (bar) 0.05
Superheater approach temperature (�C) 55
Evaporator pinch �T (�C) 14
Economiser approach temperature (�C) 25
aDefined in order to allow the bleeding to feed the deaerator.
Table 4. Steam cycle validation results.
Aspen
Plus
model GateCycle
Steam mass flow rate (kg/s) 63.80 62.21
HP steam temperature (�C) 538.0 537.8
Flue gas mass flow rate (kg/s) 418.9 418.9
Flue gas temperature (�C) 196.8 197.0
Steam plant net power output (MWe) 70.8 71.1
Power plant net power output (MWe) 240.1 240.4
Canepa et al. 93
at TOBB Ekonomi ve Teknoloji Üniversitesi on April 29, 2014pie.sagepub.comDownloaded from
precipitators or bag house filters. Oxygen content alsohas to be controlled to avoid corrosion of the equip-ment and solvent degradation. For simplicity, an idealcleaning process has been considered and therefore allthe unwanted species have been takenout, leaving a fluegas with only four species (Table 5).
Simulation and validation of CO2 captureplant
CO2 capture pilot plant
A test campaign consisting of 48 runs at 24 operatingconditions, conducted by the Separation Research
Programme (SRP) at the University of Texas atAustin pilot plant has been used to validate the cap-ture plant model in Aspen Plus�.20 The pilot plant is aclosed loop absorption and stripping facility for CO2
removal from flue gas with 32.5wt% aqueous MEAsolution. The absorber and the regenerator are carbonsteel columns, each with an internal diameter of0.427m and a total column height of 11m. The pack-ing consists of two 3.05m packed bed sections with acollector plate and redistributor between the beds.The absorber was kept at atmospheric pressurewhile the stripper operated at a pressure slightlyhigher than the atmospheric and for the last fourruns was operated in vacuum. Two different kindsof packing have been adopted: Flexipac 1Y, a struc-tured packing with a specific area of 420m2/m3 andIMTP no. 40, a random metal packing with a specificarea of 145m2/m3.
Simulation of CO2 capture pilot plant and validation
A closed-loop rate based capture model for the CO2
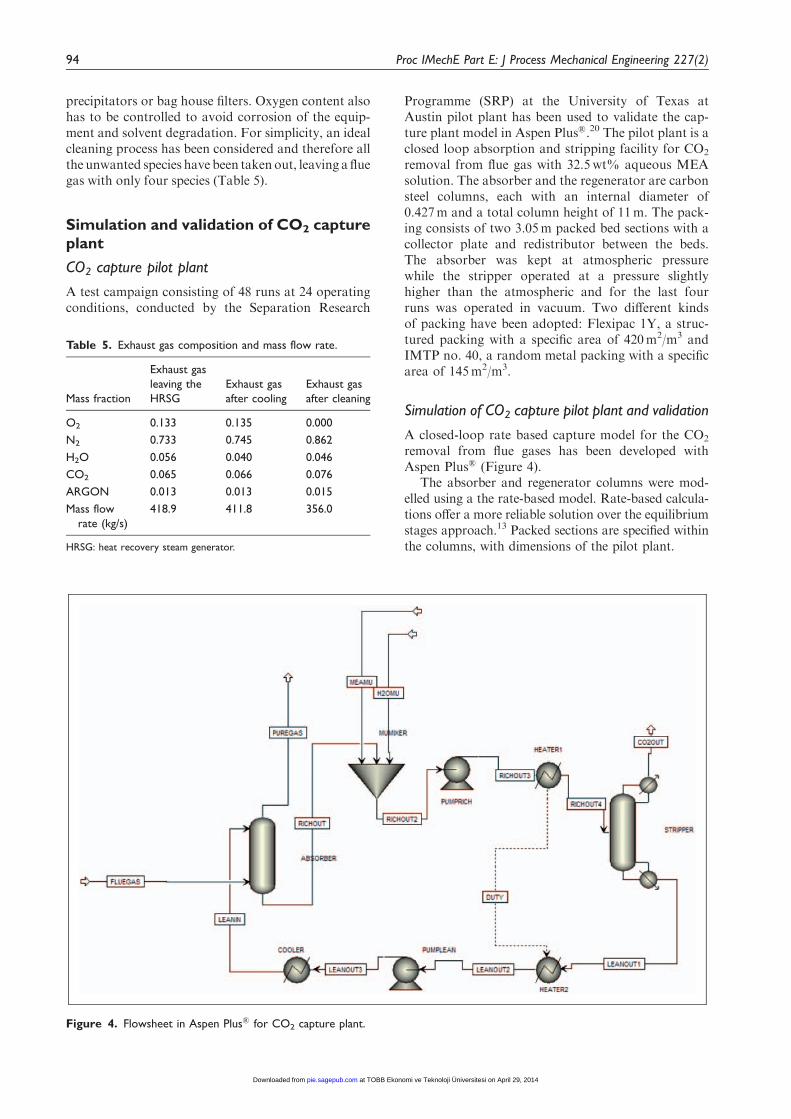
removal from flue gases has been developed withAspen Plus� (Figure 4).
The absorber and regenerator columns were mod-elled using a the rate-based model. Rate-based calcula-tions offer a more reliable solution over the equilibriumstages approach.13 Packed sections are specified withinthe columns, with dimensions of the pilot plant.
Figure 4. Flowsheet in Aspen Plus� for CO2 capture plant.
Table 5. Exhaust gas composition and mass flow rate.
Mass fraction
Exhaust gas
leaving the
HRSG
Exhaust gas
after cooling
Exhaust gas
after cleaning
O2 0.133 0.135 0.000
N2 0.733 0.745 0.862
H2O 0.056 0.040 0.046
CO2 0.065 0.066 0.076
ARGON 0.013 0.013 0.015
Mass flow
rate (kg/s)
418.9 411.8 356.0
HRSG: heat recovery steam generator.
94 Proc IMechE Part E: J Process Mechanical Engineering 227(2)
at TOBB Ekonomi ve Teknoloji Üniversitesi on April 29, 2014pie.sagepub.comDownloaded from
The absorber column uses IMTP no. 40 packing,with the mass transfer coefficients and the interfacialarea predicted by Onda correlation,21 while theholdup was calculated with the Stichlmair correl-ation.22 The regenerator column uses Flexipack 1Ypacking, where Bravo correlation (1985) is used formass transfer coefficient and interfacial area evalu-ation.23 The Bravo correlation (1992) is used forholdup calculation.24 For both packings, the Chiltonand Colburn correlation was used for the evaluationof the heat transfer coefficients.25 In each phase, thethickness of the film is determined as the ratio of theaverage diffusivity and average mass transfer coeffi-cient, the film resistance is calculated by discretisingthe films, and reactions are considered in the liquidfilm. Out of the four different flow models available,the ‘mixed’ Fow model was chosen.
The cross-heat exchanger was modelled with twodifferent Heater blocks, one for the hot and anotherfor the cold side, connected by an heat stream in orderto match their heat duties.
The closed-loop configuration adopted for the cap-ture plant has a better columns performance predic-tion11 over the standalone configuration, thanks tothe fact that this representation is closer to the realprocess with a recycle. In the simulation, the lean solv-ent is treated as a tear stream and its flow rate istherefore not an input to the calculation. Solventmakeup is required to close the loop due to losses invapour streams leaving both the absorber and regen-erator columns. A water section at the top of theabsorber can reduce solvent loss. However, waterwash was not included in this study.
The physical property method used is theElectrolyte Non-Random-Two-Liquid model forliquid and RK equation of state for vapour. The kin-etic model proposed by Aboudehir et al.26 andAspentech27 is adapted for this study. The model iscomprised of both equilibrium and rate-controlledreactions.
The equilibrium reactions are defined as
2H2O$ H3OþþOH� ð3Þ
HCO�3 þH2O$ H3Oþþ CO2�
3 ð4Þ
MEAHþ þH2O$MEAþH3Oþ
ð5Þ
The following set of rate-controlled reactions hasbeen defined
CO2 þOH� ! HCO�3 ð6Þ
HCO�3 ! CO2 þOH� ð7Þ
MEAþ CO2 þH2O!MEACOO� þH3Oþ
ð8Þ
MEACOO� þH3Oþ!MEAþ CO2 þH2O
ð9Þ
The equilibrium constants Keq for the reactions (3)to (5), on a molar concentration basis, can be deter-mined as
ln Keq
� �¼ Aþ
B
Tþ C � ln Tð Þ þD � T ð10Þ
And the kinetic expressions (6) to (9) are governed bythe power law expression
r ¼ kTnexp �E
RT
� �YNi¼1
Caii ð11Þ
The values of the parameter A, B, C and D for theequilibrium reactions as well as the kinetic param-eters, are given in Table 6.
Out of the 48 experimental cases carried out in thetest campaign, three cases (cases 28, 32 and 47) werechosen for validation to account for different liquid togas (L/G) ratios. Table 7 shows the process conditionsfor these cases.
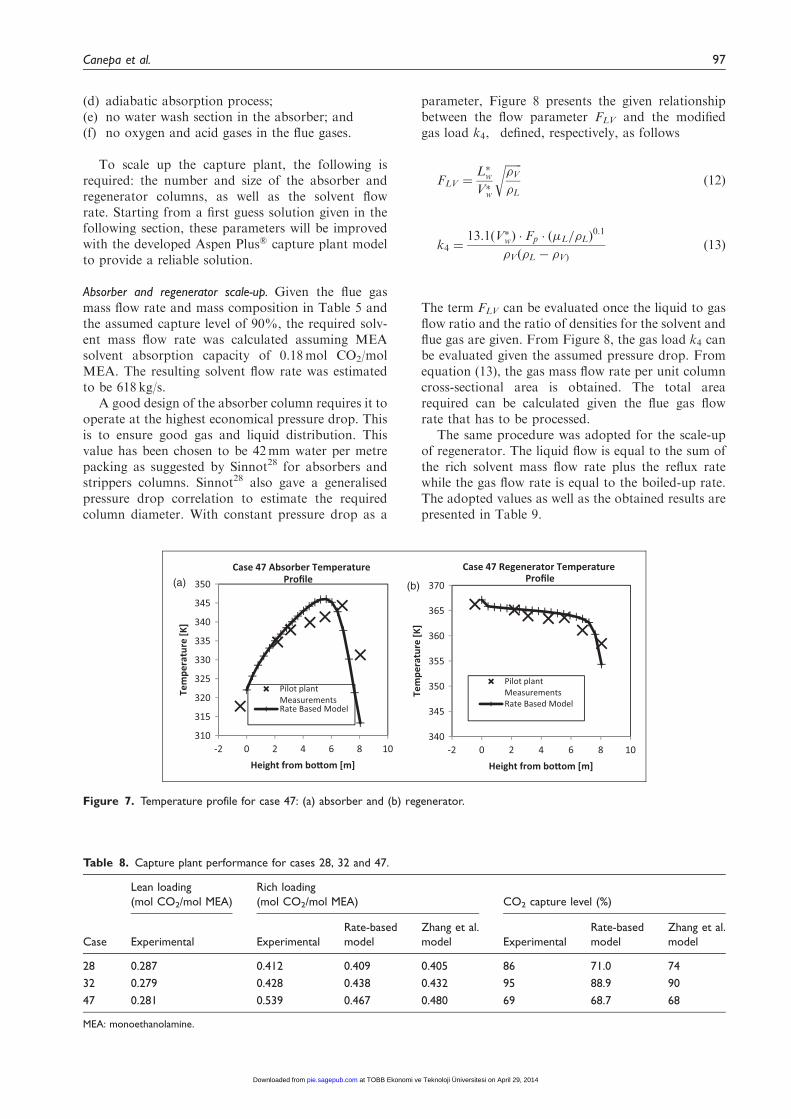
Figures 5 to 7 show the comparison of absorberand regenerator temperature profiles between themodel and the pilot plant measurements for thecases 28, 32 and 47, respectively. It can be observedthat the predictions of the model generally agree withthe available experimental data.
In Table 8, the overall performance of the CO2
capture plant model was reported. The simulationresults were compared with the experimental resultsand with those obtained by Zhang et al.13 from theirAspen Plus simulation results. The lean loading of theabsorber solvent feed stream is, in our closed-loopmodel, controlled by a design specification set in theregenerator column. The rich loading of the streamcoming from the bottom of the absorber is estimated
Table 6. Coefficient of equilibrium constants and kinetic
parameters.
Equation
no. A B C D
3 132.889 �13,455.9 �22.4773 0
4 216.049 �12,431.7 �35.4819 0
5 �3.03832 �7008.357 0 �0.0031348
k E (cal/mol)
6 4.32 eþ 13 13,249
7 2.38 eþ 17 29,451
8 9.77 eþ 10 9855.8
9 2.18 eþ 18 14,138.4
Canepa et al. 95
at TOBB Ekonomi ve Teknoloji Üniversitesi on April 29, 2014pie.sagepub.comDownloaded from
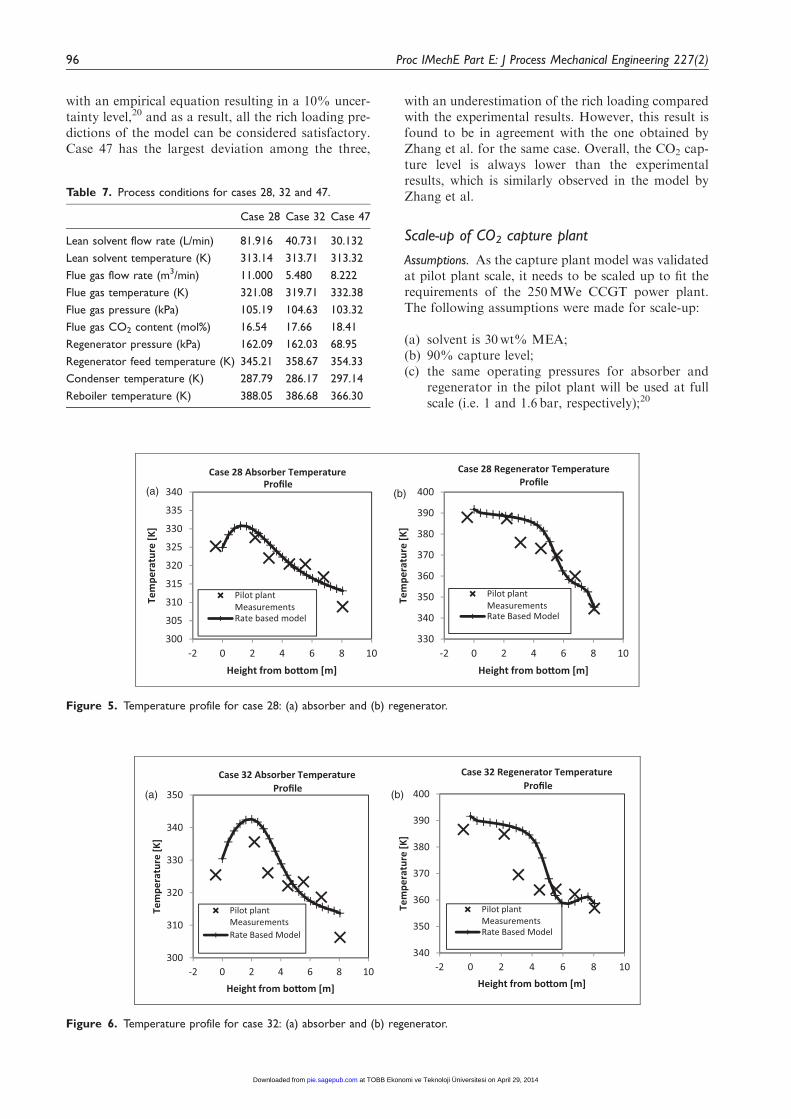
with an empirical equation resulting in a 10% uncer-tainty level,20 and as a result, all the rich loading pre-dictions of the model can be considered satisfactory.Case 47 has the largest deviation among the three,
with an underestimation of the rich loading comparedwith the experimental results. However, this result isfound to be in agreement with the one obtained byZhang et al. for the same case. Overall, the CO2 cap-ture level is always lower than the experimentalresults, which is similarly observed in the model byZhang et al.
Scale-up of CO2 capture plant
Assumptions. As the capture plant model was validatedat pilot plant scale, it needs to be scaled up to fit therequirements of the 250MWe CCGT power plant.The following assumptions were made for scale-up:
(a) solvent is 30wt% MEA;(b) 90% capture level;(c) the same operating pressures for absorber and
regenerator in the pilot plant will be used at fullscale (i.e. 1 and 1.6 bar, respectively);20
300
310
320
330
340
350(a) (b)
-2 0 2 4 6 8 10
Tem
pera
ture
[K]
Height from bo�om [m]
Case 32 Absorber Temperature Profile
Pilot plant MeasurementsRate Based Model
340
350
360
370
380
390
400
-2 0 2 4 6 8 10
Tem
pera
ture
[K]
Height from bo�om [m]
Case 32 Regenerator Temperature Profile
Pilot plant MeasurementsRate Based Model
Figure 6. Temperature profile for case 32: (a) absorber and (b) regenerator.
300
305
310
315
320
325
330
335
340(a) (b)
-2 0 2 4 6 8 10
Tem
pera
ture
[K]
Height from bo�om [m]
Case 28 Absorber Temperature Profile
Pilot plant MeasurementsRate based model
330
340
350
360
370
380
390
400
-2 0 2 4 6 8 10
Tem
pera
ture
[K]
Height from bo�om [m]
Case 28 Regenerator Temperature Profile
Pilot plant MeasurementsRate Based Model
Figure 5. Temperature profile for case 28: (a) absorber and (b) regenerator.
Table 7. Process conditions for cases 28, 32 and 47.
Case 28 Case 32 Case 47
Lean solvent flow rate (L/min) 81.916 40.731 30.132
Lean solvent temperature (K) 313.14 313.71 313.32
Flue gas flow rate (m3/min) 11.000 5.480 8.222
Flue gas temperature (K) 321.08 319.71 332.38
Flue gas pressure (kPa) 105.19 104.63 103.32
Flue gas CO2 content (mol%) 16.54 17.66 18.41
Regenerator pressure (kPa) 162.09 162.03 68.95
Regenerator feed temperature (K) 345.21 358.67 354.33
Condenser temperature (K) 287.79 286.17 297.14
Reboiler temperature (K) 388.05 386.68 366.30
96 Proc IMechE Part E: J Process Mechanical Engineering 227(2)
at TOBB Ekonomi ve Teknoloji Üniversitesi on April 29, 2014pie.sagepub.comDownloaded from
(d) adiabatic absorption process;(e) no water wash section in the absorber; and(f) no oxygen and acid gases in the flue gases.
To scale up the capture plant, the following isrequired: the number and size of the absorber andregenerator columns, as well as the solvent flowrate. Starting from a first guess solution given in thefollowing section, these parameters will be improvedwith the developed Aspen Plus� capture plant modelto provide a reliable solution.
Absorber and regenerator scale-up. Given the flue gasmass flow rate and mass composition in Table 5 andthe assumed capture level of 90%, the required solv-ent mass flow rate was calculated assuming MEAsolvent absorption capacity of 0.18mol CO2/molMEA. The resulting solvent flow rate was estimatedto be 618 kg/s.
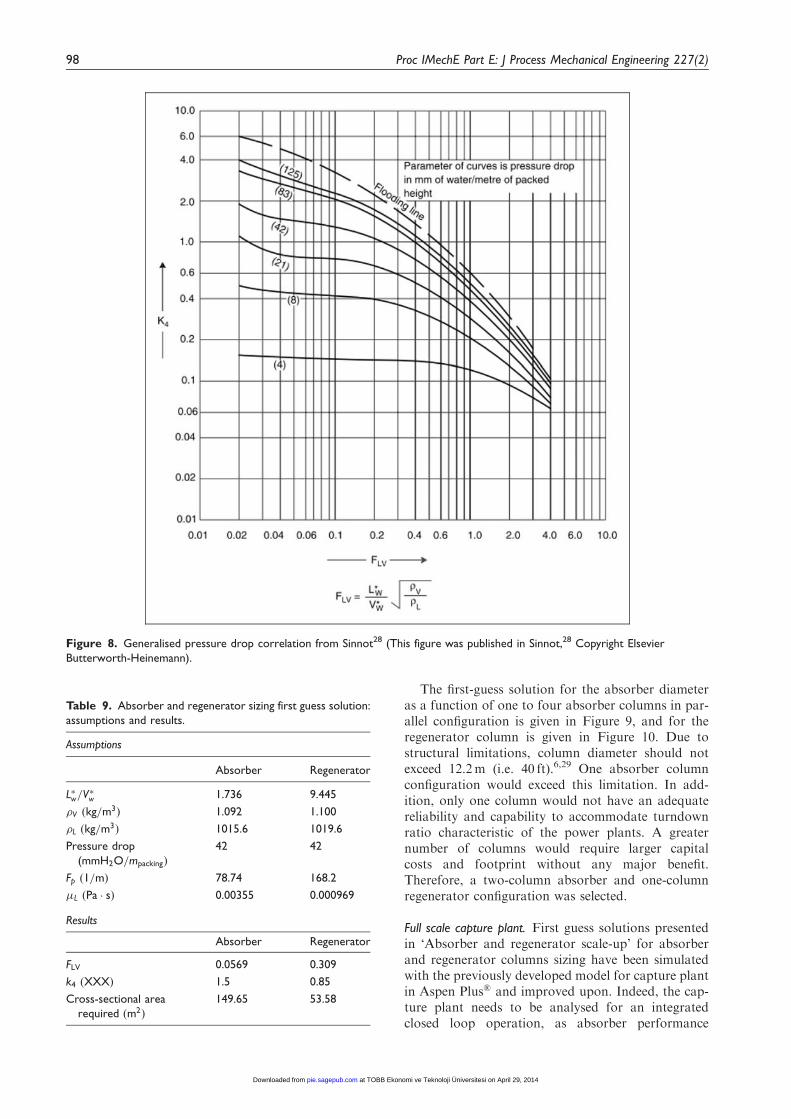
A good design of the absorber column requires it tooperate at the highest economical pressure drop. Thisis to ensure good gas and liquid distribution. Thisvalue has been chosen to be 42mm water per metrepacking as suggested by Sinnot28 for absorbers andstrippers columns. Sinnot28 also gave a generalisedpressure drop correlation to estimate the requiredcolumn diameter. With constant pressure drop as a
parameter, Figure 8 presents the given relationshipbetween the flow parameter FLV and the modifiedgas load k4, defined, respectively, as follows
FLV ¼L�wV�w
ffiffiffiffiffiffi�V�L
rð12Þ
k4 ¼13:1ðV�wÞ � Fp � ð�L=�LÞ
0:1
�Vð�L � �VÞð13Þ
The term FLV can be evaluated once the liquid to gasflow ratio and the ratio of densities for the solvent andflue gas are given. From Figure 8, the gas load k4 canbe evaluated given the assumed pressure drop. Fromequation (13), the gas mass flow rate per unit columncross-sectional area is obtained. The total arearequired can be calculated given the flue gas flowrate that has to be processed.
The same procedure was adopted for the scale-upof regenerator. The liquid flow is equal to the sum ofthe rich solvent mass flow rate plus the reflux ratewhile the gas flow rate is equal to the boiled-up rate.The adopted values as well as the obtained results arepresented in Table 9.
310
315
320
325
330
335
340
345
350 (b)(a)
-2 0 2 4 6 8 10
Tem
pera
ture
[K]
Height from bo�om [m]
Case 47 Absorber Temperature Profile
Pilot plant MeasurementsRate Based Model
340
345
350
355
360
365
370
-2 0 2 4 6 8 10
Tem
pera
ture
[K]
Height from bo�om [m]
Case 47 Regenerator Temperature Profile
Pilot plant MeasurementsRate Based Model
Figure 7. Temperature profile for case 47: (a) absorber and (b) regenerator.
Table 8. Capture plant performance for cases 28, 32 and 47.
Case
Lean loading
(mol CO2/mol MEA)
Rich loading
(mol CO2/mol MEA) CO2 capture level (%)
Experimental Experimental
Rate-based
model
Zhang et al.
model Experimental
Rate-based
model
Zhang et al.
model
28 0.287 0.412 0.409 0.405 86 71.0 74
32 0.279 0.428 0.438 0.432 95 88.9 90
47 0.281 0.539 0.467 0.480 69 68.7 68
MEA: monoethanolamine.
Canepa et al. 97
at TOBB Ekonomi ve Teknoloji Üniversitesi on April 29, 2014pie.sagepub.comDownloaded from
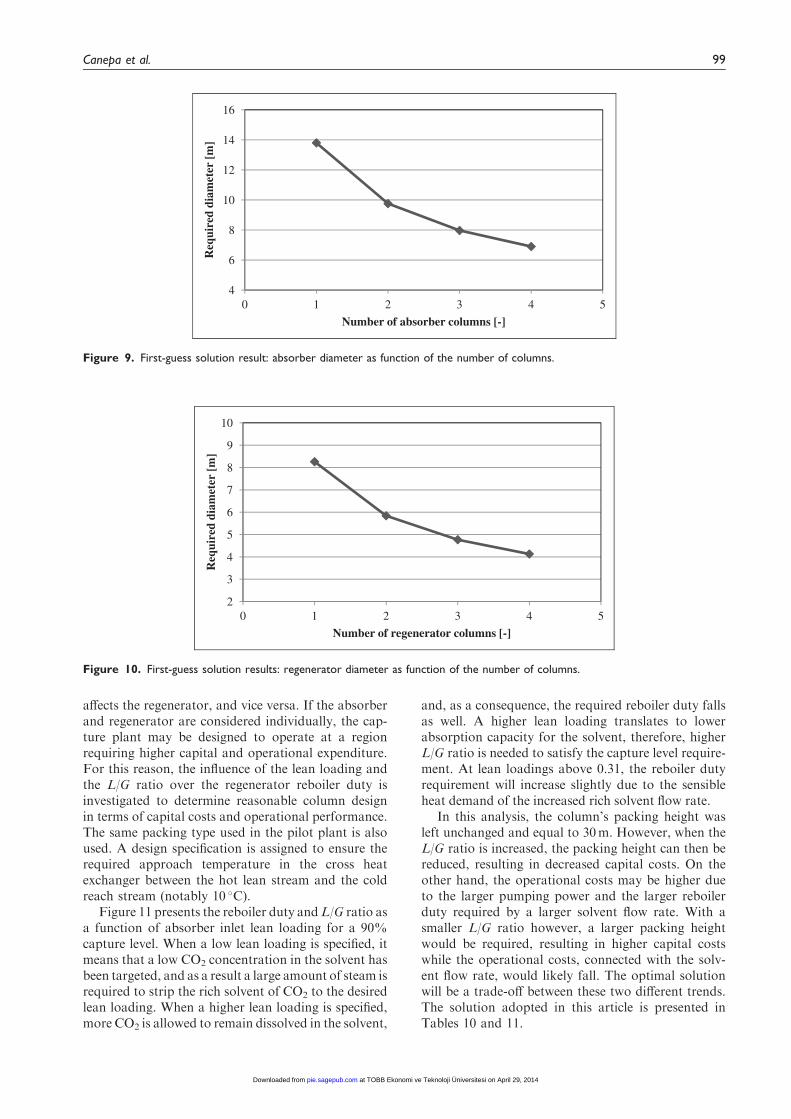
The first-guess solution for the absorber diameteras a function of one to four absorber columns in par-allel configuration is given in Figure 9, and for theregenerator column is given in Figure 10. Due tostructural limitations, column diameter should notexceed 12.2m (i.e. 40 ft).6,29 One absorber columnconfiguration would exceed this limitation. In add-ition, only one column would not have an adequatereliability and capability to accommodate turndownratio characteristic of the power plants. A greaternumber of columns would require larger capitalcosts and footprint without any major benefit.Therefore, a two-column absorber and one-columnregenerator configuration was selected.
Full scale capture plant. First guess solutions presentedin ‘Absorber and regenerator scale-up’ for absorberand regenerator columns sizing have been simulatedwith the previously developed model for capture plantin Aspen Plus� and improved upon. Indeed, the cap-ture plant needs to be analysed for an integratedclosed loop operation, as absorber performance
Figure 8. Generalised pressure drop correlation from Sinnot28 (This figure was published in Sinnot,28 Copyright Elsevier
Butterworth-Heinemann).
Table 9. Absorber and regenerator sizing first guess solution:
assumptions and results.
Assumptions
Absorber Regenerator
L�w=V�w 1.736 9.445
�V ðkg=m3Þ 1.092 1.100
�L ðkg=m3Þ 1015.6 1019.6
Pressure drop
(mmH2O=mpackingÞ
42 42
Fp ð1=mÞ 78.74 168.2
�L ðPa � sÞ 0.00355 0.000969
Results
Absorber Regenerator
FLV 0.0569 0.309
k4 ðXXXÞ 1.5 0.85
Cross-sectional area
required ðm2Þ
149.65 53.58
98 Proc IMechE Part E: J Process Mechanical Engineering 227(2)
at TOBB Ekonomi ve Teknoloji Üniversitesi on April 29, 2014pie.sagepub.comDownloaded from
affects the regenerator, and vice versa. If the absorberand regenerator are considered individually, the cap-ture plant may be designed to operate at a regionrequiring higher capital and operational expenditure.For this reason, the influence of the lean loading andthe L/G ratio over the regenerator reboiler duty isinvestigated to determine reasonable column designin terms of capital costs and operational performance.The same packing type used in the pilot plant is alsoused. A design specification is assigned to ensure therequired approach temperature in the cross heatexchanger between the hot lean stream and the coldreach stream (notably 10 �C).
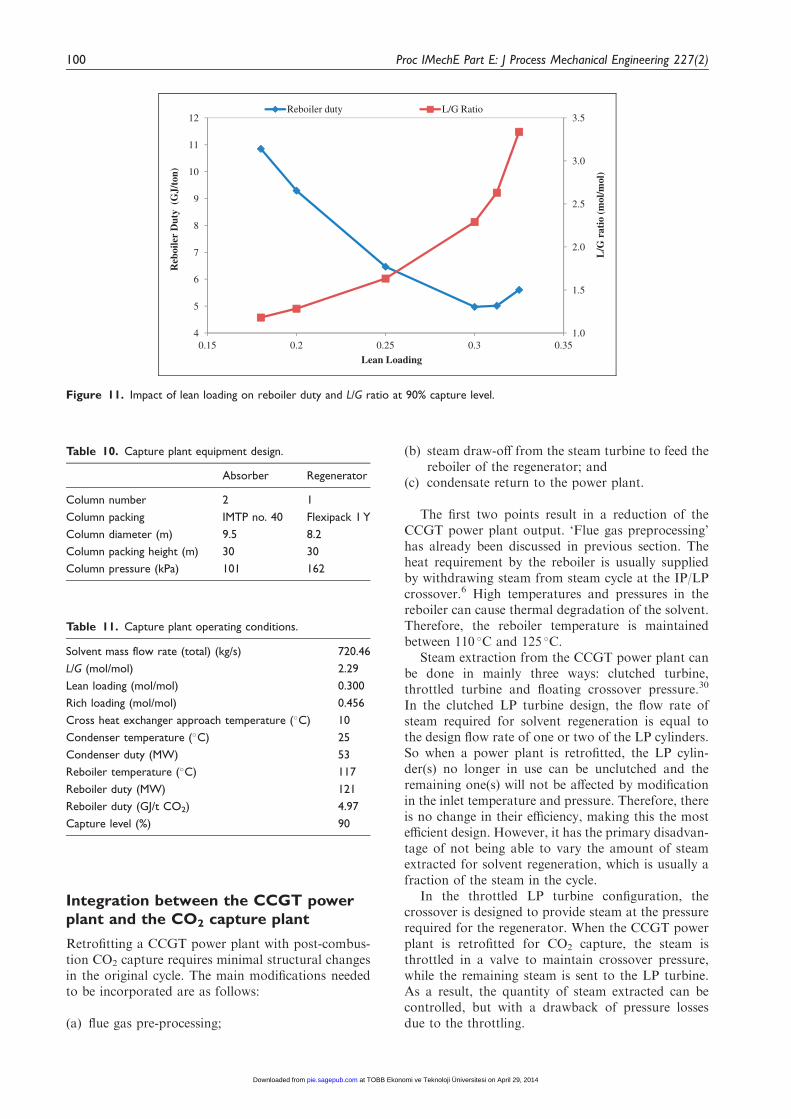
Figure 11 presents the reboiler duty andL/G ratio asa function of absorber inlet lean loading for a 90%capture level. When a low lean loading is specified, itmeans that a low CO2 concentration in the solvent hasbeen targeted, and as a result a large amount of steam isrequired to strip the rich solvent of CO2 to the desiredlean loading. When a higher lean loading is specified,more CO2 is allowed to remain dissolved in the solvent,
and, as a consequence, the required reboiler duty fallsas well. A higher lean loading translates to lowerabsorption capacity for the solvent, therefore, higherL/G ratio is needed to satisfy the capture level require-ment. At lean loadings above 0.31, the reboiler dutyrequirement will increase slightly due to the sensibleheat demand of the increased rich solvent flow rate.
In this analysis, the column’s packing height wasleft unchanged and equal to 30m. However, when theL/G ratio is increased, the packing height can then bereduced, resulting in decreased capital costs. On theother hand, the operational costs may be higher dueto the larger pumping power and the larger reboilerduty required by a larger solvent flow rate. With asmaller L/G ratio however, a larger packing heightwould be required, resulting in higher capital costswhile the operational costs, connected with the solv-ent flow rate, would likely fall. The optimal solutionwill be a trade-off between these two different trends.The solution adopted in this article is presented inTables 10 and 11.
2
3
4
5
6
7
8
9
10
0 1 2 3 4 5
Req
uire
d di
amet
er [
m]
Number of regenerator columns [-]
Figure 10. First-guess solution results: regenerator diameter as function of the number of columns.
4
6
8
10
12
14
16
0 1 2 3 4 5
Req
uire
d di
amet
er [
m]
Number of absorber columns [-]
Figure 9. First-guess solution result: absorber diameter as function of the number of columns.
Canepa et al. 99
at TOBB Ekonomi ve Teknoloji Üniversitesi on April 29, 2014pie.sagepub.comDownloaded from
Integration between the CCGT powerplant and the CO2 capture plant
Retrofitting a CCGT power plant with post-combus-tion CO2 capture requires minimal structural changesin the original cycle. The main modifications neededto be incorporated are as follows:
(a) flue gas pre-processing;
(b) steam draw-off from the steam turbine to feed thereboiler of the regenerator; and
(c) condensate return to the power plant.
The first two points result in a reduction of theCCGT power plant output. ‘Flue gas preprocessing’has already been discussed in previous section. Theheat requirement by the reboiler is usually suppliedby withdrawing steam from steam cycle at the IP/LPcrossover.6 High temperatures and pressures in thereboiler can cause thermal degradation of the solvent.Therefore, the reboiler temperature is maintainedbetween 110 �C and 125 �C.
Steam extraction from the CCGT power plant canbe done in mainly three ways: clutched turbine,throttled turbine and floating crossover pressure.30
In the clutched LP turbine design, the flow rate ofsteam required for solvent regeneration is equal tothe design flow rate of one or two of the LP cylinders.So when a power plant is retrofitted, the LP cylin-der(s) no longer in use can be unclutched and theremaining one(s) will not be affected by modificationin the inlet temperature and pressure. Therefore, thereis no change in their efficiency, making this the mostefficient design. However, it has the primary disadvan-tage of not being able to vary the amount of steamextracted for solvent regeneration, which is usually afraction of the steam in the cycle.
In the throttled LP turbine configuration, thecrossover is designed to provide steam at the pressurerequired for the regenerator. When the CCGT powerplant is retrofitted for CO2 capture, the steam isthrottled in a valve to maintain crossover pressure,while the remaining steam is sent to the LP turbine.As a result, the quantity of steam extracted can becontrolled, but with a drawback of pressure lossesdue to the throttling.
1.0
1.5
2.0
2.5
3.0
3.5
4
5
6
7
8
9
10
11
12
0.15 0.2 0.25 0.3 0.35
L/G
rat
io (m
ol/m
ol)
Reb
oile
r D
uty
(G
J/to
n)
Lean Loading
Reboiler duty L/G Ratio
Figure 11. Impact of lean loading on reboiler duty and L/G ratio at 90% capture level.
Table 11. Capture plant operating conditions.
Solvent mass flow rate (total) (kg/s) 720.46
L/G (mol/mol) 2.29
Lean loading (mol/mol) 0.300
Rich loading (mol/mol) 0.456
Cross heat exchanger approach temperature (�C) 10
Condenser temperature (�C) 25
Condenser duty (MW) 53
Reboiler temperature (�C) 117
Reboiler duty (MW) 121
Reboiler duty (GJ/t CO2) 4.97
Capture level (%) 90
Table 10. Capture plant equipment design.
Absorber Regenerator
Column number 2 1
Column packing IMTP no. 40 Flexipack 1 Y
Column diameter (m) 9.5 8.2
Column packing height (m) 30 30
Column pressure (kPa) 101 162
100 Proc IMechE Part E: J Process Mechanical Engineering 227(2)
at TOBB Ekonomi ve Teknoloji Üniversitesi on April 29, 2014pie.sagepub.comDownloaded from
The floating crossover pressure configuration is themost flexible from both the point of view of the quan-tity and of the pressure of the steam extracted. Thecrossover pipe is designed to impose an appropriatepressure drop to reach the desired steam pressuredepending on the flow rate of steam extracted, result-ing in no throttling losses at design extraction rate.The last stages of the IP turbine and the first stagesof the LP turbine would have to be designed to copewith a wide range of temperatures and pressures.
In the CCGT power plant, the steam cycle com-prises of a two-stage turbine, but is modelled as three-stage turbine. This is because the second turbine issplit into two to account for the bleeding of steamneeded to feed the deaerator. For this reason, the suit-able point for steam extraction is the crossoverbetween the HP-ST and the IP-ST. In retrofitting toCO2 capture an existing power plant, enough spaceshould be provided to accommodate the requiredvalves and tie-in piping that is required for steamextraction. After the retrofitting, the LP-ST will seea major reduction of steam flow rate, which will resultin the reduction of both its efficiency and poweroutput.
A floating crossover pressure configuration is usedin this study. The steam, taken at the HP/IP crossoveris at 5 bar and 230 �C, and the temperature has to bereduced to just above saturation temperature with awater spray. The waste heat resulting from this pro-cess could be partially recovered by combining thesteam with some of the condensate coming from thereboiler, thereby reducing the quantity of steam thathas to be extracted. The condensate from the reboileris then returned to the deaerator.
The integrated CCGT and capture plant perform-ance is given in Table 12. This is also compared withthe reference CCGT power plant before retrofitting.The power plant output is reduced by three mainfactors:
(a) flue gas blower power;
(b) steam extraction that causes a reduction of themass flow rate through the LP-ST and thereforeof its power output;
(c) solvent circulation pump power.
Out of the three factors considered, the powerreduction due to steam extraction is the main one.
Impact of EGR
Compared with their coal-fired counterparts, CCGTpower plants have a lower CO2 content in the flue gasand higher specific flows (approximately 1.5 kg/MWsin contrast to 0.95 kg/MWs). This makes post-com-bustion CO2 capture plant for CCGT bulky andcostly.31 This low CO2 concentration results in highenergy requirement for solvent regeneration, com-pared to coal-fired plants for the capture of thesame amount of CO2. One way to overcome thisproblem is EGR: a fraction of flue gases comingfrom the HRSG is recirculated back to compressorinlet where it is mixed with fresh air, increasing theCO2 content in the exhaust gas. The major benefit ofthis semi-closed cycle configuration is the reduction ofthe mass flow rate that has to be treated by the cap-ture plant.
The maximum amount of flue gas recirculation islimited by combustor-related phenomena such asFame stability and incomplete oxidation. It is believedthat the changes in turbomachinery performance maybe very small.32–35 EGR has been already successfullyapplied to compressors for anti-icing purpose36 andthe technological feasibility of recirculation ratio upto 40% has been proven by experimental research ondry low NOx (DLN) combustor.37,38
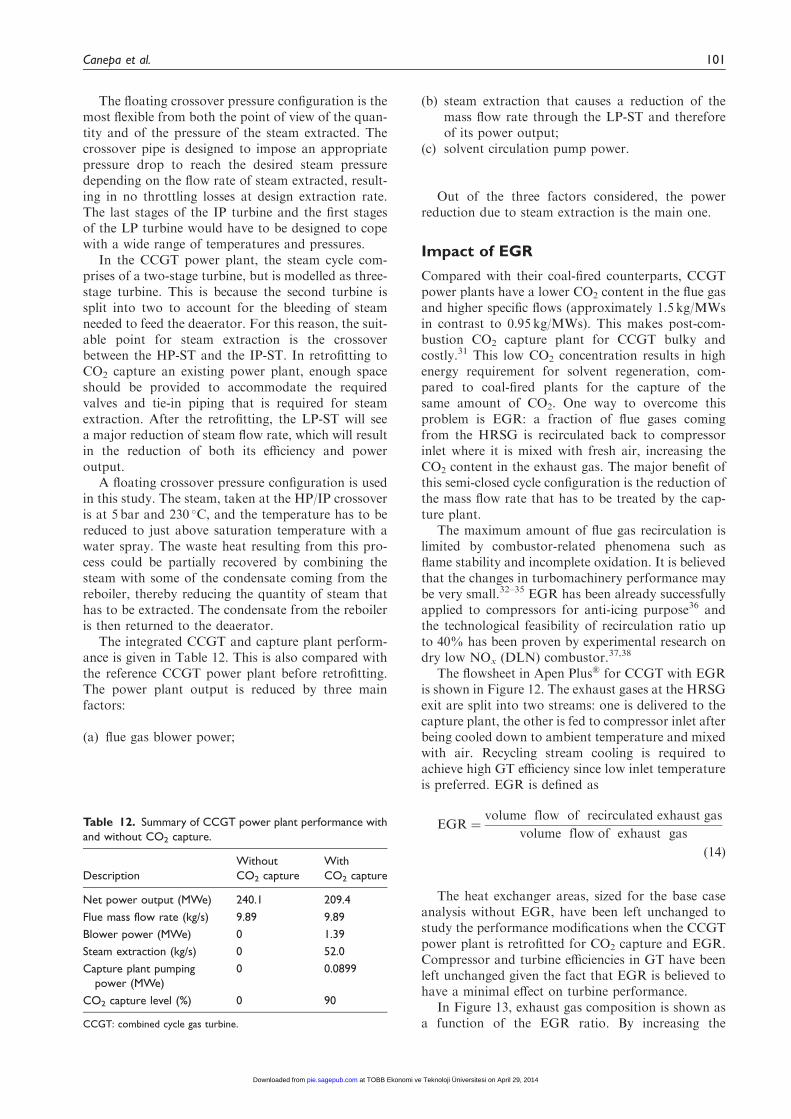
The flowsheet in Apen Plus� for CCGT with EGRis shown in Figure 12. The exhaust gases at the HRSGexit are split into two streams: one is delivered to thecapture plant, the other is fed to compressor inlet afterbeing cooled down to ambient temperature and mixedwith air. Recycling stream cooling is required toachieve high GT efficiency since low inlet temperatureis preferred. EGR is defined as
EGR ¼volume flow of recirculated exhaust gas
volume flow of exhaust gas
ð14Þ
The heat exchanger areas, sized for the base caseanalysis without EGR, have been left unchanged tostudy the performance modifications when the CCGTpower plant is retrofitted for CO2 capture and EGR.Compressor and turbine efficiencies in GT have beenleft unchanged given the fact that EGR is believed tohave a minimal effect on turbine performance.
In Figure 13, exhaust gas composition is shown asa function of the EGR ratio. By increasing the
Table 12. Summary of CCGT power plant performance with
and without CO2 capture.
Description
Without
CO2 capture
With
CO2 capture
Net power output (MWe) 240.1 209.4
Flue mass flow rate (kg/s) 9.89 9.89
Blower power (MWe) 0 1.39
Steam extraction (kg/s) 0 52.0
Capture plant pumping
power (MWe)
0 0.0899
CO2 capture level (%) 0 90
CCGT: combined cycle gas turbine.
Canepa et al. 101
at TOBB Ekonomi ve Teknoloji Üniversitesi on April 29, 2014pie.sagepub.comDownloaded from
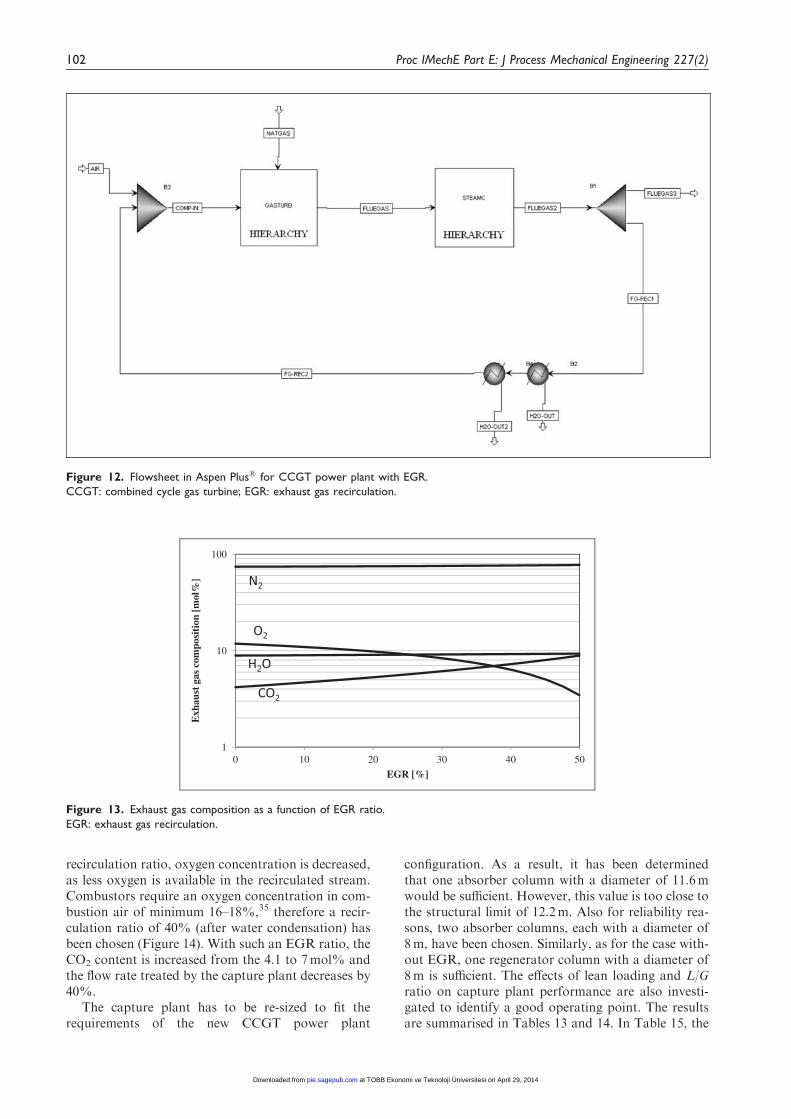
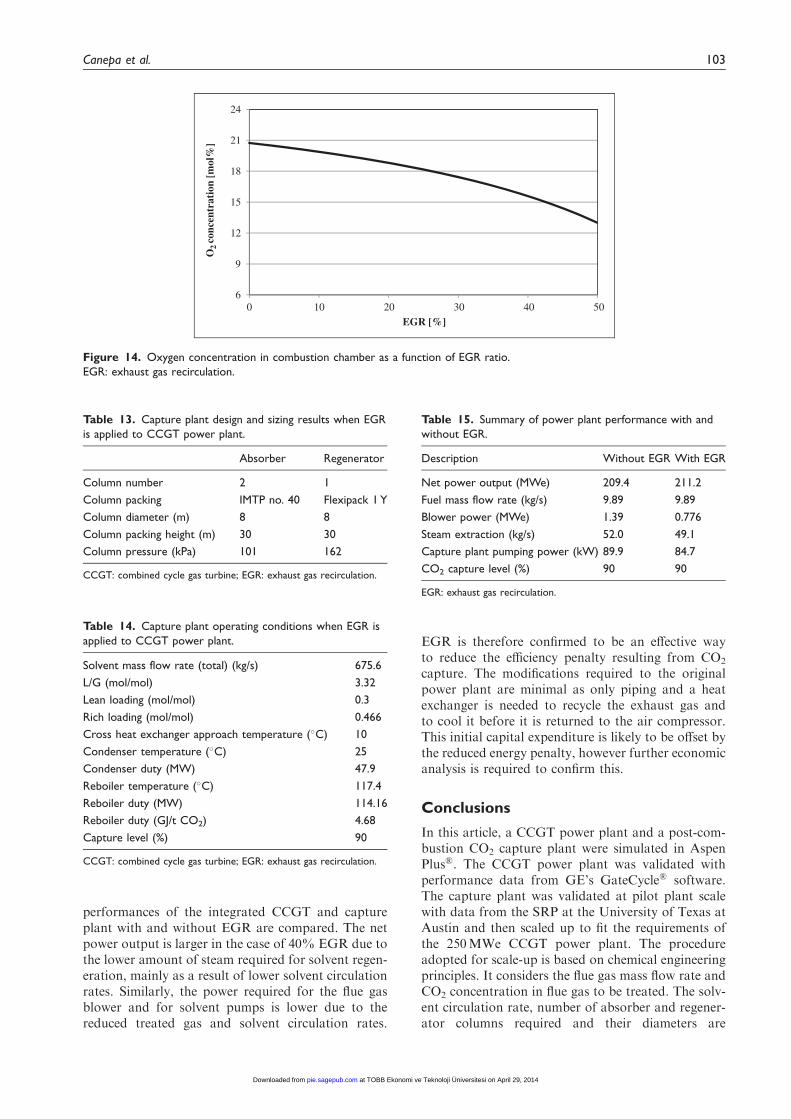
recirculation ratio, oxygen concentration is decreased,as less oxygen is available in the recirculated stream.Combustors require an oxygen concentration in com-bustion air of minimum 16–18%,35 therefore a recir-culation ratio of 40% (after water condensation) hasbeen chosen (Figure 14). With such an EGR ratio, theCO2 content is increased from the 4.1 to 7mol% andthe flow rate treated by the capture plant decreases by40%.
The capture plant has to be re-sized to fit therequirements of the new CCGT power plant
configuration. As a result, it has been determinedthat one absorber column with a diameter of 11.6mwould be sufficient. However, this value is too close tothe structural limit of 12.2m. Also for reliability rea-sons, two absorber columns, each with a diameter of8m, have been chosen. Similarly, as for the case with-out EGR, one regenerator column with a diameter of8m is sufficient. The effects of lean loading and L/Gratio on capture plant performance are also investi-gated to identify a good operating point. The resultsare summarised in Tables 13 and 14. In Table 15, the
Figure 12. Flowsheet in Aspen Plus� for CCGT power plant with EGR.
CCGT: combined cycle gas turbine; EGR: exhaust gas recirculation.
1
10
100
0 10 20 30 40 50
Exh
aust
gas
com
posi
tion
[mol
%]
EGR [%]
O2
H2O
CO2
N2
Figure 13. Exhaust gas composition as a function of EGR ratio.
EGR: exhaust gas recirculation.
102 Proc IMechE Part E: J Process Mechanical Engineering 227(2)
at TOBB Ekonomi ve Teknoloji Üniversitesi on April 29, 2014pie.sagepub.comDownloaded from
performances of the integrated CCGT and captureplant with and without EGR are compared. The netpower output is larger in the case of 40% EGR due tothe lower amount of steam required for solvent regen-eration, mainly as a result of lower solvent circulationrates. Similarly, the power required for the flue gasblower and for solvent pumps is lower due to thereduced treated gas and solvent circulation rates.
EGR is therefore confirmed to be an effective wayto reduce the efficiency penalty resulting from CO2
capture. The modifications required to the originalpower plant are minimal as only piping and a heatexchanger is needed to recycle the exhaust gas andto cool it before it is returned to the air compressor.This initial capital expenditure is likely to be offset bythe reduced energy penalty, however further economicanalysis is required to confirm this.
Conclusions
In this article, a CCGT power plant and a post-com-bustion CO2 capture plant were simulated in AspenPlus�. The CCGT power plant was validated withperformance data from GE’s GateCycle� software.The capture plant was validated at pilot plant scalewith data from the SRP at the University of Texas atAustin and then scaled up to fit the requirements ofthe 250MWe CCGT power plant. The procedureadopted for scale-up is based on chemical engineeringprinciples. It considers the flue gas mass flow rate andCO2 concentration in flue gas to be treated. The solv-ent circulation rate, number of absorber and regener-ator columns required and their diameters are
6
9
12
15
18
21
24
0 10 20 30 40 50
O2
conc
entr
atio
n [m
ol%
]
EGR [%]
Figure 14. Oxygen concentration in combustion chamber as a function of EGR ratio.
EGR: exhaust gas recirculation.
Table 14. Capture plant operating conditions when EGR is
applied to CCGT power plant.
Solvent mass flow rate (total) (kg/s) 675.6
L/G (mol/mol) 3.32
Lean loading (mol/mol) 0.3
Rich loading (mol/mol) 0.466
Cross heat exchanger approach temperature (�C) 10
Condenser temperature (�C) 25
Condenser duty (MW) 47.9
Reboiler temperature (�C) 117.4
Reboiler duty (MW) 114.16
Reboiler duty (GJ/t CO2) 4.68
Capture level (%) 90
CCGT: combined cycle gas turbine; EGR: exhaust gas recirculation.
Table 15. Summary of power plant performance with and
without EGR.
Description Without EGR With EGR
Net power output (MWe) 209.4 211.2
Fuel mass flow rate (kg/s) 9.89 9.89
Blower power (MWe) 1.39 0.776
Steam extraction (kg/s) 52.0 49.1
Capture plant pumping power (kW) 89.9 84.7
CO2 capture level (%) 90 90
EGR: exhaust gas recirculation.
Table 13. Capture plant design and sizing results when EGR
is applied to CCGT power plant.
Absorber Regenerator
Column number 2 1
Column packing IMTP no. 40 Flexipack 1 Y
Column diameter (m) 8 8
Column packing height (m) 30 30
Column pressure (kPa) 101 162
CCGT: combined cycle gas turbine; EGR: exhaust gas recirculation.
Canepa et al. 103
at TOBB Ekonomi ve Teknoloji Üniversitesi on April 29, 2014pie.sagepub.comDownloaded from
determined. The CCGT power plant was integratedwith the capture plant. The performance of the CCGTpower plant without capture is compared with thepower plant retrofitted with capture, quantifying theenergy penalty. In addition, the performance of theCCGT power plant with CO2 capture is comparedwith the CCGT power plant with CO2 capture andEGR. The results indicate that EGR is an effectiveway to reduce the energy penalty caused by the inte-gration with a CO2 capture plant.
Funding
The authors would like to acknowledge ERASMUS pro-gramme for the financial support that has allowed this col-
laboration to take place. The UK authors would like toacknowledge the financial support from UK ResearchCouncils’ Energy Programme (Ref: NE/H013865/1 and
EP/J020788/1).
References
1. Wang M, Lawal A, Stephenson P, et al. Post-combustion CO2 capture with chemical absorption: a
state-of-the-art review. Chem Eng Res Des 2011; 89(9):1609–1624.
2. Okuzumi N and Mitchell R. Current status of MHI’sCO2 recovery technology and road map to commercial-
ization for coal-Ered power plant application. In:Proceedings of the international conference and exhibition:nitrogen and syngas, Bahrain, 28 February–3 March
2010, www.mhi.co.jp/en/products/pdf/articles_07.pdf(2010, accessed July 2012).
3. Hetland J, Kvamsdal HM, Haugen G, et al. Integrating a
full carbon capture scheme onto a 450 MWe NGCCelectric power generation hub for offshore operations:presenting the Sevan GTW concept. Appl Energy 2009;
86: 2298–2307.4. Kvamsdal HM, Hetland J, Haugen G, et al. Maintaining
a neutral water balance in a 450 MWe NGCC–CCSpower system with post-combustion carbon dioxide cap-
ture aimed at offshore operation. Int J Greenhouse GasControl 2010; 4: 613–622.
5. Karimi M, Hillestad M and Svendsen HF. Natural gas
combined cycle power plant integrated to capture plant.Energy & Fuels 2012; 26(3): 1805–1813.
6. Lawal A, Wang M and Stephenson P. Demonstrating
full-scale post-combustion CO2 capture for coal-Eredpower plants through dynamic modelling and simula-tion. Fuel 2012; 101: 115–128. DOI: 10.1016/j.fuel.2010.10.056.
7. Kvamsdal HM, Jakobsen JP and Hoff KA. Dynamicmodelling and simulation of a CO2 absorber columnfor post-combustion CO2 capture. Chem Eng Process:
Process IntensiOcation 2009; 48(1): 135–144.8. Lawal A, Wang M, Stephenson P, et al. Dynamic
modelling of CO2 absorption for post-combustion cap-
ture in coal-Ered power plants. Fuel 2009; 88(12):2455–2462.
9. Lawal A, Wang M, Stephenson P, et al. Dynamic mod-
eling and simulation of CO2 chemical absorption processfor coal-Ered power plants. Comput Aided Chem Eng2009; 27: 1725–1730.
10. Lawal A, Wang M, Stephenson P, et al. Dynamic mod-elling and analysis of post-combustion CO2 chemicalabsorption process for coal-Ered power plants. Fuel
2010; 89(10): 2791–2801.11. Biliyok C, Lawal A, Wang M, et al. Dynamic model-
ling, validation and analysis of post-combustion chem-
ical absorption CO2 capture plant. Int J Greenhouse GasControl 2012; 9: 428–445.
12. Kvamsdal HM and Rochelle GT. Effects of the tem-
perature bulge in CO2 absorption from flue gas byaqueous monoethanolamine. Ind Eng Chem Res 2008;47(3): 867–875.
13. Zhang Y, Chen H, Chen C-C, et al. Rate-based process
modelling study of CO2 capture with aqueous mono-ethanolamine solution. Ind Eng Chem Res 2009; 48:9233–9246.
14. Li H, Ditaranto M and Berstad D. Technologies forincreasing CO2 concentration in exhaust gas from nat-ural gas-fired power production with post-combustion,
amine-based CO2 capture. Energy 2011; 36(2):1124–1133.
15. Bolland O and Mathieu P. Comparison of two CO2
removal options in combined cycle power plants.Energy Convers Manage 1998; 39: 1653–1663.
16. Doosan Power Systems. UK’s first carbon capture plantopens at ferrybridge power station. West Sussex, RH:
Doosan Power Systems, http://www.doosanpowersys-tems.com/NewsEvents/News/2011-11-30/UKS-FIRST-CARBON-CAPTURE-PLANT-OPENS-AT-
FERRYBRIDGE-POWER-STATION/ (2011,accessed 30 November 2011).
17. Herzog H, Meldon J and Hatton A. Advanced post-
combustion CO2 capture. Cambridge, MA:Massachusetts Institute of Technology, web.mit.edu/mitei/docs/reports/herzog-meldon-hatton.pdf (2009,accessed July 2012).
18. Ong’iro AO, Ugursal VI, Taweel AMA, et al.Simulation of combined cycle power plants using theaspen plus shell. Heat Recovery Syst CHP 1995; 15(2):
105–113.19. Jonsson M, Bolland O, Bcker D, et al. Gas turbine
cooling models for evaluation of novel cycles. In:
Proceedings of the ECOS, Trondheim, Norway, 20–22June 2005.
20. Dugas ER. Pilot plant study of carbon dioxide capture by
aqueous monoethanolamine. M.S.E. Thesis, Universityof Texas, Austin, USA, 2006.
21. Pitzer KS. Thermodynamics of electrolytes. I.Theoretical basis and general equations. J Phys Chem
1973; 77: 268–277.22. Arcis H, Rodier L, Karine B-B, et al. Modeling of
(vapor þ liquid) equilibrium and enthalpy of solution
of carbon dioxide (CO2) in aqueous ethyldiethanola-mine (MDEA) solutions. J Chem Thermodyn 2009; 41:783–789.
23. Fair JR and Bravo JL. Prediction of mass transferefEciencies and pressure drop for structured towerpackings in vapor/liquid service. Inst Chem Eng SympSer A 1985; 104: 183–200.
24. Bravo JL, Rocha JA and Fair JR. A comprehensivemodel for the performance of columns containing struc-tured packings. Inst Chem Eng Symp Ser A 1992; 129:
439–457.
104 Proc IMechE Part E: J Process Mechanical Engineering 227(2)
at TOBB Ekonomi ve Teknoloji Üniversitesi on April 29, 2014pie.sagepub.comDownloaded from
25. Taylor R and Krishna R. Multicomponent mass trans-fer. New York: John Wiley, 1993.
26. Aboudheir A, Tontiwachwuthikul P, Chakma A, et al.
Kinetics of the reactive absorption of carbon dioxidein high CO2-loaded, concentrated aqueuous mono-ethanolamine solutions. Chem Eng Sci 2003; 58:
5195–5210.27. Aspentech. Rate-based model of the CO2 capture pro-
cess by MEA using Aspen Plus, support.aspentech.com
(2011, accessed July 2012).28. Sinnott RK. Chemical engineering design. vol 6, 4th edn.
Oxford: Elsevier Butterworth-Heinemann, 2005.29. Ramezan M and Skone TJ. Carbon dioxide capture from
existing coal-Ored power plants. Report no. DOE/NETL-401/110907, 2007. Morgantown, WV: NationalEnergy Technology Laboratory (NETL).
30. Kang CA, Brandt AR and Durlofsky LJ. Optimal oper-ation of an integrated energy system including fossil fuelpower generation, CO2 capture and wind. Energy 2011;
36(12): 6806–6820. (ISSN 0360-5442, DOI: 10.1016/j.energy.2011.10.015.
31. Jonshagen K, Sipocz N and Genrup M. A novel
approach of retrofitting a combined cycle with postcombustion CO2 Capture. J Eng Gas Turbines Power2011; 133(011703): 1�7.
32. Sipocz N, Jonshagen K, Assadi A, et al. Novel high-
performing single pressure combined cycle with CO2
capture. In: Proceedings of the ASME turbo expo,Glasgow, UK, 14–18 June 2010, paper no. GT2010-
23259, pp.803–811. New York: ASME.33. Jonshagen K, Sipocz N and Genrup M. (2010), Optimal
combined cycle for CO2 capture with EGR.
In: Proceedings of the ASME turbo expo, Glasgow,UK, 14–18 June 2010, paper no. GT2010–23420,pp.867–875. New York: ASME.
34. Jonshagen K, Eriksson P and Genrup M. Low-calorific
fuel mix in a large size combined cycle plant. In:Proceedings of the ASME turbo expo, Orlando, FL, 8–12 June 2009, paper no. GT 2009-59329, pp.367–376.
New York: ASME.35. Ulfsnes R, Karlsen G, Jordal K, et al. Investigation of
physical properties of CO2/H2O-mixtures for use in
semi-closed O2/CO2 gas turbine cycle with CO2-capture.In: Proceedings of the ECOS, Copenhagen, Denmark,30 June–2 July 2003.
36. Loud RL and Slaterpryce AA. Gas turbine inlet airtreatment. GER-3419A, GE Power Generation, 1991.
37. Evulet AT, ElKady AM, Branda AR, et al. On the per-formance and operability of GE’s dry low NOx com-
bustors utilizing exhaust gas recirculation for post-combustion carbon capture. Energy Procedia 2009; 1:3809–3816.
38. Elkady AM, Evulet A, Brand A, et al. Application ofexhaust gas recirculation in a DLN F-class combustionsystem for postcombustion carbon capture. ASME
GT2008-51152, 2008. New York: ASME.
Appendix
Notation
b cooling model parametercp,c constant pressure specific heat capacity.
Average value between the blade andcompressor exit temperatures (kJ/(kg�K))
cp,g constant pressure specific heat capacity.Average value between the blade andthe combustor exit temperatures (kJ/(kg�K))
Fp packing factor (m�1)FLV flow parameterk4 pressure drop parameterK cooling model parameterL/G liquid to gas molar Fow ratio (mol/mol)L�w liquid mass flow-rate per unit column
cross-sectional area (kg/(m2�s))
_mc cooling mass flow rate (kg/s)_mg combustion chamber exit mass flow
rate (kg/s)p pressure (bar)s cooling model parameterT temperature (�C)V�w gas (or vapour) mass flow-rate per unit
column cross-sectional area (kg/(m2�s))
�pc pressure drop due to cooling (bar)� viscosity (Pa�s)� density (kg/m3)
Subscripts
b bladecmb exit combustion chamber outlet conditioncmpr exit compressor outlet conditionL liquidtbn inlet turbine inlet conditionV gas, vapour
Canepa et al. 105
at TOBB Ekonomi ve Teknoloji Üniversitesi on April 29, 2014pie.sagepub.comDownloaded from