Embed Size (px)
Citation preview
63
CHAPTER III
MATERIALS AND METHODS
Blending of polymers provides deep inroads for advanced applications. In the
present work, a novel blend has been prepared by solvent blending of two immiscible
rubbers EPDM and neoprene in compatible proportions and further reinforced with clay
and graphite fillers. Curing is done by using peroxide curing agents. Clear specification
of the materials used, experimental parts and the mechanism of peroxide curing of EPDM
are discussed along with characterization of the materials.
3.1 Methodology
Polymerization is a process of reacting monomers together to form a polymer
chain or three-dimensional networks. Curing of polymers results in increase in strength of
the polymer so that it can be used in high-end applications.
Curing of polymers is a process which refers to the toughening or hardening of a
polymer material by cross-linking of polymer chains brought about by chemical
additives, ultra-violet radiation, electron beam or heat. In the present work, peroxide
curing is done. The peroxide curing of ethylene–propylene elastomer has been well
studied as a function of its composition (relative proportions of ethylene to propylene and
nature of the diene eventually present) [1-7]. The process proceeds as per the mechanism
in Scheme 1.
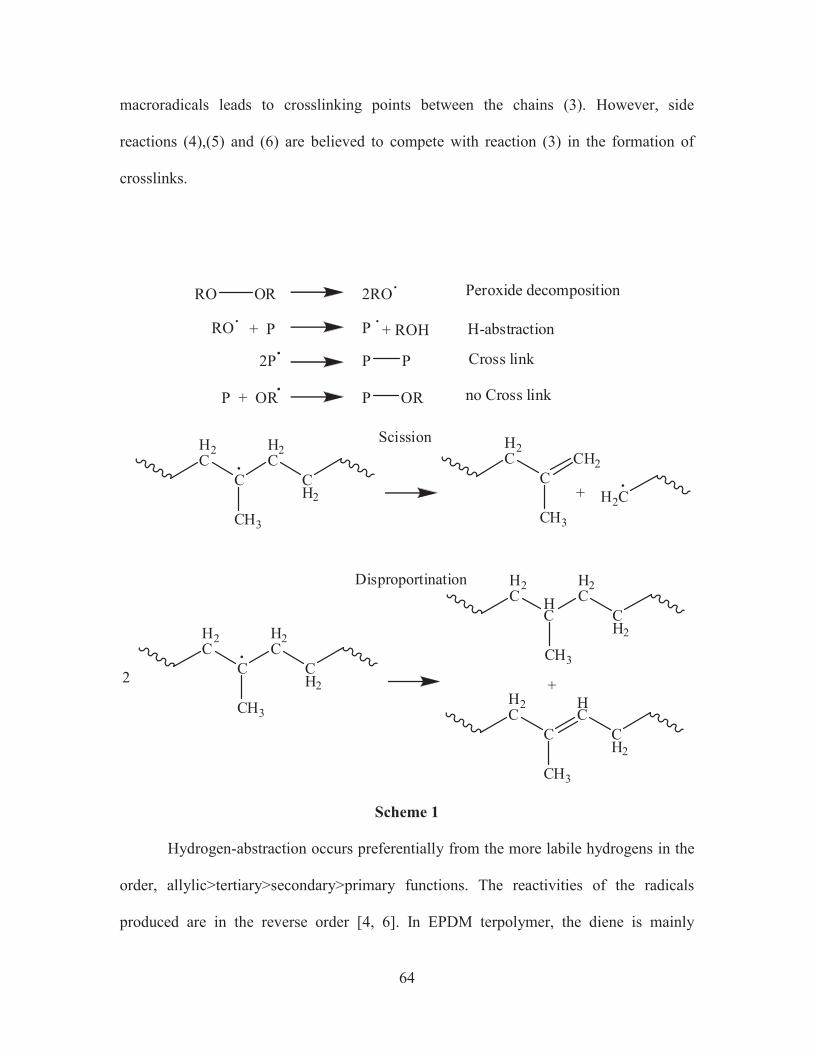
It is based on the thermal decomposition of peroxide molecules which results in
the formation of peroxy radicals (1). They can react with the polymer chains by
abstraction of labile hydrogens to produce macroradicals (2). Combination of these
64
macroradicals leads to crosslinking points between the chains (3). However, side
reactions (4),(5) and (6) are believed to compete with reaction (3) in the formation of
crosslinks.
RO OR 2RO
+ P + ROHPRO H-abstraction
2P P P Cross link
no Cross link
Peroxide decomposition
P + OR P OR
Scission
Disproportination
H2C
C
H2C
CH2
CH3
H2C
C
CH2
H2C
CH3
+
H2C
C
H2C
CH2
CH3
2
H2C
HC
H2C
CH2
CH3
H2C
C
HC
CH2
CH3
+
Scheme 1
Hydrogen-abstraction occurs preferentially from the more labile hydrogens in the
order, allylic>tertiary>secondary>primary functions. The reactivities of the radicals
produced are in the reverse order [4, 6]. In EPDM terpolymer, the diene is mainly
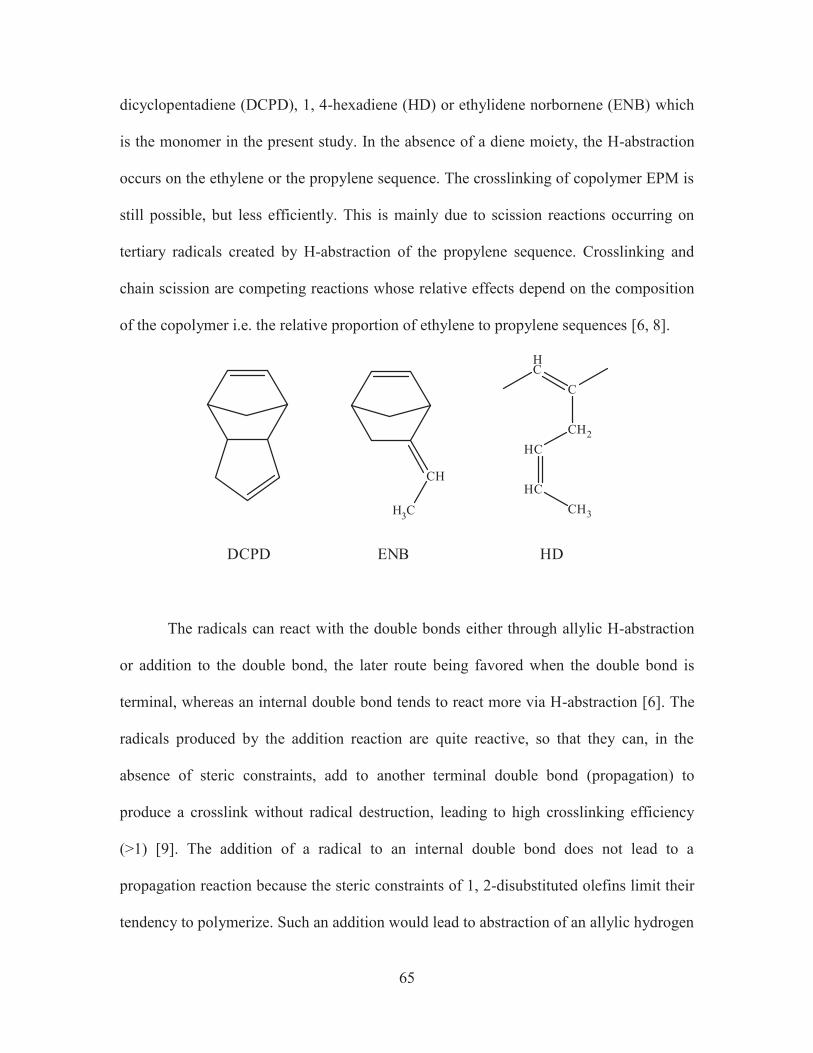
65
dicyclopentadiene (DCPD), 1, 4-hexadiene (HD) or ethylidene norbornene (ENB) which
is the monomer in the present study. In the absence of a diene moiety, the H-abstraction
occurs on the ethylene or the propylene sequence. The crosslinking of copolymer EPM is
still possible, but less efficiently. This is mainly due to scission reactions occurring on
tertiary radicals created by H-abstraction of the propylene sequence. Crosslinking and
chain scission are competing reactions whose relative effects depend on the composition
of the copolymer i.e. the relative proportion of ethylene to propylene sequences [6, 8].
HC
C
CH2
HC
HC
CH3
DCPD ENB HD
CH
H3C
The radicals can react with the double bonds either through allylic H-abstraction
or addition to the double bond, the later route being favored when the double bond is
terminal, whereas an internal double bond tends to react more via H-abstraction [6]. The
radicals produced by the addition reaction are quite reactive, so that they can, in the
absence of steric constraints, add to another terminal double bond (propagation) to
produce a crosslink without radical destruction, leading to high crosslinking efficiency
(>1) [9]. The addition of a radical to an internal double bond does not lead to a
propagation reaction because the steric constraints of 1, 2-disubstituted olefins limit their
tendency to polymerize. Such an addition would lead to abstraction of an allylic hydrogen
66
or reaction with another radical to produce a crosslink [6]. The resonance-stabilized
allylic radicals cannot give rise to propagation reactions; hence crosslinking efficiency is
less [9]. The ‘‘polymerizability’’ of the unsaturated moiety is determined by the position
of the double bond (internal or terminal), the number of allylic hydrogens, their
accessibility and the relative stability of the allylic radicals that have been formed [8].
Since ethylidene norbornene holds an internal double bond and five active allylic
hydrogens (the hydrogen on the double bridged carbon atom α to the double bond is
considered to be inert), the radicals should react more via the allylic H-abstraction route.
Indeed,it was shown that only about 25% of the crosslinking bonds arose from H-
abstraction on the methyl group [9] because the radicals cannot be stabilized by
resonance. Dikland [8] has compared the peroxide crosslinking efficiency of different
EPDM bearing diene moieties and showed that 1, 4-hexadiene is less efficient than
ethylidene norbornene though both the monomers bear five active allylic hydrogens and
an internal double bond. Hence, the mechanism of crosslinking via radical addition to the
double bond of ENB is an important route [8]. Moreover, a greater driving force for
addition is provided by a 1, 1, 2-trisubstituted substrate compared to a 1, 2-disubstituted
ethylene structure [6] which confirms the addition mechanism with ENB. The kinetics of
peroxide crosslinking has been studied as a function of peroxide substituent or
environment [2, 10]. From torque measurements, it has been shown that the rate-
determining step of the whole process is the peroxide decomposition step which is slow
compared to recombination or scission reactions. At moderate temperatures or peroxide
concentrations, the decomposition reaction globally follows a first-order reaction [7, 10,
11].
67
One disadvantage of the use of peroxide for crosslinking is the interference with
many antioxidants which act as radical scavengers leading to a reduction of the
crosslinking efficiency [12].
3.2 Materials
The materials used in the present study: two rubbers EPDM and neoprene to
prepare blends, dicumyl peroxide used as the curing agent for the rubber polymers,
toluene as the solvent, kaolinite and graphite as fillers were directly purchased and used
as such. Montmorillonite (MMT) was alkyl modified and then used as filler. Toluene is
the only organic solvent used throughout the work. Analar grade (AR) Toluene (C. No.
T78929) with 99.5% purity was obtained from NICE Chemicals, Cochin.
Tetradecyltrimethylammonium bromide was kindly supplied by Sisco Research
Laboratories, Mumbai, Sodium chloride was provided by Central Drug House, New
Delhi and Silver chloride was purchased from Merck India Ltd., India.
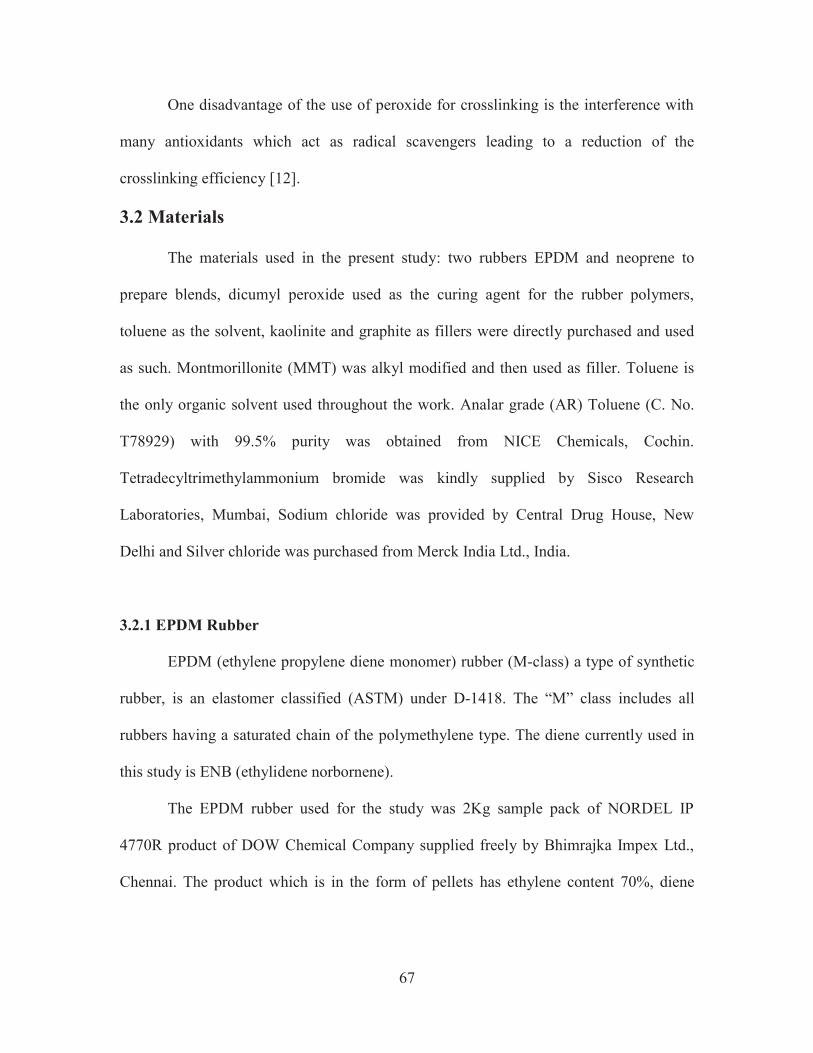
3.2.1 EPDM Rubber
EPDM (ethylene propylene diene monomer) rubber (M-class) a type of synthetic
rubber, is an elastomer classified (ASTM) under D-1418. The “M” class includes all
rubbers having a saturated chain of the polymethylene type. The diene currently used in
this study is ENB (ethylidene norbornene).
The EPDM rubber used for the study was 2Kg sample pack of NORDEL IP
4770R product of DOW Chemical Company supplied freely by Bhimrajka Impex Ltd.,
Chennai. The product which is in the form of pellets has ethylene content 70%, diene
68
4.9%, Mooney viscosity 70ML (at 125oC), typical molecular weight 200,000 (GPC Dow
test method) and density 0.88g/cc.
H2C
H2C
HC
CH3
H2C
CH
H3C
* *
p
q
r
Chemical Structure of EPDM with ENB
69
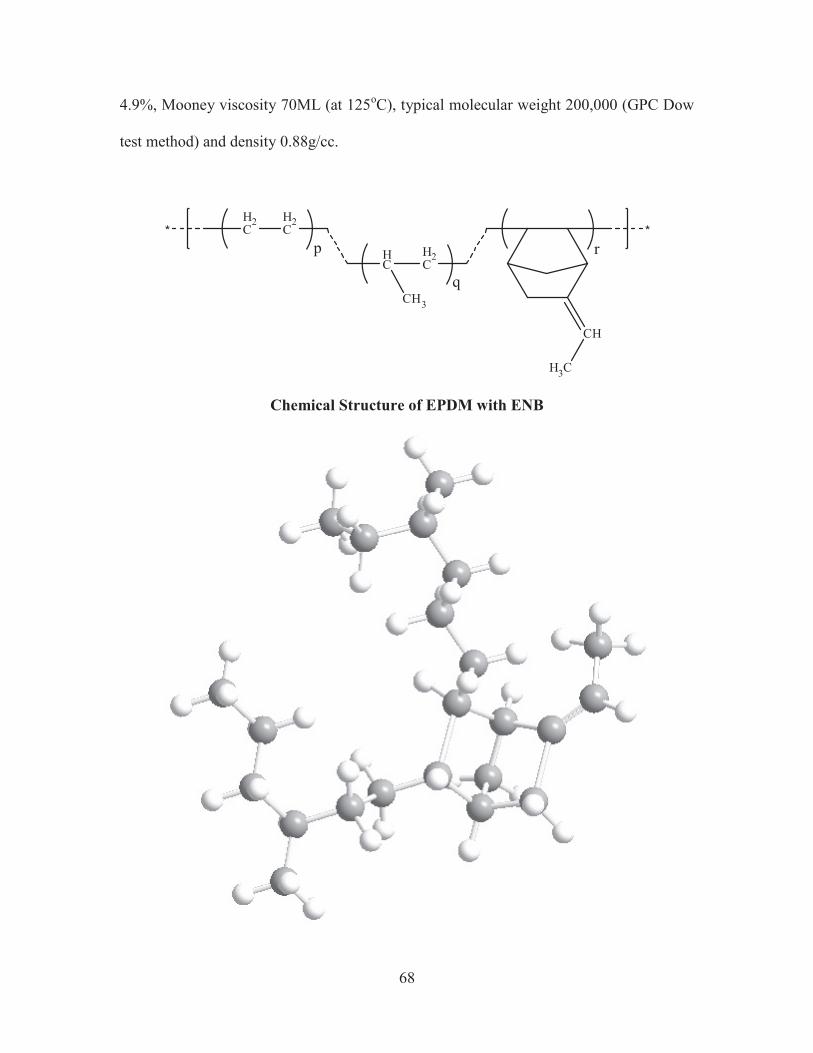
3.2.2 Neoprene Rubber
Neoprene is a family of synthetic rubbers that are produced by polymerization of
chloroprene. It contains chlorine atom within the chain. The Neoprene rubber used for the
study was 2Kg sample pack of NORDEL IP 4770R product of DOW Chemical Company
supplied freely by Bhimrajka Impex Ltd., Chennai.
CH2
C
Cl
C
H
H2C
n
Chemical Structure of Neoprene
70
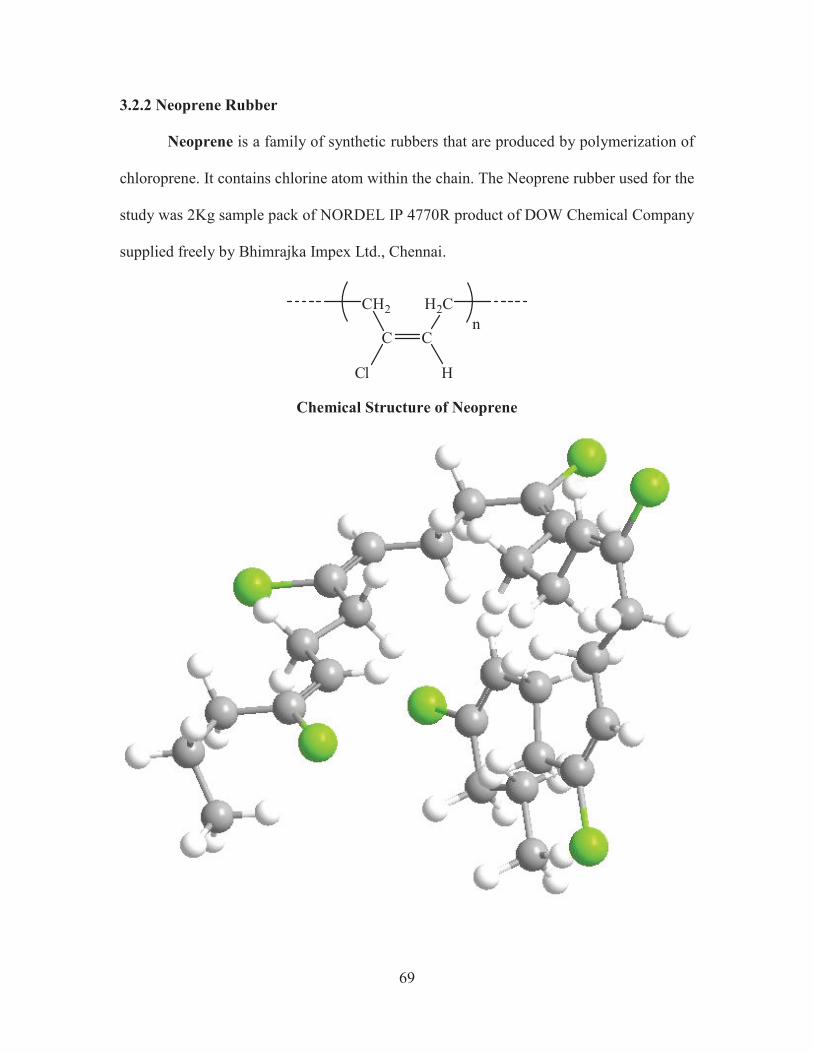
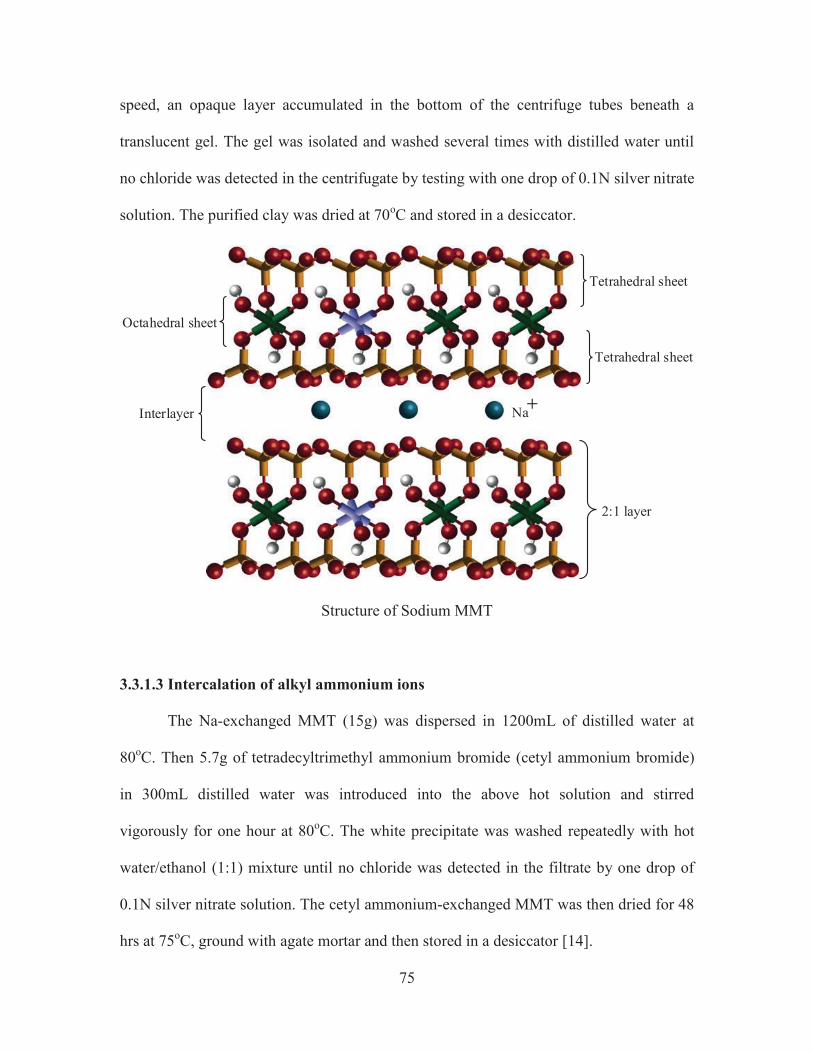
3.2.3 Montmorillonite
Montmorillonite, a member of the smectite family, is a 2:1 clay, meaning that it
has two tetrahedral sheets sandwiching a central octahedral sheet. The particles are plate-
shaped with an average diameter of approximately one micrometre. Montmorillonites
expand considerably more than other clays due to water penetrating the interlayer
molecular spaces and concomitant adsorption. The amount of expansion is due largely to
the type of exchangeable cation contained in the sample. The presence of sodium as the
predominant exchangeable cation can result in the clay swelling to several times its
original volume.
The montmorillonite clay used was Montmorillonite K10 manufactured and
supplied by Sigma-Aldrich, Germany. The clay purchased from Sigma-Aldrich was
modified by introducing sodium ions followed by alkyl ammonium groups as per
standard procedures and then used as such as filler in the rubber matrix.
71
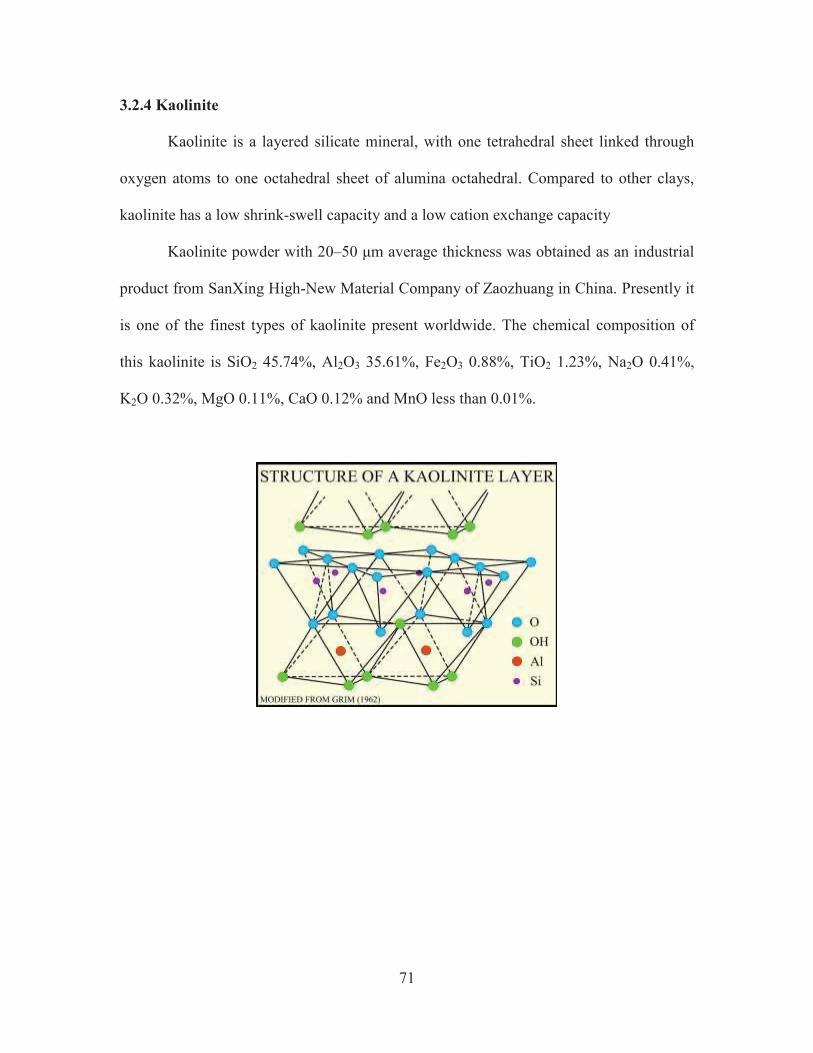
3.2.4 Kaolinite
Kaolinite is a layered silicate mineral, with one tetrahedral sheet linked through
oxygen atoms to one octahedral sheet of alumina octahedral. Compared to other clays,
kaolinite has a low shrink-swell capacity and a low cation exchange capacity
Kaolinite powder with 20–50 μm average thickness was obtained as an industrial
product from SanXing High-New Material Company of Zaozhuang in China. Presently it
is one of the finest types of kaolinite present worldwide. The chemical composition of
this kaolinite is SiO2 45.74%, Al2O3 35.61%, Fe2O3 0.88%, TiO2 1.23%, Na2O 0.41%,
K2O 0.32%, MgO 0.11%, CaO 0.12% and MnO less than 0.01%.
72
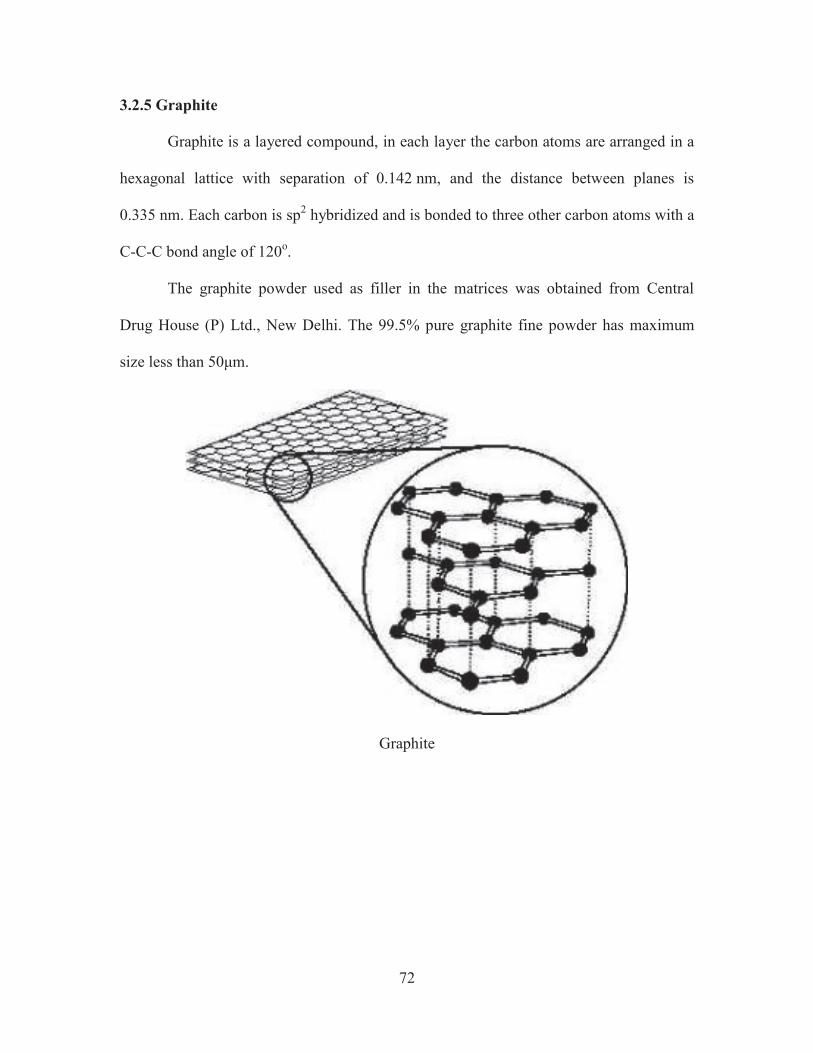
3.2.5 Graphite
Graphite is a layered compound, in each layer the carbon atoms are arranged in a
hexagonal lattice with separation of 0.142 nm, and the distance between planes is
0.335 nm. Each carbon is sp2 hybridized and is bonded to three other carbon atoms with a
C-C-C bond angle of 120o.
The graphite powder used as filler in the matrices was obtained from Central
Drug House (P) Ltd., New Delhi. The 99.5% pure graphite fine powder has maximum
size less than 50μm.
Graphite
73
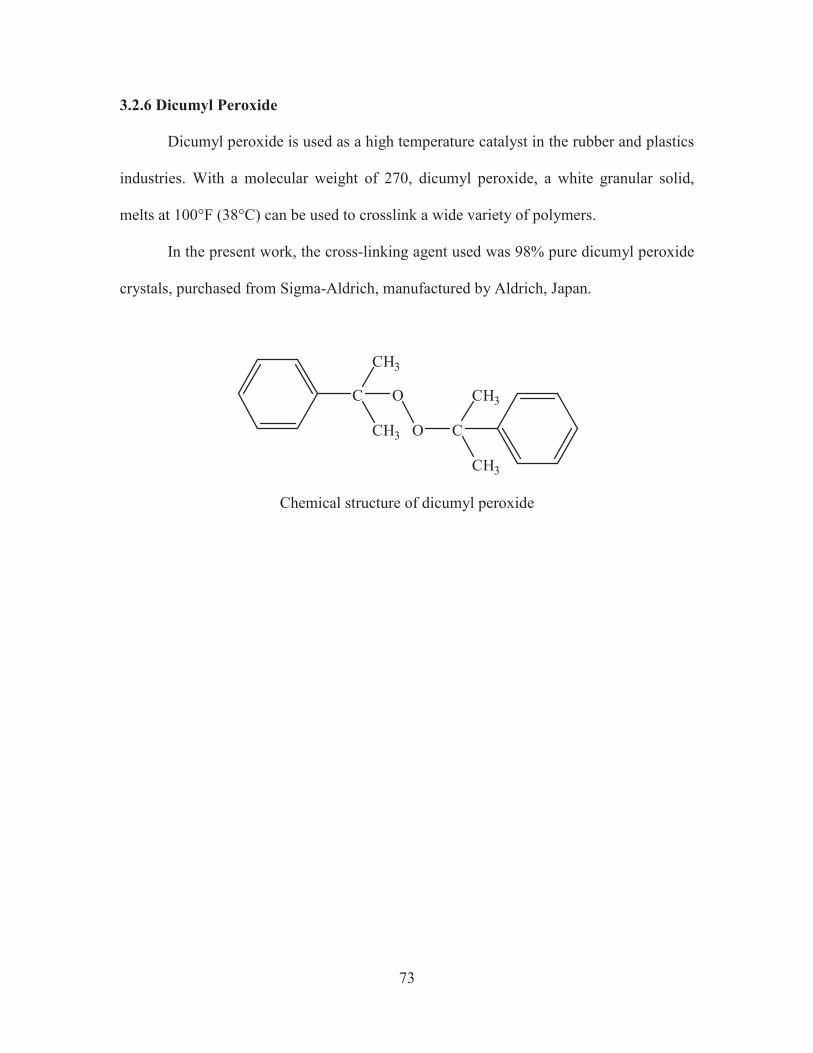
3.2.6 Dicumyl Peroxide
Dicumyl peroxide is used as a high temperature catalyst in the rubber and plastics
industries. With a molecular weight of 270, dicumyl peroxide, a white granular solid,
melts at 100°F (38°C) can be used to crosslink a wide variety of polymers.
In the present work, the cross-linking agent used was 98% pure dicumyl peroxide
crystals, purchased from Sigma-Aldrich, manufactured by Aldrich, Japan.
C
CH3
CH3
O
O C
CH3
CH3
Chemical structure of dicumyl peroxide
74
3.3 Experimental
The experimental part includes a detailed procedure of modification of
montmorillonite clay with sodium ions and then further modification by introduction of
alkyl ammonium group. The preparation of the novel rubber blend and their
reinforcement with the various fillers are also explained.
3.3.1 Organo modification of MMT
The MMT clay to be modified was purified initially and then the sodium ions
were introduced followed by the exchange of sodium ions for alkyl ammonium group.
3.3.1.1 Purification of MMT
The purification of MMT was achieved by sedimentation, centrifugation and
drying following standard methods [13]. A portion of the MMT was crushed in an agate
mortar in order to obtain a fine powder. The clay was dispersed in de-ionized water in an
ultrasonic bath for ten minutes, stirred overnight, the sediments rejected and the syrupy
liquid product (size £ 2mm) was subjected to 5000 rpm for 15 min when the product
sedimented rapidly in the centrifugal field. Particles were quickly redispersed in double
distilled water. The concentrated solution obtained was dried at 50oC in a ventilated oven
for 4 days.
3.3.1.2 Preparation of Na-montmorillonite
In order to enhance the swelling properties of MMT, sodium activation was
performed by dispersing 25g of MMT in 5L of 1N sodium chloride solution with stirring.
The stirring was continued for 24h at 70oC. Upon centrifugation of the solution at high
75
speed, an opaque layer accumulated in the bottom of the centrifuge tubes beneath a
translucent gel. The gel was isolated and washed several times with distilled water until
no chloride was detected in the centrifugate by testing with one drop of 0.1N silver nitrate
solution. The purified clay was dried at 70oC and stored in a desiccator.
Tetrahedral sheet
Tetrahedral sheet
Octahedral sheet
2:1 layer
Interlayer Na
Structure of Sodium MMT
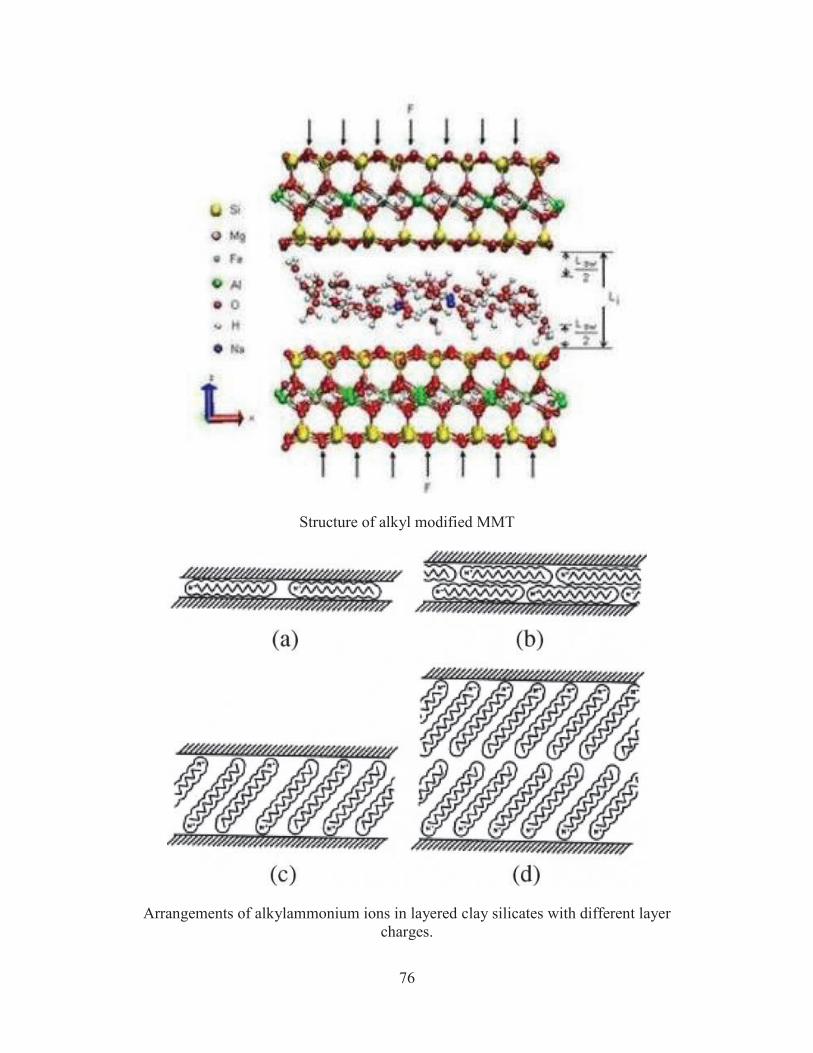
3.3.1.3 Intercalation of alkyl ammonium ions
The Na-exchanged MMT (15g) was dispersed in 1200mL of distilled water at
80oC. Then 5.7g of tetradecyltrimethyl ammonium bromide (cetyl ammonium bromide)
in 300mL distilled water was introduced into the above hot solution and stirred
vigorously for one hour at 80oC. The white precipitate was washed repeatedly with hot
water/ethanol (1:1) mixture until no chloride was detected in the filtrate by one drop of
0.1N silver nitrate solution. The cetyl ammonium-exchanged MMT was then dried for 48
hrs at 75oC, ground with agate mortar and then stored in a desiccator [14].
76
Structure of alkyl modified MMT
Arrangements of alkylammonium ions in layered clay silicates with different layer
charges.
77
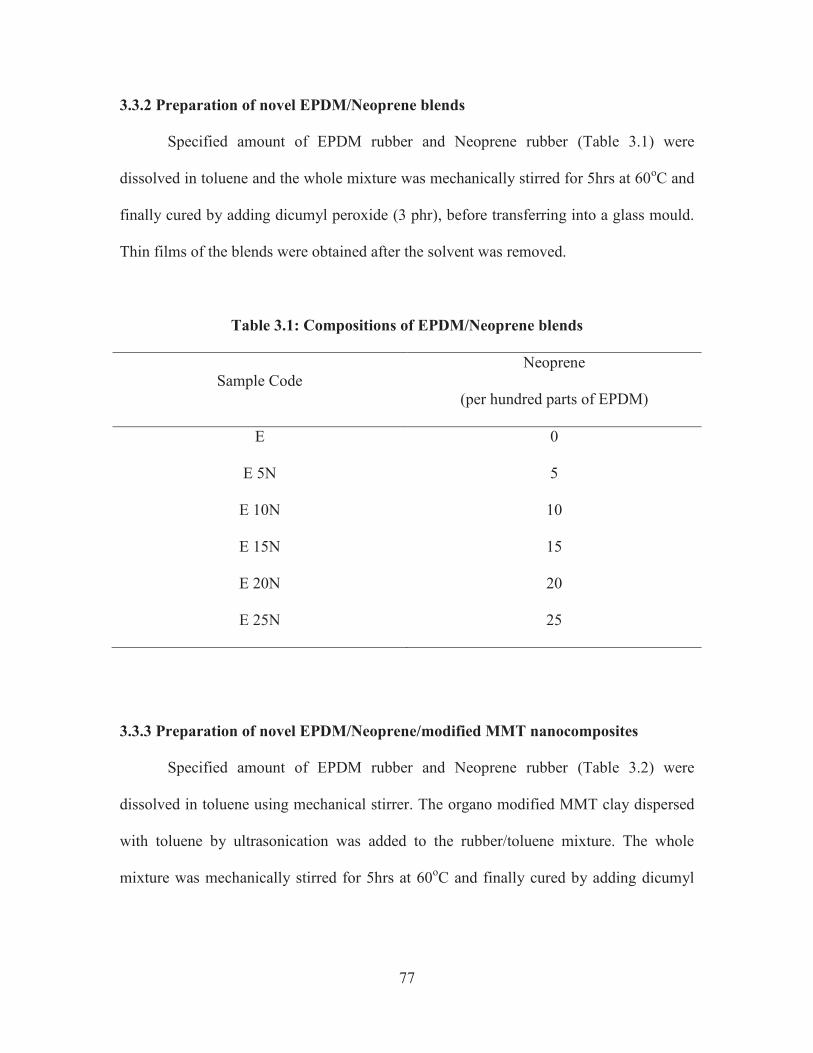
3.3.2 Preparation of novel EPDM/Neoprene blends
Specified amount of EPDM rubber and Neoprene rubber (Table 3.1) were
dissolved in toluene and the whole mixture was mechanically stirred for 5hrs at 60oC and
finally cured by adding dicumyl peroxide (3 phr), before transferring into a glass mould.
Thin films of the blends were obtained after the solvent was removed.
Table 3.1: Compositions of EPDM/Neoprene blends
Sample Code
Neoprene
(per hundred parts of EPDM)
E 0
E 5N 5
E 10N 10
E 15N 15
E 20N 20
E 25N 25
3.3.3 Preparation of novel EPDM/Neoprene/modified MMT nanocomposites
Specified amount of EPDM rubber and Neoprene rubber (Table 3.2) were
dissolved in toluene using mechanical stirrer. The organo modified MMT clay dispersed
with toluene by ultrasonication was added to the rubber/toluene mixture. The whole
mixture was mechanically stirred for 5hrs at 60oC and finally cured by adding dicumyl
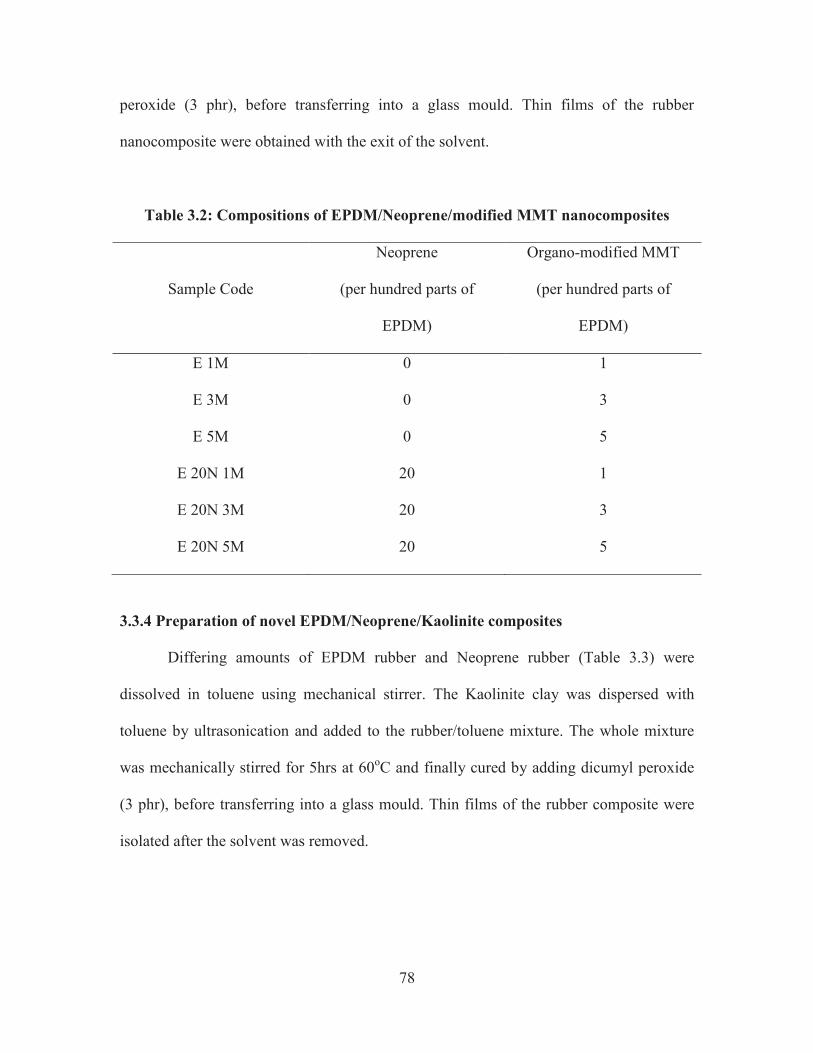
78
peroxide (3 phr), before transferring into a glass mould. Thin films of the rubber
nanocomposite were obtained with the exit of the solvent.
Table 3.2: Compositions of EPDM/Neoprene/modified MMT nanocomposites
Sample Code
Neoprene
(per hundred parts of
EPDM)
Organo-modified MMT
(per hundred parts of
EPDM)
E 1M 0 1
E 3M 0 3
E 5M 0 5
E 20N 1M 20 1
E 20N 3M 20 3
E 20N 5M 20 5
3.3.4 Preparation of novel EPDM/Neoprene/Kaolinite composites
Differing amounts of EPDM rubber and Neoprene rubber (Table 3.3) were
dissolved in toluene using mechanical stirrer. The Kaolinite clay was dispersed with
toluene by ultrasonication and added to the rubber/toluene mixture. The whole mixture
was mechanically stirred for 5hrs at 60oC and finally cured by adding dicumyl peroxide
(3 phr), before transferring into a glass mould. Thin films of the rubber composite were
isolated after the solvent was removed.
79
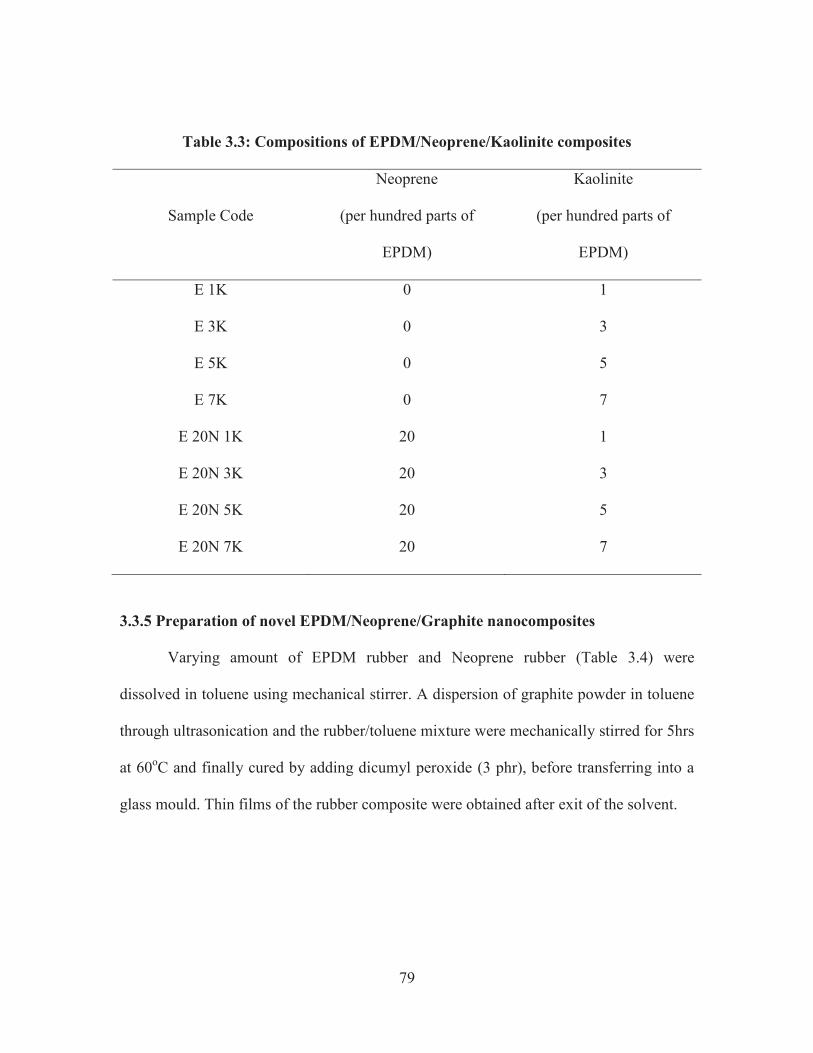
Table 3.3: Compositions of EPDM/Neoprene/Kaolinite composites
Sample Code
Neoprene
(per hundred parts of
EPDM)
Kaolinite
(per hundred parts of
EPDM)
E 1K 0 1
E 3K 0 3
E 5K 0 5
E 7K 0 7
E 20N 1K 20 1
E 20N 3K 20 3
E 20N 5K 20 5
E 20N 7K 20 7
3.3.5 Preparation of novel EPDM/Neoprene/Graphite nanocomposites
Varying amount of EPDM rubber and Neoprene rubber (Table 3.4) were
dissolved in toluene using mechanical stirrer. A dispersion of graphite powder in toluene
through ultrasonication and the rubber/toluene mixture were mechanically stirred for 5hrs
at 60oC and finally cured by adding dicumyl peroxide (3 phr), before transferring into a
glass mould. Thin films of the rubber composite were obtained after exit of the solvent.
80
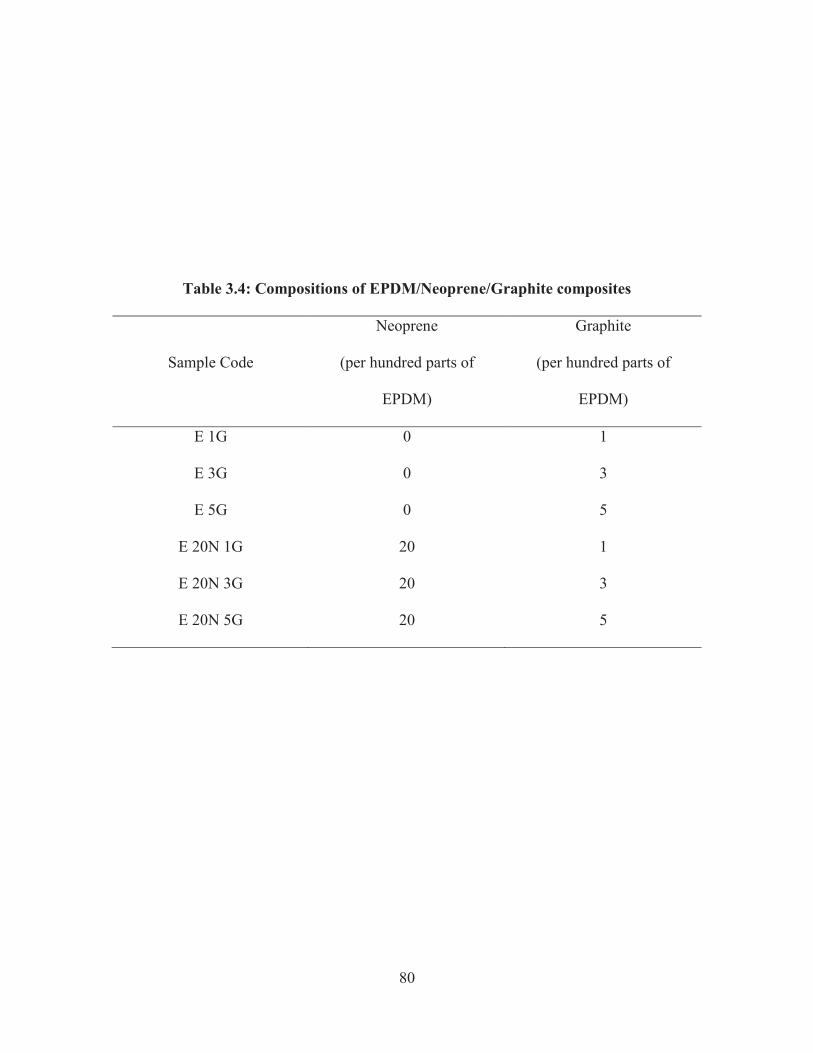
Table 3.4: Compositions of EPDM/Neoprene/Graphite composites
Sample Code
Neoprene
(per hundred parts of
EPDM)
Graphite
(per hundred parts of
EPDM)
E 1G 0 1
E 3G 0 3
E 5G 0 5
E 20N 1G 20 1
E 20N 3G 20 3
E 20N 5G 20 5
81
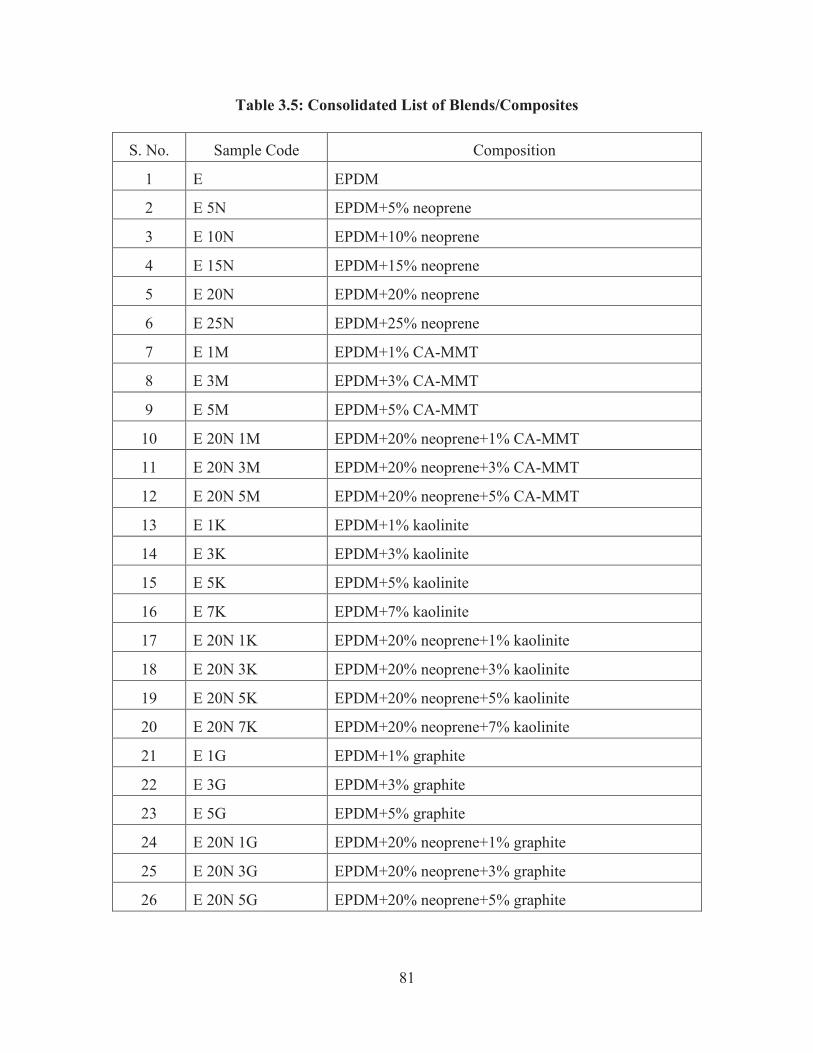
Table 3.5: Consolidated List of Blends/Composites
S. No. Sample Code Composition
1 E EPDM
2 E 5N EPDM+5% neoprene
3 E 10N EPDM+10% neoprene
4 E 15N EPDM+15% neoprene
5 E 20N EPDM+20% neoprene
6 E 25N EPDM+25% neoprene
7 E 1M EPDM+1% CA-MMT
8 E 3M EPDM+3% CA-MMT
9 E 5M EPDM+5% CA-MMT
10 E 20N 1M EPDM+20% neoprene+1% CA-MMT
11 E 20N 3M EPDM+20% neoprene+3% CA-MMT
12 E 20N 5M EPDM+20% neoprene+5% CA-MMT
13 E 1K EPDM+1% kaolinite
14 E 3K EPDM+3% kaolinite
15 E 5K EPDM+5% kaolinite
16 E 7K EPDM+7% kaolinite
17 E 20N 1K EPDM+20% neoprene+1% kaolinite
18 E 20N 3K EPDM+20% neoprene+3% kaolinite
19 E 20N 5K EPDM+20% neoprene+5% kaolinite
20 E 20N 7K EPDM+20% neoprene+7% kaolinite
21 E 1G EPDM+1% graphite
22 E 3G EPDM+3% graphite
23 E 5G EPDM+5% graphite
24 E 20N 1G EPDM+20% neoprene+1% graphite
25 E 20N 3G EPDM+20% neoprene+3% graphite
26 E 20N 5G EPDM+20% neoprene+5% graphite
82
3.4 Characterization
All the prepared blends and composites were subjected to various characterization
techniques such as spectral analysis using FT-IR, morphological studies using scanning
electron microscope and XRD, mechanical characteristics through tensile testing and
thermal analysis using TGA and DSC. All these characterizations were done using best
available standard methods.
3.4.1 Spectral Analysis- Fourier Transform Infra-Red (FT-IR)
Infrared (IR) spectroscopy plays a very important role in the physical
characterization of polymers. IR absorption bands are well known for their marked
specificity to individual chemical functionalities. IR spectroscopy is a very powerful
probing tool for numerous scientific investigations in polymers. The assignment of IR
absorption bands for specific modes of molecular vibrations in polymers gives a good
idea about the ingredients present within the matrices. The FT-IR gives the plots of wave
numbers (cm-1
) versus percentage transmittance or absorbance of the corresponding
stretching, bending, rocking frequencies, etc. of the functional groups.
IR determinations were performed with a Perkin Elmer Spectrum GX1 FT-IR
spectrometer (Monza, Italy) equipped with a Spectra Tech. Total Attenuated Reflectance
(ATR) accessory. Number of scans was 32 at 4 cm-1
. Data were processed with the
Perkin Elmer software package; a Galactic Grams 32 v5.2 software package was used for
the curve fitting procedure.
83
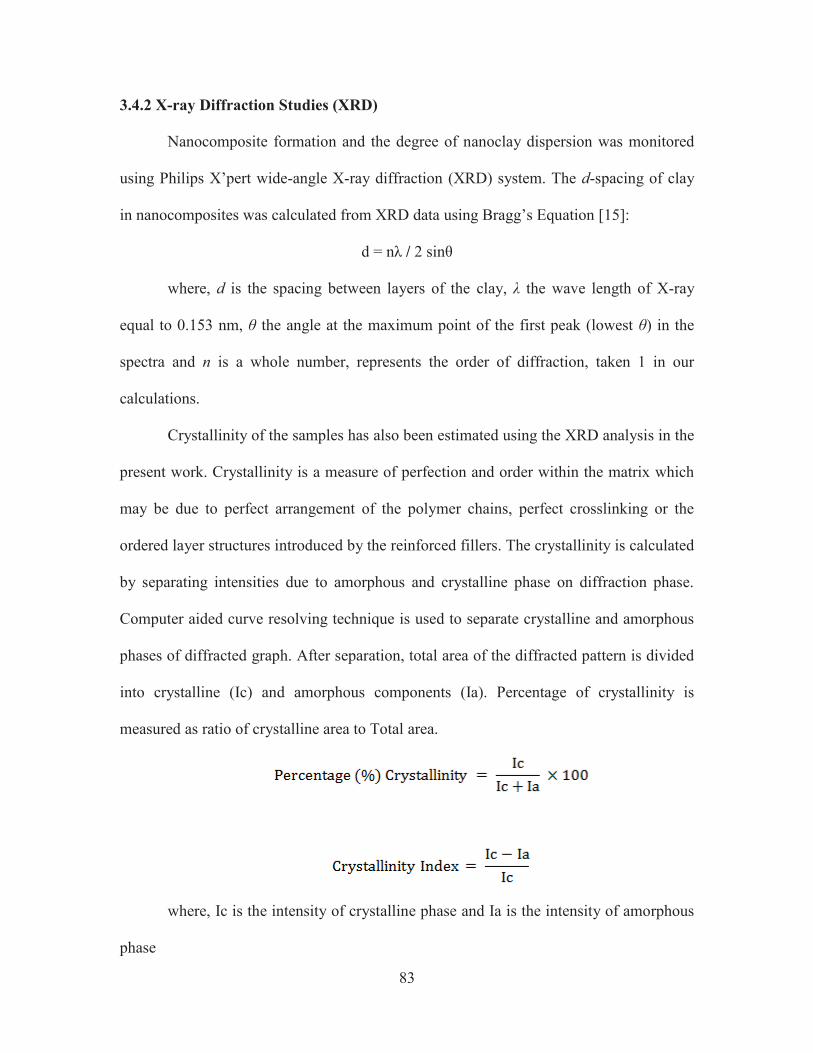
3.4.2 X-ray Diffraction Studies (XRD)
Nanocomposite formation and the degree of nanoclay dispersion was monitored
using Philips X’pert wide-angle X-ray diffraction (XRD) system. The d-spacing of clay
in nanocomposites was calculated from XRD data using Bragg’s Equation [15]:
d = nλ / 2 sinθ
where, d is the spacing between layers of the clay, λ the wave length of X-ray
equal to 0.153 nm, θ the angle at the maximum point of the first peak (lowest θ) in the
spectra and n is a whole number, represents the order of diffraction, taken 1 in our
calculations.
Crystallinity of the samples has also been estimated using the XRD analysis in the
present work. Crystallinity is a measure of perfection and order within the matrix which
may be due to perfect arrangement of the polymer chains, perfect crosslinking or the
ordered layer structures introduced by the reinforced fillers. The crystallinity is calculated
by separating intensities due to amorphous and crystalline phase on diffraction phase.
Computer aided curve resolving technique is used to separate crystalline and amorphous
phases of diffracted graph. After separation, total area of the diffracted pattern is divided
into crystalline (Ic) and amorphous components (Ia). Percentage of crystallinity is
measured as ratio of crystalline area to Total area.
where, Ic is the intensity of crystalline phase and Ia is the intensity of amorphous
phase
84
3.4.3 Thermal Properties
Thermal analysis is a group of techniques in which a property of a sample is
monitored against time or temperature while the temperature of the sample, in a specified
atmosphere, is programmed. These are differential thermal analysis (DTA), differential
scanning calorimetry (DSC), thermogravimetry (TGA), thermomechanical analysis
(TMA), dynamic mechanical analysis (DMA), and dielectric analysis (DEA). The most
popular technique for polymer applications is DSC followed by TGA (along with its
derivative, DTGA). The use of the other methods is not as widespread as DSC and TGA.
3.4.3.1 Thermal Gravimetric Analysis (TGA)
The principal applications of TGA/DTGA in polymers are determination of the
thermal stability of polymers, compositional analysis, and identification of polymers from
their decomposition pattern. Also, TGA curves are used to determine the kinetics of
thermal decomposition of polymers and the kinetics of cure where weight loss
accompanies the cure reaction
Rubber blend and composite samples were heated from 40 to 600oC, at a heating
rate of 10oC min
-1 under a constant Helium (He) flow of 90 ml min
-1, with a thermo-
gravimetric analyzer (TGA) Q500 TA Instruments coupled to a Pfeiffer Vacuum
ThermoStar M Mass Spectrometer. The weight loss was measured as a function of
temperature, and the evolved gas masses were directly monitored. DTA graph was also
obtained from the same.
85
3.4.3.2 Kinetics
Kinetics is done based on the TGA/DTA data. The aim of evaluation of kinetic
parameters from thermal analysis data is to find out the probable kinetic model which
best describes the processes and allows the calculation of reliable values for the kinetic
parameters. From the kinetics of degradation, activation energy can be calculated from an
Arrhenius Correlation, and this parameter is useful for predicting material stability. The
most common technique is the analytical model fitting method. The mathematic models
from Freeman-Carrol, Friedman, Ozawa, Flynn and Wall, ASTM, Agarwal-
Sivasubramanium, Broido, Coats-Redfern and Horowitz-Metger have been widely used
for estimating the kinetic parameters. The three methods viz. Broido, Coats-Redfern (C-
R) and Horowitz-Metzger (H-M) [16-24] which are the most acceptable and commonly
employed are used to obtain kinetic parameters. Regression analysis has been carried out
for selected samples from all combinations prepared in the present investigation. The
kinetic parameters include temperature range of various possible stages of reaction,
activation energy (Ea) and the regression values (R2).The computerized plots are
obtained for all the three methods by using spread sheets in ORIGIN Software for data
entry such as temperature range, initial weight of the sample and the residual weight of
the sample at the temperature ‘t’.
86
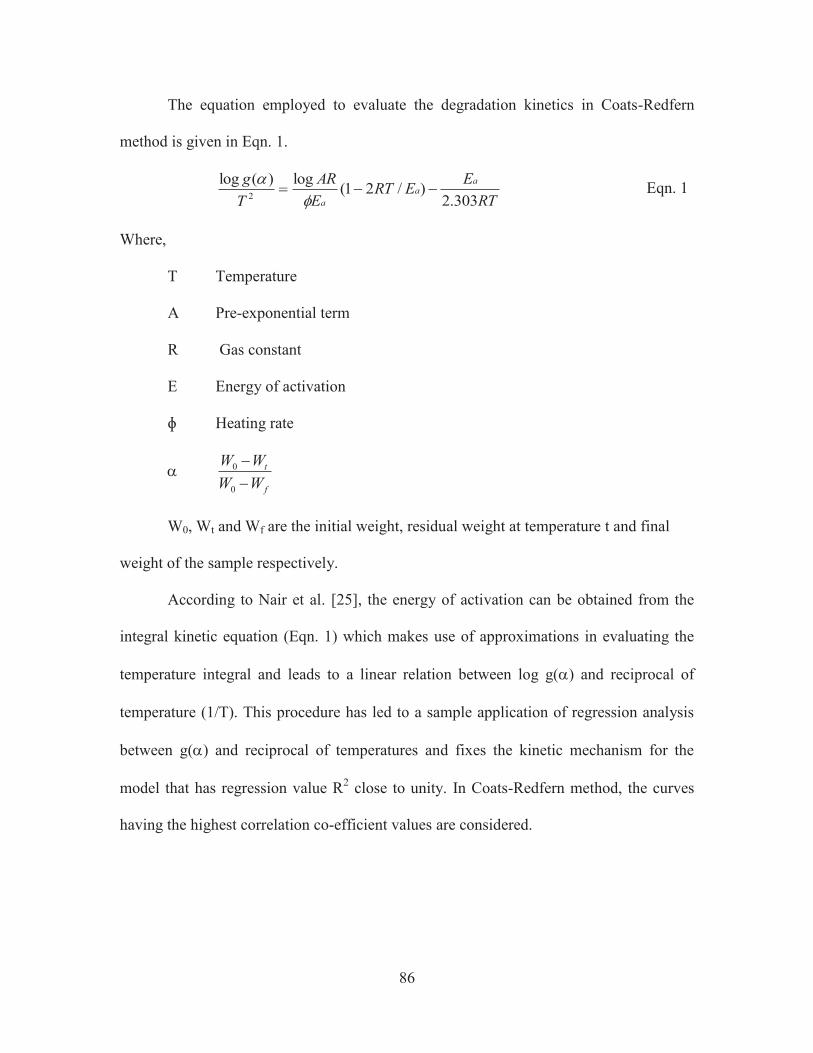
The equation employed to evaluate the degradation kinetics in Coats-Redfern
method is given in Eqn. 1.
RT
EERT
E
AR
T
g aa
a 303.2)/21(
log)(log2
--=f
a Eqn. 1
Where,
T Temperature
A Pre-exponential term
R Gas constant
E Energy of activation
ɸ Heating rate
a f
t
WW
WW
-
-
0
0
W0, Wt and Wf are the initial weight, residual weight at temperature t and final
weight of the sample respectively.
According to Nair et al. [25], the energy of activation can be obtained from the
integral kinetic equation (Eqn. 1) which makes use of approximations in evaluating the
temperature integral and leads to a linear relation between log g(a) and reciprocal of
temperature (1/T). This procedure has led to a sample application of regression analysis
between g(a) and reciprocal of temperatures and fixes the kinetic mechanism for the
model that has regression value R2 close to unity. In Coats-Redfern method, the curves
having the highest correlation co-efficient values are considered.
87
3.4.3.3 Differential Scanning Calorimetry (DSC)
DSC is used to determine the Glass Transition Temperature (Tg) of
polymer, blends and composites. The temperature region where the physical transition
from a rubbery to a glassy state takes place is called the “Glass Transition temperature
(Tg). The melting temperature of the samples was measured by a 2920 DSC V2.4F
(Universal Instruments) at a heating rate of 10oC per minute in Nitrogen atmosphere.
3.4.4 Mechanical Properties
Any property of a material that defines its response to a particular mode of stress
or strain is mechanical property, which manifests in elastic moduli, strength, and ultimate
strain in several modes, impact strength, abrasion resistance, creep, ductility, coefficient
of friction, hardness, cyclic fatigue strength, tear strength, and machinability [26].
Mechanical properties of a material include elastic and inelastic reaction when subjected
to force resulting in stress and strain.
The most frequently used mechanical properties are the quasistatic methods which
involve relatively slow loading i.e., tension, compression, and flexure. Specimens for
testing may be produced by processing operations such as injection molding,
compression molding, or machining from sheets. Machined surfaces have to be
smoothened along their longitudinal axis with abrasive paper and any flash on molded
specimens shall be removed; the cross-sectional area has to be uniform along the whole
length subjected to testing. Consequences of any non-uniformity would show up as stress
concentrators.
88
Tensile testing is the most frequently used method to characterize the material
strength. The machine should be of the constant-rate-of-crosshead-movement type,
consisting of one fixed and one movable member, both carrying self-aligning grips. The
movable member shall move with a uniform, controlled velocity with respect to the
stationary one. An extensometer is used to determine the distance between two
designated points within the gage length of the test specimen as this is stretched. Speed of
testing is defined as the relative rate of motion of the grips or test fixtures. It is specified
for different types of specimen, varying typically from 1 to 500 mm/min (0:2---20 in:
min_1). The lowest speed that produces rupture in the time range 0.5–5 min for the
specimen geometry used is to be selected.
There are two essential properties determined each time. The first is the
engineering stress
σ = F/A0
where F is the applied force and A0 is the initial cross-sectional area.
Determination of the true stress based on the actual cross-sectional area A which changes
during the experiment is possible but more difficult. The other key property is the
engineering strain (also known as the nominal tensile strain)
ε = l-l0/l0 = Δl/l0
Here l is the current length of the specimen while l0 is the original length. The
quantities obtained most often from tensile testing are:
Tensile strength: The maximum load divided by A0.
89
Percent elongation: Whenever the specimen gives a yield load larger than the load
at break, the percent elongation at yield is considered. Otherwise the percent elongation
at break is reported [27].
Tensile Testing
The tensile enables to find tensile strength, elongation at break and tensile
modulus. All these tensile tests were performed by using INSTRON 3365, UK, testing
machine as per ASTM-D3039 standards with a cross head speed of 100mm/min. Samples
with a dimension of 100mm×10mm with an average thickness of 0.3mm were used. An
average of five measurements has been recorded.
3.4.5 Morphology-Scanning Electron Microscopy (SEM)
Scanning electron microscope technique is used to produce excellent images of
the phase structure of stained blends and block copolymers. In the SEM a narrow (10 nm)
primary electron beam of the order of 10 keV in energy is scanned across the surface of
the specimen and an image is built up pixel by pixel.
For phase morphology analysis, the samples were cryogenically fractured using
liquid nitrogen. SEM photographs of the fractured surfaces were taken after preferential
extraction of the minor phase using a Philips 505 microscope (Royal Philips Electronic,
Eindhoven, Netherlands).
90
3.5 References
[1] Vallat M, F, F. Ruch, M.O. David, European Polymer Journal, 40: 1575–1586
(2004).
[2] Van Drumpt J. D., Rubber World, 33: 33–41 (1988).
[3] Akiba M, Hashim A.S., Prog Polym Sci, 22: 421–75 (1997).
[4] Ogunniyi DS. Progr Rubber Plast Technol 15(2): 95–112 (1999).
[5] Loan L. D. Rubber Chem Technol 40: 149–76 (1967).
[6] Baldwin F. P., Ver Strate G. Rubber Chem Technol, 45: 709–881 (1972).
[7] Keller RC. Rubber Chem Technol 1988; 61(2):238–54 (1988).
[8] Dikland H. G., Kauts Gum Kunst 49(6): 413–7 (1996).
[9] Baldwin FP, Borzel P,Cohen CA, Makowsk i HS,Van de Castle JF. Rubber Chem
Technol 43(3): 522–48 (1970).
[10] Van Drumpt JD, Oosterwijk H H J. J Polym Sci, Polym Chem Ed, 14: 1495–511
(1976).
[11] Gonzalez L, Rodriguez A, Marcos A, Chamorro C. Rubber Chem Technol 69:
203–14 (1996).
[12] Harpel G. A., Walrod D. H., Rubber Chem Technol 46: 1007–18 (1973).
[13] Kornmann, X., Berglund, L.A., Sterte, J., Giannelis, E.P. Polym. Eng. Sci, 38:
1351 (1998).
[14] Chinnakkannu Karikal Chozhan., Muthukaruppan Alagar., Rajkumar Josephine
Sharmila., Periyannan Gnanasundaram. J. Polym. Res., 14: 319 (2007).
[15] Sperling L. H, Physical Polymer Science, Wiley, US, 2001.
[16] Freeman E. S. and B. Carrol, J. Phys. Chem., 62, 394 (1958).
91
[17] Friedman H. L., J. Polym. Sci, Part C, 6, 183 (1963).
[18] Ozawa T., Chem. Soc. Jpn., 38, 1881 (1965).
[19] Flynn J. H. and L. A. Wall, J. Polym Sci., Part B, 4,323 (1966).
[20] ASTM Committee on standards, ASTM E698, Annual Book of ASTM Standards
(1984).
[21] Agarwal R. K. and M. S. Sivasubramanian, AICHE. J., 33,7 (1987).
[22] Broido A., J. polym. Sci, A-2 (7), 1761 (1969).
[23] Coats A. W. and J. Redfern, Nature, 201, 68 (1964).
[24] Harowitz H. H. and G. Metzger, Anal. Chem., 35, 1464 (1963).
[25] Nair C. G. R and P. M. Madhusudhanan, Thermochimica Acta., 14, 373-382
(1976).
[26] Jan W. Gooch (Ed.) “Encyclopedic Dictionary of Polymers” Springer Science-
Business Media, LLC, (2007).
[27] James E. Mark “Physical Properties of Polymers Handbook” Springer Science-
Business Media, LLC, (2007).


![UV] &!! >‘ Ze‘cZ X DjdeV^media.msanet.com/NA/USA/PermanentInstruments/Safetyand... · 2004. 3. 8. · >‘UV] &"!! >‘_Ze‘cZ_X DjdeV^ 8]bcadRcX^]](https://img.pdfslide.net/doc/110x75/60c9a5d7fee7040ad43575fe/uv-a-zeacz-x-djdevmedia-2004-3-8-auv-.jpg)