Embed Size (px)
Citation preview
TERAVISION: A DISTRIBUTED, SCALABLE, HIGH-RESOLUTION GRAPHICS STREAMING SYSTEM
BY
RAJVIKRAM SINGHB.E. Electronics Engineering, University of Mumbai, India, 1998
THESIS
Submitted as partial fulfillment of the requirements for the degree of Master of Science in Computer Science
in the Graduate College of the University of Illinois at Chicago, 2003
Chicago, Illinois

ACKNOWLEDGMENTS
I would like to thank my committee members; Jason Leigh, Andrew Johnson and Luc
Renambot for their valuable guidance and patience in leading this thesis to completion. I am
grateful to Jason for his foresight in laying the foundation for TeraVision and giving me an
opportunity to work on it, I hope that this thesis comes close to what he had envisioned.
I thank every member of the Electronic Visualization Laboratory (EVL), University of
Illinois at Chicago for their constant support and valuable inputs throughout the duration of my
thesis. I would really like to thank our support group Alan Verlo, Lance Long and Patrick
Hallihan for their relentless help with system and networking problems. I’d like to thank my team
members; Naveen Krishnaprasad for his valuable help with design issues, Shalini
Venkataraman for patiently answering my 3D graphics-related queries and Brenda Lopez for
her help with designing the GUI, logo, videos and taking care of all online web-pages. I also
want to thank Javier Girado and Yong-joo Cho for their very helpful guidance in overcoming
Windows related problems. I truly appreciate the warm support of my closest companions at
EVL: Laura, Eleni, Tina, Javid, Janet, Vaidya, Julieta, Nicholas and Marientina.
We’ve also had a lot of support from our collaborators at GRNET (Greek Research and
Technology Network), University of Amsterdam, ANL (Argonne National Labs), Northwestern
University and NCSA (National Center for Supercomputing applications). Fotis Karayannis,
Cees de Laat, Paul Wielinga, Hans Blom, Linda Winkler and are just a few of the people that I
would like to thank.
iii
iv
ACKNOWLEDGMENTS
And last but definitely not the least; I’d like to thank my parents; Dr Khushdev Singh
Mudher and Hardip Kaur, for their unconditional encouragement and support; without which any
achievement would probably not hold any value. I’d like to dedicate this thesis to them.
RS
iv
v
TABLE OF CONTENTS
CHAPTER PAGE
1. TERAVISION: MOTIVATION AND OVERVIEW ……………………. 11.1 Motivation ……………………………………………………….. 11.1.1 Collaboration / Presentation …………………………………... 11.1.2 Scientific Visualizations ………………………………………... 21.2 Visualizations and displays ……………………………………. 51.2.1 Output of a single computer …………………………………… 51.2.2 Tiled Displays …………………………………………………… 61.2.3 Stereoscopic Visualizations …………………………………… 71.2.4 Other standard and non-standard displays ………………….. 81.3 Problems associated with streaming visualizations ………… 81.4 Need to distribute network streaming load …………………... 101.4.1 Fast Networks …………………………………………………… 101.4.2 Fast Computers …………………………………………………. 111.5 TeraVision: Overview and applications ………………………. 12
2. TERAVISION: RELATED WORK ……………………………………. 142.1 Software based solutions ……………………………………… 142.1.1 Remote desktop access ……………………………………….. 142.1.2 Scalable / distributed graphics systems ……………………… 152.1.2.1 AURA ……………………………………………………………. 152.1.2.2 Chromium/WireGL ……………………………………………… 162.1.3 Media streaming software ……………………………………... 172.2 Hardware based solutions ……………………………………... 17
3. TERAVISION: CONCEPTS, SYSTEM DESIGN AND IMPLEMENTATION……………………………………………………………………. 18
3.1 Concepts ……………………………………………………….. 203.1.1 TeraVision Server ……………………………………………... 203.1.2 TeraVision Client ………………………………………………. 20
3.1.3 TeraVision Master ……………………………………………... 21
3.1.4 TeraVision Slave ……………………………………………….. 223.1.5 Video Source …………………………………………………… 23
3.1.6 Server or client Montages …………………………………….. 233.1.7 TeraVision processes ………………………………………….. 233.2 Possible configurations ………………………………………… 233.3 System design ………………………………………………….. 263.4 System modules and their design considerations ………….. 293.4.1 User Interface Module …………………………………………. 293.4.2 Control Channel ………………………………………………… 353.4.3 Sync Channel …………………………………………………... 363.4.4 Video Source Module ………………………………………….. 403.4.5 Compression Module ………………………………………….. 42
v
vi
3.4.6 Network Protocol Modules ……………………………………. 433.4.6.1 TCP Module …...……………………………………………….. 443.4.6.2 UDP Module ……………………………………………………. 45
TABLE OF CONTENTS (contd.)
CHAPTER PAGE
3.4.6.3 Multicast Module ……………………………………………….. 47
4. SPECIFIC CAPABILITIES …………………………………………….. 51
4.1 M x N to X x Y scaling …………………………………………. 514.2 Video data over UDP ………………………………………….. 544.3 Remote process execution and control ……………………… 564.4 Frame Decimation policy ……………………………………… 574.4.1 Server side decimation ………………………………………… 574.4.2 Client side decimation …………………………………………. 57
5. TESTS AND OBSERVATIONS ………………………………….…… 585.1 Test machines’ specifications ………………………………... 58
5.1.1 Linux machines ………………………………………………… 585.1.2 Windows machines ……………………………………………. 585.2 Network specifications ………………………………………… 595.2.1 LAN ……………………………………………………………… 595.2.2 WAN …………………………………………………………….. 595.3 Tests …………………………………………………………….. 59
5.3.1 Performance over TCP and UDP …………………………….. 595.3.2 Affect of Synchronization and Scalability ……………………. 615.3.3 Affect of different frame sizes ………………………………… 62
5.3.4 Affect of UDP datagram sizes ………………………………... 645.4 System demonstrations ……………………………………….. 65
6. CONCLUSIONS AND FUTURE WORK …………………………….. 666.1 Contributions ……………………………………………………. 666.2 Future work ……………………………………………………... 676.2.1 Multicasting tiled displays ……………………………………… 676.2.2 Optical multicast ………………………………………………… 676.2.3 Incorporate RBUDP ……………………………………………. 686.2.4 Integration with the Access Grid ……………………………… 686.2.5 Real-time guarantees from the OS …………………………… 696.2.6 Collapsing large displays to small ……………………………. 69
6.2.7 Compression over unreliable protocols ……………………… 706.2.8 Secure channel for control plane ……………………………... 706.2.9 Port-mapping and restricting port range ……………………... 70
vi
vii
6.3 Concluding remarks ……………………………………………. 71
CITED LITERATURE …………………………………………………… 72
VITA ………………………………………………………………………. 74
vii
viii
LIST OF TABLES
TABLE PAGE
I. COMPARISION CHART OF EXISTING SYSTEMS AND TERAVISION 18
II. SYSTEM PERFORMANCE OVER TCP………………………………… 60
III. SYSTEM PERFORMANCE OVER UDP………………………………… 60
IV. EFFECT OF SYNCHRONIZATION AND SCALABILITY ON CLIENTS 61
V. EFFECT OF SYNCHRONIZATION AND SCALABILITY ON SERVERS 62
VI. EFFECT OF FRAME SIZES OVER TCP ………………………………… 63
VII. EFFECT OF FRAME SIZES OVER UDP ………………………………… 63
VIII. EFFECT OF UDP DATAGRAM SIZES ON WINDOWS ………………… 64
viii
ix
LIST OF FIGURES
FIGURE PAGE
1. The Continuum – An Amplified Collaboration Environment at EVL ……………………………………………………………………. 2
2. Scientific Visualization Pipeline ……………………………………….. 4
3. Graphics processing pipeline constructed using n machines ……… 5
4. Display from a single computer generating visualization …………... 6
5. EVL’S 15 tile tiled-display running Vol-A-Tile; an interactive, realtime volume rendering software …………………………………… 7
6. Users seen interacting with a passive stereo system called AGAVE at EVL’s AccessGrid room …………………………………… 8
7. Basic TeraVision setup ………………………………………………… 13
8. Master-Slave Interaction ……………………………………………….. 22
9. TeraVision setup for streaming stereoscopic video ………………… 24
10. Example of streaming tiled-displays using multiple VBoxes at a site …………………………………………………………………… 25
11. Block diagram representation of TeraVision server design ………... 27
12. Block diagram representation of TeraVision client design …………. 28
13. Interaction between the UI modules and the TeraVision process … 32
14. TeraVision GUI main screen …………………………………………... 34
15. Configuring individual modules through the system configuration screen ……………………………………………………………………. 35
16. Steps for handshake over TCP ……………………………………….. 39
17. Example of external sources with TeraVision servers ……………… 41
18. TCP module configuration screen …………………………………….. 44
19. UDP module configuration screen ……………………………………. 47
20. Single video stream multicast from one server to one client ………. 48
ix
x
LIST OF FIGURES (contd.)
FIGURE PAGE
21. Multiple video streams multicast from many servers to many clients ……………………………………………………………… 49
22. Multicast module configuration screen ……………………………….. 50
23. Scaling source video to client display ………………………………… 52
24. Header and payload fields of a TeraVision UDP packet ………….. 55
x
xi
LIST OF ABBREVIATIONS
ACE Advanced Collaborative Environments
AGAVE Access Grid Augmented Virtual Environment
CPU Central Processing Unit
PDA Personal Digital Assistant
RFC Request For Comments
TCP Transmission Control Protocol
UDP Unreliable Datagram Protocol
LAN Local Area Networks
WAN Wide Area Networks
NFS Network File System
LFN Long Fat Network
Gbps Gigabits Per Second
VGA Video Graphics Adapter
DVI Digital Video Interface
USB Universal Serial Bus
RBUDP Reliable Blast UDP
MPEG Motion Picture Experts Group
IPC Inter-Process Communication
MMX Multimedia Extensions
IA-32 Intel Architecture, 32-bits
IA-64 Intel Architecture, 64-bits
GUI Graphical User Interface
FLTK Fast Light Tool Kit
xi
xii
BDP Bandwidth Delay Product
MTU Maximum Transmission Unit
OS Operating System
xii
xiii
SUMMARY
One of the common problems faced in collaborative environments and scientific
visualization applications, is termed the 'Display docking' or the 'Display Pushing' problem. In
simple words, it is the need for distributing visualizations or presentations generated on one or
more computers, to remote sites for viewing and/or image post-processing. A typical image
source in such a case could be computers ranging from laptops showing presentations, to
compute clusters number crunching terabytes of data and rendering high resolution
visualizations on tiled displays.
In this thesis report we present a scalable platform independent solution which is
capable of transmitting multiple high resolution video streams from such video sources to one or
more destinations. The unique capability of this concept is that it is a flexible hardware and
software based solution, where no special software/hardware has to be installed on the source
or destination machines to enable them to transmit their video. The load of streaming these
high-resolution video streams is also off-loaded to dedicated systems, leaving the source
machines, generating the graphics, free for pure computation. The multiple video streams
handled by the system can either be independent of each other or they might be component
streams of a more complex video system, such as a tiled display or stereoscopic display. We
shall also present results with testing on high speed dedicated long haul networks, and local
area gigabit LANs with different Layer 4 protocols.
xiii
xiv
1. TERAVISION: MOTIVATION AND OVERVIEW
We must not wait for things to come, believing that they are decided by
irrescindable destiny. If we want it, we must do something about it now.
- Erwin Schrödinger (Nobel Prize laureate)
1.1 Motivation
1.1.1 Collaboration / Presentation
Collaborative environments are physical meeting places that allow remote users to
interact and work on a common set of tasks. Such environments have an inherent and basic
requirement that the users are able to share and present their ideas to remote parties in such a
way that it feels like all the participants are in the same room. One example is a system called
the Continuum [5] at the Electronic Visualization Laboratory, at the University of Illinois at
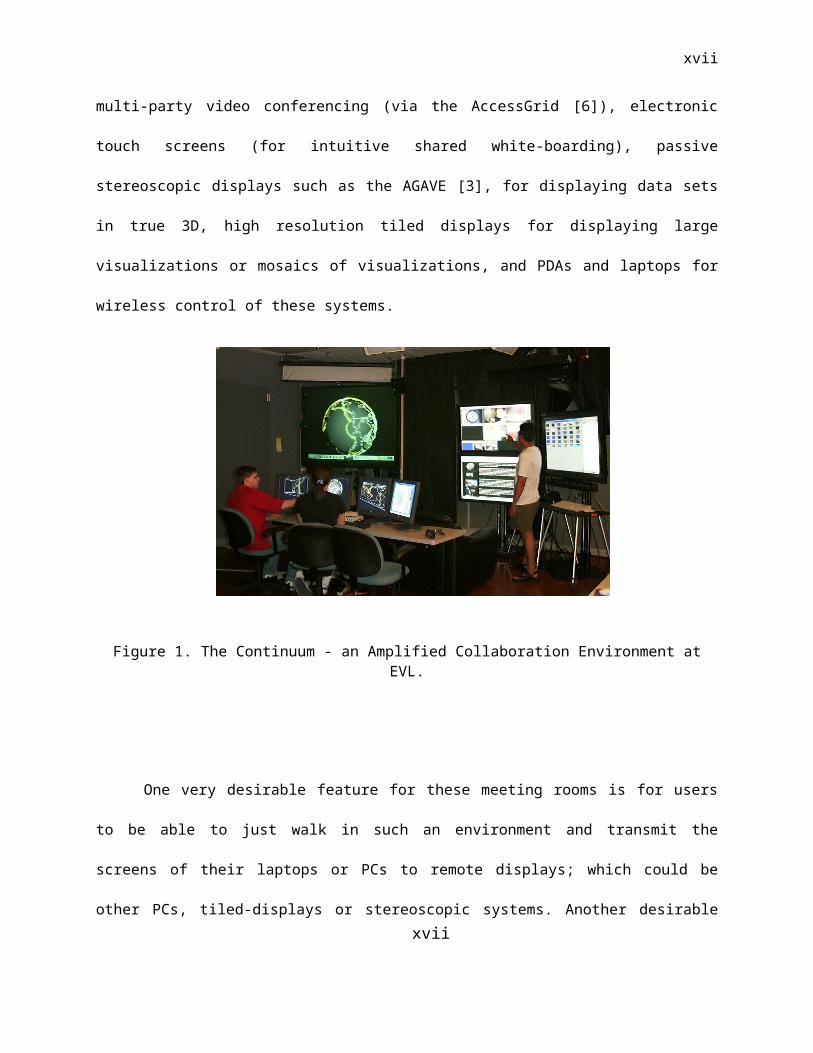
Chicago. Continuum, as shown in Figure 1 is an example of an Advanced Collaborative
Environment (ACE) which are based on the concept of the “War Room” or “Project Room” and
have been shown to increase the productivity of collocated working teams by a factor of two [5].
The Continuum integrates a broad range of technologies that include: multi-party video
conferencing (via the AccessGrid [6]), electronic touch screens (for intuitive shared white-
boarding), passive stereoscopic displays such as the AGAVE [3], for displaying data sets in true
3D, high resolution tiled displays for displaying large visualizations or mosaics of visualizations,
and PDAs and laptops for wireless control of these systems.
xiv
xv
Figure 1. The Continuum - an Amplified Collaboration Environment at EVL.
One very desirable feature for these meeting rooms is for users to be able to just walk in
such an environment and transmit the screens of their laptops or PCs to remote displays; which
could be other PCs, tiled-displays or stereoscopic systems. Another desirable feature would be
to do so without requiring installing any software/hardware on the source machines to do the
streaming. The visualization that has to be streamed could be something as simple as a
presentation running off a laptop to the output of 3D visualization software running on a multi-
processor machine.
1.1.2 Scientific Visualizations:
Data visualization is an application of computer science concepts that touches almost
every other scientific field. From simple 2D graph representations of time-dependent sensor
data to heavy computationally demanding 3D simulations, data visualization proves to be as
xv
xvi
important as the application itself. Over the recent years, there has been a significant impetus
driving innovations in the graphics hardware industry. Now users can buy inexpensive
commodity 3D graphics cards for their PCs, which are capable of processing millions of
polygons per second; something that was considered to be the realm of specialized
supercomputers till 5 years back. This has obviously led to a spate of ideas to do better
visualization research with more data than was ever possible. However since processing large
data-sets also means that we need large computing power, the other area that has been
influenced as a result, is that of distributed computing using clusters. Clusters have proved to be
an effective means to build cheap and low-end supercomputers with commodity hardware and
software. Combined with the latest graphics hardware, they are capable of visualizing large and
complex data-sets.
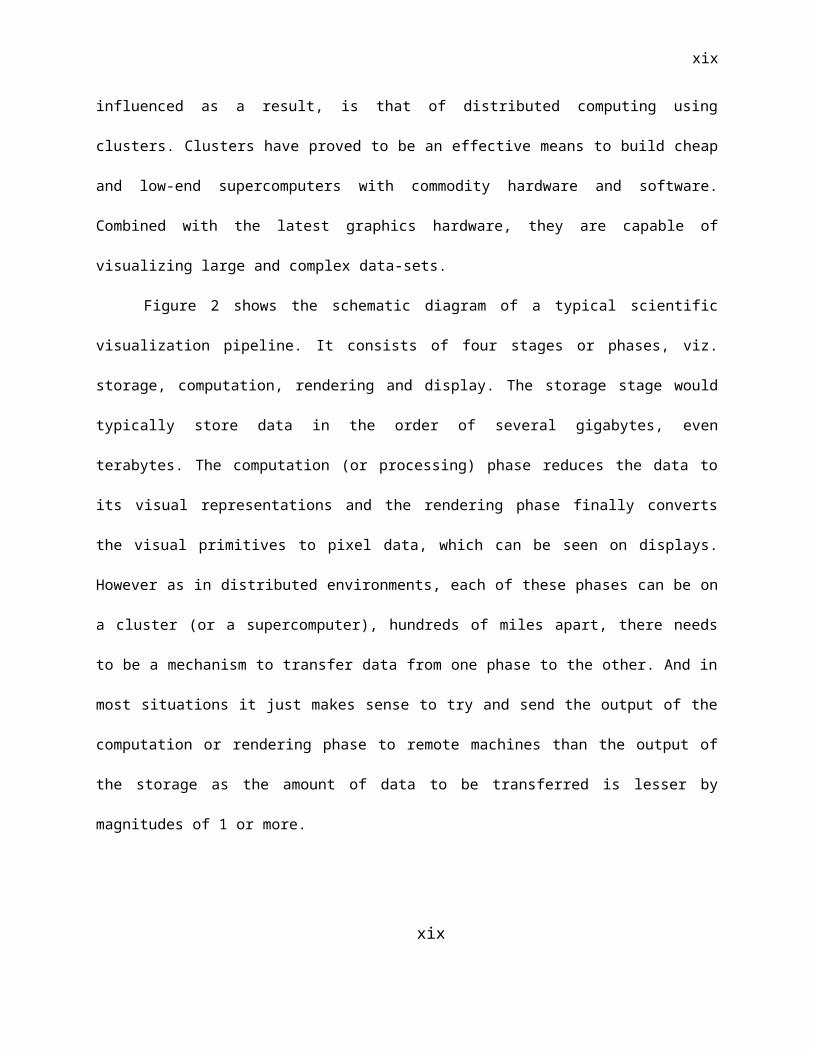
Figure 2 shows the schematic diagram of a typical scientific visualization pipeline. It
consists of four stages or phases, viz. storage, computation, rendering and display. The storage
stage would typically store data in the order of several gigabytes, even terabytes. The
computation (or processing) phase reduces the data to its visual representations and the
rendering phase finally converts the visual primitives to pixel data, which can be seen on
displays. However as in distributed environments, each of these phases can be on a cluster (or
a supercomputer), hundreds of miles apart, there needs to be a mechanism to transfer data
from one phase to the other. And in most situations it just makes sense to try and send the
output of the computation or rendering phase to remote machines than the output of the storage
as the amount of data to be transferred is lesser by magnitudes of 1 or more.
xvi
xvii
Figure 2. Scientific Visualization pipeline
Let us consider the case where the rendering machines are a shared resource offered
by a supercomputing center, thousands of miles away from the researchers running the code. In
this case, the researchers want to see the resultant visualization in its entirety, locally on their
site. The reader should keep in mind that scientific visualization applications are capable of
producing high-resolution video streams at the rate of multiple gigabits/second, which require a
substantial amount of CPU and system resources to transmit (or receive). But since the
applications generating the scientific visualization themselves take up a lot of resources on the
computing machines too, they leave no (or little) resources to stream the video to the desired
destination. One way to solve this problem is to offload the graphics streaming load to a
dedicated set of machines.
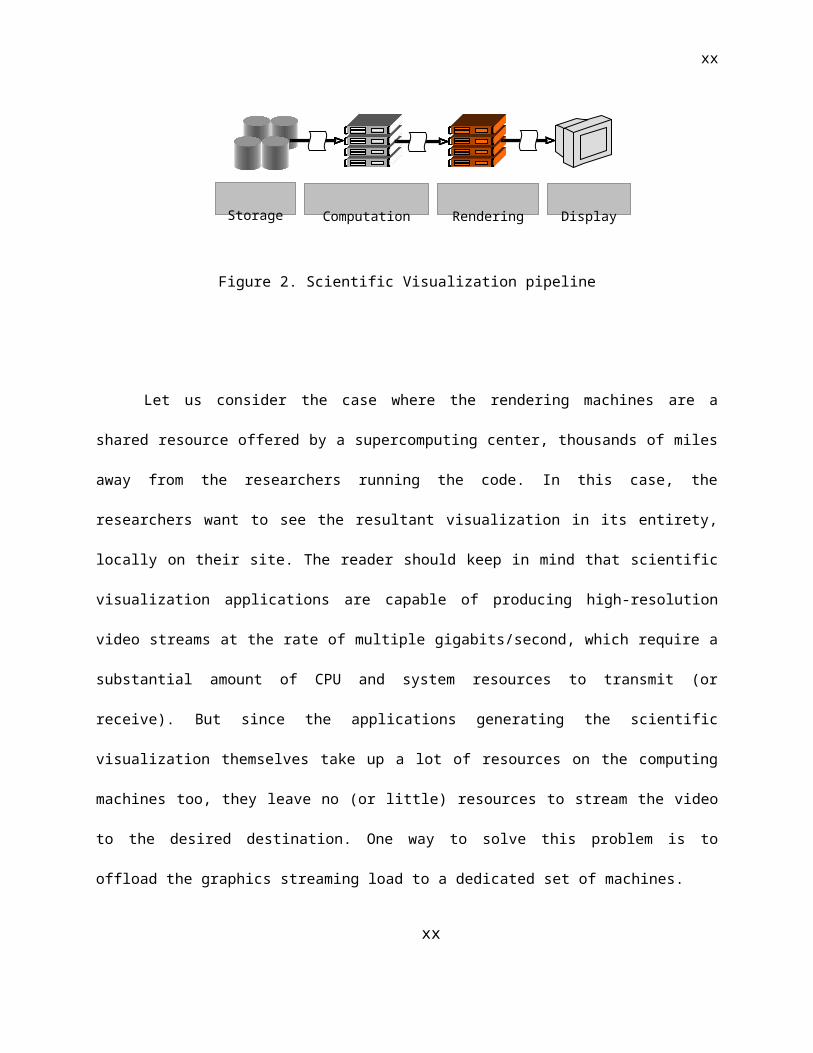
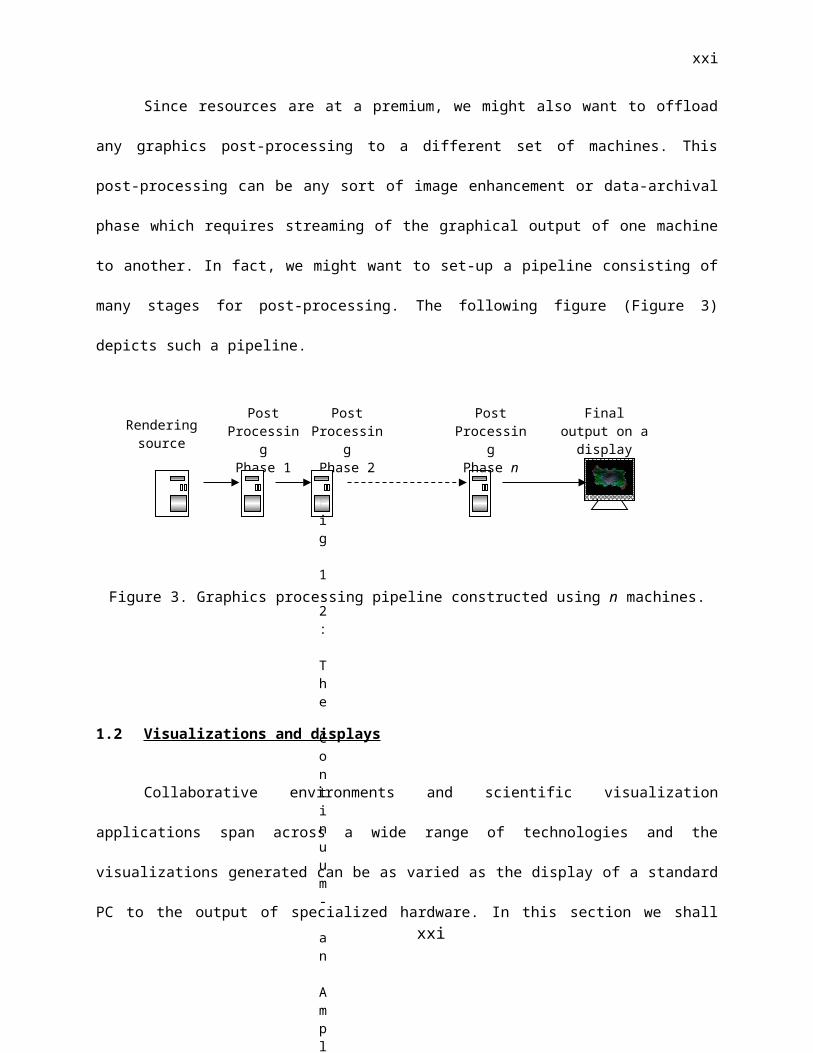
Since resources are at a premium, we might also want to offload any graphics post-
processing to a different set of machines. This post-processing can be any sort of image
enhancement or data-archival phase which requires streaming of the graphical output of one
machine to another. In fact, we might want to set-up a pipeline consisting of many stages for
post-processing. The following figure (Figure 3) depicts such a pipeline.
xvii
Storage Computation Rendering Display
xviii
Figure 3. Graphics processing pipeline constructed using n machines.
1.2 Visualizations and displays
Collaborative environments and scientific visualization applications span across a wide
range of technologies and the visualizations generated can be as varied as the display of a
standard PC to the output of specialized hardware. In this section we shall talk about the
different types of configurations that are possible and give a brief introduction to the
technologies behind them.
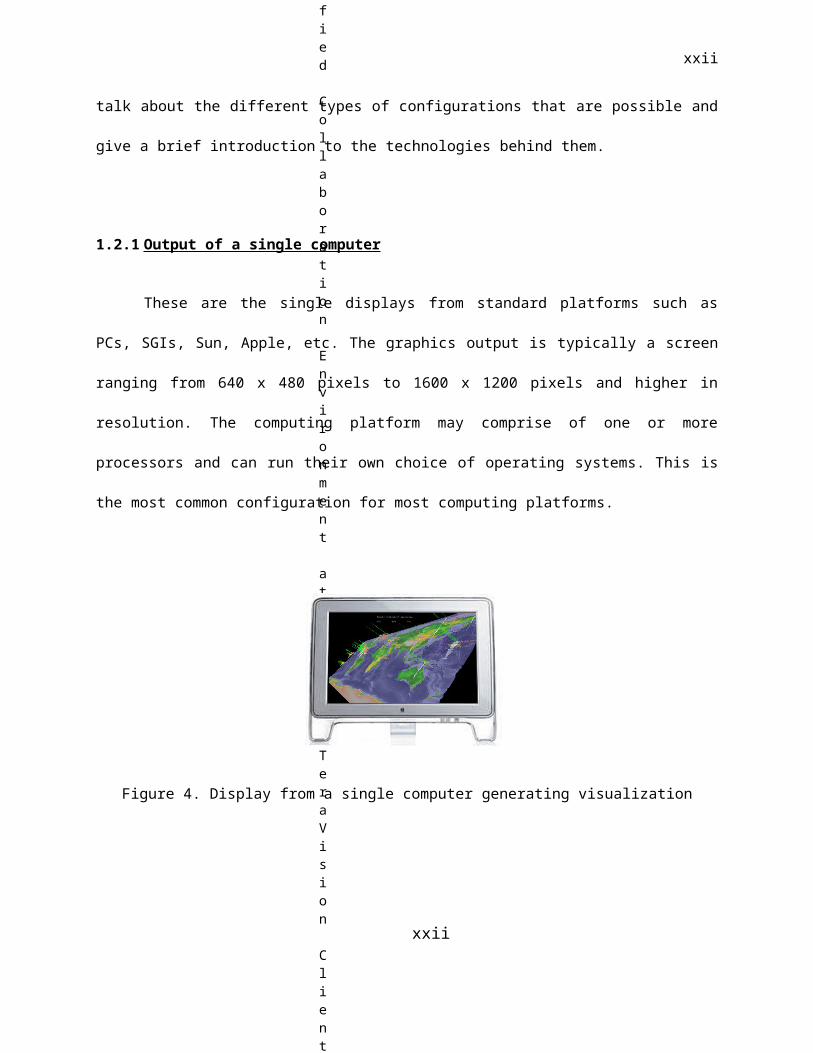
1.2.1 Output of a single computer
These are the single displays from standard platforms such as PCs, SGIs, Sun, Apple,
etc. The graphics output is typically a screen ranging from 640 x 480 pixels to 1600 x 1200
pixels and higher in resolution. The computing platform may comprise of one or more
processors and can run their own choice of operating systems. This is the most common
configuration for most computing platforms.
xviii
Rendering source
Post Processing
Phase 2
Post Processing
Phase 1
Fig 1.2: The Continuum- an Amplified Collaboration Environment at EVL.
TeraVision Client
Post Processing
Phase n
Final output on a display
xix
Figure 4. Display from a single computer generating visualization
1.2.2 Tiled Displays
Tiled-displays are made up of the graphical output screens of many computers, tiled
together to give the effect of a singular large display. They are used for high-resolution
visualization applications with requirements that cannot be solved by present day display and
computing technologies.
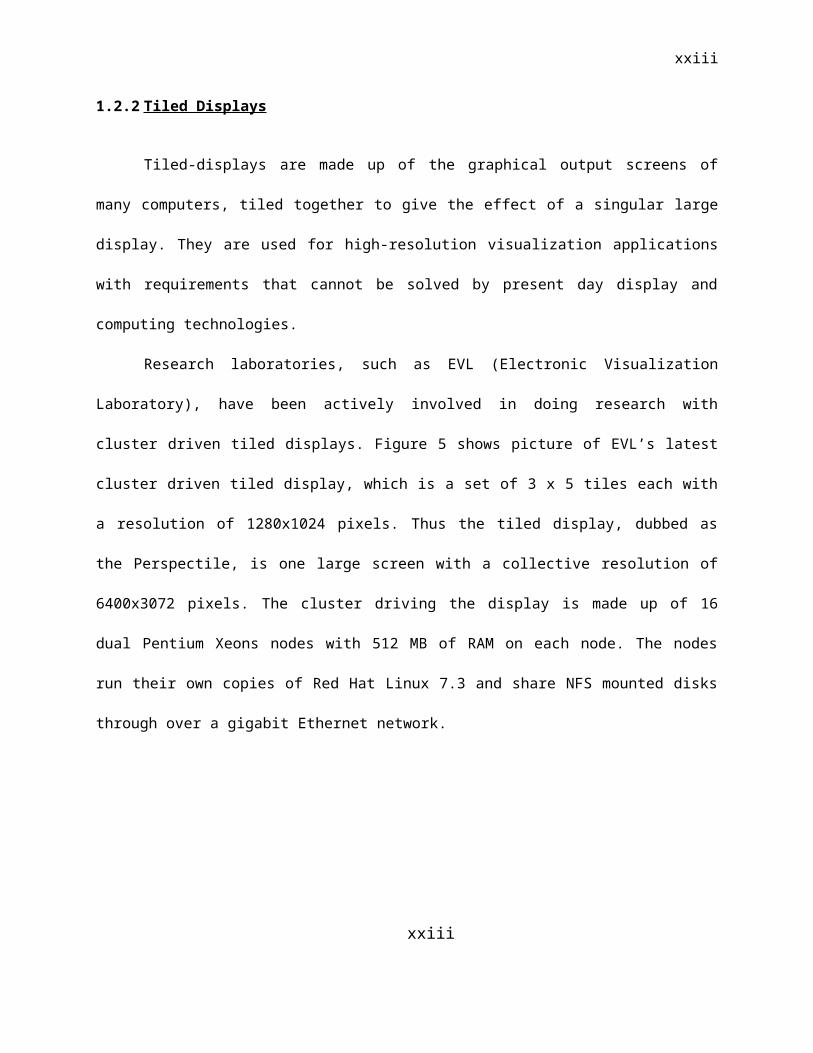
Research laboratories, such as EVL (Electronic Visualization Laboratory), have been
actively involved in doing research with cluster driven tiled displays. Figure 5 shows picture of
EVL’s latest cluster driven tiled display, which is a set of 3 x 5 tiles each with a resolution of
1280x1024 pixels. Thus the tiled display, dubbed as the Perspectile, is one large screen with a
collective resolution of 6400x3072 pixels. The cluster driving the display is made up of 16 dual
Pentium Xeons nodes with 512 MB of RAM on each node. The nodes run their own copies of
Red Hat Linux 7.3 and share NFS mounted disks through over a gigabit Ethernet network.
xix
xx
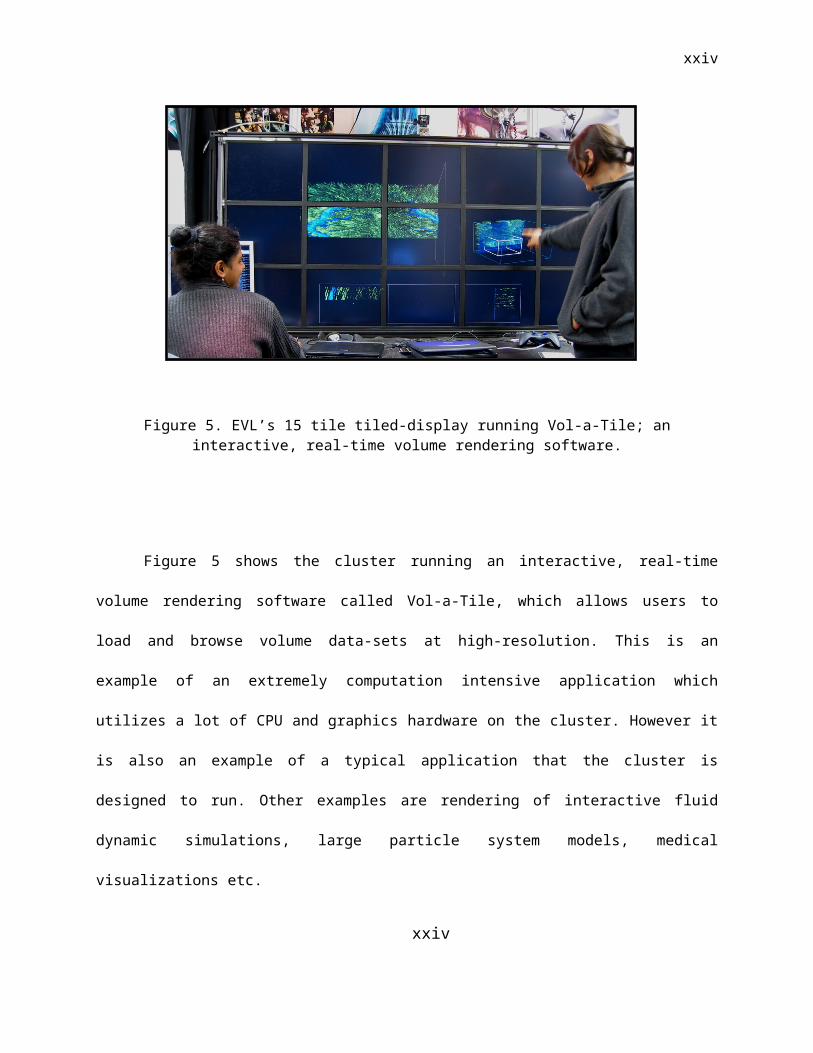
Figure 5. EVL’s 15 tile tiled-display running Vol-a-Tile; an interactive, real-time volume rendering software.
Figure 5 shows the cluster running an interactive, real-time volume rendering software
called Vol-a-Tile, which allows users to load and browse volume data-sets at high-resolution.
This is an example of an extremely computation intensive application which utilizes a lot of CPU
and graphics hardware on the cluster. However it is also an example of a typical application that
the cluster is designed to run. Other examples are rendering of interactive fluid dynamic
simulations, large particle system models, medical visualizations etc.
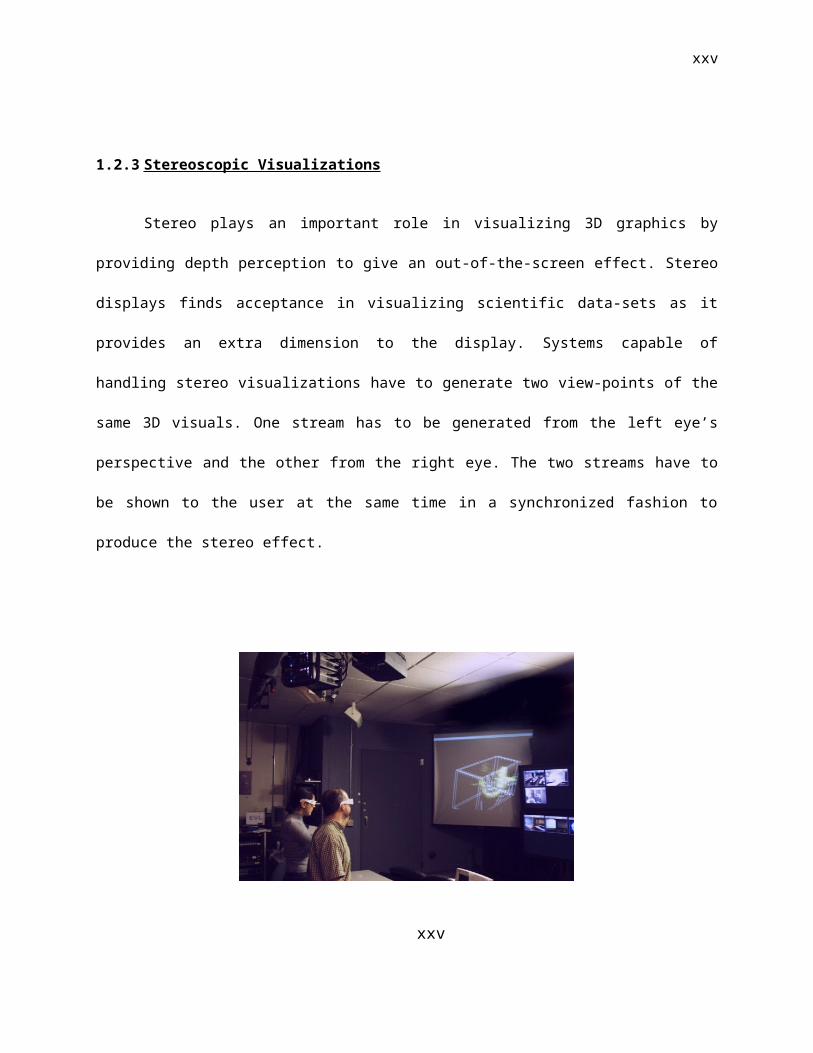
1.2.3 Stereoscopic Visualizations
Stereo plays an important role in visualizing 3D graphics by providing depth perception
to give an out-of-the-screen effect. Stereo displays finds acceptance in visualizing scientific
xx
xxi
data-sets as it provides an extra dimension to the display. Systems capable of handling stereo
visualizations have to generate two view-points of the same 3D visuals. One stream has to be
generated from the left eye’s perspective and the other from the right eye. The two streams
have to be shown to the user at the same time in a synchronized fashion to produce the stereo
effect.
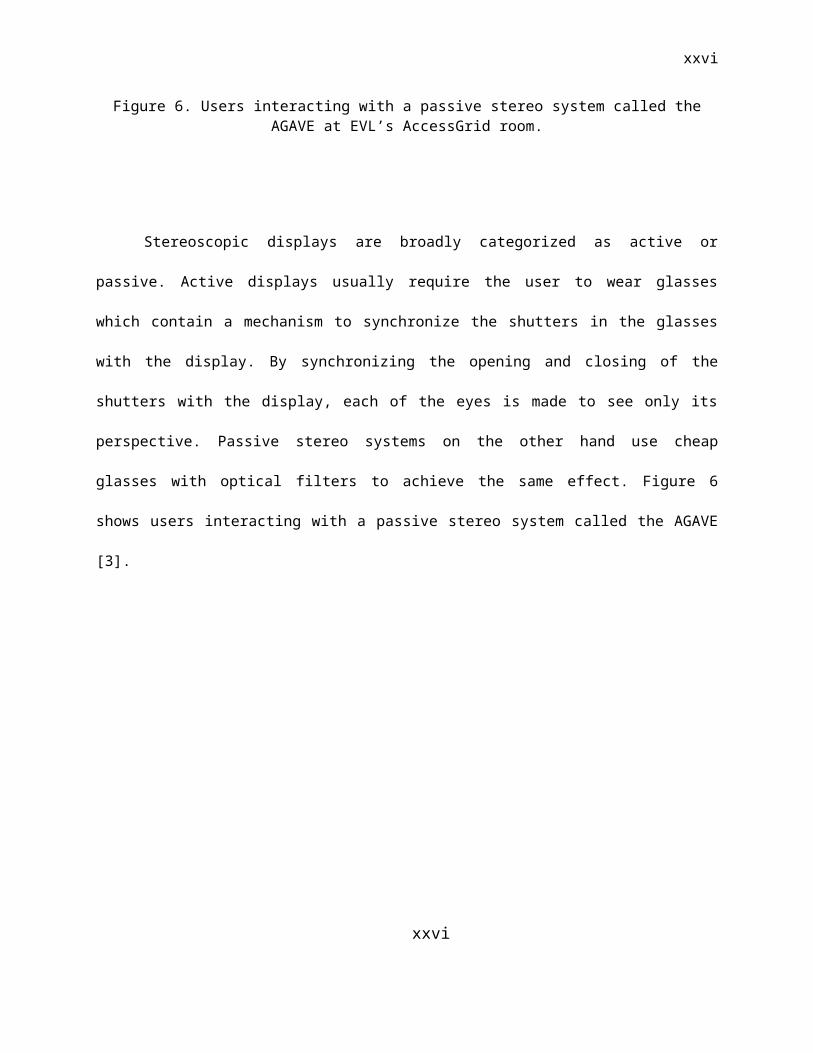
Figure 6. Users interacting with a passive stereo system called the AGAVE at EVL’s AccessGrid
room.
Stereoscopic displays are broadly categorized as active or passive. Active displays
usually require the user to wear glasses which contain a mechanism to synchronize the shutters
in the glasses with the display. By synchronizing the opening and closing of the shutters with the
display, each of the eyes is made to see only its perspective. Passive stereo systems on the
other hand use cheap glasses with optical filters to achieve the same effect. Figure 6 shows
users interacting with a passive stereo system called the AGAVE [3].
xxi
xxii
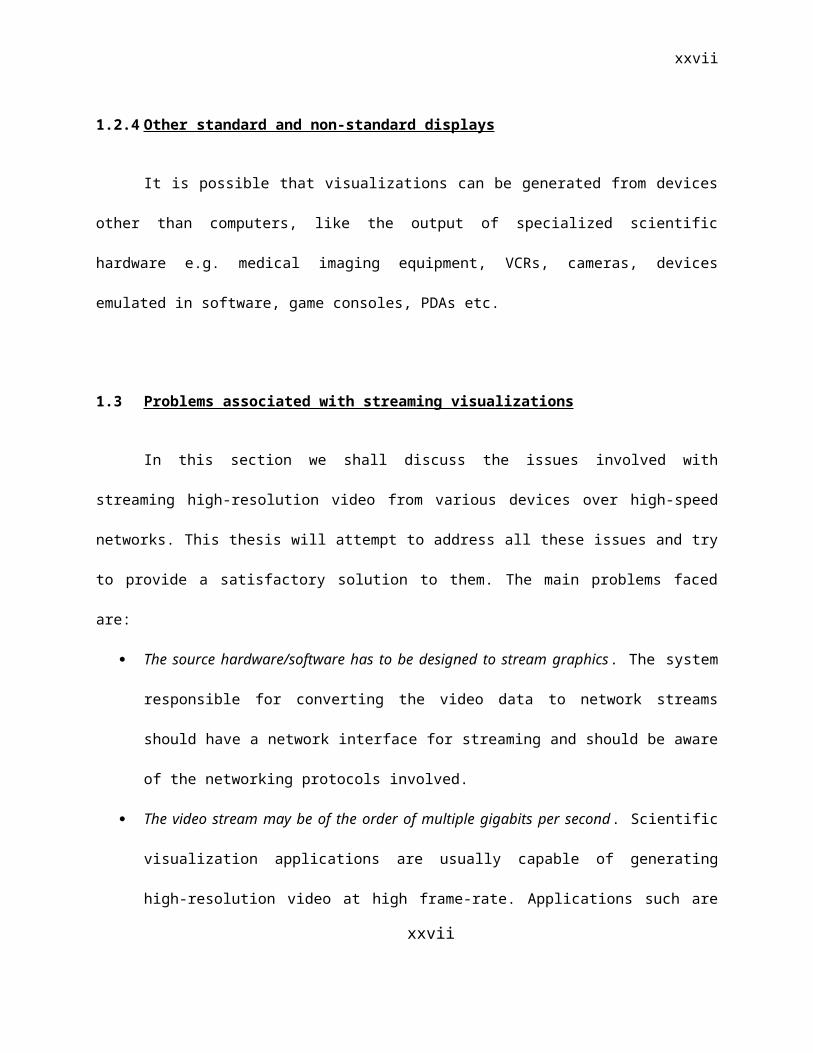
1.2.4 Other standard and non-standard displays
It is possible that visualizations can be generated from devices other than computers,
like the output of specialized scientific hardware e.g. medical imaging equipment, VCRs,
cameras, devices emulated in software, game consoles, PDAs etc.
1.3 Problems associated with streaming visualizations
In this section we shall discuss the issues involved with streaming high-resolution video
from various devices over high-speed networks. This thesis will attempt to address all these
issues and try to provide a satisfactory solution to them. The main problems faced are:
The source hardware/software has to be designed to stream graphics. The system
responsible for converting the video data to network streams should have a network
interface for streaming and should be aware of the networking protocols involved.
The video stream may be of the order of multiple gigabits per second. Scientific
visualization applications are usually capable of generating high-resolution video at high
frame-rate. Applications such are medical imaging, cannot withstand artifacts generated
from compression and so in many cases, the streams have to be transmitted without any
form of compression. This puts considerable load on the sending and receiving
machines to handle network traffic.
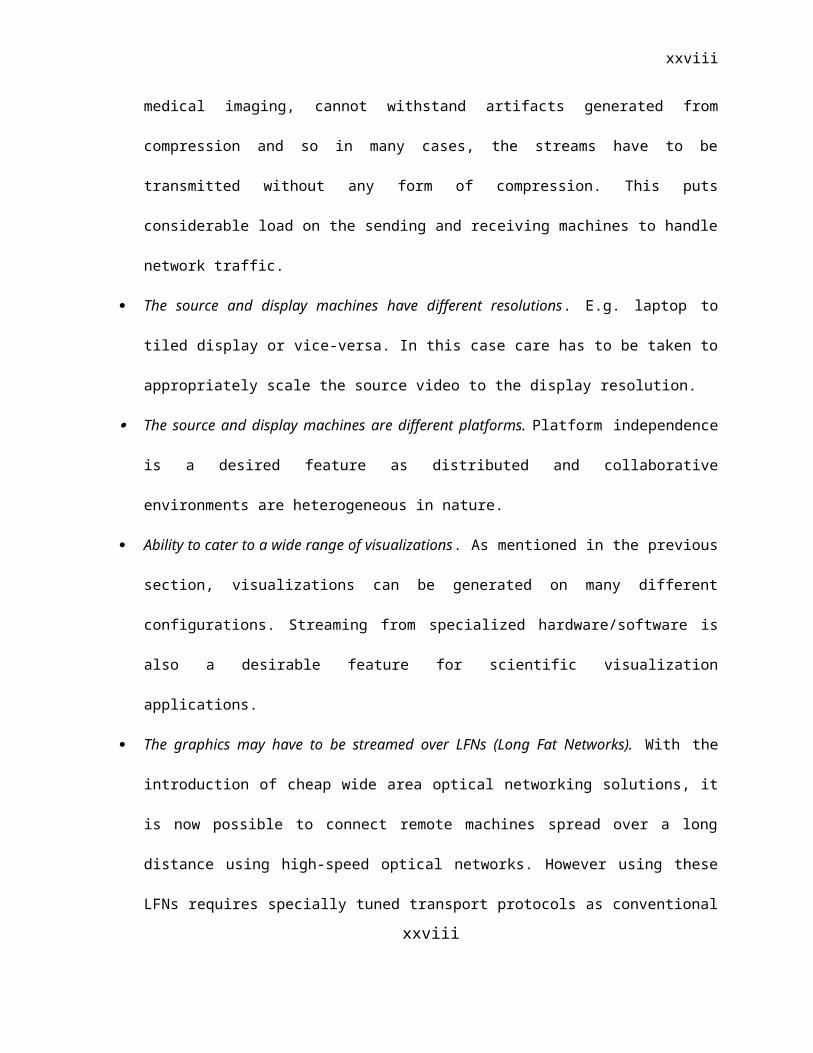
The source and display machines have different resolutions. E.g. laptop to tiled display
or vice-versa. In this case care has to be taken to appropriately scale the source video to
the display resolution.
xxii
xxiii
The source and display machines are different platforms. Platform independence is a
desired feature as distributed and collaborative environments are heterogeneous in
nature.
Ability to cater to a wide range of visualizations. As mentioned in the previous section,
visualizations can be generated on many different configurations. Streaming from
specialized hardware/software is also a desirable feature for scientific visualization
applications.
The graphics may have to be streamed over LFNs (Long Fat Networks). With the
introduction of cheap wide area optical networking solutions, it is now possible to
connect remote machines spread over a long distance using high-speed optical
networks. However using these LFNs requires specially tuned transport protocols as
conventional transport protocols were designed for slower networks. Application writers
are typically not aware of networking details to handle this aspect.
1.4 Need to distribute network streaming load
Consider the graphical output of a typical PC, which is at a resolution of 1024 x 768
pixels. Transmission of 30 such frames every second at a pixel depth of 24 bits per pixel
translates to 0.5 Gbps of data. Higher resolutions, as needed by scientific visualizations, such
as 1600 x 1200 pixels, would amount to 1.3 Gbps of data. Transmitting an entire tiled display
consisting of 15 tiles at 1280 x 1024 pixels each, means that we need to transmit approximately
14 Gbps of video data. Due to this nature and size of video data, we obviously need fast
networks and fast computers to take care of the streaming.
xxiii
xxiv
1.4.1 Fast Networks
Recent advancements with optical networks have produced commodity network cards
that can be plugged into computers to get a network link of up to 1 Gbps. Soon there will be 10
Gbps network cards available off the shelf too. Apart from the gigabit network cards, it is now
possible to route network traffic using optical switches. Optical switches allow setting up
dedicated light paths between machines to pipe gigabit traffic without any congestion. Thus we
now have an inexpensive and fast ‘bus’ between machines on a LAN, or even across the globe.
Therefore over the past few years, network bandwidth has ceased to be a problem for most
applications.
1.4.2 Fast Computers
Tests show that network streaming by itself is very resource hungry and we need fast
machines to stream data at high rates. A typical 32-bit Pentium Xeon machine @1.8 GHz,
utilizes 70% of its CPU to stream UDP data at 1 Gbps. Unfortunately typical scientific
visualization applications such as volume rendering of 3D data-sets, real-time interactive
simulations etc also require a lot of computing power themselves and most of the time the best
machines are not fast enough.
In such a scenario, where both visualization and streaming require a lot of resources, it
seems to be wiser to be able to distribute the load of network streaming to dedicated machines.
To make the situation worse, the network bandwidth has been growing at a rate faster than that
defined by Moore’s law for the computing power. In other words, in the coming future the best
computers will prove to be insufficient to utilize the networks optimally.
xxiv
xxv
1.5 TeraVision: Overview and applications
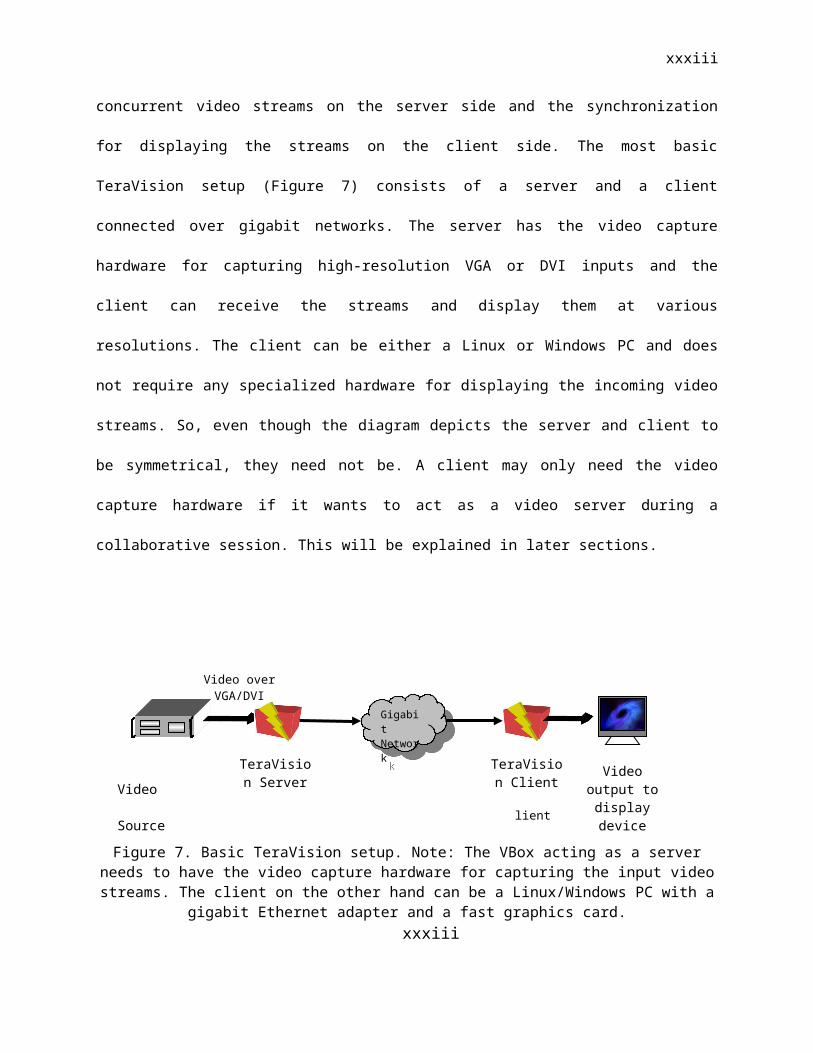
One can envision TeraVision as a hardware-assisted, network-enabled “PowerPoint”
projector for distributing and displaying scientific visualizations. A user who wants to give a
presentation on his/her laptop, or stream output from one of the nodes of a graphics cluster
simply plugs the VGA or DVI output of the source computer into the TeraVision Box (also called
VBox for short). The box captures the signal at its native resolution, digitizes it and broadcasts it
to other networked TeraVision boxes (see Figure 7). Though the capture card is one of the
preferred means of getting a video stream into the system, the video source can be any other
video device, like a USB/FireWire camera or software generating a visualization etc.
Furthermore, using the VBox one can also transmit an entire tiled-display provided there
are sufficient VBoxes at each end-point. Since the tile configuration and resolution can be
different at either ends, the TeraVision boxes provide the scaling mechanism to ‘fit’ the source
video to the destination display. Two VBoxes can be connected to the twin-heads of a
stereoscopic AGAVE [3] system to allow streaming of stereoscopic computer graphics. The
VBoxes take responsibility for the synchronization for simultaneous capture of concurrent video
streams on the server side and the synchronization for displaying the streams on the client side.
The most basic TeraVision setup (Figure 7) consists of a server and a client connected over
gigabit networks. The server has the video capture hardware for capturing high-resolution VGA
or DVI inputs and the client can receive the streams and display them at various resolutions.
The client can be either a Linux or Windows PC and does not require any specialized hardware
for displaying the incoming video streams. So, even though the diagram depicts the server and
client to be symmetrical, they need not be. A client may only need the video capture hardware if
it wants to act as a video server during a collaborative session. This will be explained in later
sections.
xxv
xxvi
Figure 7. Basic TeraVision setup. Note: The VBox acting as a server needs to have the video capture hardware for capturing the input video streams. The client on the other hand can be a
Linux/Windows PC with a gigabit Ethernet adapter and a fast graphics card.
Since the graphics output of the rendering source is typically transferred to a TeraVision
server using a video cable, the source machine is not loaded at all for doing the network
streaming. The TeraVision servers take on the load for compressing (if required) and streaming
the video data. Also the source can be any hardware platform running its choice of an operating
system or it can be a non-standard specialized platform. There needs to be no changes made to
the source software/hardware to perform the streaming.
The TeraVision system was designed to stream video over LFNs and contains network
protocol modules which are tuned for this purpose. The system has been designed to offer a
framework for adding new video sources, compression modules or network protocols to the
existing ones. Thus an attempt has been made to make the system as flexible as possible for a
wide range of scientific visualization and collaborative applications.
xxvi
Video over VGA/DVI
Video Source
GigabitNetwork
GigabitNetwork
C
lient
TeraVision Client
TeraVision Server
Video output to display
device
2. TERAVISION: RELATED WORK
In this chapter we will attempt to summarize the previous research and existing systems
that are related to this thesis. Since the system proposed in this thesis does not exactly fall in
any category per se, we will discuss categories which are related to the functionalities proposed
by TeraVision, viz. video/graphics streaming and display pushing. We can broadly categorize
the existing systems and solutions as either software or hardware based.
2.1 Software based solutions
2.1.1 Remote desktop access
Most modern operating systems offer some form of a remote desktop access, which
inherently also provides a means to push the computer’s display to remote machines. However
since these mechanisms are typically designed to let users access a machine remotely over
slow networks, they are designed to work with event based updates. In other words, these
systems are supposed to use minimal CPU and network bandwidth by transmitting the screens
only when a user interacts with it or when the software detects a change in the screen content.
These design constraints do not allow display pushing at the rate and quality of a video stream,
as needed by scientific visualization applications. Moreover, since a lot of 3D rendering
nowadays is handled directly by the graphics hardware, an OpenGL (or equivalent) rendering
surface cannot be available to another program. This makes it difficult for any program other
than the rendering program to capture the screens for pushing them to remote machines
One of the most popular cross platform solutions, originally developed by AT&T, is called
VNC (Virtual Network Computing). It is remote control software which allows users to view and
interact with one computer (the "server") using a simple program (the "viewer") on a remote
27
28
computer. It has many variants available today but as mentioned above, it’s based on event
based updates, which make it difficult to use it for streaming real-time video.
The other system that has received wide-spread acceptance is the Microsoft Remote
Desktop which comes built in with the Windows OS now. The software, like VNC, is designed to
minimize bandwidth utilization and resorts to techniques such as bitmap caching and clubbing
updates for multiple events, which proves to be bad for real-time streaming.
2.1.2 Scalable / distributed graphics systems
Considering the scientific visualization pipeline of Fig 1.2, these systems attempt to
stream the output of the computing phase to remote machines. Thus instead of directly
transmitting the video pixels, the machines transmit 3D primitives representing the final
visualization, to remote machines for rendering. The receiving machines are then responsible
for rendering the pixels from the 3D primitives. These systems can scale across distributed and
parallel architectures to provide a high throughput graphics pipeline for monolithic or tiled-
displays.
2.1.2.1 AURA
AURA presents a C++ API that extends the capabilities in low-level graphics libraries like
OpenGL or Direct3D with scene graph management paradigms and a virtual reality
programming framework. It is developed by the Vrije University, The Netherlands [10]. It
supports immersive virtual environments and also large tiled displays. Current implementations
of AURA work on various platforms like SGI IRIX, Linux and Windows 2000.
28
29
The software allows the rendering of a 3D scene graph to be distributed to a tiled display
using the high-speed interconnects of a cluster. The system is relevant to this thesis as in one of
its operating modes, it attempts to stream graphics information to the various nodes driving a
tiled-displays. However the approach uses streaming of polygon information, rather than video,
to the nodes. Each participating node then proceeds to render its frustum or viewpoint of the
scene graph [10]. This is a very effective way for distributing the rendering load to different
nodes, but increases the load on the machine responsible for streaming the graphics primitives.
Since the serving nodes are not designed to be scalable, there is an upper limit on the amount
of graphics information that can served and processed. Moreover the 3D visualization has to be
written with the AURA library to take advantage of its features.
Aura employs TCP by default, to stream data but it has also been tested with RBUDP to
stream information over LFNs. Thus it is capable of streaming graphics information to remote
clusters for rendering.
2.1.2.2 Chromium/WireGL
Chromium is a framework for scalable real-time rendering on clusters of workstations. It
is based on the Stanford WireGL project [11][9]. It can be used on platforms like Windows, SGI
IRIX and Linux.
Designed to work with many configurations, it is also capable of streaming OpenGL
primitives to nodes of a tiled-display. It looks at the OpenGL commands being outputted from a
program as a stream and provides ‘stream filters’ to manipulate them. The stream filters can
distribute the polygon level information to the rendering nodes as required and then, like Aura,
provide a synchronization mechanism to time the graphics frame-buffer refreshes across the
nodes. It also provides the notion of plugging in modules for graphics pre-processing, in which
29
30
instead of sending out the primitives directly to the screen, then are sent to other processing
modules. In this way, a pipeline can be formed across many machines to do computationally
heavy rendering.
Like TeraVision, Chromium also provides the notion of multiple servers and clients,
which enables it to scale effectively for large data-sets. The difference lies in the fact that all the
graphics pre-processing is done before the primitives are transmitted to the rendering machines.
So the load of streaming the graphics still lies on the machines which are also doing the
computation. As we have introduced in the previous chapter, the TeraVision pipeline works with
video, resulting from a graphics device, and all the processing in the pipeline thus happens at
the pixel level.
2.1.3 Media streaming software
There are too many solutions available for streaming video from files, cameras etc over
the web to be enumerated here. Though some of them are capable of streaming video at high
resolution, it is safe to say that they are not flexible enough to be able to be used for scientific
visualizations or for handling complex display systems such as tiled or stereoscopic displays.
Quite a lot of these systems also have the restriction of being able to run the video source only
from very specific platforms.
2.2 Hardware based solutions
Sandia National Labs has a patented hardware approach, which they call as the ‘Be
There Now’ Hardware, which is very similar to the TeraVision approach for streaming video. The
solution is a embedded system, running Linux on re-programmable logic arrays which provides
30
31
dedicated hardware for video streaming. Like TeraVision, it accepts the VGA output of a
computing device and digitizes it, compresses it and streams it on gigabit networks. It uses an
MPEG encoder/decoder on a chip to provide real-time data compression. It has also been
tested over LFNs and provides excellent video quality and frame rate.
However because of the hardware approach, the system is not very flexible. It is not
apparently easy to integrate new video sources, compression modules or network protocols in
the firmware. The system is also not designed to be scalable and in its present configuration, it
can only transmit a one-to-one video stream. In other words, it is not designed to handle
streaming of more complex video systems, such as stereoscopic displays or tiled-displays.
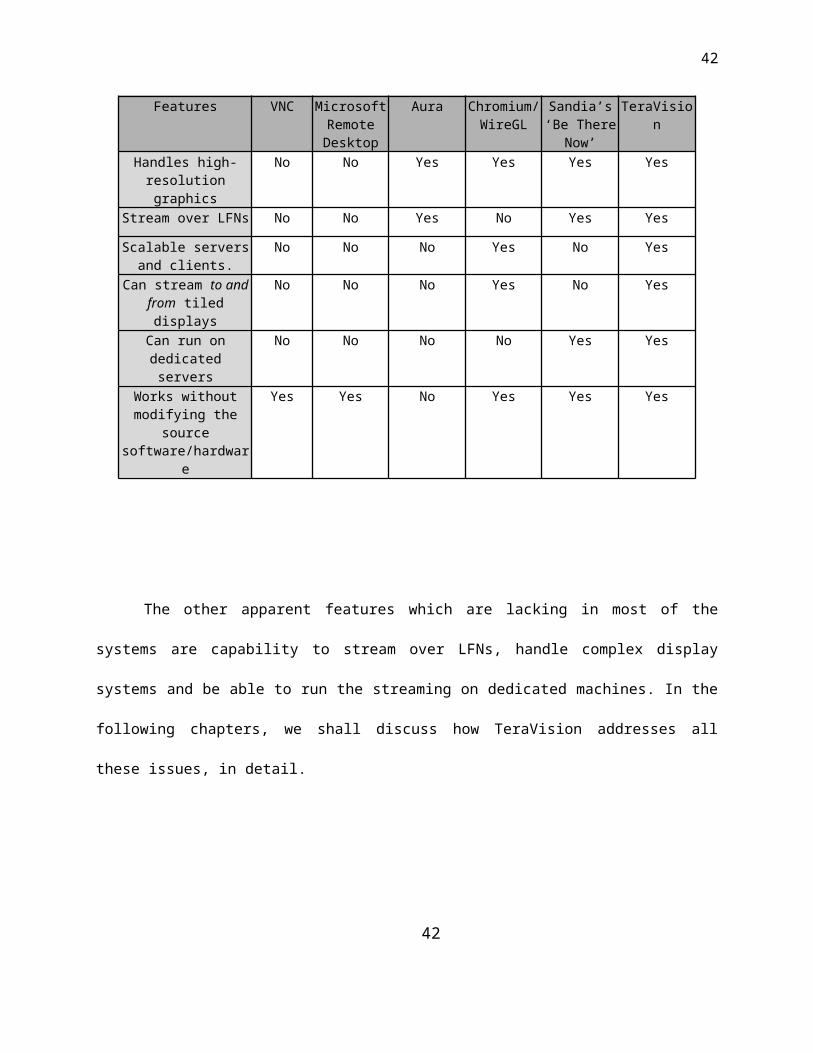
The following Table 1 compares TeraVision with the existing systems. From the table we
can see that most systems were not designed to be scalable. Scalability is a feature of a
system, which allows it to increase its capability by adding more such similar systems. In other
words, if a TeraVision box is capable of handling video at X bits per second and we want to
transmit nX bits per second, we should be able to use n TeraVision boxes to take care of the
load.
TABLE I
COMPARISION CHART OF EXISTING SYSTEMS AND TERAVISION
Features VNC MicrosoftRemote Desktop
Aura Chromium/WireGL
Sandia’s ‘Be There Now’
TeraVision
Handles high-resolution graphics
No No Yes Yes Yes Yes
Stream over LFNs No No Yes No Yes Yes
Scalable servers and clients.
No No No Yes No Yes
Can stream to and from tiled displays
No No No Yes No Yes
31
32
Can run on dedicated servers
No No No No Yes Yes
Works without modifying the source software/hardware
Yes Yes No Yes Yes Yes
The other apparent features which are lacking in most of the systems are capability to
stream over LFNs, handle complex display systems and be able to run the streaming on
dedicated machines. In the following chapters, we shall discuss how TeraVision addresses all
these issues, in detail.
32
3. TERAVISION: CONCEPTS, SYSTEM DESIGN AND IMPLEMENTATION
3.1 Concepts
This section attempts to introduce the pertinent concepts that the reader needs to be
familiar with before proceeding to the advanced sections such as System Design and
Implementation.
3.1.1 TeraVision Server
The TeraVision server is the machine (or set of machines) which provide the video
streams. The direction of video is always from server to client. The server process (or
processes) can be run on dedicated machines which have some video capture hardware to take
in the video from the source machines. But if there is a means to feed the video from the source
to the TeraVision server process through software mechanisms, such as IPCs, we can run the
servers on the same machine as the source process providing the video. One server process
may be serving many clients at the same time and all the streams being sent out will be
synchronized with each other.
3.1.2 TeraVision Client
The client does not require any specialized hardware as long as it has a network
interface fast enough to handle the desired video bandwidth. The client processes are
responsible for displaying the incoming video streams on the machine’s graphics output. One
client may receive its video streams from one or more servers. This is especially true in the case
of tiled displays, where the source tiled display is of different resolution/tiles than the client tiled
33
34
display. All the component video streams that make up the display are synchronized internally
before being shown on the display.
3.1.3 TeraVision Master
Each TeraVision server or client process either operates in the Master or the Slave
mode. A TeraVision server side would consist of one master and multiple slaves. Since there
can be any number of processes that make up the server (or client) side, there has to be one
point of control for all the processes and the master process serves that purpose. The master
process is responsible for synchronizing all slave processes registered with it. The user
interacts with the master process but the commands are broadcasted to all the slaves. Most of
the control plane interaction that happens between the server and the client happens between
the master server and the master client. And as one of the important roles, the master is also
the one that sends the synchronization messages to all slaves. The synchronization messages
are very important to time the capture (on the servers) and the display refreshes (on the clients)
across machines.
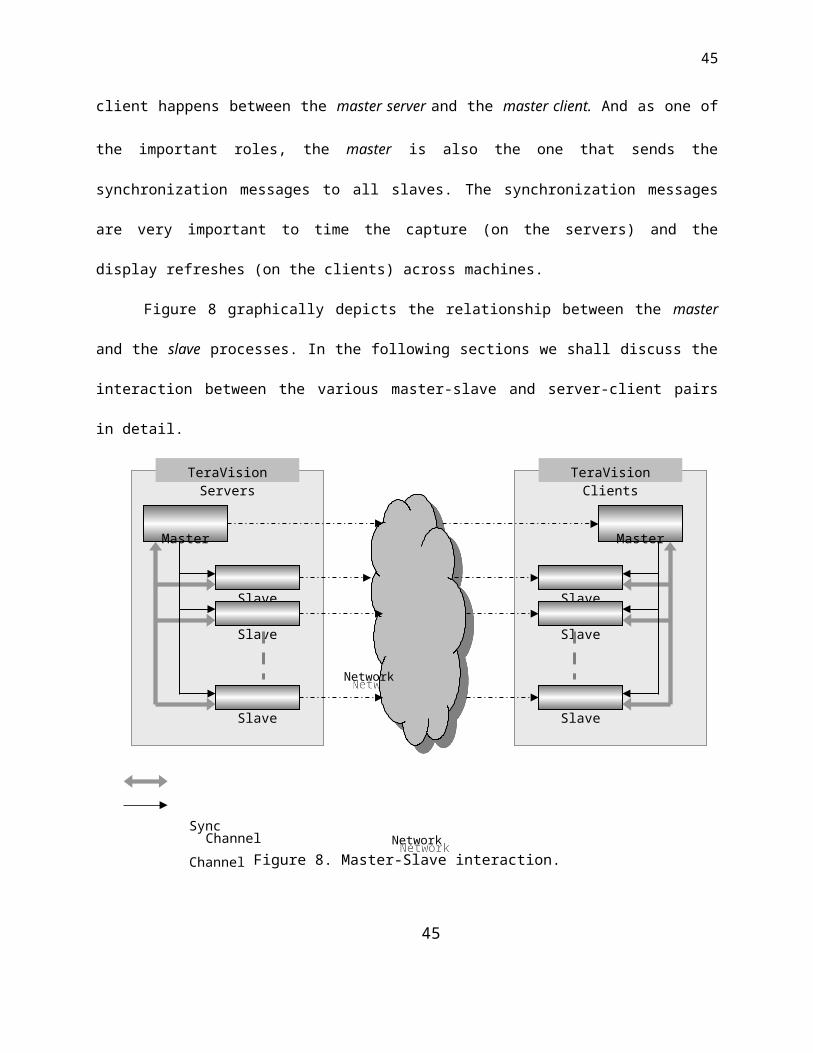
Figure 8 graphically depicts the relationship between the master and the slave
processes. In the following sections we shall discuss the interaction between the various
master-slave and server-client pairs in detail.
34
35
Figure 8. Master-Slave interaction.
3.1.4 TeraVision Slave
The slave processes cannot run by themselves. They are spawned by a master and
after coming up, they need to register with a master process in order to operate. They depend
on the master for providing the sync messages, user interaction messages and control plane
information.
35
Network
Network
Network
Network
TeraVision Servers
Master
Slave
Slave
Slave
Control
ChannelSync
Channel
TeraVision Clients
Master
Slave
Slave
Slave
36
3.1.5 Video Source
This can be an actual physical device or a software emulation of a video source. Each
server needs to have at least one video source in order to operate. If the server side consists of
many TeraVision server processes, the video sources should ideally be capable of
synchronizing their video streams.
3.1.6 Server or client Montages
Since the number of tiles on the server and client side need not be the same, many
possible cases arise where a client might receive its video in parts from multiple servers or a
server might serve parts of its video to multiple clients. These rectangular ‘parts’ of the video are
termed as montages.
3.1.7 TeraVision processes
Since the server (or client) side of TeraVision may contain many machines working
together to source (or sink) video data, multiple copies of the TeraVision software are run on
each of the participating machines. These copies or processes need to be synchronized and
control information has to be passed between them for their proper operation.
3.2 Possible configurations
36
37
The most basic configuration of a TeraVision system consists of one server and one
client as shown in Figure 7. The setup has a single source machine connected to a TeraVision
server which streams the video to a single client.
However, as discussed before, it is possible to operate more than one TeraVision box at
one time and synchronize their operations for handling complex display systems. When more
than one TeraVision box is being used, one of the boxes operates as a master and the rest as
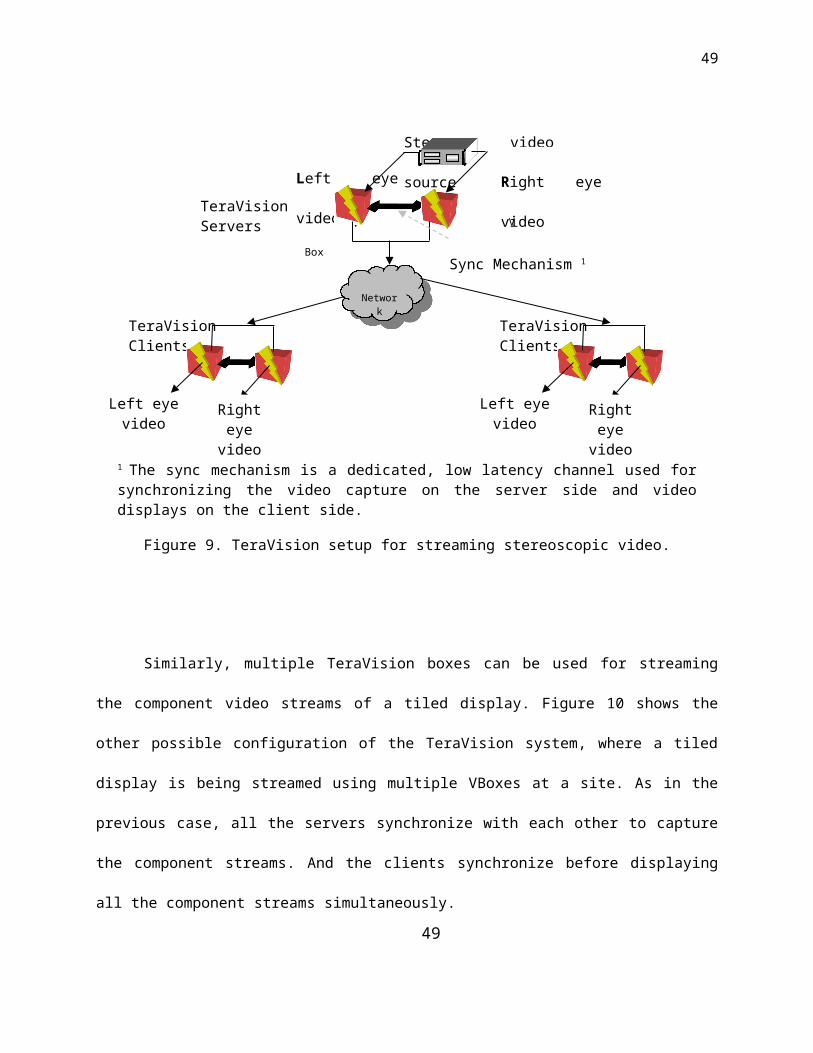
slaves. Figure 9 depicts a situation where two TeraVision servers are used for streaming
stereoscopic video to multiple client sites. The two streams (Left and Right eye video) are
synchronized during capture on the servers and then again on the two clients at every site
before the display.
37
Left eye video
TeraVision Clients
Right eye video
V
Box
V
Box
TeraVision Servers
Sync Mechanism 1
Left eye video
Stereo video source
Right eye video
Network
Network
Left eye video
TeraVision Clients
Right eye video
1 The sync mechanism is a dedicated, low latency channel used for synchronizing the video capture on the server side and video displays on the client side.
38
Figure 9. TeraVision setup for streaming stereoscopic video.
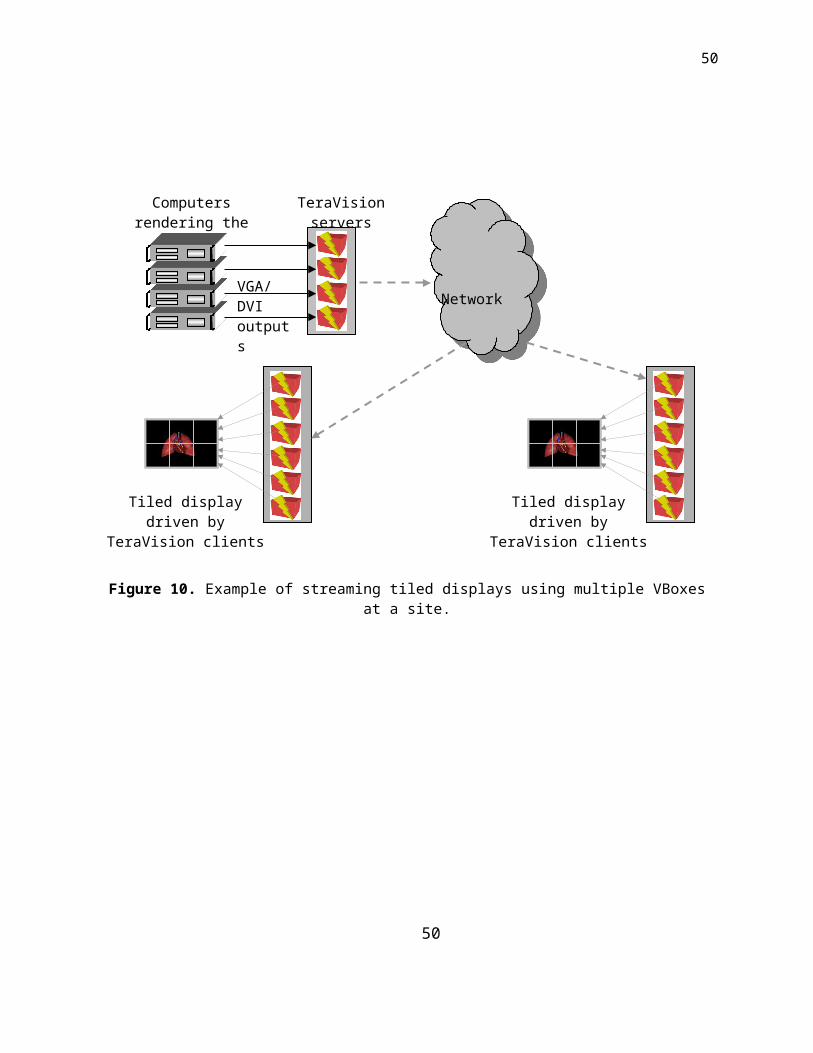
Similarly, multiple TeraVision boxes can be used for streaming the component video
streams of a tiled display. Figure 10 shows the other possible configuration of the TeraVision
system, where a tiled display is being streamed using multiple VBoxes at a site. As in the
previous case, all the servers synchronize with each other to capture the component streams.
And the clients synchronize before displaying all the component streams simultaneously.
Figure 10. Example of streaming tiled displays using multiple VBoxes at a site.
38
Computers rendering the graphics
TeraVision servers
NetworkNetworkVGA/DVI outputs
Tiled display driven by TeraVision clients
Tiled display driven by TeraVision clients
39
3.3 System design
One of the main goals of the TeraVision system design was to make the architecture as
flexible as possible in order to facilitate incorporation of new video sources, compression
algorithms and networking protocols easily in the system. This would thus provide a framework
for future expansion and experiments and allow for improving performance and adding new
features. It would also allow TeraVision to be adapted to a wide spectrum of scenarios. Thus
one of the first steps was to identify the sub-systems which would be frequently liable to
modifications with change in operating requirements. There are three such sub-systems, which
satisfy such a design need and they are:
The video source modules
Compression modules
Network protocols modules
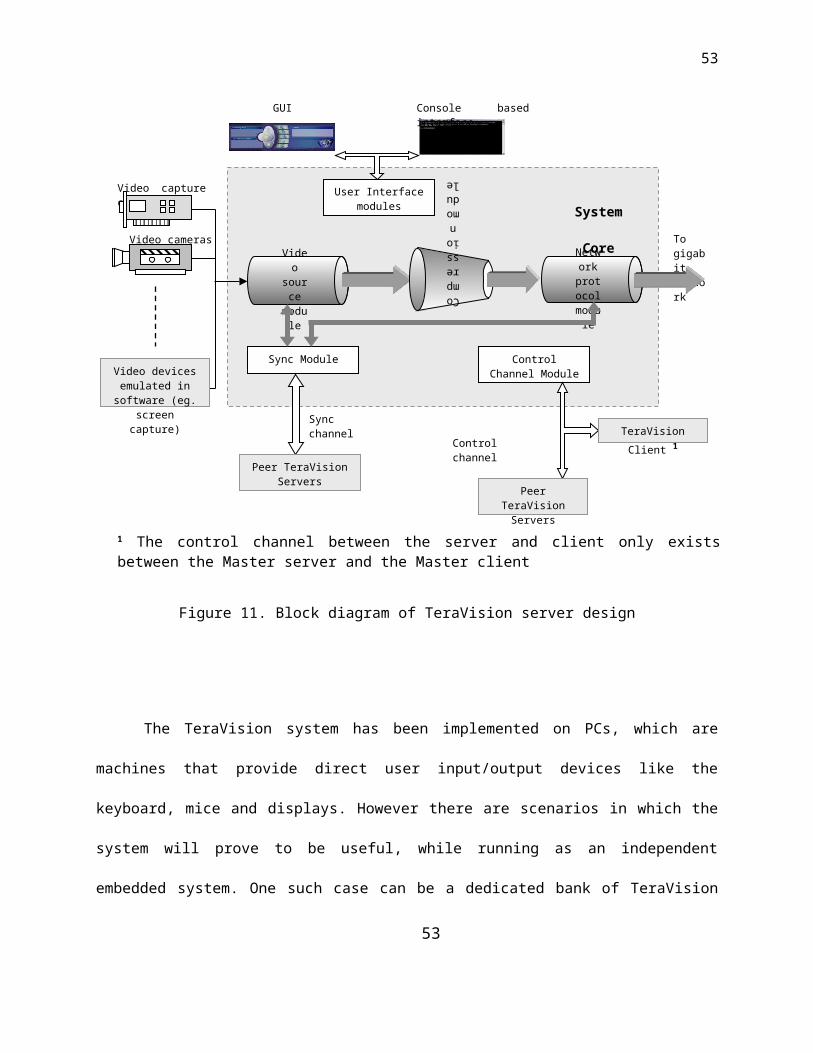
Figure 11 and Figure 12 show the modular block diagram of the system while behaving
as a server and client respectively. The three main blocks of the system, as enumerated above,
are also the most computation and I/O intensive parts and are arranged in a pipeline fashion,
with the output of one being fed as the input of the next. One of the main considerations for the
pipelined design was that these three blocks tend to have a throughput of their own, which are
decided by factors such as system load, network congestion, type of video input etc. and thus
we would like them to operate independently of each other. Each block will try to process its
input as fast as the underlying OS/hardware will allow it to. A multithreaded approach allows the
software to take advantage of multiple CPUs at the hardware level. The implementation of the
software also tries to ensure minimal memory copies and utilize hardware supported features
39
40
such as MMX to enhance performance. We shall delve into each of these sub-systems in detail
in the following sections.
The system is currently available for the Linux and Windows platforms on the Intel IA-32
architecture and plans are underway to port it to the IA-64 architecture.
Figure 11. Block diagram of TeraVision server design
40
To gigabit network
Control channel
Sync channel
Video cameras
Video capture cards
Video
source
module
Networ
k protocol module
Control Channel Module
Sync Module
User Interface modules
Video devices emulated in
software (eg. screen capture)
Peer TeraVision Servers
TeraVision
Client 1
Peer TeraVision Servers
GUI Console based interface
1 The control channel between the server and client only exists between the Master server and the Master client
System
Core
Compression
module
41
The TeraVision system has been implemented on PCs, which are machines that provide
direct user input/output devices like the keyboard, mice and displays. However there are
scenarios in which the system will prove to be useful, while running as an independent
embedded system. One such case can be a dedicated bank of TeraVision servers which are
capturing the rendered output of a cluster and streaming them to a remote tiled display. Such a
setup does not require a direct user interface per se, since there is no need for users to interact
with the machines. In such a case, a remote interface is required to configure and control the
TeraVision processes. The system provides a GUI and a console based interface for this
purpose, both of which can be run from a remote machine and can communicate with the main
TeraVision processes over sockets.
41
42
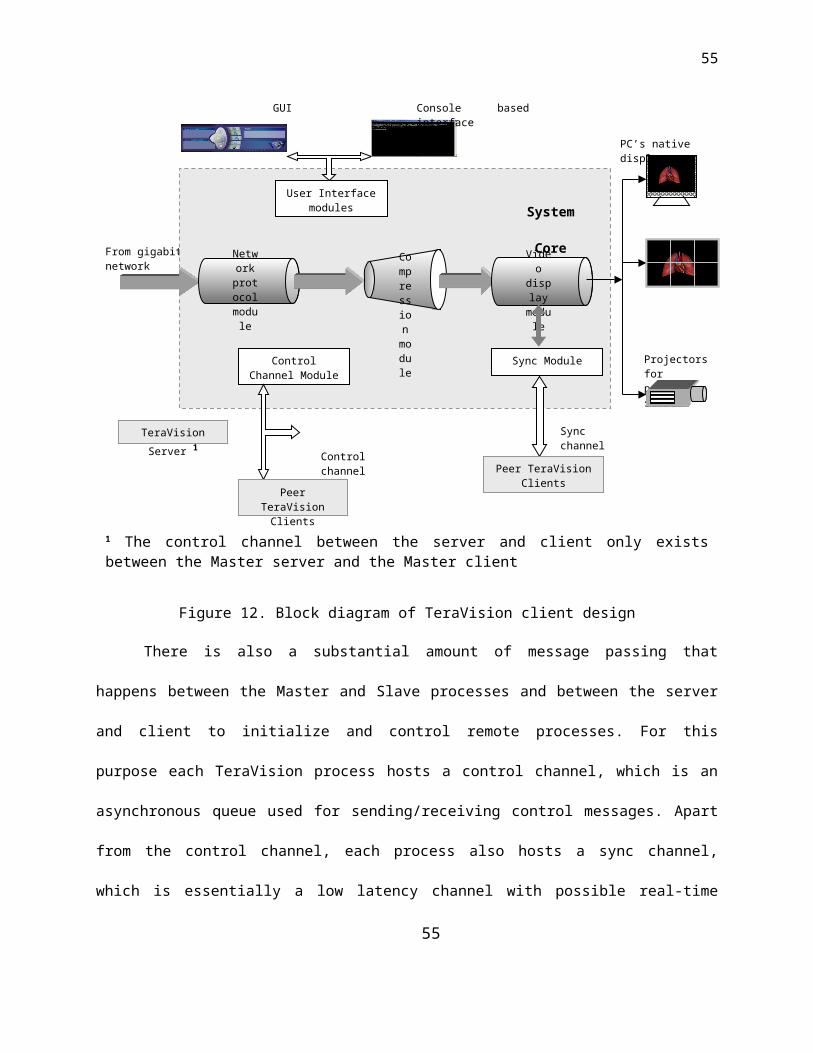
Figure 12. Block diagram of TeraVision client design
There is also a substantial amount of message passing that happens between the
Master and Slave processes and between the server and client to initialize and control remote
processes. For this purpose each TeraVision process hosts a control channel, which is an
asynchronous queue used for sending/receiving control messages. Apart from the control
channel, each process also hosts a sync channel, which is essentially a low latency channel
with possible real-time priority, to allow remote processes to closely synchronize with each
other. The system core is the ‘glue’ code which is responsible for handling the interaction
between various modules.
42
From gigabit network
Control channel
Control Channel Module
User Interface modules
TeraVision
Server 1
Peer TeraVision Clients
Sync Module
Peer TeraVision Clients
Networ
k protocol module
GUI Console based interface
Sync channel
Compression
module
PC’s native display
Projectors for passive stereo
Video
display
module
System
Core
1 The control channel between the server and client only exists between the Master server and the Master client
43
3.4 System modules and their design considerations
In this section we shall go over the various system modules and talk about the specific
considerations which were given for their design. In the cases of the important modules, we
shall discuss the implementation details to the level of the class diagrams. This section also
provides basic guidelines for developers interested in building loadable modules for TeraVision.
The reader is also encouraged to go through the bibliography to familiarize himself/herself with
the terminology before going ahead with the following sections.
3.4.1 User Interface Module:
As all user interfaces have to, the TeraVision system also has to provide an interface
which is intuitive and easy to use. But apart from this, the UI has the following special
requirements.
Remote management: Since the system in its very nature is distributed, it is important to
be able to control it remotely. There are also scenarios in which the TeraVision servers
or clients might run as embedded systems, which by themselves do not have a direct
user input/ouput device attached to it.
Single point control: The TeraVision system at any given time may comprise of many
processes running across various systems. There is a need to control all the processes
from a single interface.
Emergency back channel: This is a special requirement of systems like TeraVision,
where the computer running the processes might stream data over the network, which is
close to the network limit. In such scenarios, there is always the possibility that network
43
44
switches and routers will get inundated with too much traffic, making it difficult to do
remote management with a GUI. Thus the UI needs to provide a backchannel which can
be used for passing minimal commands to the TeraVision processes to control them.
Plug-in specific GUI screens: Since the design uses a plug-in approach to adding new
compression modules, video sources or network protocols, it is not possible to know
about the configuration screens for these plug-ins. Thus the system should have a
provision for ‘adding’ new configuration screens as required, without modifying any of
the main UI code. For e.g. a new compression module added to the system may provide
a configuration screen to modify the quality of compression using hardware acceleration.
The loadable modules have a generic member function in the abstract class, which they
are derived from. This function, advSettings(), is present in all the modules and is
responsible for providing the configuration screen for the module. The idea is that the
user can chose a module that he/she wishes to use from the main TeraVision GUI and
then simply click on a generic configure button to bring up the configuration screen
specific to the module.
Currently the TeraVision system provides a GUI, built using FLTK (Fast Light Tool Kit)
and a command console through a telnet session. Both the options require the UI to connect to
the TeraVision process over sockets and pass messages to control the process. The messages
passed are queued in a FIFO on the receiving side. The UI servers are essentially threads
which run in the background and pickup the messages from the network (TCP) sockets. The
messages are then put in a queue and the TeraVision processes polls the queue at logical
intervals to check for user interaction. The following Figure 13 further depicts the interaction of
the UI modules with the master process. Typically all the UI messages are broadcasted to the
44
45
peer slave processes, registered with the master. This provides the user a single point of control
for all the processes.
Right now the console provides control through minimal commands and provides the
emergency backchannel for controlling the application. The GUI uses configuration files for
storing the system wide settings and module specific configurations. These files are then read
by the main TeraVision process at run-time.
Figure 13. Interaction between the UI modules and the TeraVision process.
Figure 14 shows a snapshot of the TeraVision GUI and indicates the function of various
widgets on the screen. The role of some of the widgets is different in the server and the client
mode. We shall briefly consider the main widgets and talk about their roles.
45
Socket based connection
UI
Server
TeraVision Master
Process
FIFO containing UI messages
Command console
UI Clients
GUI
UI messages are broadcasted to all the slave processes
46
Play button: While operating as the server, the play button:
o Spawns the master TeraVision process.
o The master process then in turn spawns all the slaves.
o An ‘initproc’ UI message is broadcasted, which initializes the video source and
compression modules in all the processes and then brings up the network
protocol modules in a server mode.
o A ‘play’ UI message is then broadcasted to start the video source. The processes
are then ready to accept requests from clients.
However while operating as a client, the play button:
o spawns the master TeraVision process.
o The master process then in turn spawns all the slaves.
o An ‘initproc’ UI message is broadcasted, which initializes the compression
modules and then the network protocol modules in a client mode. Next, the
display module is initialized. The clients then connect to the server(s) and wait.
o A ‘play’ message is broadcasted to all the processes which cause the clients to
start receiving and displaying the video streams from the network.
Pause button: The pause button does not stop the processes, but merely interrupts the
video streams. The system can be resumed by sending the ‘play’ message again. While
operating as a server, when a TeraVision process receives a ‘pause’ message, it
requests the video source to temporarily cease the video frames to be fed to the
common circular buffers. This automatically causes the network modules to pause too,
since they do not have any fresh frames to stream.
46
47
However while operating as a client, the ‘pause’ message causes the network
modules to temporarily cease receiving any data from the network. Thus the display
module also freezes.
Stop button: The stop button essentially sends out a ‘stop’ UI message to the TeraVision
processes. The various modules are requested to stop and to get ready for a clean-up.
Soon after then, the modules will be offloaded and the process will be shutdown.
Server IP and Port input boxes: These are only pertinent when the TeraVision process is
operating in the client mode. The users can enter the IP and port information of the
master server process here.
Figure 14. TeraVision GUI main screen.
47
Play
buttonStop
button
Pause
button
Operating
mode
Server IP and
Port Network protocol
configuration
Video module
configuration
Status
box
System
configurationFloor Control Lock 1
Performance
monitoring 11 Currently not implemented
48
Figure 15 shows the UI screen for the system configuration, from where the
configuration screens for specific modules can be displayed. Once a module is selected through
the drop-down box, the GUI client program loads the module and when the user hits the
‘Configure’ button, it calls the advSettings() function, inside the module to call its configuration
screen.
Figure 15. Configuring individual modules through the system configuration screen
3.4.2 Control Channel
The various TeraVision processes participating in the system need to pass a lot of
messages between themselves for initialization and control at all times. The control channel is
an asynchronous message-passing channel that is hosted by all the TeraVision processes.
Though the channel has been implemented over TCP sockets, an instance of the channel does
not have to maintain a connection with any other instance. The message sender can just call a
48
System configuration
screen
Module configuration
screen
49
send() function with the IP and the port of the receiving machine as the parameters. The
channel then attempts to connect to the remote instance momentarily, passes the message and
breaks off the connection. The messages passed are queued at the receiving side by a server
thread and can be extracted either on the basis of type/priority or if the communicating
endpoints are multiple pairs of threads, the implementation provides a notion of virtual channels
that the multiple communicating pairs can use to pass messages to each other.
As mentioned above, the receiving side of the channel is a server thread, which
continuously listens for clients and services them in a sequential fashion. Thus only one control
channel client is allowed to connect at one time. After the message has been passed between
the client and server, the connection is broken, allowing the server to service the next client.
This design allows a many-to-many message passing mechanism between any numbers
of processes without having to maintain any persistent connections between the processes. The
messages passed are of fixed size since it’s easier to manage them with fixed size buffers.
3.4.3 Sync Channel
The sync channel is a high-priority, low-latency channel used by peer server (or client)
processes to closely synchronize the video streams across processes running on different
machines. This is one of the more important components as it decides the performance of the
system to a large extent. Since a TeraVision server (or client) may comprise of many processes
with each process sending or receiving many video streams, there is a need to synchronize
these processes in real-time, so that the video at the display end does not appear to be non-
uniform.
49
50
The sync channel operates in two possible modes, viz. master and slave. The master
TeraVision process operates the sync channel in the master mode and the slave TeraVision
operates them in the slave mode. Each sync client is responsible for connecting to one sync
master during initialization and the sync master is responsible for sending the sync ‘pulse’ (or
sync message) to all the sync clients registered with it.
The processes need to be synchronized both at the server and client side. On the server
side, all the TeraVision server processes might need to synchronize at the following two levels:
At the video source level: Since the video sources providing the video frames can be
independent software/hardware components, running at their own rates, there is often a
need to start/stop the devices at precisely the same time so that the component video
sub-streams are fed into the system properly.
At the network level: Synchronizing the video sources, ensures that we can look into the
common circular buffers across machines and say which video frames correspond to
each other. However once the frames are transmitted on the network, there is no
guarantee for the order or rate at which they would reach the clients. Thus just before
the transmission, the TeraVision servers synchronize one more time and this time the
master server sends across a frame number with the sync pulse that all clients ( and the
master) use for stamping the next transmitted video frame with. This step happens for
each video frame that is transmitted per stream so that when the frames reach the
clients, all the client processes know which frames in their respective buffers correspond
to each other.
But at the client side, we do not need to synchronize at the network level in order to
receive the frames. So the network threads of the individual TeraVision clients are free to
receive video frames at their own rates. However synchronization is required before displaying
50
51
the frames. Thus the sync pulse is sent out by the master process before displaying every
frame. The slaves listen for this message, which also contains the frame number to be
displayed. Thus on receiving the message, the slaves load up the appropriate frame from their
common buffers and display them on the graphics output.
The sync channel has the following requirements which we will discuss individually with
some of the implementation details:
Low-Latency: This is one of the primary requirements of the sync channel. The sync
pulse has to be sent from the master to all the slave processes with minimal delay to get
the best results. Since the sync channel is implemented over TCP/IP sockets, there are
buffers and system/driver queues which can delay the transmission of the sync
message. In the implementation of the sync channel, one definite way to ensure good
latency between processes is to switch off the Nagle’s algorithm in the TCP stack. This
can usually be done by setting the TCP_NO_DELAY option at the TCP socket level.
Nagle’s algorithm, as explained in RFC 896 [7], is used to automatically concatenate a
number of small buffer messages; this process (called nagling) increases the efficiency
of a network application system by decreasing the number of packets that must be sent.
High-Priority: Disabling Nagle’s algorithm however does not yet guarantee any upper
bound on the amount of time needed to send the sync message across. Since the sync
channel operates on TCP sockets, it is greatly affected by factors such as system load,
scheduler’s time slice resolution, buffering delays etc. In other words one cannot say for
sure that the sync messages are transmitted (or received) at the instant when the
application wants to. We need some notion of real-time guarantees from the OS to
ensure that the sync messages are indeed sent across with the highest possible priority.
51
52
In the current implementation of the sync channel, real-time support has not been put in.
It can be considered as a part of the ‘future works’ section.
Handshake over TCP: When messages are transmitted over TCP, the protocol
guarantees that the sender blocks to send the data to the socket buffers on the other
machine but does not guarantee that the message has reached the intended application.
And for the sync messages, it is imperative that the master knows that messages have
been delivered to the slaves (and not just to their socket buffers). Thus a very simple
hand-shake protocol is required over TCP to take care of this. Figure 16 shows how this
handshake works.
Figure 16. Steps for handshake over TCP
52
TV_SYNC
TV_SYNC
TV_SYNC
TV_SYNC_SLAVE_UPDA
TE
TV_SYNC_SLAVE_UPDA
TE
TV_SYNC_SLAVE_UPDA
TE
Master
Slave
Step 1: Master expects a TV_SYNC_SLAVE_UPDATE messages from all registered slaves.
Slave
Slave
Master
Slave
Slave
Slave
Step 2: Master broadcasts a TV_SYNC messages to all registered slaves.
53
Whenever a client is ready to receive a sync message, it is required to send a
TV_SYNC_SLAVE_UPDATE message to the master. This typically is done right after a
successful sync. And on the master side the sending of a TV_SYNC is delayed till all the slaves
have indicated their readiness by sending a TV_SYNC_SLAVE_UPDATE message. The
sending back of the TV_SYNC_SLAVE_UPDATE message can also be viewed as an
application level acknowledgement to confirm the delivery of a TV_SYNC message.
53
54
3.4.4 Video Source Module
The video source module provides the software interface for a video device. So in
essence it is a high level driver which makes various video devices available through a standard
interface. All modules are inherited from an abstract base class tvVideoSource and are
implemented as dynamically loaded libraries. This approach was chosen as it allows leeway for
incorporation of different video devices in the future without modifying the core TeraVision code.
Video sources can be broadly categorized as internal or external.
External video source examples:
Via video capture hardware
USB/Fire-wire cameras etc
Internal video source (video devices emulated in software) examples:
Rendered output of visualization software
Play back of flip-book animation or movie files.
The TeraVision system was designed to alleviate the display-pushing problem for a wide
range of scientific visualization applications. Many times scientific visualizations need more than
a simple PC for generating the graphics. The software might need a supercomputer or a cluster
of computers to generate the graphics. And when the software needs a lot of computing power
for the rendering part, there is no CPU remaining for streaming the video output to other
machines. In such a scenario, it is preferable that the video source is external to the TeraVision
server(s) so that the CPU on the servers can be dedicated to the purpose of video streaming,
without being affected by the load on the machines generating the graphics. The current
implementation of the system currently support the I-RGB cards from Foresight Imaging Inc,
54
55
which are capable of capturing 1600x1200 pixel screens at up to 60 frames per second. Figure
3.7(a) further illustrates how external sources are integrated with the TeraVision servers.
Figure 17. Example of external sources with TeraVision servers.
It is not possible to always justify dedicating machines for TeraVision servers, especially
when the graphics being generated by the source computer does not require intensive
computing and leaves enough computing power on the machine to also take care of network
streaming. In such cases we would like to run the TeraVision servers on the same machines as
the one generating the graphics. The video source plug-in in this case would need to relay the
graphical output of the software to the TeraVision process by using IPC (Inter Process
Communication) mechanisms or by some other means. In the current implementation, there is a
55
Computers rendering the graphics
TeraVision servers
NetworkNetworkVGA/DVI
outputs
Tiled display driven by TeraVision clientsTiled display driven
by TeraVision clients
56
plug-in available for an internal video source. The plug-in loads up animation frames into
memory and then feeds them into the common buffers of the TeraVision process, at a user
specified rate, to emulate a video source.
3.4.5 Compression Module
The compression modules are used for reducing the amount of data being transmitted
across the network. Servers and clients can opt to either use compression or run uncompressed
video streams. By default the compression is switched off as it is useful only in situations when
the network bandwidth is smaller than the desired uncompressed video source bandwidth. The
main requirements of the compression modules are:
Efficient algorithm: Each TeraVision system typically handles many hundreds of
megabytes of data every second. Since all the data has to go through the video source,
compression and network pipeline, inefficient handling of data can really hurt
performance. The compression module is potentially one of the most CPU intensive
modules in the system and so care should be taken to keep number of memory copies
and data parses to a minimum. For the current system, an RLE algorithm with a
quantization noise filter was implemented. The algorithm has been discussed in detail in
later sections and is implemented as a single parse, single memory copy module.
Transmission over unreliable channels: When compressed data is transmitted over
unreliable channels (e.g. UDP or Multicast), care has to be taken to recover from packet
losses. One simple way of dealing with packet losses, without introducing data-
redundancy is to make sure that the compressed data structures are aligned along the
border of the network packets carrying them. So when there are packet losses, there is
an integral loss of information, which allows the decompression algorithm to recover
56
57
data from the remaining packets. Other techniques such as forward error correction
introduce data redundancy in the transmitted stream to allow from recovery from loss.
Real-time requirements: For a large number of compression algorithms, the amount of
CPU time taken for compressing a video frame is a factor of the content of the video
frame itself. Variables like color range of the pixels, amount of noise etc. can affect the
degree and quality of compression. Ideally for the TeraVision compression modules,
apart from efficiency we would like the encoding and de-coding times to be as
independent of these factors as possible. In other words, we would like a known upper
bound on the compression-decompression times which has the smallest variance
possible.
Since the TeraVision servers and clients are simultaneously streaming parts of the same
big video stream, it is possible that at any given time, the video sub-frames handled by certain
server-client connection are quite different than the others. If the compression times are
dependent on the content of the video frames, we will have some streams lagging behind the
others. Since all the video streams are synchronized, the net rate of the video streams would be
decided by the rate of the slowest stream. To keep the load balanced on all the participating
machines, we want compression times with minimal variance.
The TeraVision compression modules are also implemented as dynamically loadable
libraries and are inherited from the abstract base class, tvComprModule. The compression
modules are supposed to provide functions for both compression and decompression and are
expected to indicate a failure if they cannot compress the video frames.
3.4.6 Network Protocol Modules
57
58
The network protocol modules are also implemented as dynamically loadable objects.
The channel that they provide for data delivery can be either reliable (e.g. TCP or RBUDP) or
un-reliable (eg. UDP, Multicast etc.). In the current implementation of the system, we have a
TCP module, a UDP module and a Multicast module. Like all other modules, the configuration
for individual libraries can be done through a GUI screen that the library provides within itself. All
networking modules should be initialized either in the server or the client mode. When acting as
a server, the module can be put into the listen mode where it waits for clients to connect and
pull video data. The video data is always passed from the server to the client and never the
other way around. Apart from the basic requirement of providing a transport layer, each
individual protocol has its own peculiar needs. Thus instead of generalizing the design
requirements of the network protocol modules, we shall consider the three implemented
modules separately and briefly discuss about them.
3.4.6.1 TCP module
This is the simplest of all networking modules as it is essentially a wrapper around
TCP sockets. The user can specify the socket buffer sizes for the send and receive buffers,
from the configuration screen. The default value of the socket buffers are typically set to 64
Kbytes. This is insufficient for most links on a LFN (Long Fat Networks) and needs to be
adjusted according to the BDP (Bandwidth Delay Product). Figure 18 shows a snapshot of the
configuration screen for the TCP module.
58
59
Figure 18. TCP module configuration screen.
3.4.6.2 UDP Module:
TCP does provide a reliable transport layer by taking care of packet losses, flow control
and data integrity but it has performance limitations when it has to be used to send large
amounts of data over LFNs. Since the present day optical networks are extremely reliable, the
physical and data-link layers are rarely responsible for losing any packets, UDP streams can
prove to be good option for streaming data over LFNs. In fact using UDP to stream video data
we find that we can get a higher throughput than TCP, albeit with some losses. Fortunately
video streams can tolerate packet losses, which simply translate to losing pixels in the video
frame. However there are the following special considerations that we have to give while using
UDP:
Recovering from packet losses and out of order packets: If we simply break up the video
frames into UDP packets and send them across the network, it would not be enough.
There can be packet losses along the way or the order in which the frames were sent 59
60
might not be preserved, which can distort the video frames. Thus when we receive the
packet on the other end, we should be able to recover from such errors. In the current
implementation of the UDP module, a simple protocol has been implemented over UDP
for this purpose. This protocol has been explained in detail in the section 4.2. It solves
the problem with UDP streaming as follows:
a. Each network packet carries a header stamped with a unique id which identifies the
video frame that it belongs to.
b. The header also carries offset information within it, which tells the receiver where to
place the payload in the entire frame. This way when packets are lost or duplicated,
we still know where the data has to be correctly placed in the video frame.
Simulating connect: Unlike TCP UDP sockets are un-connected in nature since the
protocol is not connection oriented. However as a requirement for the TeraVision
network protocol modules, the UDP module while operating as a server should be able
to go in a listen mode where it ‘listens’ for clients to connect before pushing the video
data. Thus we try to simulate a dummy connection phase by setting up a temporary TCP
server socket. The client connects to the server TCP socket by creating its own
temporary TCP client socket. The client then passes the information about the UDP
socket that it actually wants to receive the data through this TCP connection. The TCP
connection is then torn down and the server starts streaming UDP data towards the
client.
Configurable packet sizes: The standard size for an Ethernet packet is 1500 bytes. After
discarding the space required by the Ethernet and IP headers, we are approximately left
with 1450 bytes on which we can place our UDP data. In other words all the video frame
information is broken up into 1450 byte chunks before being sent across on UDP
60
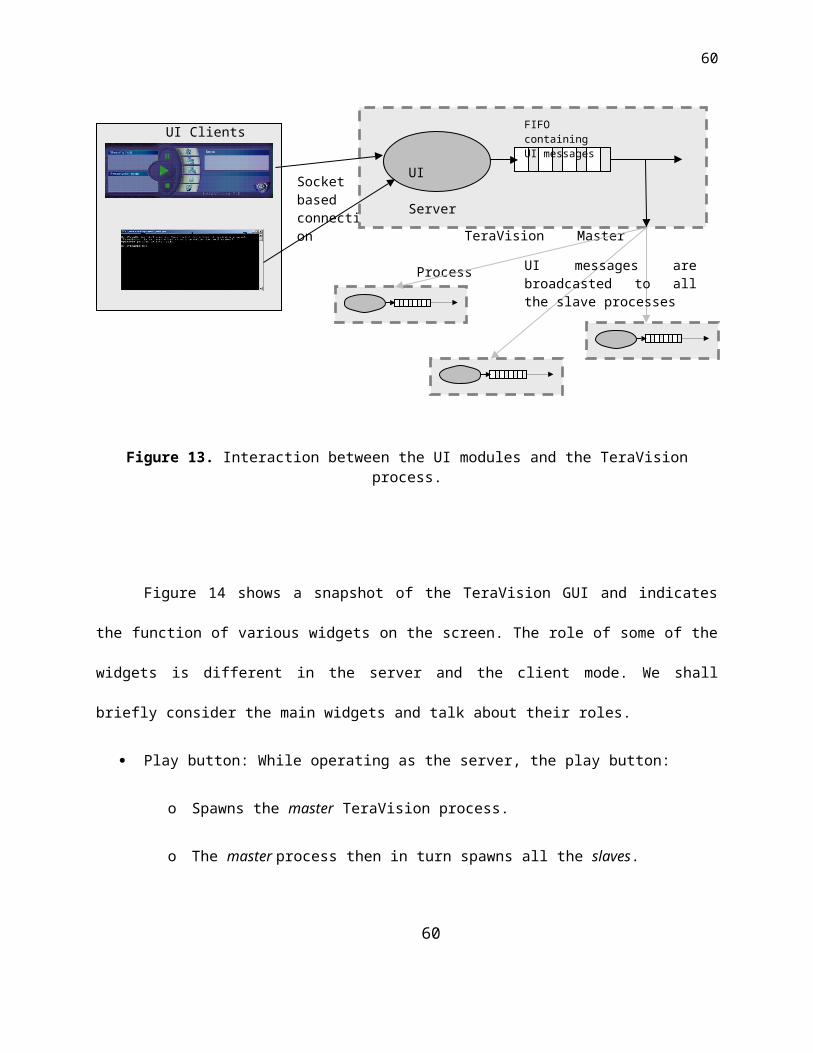
61
packets. However some networks and OSes support other sizes, which might give better
performance under certain conditions. Thus the user should be able to specify the
packet size to use for the UDP streams. The following Figure 19 shows the configuration
screen for the UDP module.
Figure 19. UDP module configuration screen.
3.4.6.3 Multicast Module:
IP multicast is essentially done over UDP sockets with the difference that the range of IP
addresses used is restricted to 224.0.0.0 to 239.255.255.255. Apart from this each process has
to request the OS to add it to a multicast group on the network. This information is passed onto
the routers/switches which are actually responsible for replicating the multicast packets and
61
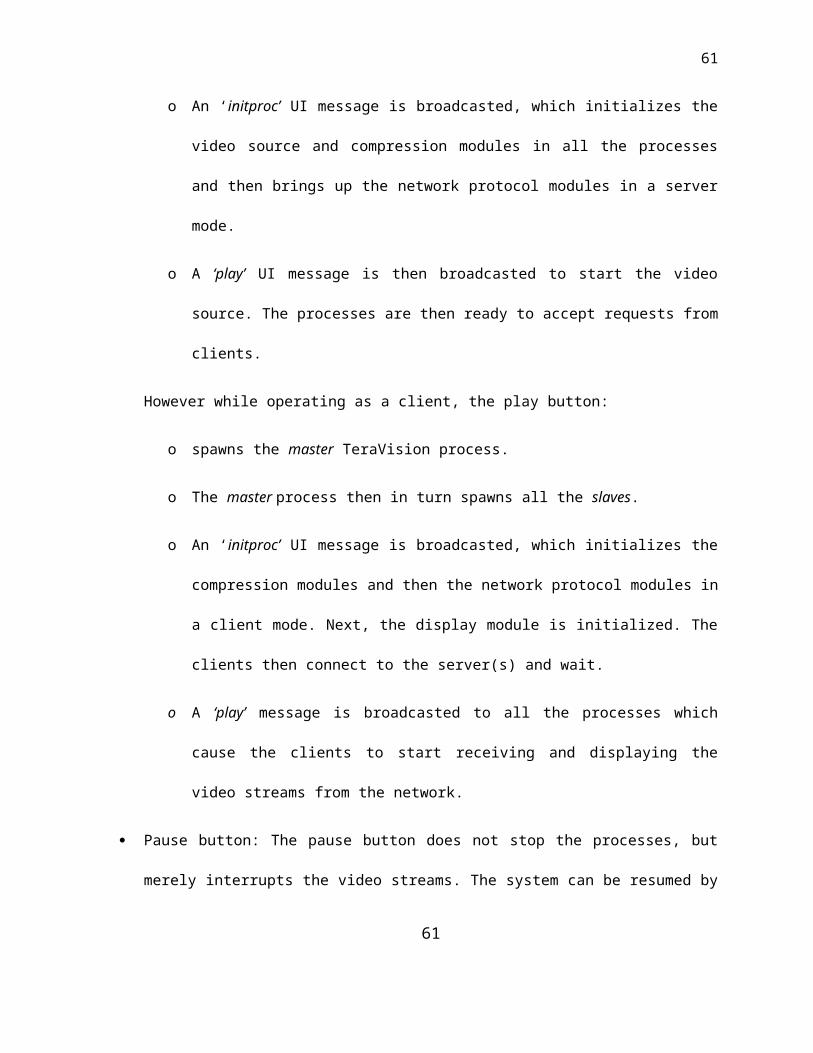
62
forwarding them to the interested hosts/networks. The OS picks up the multicast packets on the
network and if there is a process which belongs to the multicast group of the packet, it passes
the packet up to the higher layers towards the application.
Since the Multicast is also essentially unreliable, all the special design considerations for
video streaming that were given for UDP also apply to multicast video streams plus the
following.
Specify network interface: The OS usually has entry in the routing tables to decide how
the multicast traffic has to be handled. But it’s possible to have machines with multiple
interfaces on the same network or when the multicast traffic can be sent over multiple
interfaces. In such a case we want the user to be capable of specifying the network
interface to use. Figure 22 shows a snapshot of the configuration screen for the
multicast module.
Generating a multicast address for every video stream: The current implementation of
the multicast module supports multicasting of just a single video stream from a server to multiple
single clients. Multicast of entire tiled displays, which involves transmission of multiple video
streams from the server(s) to the client(s), is a slightly more complex problem requiring some
more work. Consider the case where there is a single TeraVision server, sending out just one
video stream over multicast to clients expecting it. As shown in Figure 20 this is the simplest
case of multicasting.
62
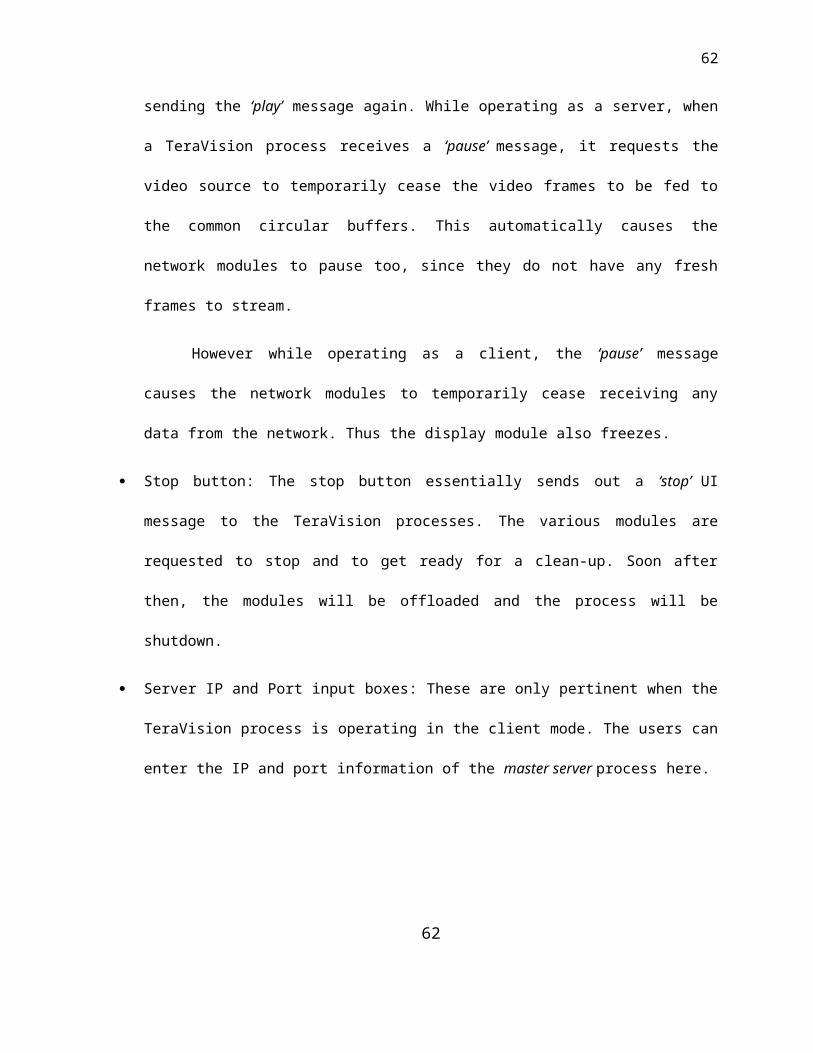
63
Figure 20. Single video stream multicast from one server to clients
Now let us consider the case for multicasting a tiled-display. Figure 21 shows the
requirements of such a setup. There is a 2x2 tiled display which is being multicast to 2x2 tiled
display clients. There are four video streams which are being transmitted (one per server).
However since each stream has to go to one TeraVision client box at each client location, each
stream has to be transmitted with a different multicast address. This is a simple case where the
number of client tiles is the same as the number of server tiles. The situation quickly
complicates when this is not the case. For e.g. if the clients were a 3x3, there would be a total of
12 transmitted video streams. Thus there should be enough multicast addresses available to
take care of all possible situations and the server(s) and client(s) should be able to take care of
allocating these addresses to the individual streams, dynamically at run-time. This is not taken
care of in the current implementation of the system and is a part of the future work.
63
TeraVision Client
TeraVision Client
Multicast capable
Netw
ork
Multicast capable
Netw
ork
TeraVision Server
TeraVision Client
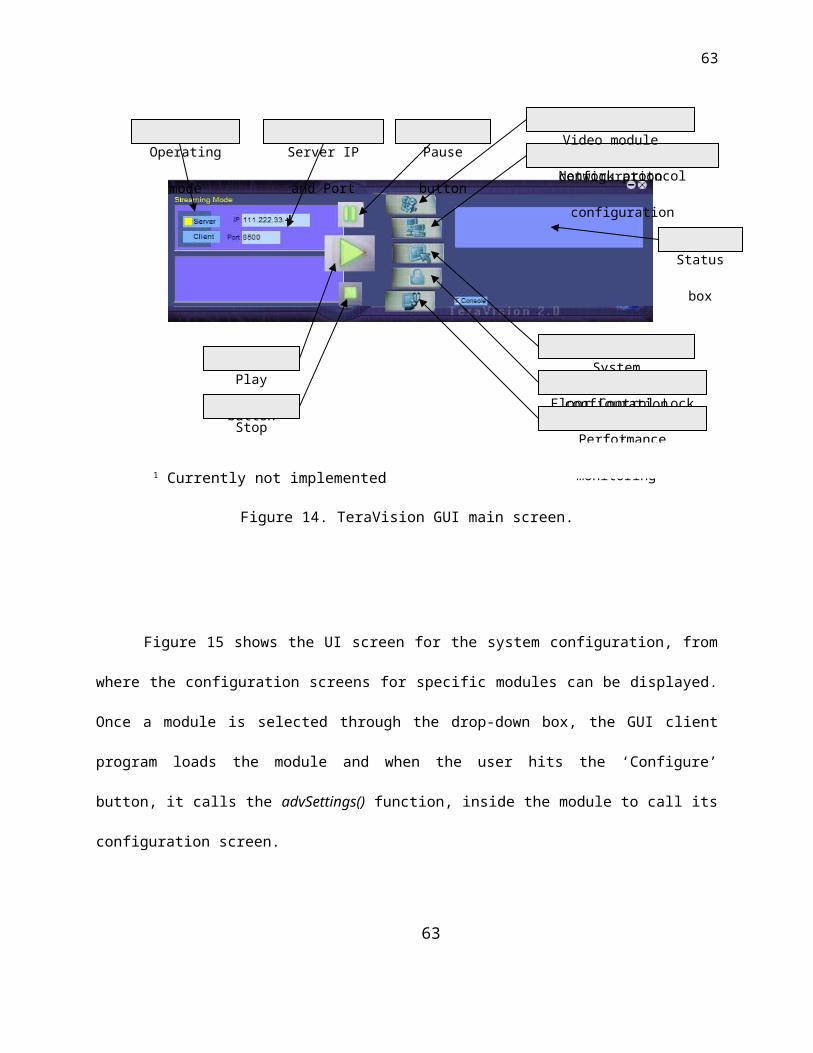
64
Figure 21. Multiple video streams multicast from many servers to many clients.
Figure 22. Multicast module configuration screen.
64
Source tiled display
TeraVision Clients
TeraVision Clients
Multicast capable
Netw
ork
Multicast capable
Netw
ork
TeraVision Servers
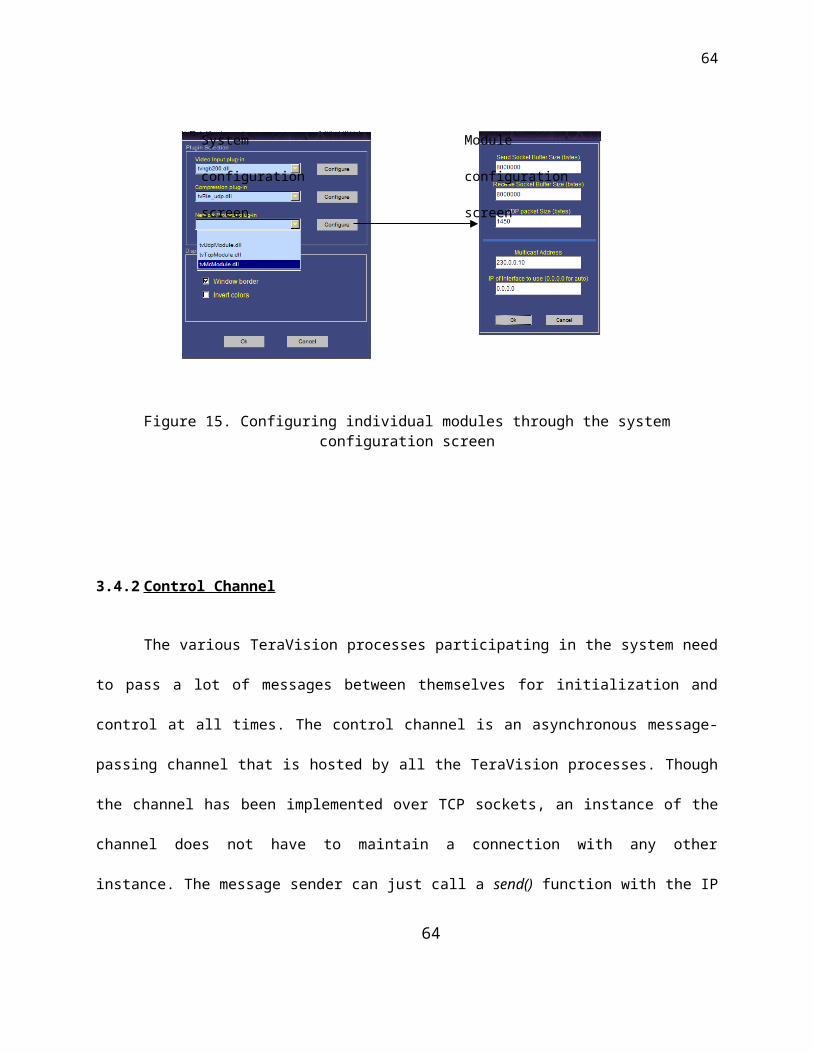
65
The network protocol modules are inherited from the abstract base class, tvNwProtocol
as defined in the tvNwProtocol.h header file. The class diagrams for the modules are as shown
below.
65
4. SPECIFIC CAPABILITIES
In this section, we touch upon some very specific issues which were addressed during
the system design. The approaches used for tackling these problems were major factors in
deciding the performance and flexibility of the system as a whole.
4.1 M x N to X x Y scaling
If we want to stream one display to another, there should be no theoretical restriction on
the number of pixels that the source can transmit and what the client can receive. But since
hardware always has an upper bound, TeraVision was designed to be scalable, where multiple
TeraVision boxes can synchronize together to act as one large capture card on the server side.
And on the client side, the system again synchronizes to provide one large collective display.
During the initial handshake phase, all the slaves on the server side register with their
masters. The master thus is aware of the total pixel resolution on the server side. Similarly on
the client side, the master is aware of the collective resolution of the display. The master client
then proceeds to calculate the video stream mappings for all the clients. Since there can be any
number of tiles on either side, a server might be serving multiple clients at any given time or one
client could be receiving its video montages from multiple server. The following Figure 23
illustrates this graphically
66
67
Figure 23. Scaling source video to client display
The master client has to inform all the slave clients about their respective mappings,
which is done through the control channel. We make the assumption that the all tiles on the
client side have the same display resolution and also all the tiles on the server side have the
same resolution. Consider the following parameters:
Xs – pixel width of each server tile
Ys – pixel height of each server tile
67
Note: The figure on the left shows a single tile server sending the video to a 2x2 client. In this case the server has to service 4 clients and each client connects to the same server. In the second case, the server is a 2x2 and a client is a 3x3 tiled display. If we consider the middle tile, we see that it has to actually receive 4 video streams from 4 different servers.
1 tile server
2x2 tiled client
2x2 tiled server
3x3 tiled client
Case A Case B
68
Xc - pixel width of each client tile
Yc - pixel height of each client tile
Ms – Number of horizontal tiles on the server, with the tiles numbered from 0 to Ms -1.
Ns – Number of vertical tiles on the server, with the tiles numbered from 0 to Ns -1
Mc – Number of horizontal tiles on the client, with the tiles numbered frm 0 to Mc -1
Nc – Number of vertical tiles on the client, with the tiles numbered from 0 to Nc -1.
Thus, the horizontal scale factor, hsf = (Ms * Xs) / (Mc * Xc)
Vertical scale factor, vsf = (Ns * Ys) / (Nc * Yc)
Then the remaining scaling parameters can be calculated according to the following equations:
Number of horizontal client montages = αi for i = 0,
= αi - αi-1 + 1, for i = 1 to (Mc – 1)
where αi = (Mc/Ms) * i, for i = 0 to (Mc – 1)
Similarly, number of vertical client montages = αi for i = 0,
= αi - αi-1 + 1, for i = 1 to (Nc – 1)
where αi = (Nc/Ns) * i, for i = 0 to (Nc – 1)
Now for every client montage that exists, there is a corresponding server montage. In
order to be able to retrieve and show the server montage, the clients need to know the following
parameters,
Oxs – horizontal offset in a server tile
Oys – vertical offset in a server tile
mxs – montage width on the server side68
69
mys – montage height on the server side
Knowing the number of client montages, we traverse from left to right and top to bottom
pixel by pixel for all the server tiles. And every time we encounter either a server tile boundary
or (the corresponding) client tile boundary, we note the offsets Oxs and Oys in that server tile and
the width ( mxs ) and height ( mys ) of the server montage.
Therefore
Client’s server side montage pixel width = hsf * mxs
Client’s server side montage pixel height = vsf * mys
Knowing the number of montages, the scaling factors, server side offsets and montage
dimensions, the clients can calculate the client side offsets of each montage too. Each client is
then able to connect to one or more servers and request a part (or whole) of the video stream
based on these parameters.
4.2 Video data over UDP
When video data is sent over UDP, even if one packet is lost, the receiver just accepts
the next incoming packet and tries to arrange it next to the previously received packet. The
resultant image gets warped as there is no indication of whether packets were lost and how
many of them were lost. Thus care has to taken while sending video data over UDP to recover
from data loss, out of order packets or integrity failure. The UDP class in TeraVision implements
a protocol over UDP packets to take care of these anomalies of an unreliable channel. Figure
24 shows the structure of the header and payload used for the protocol.
69
70
Figure 24. Header and payload fields of a TeraVision UDP packet.
Each UDP packet is stamped with a header which has fields carrying the following
information:
The video frame id of which the UDP packet is a part of. Every TeraVision frame has a
unique identifier which allows the clients and servers to synchronize their display or capture
respectively. This identifier helps the receiver place the packet in the correct video buffer on
the client end.
The packet id: All the packets for a video frame are numbered from 0 to a maximum value,.
The maximum value depends on the size of the video frame and UDP packet and is given
by the relation.
Nmax = V / (U - h),
Where,
70
1442 bytes4 bytes2 bytes
Video Frame id
Header
Video data (payload)
Total number of UDP packets for this video frame. 1
2 bytes
Packet ID
1 This field carries the length of the payload for the last UDP packet of a video frame. This is because the length of the last packet is variable. The default size of the entire packet is 1450 bytes.
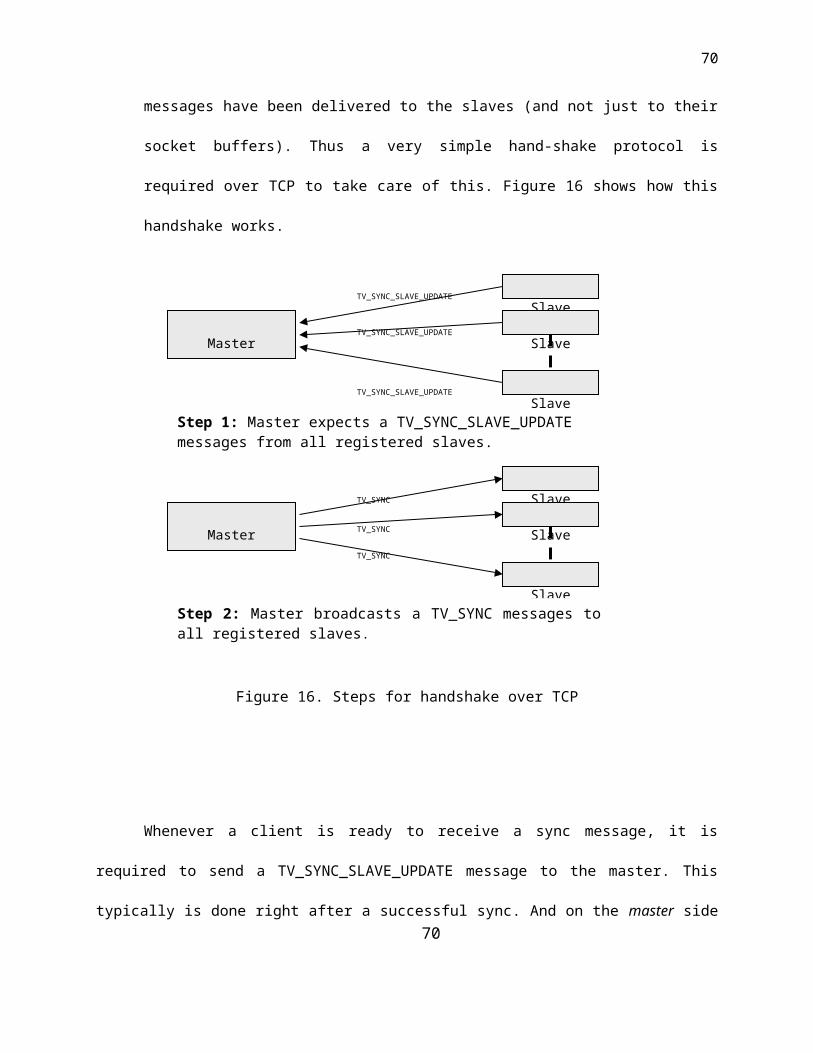
71
V – The size of the video frame
U – Size of the UDP packet use
h – Size of the header for TeraVision’s protocol. (Currently 8 bytes)
This identifier helps the receiver to calculate the correct offset in which the payload of
the packet should be placed, even if pre-ceding packet were lost or will arrive later (out-of-
order).
Figure 24 shows the different fields of the UDP packet. The implementation uses scatter-
gather calls to handle the header-payload structures efficiently. The receiver actually runs as a
thread and tries to empty the socket buffers as quickly as possible, in order to minimize
overflow.
4.3 Remote process execution and control
Since the TeraVision processes have to be spawned over several machines, we need a
mechanism to do so. For this purpose, the tvRemExec utility was written. The utility can be run
in a daemon mode on all participating nodes. The TeraVision master can then send commands
to the daemons to spawn the TeraVision slave processes on all the slave nodes. The utility
maintains a list of all spawned child processes and is used for controlling and safely shutting
down the processes whenever needed.
The current implementation of the tvRemExec is over simple TCP sockets and is a
potential security hazard. The future versions will have a secure channel for operation.
71
72
4.4 Frame Decimation policy
The graphics and networking subsystems run at speeds decided by many factors from
hardware limitation to load on the resources. Thus it would be a bad thing to assume that the
network is as fast as the graphics and vice-versa. There is a need for a frame-decimation policy
which helps in deciding which frames are to be dropped, when all components of the system
cannot run at the same speed.
4.4.1 Server side decimation:
The network tries to transmit the video frames at the best possible speeds. But if the
video source is feeding frames faster than the network can handle, frames have to be dropped.
The server looks only for the latest frames in the video buffers for transmission. This way the
decimation is indirectly decided by the network speed.
4.4.2 Client side decimation:
The client uses the same policy as the server and the display threads look for the latest
frames in the buffers. So if the network was faster than the display, the display speed decides
what frames are dropped from the buffer.
72
5. TESTS AND OBSERVATIONS
This section provides results from tests conducted with the TeraVision prototype
systems over LANs and WANs. The test frames transmitted in all the cases are video frames
with a resolution of 1024x768 at 24 bits per pixel, unless specified otherwise. All tests were
done with uncompressed video streams. Since the system has been implemented for Linux and
Windows and can run on many machines at the same time, there are several possible test
combinations. In this section we shall consider the test results most pertinent to the thesis.
5.1 Test machines’ specifications
All machines were equipped with gigabit Ethernet adapters and a 100 BaseT interface.
The video data was sent over the gigabit interfaces and the synchronization messages are
passed over the Fast Ethernet interface. No changes were made at the kernel or driver level to
optimize performance.
5.1.1 Linux machines
Hardware specifications: Dual Intel Xeon CPUs at 1.8 GHz, 512 MB RAM.
Software specification: Red Hat 7.3
Video Source: Emulated in software.
5.1.2 Windows machines
Hardware specifications: Intel Xeon at 1.5 GHz, 512 MB RAM
Software specifications: Windows 2000
Video Source: Foresight Imaging’s I-RGB-200 video-capture cards.
73
74
5.2 Network specifications
5.2.1 LAN
The LAN tests were done over Linux and Windows machines connected over a gigabit
switch. The NICs (Network Interface cards) used have optical fiber interfaces and are capable of
providing a maximum throughput of 1Gbps.
5.2.2 WAN
The main tests for LFNs were conducted between SARA [15] and EVL [16] over the
Starlight network [14]. In all cases the maximum throughput of the network was 1 Gbps and the
MTU size was set to 1500 bytes. Some results from tests run between GRNET (Greek
Research and Technology Network), Greece and EVL are also presented.
5.3 Tests
The following tables, TABLE II and TABLE III show the performance of the system with
TCP and UDP over LAN and WAN. The tests were done between one sending and one
receiving machine. As a general observation, we notice that Linux machines have higher
sending and receiving throughput capabilities.
5.3.1 Performance over TCP and UDP
The UDP bandwidths indicated in the tables are the maximum sustained throughputs
which were observed without getting any packet losses. In the event of packet losses, it was
74
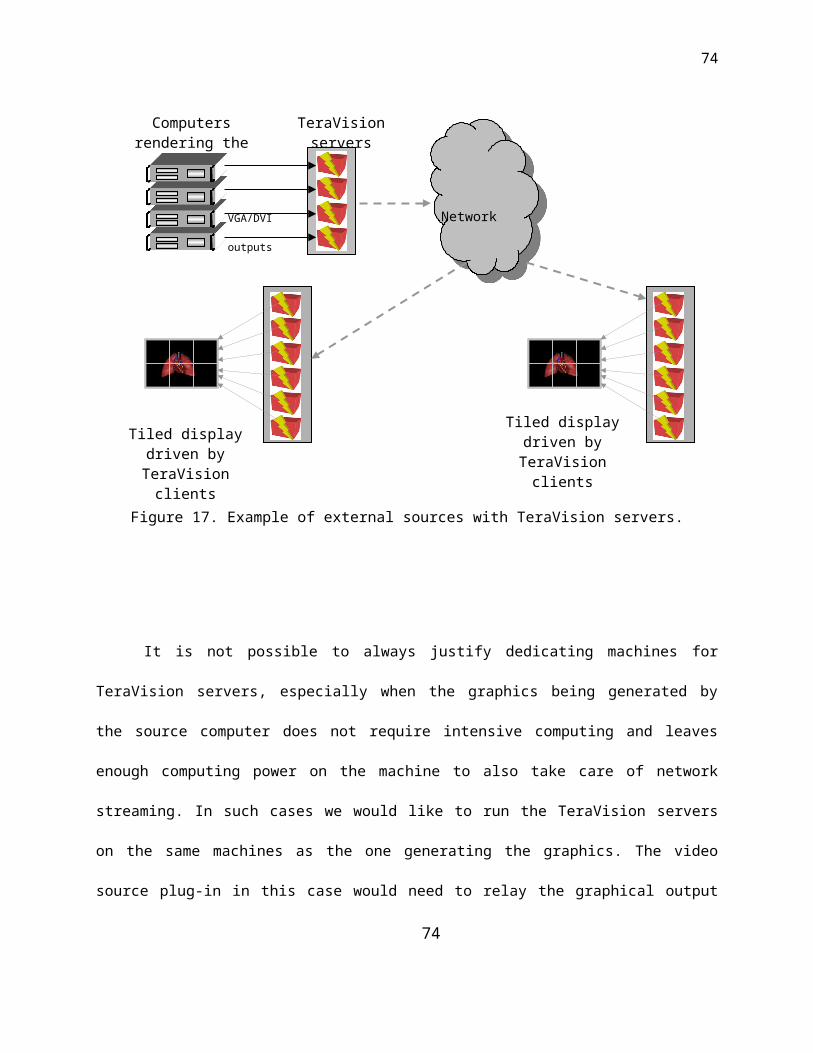
75
seen that the network interfaces never lost any packets. Buffer overflows at the sending or
receiving side were always responsible for the loss.
TABLE IISYSTEM PERFORMANCE WITH TCP
Tests Bandwidth used (Mbps)
EffectiveFrame Rate
(Frames / sec)
Server CPU utilization
Client CPU utilization
Test network
LAN (Linux to Linux)
703.12 37.4 65.4 % 98 % Local area 1 Gbps
LAN (Windows to Linux)
534 28.4 60 % 64 % Local area 1 Gbps
WAN (Linux to Linux)
110 5.8 15 % 9 % Starlight (1 Gbps)
WAN (Windows to Linux)
110 5.8 54 % 10 % GRNET to EVL (1 Gbps)
TABLE IISYSTEM PERFORMANCE WITH UDP
Tests Bandwidth used
(Mbps)
EffectiveFrame Rate(Frames /
sec)
Server CPU utilization
Client CPU utilization
Test network
LAN (Linux to Linux)
930.6 49.5 64 % 94 % Local area 1 Gbps
LAN (Windows to Linux)
180 9.6 80 % 17 % Local area 1 Gbps
WAN (Linux to Linux)
285 15.2 26 % 27 % Starlight (1 Gbps)
WAN (Windows to Linux)
190 10.1 60 % 100% GRNET to EVL (1 Gbps)
75
76
As multiple VBoxes are stacked on the server or client side to handle complex displays,
they have to synchronize with each other to send and receive video streams. The following
tables, TABLE IV and TABLE V show the affect on system performance due to the overheads
involved with scalability and synchronization. The data is sent over TCP to observe the affect of
congestion on bandwidth.
5.3.2 Effect of Synchronization and Scalability
TABLE IV shows results from a test, where one Windows server is used and the number
of Linux clients are varied to see the affect on performance. We observe from the table, that as
the number of clients increase, the total sending bandwidth decreases gradually and the CPU
utilization on the serve side increases. However since with increase in the number of clients, the
video data received by each client decreases, the CPU utilization on the clients goes down.
TABLE IVEFFECT OF SYNCHRONIZATION AND SCALABILITY ON CLIENTS
Tests Bandwidth used (in Mbps)
EffectiveFrame Rate (Frames /
sec)
Server CPU utilization
Per Client CPU
utilization
Test network
with 1 client 534 28.4 60 % 64 % Local area, 1 Gbps
With 4 clients 530 28 95 % 17 % Local area, 1 Gbps
With 9 clients 503.84 26.8 97 % 7.5 % Local area, 1 Gbps
With 15 clients 488.8 26 98 % 4 % Local area, 1 Gbps
76
77
In TABLE V, one Linux client is used for displaying the streams sent by many Linux
servers. As we increase the number of servers, the amount of data being received by the client
increases. This causes a bottleneck causing TCP’s congestion mechanism to reduce the
sending rate [Reference – TCP]. We notice that the client side CPU soon becomes a problem.
Also since there is no decimation of video data, the client attempts to show the video streams in
its entirety. This becomes a serious problem for the display hardware on the machines which
are designed to handle smaller display resolutions.
TABLE VEFFECT OF SYNCHRONIZATION AND SCALABILITY ON SERVERS
Tests Bandwidth used (in Mbps)
EffectiveFrame Rate (Frames /
sec)
Server CPU utilization
Per Client CPU
utilization
Test network
with 1 server 623 33 70 % 80 % Local area, 1 Gbps
With 4 servers 180 9.5 17 % 94 % Local area, 1 Gbps
With 9 servers 120 6.3 15 % 99 % Local area, 1 Gbps
5.3.3 Effect of different frame sizes
The video frame sizes and frame rate determines the amount of data that has to be
streamed. In the following tests, shown in TABLE VI and TABLE VII, we vary the frame sizes
but do not control the frame rate. The system attempts to send the frames at the best possible
rate. The tests shown here were done over TCP and UDP on LAN between one sending
77
78
(Windows) machine and one receiving (Linux) machine. We notice that in both the cases, the
bandwidth and CPU utilization remains and the only thing that varies is the frame rate.
78
79
TABLE VIEFFECT OF FRAME SIZES OVER TCP
Video frame sizes(at 24 bpp)
Bandwidth used (in Mbps)
EffectiveFrame Rate (Frames /
sec)
Server CPU utilization
Per Client CPU
utilization
Test network
800 x 600 489 42.45 52 % 55% Local area, 1 Gbps
1024 x 768 534 28.4 60 % 60 % Local area, 1 Gbps
1200 x 1024 473 13.6 60 % 60 % Local area, 1 Gbps
1600 x 1200 468 10.13 60 % 60 % Local area, 1 Gbps
TABLE VIIEFFECT OF FRAME SIZES OVER UDP
Video frame sizes(at 24 bpp)
Bandwidth used (in Mbps)
EffectiveFrame Rate (Frames /
sec)
Server CPU utilization
Per Client CPU
utilization
Test network
800 x 600 176 15.2 78 % 34 % Local area, 1 Gbps
1024 x 768 180 9.6 80 % 34 % Local area, 1 Gbps
1200 x 1024 184 5.4 80 % 34 % Local area, 1 Gbps
1600 x 1200 181 3.92 80 % 34 % Local area, 1 Gbps
79
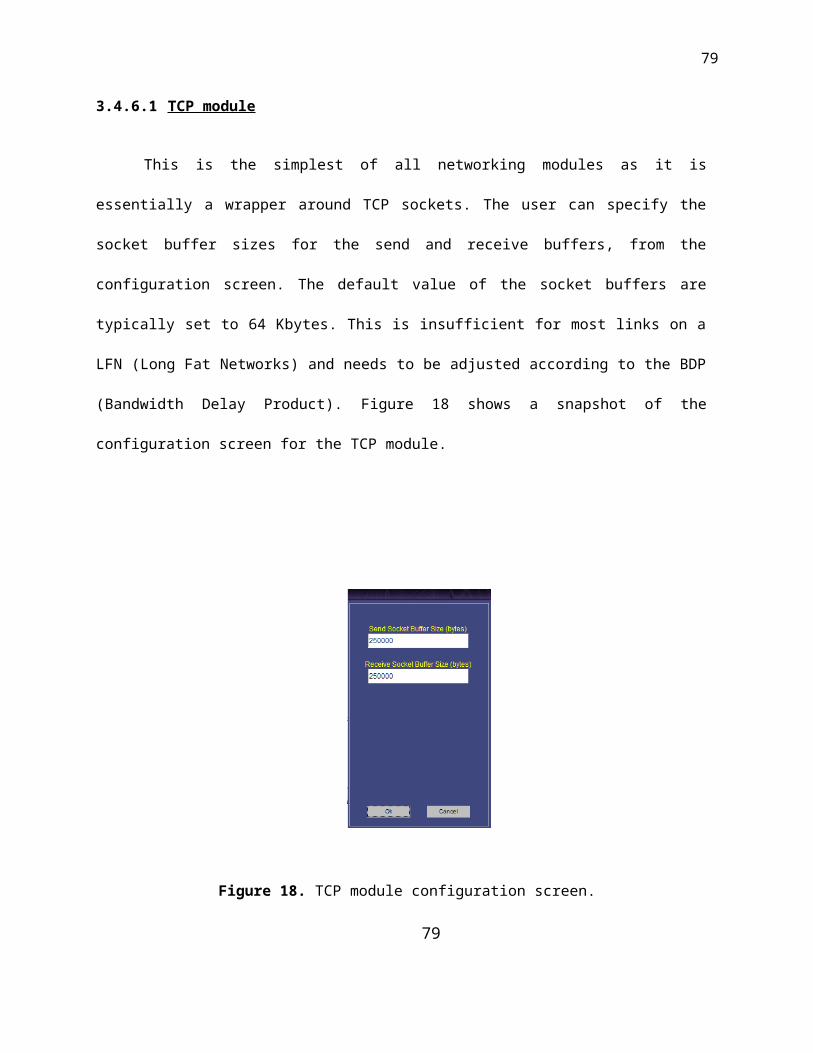
80
5.3.4 Effect of UDP datagram sizes
As discussed in section 4.2, care has to be taken while sending video data over UDP.
We assume that since a UDP datagram would be sent on Ethernet packets, we try to send the
video data structures which can fit on Ethernet packets. This way, even if packets are lost, we
can recover from the losses.
During the course of developing the prototype, it was observed that the standard 1500
byte datagram size was a bad assumption for performance of UDP streams on Windows. The
datagram size did not make any difference for Linux. In all the previous tests, the datagram size
for UDP tests was assumed to be 1500 bytes, since the Ethernet packets handling the data are
set to 1500 byte MTUs on the network. The following TABLE VIII shows the affect on the
sending throughput on Windows with variation in datagram sizes.
We notice that as we increase the datagram sizes, the sending throughput increases
and the server CPU utilization goes down. However the client’s CPU utilization goes up, as an
affect of increase in bandwidth.
TABLE VIIIEFFECT OF UDP DATAGRAM SIZES ON WINDOWS
Datagram sizes (in bytes)
Bandwidth used (in Mbps)
EffectiveFrame Rate (Frames /
sec)
Server CPU utilization
Client CPU utilization
Test network
1450 180 9.6 80 % 34 % Local area, 1 Gbps
8192 392 20.8 65 % 55 % Local area, 1 Gbps
16384 498 26.5 70 % 63 % Local area, 1 Gbps
80
81
32768 586 31 60 % 80 % Local area, 1 Gbps
5.4 System Demonstrations
The system has been tested and demonstrated at conferences and public exhibitions to
adjudge the response of the scientific community towards it. Over the period of the prototype
development, the system was demonstrated at the following places:
• iGrid 2002, Sept 2002, Amsterdam [17]
• Workshop "Towards integrated Networking and Grids infrastructures for eScience and
beyond - The EU e-Infrastructures initiative”, June 2003 [18]
• All Hands Meeting, May 2003, University of Illinois at Urbana-Champaign
• OptIPuter[19] Site Visit, Sept 2003.
• Furthermore TeraVision boxes have been installed at ANL and at NCSA for further
system and user testing.
81
6. CONCLUSIONS AND FUTURE WORK
6.1 Contributions
The main contributions of this thesis can be listed as follows. It can also be considered
as the listing of the capabilities of the system:
• High-Resolution video can be streamed over LFNs without loading the rendering
machines. And the users do not need to have an in-depth understanding of the
networking concepts to be able to do so.
• The thesis proposes a unique way of distributing the load of video streaming across
machines by using the output of the graphics hardware.
• Streaming of complex display systems such as stereoscopic or tiled-displays, which
require a high degree of synchronization for their working, is now possible.
• The source video streams automatically scale to fit the destination’s display. The
sending machines distribute the video streams to the display machine(s) to utilize the
available display resolution completely.
• The system provides a framework which can be used to adapt it to a variety of different
collaborative environments and scientific visualization applications.
• The streaming system is oblivious to the platform used for generating the visualizations
and can stream from virtually any graphics system with a video output.
82
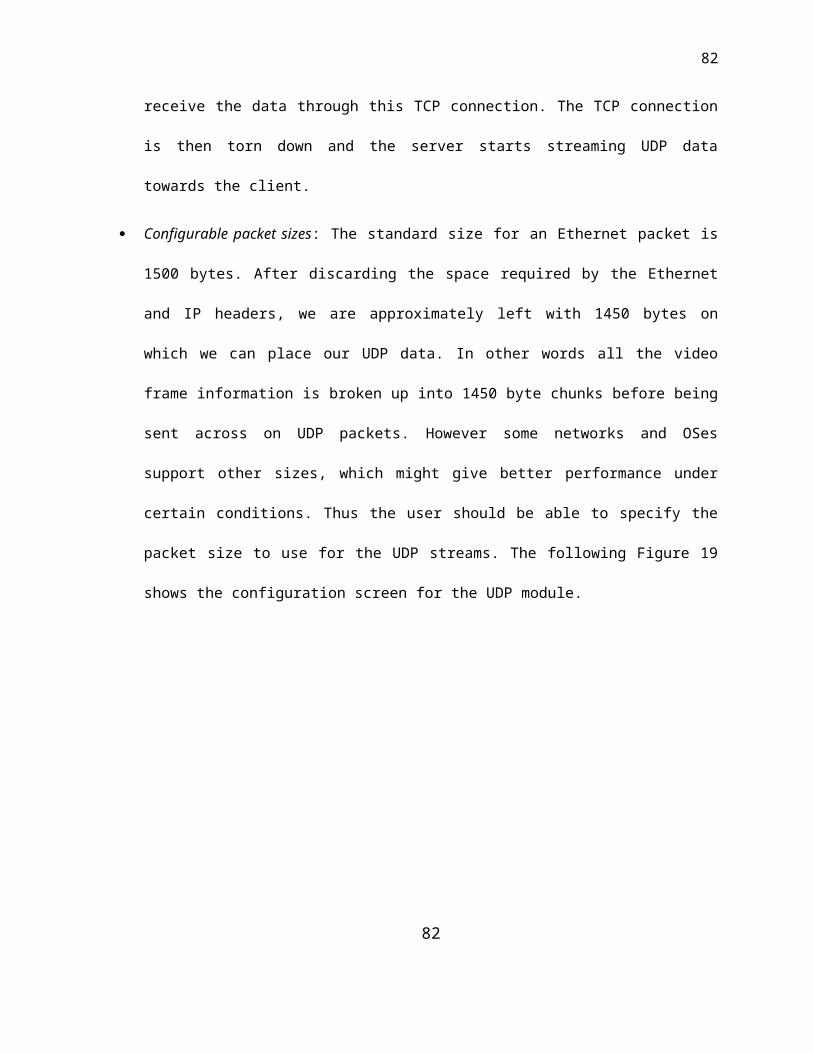
83
6.2 Future work
6.2.1 Multicasting tiled displays
As explained in section 3.3.1.8 the system currently is capable of multicasting single
video streams to single displays only. The problem of multicasting to and from tiled-displays is
definitely solvable but requires more work at the control-plane level interaction between the
TeraVision processes.
The problem can be solved easily by making the assumption that each client site has the
same display configuration. By giving a unique multicast address to every server montage that
is transmitted, the server tile(s) can be multicast to the clients. However since till run-time, it is
not known how many server montages are present, the TeraVision processes need to generate
the multicast addresses to be used, from a list of possible addresses.
6.2.2 Optical multicast
With advancement in MEMS (Micro-Electro-Mechanical Systems) it has been possible to
construct pure photonic switches, which use micro-mirrors for routing light from one port to the
other. These electro-mechanical systems are not suitable for routing network traffic in real-time
but are very useful for setting up dedicated light paths between machines across the LAN or
across the globe. With optical fiber technology getting cheaper everyday, it is now possible to
have dedicated network pipes between computing machines.
As a consequence, optical splitters have enabled a unique way of providing multicast for
network traffic, by splitting a light beam (carrying network traffic) into many similar beams. This
is a very attractive approach as no electronics is involved it doing the network packet replication
83
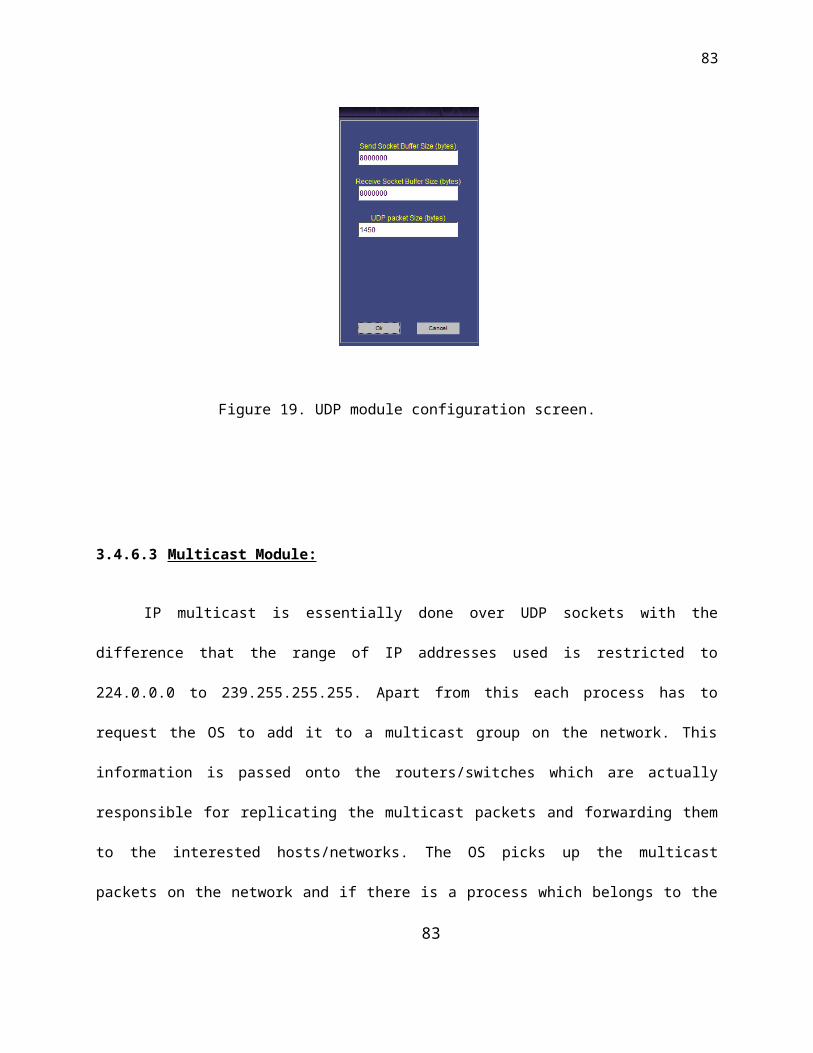
84
and thus eliminates the problem of loads on routers and switches. But ss of today, the
technology is still in its nascent stages and more work needs to be done before optical network
can be used with the conventional IP/Ethernet based protocols.
6.2.3 Incorporate RBUDP
Since typical scientific visualizations cannot tolerate any type of artifacts in the resultant
video, UDP may not provide the ideal solution in many cases because of the possibility of
packet-losses. We need a reliable transport layer, which can provide the performance of UDP
but with the reliability of TCP. EVL has been working on such a streaming protocol called the
RBUDP [1]. RBUDP uses a scheme of selective acknowledgments, where the sender sends a
burst of UDP packets and the receiver acknowledges only the packets which are not received.
The sender then re-transmits the missing packets. RBUDP has shown excellent results for
LFNs and the bandwidth numbers are close to that from UDP streams. Thus future versions of
TeraVision should provide a network protocol plug-in for RBUDP.
6.2.4 Integration with the Access Grid
The AccessGrid [3][6] is a very popular environment for remote collaboration that has
been accepted by various universities and government organizations across the country. It is a
virtual space which employs various display technologies and is frequently used by scientists to
discuss and present their ideas. Thus it provides the perfect setup for utilizing the capabilities of
a system such as TeraVision. The AccessGrid, currently provides a framework for incorporating
new services and systems into its existing setup.
84
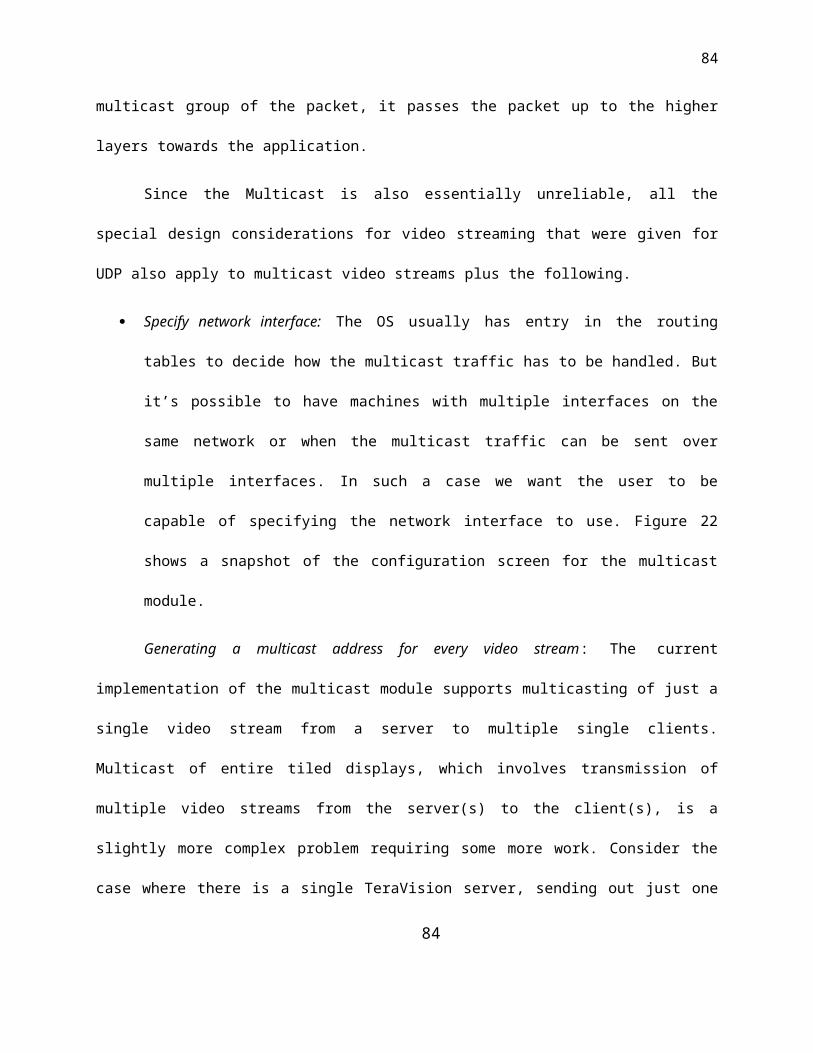
85
85
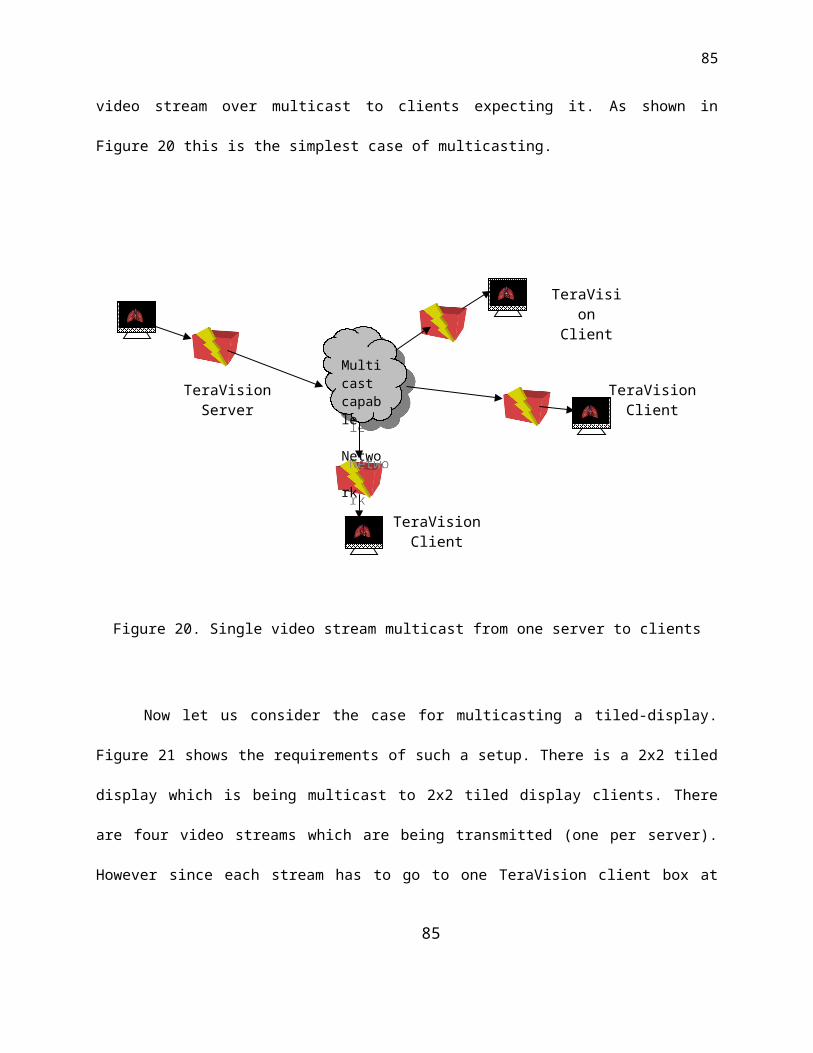
86
6.2.5 Real-time guarantees from the OS
One of the most difficult problems that had to be solved during the course of prototyping
TeraVision, was the development of the sync module. Since the sync module works over
TCP/IP sockets, the latency of the sync messages are decided by factors such as system load.
If the server or client systems have heavily loaded resources, the synchronization suffers and
the resulting video montages are not timed correctly. There is a need to provide a real-time
guarantee from the OS to ensure an upper-bound on the time taken for the sync messages to
be sent across machines.
6.2.6 Collapsing large displays to small
In the current implementation, if a large display is being streamed to a smaller display,
there is no decimation done at the pixel level to reduce the data appropriately. Since the client
display has less resolution than the source video streams, it is inefficient to stream more data
than can be viewed. Moreover, in cases where say an entire 15-tile display is being sent to a
laptop, 15 serving machines will attempt to send their video streams towards one client. This
would obviously create a bottleneck on the client’s network interface and may cause many
undesirable effects such as congestion and packet-losses. The client typically also might not be
able to handle the load of so many full-resolution video streams simultaneously. Thus there is a
need to decimate the data at the source before transmission in such cases.
86
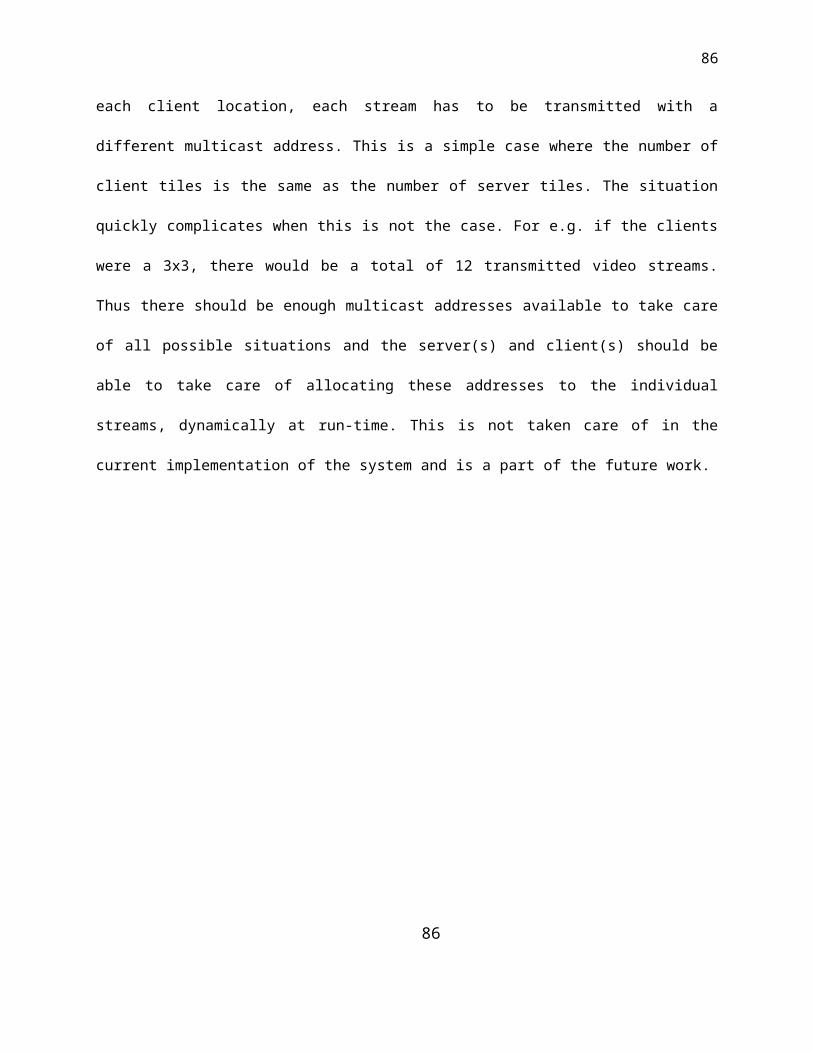
87
6.2.7 Compression over unreliable protocols
As discussed in section 3.3.1.5 special care has to taken when sending compressed
data over unreliable channels. The current implementation provides a RLE (Run Length
Encoding) compression module which will work only on reliable transport protocols such as TCP
but fail over UDP and Multicast.
6.2.8 Secure channel for control plane
The current implementation of the control plane is done over un-encrypted TCP sockets,
which can prove to be a potential security hazard. Since these channels are present in all
TeraVision processes, they need to be secured to prevent misuse of the TeraVision boxes. The
video data is also sent over open sockets right now but the users have the option of plugging-in
their own secure protocols to take care of it.
6.2.9 Port-mapping and restricting port range
During user testing, it was realized that many research labs want to run TeraVision
servers from behind fire-walls. This means that there has to be a known range of network ports
that are used on the VBoxes and it should preferably be as small as possible. In the current
implementation, the main port values are hard-coded and the many modules use ports as
assigned by the operating system defaults.
87
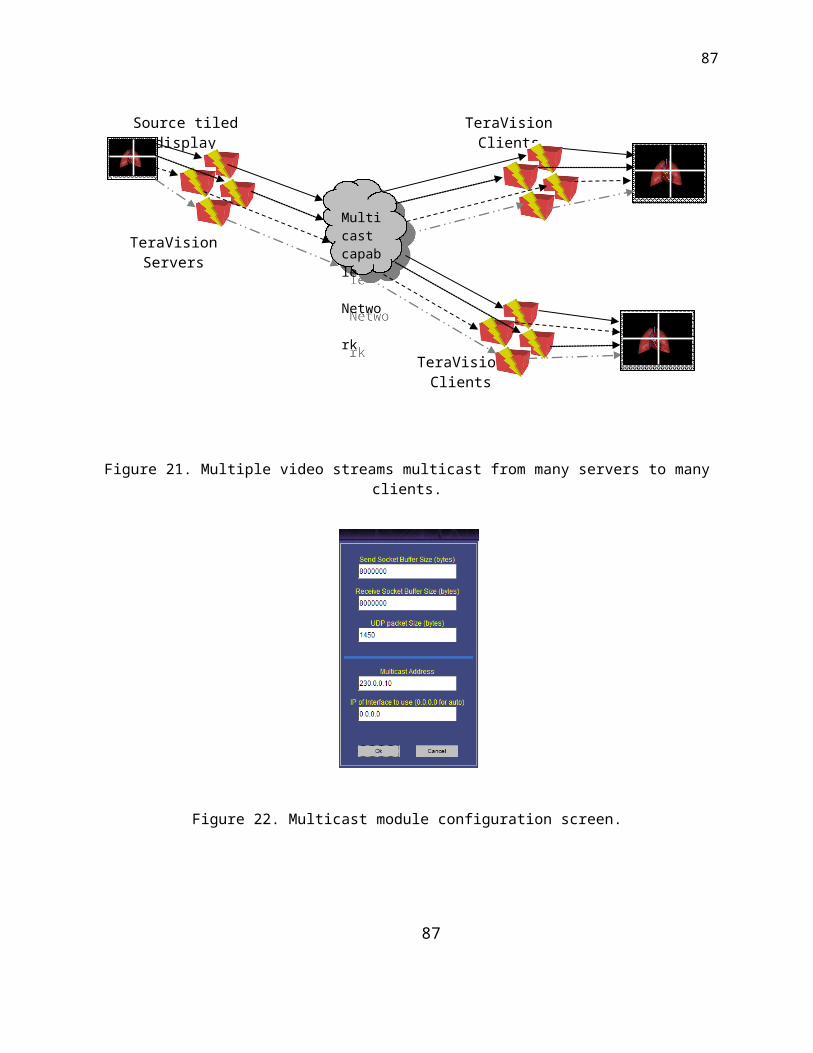
88
6.3 Concluding remarks
The system proposed and prototyped during the course of this thesis provides a flexible
and scalable solution for the display pushing problem in collaborative environments and
scientific visualization applications. Now users can stream the output of complex visualization
systems over LFNs without making any modifications to the source machines. The system
scales the visualization, generated by the source machines, automatically to the client’s display.
The solution also distributes the load for streaming the high-resolution video streams to
dedicated machines, leaving the rendering machines free for computation and rendering. This is
a very important feature for computationally heavy visualization applications.
The system attempts to provide a framework which allows easy adaptation to many
visualization scenarios and it is hoped that it will prove to be a useful tool for collaborative
environments and the scientific community.
88
CITED LITERATURE
1. E. He, J. Leigh, O. Yu , T. A. DeFanti, Reliable Blast UDP: Predictable High Performance Bulk Data Transfer, IEEE Cluster Computing 2002, Chicago, Illinois, Sept, 2002.
2. E. He, J. Alimohideen, N. K. Krishnaprasad, J. Leigh, O. Yu, T. A. DeFanti, L. Smarr, QUANTA: A Toolkit for High Performance Networking Applications.
3. J. Leigh, G. Dawe, J. Talandis, E. He, S. Venkataraman, J. Ge, D. Sandin, T. A. DeFanti, AGAVE: Access Grid Augmented Virtual Environment, Proc. AccessGrid Retreat, Argonne, llinois, Jan, 2001.
4. W. R. Stevens, “Unix Networking Programming, Volume 1, Second Edition: Networking APIs: Sockets and XTI,” Addison Wesley, 1998, pp.357.
5. http://www.evl.uic.edu/cavern/continuum
6. http://www.accessgrid.org
7. John Nagle. Rfc896: Congestion control in ip/tcp internetworks. Technical report, Internet Assigned Numbers Authority, Jon Postel, USC/ISI, 4676 Admiralty Way, Marina del Rey, DA 90292, 1984.
http://info.internet.isi.edu/in-notes/rfc/files/rfc896.txt
8. http://www.realvnc.com
9. http://graphics.cs.ucdavis.edu/~staadt/download/Staadt_EGVE03.pdf
10. http://www.icwall.nl/lucspapers/ipt2002.pdf
11. http://chromium.sourceforge.net/doc/index.html
12. http://www.cs.virginia.edu/~gfx/pubs/cr/cr_lowquality.pdf
13. http://www.cs.virginia.edu/~gfx/pubs/CRopenRM/CRopenRM.pdf
14 http://www.startap.net
15 http//www.sara.nl
16 http://www.evl.uic.edu
17 http://www.igrid.org
89
90
18 http://www.cordis.lu/greece/events120603.htm
19 J. Leigh, Renambot, L., DeFanti, T., Brown, M., He, E, Krishnaprasad, N., Meerasa, J., Nayak, A., Park, K., Singh, R., Venkataraman, S., Zhang, C., Livingston, D., McLaughlin, M., An Experimental OptIPuter Architecture for Data-Intensive Collaborative Visualization, 3rd Workshop on Advanced Collaborative Environments (in conjunction with the High Performance Distributed Computing Conference), Seattle, WA 06/22/2003 - 06/22/2003
90
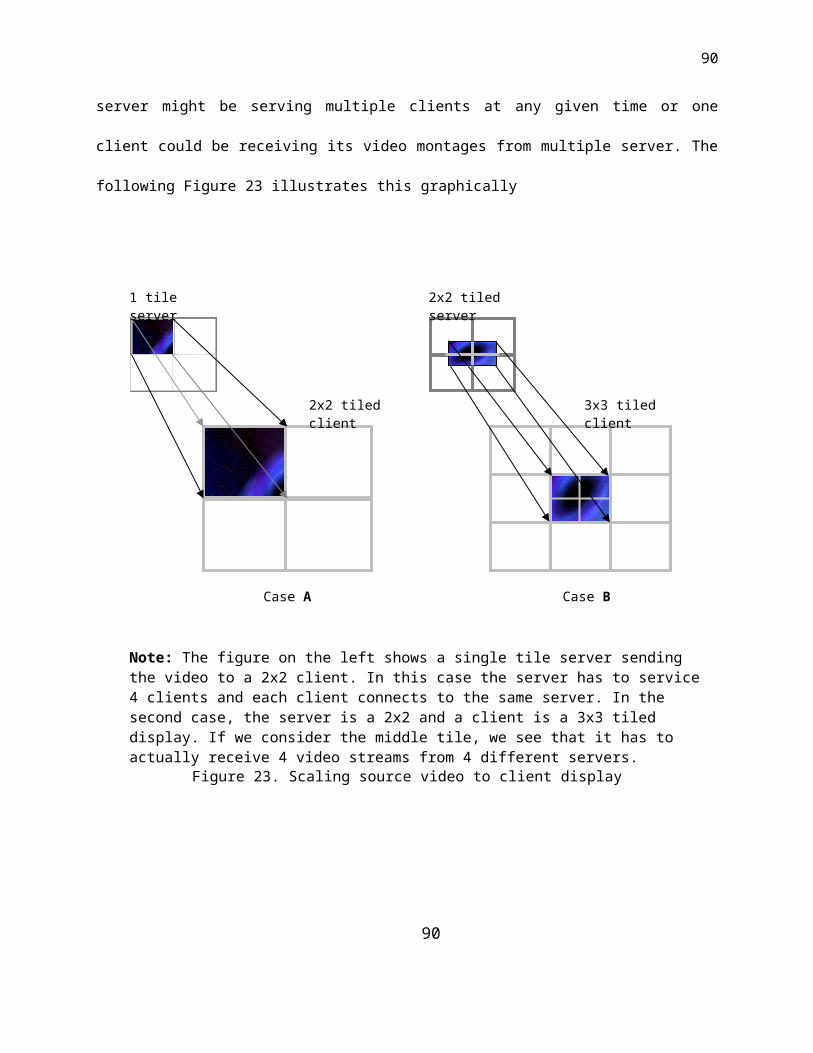
VITA
NAME Rajvikram Singh
EDUCATION B.E. Electronics Engineering, University of Mumbai, Mumbai, India, 1998
M.S., Computer Science, University of Illinois at Chicago, Chicago, Illinois, 2003.
WORK EXPERIENCE
Research Assistant, Electronic Visualization Laboratory, University of Illinois at Chicago, Chicago, Illinois, Aug 2000 - present.
Software Systems Engineer, Tata Infotech Ltd., Mumbai, India, Aug 1998 – July 2000.
PUBLICATIONS Singh, R., Leigh, J., DeFanti, T., A., Karayannis, F., TeraVision: a high resolution graphics streaming device for amplified collaboration environments Future Generation Computer Systems 1008 (2003) 11/01/2002 - 12/24/2003
J. Leigh, Girado, J., Singh, R., Johnson, A., Park, K., DeFanti, T. A., TeraVision : a Platform and Software Independent Solution for Real Time Display Distribution in Advanced Collaborative Environments, Access Grid Retreat 2002 Proceedings, La Jolla, CA 03/04/2002 - 03/05/2002
J. Leigh, Renambot, L., DeFanti, T., Brown, M., He, E, Krishnaprasad, N., Meerasa, J., Nayak, A., Park, K., Singh, R., Venkataraman, S., Zhang, C., Livingston, D., McLaughlin, M., An Experimental OptIPuter Architecture for Data-Intensive Collaborative Visualization, 3rd Workshop on Advanced Collaborative Environments (in conjunction with the High Performance Distributed Computing Conference), Seattle, WA 06/22/2003 - 06/22/2003
J. Leigh, A. Johnson, K. Park, A. Nayak, R. Singh, V. Chowdhry, Amplified Collaboration Environments, VizGrid Symposium, Tokyo, November 2002.
91
92
SCRATCH SHEETS
Miscrelleneous thing … for discussion
- LFN (and latest developments)
92
93
- Requirements of protocols for LFNs … what are the options available
- TCP tuning (web100 etal. and auto tuning)
- Packet losses with UDP
- RBUDP et al.
ToDos
Add class diagrams to chapter 3, video source modules, compression modules and
network protocols module section
Discuss RLE in detail
Fix the equations in the MxN to XxY section. The equation for calculating the server side
parameters for the client montages is incorrect.
93
94
94