Embed Size (px)
Citation preview

The Smart Grid is a compilation of concepts, technologies, and operating practices
intended to bring the electric grid into the 21st century.
1
intended to bring the electric grid into the 21st century.
Defining the smart grid is difficult for several reasons. First, there is no single template that
defines exactly what the smart grid will look like or how it will operate in any given service
area. Without a consensus template people tend to construct their own mental vision of
how the technologies, systems ,and customers will interact. There is also the reality that
customer mix, geography, weather and other factors will almost certainly make the smart
grid in each service area a little unique.
The second factor contributing to the uncertain definition is the fact that the smart grid
does not yet exist. Many of the systems and technologies expected to become a part of
smart grid either haven’t been developed yet or are in prototype or early stages of testing
and implementation.
It is difficult to define something that does not exist. While these factors attach a degree
of uncertainty to smart grid, there are several foundational concepts, technologies, and
regulatory practices that define smart grid expectations.
The purpose of this Smart Grid 101 tutorial is to identify what we know and to clarify key
questions to help reduce the unknown.

This first segment of the Smart Grid 101 tutorial includes three chapters. Each chapter
addresses one of the key domains that contribute to the smart grid vision.addresses one of the key domains that contribute to the smart grid vision.
While the scope of smart grid covers the entire utility system from generation to how
customers use energy, this tutorial primarily focuses on the intersection between the
distribution system and customers. All elements of smart grid include important
engineering, economic , and policy issues. However, with the exception of alternative
generation options, the generation and transmission segments are less uncertain and more
dominated by engineering economics than the distribution and customer segments.
2

From a regulatory perspective, a clear definition of smart grid is important for two reasons.
First, it helps if consumers, utilities, vendors and regulators all start from a common First, it helps if consumers, utilities, vendors and regulators all start from a common
understanding of smart grid. Second, how smart grid is defined establishes the framework
to guide expectations, resource allocation decisions, and implementation priorities.
However, coming up with a simple, universally accepted definition of the smart grid is not
an easy task. While everyone generally agrees that the term “smart grid” implies a
modernization of the existing electric system, there are divergent opinions on how
modernization translates into specific policy actions or resource decisions.
3

Consider the following question.
“If you were to start from scratch today to design an electric system for your community,
what would it look like?”
This is a key challenge for creating a smart grid.
Designing a system from scratch, starting with no legacy systems and no rules, allows you
to identify how best to incorporate new technologies and designs and to achieve the
objectives most important to you. Your neighbors design and objectives may not exactly
match yours, which is exactly the problem we encounter today in defining smart grid.
Everyone has slightly different perspectives, which results in different designs and
objectives.
Once your new smart grid is designed, you have established the vision or where you “want
to be”, which makes it possible to compare your future grid, with “where you are”, the
current grid.
These differences are critical because they establish a benchmark and framework for
determining what you have to do to transition to a smart grid.
4

To define smart grid we have to answer three basic questions.
1. What is a smart grid?
2. How is a smart grid different from the existing utility grid?
3. Why do we need it?
5

Question 1: WHAT IS SMART GRID ?
Fundamentally, smart grid is a combination of information and communication applications that link together generation, transmission, distribution, and customer end-use technologies. The need to integrate all of the systems that generate and supply energy with customer usage is one of the very certain design principles of smart grid. System integration will be accomplished using information and communication systems .
Smart grid is not necessarily a specific combination of parts as much as it is a process for using information and communications to integrate all the components that make up each electric system. Smart grid is system integration.
The smart grid system integration process shares three common objectives:
1. Promote customer choice – provide customers with information, rates and pricing, and technologies that will allow them to make better usage decisions;
2. Improve reliability – use automation on the grid and in customer premises as well as alternative generation options to improve system reliability and stability, and
3. Integrate renewables – support alternative generation and storage options that minimize or reduce environmental impacts, improve overall system efficiency, and reduce carbon-based fuel usage.
Note: Title XIII, Section 1301 of the Energy Independence and Security Act of 2007 describes smart grid as a system capable of accomplishing ten specific objectives http://frwebgate.access.gpo.gov/cgi-bin/getdoc.cgi?dbname=110_cong_bills&docid=f:h6enr.txt.pdf
6

Question 2: HOW IS A SMART GRID DIFFERENT FROM THE EXISTING GRID ?
The existing utility grid is a centralized system where power flows in one direction, from The existing utility grid is a centralized system where power flows in one direction, from
generation resources through the transmission-distribution system to the customer.
Generation may or may not be located in the same geographic area as the load being
served, which can often require transmission from distant locations.
Existing utility grids may or may not include Supervisory Control and Data Acquisition
(SCADA) sensors, computing, and communications to monitor grid performance. Utility
systems may depend instead on separate reporting systems, periodic studies, and stand-
alone outage management applications.
Information to the customer is generally limited to a periodic bill for services consumed in
a prior time period or billing cycle. Utility web sites may or may not provide customers will
access to their usage data. Energy usage is usually presented as an aggregate kWh value
for a specific billing cycle, which may or may not align with monthly calendar boundaries.
7

Question 2(continued): HOW IS SMART GRID DIFFERENT FROM THE EXISTING GRID ?
The first step to transform the existing grid into a smart grid requires the addition of
generation options throughout the grid at bulk power transfer points, substations, other
distribution locations and on the customer side of the meter. Adding generation
throughout the grid allows power sources to be located closer to their point of use,
reducing investment in transmission and distribution, and in many cases reducing energy
losses. Implementation of widespread, smaller generation resources diversifies supply,
reduces risks of major outages, and improves overall reliability.
Sensors, remote monitoring, automated switches, reclosers, upgraded capacitor banks,
and other equipment may be integrated into the grid to provide end-to-end monitoring
and control of the transmission and distribution network. Equivalent additions on the
customer side of the meter would include automated control systems and smart appliances
with embedded price and event-sensing and energy management capability. Sensors
provide the information to better understand grid operation, while control devices provide
options to better manage system operation.
8

Question 3. WHY DO WE NEED A SMART GRID?
The last stage necessary to transform and create a smart grid is the addition of
communication systems to support information flows that fully link both the utility and
customer sides of the grid.
On the utility side of the grid, sensors will be integrated with high speed switches and
expert systems to automatically balance power flows, isolate and re-route power around
disturbances , report outages, and continuously update system operators with weather,
demand, and performance data from throughout the system.
On the customer side of the grid, near real-time meter data will be available so customers
can better understand how individual appliances and behavior impact their energy usage
and costs. Broadcast price, reliability and event signals may be monitored directly by smart
appliances or through home automation gateways , responding automatically to customer
preferences to defer or reduce usage during high-priced or constrained reliability periods.
Third-party service providers may also provide customers with a range of information and
energy management services.
9

Question 3 (continued). WHY DO WE NEED A SMART GRID?
This table lists seven attributes that further distinguish specific differences between the existing grid and a smart grid. Distinguishing specific differences between the existing grid and a smart grid helps frame the technological and operational differences that help answer ‘WHY do we need a smart grid’. Some of the advantages include:
1. Utility Business Model: In a smart grid, ownership and operation is distributed between the utility, third-party providers and the customer. Distributing asset ownership could work to reduce overall long-run costs and spur innovation in generation sources.
2. Obligation to Serve: For the current electric grid, the traditional regulatory compact provides utilities with exclusive, sole-provider operating rights and in return obligates them to provide safe reliable service to all customers. With a smart grid, the regulatory compact is broadened to now allow third-party retail service providers and customers to provide additional energy information and management services. Reliability services may become more customized and tailored to each customer’s specific needs and prferences. Under this new compact the customer is expected to have more choice regarding the services received and what they pay.
3. Generation Resources: Under a smart grid, more generation resources are expected to become distributed throughout the grid. Distributing generation throughout the grid is expected to improve reliability, reduce the need for transmission expansion, reduce major siting issues, and encourage applications of alternative renewable options.
10

Question 3 (continued). WHY DO WE NEED A SMART GRID?
4. Transmission / Distribution: Systems designed to transport power from centralized
locations will under smart grid migrate to self-contained micro-grids and localized
generation sources.
5. Metering-Measurement: Advanced metering is expected to provide the interface
between the utility and customer, to provide CUSTOMER access to more detailed usage
data, and a foundation for more relevant action-oriented customer education.
Advanced metering will also provide capability to provide a much wider range of pricing
options including pre-payment and innovative dynamic rates. Finally, advanced
metering infrastructure (and near real-time communications) supports expanded
demand response opportunities including enabling customer participation in ancillary
services markets.
6. Rates (Pricing): Under the existing conventional grid, rates are reasonably static,
changing infrequently, where their primary purpose is to compute a periodic bill. In a
smart grid environment, rates will take on an active day-to-day operational role to
facilitate not only expanded demand response but also facilitate integration of large-
scale intermittent renewable generation, electric vehicles, and other localized options.
7. Customer Role: Under smart grid, customers are expected to become more active
participants in how they obtain and use energy. That doesn’t mean that customers will
have to stand around and monitor energy prices in real time, however it does mean
11
have to stand around and monitor energy prices in real time, however it does mean
that customers will be provided with more information to better inform them regarding
how they use energy, what it costs, and options for changing and automating their
energy usage habits to better control their costs.

6/16/2011
12

A Smart Grid vision communicates an image of the future. What will the grid look like in 5,
10, or 20 years? Who will own the parts, who will pay for them, and will we use energy 10, or 20 years? Who will own the parts, who will pay for them, and will we use energy
differently than we do today? A Smart Grid vision defines our expectations for what it
looks like, how it operates, and what it costs. While defining Smart Grid is difficult, coming
up with a consensus Smart Grid vision would be extremely difficult. There are just too
many unresolved technology and policy uncertainties to support a consensus vision.
Instead it is possible to identify and agree on several key elements that will be essential to
Smart Grid under any set of circumstances. Achieving agreement on fundamental
expectations will provide a framework for establishing initial technology, policy, and
implementation priorities.
13
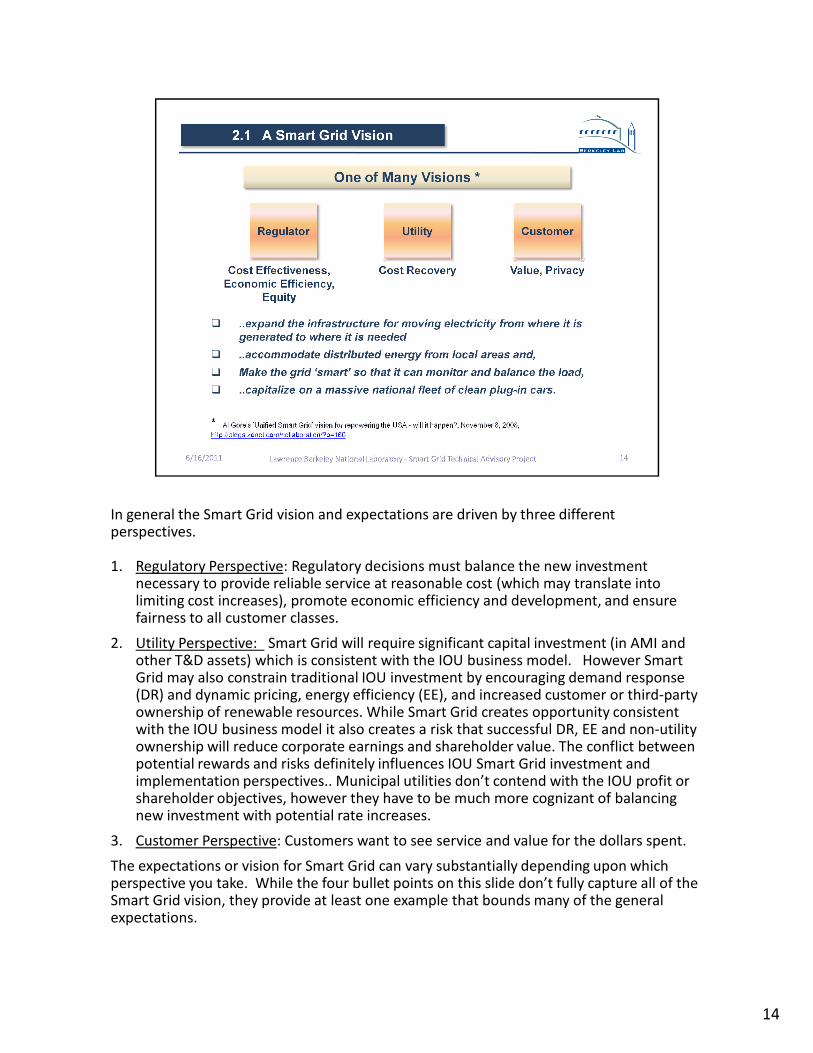
In general the Smart Grid vision and expectations are driven by three different perspectives.
14
perspectives.
1. Regulatory Perspective: Regulatory decisions must balance the new investment necessary to provide reliable service at reasonable cost (which may translate into limiting cost increases), promote economic efficiency and development, and ensure fairness to all customer classes.
2. Utility Perspective: Smart Grid will require significant capital investment (in AMI and other T&D assets) which is consistent with the IOU business model. However Smart Grid may also constrain traditional IOU investment by encouraging demand response (DR) and dynamic pricing, energy efficiency (EE), and increased customer or third-party ownership of renewable resources. While Smart Grid creates opportunity consistent with the IOU business model it also creates a risk that successful DR, EE and non-utility ownership will reduce corporate earnings and shareholder value. The conflict between potential rewards and risks definitely influences IOU Smart Grid investment and implementation perspectives.. Municipal utilities don’t contend with the IOU profit or shareholder objectives, however they have to be much more cognizant of balancing new investment with potential rate increases.
3. Customer Perspective: Customers want to see service and value for the dollars spent.
The expectations or vision for Smart Grid can vary substantially depending upon which perspective you take. While the four bullet points on this slide don’t fully capture all of the Smart Grid vision, they provide at least one example that bounds many of the general expectations.

Developing a Smart Grid Vision
The previous slide identified different perspectives of smart grid, first the generalized perspectives representing the three major participants in each electric system and second, an early, more specific national policy perspective.
One conclusion that should be drawn from these different perspectives is that a consensus opinion regarding Smart Grid expectations will be difficult to achieve. What makes achieving consensus even more difficult is that implementation decisions need to be resolved against what can often be unique local needs and requirements.
This slide poses a series of five questions that should be resolved for any Smart Grid implementation. These questions also represent typical issues and concerns raised by many state commissions in the midst of Smart Grid proceedings.
These questions also provide the guidance for all the remaining information in this tutorial.
1. What problem(s) are you trying to solve: manage future costs, improve reliability, or integrate renewables?
2. Which perspective(s) are you trying to serve: society, end-use (rate payer), or the utility?
3. How is the “Smart Grid” different from what you’ve already been doing?
4. What are the Smart Grid costs and benefits?
5. Where do you start and what information do you need to proceed: [1] Pilot programs or [2] a Transition Plan?
15

This table and the two that follow provide much more specific lists of expected Smart Grid benefits categorized into the regulator or societal, utility, and customer perspectives. Each benefits categorized into the regulator or societal, utility, and customer perspectives. Each table of benefits is characterized by a list of seven attributes that correspond to the expected source that will produce or contribute to achieving the benefit. The final column in each table poses a question that asks if a benefit is “Realistic ?”.
The entries in the “Realistic” column for each of the three tables of benefits is always left blank. The reason - Smart Grid is still too new and not far enough along in implementation to confirm whether any of these benefits will actually be realized. In addition almost all of the benefits require concurrent implementation of policy, rate, and technology options and some degree of customer participation or acceptance. This concurrent implementation or system integration element of Smart Grid is particularly uncertain.
All of the expected benefits in these three slides were culled from legislation or reports and presentations by proponents of Smart Grid.
This table lists ten (10) expected Smart Grid societal benefits. These benefits represent broad system wide expectations that should benefit utilities, customers, and society in general.
For example, increasing grid reliability is particularly difficult to measure. As will be pointed out later in this tutorial, there are few standards in place to govern reliability reporting or measurement and the common industry indexes and metrics already in use reflect a utility rather than customer centric valuation. The claimed reduction in petroleum imports provides another example, where the factors impacting this benefit include national and international politics, economics and environmental issues that go far beyond the Smart Grids anticipated by any individual utility.
16
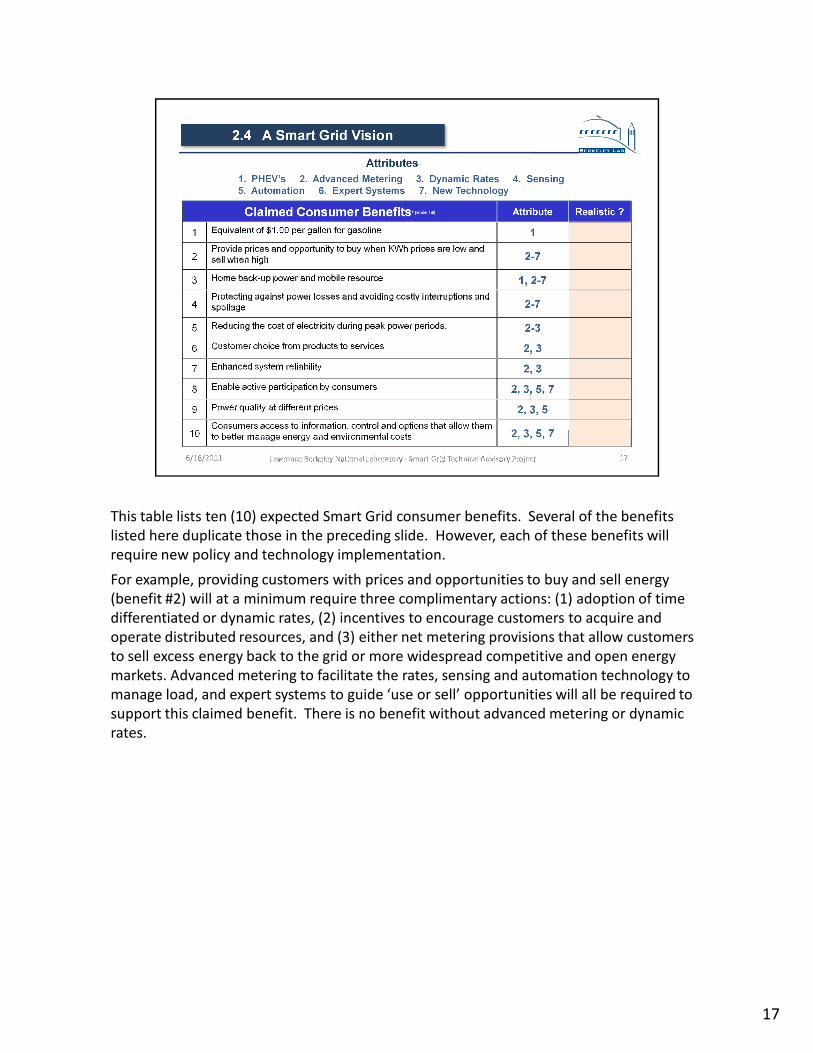
This table lists ten (10) expected Smart Grid consumer benefits. Several of the benefits
listed here duplicate those in the preceding slide. However, each of these benefits will
17
listed here duplicate those in the preceding slide. However, each of these benefits will
require new policy and technology implementation.
For example, providing customers with prices and opportunities to buy and sell energy
(benefit #2) will at a minimum require three complimentary actions: (1) adoption of time
differentiated or dynamic rates, (2) incentives to encourage customers to acquire and
operate distributed resources, and (3) either net metering provisions that allow customers
to sell excess energy back to the grid or more widespread competitive and open energy
markets. Advanced metering to facilitate the rates, sensing and automation technology to
manage load, and expert systems to guide ‘use or sell’ opportunities will all be required to
support this claimed benefit. There is no benefit without advanced metering or dynamic
rates.

This table lists seven (7) expected Smart Grid utility benefits. What is unusual about this
list of benefits is that none address utility profitability, earnings, or impacts on shareholder list of benefits is that none address utility profitability, earnings, or impacts on shareholder
equity. While we could have added utility specific financial benefits the intent was to reflect
how Smart Grid is reflected in industry related publications and venues. Obviously, utility
financial, operational, and shareholder benefits (for investor owned utilities) are all
important in assessing the value of Smart Grid and should be included in any evaluation.
What is apparent from the listed benefits in three preceding tables is that many of the
claimed benefits for Smart Grid are prospective, difficult to measure, and in many cases
uncertain because they are dependent upon policy, economic, and political factors beyond
local control. Because Smart Grid is defined as a system integration effort, the benefits
naturally reflect the expected long-term system integration benefits. As a result, it is
difficult to generalize Smart Grid benefits from one implementation to another. This poses
a difficult situation for local boards and state regulatory commissions that are obligated to
assess the operational impacts, economics, cost-benefit, and expected value of proposed
Smart Grid initiatives. One solution to this problem is to refocus on near-term expectations
and benefits from the rate, metering, technology, and operational elements that will
eventually create the Smart Grid and set aside the prospective industry promoted broad
categories of benefits.
18

19
When customers “flip the switch” they expect their lights to go on and stay on. Local storm
or accident caused outages can be disruptive and costly, however customers are generally
20
or accident caused outages can be disruptive and costly, however customers are generally
accepting that certain acts of nature are inevitable and must be tolerated. Forced outages
or rotating blackouts, like those instituted in California during their energy crisis of 2000-
2001 generate very different adverse customer reactions because they are considered
avoidable, they can create significant financial hardships for all customers (and the utility
if it results in inappropriate policy or legislative intervention).
While improved reliability is considered one of the major benefits of Smart Grid, there are
emerging concerns regarding the real value of claimed benefits versus the investment
required. First consider that reliability improvements are not a unique function of Smart
Grid. Improvements to the transmission and distribution grid are continuous, normal
activities necessary to maintain and operate the grid. Adding automation, SCADA, and
outage management capability have also been common to utility systems for at least 30
years.
However, under Smart Grid potential reliability improvements expand beyond the normal
distribution grid to include the integration of distributed generation, renewables, and micro
grids on a large scale. Here is where the three perspectives outlined in slide #2.1 play a
significant role in helping to address the appropriateness of reliability Smart Grid
improvements.

The accepted industry definition of reliability is limited to total electric interruptions or a
complete loss of voltage. The value of reliability then becomes a function of the scope of complete loss of voltage. The value of reliability then becomes a function of the scope of
the outage defined by the bulleted list of factors such as number of customers, their
connected load, and the duration of the interruption.
Customer outage cost is a key factor missing from this bulleted list. An outage on a feeder
serving 1000 small residential customers with 5MW of load will probably experience
different losses (damage function) than a children’s hospital, chicken farm, or public safety
complex with the same load. Customer outage costs are important because they ‘calibrate’
the value of an outage, however customer outage costs are usually excluded from utility
and regulatory outage measures because they are considered difficult to measure and
somewhat subjective.
Can you measure reliability without including customer outage costs?
21

With any investment, the first step is to identify and define the objectives. Nine illustrative
questions are provided that address potential reliability improvements linked to the
6/16/2011
questions are provided that address potential reliability improvements linked to the
definition of reliability.
Metrics that measure current system conditions in response to each question establish the
benchmarks against which investment objectives could be developed. These questions are
not mutually exclusive in that several could be combined to establish a more robust set of
objectives. These questions are also only examples. They don’t represent a complete
inventory of possible reliability objectives.
22

Understanding the major causes and value of outages is necessary before reliability
objectives can be established or evaluated.
6/16/2011
objectives can be established or evaluated.
This graphic example illustrates the distribution of outages by ‘cause’ reported for Detroit
Edison Company*, a Midwestern utility. This pie chart shows that weather, unknown, and
outside contact with the grid accounts for 79% of the system outages and only 5% are due
to power grid failure. The distribution of outage minutes by these same causal factors
would provide a more meaningful metric to address grid reliability improvements. Outage
objectives and investment value would be quite different if the 5% of outages associated
with power grid failure also account for 95% of the total outage minutes.
* Tracking the Reliability of the U.S. Source:
http://my.dteenergy.com/home/powerProblems/electricityOut/index.html
23

The four formulas on this slide represent the common metrics used to evaluate utility
reliability performance, however none of these metrics include factors to reflect the value
6/16/2011
reliability performance, however none of these metrics include factors to reflect the value
of service or customer outage cost. While these metrics may reflect real improvements to
utility system operating and maintenance practices, what still needs to be determined is
whether reductions in the average duration of outages (SAIDI) or the average customer
interruption duration (CAIDI) and any of the other measures adequately reflect material
customer impacts.
Reliability Resources
� “Tracking the Reliability of the U.S. Electric Power System: An Assessment of Publicly
Available Information Reported to State Public Utility Commissions”, J.Eto and
K.Hamachi LaCommare, October 2008, LBNL-1092E, Ernest Orlando Lawrence
Berkeley National Laboratory. http://repositories.cdlib.org/lbnl/LBNL-1092E/
� “Estimated Interruption Costs for Electric Utility Customers in the United States,
Draft Report, February 2009, Freeman, Sullivan &Co., Office of Electricity Delivery and
Energy Reliability, U.S. Department of Energy.
http://www.netl.doe.gov/moderngrid/docs/Cost_of_Power_Interruptions_to_Electri
city_Consumers_in_the_.pdf
� IEEE Standard 1366-2003 Reliability Index and Major Event Definitions.
24

This graphic illustrates another factor that needs to be weighed when considering reliability
improvements. General utility practice is to only report outages with durations that exceed improvements. General utility practice is to only report outages with durations that exceed
5 minutes. This bar chart illustrates that 88 (70.4%) of the 125 utilities surveyed only
report outages with durations exceeding 5 minutes. Historically short duration outages less
than 5 minutes duration far outnumber those exceeding 5 minutes. Consequently, this
reporting practice potentially misses a significant impact on customer experienced
reliability. Defining the criteria for what constitutes an outage could materially impacts the
technology fix and cost or outage improvement measures.
While statistical distributions that explain the cause and duration of outages are important,
no combination of these statistics provides sufficient information to determine the cost
effectiveness or priorities for new reliability investments. What’s missing is a metric that
reflects customer outage cost or value of service and how this valuation is impacted by the
frequency and duration of outages. For example, outage costs that increase linearly as a
function of outage duration would seem to justify investments that provide better
detection, faster response, and a reduction in unserved energy (shorter outages).
However, outage costs tend to vary significantly by customer class, so allocating reliability
investments should be guided not just to reduce outage minutes but to reduce the most
valuable outage minutes.
25

This slide provides two examples of relative customer outage costs. While these examples use data from studies almost 20 years apart, the underlying relationship remains consistent – that outage from studies almost 20 years apart, the underlying relationship remains consistent – that outage costs differ substantially between customer classes and those differences have implications for resource allocation and grid management.
Example A illustrates the range of outage costs for an individual utility by customer class (blue bars) and for the aggregate service area averaged value over all customers (orange bars). Example B provides the U.S. average outage cost by customer class for three different outage durations. Example B also provides the outage costs normalized (in red) to the Residential 1-hour outage cost, to provide comparable metrics in Example A. To normalize the values in Example B all dollar outage costs were divided by the “1 hour” Residential value.
The objective of this slide is to illustrate the disparate value customer outage costs create in targeting and evaluating T&D reliability improvements. Weighting feeder, substation, and other grid improvements by customer outage costs would substantially change implementation and investment priorities. Variations in outage costs also have implications for how utilities target demand response options.
In this example, an investment to improve one of two feeders, one residential and one industrial, each with similar outage rates, all other things being equal, should favor the industrial feeder. Reductions in industrial outages will produce many times the benefit of a similar residential improvement.
Once the cause, characteristics, and value parameters have been established two key questions need to be resolved:
1. Will the proposed investments actually improve reliability? While outage minutes may be reduced, Example B indicates that momentary unreported outages still create a substantial cost.
2. Are there alternatives that might be more effective and less costly? Alternatives may include distributed generation, on-site renewables, storage and micro grid options.
26

6/16/2011
There are four key observations and conclusions that can be drawn from the previous slides
on defining and valuing reliability in the context of Smart Grid.
27
on defining and valuing reliability in the context of Smart Grid.
1. There is no consistent industry definition for defining system reliability, particularly
under a smart grid structure that considers alternative grid designs and distributed
generation resources.
2. Existing industry definitions of reliability only report a portion of the events that impact
customer service delivery.
3. The value component of reliability is customer outage costs, which is a function of
many variables, may be difficult to estimate, and is not considered in current reliability
metrics.
4. It is not clear which specific Smart Grid measures will contribute the most to system
reliability improvements.
What is clear is that not all Smart Grid investments will produce equivalent benefits.
Regulators should be aware that they may have to consider and address the inadequate
and incomplete definitions and the difficulty in establishing ‘customer value’ for reliability
as part of their assessment of Smart Grid benefits.

28
![[Smart Grid Market Research] Brazil: The Smart Grid Network, Zpryme Smart Grid Insights, October 2011](https://img.pdfslide.net/doc/110x75/577d20871a28ab4e1e931ff6/smart-grid-market-research-brazil-the-smart-grid-network-zpryme-smart-grid.jpg)


![[Smart Grid Market Research] Smart Grid Hiring Trends Study (Part 1 of 2) - Zpryme Smart Grid Insights](https://img.pdfslide.net/doc/110x75/541402208d7f728a698b47a7/smart-grid-market-research-smart-grid-hiring-trends-study-part-1-of-2-zpryme-smart-grid-insights.jpg)


![[Smart Grid Market Research] Smart Grid Hiring Trends Study (Part 2 of 2)- Zpryme Smart Grid Insights](https://img.pdfslide.net/doc/110x75/5414021c8d7f7284698b47a9/smart-grid-market-research-smart-grid-hiring-trends-study-part-2-of-2-zpryme-smart-grid-insights.jpg)
![[Smart Grid Market Research] India: Smart Grid Legacy, Zpryme Smart Grid Insights, September 2011](https://img.pdfslide.net/doc/110x75/541402518d7f7294698b47d4/smart-grid-market-research-india-smart-grid-legacy-zpryme-smart-grid-insights-september-2011.jpg)


![[Smart Grid Market Research] The Optimized Grid - Zpryme Smart Grid Insights](https://img.pdfslide.net/doc/110x75/541402188d7f7294698b47d2/smart-grid-market-research-the-optimized-grid-zpryme-smart-grid-insights.jpg)