Embed Size (px)
Citation preview
John Townshend, Chengquan Huang, Jeffrey Masek, Matthew Hansen, Samuel Goward, Compton Tucker, Saurabh Channan, Greg Ederer, Min Feng, Feng Gao, DoHyung Kim, Raghuram Narasimhan, Peter Potapov, Joseph Sexton,
Alex Shatalin, Danxia Song, Kuan Song, Xiaopeng Song, Bin Tan, Eric Vermote, Robert Wolfe, Guangxiao Zhang
April 21, 2010
Three Decades of Forest Cover Change in the Americas Evaluated Using the
GeoCover and MDGLS Data (LCLUC)and
Earth Science Data Records of Global Forest Cover Change (MEaSUREs)
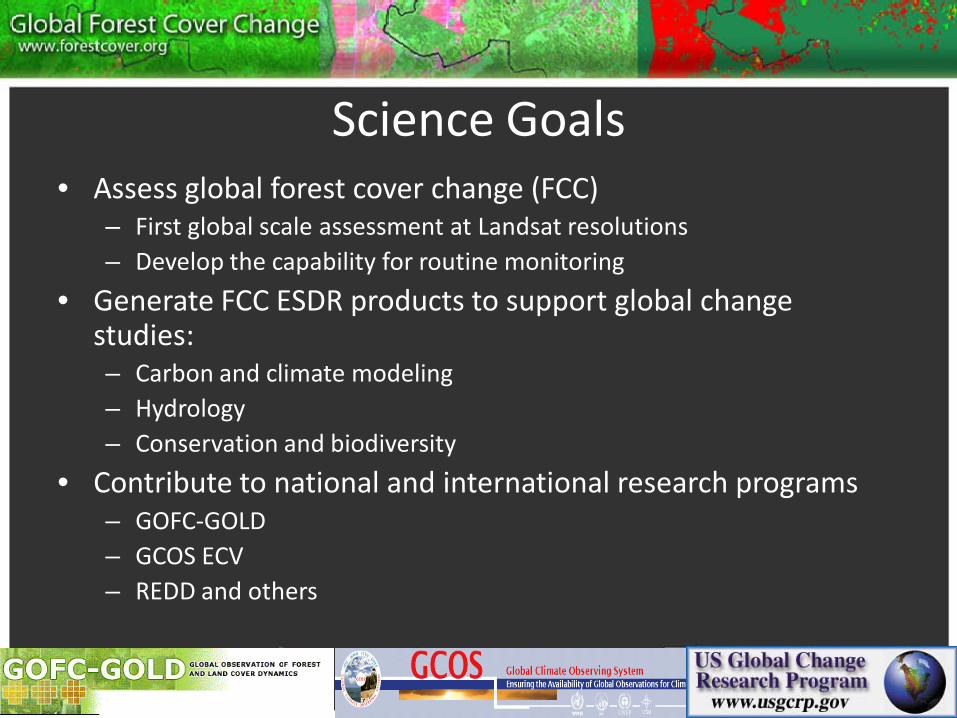
Science Goals• Assess global forest cover change (FCC)
– First global scale assessment at Landsat resolutions– Develop the capability for routine monitoring
• Generate FCC ESDR products to support global change studies:– Carbon and climate modeling– Hydrology– Conservation and biodiversity
• Contribute to national and international research programs– GOFC-GOLD – GCOS ECV– REDD and others
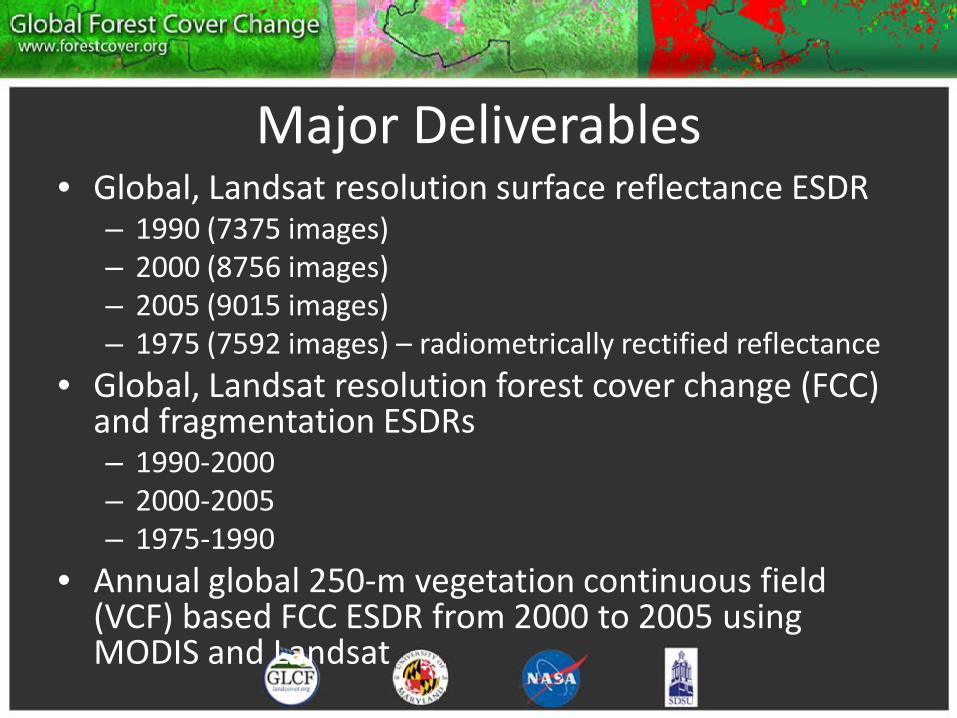
Major Deliverables• Global, Landsat resolution surface reflectance ESDR
– 1990 (7375 images)– 2000 (8756 images)– 2005 (9015 images)– 1975 (7592 images) – radiometrically rectified reflectance
• Global, Landsat resolution forest cover change (FCC) and fragmentation ESDRs – 1990-2000– 2000-2005– 1975-1990
• Annual global 250-m vegetation continuous field (VCF) based FCC ESDR from 2000 to 2005 using MODIS and Landsat
Research Team• UMD Team
– John Townshend (PI)– Samuel Goward– Chengquan Huang– Saurabh Channan– Min Feng (IGSNRR, China)– Joseph Sexton– Raghuram Narasimhan– Students
• DoHyung Kim• Alex Shatalin• Danxia Song• Kuan Song• Xiaopeng Song• Guangxiao Zhang
• NASA/GSFC Team– Jeff Masek– Compton Tucker– Robert Wolfe– Feng Gao– Eric Vermote– Bin Tan– Greg Ederer
• SDSU Team– Matt Hansen– Peter Potapov
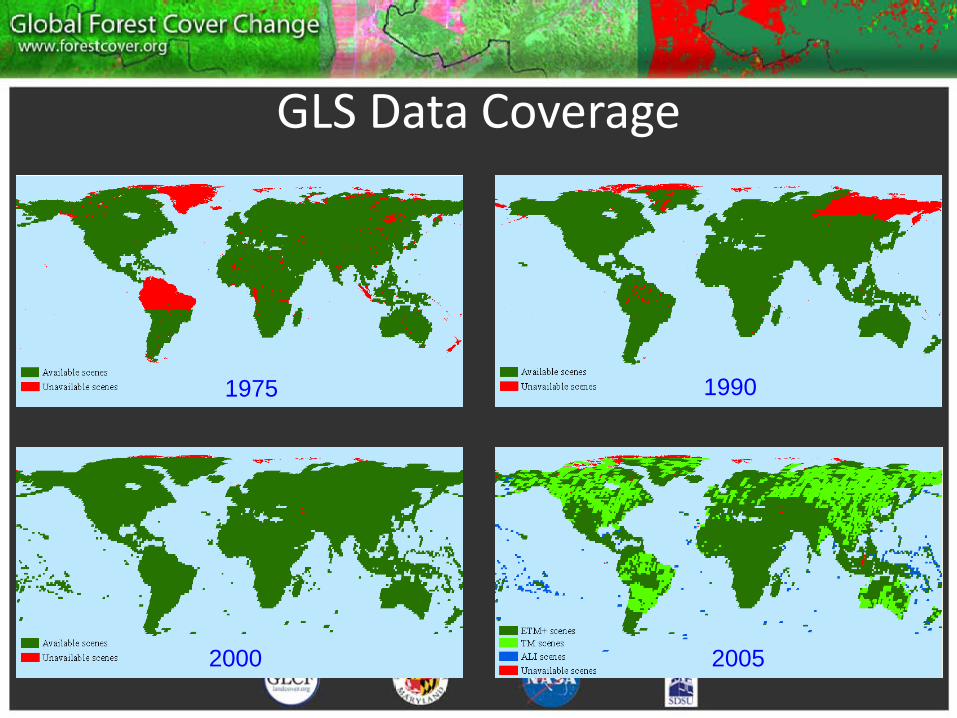
GLS Data Coverage
1975
20052000
1990
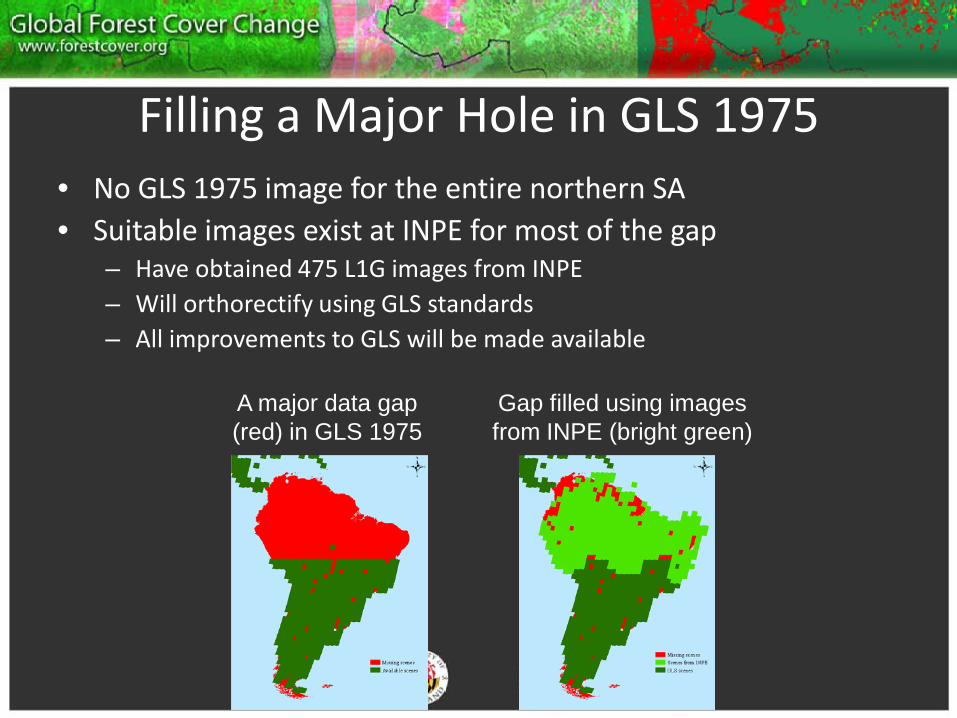
Filling a Major Hole in GLS 1975• No GLS 1975 image for the entire northern SA• Suitable images exist at INPE for most of the gap
– Have obtained 475 L1G images from INPE– Will orthorectify using GLS standards– All improvements to GLS will be made available
A major data gap (red) in GLS 1975
Gap filled using images from INPE (bright green)
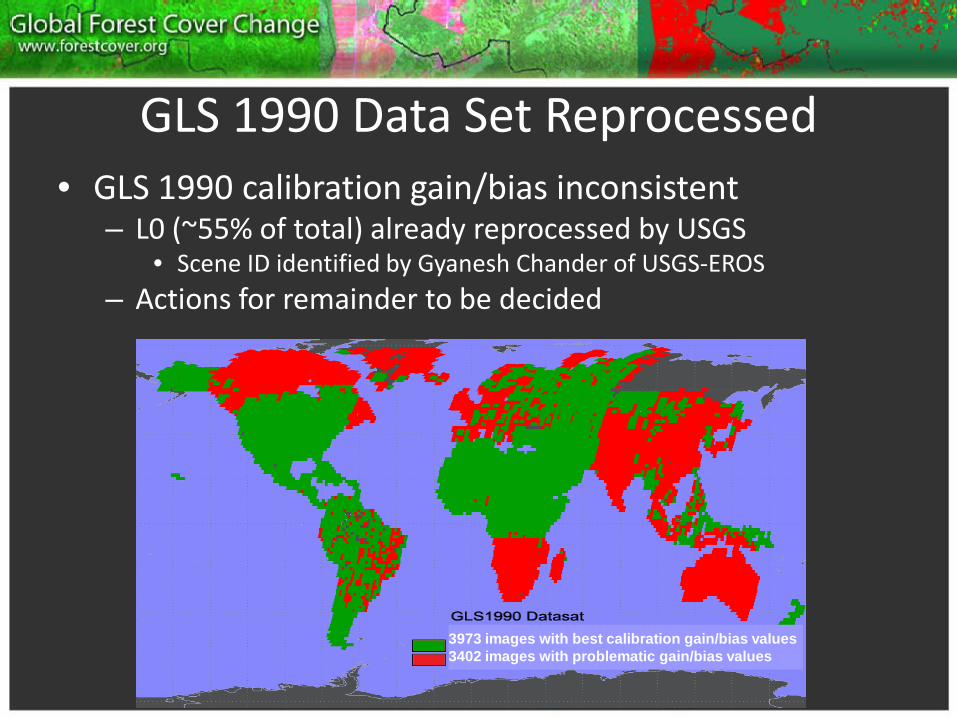
GLS 1990 Data Set Reprocessed• GLS 1990 calibration gain/bias inconsistent
– L0 (~55% of total) already reprocessed by USGS • Scene ID identified by Gyanesh Chander of USGS-EROS
– Actions for remainder to be decided
3973 images with best calibration gain/bias values3402 images with problematic gain/bias values
Products for Special Groups
• Products for modelers– ESDR products will be aggregated from the fine resolution and the 250
m FCC products to 250 m, 500 m, 1 km, and 0.05° grids
• Products for the conservation/biodiversity community– Fragmentation products derived from the fine resolution FCC products – Subsets of the above products for forested protected areas (PA) of the
world and their buffer zones• PA defined according to the World Database on Protected Areas (WDPA,
UNEP-WCMC)
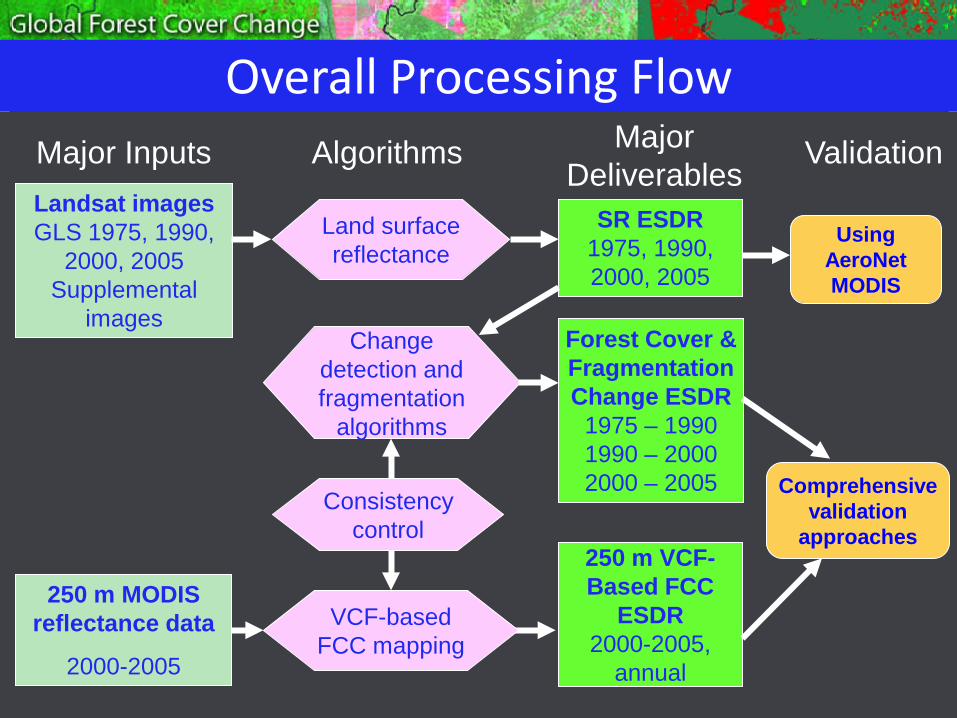
Overall Processing Flow
250 m MODIS reflectance data
2000-2005
250 m VCF-Based FCC
ESDR2000-2005,
annual
Landsat imagesGLS 1975, 1990,
2000, 2005Supplemental
images
SR ESDR1975, 1990, 2000, 2005
Change detection and fragmentation
algorithms
Land surface reflectance
Forest Cover & Fragmentation Change ESDR
1975 – 19901990 – 20002000 – 2005
VCF-based FCC mapping
Consistency control
Using AeroNet MODIS
Comprehensive validation
approaches
Major Inputs Algorithms Major Deliverables
Validation
Key Requirements for ESDR Algorithms• Automation
– Need to push through ~33,000 Landsat images
• Comprehensive quality assessment– Operational QA– Comparison with existing products– Accuracy assessment
• Refinement and reprocessing– Refinements needed to incorporate lessons learned– Existing computing capacity allows multiple reprocessing for all 4
epochs• Reprocessing global SR takes two months• Reprocessing global FCC takes three months• Additional capability at GSFC-LEDAPS
Why a Landsat Surface Reflectance ESDR?
• More consistent imagery for mapping change
• Improved cross-sensor algorithms using common radiometric basis (e.g. MODIS, Landsat)
• Better integration with ground-measured reflectance (e.g. spectral endmembers) and canopy reflectance models to support biophysical products
11
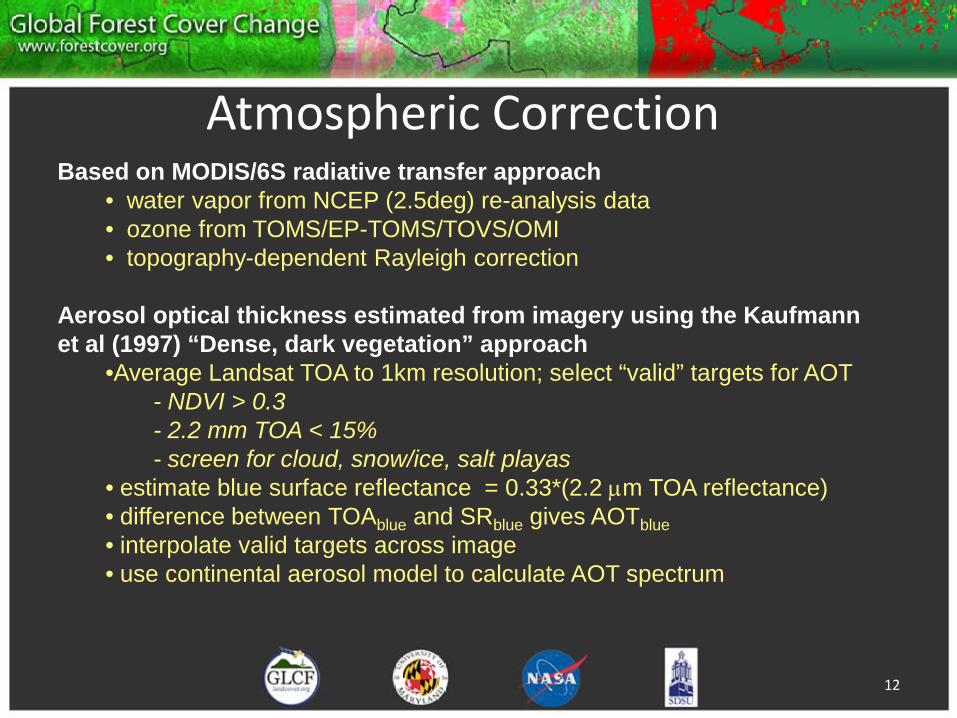
Atmospheric Correction
12
Based on MODIS/6S radiative transfer approach• water vapor from NCEP (2.5deg) re-analysis data• ozone from TOMS/EP-TOMS/TOVS/OMI• topography-dependent Rayleigh correction
Aerosol optical thickness estimated from imagery using the Kaufmann et al (1997) “Dense, dark vegetation” approach
•Average Landsat TOA to 1km resolution; select “valid” targets for AOT- NDVI > 0.3- 2.2 mm TOA < 15%- screen for cloud, snow/ice, salt playas
• estimate blue surface reflectance = 0.33*(2.2 µm TOA reflectance)• difference between TOAblue and SRblue gives AOTblue• interpolate valid targets across image• use continental aerosol model to calculate AOT spectrum
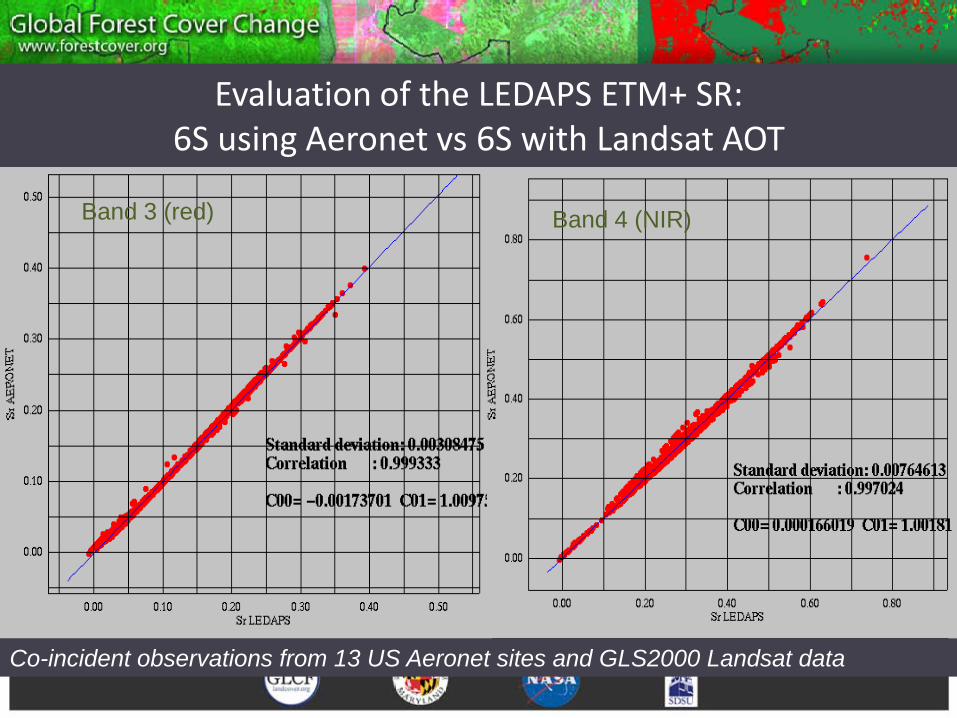
Evaluation of the LEDAPS ETM+ SR:6S using Aeronet vs 6S with Landsat AOT
Band 3 (red) Band 4 (NIR)
Co-incident observations from 13 US Aeronet sites and GLS2000 Landsat data
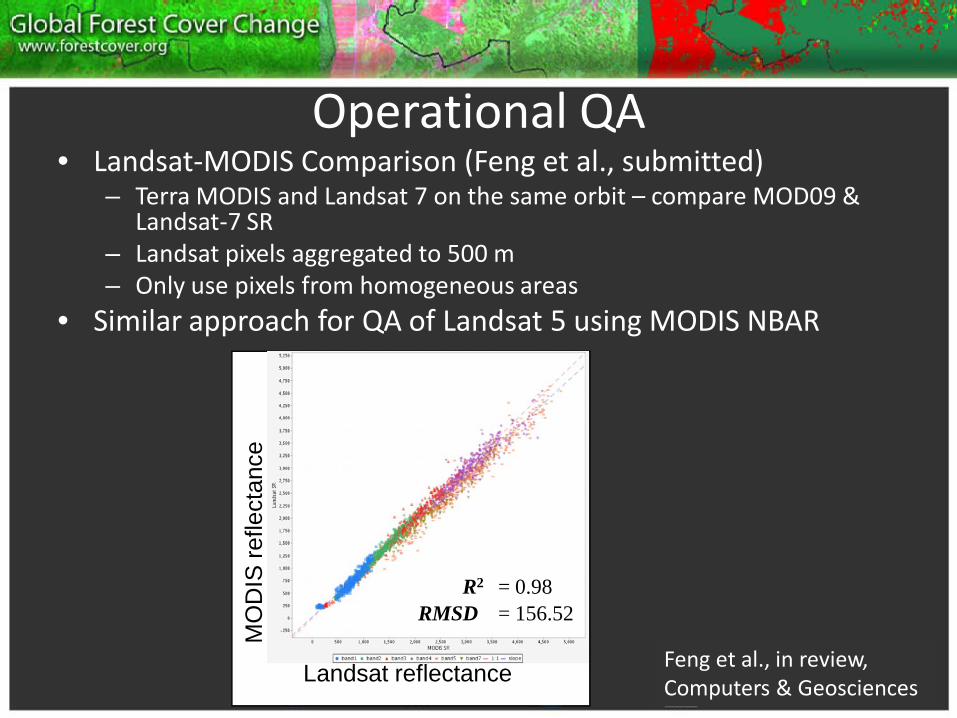
Operational QA• Landsat-MODIS Comparison (Feng et al., submitted)
– Terra MODIS and Landsat 7 on the same orbit – compare MOD09 & Landsat-7 SR
– Landsat pixels aggregated to 500 m– Only use pixels from homogeneous areas
• Similar approach for QA of Landsat 5 using MODIS NBAR
Landsat reflectance
MO
DIS
refle
ctan
ce
R2 = 0.98RMSD = 156.52
Feng et al., in review, Computers & Geosciences
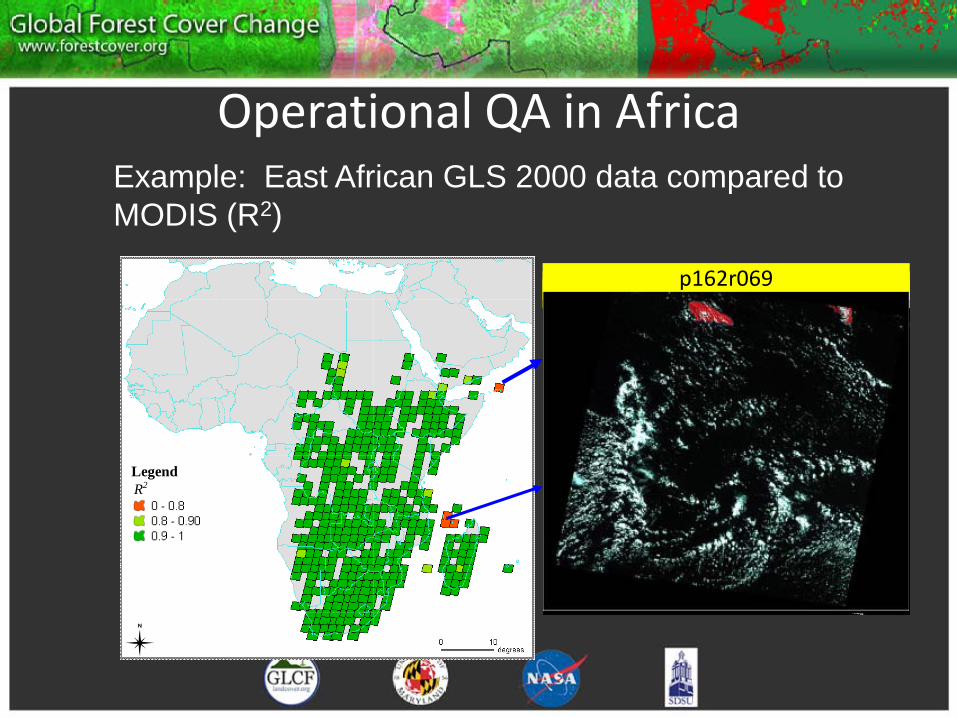
Operational QA in AfricaExample: East African GLS 2000 data compared to MODIS (R2)
LegendR2
p159r051p159r051p162r069
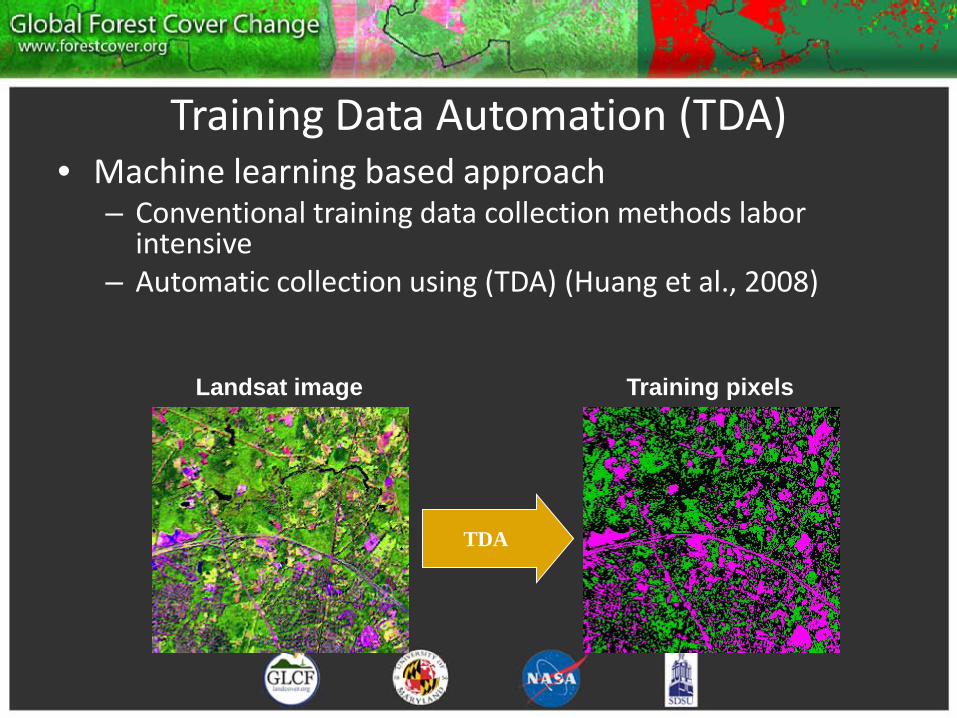
Training Data Automation (TDA)• Machine learning based approach
– Conventional training data collection methods labor intensive
– Automatic collection using (TDA) (Huang et al., 2008)
TDA
Landsat image Training pixels
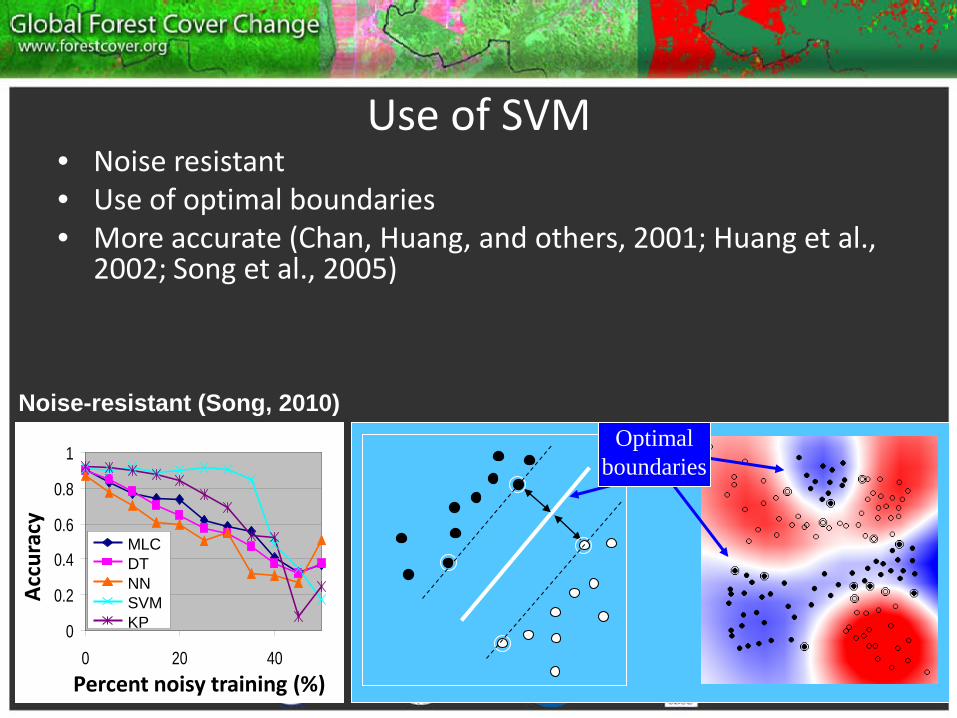
Use of SVM• Noise resistant• Use of optimal boundaries• More accurate (Chan, Huang, and others, 2001; Huang et al.,
2002; Song et al., 2005)
Optimal boundaries
Noise-resistant (Song, 2010)
0
0.2
0.4
0.6
0.8
1
0 20 40
MLCDTNNSVMKP
Percent noisy training (%)
Acc
urac
y
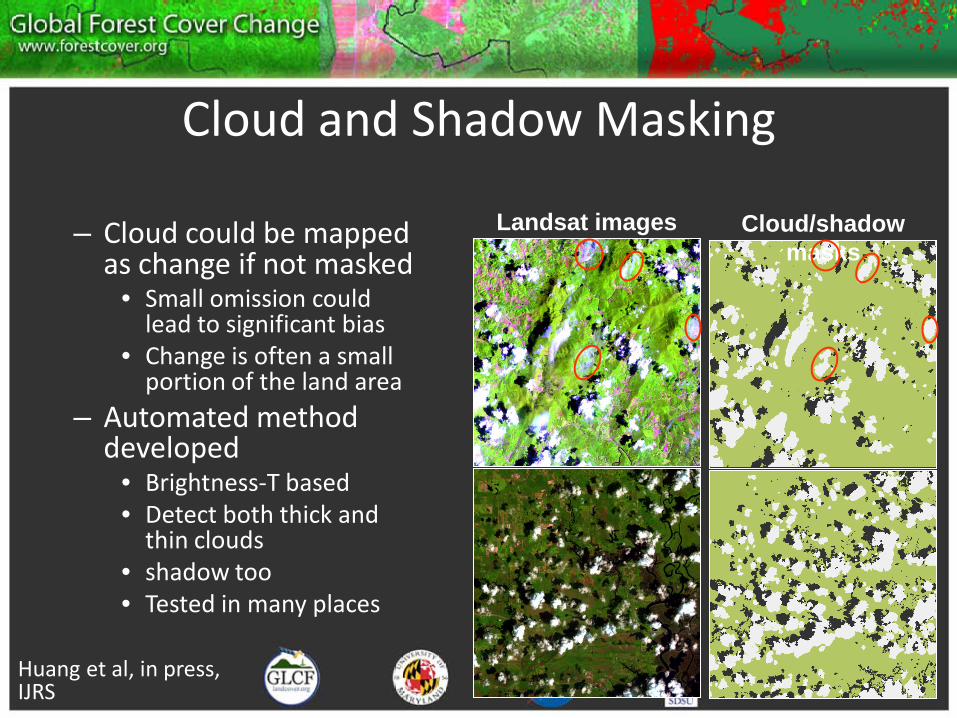
Cloud and Shadow Masking
– Cloud could be mapped as change if not masked
• Small omission could lead to significant bias
• Change is often a small portion of the land area
– Automated method developed
• Brightness-T based• Detect both thick and
thin clouds• shadow too• Tested in many places
Cloud/shadow masks
Landsat images
Huang et al, in press, IJRS
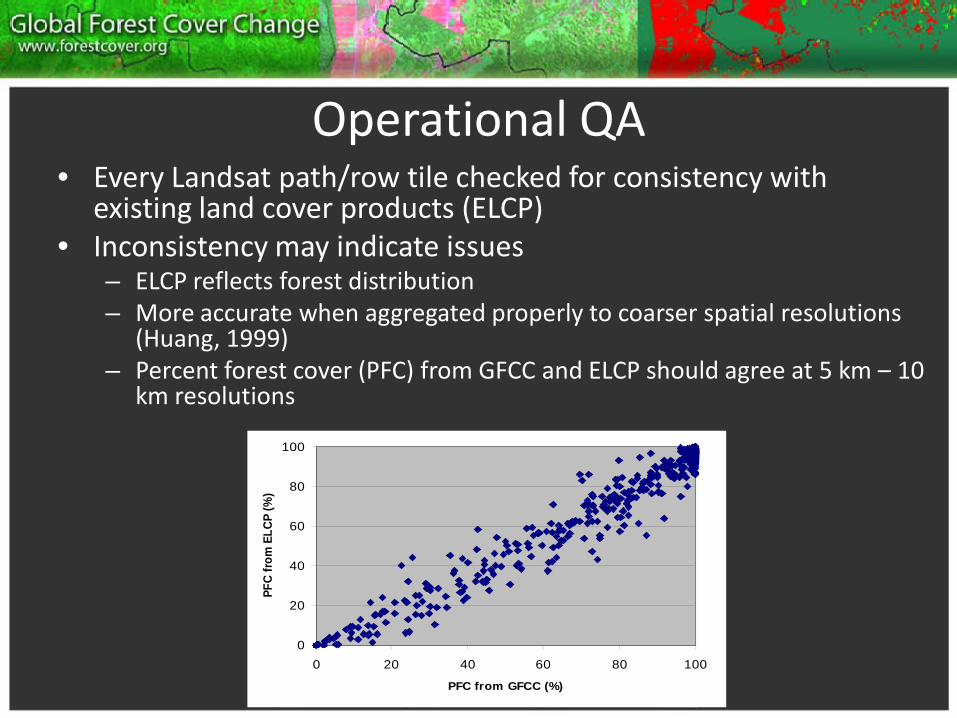
Operational QA• Every Landsat path/row tile checked for consistency with
existing land cover products (ELCP) • Inconsistency may indicate issues
– ELCP reflects forest distribution– More accurate when aggregated properly to coarser spatial resolutions
(Huang, 1999)– Percent forest cover (PFC) from GFCC and ELCP should agree at 5 km – 10
km resolutions
0
20
40
60
80
100
0 20 40 60 80 100
PFC from GFCC (%)
PFC
from
ELC
P (%
)
Accuracy Assessment• Most comprehensive accuracy assessment at the global scale
– Unbiased accuracy estimates needed for quantifying uncertainty
• Previous reference data collection methods inadequate– Unbiased results require probability sampling design – Reference data often not available at sample locations
• Developed web-based forest change labeling tool for reference data collection– Reference data can be collected at any sample location– Very efficient– Allow probability sampling design and hence unbiased accuracy
estimates at global and regional scales
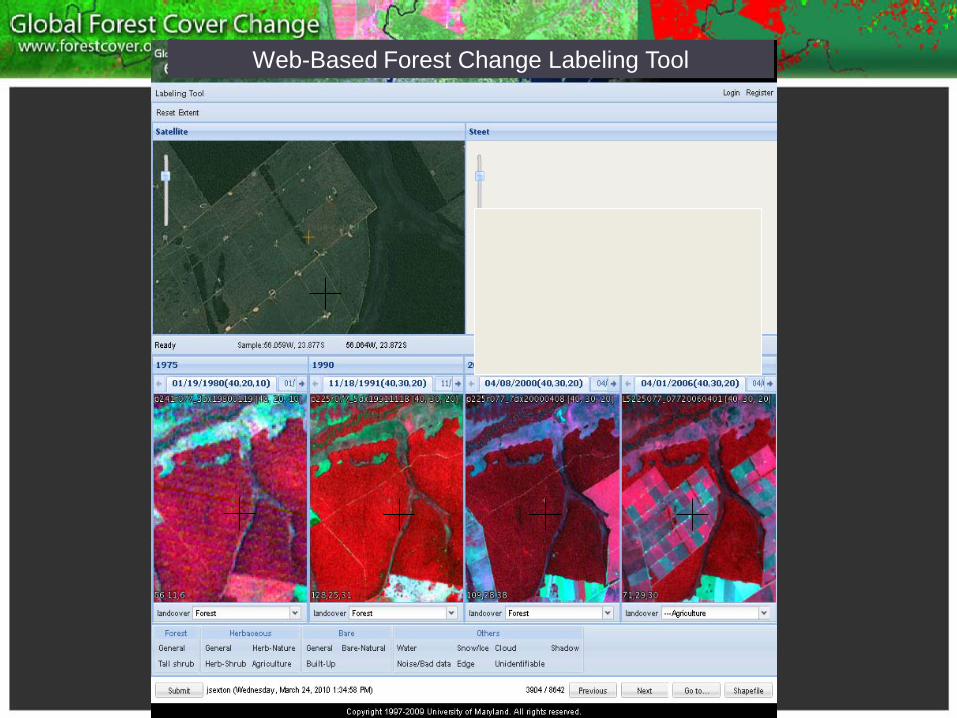
Web-Based Forest Change Labeling Tool
FCC ESDR Processing Plan• 2000-2005 global processing in process• Product generation schedule for version 1
(ending date)– FCC 1990-2000 (9/11)– FCC 2000-2005 (9/11)– FCC 1975-1990 (3/12)
– Major reprocessing after 3/12 for version 2• Incorporating algorithm refinements
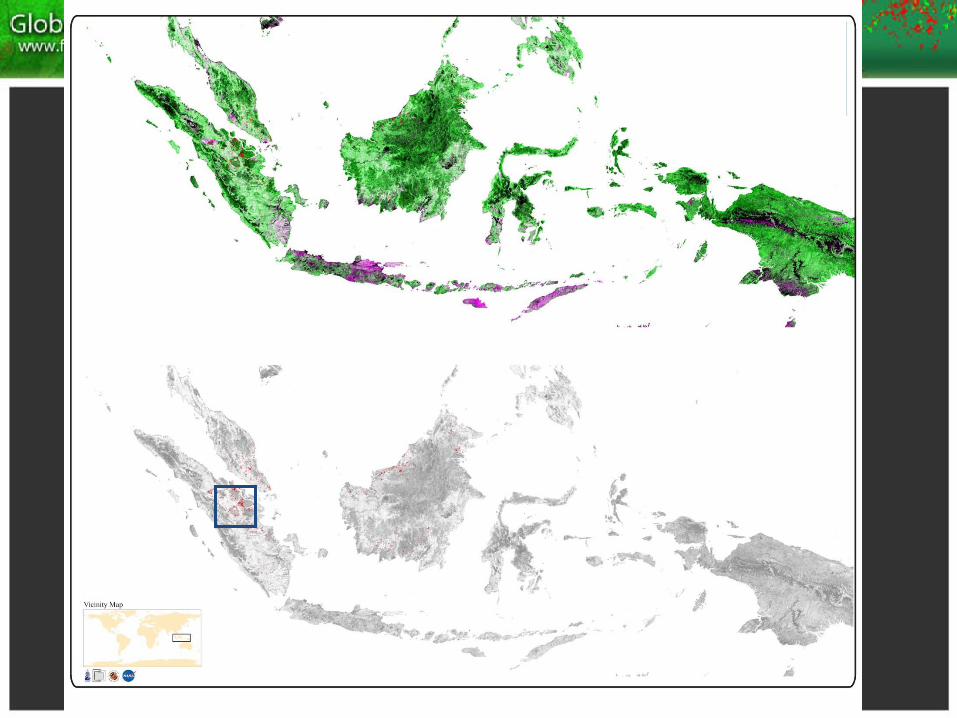
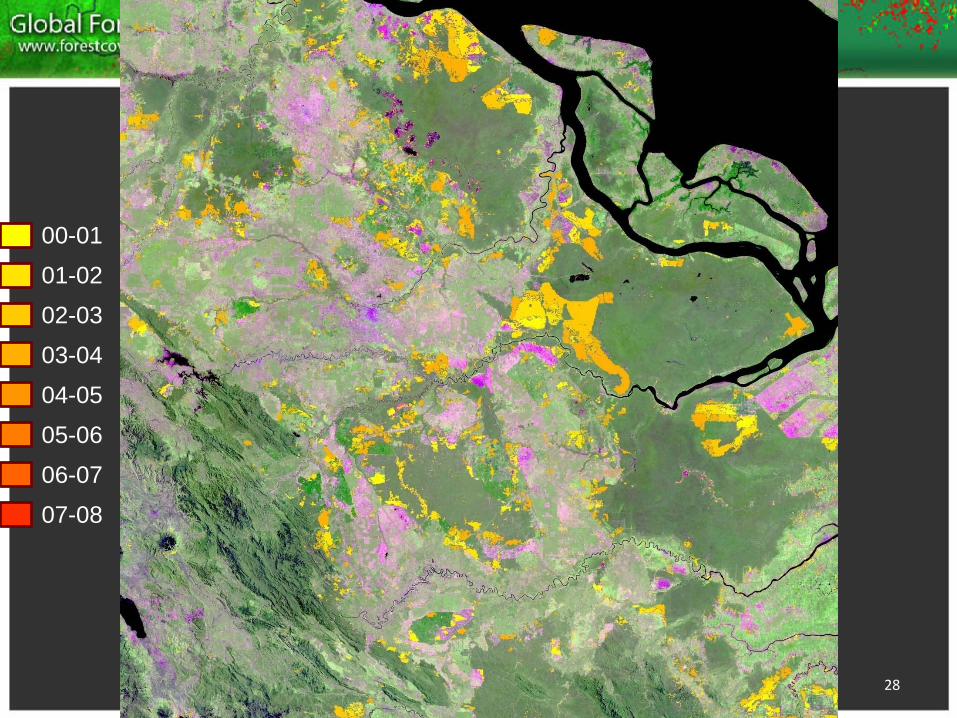
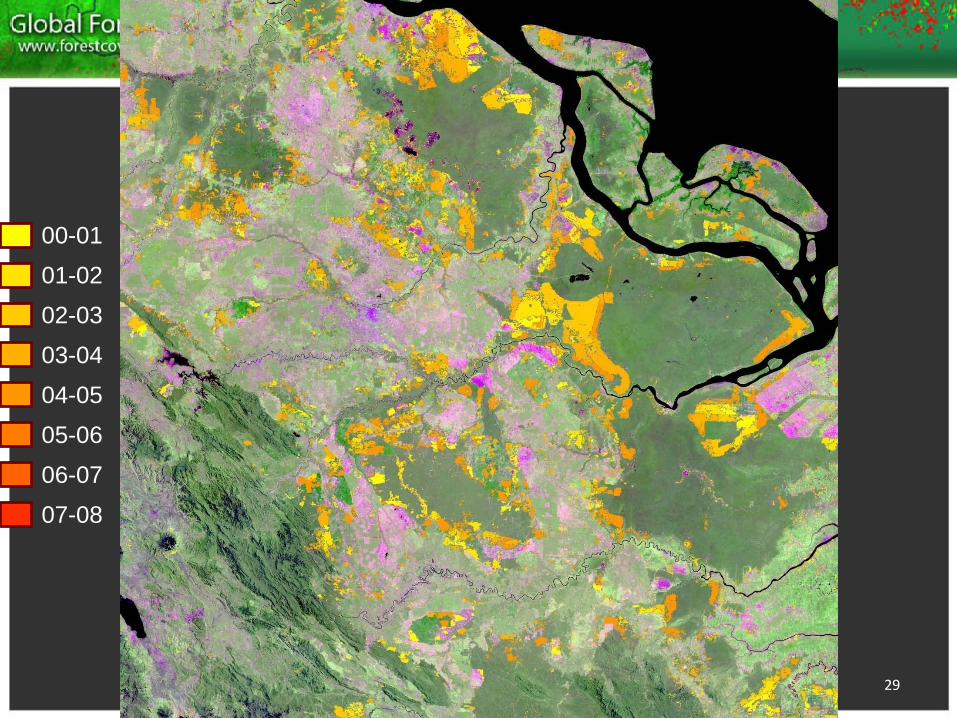
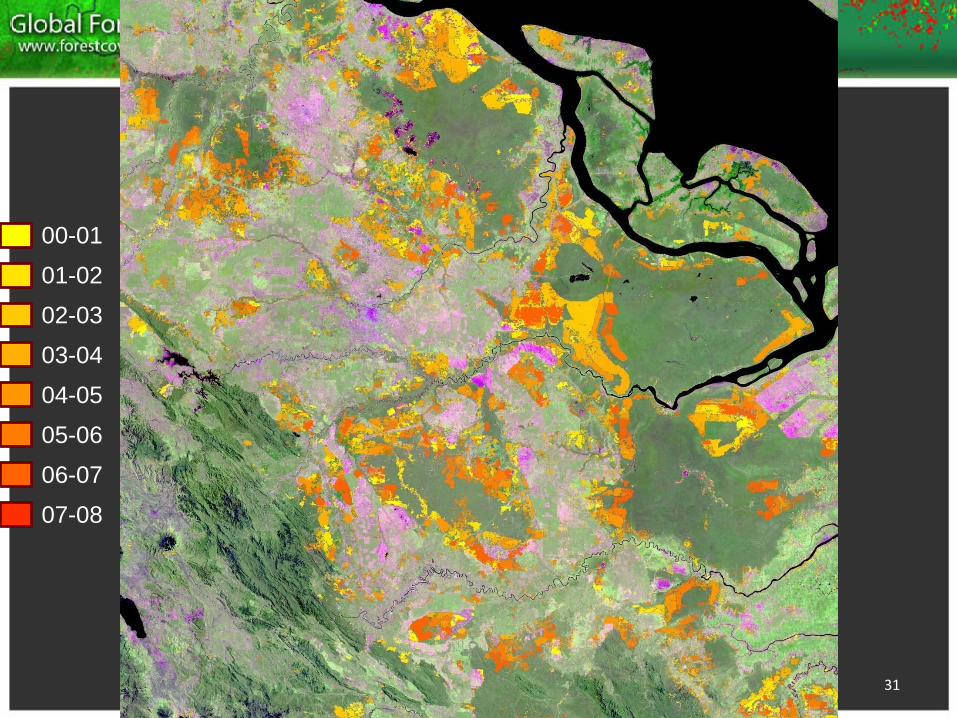
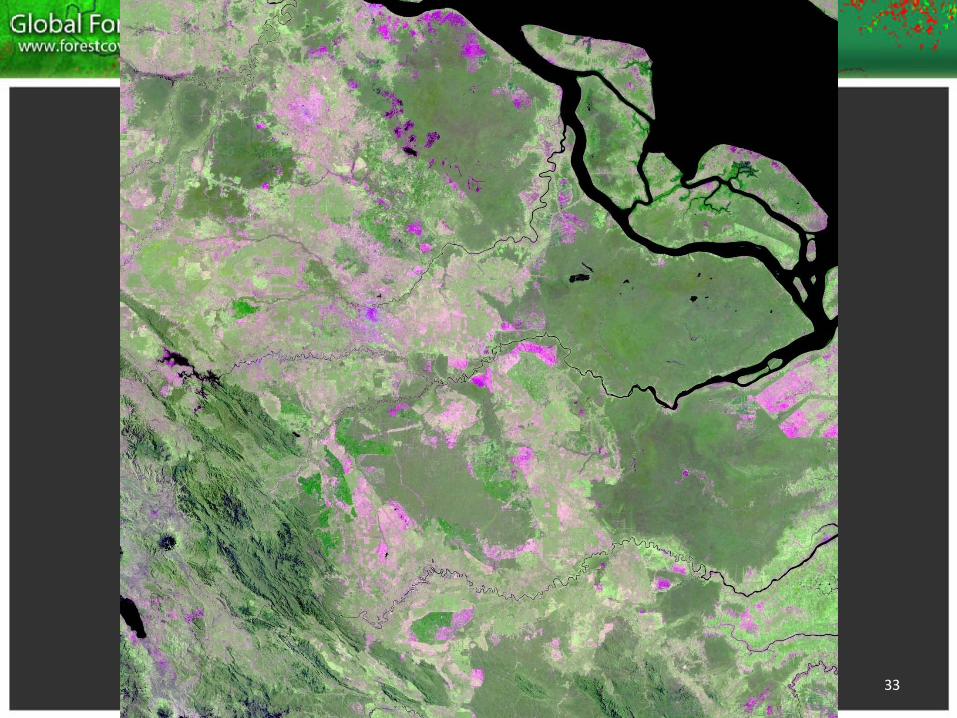
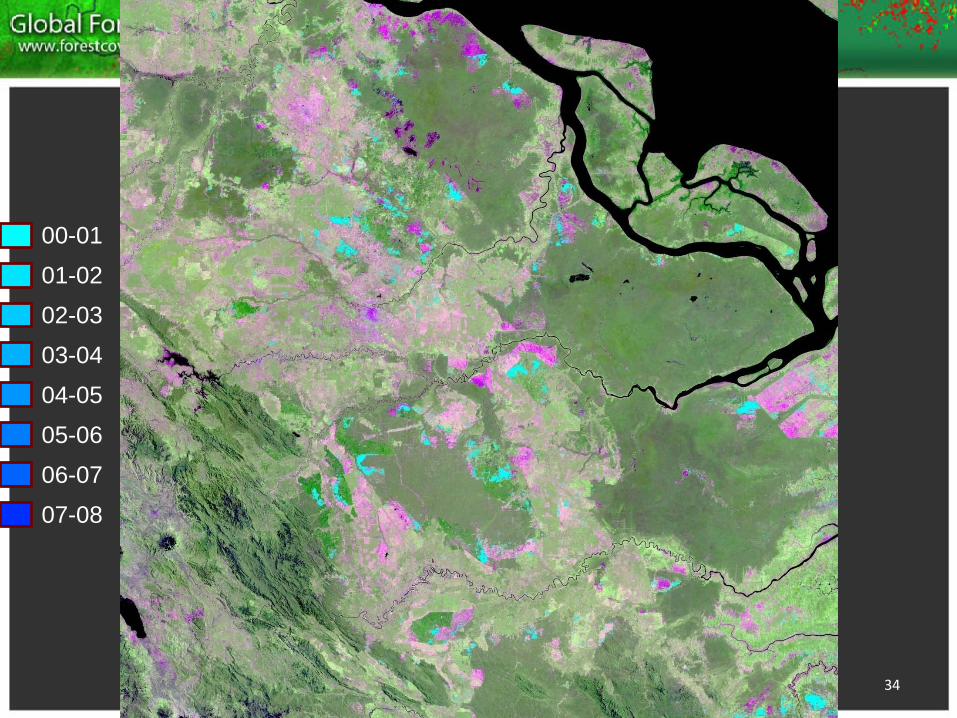
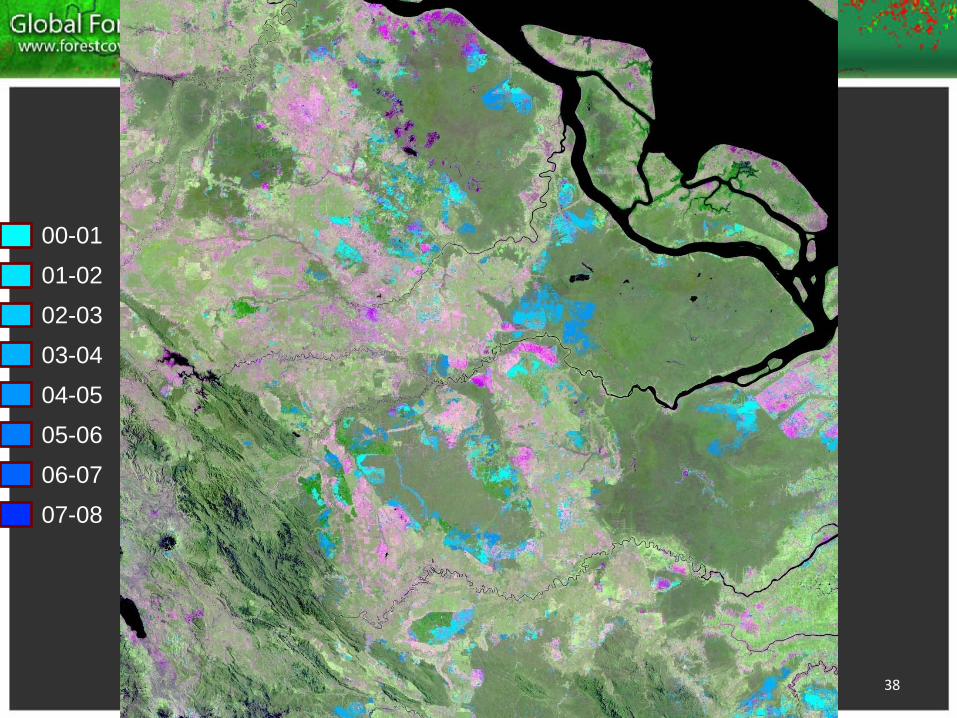
Forest Change in Insular Southeast Asia

24
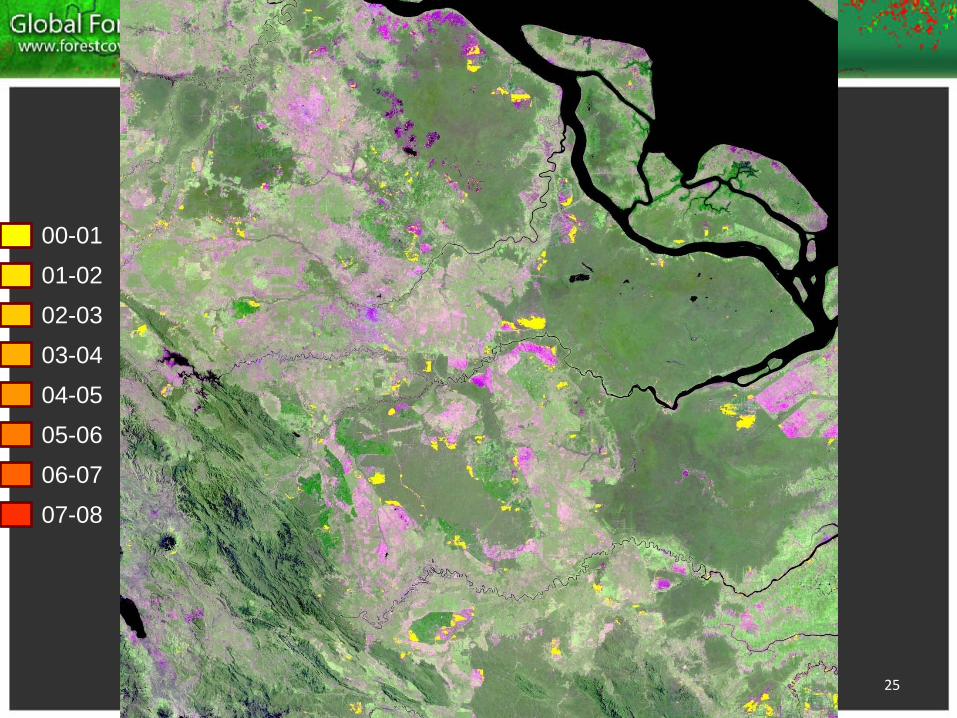
25
00-01
01-02
02-03
03-04
04-05
05-06
06-07
07-08
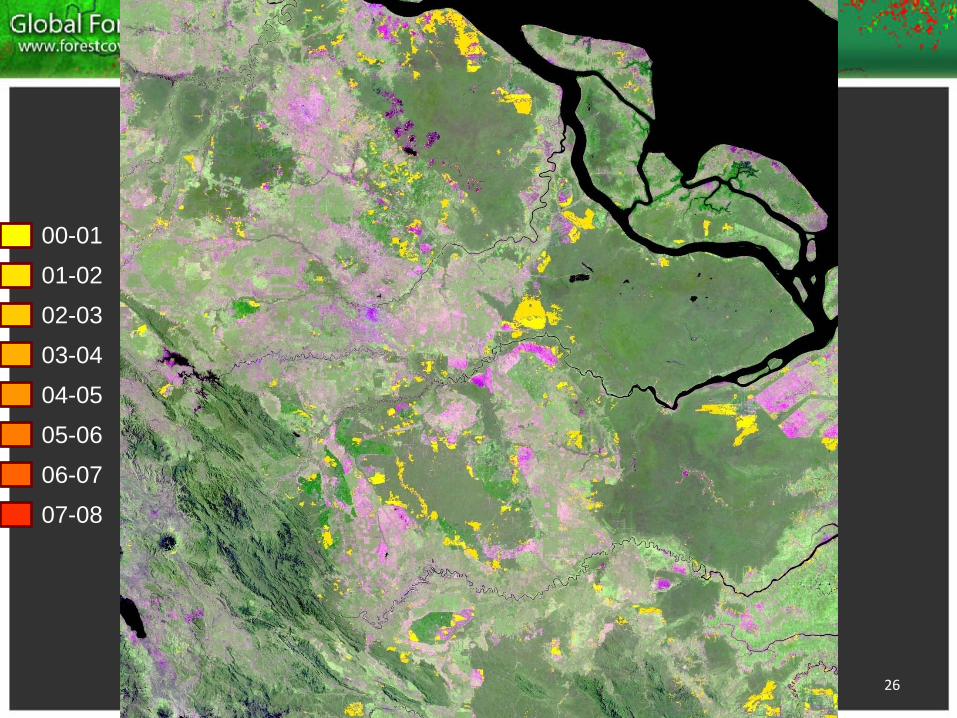
26
00-01
01-02
02-03
03-04
04-05
05-06
06-07
07-08
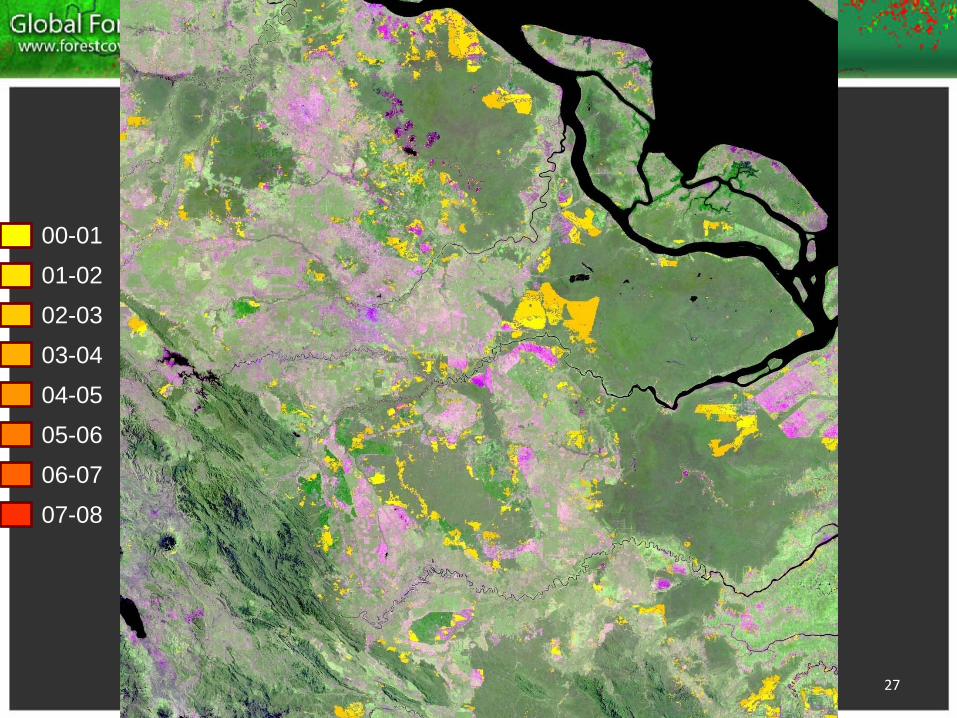
27
00-01
01-02
02-03
03-04
04-05
05-06
06-07
07-08
28
00-01
01-02
02-03
03-04
04-05
05-06
06-07
07-08
29
00-01
01-02
02-03
03-04
04-05
05-06
06-07
07-08

30
00-01
01-02
02-03
03-04
04-05
05-06
06-07
07-08
31
00-01
01-02
02-03
03-04
04-05
05-06
06-07
07-08
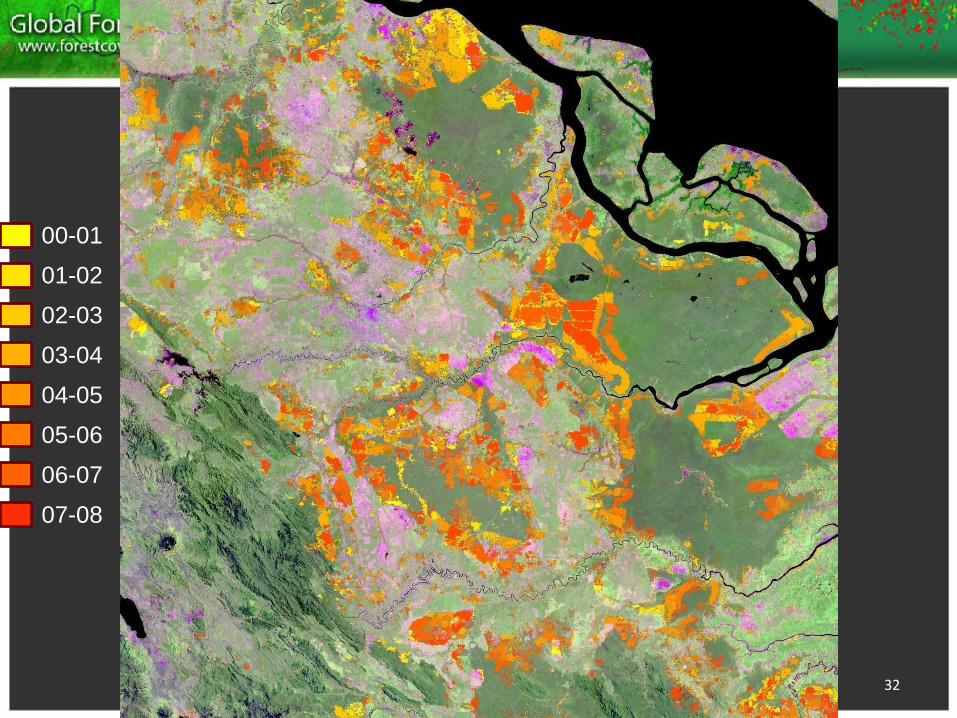
32
00-01
01-02
02-03
03-04
04-05
05-06
06-07
07-08
33
34
00-01
01-02
02-03
03-04
04-05
05-06
06-07
07-08

35
00-01
01-02
02-03
03-04
04-05
05-06
06-07
07-08

36
00-01
01-02
02-03
03-04
04-05
05-06
06-07
07-08

37
00-01
01-02
02-03
03-04
04-05
05-06
06-07
07-08
38
00-01
01-02
02-03
03-04
04-05
05-06
06-07
07-08
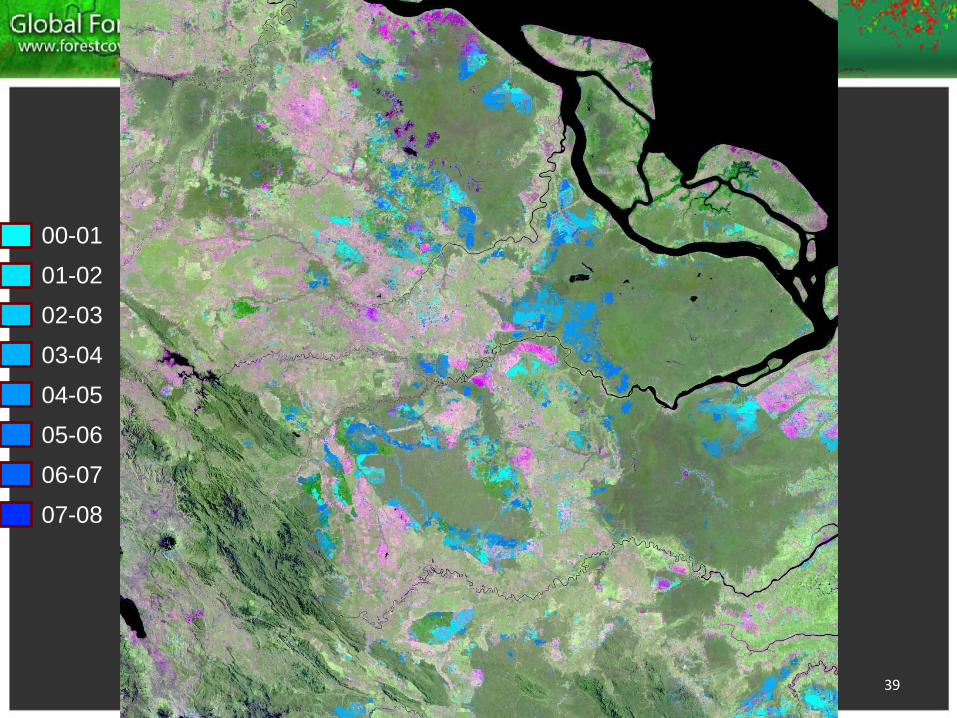
39
00-01
01-02
02-03
03-04
04-05
05-06
06-07
07-08
40
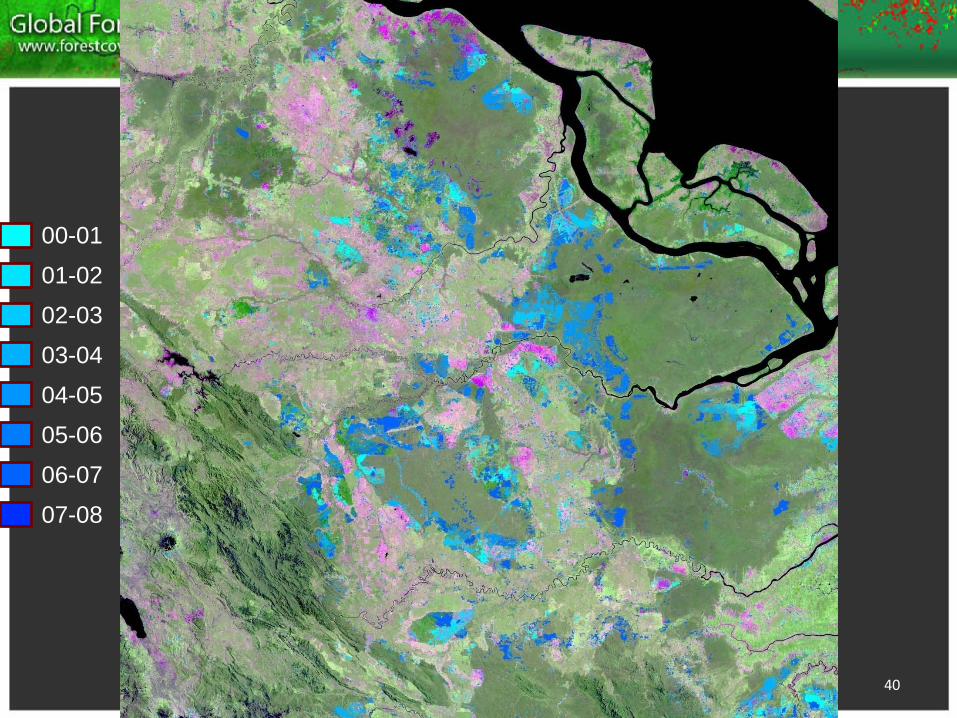
00-01
01-02
02-03
03-04
04-05
05-06
06-07
07-08
41
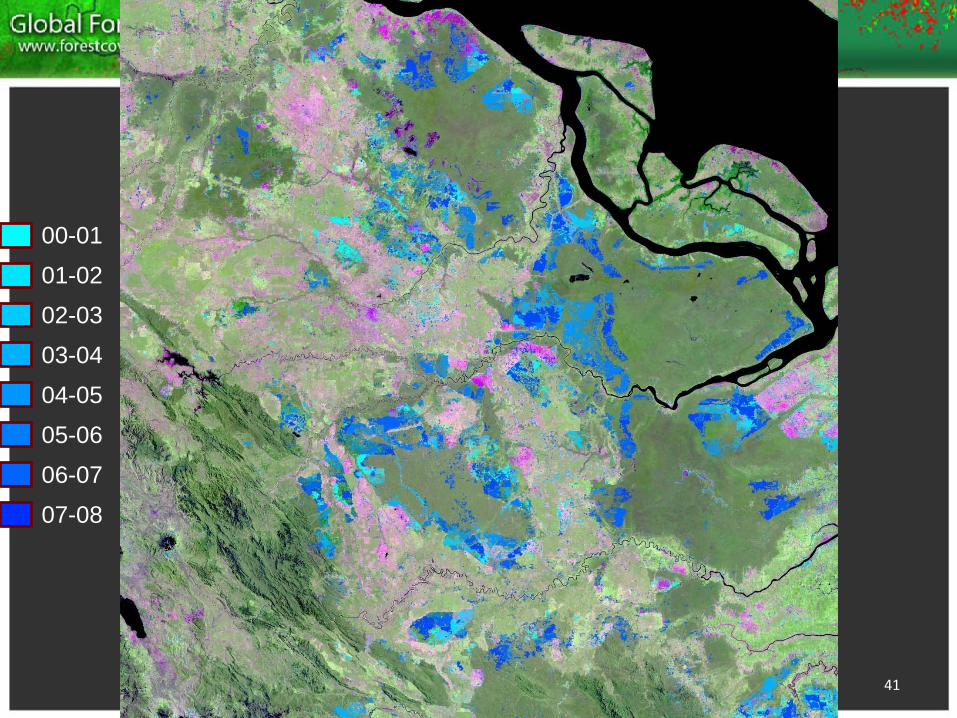
00-01
01-02
02-03
03-04
04-05
05-06
06-07
07-08
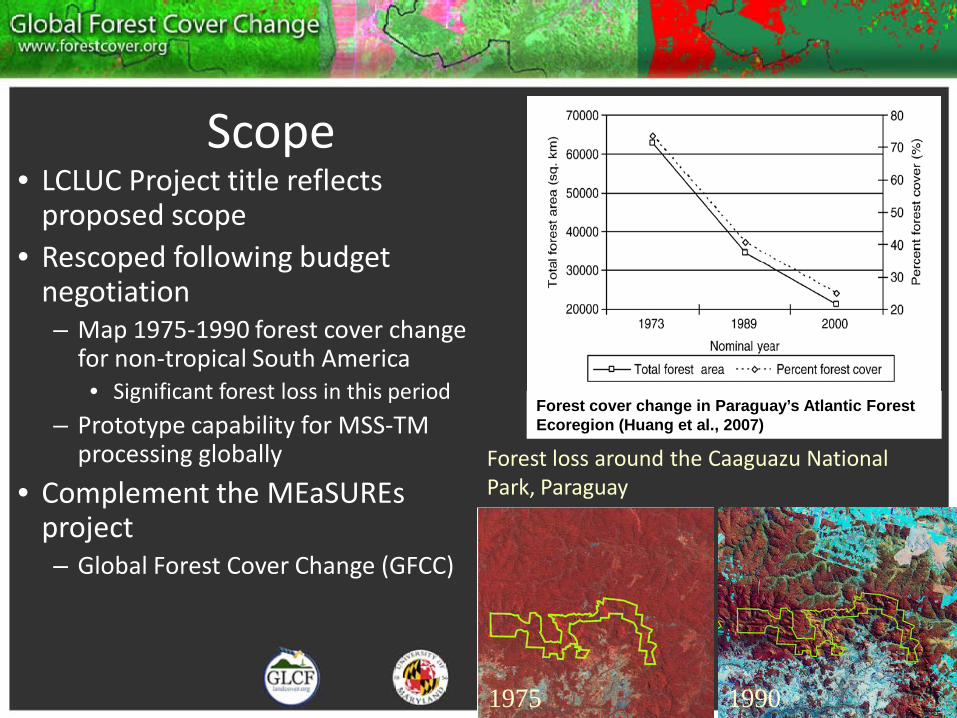
Scope• LCLUC Project title reflects
proposed scope• Rescoped following budget
negotiation– Map 1975-1990 forest cover change
for non-tropical South America• Significant forest loss in this period
– Prototype capability for MSS-TM processing globally
• Complement the MEaSUREs project– Global Forest Cover Change (GFCC)
Forest cover change in Paraguay’s Atlantic Forest Ecoregion (Huang et al., 2007)
1975 1990
Forest loss around the Caaguazu National Park, Paraguay
Relationship to Other NASA Projects
• Originally planned to supply surface reflectance products to other groups earlier– Delay in GLS delivery has hindered this
• Requesting other NASA LCLUC projects to supply results to assist validation
• Validation data will be made available, e.g., through GOFC-GOLD
43
Credits
• Recent N. American Forest Dynamics via integration of ASTER, MODIS and Landsat Reflectance Data (NNH06ZDA001N-EOS, 2006)
• Three Decades of Forest Cover Change in the Americas Evaluated Using the GeoCover and MDGLS Data Sets (NNH07ZDA001N-LCLUC, 2007)
• Enhanced Land Cover Products from MODIS: Vegetation Continuous Fields Maintenance and Refinements (NNH06ZDA001N-EOS, 2006)
• Congo Basin Forest Monitoring Using Satellites for CARPE 4 (NNX09AD26G)
• Producing Composite Imagery And Forest Cover And Change Characterizations For The Humid Tropics - A Contribution To The MDGLS Activity (NNH07ZDA001N-LCLUC, 2007)
• Web-enabled Landsat data (WELD) - a consistent seamless near real time MODIS-Landsat data fusion for the terrestrial user community (NNH06ZDA001N-MEaSUREs)
• Establishing a Global Forest Monitoring Capability Using Multi-Resolution and Multi-Temporal Remotely Sensed Data Sets (NNG06GD95G)
The Earth Science Data Records of Global Forest Cover Change project is funded by the MEaSUREs program (NNH06ZDA001N-MEaSUREs).
Other Related NASA Support include:
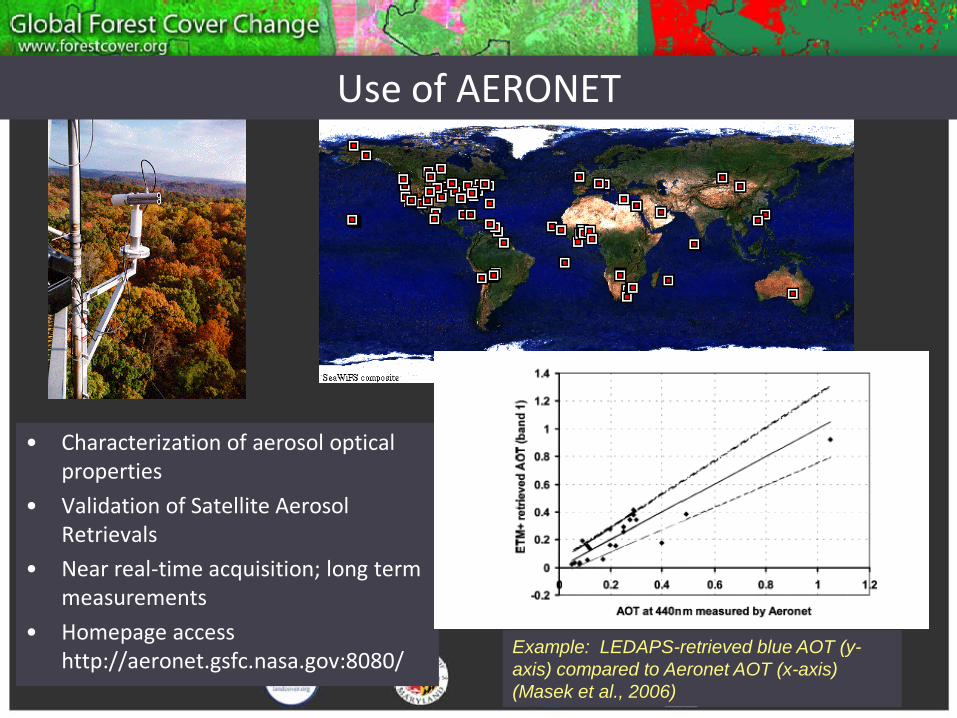
• Characterization of aerosol optical properties
• Validation of Satellite Aerosol Retrievals
• Near real-time acquisition; long term measurements
• Homepage access http://aeronet.gsfc.nasa.gov:8080/
Example: LEDAPS-retrieved blue AOT (y-axis) compared to Aeronet AOT (x-axis) (Masek et al., 2006)
Use of AERONET
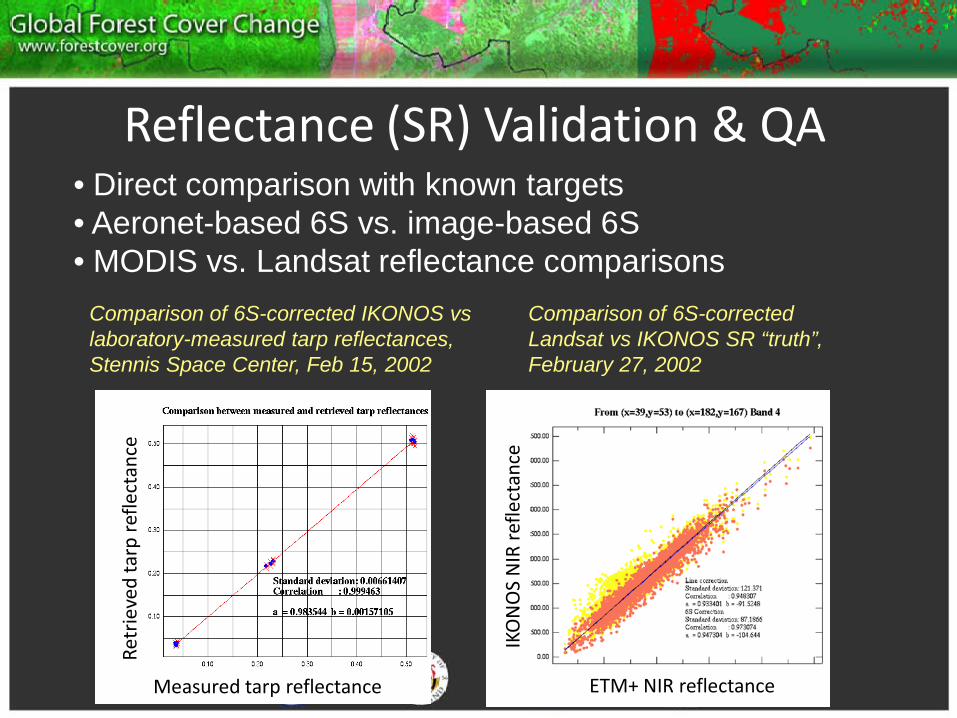
Reflectance (SR) Validation & QA• Direct comparison with known targets• Aeronet-based 6S vs. image-based 6S• MODIS vs. Landsat reflectance comparisons
Comparison of 6S-corrected IKONOS vs laboratory-measured tarp reflectances, Stennis Space Center, Feb 15, 2002
Comparison of 6S-corrected Landsat vs IKONOS SR “truth”, February 27, 2002
Measured tarp reflectance
Retr
ieve
d ta
rp re
flect
ance
ETM+ NIR reflectance
IKO
NO
S N
IR r
efle
ctan
ce