Embed Size (px)
Citation preview
ORIGINAL PAPER
Threshold to maturity in a long-lived reptile: interactionsof age, size, and growth
Karen A. Bjorndal • Joe Parsons • Walter Mustin •
Alan B. Bolten
Received: 4 August 2012 / Accepted: 29 October 2012 / Published online: 13 November 2012
� Springer-Verlag Berlin Heidelberg 2012
Abstract Thresholds to sexual maturity—either age or
size—are critical life history parameters. Usually investi-
gated in short-lived organisms, these thresholds and inter-
actions among age, size, and growth are poorly known for
long-lived species. A 34-year study of captive green turtles
(Chelonia mydas) that followed individuals from hatching
to beyond maturity provided an opportunity to evaluate
these parameters in a long-lived species with late maturity.
Age and size at maturity are best predicted by linear growth
rate and mass growth rate, respectively. At maturity,
resource allocation shifts from growth to reproductive
output, regardless of nutrient availability or size at matu-
rity. Although captive turtles reach maturity at younger
ages than wild turtles, the extensive variation in captive
turtles under similar conditions provides important insights
into the variation that would exist in wild populations
experiencing stochastic conditions. Variation in age/size at
maturity should be incorporated into population models for
conservation and management planning.
Introduction
Age and size at sexual maturity are critical components of
life history studies because of their importance in deter-
mining an organism’s fitness (Stearns 1992; Roff 2002).
The timing of maturation involves classic life history trade-
offs that balance the fitness benefits of early maturation
(increased survival to first reproduction and decreased
generation time) and late maturation (increased body size
and enhanced size-mediated processes such as reproductive
output and competitive ability). Maturity is controlled by a
number of complex processes that are influenced by a
variety of factors, and the relative contributions of these
influences on age and size at maturity can vary consider-
ably among individuals in a population (Bernardo 1993).
The thresholds to maturation have been the subject of many
studies, particularly in exploited fish stocks in which age
and size at maturity change with exploitation intensity
and the size and maturity status of the fish being targeted
(Ernande et al. 2004; Dieckmann and Heino 2007).
Although most studies of maturity thresholds have focused
on age, size, and growth rates, other relevant phenotypic
traits, such as body condition, should be considered (Uusi-
Heikkila et al. 2011), as well as developmental processes
(Berner and Blanckenhorn 2007; Kingsolver et al. 2012)
because maturation rate does not necessarily follow the
same trajectory as somatic growth rate (Bernardo 1993).
Naturally, most experimental studies designed to
address maturation thresholds have involved organisms
with short maturation times (e.g., Uusi-Heikkila et al.
2011; Kingsolver et al. 2012). Our study explores variation
in age and size at maturity and in growth rates before and
after maturity in a long-lived species, the green turtle,
Chelonia mydas, under controlled conditions. Like most
species of sea turtles, green turtles in the wild reach
Communicated by R. Lewison.
Electronic supplementary material The online version of thisarticle (doi:10.1007/s00227-012-2116-1) contains supplementarymaterial, which is available to authorized users.
K. A. Bjorndal (&) � A. B. Bolten
Department of Biology, Archie Carr Center for Sea Turtle
Research, University of Florida, Gainesville, FL 32611, USA
e-mail: [email protected]
J. Parsons � W. Mustin
Cayman Turtle Farm, Grand Cayman KY1-1301,
Cayman Islands
123
Mar Biol (2013) 160:607–616
DOI 10.1007/s00227-012-2116-1
maturity after decades of relatively slow growth (Balazs
and Chaloupka 2004; Goshe et al. 2010).
In a study of how to improve population assessments of
sea turtle populations, the U.S. National Research Council
(2010) identified age at sexual maturity (AgeSM) as one of
the most serious data gaps in our knowledge of sea turtle
demography. In addition, the Turtle Expert Working Group
(TEWG 2009) concluded that time to maturity is a
parameter that needs to be estimated more rigorously to
realistically estimate extinction risk for sea turtles. Esti-
mation of AgeSM in sea turtles is challenging because of
their extensive movements during a protracted immature
period, and our inability to determine the age of live sea
turtles (Bjorndal et al. 2011).
Direct measures of AgeSM in sea turtles from marking
hatchlings in a manner that will remain at maturity are
quite rare (Bell et al. 2005; Limpus 2009). Most estimates
of AgeSM in sea turtles have been generated from growth
models based on capture-mark-recapture data (references
in Chaloupka and Musick 1997), skeletochronology (ref-
erences in Snover et al. 2007; Goshe et al. 2010), or length-
frequency analyses (Casale et al. 2011). Scott et al. (2012)
used a novel approach with Lagrangian-derived growth
estimates to estimate AgeSM in loggerhead sea turtles
(Caretta caretta). A limitation of these approaches is that
the length at sexual maturity (LengthSM) must be desig-
nated to calculate the time duration to grow from hatching
to sexual maturity. However, LengthSM in sea turtles
appears to be quite variable. Large variation in female body
size is characteristic of sea turtle nesting aggregations (e.g.,
Carr and Goodman 1970; Broderick et al. 2003), which
apparently results primarily from diversity in LengthSM
rather than growth post maturity, because growth after
maturity is usually negligible (Carr and Goodman 1970;
Bjorndal et al. 1983; Broderick et al. 2003; Price et al.
2004). Therefore, selection of an appropriate population-
wide LengthSM for estimating AgeSM is problematic.
Although several measures have been used, the most
common are the minimum and mean size of nesting
females (Snover et al. 2007; Goshe et al. 2010).
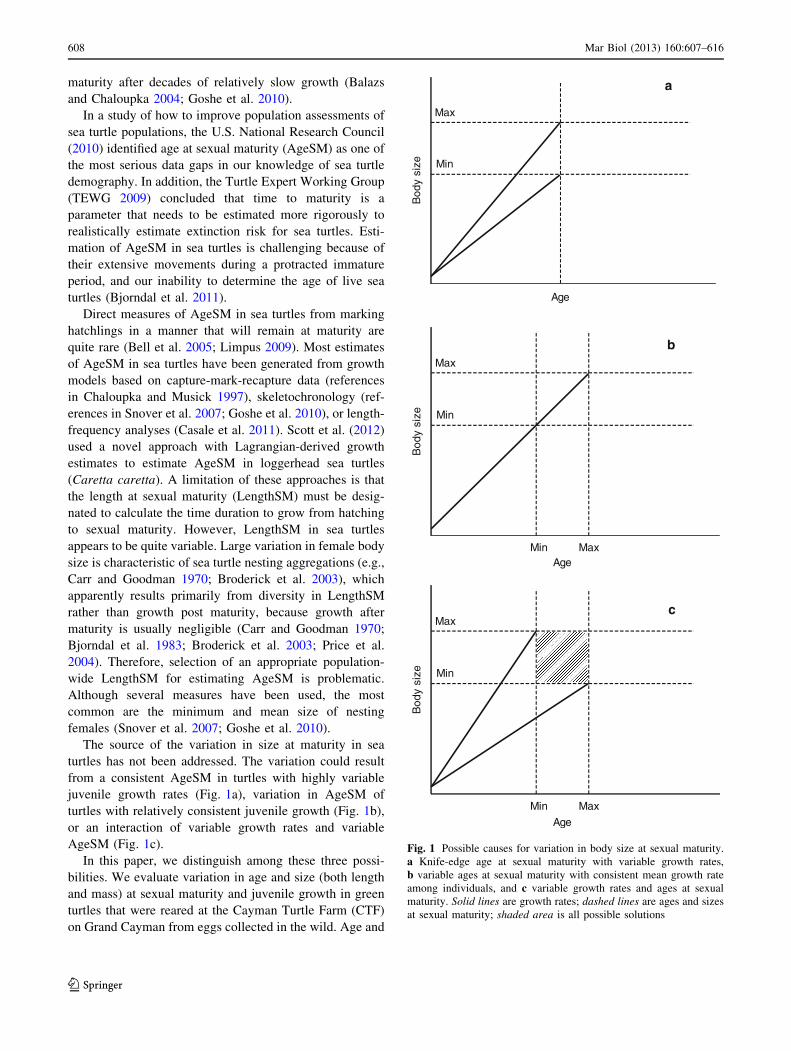
The source of the variation in size at maturity in sea
turtles has not been addressed. The variation could result
from a consistent AgeSM in turtles with highly variable
juvenile growth rates (Fig. 1a), variation in AgeSM of
turtles with relatively consistent juvenile growth (Fig. 1b),
or an interaction of variable growth rates and variable
AgeSM (Fig. 1c).
In this paper, we distinguish among these three possi-
bilities. We evaluate variation in age and size (both length
and mass) at sexual maturity and juvenile growth in green
turtles that were reared at the Cayman Turtle Farm (CTF)
on Grand Cayman from eggs collected in the wild. Age and
Age
Bod
y si
ze
Max
Min
Age
Bod
y si
ze
Max
Min
Min Max
Age
Bod
y si
ze
Max
Min
Min Max
b
a
c
Fig. 1 Possible causes for variation in body size at sexual maturity.
a Knife-edge age at sexual maturity with variable growth rates,
b variable ages at sexual maturity with consistent mean growth rate
among individuals, and c variable growth rates and ages at sexual
maturity. Solid lines are growth rates; dashed lines are ages and sizes
at sexual maturity; shaded area is all possible solutions
608 Mar Biol (2013) 160:607–616
123
size at sexual maturity are defined as age and size at first
oviposition. The turtles were fed a nutritionally balanced,
high-quality diet under the same conditions from hatching
to years past sexual maturity. Values of AgeSM in green
turtles at CTF cannot be used to estimate AgeSM in wild
turtles because nutrition affects AgeSM in sea turtles
(Bjorndal 1985). However, because the turtles were raised
in the same environmental conditions at CTF, we have a
unique opportunity to evaluate variation in age and size at
maturity and average growth rates to maturity and after
maturity in a long-lived species with delayed maturity from
data collected over 34 years. We also explore the sources
of the variation in age and size at maturity by assessing
interactions of age and size at sexual maturity, growth rates
prior to sexual maturity, growth rates post maturity, and
body condition at maturity. We evaluate the predictive
capacity of parameters for age and size at maturity.
Methods
Between 1968 and 1972, thousands of eggs were collected
from nesting beaches at Ascension Island, Suriname, and
Tortuguero, Costa Rica. The eggs were transported to CTF,
where they hatched. Our study is based on 47 female green
turtles of known age and source nesting population derived
from these eggs.
All turtles were fed a high protein, balanced diet and were
raised in group tanks under the same conditions. At a few
intervals during the juvenile period, the largest turtles from
these tanks were segregated into one group as future breeding
stock. Finally, all sub-adult green turtles selected for
breeding were moved into a breeding pond (70 9 40 m) that
had been dug in concretized coral bedrock into which sea-
water was pumped. An artificial nesting beach was con-
structed along the length of the pond. All turtles had flipper
tags, and, during the nesting season, the females were
intercepted as they came ashore to nest so that the eggs could
be moved to a hatchery. We are confident that each turtle was
identified during her first nesting season. We use age at first
nesting as AgeSM. Body size—both curved carapace length
(CCL) and body mass—was measured annually for all turtles
in the breeding pond. CCL was measured from the anterior
midpoint of the nuchal scute to the posterior tip of one of the
posterior marginal scutes. Body condition index was calcu-
lated as Fulton’s K ([mass/CCL3] 9 103; Ricker 1975).
We estimated average somatic growth rates before sexual
maturity by subtracting the mean hatchling length and mass
(5 cm and 30 g; Hirth 1997) from LengthSM and mass at
sexual maturity (MassSM), respectively, and dividing that
value by AgeSM. Somatic growth rates after sexual maturity
were determined for both CCL and mass for two intervals:
4 years after sexual maturity to assess growth shortly after
maturity and all years after sexual maturity measured for
each turtle with a minimum of 9 years.
To compare carapace lengths between adult CTF green
turtles and wild populations, we had to convert straight
carapace length (SCL) to CCL for adults in a few popu-
lations. We added 4 cm to SCL to estimate CCL (Hirth
1980; Frazer and Ladner 1986).
Most relationships among parameters were assessed with
Spearman Rank tests, but in a few cases, linear regressions
were conducted when assumptions were met and it was
important to estimate the proportion of variance accounted
for by a variable. All statistical analyses were run in S-Plus
(v. 8.1) with alpha = 0.05. Year of birth or source population
did not have a significant effect on age, CCL or mass at
sexual maturity, growth rates, or condition index (GLM,
P [ 0.05). Therefore, we combined data for all analyses.
Results
There was considerable variation in the age at sexual
maturity (AgeSM), CCL at sexual maturity (LengthSM),
mass at sexual maturity (MassSM) and condition index
(Table 1; Fig. S1 in Online Resource 1). MassSM had the
greatest variation as indicated by CV. AgeSM was not
significantly correlated with either LengthSM or MassSM
(Spearman rank tests; rs = 0.204 and rs = 0.078,
P = 0.166 and P = 0.596, respectively), but LengthSM
and MassSM were significantly, positively correlated
(rs = 0.845, P \ 0.001). The negative relation between
AgeSM and body condition index was barely significant
(Spearman rank test, rs = -0.295, P = 0.046); LengthSM
or MassSM was not significantly correlated with body
condition index, although MassSM approached signifi-
cance (Spearman rank tests, rs = -0.227 and rs = 0.273,
P = 0.123 and P = 0.064, respectively).
Average somatic growth rates before sexual maturity
varied greatly (Table 1). Based on CV, length growth was
less variable than mass growth. The negative relation
Table 1 Age, curved carapace length (CCL), body mass, and body
condition index (BCI; units [kg/cm3] 9 103) at sexual maturity and
average growth rate from hatching to sexual maturity in female green
turtles (N = 47)
Age
(year)
CCL
(cm)
Mass
(kg)
BCI Growth
(cm/year)
Growth
(kg/year)
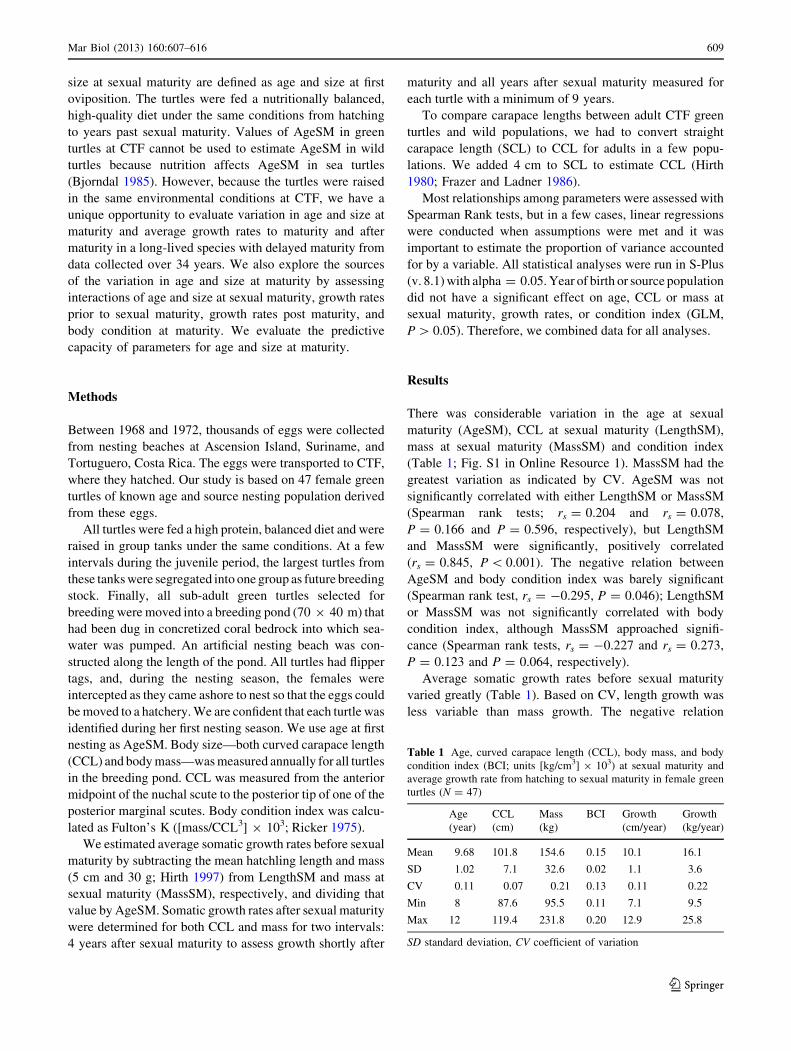
Mean 9.68 101.8 154.6 0.15 10.1 16.1
SD 1.02 7.1 32.6 0.02 1.1 3.6
CV 0.11 0.07 0.21 0.13 0.11 0.22
Min 8 87.6 95.5 0.11 7.1 9.5
Max 12 119.4 231.8 0.20 12.9 25.8
SD standard deviation, CV coefficient of variation
Mar Biol (2013) 160:607–616 609
123
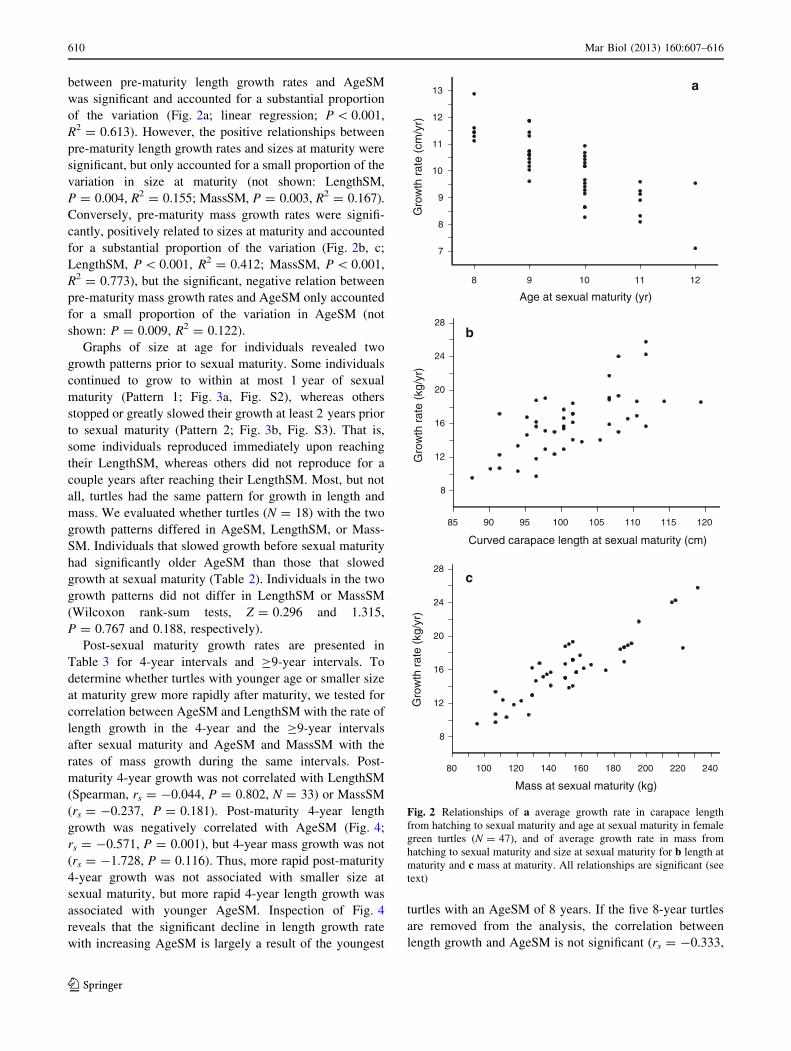
between pre-maturity length growth rates and AgeSM
was significant and accounted for a substantial proportion
of the variation (Fig. 2a; linear regression; P \ 0.001,
R2 = 0.613). However, the positive relationships between
pre-maturity length growth rates and sizes at maturity were
significant, but only accounted for a small proportion of the
variation in size at maturity (not shown: LengthSM,
P = 0.004, R2 = 0.155; MassSM, P = 0.003, R2 = 0.167).
Conversely, pre-maturity mass growth rates were signifi-
cantly, positively related to sizes at maturity and accounted
for a substantial proportion of the variation (Fig. 2b, c;
LengthSM, P \ 0.001, R2 = 0.412; MassSM, P \ 0.001,
R2 = 0.773), but the significant, negative relation between
pre-maturity mass growth rates and AgeSM only accounted
for a small proportion of the variation in AgeSM (not
shown: P = 0.009, R2 = 0.122).
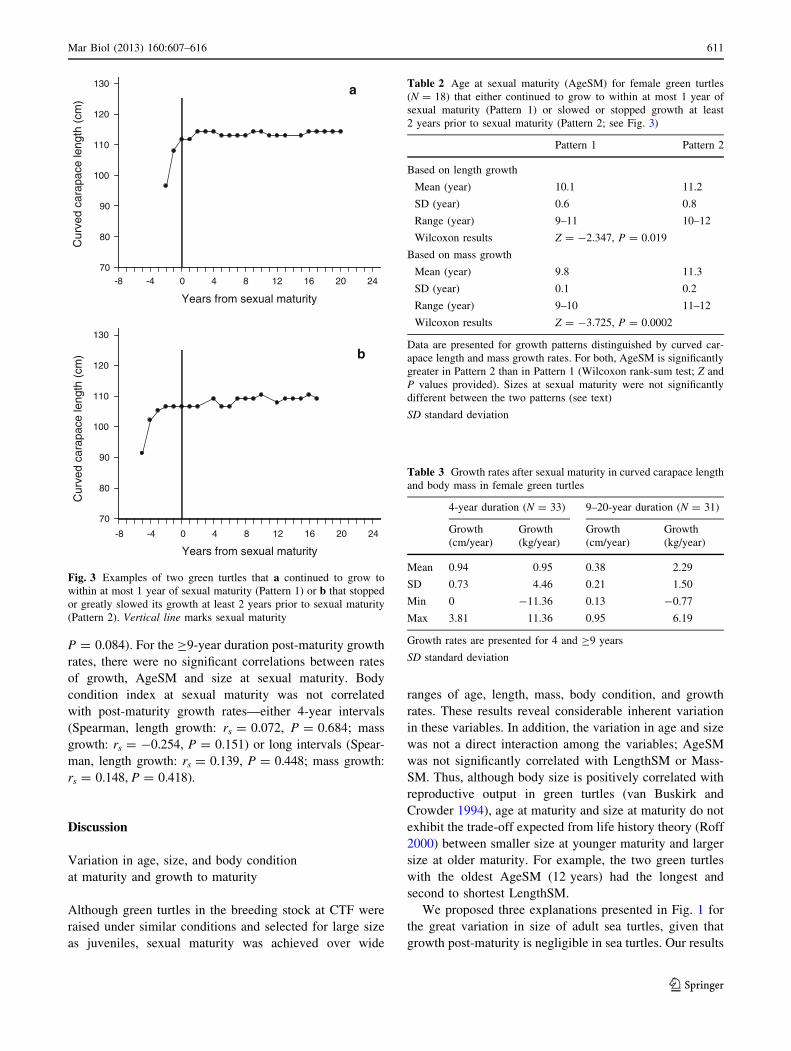
Graphs of size at age for individuals revealed two
growth patterns prior to sexual maturity. Some individuals
continued to grow to within at most 1 year of sexual
maturity (Pattern 1; Fig. 3a, Fig. S2), whereas others
stopped or greatly slowed their growth at least 2 years prior
to sexual maturity (Pattern 2; Fig. 3b, Fig. S3). That is,
some individuals reproduced immediately upon reaching
their LengthSM, whereas others did not reproduce for a
couple years after reaching their LengthSM. Most, but not
all, turtles had the same pattern for growth in length and
mass. We evaluated whether turtles (N = 18) with the two
growth patterns differed in AgeSM, LengthSM, or Mass-
SM. Individuals that slowed growth before sexual maturity
had significantly older AgeSM than those that slowed
growth at sexual maturity (Table 2). Individuals in the two
growth patterns did not differ in LengthSM or MassSM
(Wilcoxon rank-sum tests, Z = 0.296 and 1.315,
P = 0.767 and 0.188, respectively).
Post-sexual maturity growth rates are presented in
Table 3 for 4-year intervals and C9-year intervals. To
determine whether turtles with younger age or smaller size
at maturity grew more rapidly after maturity, we tested for
correlation between AgeSM and LengthSM with the rate of
length growth in the 4-year and the C9-year intervals
after sexual maturity and AgeSM and MassSM with the
rates of mass growth during the same intervals. Post-
maturity 4-year growth was not correlated with LengthSM
(Spearman, rs = -0.044, P = 0.802, N = 33) or MassSM
(rs = -0.237, P = 0.181). Post-maturity 4-year length
growth was negatively correlated with AgeSM (Fig. 4;
rs = -0.571, P = 0.001), but 4-year mass growth was not
(rs = -1.728, P = 0.116). Thus, more rapid post-maturity
4-year growth was not associated with smaller size at
sexual maturity, but more rapid 4-year length growth was
associated with younger AgeSM. Inspection of Fig. 4
reveals that the significant decline in length growth rate
with increasing AgeSM is largely a result of the youngest
turtles with an AgeSM of 8 years. If the five 8-year turtles
are removed from the analysis, the correlation between
length growth and AgeSM is not significant (rs = -0.333,
8 9 10 11 12
Age at sexual maturity (yr)
7
8
9
10
11
12
13
Gro
wth
rat
e (c
m/y
r)
85 90 95 100 105 110 115 120
Curved carapace length at sexual maturity (cm)
8
12
16
20
24
28
Gro
wth
rat
e (k
g/yr
)
80 100 120 140 160 180 200 220 240
Mass at sexual maturity (kg)
8
12
16
20
24
28
Gro
wth
rat
e (k
g/yr
)
a
b
c
Fig. 2 Relationships of a average growth rate in carapace length
from hatching to sexual maturity and age at sexual maturity in female
green turtles (N = 47), and of average growth rate in mass from
hatching to sexual maturity and size at sexual maturity for b length at
maturity and c mass at maturity. All relationships are significant (see
text)
610 Mar Biol (2013) 160:607–616
123
P = 0.084). For the C9-year duration post-maturity growth
rates, there were no significant correlations between rates
of growth, AgeSM and size at sexual maturity. Body
condition index at sexual maturity was not correlated
with post-maturity growth rates—either 4-year intervals
(Spearman, length growth: rs = 0.072, P = 0.684; mass
growth: rs = -0.254, P = 0.151) or long intervals (Spear-
man, length growth: rs = 0.139, P = 0.448; mass growth:
rs = 0.148, P = 0.418).
Discussion
Variation in age, size, and body condition
at maturity and growth to maturity
Although green turtles in the breeding stock at CTF were
raised under similar conditions and selected for large size
as juveniles, sexual maturity was achieved over wide
ranges of age, length, mass, body condition, and growth
rates. These results reveal considerable inherent variation
in these variables. In addition, the variation in age and size
was not a direct interaction among the variables; AgeSM
was not significantly correlated with LengthSM or Mass-
SM. Thus, although body size is positively correlated with
reproductive output in green turtles (van Buskirk and
Crowder 1994), age at maturity and size at maturity do not
exhibit the trade-off expected from life history theory (Roff
2000) between smaller size at younger maturity and larger
size at older maturity. For example, the two green turtles
with the oldest AgeSM (12 years) had the longest and
second to shortest LengthSM.
We proposed three explanations presented in Fig. 1 for
the great variation in size of adult sea turtles, given that
growth post-maturity is negligible in sea turtles. Our results
-8 -4 0 4 8 12 16 20 24
Years from sexual maturity
70
80
90
100
110
120
130C
urve
d ca
rapa
ce le
ngth
(cm
)
-8 -4 0 4 8 12 16 20 24
Years from sexual maturity
70
80
90
100
110
120
130
Cur
ved
cara
pace
leng
th (
cm)
a
b
Fig. 3 Examples of two green turtles that a continued to grow to
within at most 1 year of sexual maturity (Pattern 1) or b that stopped
or greatly slowed its growth at least 2 years prior to sexual maturity
(Pattern 2). Vertical line marks sexual maturity
Table 2 Age at sexual maturity (AgeSM) for female green turtles
(N = 18) that either continued to grow to within at most 1 year of
sexual maturity (Pattern 1) or slowed or stopped growth at least
2 years prior to sexual maturity (Pattern 2; see Fig. 3)
Pattern 1 Pattern 2
Based on length growth
Mean (year) 10.1 11.2
SD (year) 0.6 0.8
Range (year) 9–11 10–12
Wilcoxon results Z = -2.347, P = 0.019
Based on mass growth
Mean (year) 9.8 11.3
SD (year) 0.1 0.2
Range (year) 9–10 11–12
Wilcoxon results Z = -3.725, P = 0.0002
Data are presented for growth patterns distinguished by curved car-
apace length and mass growth rates. For both, AgeSM is significantly
greater in Pattern 2 than in Pattern 1 (Wilcoxon rank-sum test; Z and
P values provided). Sizes at sexual maturity were not significantly
different between the two patterns (see text)
SD standard deviation
Table 3 Growth rates after sexual maturity in curved carapace length
and body mass in female green turtles
4-year duration (N = 33) 9–20-year duration (N = 31)
Growth
(cm/year)
Growth
(kg/year)
Growth
(cm/year)
Growth
(kg/year)
Mean 0.94 0.95 0.38 2.29
SD 0.73 4.46 0.21 1.50
Min 0 -11.36 0.13 -0.77
Max 3.81 11.36 0.95 6.19
Growth rates are presented for 4 and C9 years
SD standard deviation
Mar Biol (2013) 160:607–616 611
123
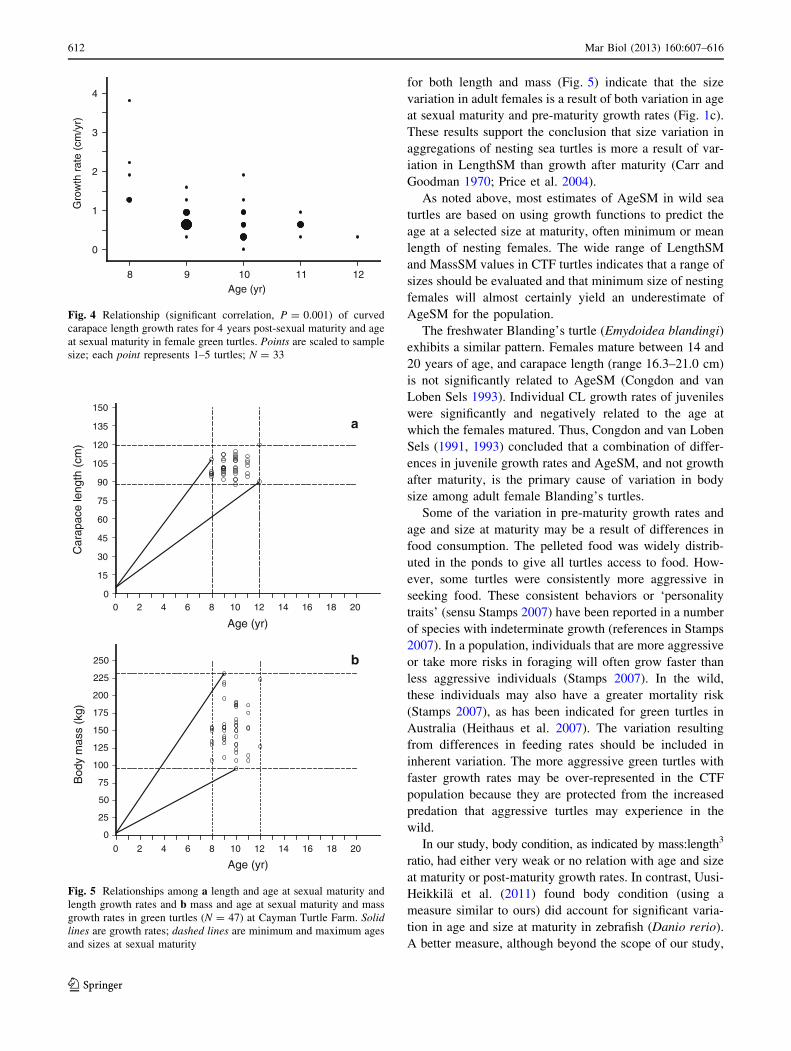
for both length and mass (Fig. 5) indicate that the size
variation in adult females is a result of both variation in age
at sexual maturity and pre-maturity growth rates (Fig. 1c).
These results support the conclusion that size variation in
aggregations of nesting sea turtles is more a result of var-
iation in LengthSM than growth after maturity (Carr and
Goodman 1970; Price et al. 2004).
As noted above, most estimates of AgeSM in wild sea
turtles are based on using growth functions to predict the
age at a selected size at maturity, often minimum or mean
length of nesting females. The wide range of LengthSM
and MassSM values in CTF turtles indicates that a range of
sizes should be evaluated and that minimum size of nesting
females will almost certainly yield an underestimate of
AgeSM for the population.
The freshwater Blanding’s turtle (Emydoidea blandingi)
exhibits a similar pattern. Females mature between 14 and
20 years of age, and carapace length (range 16.3–21.0 cm)
is not significantly related to AgeSM (Congdon and van
Loben Sels 1993). Individual CL growth rates of juveniles
were significantly and negatively related to the age at
which the females matured. Thus, Congdon and van Loben
Sels (1991, 1993) concluded that a combination of differ-
ences in juvenile growth rates and AgeSM, and not growth
after maturity, is the primary cause of variation in body
size among adult female Blanding’s turtles.
Some of the variation in pre-maturity growth rates and
age and size at maturity may be a result of differences in
food consumption. The pelleted food was widely distrib-
uted in the ponds to give all turtles access to food. How-
ever, some turtles were consistently more aggressive in
seeking food. These consistent behaviors or ‘personality
traits’ (sensu Stamps 2007) have been reported in a number
of species with indeterminate growth (references in Stamps
2007). In a population, individuals that are more aggressive
or take more risks in foraging will often grow faster than
less aggressive individuals (Stamps 2007). In the wild,
these individuals may also have a greater mortality risk
(Stamps 2007), as has been indicated for green turtles in
Australia (Heithaus et al. 2007). The variation resulting
from differences in feeding rates should be included in
inherent variation. The more aggressive green turtles with
faster growth rates may be over-represented in the CTF
population because they are protected from the increased
predation that aggressive turtles may experience in the
wild.
In our study, body condition, as indicated by mass:length3
ratio, had either very weak or no relation with age and size
at maturity or post-maturity growth rates. In contrast, Uusi-
Heikkila et al. (2011) found body condition (using a
measure similar to ours) did account for significant varia-
tion in age and size at maturity in zebrafish (Danio rerio).
A better measure, although beyond the scope of our study,
8 9 10 11 12
Age (yr)
0
1
2
3
4
Gro
wth
rat
e (c
m/y
r)
Fig. 4 Relationship (significant correlation, P = 0.001) of curved
carapace length growth rates for 4 years post-sexual maturity and age
at sexual maturity in female green turtles. Points are scaled to sample
size; each point represents 1–5 turtles; N = 33
0 2 4 6 8 10 12 14 16 18 20
Age (yr)
0
15
30
45
60
75
90
105
120
135
150
Car
apac
e le
ngth
(cm
)
0 2 4 6 8 10 12 14 16 18 20
Age (yr)
0
25
50
75
100
125
150
175
200
225
250
Bod
y m
ass
(kg)
b
a
Fig. 5 Relationships among a length and age at sexual maturity and
length growth rates and b mass and age at sexual maturity and mass
growth rates in green turtles (N = 47) at Cayman Turtle Farm. Solidlines are growth rates; dashed lines are minimum and maximum ages
and sizes at sexual maturity
612 Mar Biol (2013) 160:607–616
123
may well be the ratio of structural to reserve tissues
(Broekhuizen et al. 1994). Structural tissues are those that
cannot be mobilized once laid down—primarily skeletal,
circulatory, nervous, and some muscle tissues. Reserve
tissues can be mobilized and are primarily fat stores and
those parts of the musculature that can be mobilized. How
individuals allocate nutrients and energy between these
types of tissues may have important implications for the
maturation process. Broekhuizen et al. (1994) concluded
that individual salmonids modulate their physiology and
behavior in response to the instantaneous ratio of mobi-
lizable to non-mobilizable tissues. Differential resource
allocation in growing sea turtles between these two tissue
types may explain some of the variation in the parameters
we measured. Variation in growth in length will largely
depend on deposition of structural tissue, and, while growth
in mass will depend on all tissues, variation in mass growth
will result primarily from deposition rates of reserve tis-
sues. This difference could explain the greater variation in
MassSM than LengthSM and in mass growth rates com-
pared to length growth rates.
The substantial variation in AgeSM that is accounted for
by length growth rates and the substantial variation in
LengthSM and MassSM accounted for by mass growth
rates (Fig. 2) indicate that rate of juvenile linear growth is a
better predictor of AgeSM, whereas growth in mass is a
better predictor for size at maturity. The extent of variation
in pre-maturity growth rates for turtles held under the same
conditions may seem surprising. However, all studies of
growth rates of sea turtles in captivity of which the authors
are aware have reported high levels of variation (e.g.,
Stokes et al. 2006; Reich et al. 2008).
CTF turtles either grew relatively rapidly to AgeSM
(Pattern 1) or shifted to negligible growth for at least two
years before AgeSM (Pattern 2). This difference was an
important source of variation for age, but not size, at sexual
maturity. However, these patterns do not account for the
effect of pre-maturity length growth rates on AgeSM.
When we changed the AgeSM of turtles with Pattern 2 to
the age at which they attained their size at sexual maturity,
and recalculated the growth rate accordingly, the relation
of pre-maturity length growth rate to AgeSM remained
significant and a similar proportion of variation was
accounted for by this relation. A combination of growth
rates and laparoscopic evaluation of gonads of adult-sized
sea turtles on their foraging grounds has revealed both
patterns of growth in wild sea turtles (Limpus 2009). Why
growth becomes negligible before maturity in Pattern 2 is
not known. Perhaps this is an example of the disparity
between rate of maturation and growth rate (Bernardo
1993), and turtles are diverting resources from skeletal and
mass growth to the maturation of their reproductive
systems.
Comparisons with wild populations
Green turtles in CTF had AgeSM values from 8 to
12 years. These ages are much younger than those pre-
dicted from the function relating AgeSM to size at maturity
in testudines (Scott et al. 2012).
The magnitude of the difference in AgeSM between
CTF and wild green turtles is great, but difficult to assess
precisely because of the variable, and sometimes flawed,
estimates of AgeSM in Atlantic wild green turtles. Based
on a thorough study of 111 green turtles that stranded dead
along the U.S. coast, AgeSM was estimated to range
between 28 and 44.5 years, depending on the growth
function and LengthSM selected (Goshe et al. 2010). This
study used skeletochronology and had a complete size
range from hatchlings to adults.
Previous estimates of 18–33 years to maturity using
mark-recapture data from wild green turtles in Florida,
USA (Mendonca 1981; Frazer and Ehrhart 1985) and the
Caribbean (Frazer and Ladner 1986) were based on small
sample sizes that did not span the entire size range. Direct
measures are available for two green turtles marked at
release; a female released as a hatchling was found nesting
after 17 years, and one released as a head-started yearling
nested at an age of 15 years (Bell et al. 2005). Data from
head-started turtles must be interpreted with caution
because early periods of high-quality nutrition and rapid
growth can entrain later growth trajectories in reptiles
despite changes in nutrient resources—termed the ‘‘silver
spoon’’ effect (Madsen and Shine 2000).
Despite the uncertainty around these estimates of
AgeSM for wild green turtles, it is clear that CTF green
turtles reach sexual maturity at much younger ages. This
difference is not surprising because green turtles in the
Greater Caribbean are primarily herbivorous (Bjorndal
1997), and herbivory in green turtles limits their produc-
tivity (Bjorndal 1982, 1985). The higher quality diet at
CTF supports more rapid growth and allows CTF turtles to
reach size at maturity in a much shorter time.
CTF green turtles attain sexual maturity at 88–119 cm
CCL, which is the lower half of the size range of wild adult
female green turtles. CCL of adult female green turtles in
the three source populations of CTF turtles (Ascension
Island, Suriname, and Tortuguero, Costa Rica) ranged from
87 to 145 cm (converted from SCL values from Hirth
1997). The size distribution presented for wild green turtle
populations are values for all nesting females, not
LengthSM values. Because growth in length after maturity
is slow in wild green turtles, the comparison is reasonable.
CTF green turtles weighed between 96 and 232 kg at
sexual maturity, which largely falls within the range of
wild green turtles, although the minimum mass is smaller
in CTF turtles. Mass of adult female green turtles in the
Mar Biol (2013) 160:607–616 613
123
three source populations of CTF turtles (Ascension Island,
Suriname, and Tortuguero, Costa Rica) ranged from 113 to
235 kg (Hirth 1997). The mean mass of CTF turtles
(154.6 kg) fell within the range for wild turtles. Because
post-maturity mass growth rates have not been measured in
wild green turtles, we do not know whether the comparison
between MassSM in CTF turtles and mass of all nesting
wild turtles is reasonable. Post-maturity mass growth rates
appear to be greater than length growth rates in CTF tur-
tles, so the mass data drawn from a sample of all nesting
wild turtles may overestimate the size of wild MassSM.
From the extensive variation in age and size at maturity
in CTF green turtles, there is clearly no knife-edge
threshold to sexual maturity in these three parameters.
Because LengthSM in CTF turtles is the parameter most
similar to wild turtles, length apparently most closely
approximates a threshold to attaining maturity.
Data on variation in age and size at sexual maturity
(length or mass) are not available for wild populations of
sea turtles. Variation in these parameters would almost
certainly be greater in wild populations than in CTF turtles
because juvenile growth rates would have greater variation
as a result of the differences in resources and habitats
experienced by immature wild turtles in comparison with
those at CTF. Somatic growth rates in wild sea turtles are
known to vary spatially and temporally (Bjorndal et al.
2000; Diez and van Dam 2002; Balazs and Chaloupka
2004; Chaloupka et al. 2004; Kubis et al. 2009). However,
variation in age and size at maturity in wild turtles could be
decreased by compensatory growth (Bjorndal et al. 2003;
Roark et al. 2009) or by increased mortality of slow-
growing turtles that remain in vulnerable size classes for a
longer time and thus decrease the probability of older
AgeSM (as a result of slow length growth) or larger
LengthSM/MassSM (as a result of slow mass growth). In
contrast, density-dependent effects could yield older
AgeSM and smaller LengthSM and MassSM, as popula-
tions recover (Heppell et al. 2007; Chaloupka et al. 2008)
and somatic growth rates slow (Bjorndal et al. 2000; Balazs
and Chaloupka 2004). In addition, sea turtles are subjected
to a large number of threats (Lutcavage et al. 1997; Bolten
et al. 2011), many of which produce sub-lethal effects
that can decrease juvenile growth rates (McCauley and
Bjorndal 1999; Roark et al. 2009) and thus could result in
older AgeSM and/or smaller size at maturity.
The timing of maturation in species with indeterminate
growth drives the shift in nutrient and energy allocation
from primarily somatic growth to primarily reproduction
(Czarnołeski and Kozłowski 1998). Turtles have indeter-
minate growth (Shine and Iverson 1995), and it appears
that growth in wild adult female sea turtles becomes neg-
ligible after sexual maturity. Given that CTF turtles are
maintained on an abundant, high-quality diet, CTF turtles
may be able to allocate resources to both somatic growth
and reproduction after sexual maturity. Mean length
growth rates for CTF green turtles were 0.94 cm/year for
the 4-year interval post-maturity and 0.38 cm/year for the
entire post-maturity duration for those turtles with dura-
tions C9 year. Two estimates are available from Atlantic
wild populations. Mean SCL growth rate in green turtles at
Tortuguero, Costa Rica, is 0.4 cm/year (N = 179) calcu-
lated from Fig. 1 in Carr and Goodman (1970). Green
turtles nesting on Cyprus had a mean length growth rate of
0.11 cm/year (Broderick et al. 2003). We could find no
data for mass growth.
CTF turtles grow somewhat more rapidly in the 4 years
immediately following maturity, than in later years. This
growth pattern fits indeterminate growth, in which the post-
maturity body size should increase and then gradually
plateau (Day and Taylor 1997). The longer term growth
rates of CTF green turtles—which is the appropriate rate to
compare with the values from wild populations with mixed
ages—fall within the range measured for wild green turtles.
CTF turtles are not allocating substantial resources to post-
maturity growth. Rather, they maximize reproductive out-
put by approximately doubling the number of clutches laid
by a female within each breeding season and halving the
number of years between breeding seasons in comparison
with wild populations (Bjorndal 1985). The strength of this
shift from allocating resources to reproduction away from
growth at maturity is further supported by the lack of
relation between size at maturity and post-maturity growth
rates. Turtles with small sizes at AgeSM do not invest more
in increasing body size than turtles with large size at
AgeSM. However, the youngest green turtles (8 years) at
sexual maturity did exhibit faster length (but not mass)
growth for 4 years after sexual maturity, but the significant
difference disappeared after 4 years.
Conclusions
This study reveals the difficulty of estimating AgeSM for
sea turtle populations. Even when raised under similar
conditions at CTF, individuals vary substantially in both
age and size at maturity. The variable conditions to which
wild sea turtles are exposed will add to this high level of
inherent variation, resulting in even greater variation in
AgeSM. Of the three variables AgeSM, LengthSM, and
MassSM, CTF turtles are most similar to wild green turtles
in LengthSM. Thus, body length is apparently the param-
eter that most closely approaches a threshold for maturity.
The best predictor of AgeSM in our study is average pre-
maturity linear growth rate. The best predictor of size at
sexual maturity (both length and mass) is average pre-
maturity mass growth rate. In our study, we only had data
614 Mar Biol (2013) 160:607–616
123
to calculate average growth from size at hatching to sexual
maturity. Perhaps a portion of the growth function—for
example, early juvenile growth rate or late sub-adult
growth rates—would be better predictors of age and size at
maturity. This possibility should be pursued.
At sexual maturity, resource allocation shifts almost
completely away from somatic growth to reproductive
output in wild and CTF green turtles, regardless of level of
nutrition or size at maturity. Apparently, investment of a
given amount of nutrients into increasing female body size
after maturity does not yield as great an increase in
reproductive potential as the same investment directly
allocated into reproductive output through increased num-
ber of egg clutches per year and reduced inter-breeding
intervals.
Current population models for sea turtles and the man-
agement plans based on those models use single, knife-
edge estimates of age and/or size at maturity (National
Research Council 2010). Wild populations almost certainly
have higher levels of variation in age and size at maturity
than CTF turtles, and this variation should be incorporated
into management plans to improve assessment of popula-
tion conservation status and the response to management
actions.
Acknowledgments This study was funded by the Disney Wildlife
Conservation Fund. We are grateful to the staff of the Cayman Turtle
Farm for their many years of work that made this study possible. We
thank M. Chaloupka for constructive comments on the manuscript.
All animal care was conducted incompliance with the Government of
the Cayman Islands. The authors declare that they have no conflict of
interest.
References
Balazs GH, Chaloupka M (2004) Spatial and temporal variability in
somatic growth of green sea turtles (Chelonia mydas) resident in
the Hawaiian Archipelago. Mar Biol 145:1043–1059
Bell CDL, Parsons J, Austin TJ, Broderick AC, Ebanks-Petrie G,
Godley BJ (2005) Some of them came home: the Cayman Turtle
Farm headstarting project for the green turtle Chelonia mydas.
Oryx 39:137–148
Bernardo J (1993) Determinants of maturation in animals. Trends
Ecol Evol 8:166–173
Berner D, Blanckenhorn WU (2007) An ontogenetic perspective on
the relationship between age and size at maturity. Funct Ecol
21:505–512
Bjorndal KA (1982) The consequences of herbivory for the life
history pattern of the Caribbean green turtle. In: Bjorndal KA
(ed) Biology and conservation of sea turtles. Smithsonian
Institution Press, Washington, pp 111–116
Bjorndal KA (1985) Nutritional ecology of sea turtles. Copeia
1985:736–751
Bjorndal KA (1997) Foraging ecology and nutrition of sea turtles. In:
Lutz PL, Musick JA (eds) The biology of sea turtles. CRC Press,
Boca Raton, pp 199–231
Bjorndal KA, Meylan AB, Turner BJ (1983) Sea turtles nesting at
Melbourne Beach, Florida, 1. Size, growth and reproductive
biology. Biol Conserv 26:65–77
Bjorndal KA, Bolten AB, Chaloupka MY (2000) Green turtle somatic
growth model: evidence for density dependence. Ecol Appl
10:269–282
Bjorndal KA, Bolten AB, Dellinger T, Delgado C, Martins HR (2003)
Compensatory growth in oceanic loggerhead sea turtles:
response to a stochastic environment. Ecology 84:1237–1249
Bjorndal KA, Bowen BW, Chaloupka M, Crowder LB, Heppell SS,
Jones CM, Lutcavage ME, Policansky D, Solow AR, Withe-
rington BE (2011) From crisis to opportunity: better science
needed for restoration in the Gulf of Mexico. Science
331:537–538
Bolten AB, Crowder LB, Dodd MG, MacPherson SL, Musick JA,
Schroeder BA, Witherington BE, Long KJ, Snover ML (2011)
Quantifying multiple threats to endangered species: an example
from loggerhead sea turtles. Front Ecol Environ 9:295–301
Broderick AC, Glen F, Godley BJ, Hays GC (2003) Variation in
reproductive output of marine turtles. J Exp Mar Biol Ecol
288:95–109
Broekhuizen N, Gurney WSC, Jones A, Bryant AD (1994) Modelling
compensatory growth. Funct Ecol 8:770–782
Carr A, Goodman D (1970) Ecologic implications of size and growth
in Chelonia. Copeia 1970:783–786
Casale P, Mazaris AD, Freggi D (2011) Estimation of age at maturity
of loggerhead sea turtles Caretta caretta in the Mediterranean
using length frequency data. Endanger Species Res 13:123–129
Chaloupka MY, Musick JA (1997) Age, growth, and population
dynamics. In: Lutz PL, Musick JA (eds) The biology of sea
turtles. CRC Press, Boca Raton, pp 233–276
Chaloupka M, Limpus C, Miller J (2004) Green turtle somatic growth
dynamics in a spatially disjunct Great Barrier Reef metapopu-
lation. Coral Reefs 23:325–335
Chaloupka M, Bjorndal KA, Balazs GH, Bolten AB, Ehrhart LM,
Limpus CJ, Suganuma H, Troeng S, Yamaguchi M (2008)
Encouraging outlook for recovery of a once severely exploited
marine megaherbivore. Global Ecol Biogeogr 17:297–304
Congdon JD, van Loben Sels RC (1991) Growth and body size
variation in Blanding’s turtles (Emydoidea blandingi): relation-
ships to reproduction. Can J Zool 69:239–245
Congdon JD, van Loben Sels RC (1993) Relationships of reproduc-
tive traits and body size with attainment of sexual maturity and
age in Blanding’s turtles (Emydoidea blandingi). J Evol Biol
6:547–557
Czarnołeski M, Kozłowski J (1998) Do Bertalanffy’s growth curves
result from optimal resource allocation? Ecol Lett 1:5–7
Day T, Taylor PD (1997) Von Bertalanffy’s growth equation should
not be used to model age and size at maturity. Am Nat
149:381–393
Dieckmann U, Heino M (2007) Probabilistic reaction norms:
their history, strengths, and limitations. Mar Ecol Prog Ser
335:253–269
Diez CE, van Dam RP (2002) Habitat effect on hawksbill turtle
growth rates on feeding grounds at Mona and Monito Islands,
Puerto Rico. Mar Ecol Prog Ser 234:301–309
Ernande B, Dieckmann U, Heino M (2004) Adaptive changes in
harvested populations: plasticity and evolution of age and size at
maturation. Proc R Soc B 271:415–423
Frazer NB, Ehrhart LM (1985) Preliminary growth models for green,
Chelonia mydas, and loggerhead, Caretta caretta, turtles in the
wild. Copeia 1985:73–79
Frazer NB, Ladner RC (1986) A growth curve for green sea turtles,
Chelonia mydas, in the U.S. Virgin Islands, 1913–14. Copeia
1986:798–802
Mar Biol (2013) 160:607–616 615
123
Goshe LR, Avens L, Scharf FS, Southwood AL (2010) Estimation of
age at maturation and growth of Atlantic green turtles (Cheloniamydas) using skeletochronology. Mar Biol 157:1725–1740
Heithaus MR, Frid A, Wirsing AJ, Dill LM, Fourqurean JW,
Burkholder D, Thomson J, Bejder L (2007) State-dependent
risk-taking by green sea turtles mediates top-down effects of
tiger shark intimidation in a marine ecosystem. J Anim Ecol
76:837–844
Heppell SS, Burchfield PM, Pena LJ (2007) Kemp’s ridley recovery:
how far have we come, and where are we headed? In: Plotkin PT
(ed) Biology and conservation of ridley sea turtles. Johns
Hopkins University Press, Baltimore, pp 325–335
Hirth HF (1980) Some aspects of the nesting behavior and reproduc-
tive biology of sea turtles. Am Zool 20:507–523
Hirth HF (1997) Synopsis of the biological data on the green turtle
Chelonia mydas (Linnaeus, 1758). U.S. Fish and Wildlife
Service. Biol Rep 97:1–120
Kingsolver JG, Diamond SE, Seiter SA, Higgins JK (2012) Direct and
indirect phenotypic selection on developmental trajectories in
Manduca sexta. Funct Ecol 26:598–607
Kubis S, Chaloupka M, Ehrhart L, Bresette M (2009) Growth rates of
juvenile green turtles Chelonia mydas from three ecologically
distinct foraging habitats along the east central coast of Florida,
USA. Mar Ecol Prog Ser 389:257–269
Limpus CJ (2009) A biological review of Australian Marine turtles.
Queensland Environmental Protection Agency, Brisbane
Lutcavage ME, Plotkin P, Witherington B, Lutz PL (1997) Human
impacts on sea turtle survival. In: Lutz PL, Musick JA (eds) The
biology of sea turtles. CRC Press, Boca Raton, pp 387–409
Madsen T, Shine R (2000) Silver spoons and snake body sizes: prey
availability early in life influences long-term growth rates of
free-ranging pythons. J Anim Ecol 69:952–958
McCauley SJ, Bjorndal KA (1999) Conservation implications of
dietary dilution from debris ingestion: sublethal effects in post-
hatchling loggerhead sea turtles. Conserv Biol 13:925–929
Mendonca MT (1981) Comparative growth rates of wild immature
Chelonia mydas and Caretta caretta in Florida. J Herpetol
15:447–451
National Research Council (2010) Assessment of sea-turtle status and
trends: integrating demography and abundance. National Acad-
emies Press, Washington, DC
Price ER, Wallace BP, Reina RD, Spotila JR, Paladino FV, Piedra R,
Velez E (2004) Size, growth, and reproductive output of adult
female leatherback turtles Dermochelys coriacea. Endanger
Species Res 5:1–8
Reich KJ, Bjorndal KA, Martınez del Rio C (2008) Effects of growth
and tissue type on the kinetics of 13C and 15N incorporation in a
rapidly growing ectotherm. Oecologia 155:651–663
Ricker WE (1975) Computation and interpretation of biological
statistics of fish populations. Bull Fish Res Board Can 191:1–382
Roark AM, Bjorndal KA, Bolten AB (2009) Compensatory responses
to food restriction in juvenile green turtles (Chelonia mydas).
Ecology 90:2524–2534
Roff DA (2000) Trade-offs between growth and reproduction: an
analysis of the quantitative genetic evidence. J Evol Biol
13:434–445
Roff DA (2002) Life history evolution. Sinauer, Sunderland
Scott R, Marsh R, Hays GC (2012) Life in the really slow lane:
loggerhead sea turtles mature late relative to other reptiles. Funct
Ecol 26:227–235
Shine R, Iverson JB (1995) Patterns of survival, growth and
maturation in turtles. Oikos 72:343–348
Snover ML, Hohn AA, Crowder LB, Heppell SS (2007) Age and
growth in Kemp’s ridley sea turtles: evidence from mark-
recapture and skeletochronology. In: Plotkin PT (ed) Biology
and conservation of ridley sea turtles. Johns Hopkins University
Press, Baltimore, pp 89–105
Stamps JA (2007) Growth-mortality tradeoffs and ‘personality traits’
in animals. Ecol Lett 10:355–363
Stearns SC (1992) The evolution of life histories. Oxford University
Press, Oxford
Stokes L, Wyneken J, Crowder LB, Marsh J (2006) The influence of
temporal and spatial origin on size and early growth rates in
captive loggerhead sea turtles (Caretta caretta) in the United
States. Herpetol Conserv Biol 1:71–80
Turtle Expert Working Group (TEWG) (2009) An assessment of the
loggerhead turtle population in the western North Atlantic
Ocean. NOAA Technical Memorandum NMFS-SEFSC-575,
p 142. http://www.sefsc.noaa.gov/turtles/TM_575_TEWG.pdf.
Accessed 20 Oct 2012
Uusi-Heikkila S, Kuparinen A, Wolter C, Meinelt T, O’Toole AC,
Arlinghaus R (2011) Experimental assessment of the probabi-
listic maturation reaction norm: condition matters. Proc R Soc B
278:709–717
van Buskirk J, Crowder LB (1994) Life-history variation in marine
turtles. Copeia 1994:66–81
616 Mar Biol (2013) 160:607–616
123