Embed Size (px)
Citation preview

Outlook for 19 of Europe’s most important gateway cities, representing 650,000 hotel rooms and over 85 million international arrivals
Second edition
January 2013
Thriving or survivingEuropean cities hotel forecast 2013
www.pwc.com/hospitality

Front cover photo credit: © Paris Tourist Office – Photographer: David Lefranc
ContentsForeword 3
Review of 2012 4
Thriving or surviving in 2013? 6
Trends, issues and challenges in the coming year 14
Economic, travel and supply outlook 17
Individual European cities hotel forecast 2013 22
Methodology and model assumptions 48
Further reading 52
Contacts 54

PwC Thriving or Surviving 3
ForewordPwC1 is delighted to bring you our European cities hotel forecast for 2013. This second edition features 19 of Europe’s most important gateway cities. For each city, we provide a forecast of occupancy, ADR and RevPAR, as well as the economic outlook and our analysis of the opportunities driving tourism and investment in 2013. All the cities featured are capitals of culture, finance and commerce and together they account for over 650,000 rooms and welcome more than 85 million international arrivals each year.
Success in 2013 is not just about growthIn absolute trading terms, the projected leader board for 2013 is largely unchanged from last year, with Paris, London, and Edinburgh still the fullest cities – although the order has changed and London is expected to be in third place in 2013 compared to first place in 2012; Paris, Geneva and Zurich remain the most expensive and Paris the clear winner in RevPAR terms at €211.17. The
city slipping a little down the RevPAR forecast league table is Madrid while St. Petersburg rises to take its place. But in growth terms, the picture is somewhat different.
Thrivers or survivors? Overall, RevPAR growth is expected to slow in 2013, held back by strong economic headwinds across the eurozone. But there will be thrivers; cities expected to show robust RevPAR growth include Paris, St Petersburg and Edinburgh and more modest increases should be seen in Frankfurt, Berlin, Dublin and Moscow. For others we expect little or no RevPAR growth in 2013 and some, most notably London and Madrid, will see negative growth. For London, coming off an Olympic high, this is perhaps to be expected and the city will still enjoy very high absolute trading and profitability levels. For Madrid, by contrast, 2013 will be more about adopting strategies for survival as occupancy and ADR fall below the ten year average.
Adapting to the new economic normalOur analysis also shows us that return to a steady state of economic growth in Europe is unlikely in the near future. This being so, hotel sectors must learn to adjust to this new economic climate, while at the same time responding to the new trends and challenges that the industry faces. To understand more about these, as part of our research we asked hotel industry leaders about the issues, trends and opportunities that keep them awake at night. What’s at the top of their lists? Changing consumer preferences; the digital revolution; the impact of online aggregators on price and distribution; and gaining market share in a slow growth economy where retaining existing customers becomes a ‘must-have’ and the battle for visitors from emerging markets intensifies. With fewer customers to go round in 2013, loyalty and reward programmes could make the difference between success and failure.
2013 may be largely about the economy but it will also be about seizing the opportunities created by past investment, a clear strategy and skillful management.
1PwC refers to the PwC network and/or one or more of its member firms, each of which is a separate legal entity

4 European cities hotel forecast PwC
Review of 2012
PwC Thriving or Surviving 5
A resilient 2012 for hotels with some star studded double digit growth performances
Looking backFor Europe in 2012, average hotel occupancy rates showed a small decline for the year to September, notably in Southern European destinations. By contrast, a report from the European Travel Commission shows clear and continued gains in some Eastern European countries. Hotels have been able to raise rates but these gains remained subdued, especially in the face of other cost increases, and operators remained under pressure. This data suggest a rise in demand for less expensive options including a shorter length of stay on tourism trips and a rise in non-hotel demand.
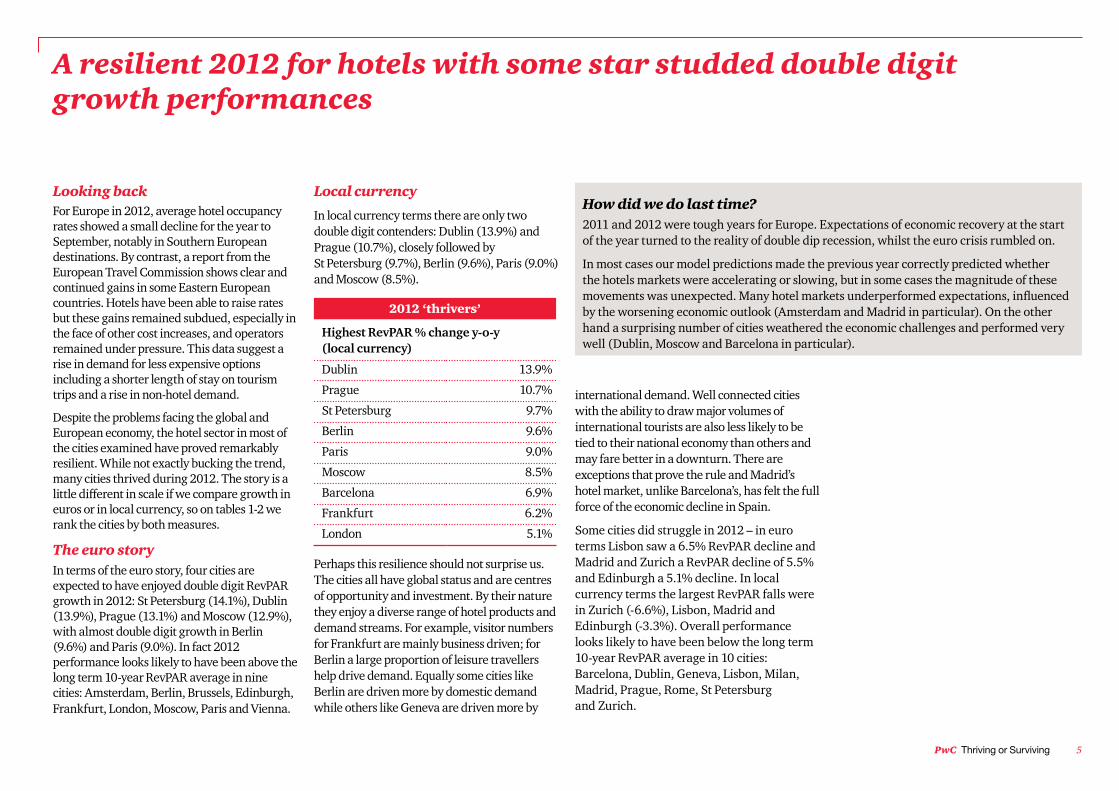
Despite the problems facing the global and European economy, the hotel sector in most of the cities examined have proved remarkably resilient. While not exactly bucking the trend, many cities thrived during 2012. The story is a little different in scale if we compare growth in euros or in local currency, so on tables 1-2 we rank the cities by both measures.
The euro storyIn terms of the euro story, four cities are expected to have enjoyed double digit RevPAR growth in 2012: St Petersburg (14.1%), Dublin (13.9%), Prague (13.1%) and Moscow (12.9%), with almost double digit growth in Berlin (9.6%) and Paris (9.0%). In fact 2012 performance looks likely to have been above the long term 10-year RevPAR average in nine cities: Amsterdam, Berlin, Brussels, Edinburgh, Frankfurt, London, Moscow, Paris and Vienna.
How did we do last time? 2011 and 2012 were tough years for Europe. Expectations of economic recovery at the start of the year turned to the reality of double dip recession, whilst the euro crisis rumbled on.
In most cases our model predictions made the previous year correctly predicted whether the hotels markets were accelerating or slowing, but in some cases the magnitude of these movements was unexpected. Many hotel markets underperformed expectations, influenced by the worsening economic outlook (Amsterdam and Madrid in particular). On the other hand a surprising number of cities weathered the economic challenges and performed very well (Dublin, Moscow and Barcelona in particular).
Local currency
In local currency terms there are only two double digit contenders: Dublin (13.9%) and Prague (10.7%), closely followed by St Petersburg (9.7%), Berlin (9.6%), Paris (9.0%) and Moscow (8.5%).
2012 ‘thrivers’
Highest RevPAR % change y-o-y (local currency)
Dublin 13.9%
Prague 10.7%
St Petersburg 9.7%
Berlin 9.6%
Paris 9.0%
Moscow 8.5%
Barcelona 6.9%
Frankfurt 6.2%
London 5.1%
Perhaps this resilience should not surprise us. The cities all have global status and are centres of opportunity and investment. By their nature they enjoy a diverse range of hotel products and demand streams. For example, visitor numbers for Frankfurt are mainly business driven; for Berlin a large proportion of leisure travellers help drive demand. Equally some cities like Berlin are driven more by domestic demand while others like Geneva are driven more by
international demand. Well connected cities with the ability to draw major volumes of international tourists are also less likely to be tied to their national economy than others and may fare better in a downturn. There are exceptions that prove the rule and Madrid’s hotel market, unlike Barcelona’s, has felt the full force of the economic decline in Spain.
Some cities did struggle in 2012 – in euro terms Lisbon saw a 6.5% RevPAR decline and Madrid and Zurich a RevPAR decline of 5.5% and Edinburgh a 5.1% decline. In local currency terms the largest RevPAR falls were in Zurich (-6.6%), Lisbon, Madrid and Edinburgh (-3.3%). Overall performance looks likely to have been below the long term 10-year RevPAR average in 10 cities: Barcelona, Dublin, Geneva, Lisbon, Milan, Madrid, Prague, Rome, St Petersburg and Zurich.

6 European cities hotel forecast PwC
Thriving or surviving in 2013?
PwC Thriving or Surviving 7
No double digit RevPAR growth expected in 2013 but still opportunities for growth
Looking aheadExpect slower growth in 2013 The hotel industry faces a more competitive and challenging environment in 2013 with continuing economic headwinds likely to hold back growth. RevPAR growth is expected to slow in 2013 and there will be no double digit gains in any of the cities surveyed. Again the story is a little different in scale if we compare growth in euros and in local currency, so on tables 1-2 we rank the cities by both measures.
In growth terms, the leaders in the forecast table can be called ‘thrivers’. St Petersburg is expected to lead the euro rankings of the ‘thrivers’ with robust 7.3% RevPAR growth over 2012; followed by Moscow (5.2%) Paris (5.0%) Frankfurt (3.5%), Berlin (3.2%) and Dublin (3.1%). In local currency terms Paris tops the charts with 5.0% RevPAR growth – closely followed by St Petersburg, (4.8%), Edinburgh (4.0%), Frankfurt, Berlin and Dublin. See full rankings in tables 1 and 2.
As for the ‘survivors’ in 2013, we see a mixed bag of cities due to a variety of contributory drivers. In London, we expect softer trading after three record years and above average supply increases – coming down from some very heady trading heights of the Olympics and Jubilee year. For most of 2012 RevPAR in London stayed about 25% above 2007 levels. In other cities, such as Madrid, growth remains significantly below the long term trend and is slipping from altogether lower levels. There are seven cities expected to see RevPAR declines in 2013. London is expected to see the largest decline at 7.9%, followed by Madrid (-5.8%) Amsterdam (-3.2%), Zurich (-1.3%), Brussels (-1.2%), Rome (-1.1%) and Geneva (-0.3%). In local currency terms London still sits at the bottom of the RevPAR declines league (-6.8%).
Even within a ‘thriver’ city however, hotel markets are not homogenous. There are submarkets outside some of the central business districts, that reveal weaker trends. Hotels located farther out of the city or in poor locations could find the going tougher in 2013. For example, the trend of converting offices to hotels on the outskirts of Amsterdam could leave hoteliers in more outlying areas struggling. As ever, location remains the prime determinant of success.
8 European cities hotel forecast PwC
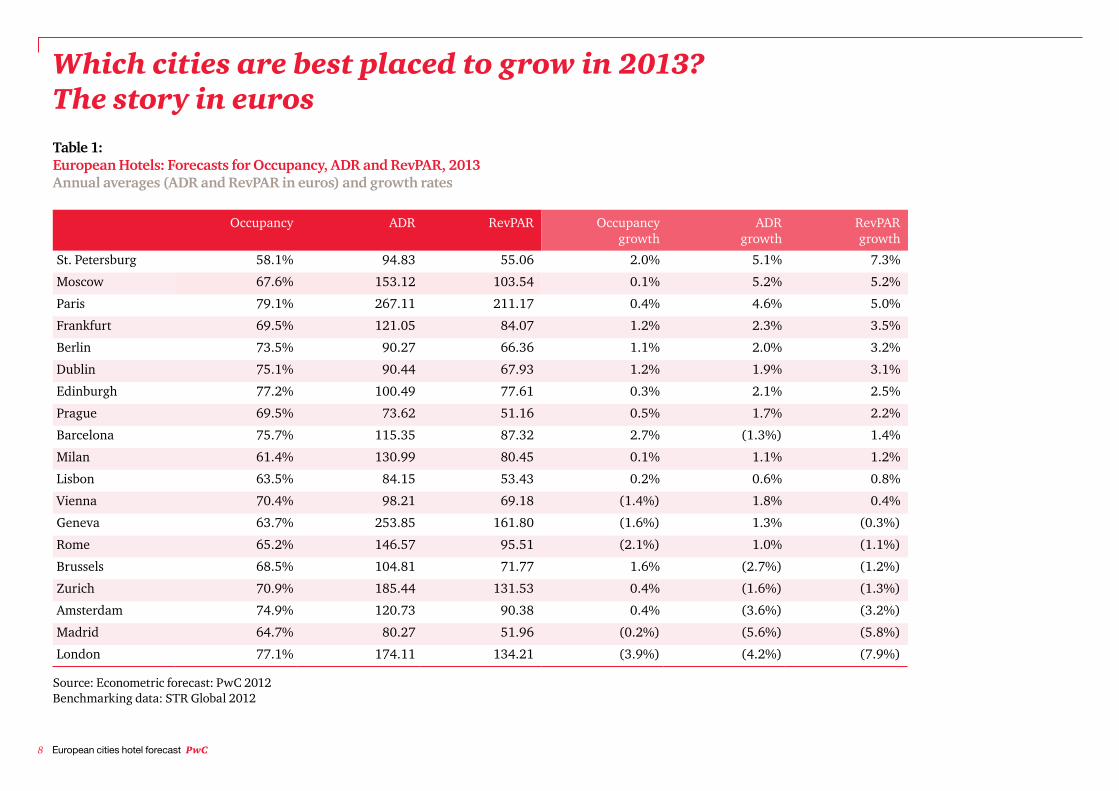
Which cities are best placed to grow in 2013? The story in euros Table 1:European Hotels: Forecasts for Occupancy, ADR and RevPAR, 2013Annual averages (ADR and RevPAR in euros) and growth rates
Source: Econometric forecast: PwC 2012Benchmarking data: STR Global 2012
Occupancy ADR RevPAR Occupancy growth
ADR growth
RevPAR growth
St. Petersburg 58.1% 94.83 55.06 2.0% 5.1% 7.3%
Moscow 67.6% 153.12 103.54 0.1% 5.2% 5.2%
Paris 79.1% 267.11 211.17 0.4% 4.6% 5.0%
Frankfurt 69.5% 121.05 84.07 1.2% 2.3% 3.5%
Berlin 73.5% 90.27 66.36 1.1% 2.0% 3.2%
Dublin 75.1% 90.44 67.93 1.2% 1.9% 3.1%
Edinburgh 77.2% 100.49 77.61 0.3% 2.1% 2.5%
Prague 69.5% 73.62 51.16 0.5% 1.7% 2.2%
Barcelona 75.7% 115.35 87.32 2.7% (1.3%) 1.4%
Milan 61.4% 130.99 80.45 0.1% 1.1% 1.2%
Lisbon 63.5% 84.15 53.43 0.2% 0.6% 0.8%
Vienna 70.4% 98.21 69.18 (1.4%) 1.8% 0.4%
Geneva 63.7% 253.85 161.80 (1.6%) 1.3% (0.3%)
Rome 65.2% 146.57 95.51 (2.1%) 1.0% (1.1%)
Brussels 68.5% 104.81 71.77 1.6% (2.7%) (1.2%)
Zurich 70.9% 185.44 131.53 0.4% (1.6%) (1.3%)
Amsterdam 74.9% 120.73 90.38 0.4% (3.6%) (3.2%)
Madrid 64.7% 80.27 51.96 (0.2%) (5.6%) (5.8%)
London 77.1% 174.11 134.21 (3.9%) (4.2%) (7.9%)
PwC Thriving or Surviving 9
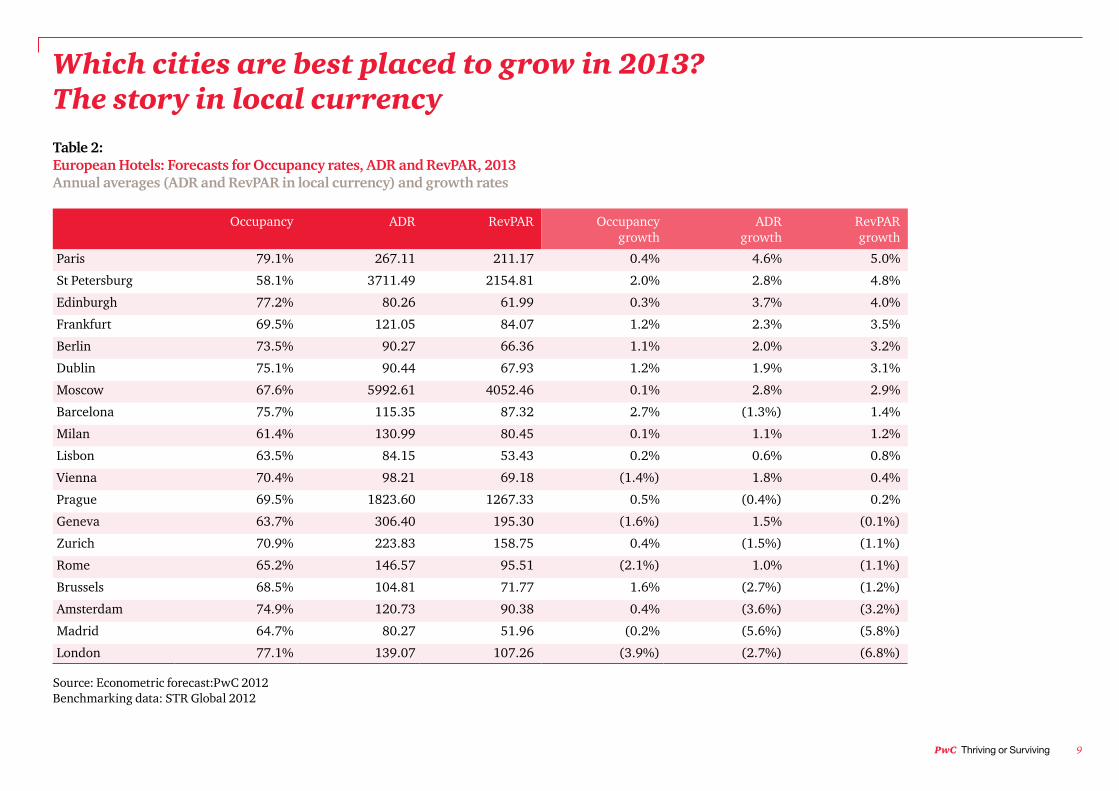
Which cities are best placed to grow in 2013? The story in local currencyTable 2:European Hotels: Forecasts for Occupancy rates, ADR and RevPAR, 2013Annual averages (ADR and RevPAR in local currency) and growth rates
Occupancy ADR RevPAR Occupancy growth
ADR growth
RevPAR growth
Paris 79.1% 267.11 211.17 0.4% 4.6% 5.0%
St Petersburg 58.1% 3711.49 2154.81 2.0% 2.8% 4.8%
Edinburgh 77.2% 80.26 61.99 0.3% 3.7% 4.0%
Frankfurt 69.5% 121.05 84.07 1.2% 2.3% 3.5%
Berlin 73.5% 90.27 66.36 1.1% 2.0% 3.2%
Dublin 75.1% 90.44 67.93 1.2% 1.9% 3.1%
Moscow 67.6% 5992.61 4052.46 0.1% 2.8% 2.9%
Barcelona 75.7% 115.35 87.32 2.7% (1.3%) 1.4%
Milan 61.4% 130.99 80.45 0.1% 1.1% 1.2%
Lisbon 63.5% 84.15 53.43 0.2% 0.6% 0.8%
Vienna 70.4% 98.21 69.18 (1.4%) 1.8% 0.4%
Prague 69.5% 1823.60 1267.33 0.5% (0.4%) 0.2%
Geneva 63.7% 306.40 195.30 (1.6%) 1.5% (0.1%)
Zurich 70.9% 223.83 158.75 0.4% (1.5%) (1.1%)
Rome 65.2% 146.57 95.51 (2.1%) 1.0% (1.1%)
Brussels 68.5% 104.81 71.77 1.6% (2.7%) (1.2%)
Amsterdam 74.9% 120.73 90.38 0.4% (3.6%) (3.2%)
Madrid 64.7% 80.27 51.96 (0.2% (5.6%) (5.8%)
London 77.1% 139.07 107.26 (3.9%) (2.7%) (6.8%)
Source: Econometric forecast:PwC 2012Benchmarking data: STR Global 2012
10 European cities hotel forecast PwC
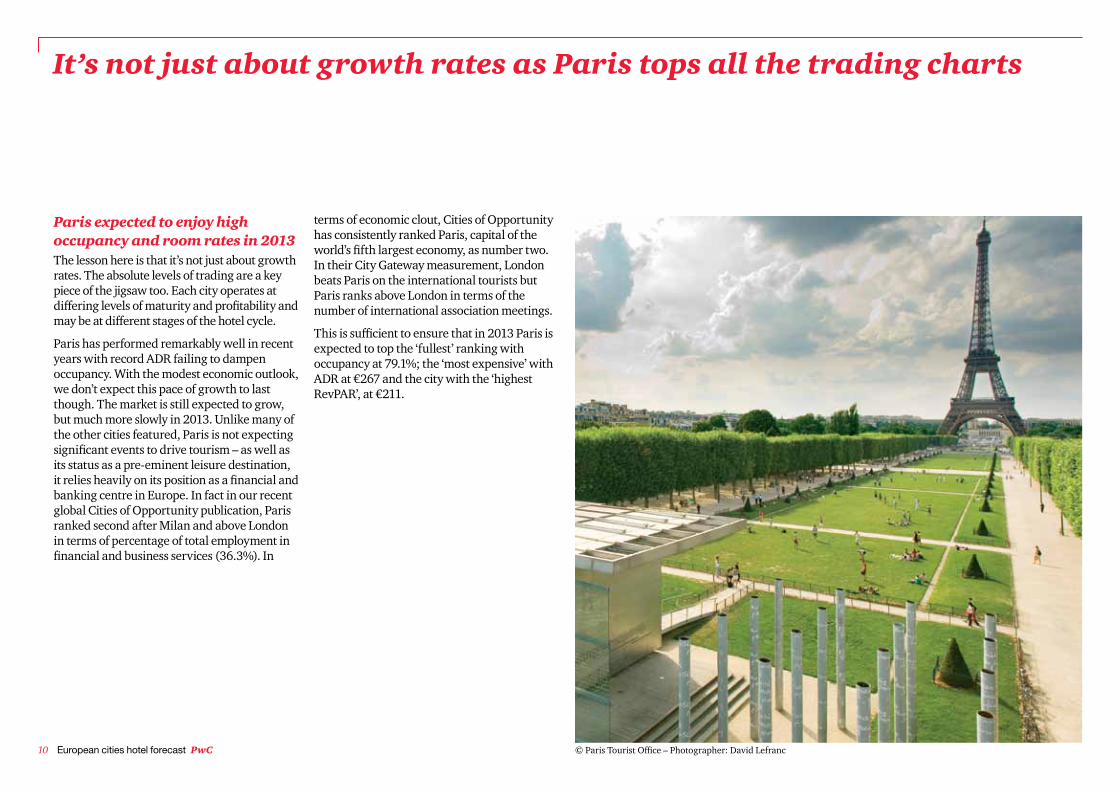
Paris expected to enjoy high occupancy and room rates in 2013The lesson here is that it’s not just about growth rates. The absolute levels of trading are a key piece of the jigsaw too. Each city operates at differing levels of maturity and profitability and may be at different stages of the hotel cycle.
Paris has performed remarkably well in recent years with record ADR failing to dampen occupancy. With the modest economic outlook, we don’t expect this pace of growth to last though. The market is still expected to grow, but much more slowly in 2013. Unlike many of the other cities featured, Paris is not expecting significant events to drive tourism – as well as its status as a pre-eminent leisure destination, it relies heavily on its position as a financial and banking centre in Europe. In fact in our recent global Cities of Opportunity publication, Paris ranked second after Milan and above London in terms of percentage of total employment in financial and business services (36.3%). In
terms of economic clout, Cities of Opportunity has consistently ranked Paris, capital of the world’s fifth largest economy, as number two. In their City Gateway measurement, London beats Paris on the international tourists but Paris ranks above London in terms of the number of international association meetings.
This is sufficient to ensure that in 2013 Paris is expected to top the ‘fullest’ ranking with occupancy at 79.1%; the ‘most expensive’ with ADR at €267 and the city with the ‘highest RevPAR’, at €211.
It’s not just about growth rates as Paris tops all the trading charts
© Paris Tourist Office – Photographer: David Lefranc
PwC Thriving or Surviving 11
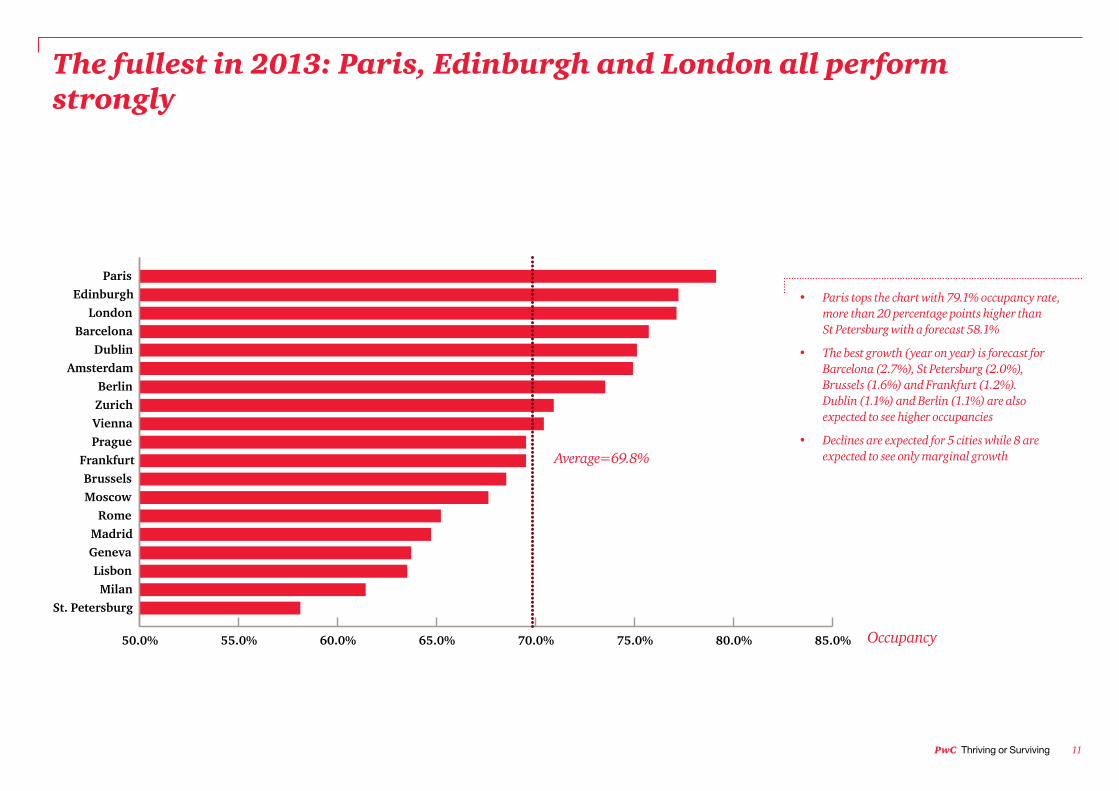
The fullest in 2013: Paris, Edinburgh and London all perform strongly
• Paris tops the chart with 79.1% occupancy rate, more than 20 percentage points higher than St Petersburg with a forecast 58.1%
• The best growth (year on year) is forecast for Barcelona (2.7%), St Petersburg (2.0%), Brussels (1.6%) and Frankfurt (1.2%). Dublin (1.1%) and Berlin (1.1%) are also expected to see higher occupancies
• Declines are expected for 5 cities while 8 are expected to see only marginal growthAverage=69.8%
Occupancy50.0%
St. PetersburgMilan
ParisEdinburgh
LondonBarcelona
DublinAmsterdam
BerlinZurichViennaPrague
FrankfurtBrusselsMoscow
RomeMadridGenevaLisbon
55.0% 60.0% 65.0% 70.0% 75.0% 80.0% 85.0%
12 European cities hotel forecast PwC
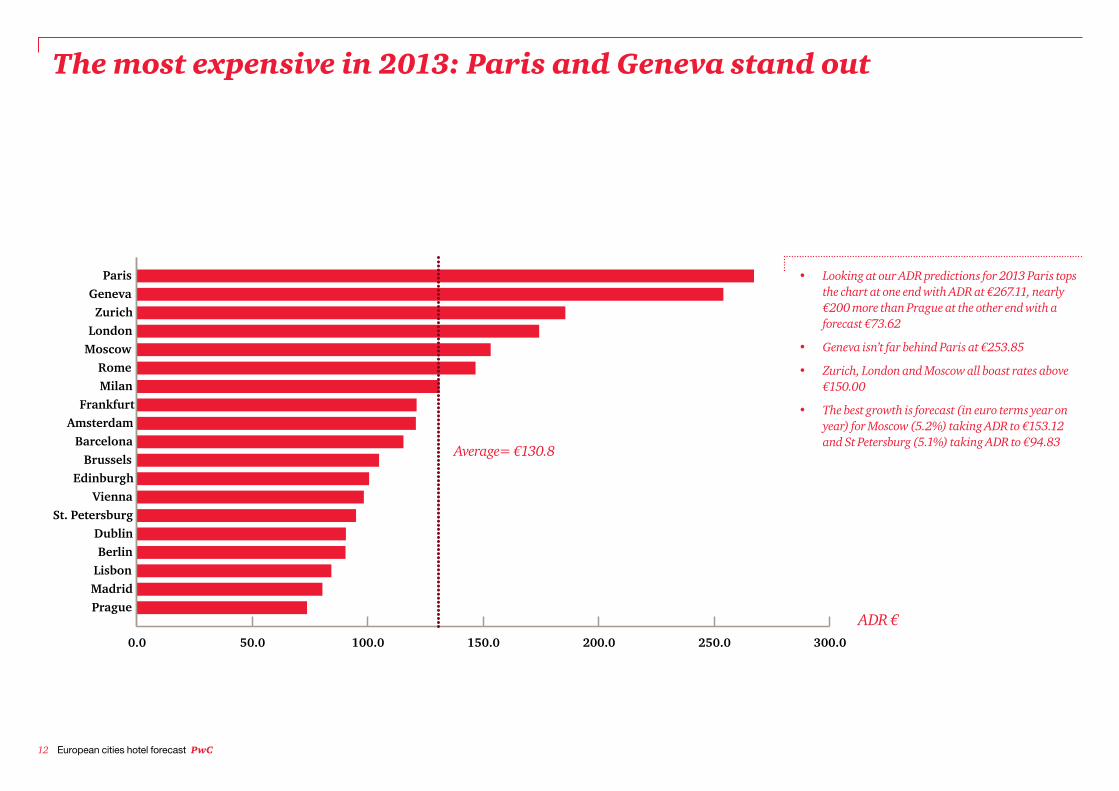
The most expensive in 2013: Paris and Geneva stand out
• Looking at our ADR predictions for 2013 Paris tops the chart at one end with ADR at €267.11, nearly €200 more than Prague at the other end with a forecast €73.62
• Geneva isn’t far behind Paris at €253.85
• Zurich, London and Moscow all boast rates above €150.00
• The best growth is forecast (in euro terms year on year) for Moscow (5.2%) taking ADR to €153.12 and St Petersburg (5.1%) taking ADR to €94.83
Average= €130.8
ADR €0.0 50.0 100.0 150.0 200.0 250.0 300.0
St. Petersburg
Milan
Paris
Edinburgh
London
Barcelona
Dublin
Amsterdam
Berlin
Zurich
Vienna
Prague
Frankfurt
Brussels
MoscowRome
Madrid
Geneva
Lisbon
PwC Thriving or Surviving 13
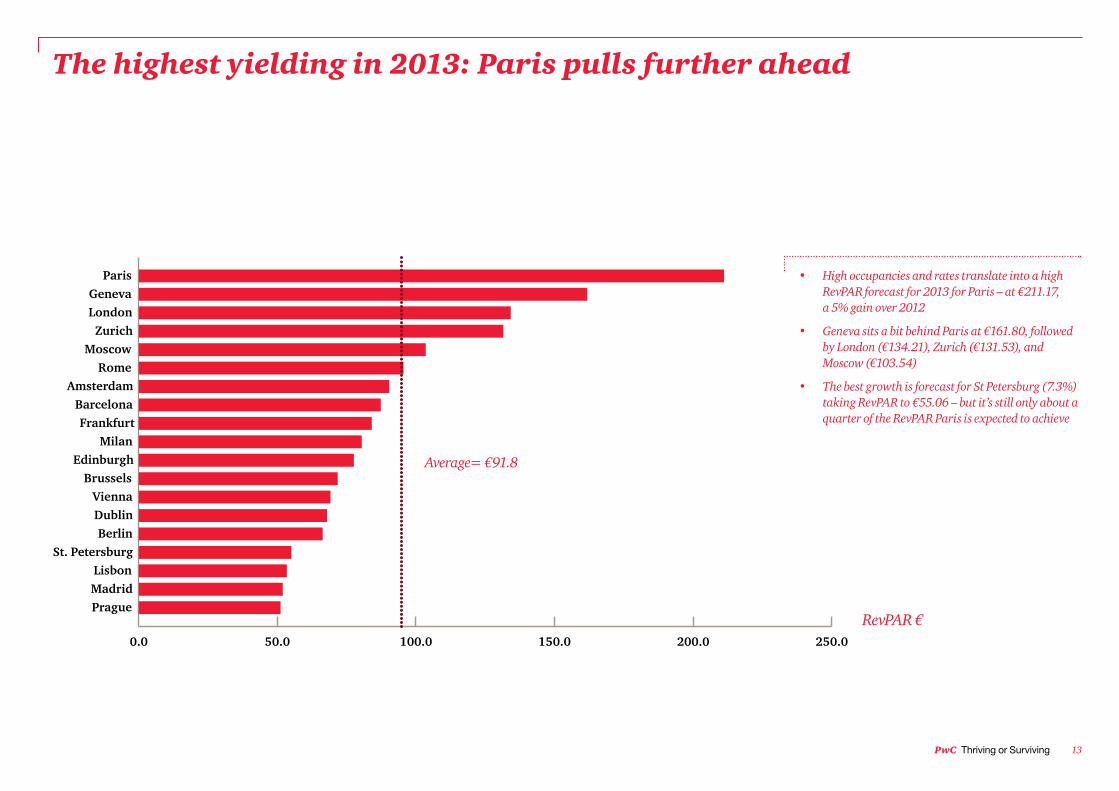
The highest yielding in 2013: Paris pulls further ahead
• High occupancies and rates translate into a high RevPAR forecast for 2013 for Paris – at €211.17, a 5% gain over 2012
• Geneva sits a bit behind Paris at €161.80, followed by London (€134.21), Zurich (€131.53), and Moscow (€103.54)
• The best growth is forecast for St Petersburg (7.3%) taking RevPAR to €55.06 – but it’s still only about a quarter of the RevPAR Paris is expected to achieve
RevPAR €
Average= €91.8
0.0 50.0 100.0 150.0 200.0 250.0
St. Petersburg
Milan
Paris
Edinburgh
London
Barcelona
Dublin
Amsterdam
Berlin
Zurich
Vienna
Prague
Frankfurt
Brussels
MoscowRome
Madrid
Geneva
Lisbon

14 European cities hotel forecast PwC
Trends, issues and challenges in the coming year
PwC Thriving or Surviving 15
Trends, issues and challenges for 2013
Fewer new customers to go round in 2013Little economic growth, and low consumer confidence across Europe means gaining new customers is expected to be difficult in 2013. Competition will be intense and it makes sense for hotels to concentrate on looking after and retaining existing business and leisure customers. Engaging with consumers is key.
Digital media is revolutionising choosing, booking, ‘experiencing’ and sharingHow hotels’ customers choose, compare prices, book and share opinions about their travel experience is undergoing radical transformation. Research by Accor into business traveller preferences revealed European business travellers are digital-savvy: 36% have downloaded a hotel booking application, and 49% always or from time to time share their opinions on social networks.
The research also revealed differences among French, German and British business travellers. As far as online booking is concerned, the British are well ahead of the French and the Germans when reserving directly via the hotel’s website (64% compared with 47% and 30%, respectively).
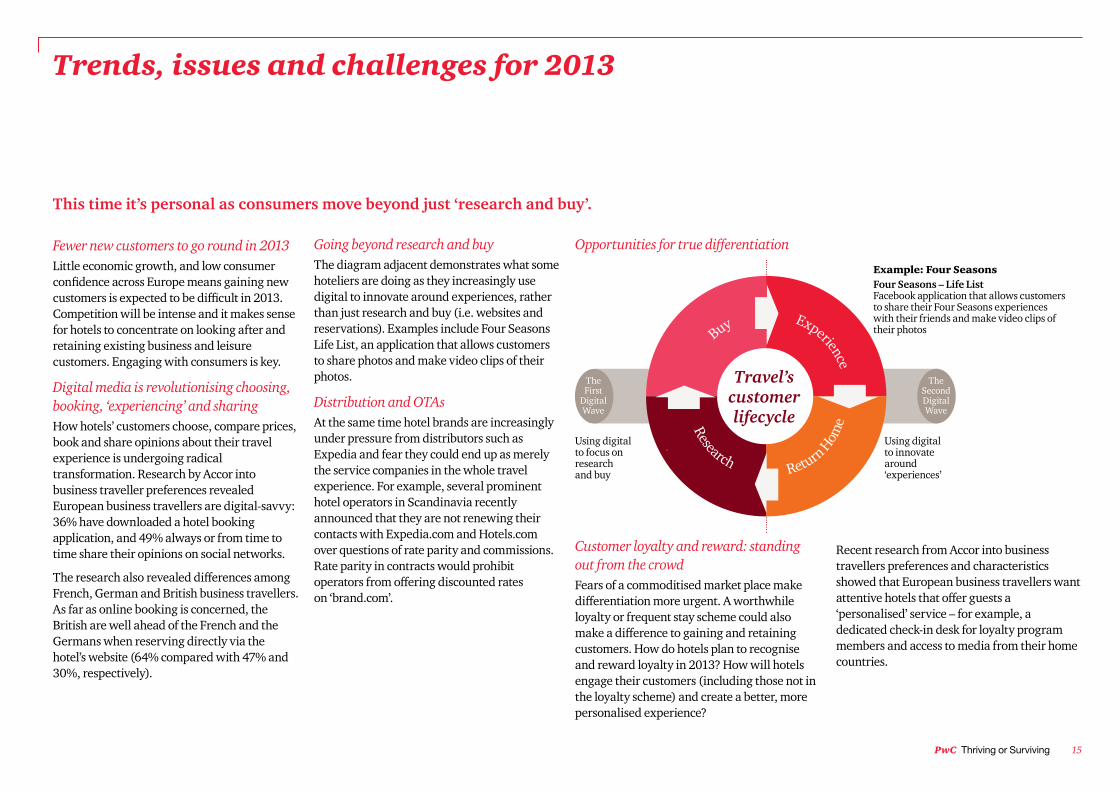
Going beyond research and buyThe diagram adjacent demonstrates what some hoteliers are doing as they increasingly use digital to innovate around experiences, rather than just research and buy (i.e. websites and reservations). Examples include Four Seasons Life List, an application that allows customers to share photos and make video clips of their photos.
Distribution and OTAsAt the same time hotel brands are increasingly under pressure from distributors such as Expedia and fear they could end up as merely the service companies in the whole travel experience. For example, several prominent hotel operators in Scandinavia recently announced that they are not renewing their contacts with Expedia.com and Hotels.com over questions of rate parity and commissions. Rate parity in contracts would prohibit operators from offering discounted rates on ‘brand.com’.
Customer loyalty and reward: standing out from the crowdFears of a commoditised market place make differentiation more urgent. A worthwhile loyalty or frequent stay scheme could also make a difference to gaining and retaining customers. How do hotels plan to recognise and reward loyalty in 2013? How will hotels engage their customers (including those not in the loyalty scheme) and create a better, more personalised experience?
Recent research from Accor into business travellers preferences and characteristics showed that European business travellers want attentive hotels that offer guests a ‘personalised’ service – for example, a dedicated check-in desk for loyalty program members and access to media from their home countries.
This time it’s personal as consumers move beyond just ‘research and buy’.
Travel’s customer lifecycle
Buy Experience
Return Hom
eResearch
The First
Digital Wave
The Second Digital Wave
Four Seasons – Life List Facebook application that allows customers to share their Four Seasons experiences with their friends and make video clips of their photos
Using digital to focus on research and buy
Using digital to innovate around ‘experiences’
Example: Four Seasons
Opportunities for true differentiation


PwC Thriving or Surviving 17
Economic, travel and supply outlook
18 European cities hotel forecast PwC
Economic outlook: the success of the hotel sector in 2013 depends in large part on how the eurozone crisis unfolds
European OutlookMost of the hotel markets we are analysing are based in the eurozone and many of the economic fundamentals across the currency bloc remain precarious. In particular, persistently high levels of government debt and deficits continue to threaten the stability of the region. At the same time, planned fiscal consolidation measures are becoming increasingly difficult to implement, as shown by the intensifying social unrest, most notably in Greece, Spain and Portugal.
Scenarios for the outcome of the eurozoneWith the level of uncertainty over the eurozone’s future remaining high, we express our view of its future in terms of three scenarios.
Our main, and most optimistic, scenario continues to assume loose monetary policy, additional rounds of ECB financing and greater fiscal transfers for the eurozone periphery. But even in this case we are expecting GDP across the currency area to decline by 0.7% in 2012, and then for there to be no growth in 2013.
Our first downside scenario involves a Greek exit but also a commitment by leaders of the remaining eurozone countries to ‘do whatever it takes’ to save the euro. In practice, this will mean building a firewall around vulnerable economies and accelerating fiscal austerity measures in the periphery to avoid ‘the Greek fate’. In this scenario, a contained Greek exit leads to a decline of 1.7% of the currency area’s GDP in 2013.
A more severe scenario assumes a Greek exit is contagious and the European authorities fail to keep the eurozone together. A ‘new euro bloc’ of the strong economies forms, benefiting from capital inflows but suffering a higher ‘new-euro’ exchange rate and more stringent fiscal rules. The breakaway economies would face depreciation, soaring inflation and falling output but perhaps also a boost to exports. Were this to occur, we would expect a more severe recession in 2013, with the eurozone economy contracting by 2.5%.
Non euro countriesWe are also looking at several non-euro economies, including Russia, the UK and Switzerland. We have a slightly more positive view of these countries. Growth in 2013 in the UK is expected to come in at 1.8%, stronger than any other large Western European economy. Russia is also expected to do well, with growth of 3.8% expected in 2013.
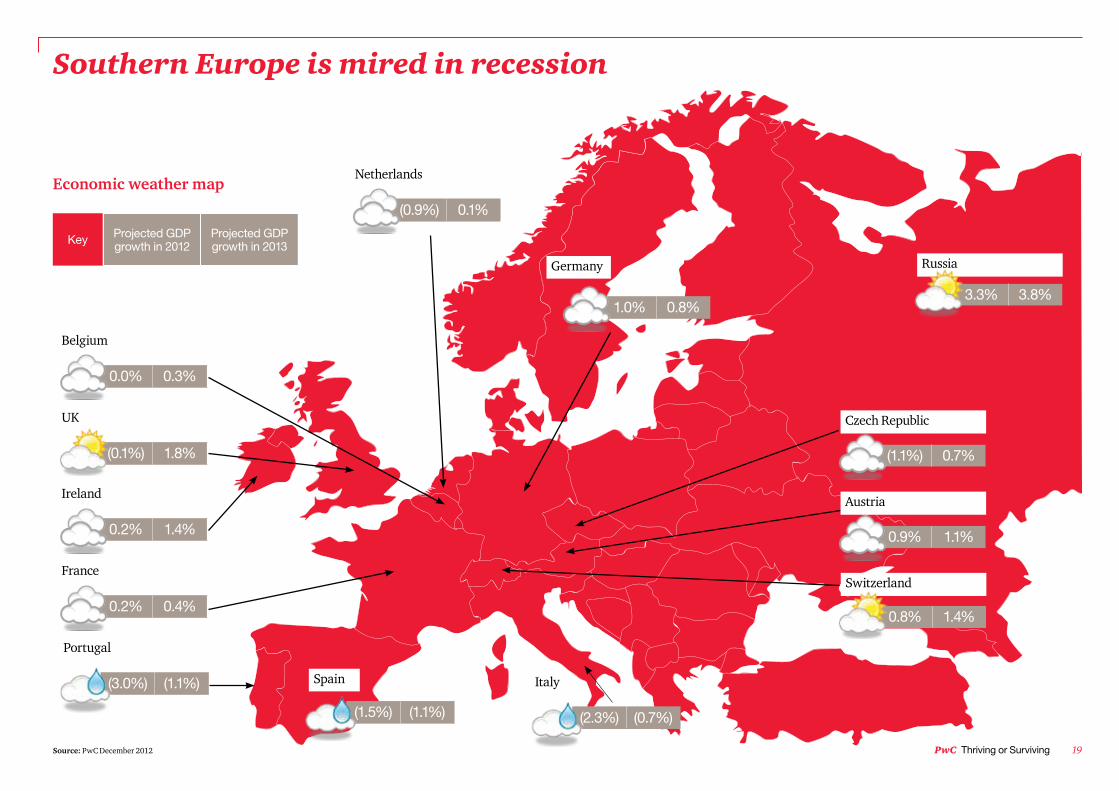
Switzerland is expected to expand by 1.4% in 2013, following growth of 0.8% in 2012. This is mirrored by increased flight of capital into Swiss real estate investment, as investors look to invest their money in a safer less volatile economy. The chart overleaf shows out forecast economic ‘weathermap’ for the countries with cities in this European cities hotel forecast.
“The tailwinds which supported growth for over two decades prior to the financial crisis – easy money, cheap imports and strong confidence – are no longer available to provide momentum to developed economies.”
Dr Andrew Sentance CBE, Senior Economic Adviser to PwC
Our forecasts are based on our main economic scenario. Should the euro crisis intensify, we may see a less encouraging outcome for hotels.
PwC Thriving or Surviving 19
Southern Europe is mired in recession
Key Projected GDP growth in 2012
Projected GDP growth in 2013
Belgium
0.0% 0.3%
Germany
1.0% 0.8%
Ireland
0.2% 1.4%
France
0.2% 0.4%
UK
(0.1%) 1.8%
Portugal
(3.0%) (1.1%) Italy
(2.3%) (0.7%)(1.5%) (1.1%)
Spain
Czech Republic
(1.1%) 0.7%
Austria
0.9% 1.1%
Switzerland
0.8% 1.4%
Russia
3.3% 3.8%
Economic weather map Netherlands
(0.9%) 0.1%
Source: PwC December 2012
20 European cities hotel forecast PwC
Travel outlook: resilient but inbound travel growth expected to be in short supply in 2013
Central and eastern Europe stars Despite ongoing economic troubles, tourism within Europe continued to grow in 2012 with increased arrivals from several key origin markets, according to the European Travel Commission (Q3 2012). However, the rate of growth started to slow. While some Western European destinations have posted growth in the first eight months of 2012, central and eastern European destinations continue to lead the way. Most travel in Europe is intra-European i.e. Europeans travelling within Europe and this segment saw demand grow as European travellers sought out cost savings with shorter trips closer to home.
Where are visitors coming from? Russia was the top performing intra European travel market in the first eight months of 2012. Germany and the Netherlands also showed growth especially to eastern European destinations. French travel was more mixed and there were weaker trends from Italy. The UK kicked off the year well but then trailed off.
Despite a recent slowdown, European destinations are also attracting more visitors from key long-haul origin markets. China is a target market for many countries and hotels – almost 5 million visitors came to Europe in 2012. This year American visits to eastern Europe showed some strong growth and more Japanese visitors were reported back in Europe.
No growth forecast for Europe inbound in 2013Looking ahead Tourism Economics’ global travel forecasts expect the outturn for 2012 to be 2.4% growth in inbound tourists to Europe. This compares to global growth of 3.7%, driven by Asia Pacific and Africa. Europe’s growth is expected to be led by western, central and eastern regions where growth approaches 4%. Not so for 2013, where Tourism Economics expect no growth in Europe (compares with a global growth forecast of 2.6%) with declines for western Europe and the southern Mediterranean region. The only glimmers of growth come from central and eastern Europe and the Baltic.
Business and meetings prospects A recent American Express survey concludes that in Europe the continuing euro crisis and economic uncertainty means the region will likely experience declines in both meeting spend and the number of meetings in 2013. Issues that will be key in 2013 include: meetings approvals becoming more difficult; increasing engagement via social media and a shift to local meetings. Top destinations for meetings in Europe are projected to be London, Paris, Amsterdam, Barcelona and Brussels. In contrast, some observers believe there are grounds for mild optimism as, having slipped so far, the only way is up for meetings and conferences.
“As Europe sees declines, meeting professionals in every region point to budget challenges and the need to ascertain their companies’ own financial performance before they make investments in meetings as top influencers of their programs. As a result, one of the top emerging trends in the space is the shift to more local meetings. Meetings professionals are also preparing for group hotel and air expenses to rise next year.”
Issa Jouaneh, Vice President and General Manager, American Express Meetings & Events, Hotels Magazine, November 2012
PwC Thriving or Surviving 21
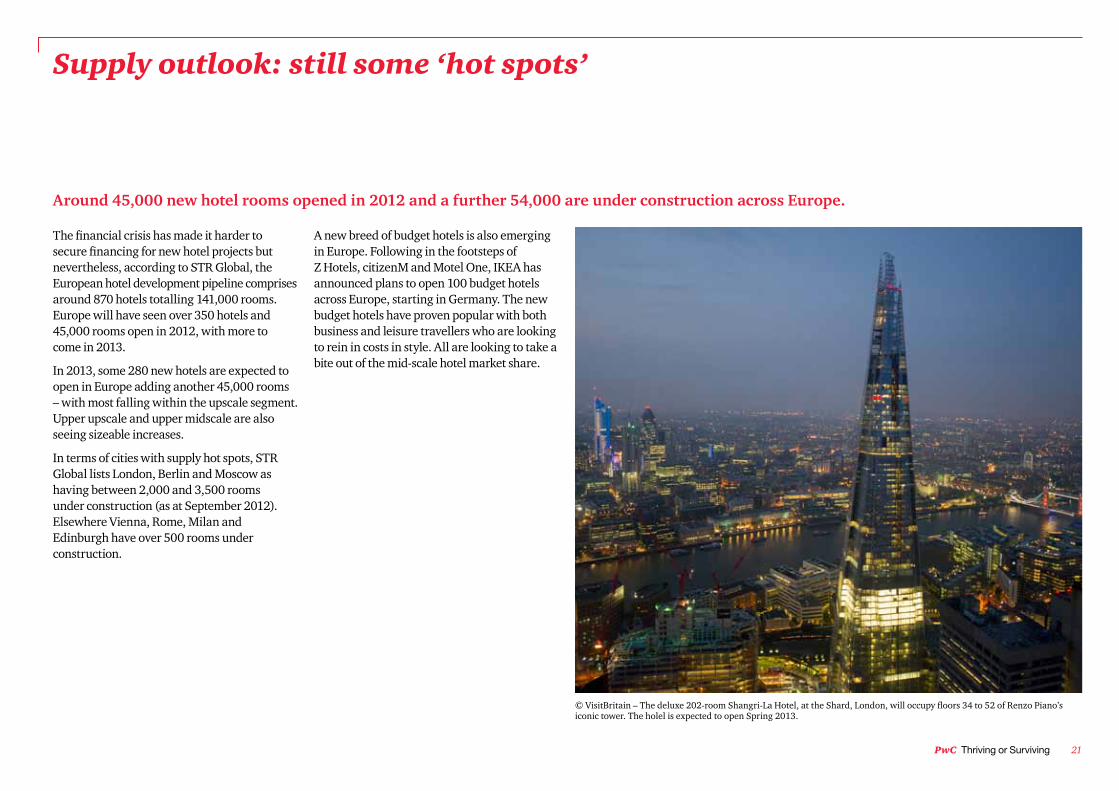
The financial crisis has made it harder to secure financing for new hotel projects but nevertheless, according to STR Global, the European hotel development pipeline comprises around 870 hotels totalling 141,000 rooms. Europe will have seen over 350 hotels and 45,000 rooms open in 2012, with more to come in 2013.
In 2013, some 280 new hotels are expected to open in Europe adding another 45,000 rooms – with most falling within the upscale segment. Upper upscale and upper midscale are also seeing sizeable increases.
In terms of cities with supply hot spots, STR Global lists London, Berlin and Moscow as having between 2,000 and 3,500 rooms under construction (as at September 2012). Elsewhere Vienna, Rome, Milan and Edinburgh have over 500 rooms under construction.
A new breed of budget hotels is also emerging in Europe. Following in the footsteps of Z Hotels, citizenM and Motel One, IKEA has announced plans to open 100 budget hotels across Europe, starting in Germany. The new budget hotels have proven popular with both business and leisure travellers who are looking to rein in costs in style. All are looking to take a bite out of the mid-scale hotel market share.
Supply outlook: still some ‘hot spots’
Around 45,000 new hotel rooms opened in 2012 and a further 54,000 are under construction across Europe.
© VisitBritain – The deluxe 202-room Shangri-La Hotel, at the Shard, London, will occupy floors 34 to 52 of Renzo Piano’s iconic tower. The holel is expected to open Spring 2013.

22 European cities hotel forecast PwC
Economic and travel outlook
Individual European cities hotel forecast 2013

PwC Thriving or Surviving 23
24 European cities hotel forecast PwC
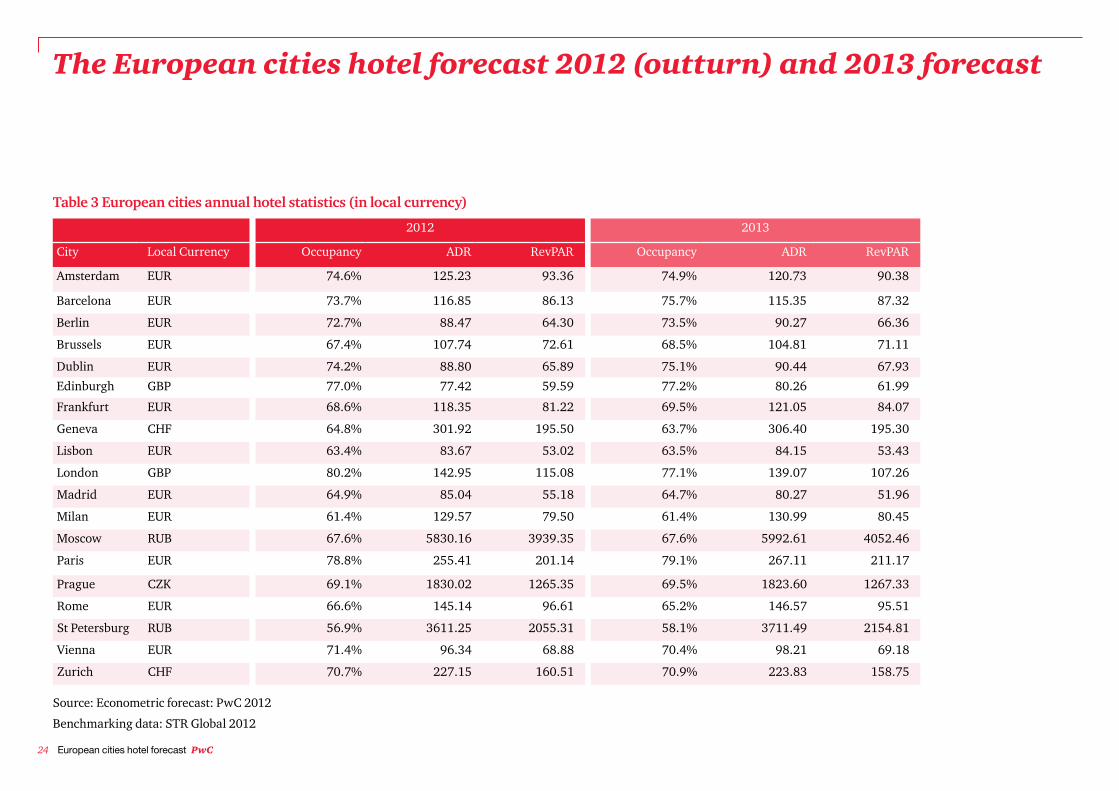
2012 2013
City Local Currency Occupancy ADR RevPAR Occupancy ADR RevPAR
Amsterdam EUR 74.6% 125.23 93.36 74.9% 120.73 90.38
Barcelona EUR 73.7% 116.85 86.13 75.7% 115.35 87.32
Berlin EUR 72.7% 88.47 64.30 73.5% 90.27 66.36
Brussels EUR 67.4% 107.74 72.61 68.5% 104.81 71.11
Dublin EUR 74.2% 88.80 65.89 75.1% 90.44 67.93
Edinburgh GBP 77.0% 77.42 59.59 77.2% 80.26 61.99
Frankfurt EUR 68.6% 118.35 81.22 69.5% 121.05 84.07
Geneva CHF 64.8% 301.92 195.50 63.7% 306.40 195.30
Lisbon EUR 63.4% 83.67 53.02 63.5% 84.15 53.43
London GBP 80.2% 142.95 115.08 77.1% 139.07 107.26
Madrid EUR 64.9% 85.04 55.18 64.7% 80.27 51.96
Milan EUR 61.4% 129.57 79.50 61.4% 130.99 80.45
Moscow RUB 67.6% 5830.16 3939.35 67.6% 5992.61 4052.46
Paris EUR 78.8% 255.41 201.14 79.1% 267.11 211.17
Prague CZK 69.1% 1830.02 1265.35 69.5% 1823.60 1267.33
Rome EUR 66.6% 145.14 96.61 65.2% 146.57 95.51
St Petersburg RUB 56.9% 3611.25 2055.31 58.1% 3711.49 2154.81
Vienna EUR 71.4% 96.34 68.88 70.4% 98.21 69.18
Zurich CHF 70.7% 227.15 160.51 70.9% 223.83 158.75
Table 3 European cities annual hotel statistics (in local currency)
The European cities hotel forecast 2012 (outturn) and 2013 forecast
Source: Econometric forecast: PwC 2012
Benchmarking data: STR Global 2012
PwC Thriving or Surviving 25
Amsterdam
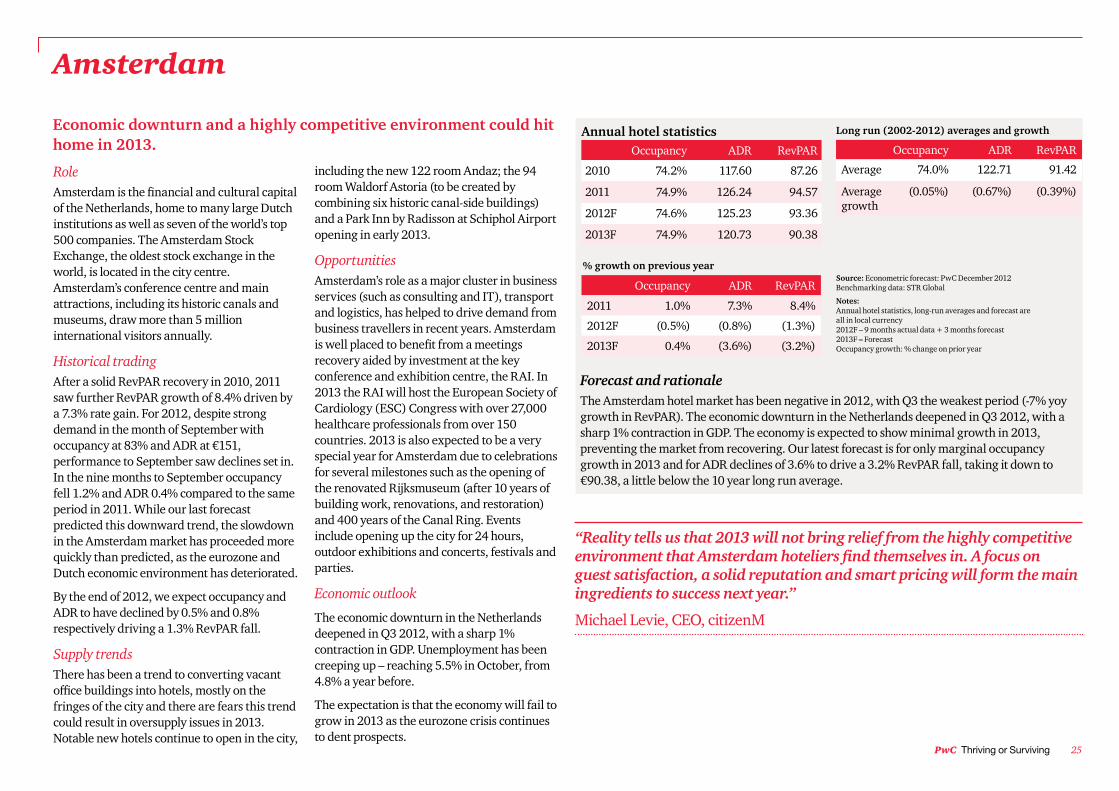
Economic downturn and a highly competitive environment could hit home in 2013.
RoleAmsterdam is the financial and cultural capital of the Netherlands, home to many large Dutch institutions as well as seven of the world’s top 500 companies. The Amsterdam Stock Exchange, the oldest stock exchange in the world, is located in the city centre. Amsterdam’s conference centre and main attractions, including its historic canals and museums, draw more than 5 million international visitors annually.
Historical trading After a solid RevPAR recovery in 2010, 2011 saw further RevPAR growth of 8.4% driven by a 7.3% rate gain. For 2012, despite strong demand in the month of September with occupancy at 83% and ADR at €151, performance to September saw declines set in. In the nine months to September occupancy fell 1.2% and ADR 0.4% compared to the same period in 2011. While our last forecast predicted this downward trend, the slowdown in the Amsterdam market has proceeded more quickly than predicted, as the eurozone and Dutch economic environment has deteriorated.
By the end of 2012, we expect occupancy and ADR to have declined by 0.5% and 0.8% respectively driving a 1.3% RevPAR fall.
Supply trendsThere has been a trend to converting vacant office buildings into hotels, mostly on the fringes of the city and there are fears this trend could result in oversupply issues in 2013. Notable new hotels continue to open in the city,
including the new 122 room Andaz; the 94 room Waldorf Astoria (to be created by combining six historic canal-side buildings) and a Park Inn by Radisson at Schiphol Airport opening in early 2013.
OpportunitiesAmsterdam’s role as a major cluster in business services (such as consulting and IT), transport and logistics, has helped to drive demand from business travellers in recent years. Amsterdam is well placed to benefit from a meetings recovery aided by investment at the key conference and exhibition centre, the RAI. In 2013 the RAI will host the European Society of Cardiology (ESC) Congress with over 27,000 healthcare professionals from over 150 countries. 2013 is also expected to be a very special year for Amsterdam due to celebrations for several milestones such as the opening of the renovated Rijksmuseum (after 10 years of building work, renovations, and restoration) and 400 years of the Canal Ring. Events include opening up the city for 24 hours, outdoor exhibitions and concerts, festivals and parties.
Economic outlook
The economic downturn in the Netherlands deepened in Q3 2012, with a sharp 1% contraction in GDP. Unemployment has been creeping up – reaching 5.5% in October, from 4.8% a year before.
The expectation is that the economy will fail to grow in 2013 as the eurozone crisis continues to dent prospects.
“Reality tells us that 2013 will not bring relief from the highly competitive environment that Amsterdam hoteliers find themselves in. A focus on guest satisfaction, a solid reputation and smart pricing will form the main ingredients to success next year.”
Michael Levie, CEO, citizenM
Annual hotel statistics Long run (2002-2012) averages and growth
% growth on previous year
Occupancy ADR RevPAR
2010 74.2% 117.60 87.26
2011 74.9% 126.24 94.57
2012F 74.6% 125.23 93.36
2013F 74.9% 120.73 90.38
Occupancy ADR RevPAR
Average 74.0% 122.71 91.42
Average growth
(0.05%) (0.67%) (0.39%)
Occupancy ADR RevPAR
2011 1.0% 7.3% 8.4%
2012F (0.5%) (0.8%) (1.3%)
2013F 0.4% (3.6%) (3.2%)
Source: Econometric forecast: PwC December 2012 Benchmarking data: STR Global
Notes: Annual hotel statistics, long-run averages and forecast are all in local currency 2012F – 9 months actual data + 3 months forecast 2013F – Forecast Occupancy growth: % change on prior year
Forecast and rationale The Amsterdam hotel market has been negative in 2012, with Q3 the weakest period (-7% yoy growth in RevPAR). The economic downturn in the Netherlands deepened in Q3 2012, with a sharp 1% contraction in GDP. The economy is expected to show minimal growth in 2013, preventing the market from recovering. Our latest forecast is for only marginal occupancy growth in 2013 and for ADR declines of 3.6% to drive a 3.2% RevPAR fall, taking it down to €90.38, a little below the 10 year long run average.
26 European cities hotel forecast PwC
Barcelona
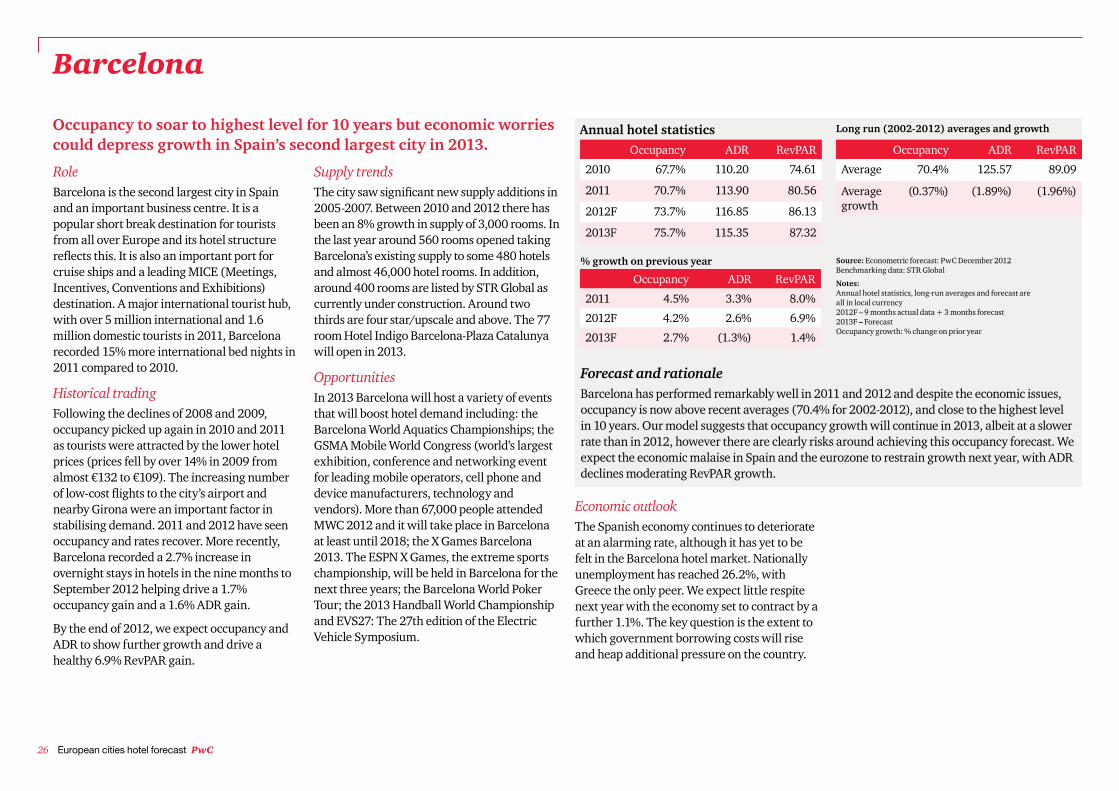
Occupancy to soar to highest level for 10 years but economic worries could depress growth in Spain’s second largest city in 2013.
RoleBarcelona is the second largest city in Spain and an important business centre. It is a popular short break destination for tourists from all over Europe and its hotel structure reflects this. It is also an important port for cruise ships and a leading MICE (Meetings, Incentives, Conventions and Exhibitions)destination. A major international tourist hub, with over 5 million international and 1.6 million domestic tourists in 2011, Barcelona recorded 15% more international bed nights in 2011 compared to 2010.
Historical trading Following the declines of 2008 and 2009, occupancy picked up again in 2010 and 2011 as tourists were attracted by the lower hotel prices (prices fell by over 14% in 2009 from almost €132 to €109). The increasing number of low-cost flights to the city’s airport and nearby Girona were an important factor in stabilising demand. 2011 and 2012 have seen occupancy and rates recover. More recently, Barcelona recorded a 2.7% increase in overnight stays in hotels in the nine months to September 2012 helping drive a 1.7% occupancy gain and a 1.6% ADR gain.
By the end of 2012, we expect occupancy and ADR to show further growth and drive a healthy 6.9% RevPAR gain.
Supply trendsThe city saw significant new supply additions in 2005-2007. Between 2010 and 2012 there has been an 8% growth in supply of 3,000 rooms. In the last year around 560 rooms opened taking Barcelona’s existing supply to some 480 hotels and almost 46,000 hotel rooms. In addition, around 400 rooms are listed by STR Global as currently under construction. Around two thirds are four star/upscale and above. The 77 room Hotel Indigo Barcelona-Plaza Catalunya will open in 2013.
Opportunities In 2013 Barcelona will host a variety of events that will boost hotel demand including: the Barcelona World Aquatics Championships; the GSMA Mobile World Congress (world’s largest exhibition, conference and networking event for leading mobile operators, cell phone and device manufacturers, technology and vendors). More than 67,000 people attended MWC 2012 and it will take place in Barcelona at least until 2018; the X Games Barcelona 2013. The ESPN X Games, the extreme sports championship, will be held in Barcelona for the next three years; the Barcelona World Poker Tour; the 2013 Handball World Championship and EVS27: The 27th edition of the Electric Vehicle Symposium.
Economic outlookThe Spanish economy continues to deteriorate at an alarming rate, although it has yet to be felt in the Barcelona hotel market. Nationally unemployment has reached 26.2%, with Greece the only peer. We expect little respite next year with the economy set to contract by a further 1.1%. The key question is the extent to which government borrowing costs will rise and heap additional pressure on the country.
Occupancy ADR RevPAR
2010 67.7% 110.20 74.61
2011 70.7% 113.90 80.56
2012F 73.7% 116.85 86.13
2013F 75.7% 115.35 87.32
Occupancy ADR RevPAR
2011 4.5% 3.3% 8.0%
2012F 4.2% 2.6% 6.9%
2013F 2.7% (1.3%) 1.4%
Source: Econometric forecast: PwC December 2012 Benchmarking data: STR Global
Notes: Annual hotel statistics, long-run averages and forecast are all in local currency 2012F – 9 months actual data + 3 months forecast 2013F – Forecast Occupancy growth: % change on prior year
Annual hotel statistics
% growth on previous year
Long run (2002-2012) averages and growth
Forecast and rationale Barcelona has performed remarkably well in 2011 and 2012 and despite the economic issues, occupancy is now above recent averages (70.4% for 2002-2012), and close to the highest level in 10 years. Our model suggests that occupancy growth will continue in 2013, albeit at a slower rate than in 2012, however there are clearly risks around achieving this occupancy forecast. We expect the economic malaise in Spain and the eurozone to restrain growth next year, with ADR declines moderating RevPAR growth.
Occupancy ADR RevPAR
Average 70.4% 125.57 89.09
Average growth
(0.37%) (1.89%) (1.96%)
PwC Thriving or Surviving 27
Annual hotel statistics Long run (2002-2012) averages and growth
% growth on previous yearSource: Econometric forecast: PwC December 2012 Benchmarking data: STR Global
Notes: Annual hotel statistics, long-run averages and forecast are all in local currency 2012F – 9 months actual data + 3 months forecast 2013F – Forecast Occupancy growth: % change on prior year
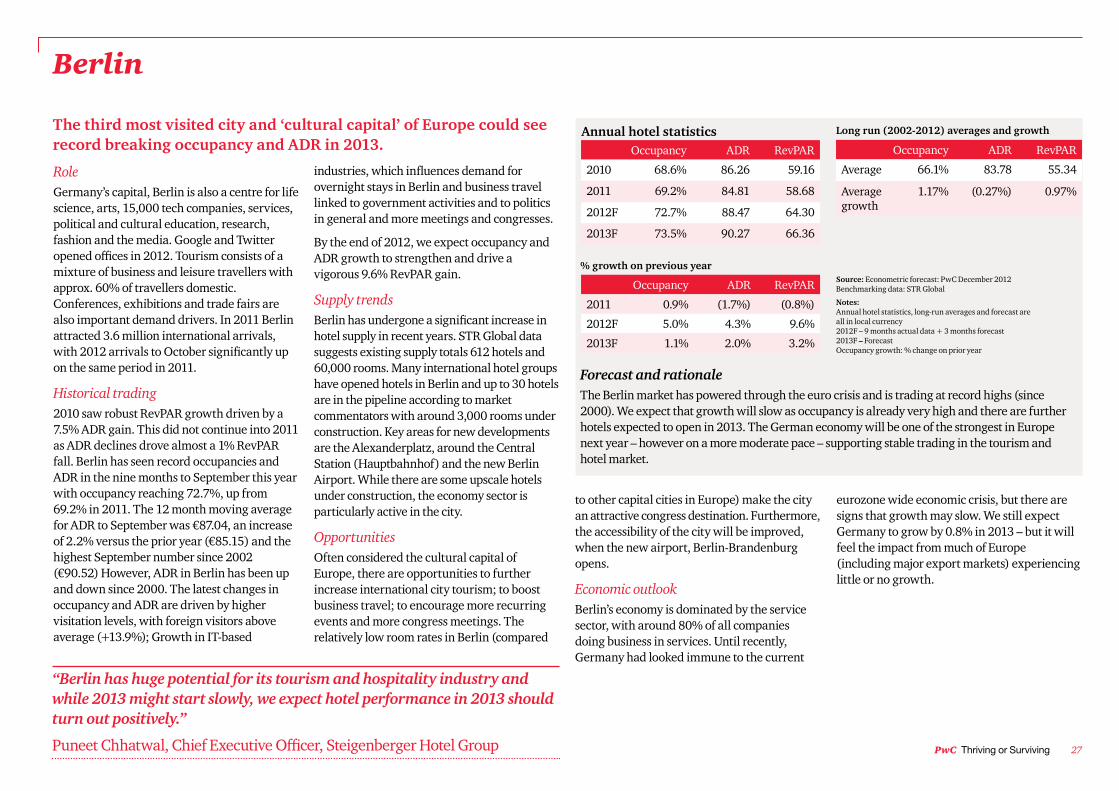
The third most visited city and ‘cultural capital’ of Europe could see record breaking occupancy and ADR in 2013.
RoleGermany’s capital, Berlin is also a centre for life science, arts, 15,000 tech companies, services, political and cultural education, research, fashion and the media. Google and Twitter opened offices in 2012. Tourism consists of a mixture of business and leisure travellers with approx. 60% of travellers domestic. Conferences, exhibitions and trade fairs are also important demand drivers. In 2011 Berlin attracted 3.6 million international arrivals, with 2012 arrivals to October significantly up on the same period in 2011.
Historical trading 2010 saw robust RevPAR growth driven by a 7.5% ADR gain. This did not continue into 2011 as ADR declines drove almost a 1% RevPAR fall. Berlin has seen record occupancies and ADR in the nine months to September this year with occupancy reaching 72.7%, up from 69.2% in 2011. The 12 month moving average for ADR to September was €87.04, an increase of 2.2% versus the prior year (€85.15) and the highest September number since 2002 (€90.52) However, ADR in Berlin has been up and down since 2000. The latest changes in occupancy and ADR are driven by higher visitation levels, with foreign visitors above average (+13.9%); Growth in IT-based
industries, which influences demand for overnight stays in Berlin and business travel linked to government activities and to politics in general and more meetings and congresses.
By the end of 2012, we expect occupancy and ADR growth to strengthen and drive a vigorous 9.6% RevPAR gain.
Supply trendsBerlin has undergone a significant increase in hotel supply in recent years. STR Global data suggests existing supply totals 612 hotels and 60,000 rooms. Many international hotel groups have opened hotels in Berlin and up to 30 hotels are in the pipeline according to market commentators with around 3,000 rooms under construction. Key areas for new developments are the Alexanderplatz, around the Central Station (Hauptbahnhof) and the new Berlin Airport. While there are some upscale hotels under construction, the economy sector is particularly active in the city.
Opportunities Often considered the cultural capital of Europe, there are opportunities to further increase international city tourism; to boost business travel; to encourage more recurring events and more congress meetings. The relatively low room rates in Berlin (compared
Occupancy ADR RevPAR
2010 68.6% 86.26 59.16
2011 69.2% 84.81 58.68
2012F 72.7% 88.47 64.30
2013F 73.5% 90.27 66.36
Occupancy ADR RevPAR
2011 0.9% (1.7%) (0.8%)
2012F 5.0% 4.3% 9.6%
2013F 1.1% 2.0% 3.2%
to other capital cities in Europe) make the city an attractive congress destination. Furthermore, the accessibility of the city will be improved, when the new airport, Berlin-Brandenburg opens.
Economic outlookBerlin’s economy is dominated by the service sector, with around 80% of all companies doing business in services. Until recently, Germany had looked immune to the current
eurozone wide economic crisis, but there are signs that growth may slow. We still expect Germany to grow by 0.8% in 2013 – but it will feel the impact from much of Europe (including major export markets) experiencing little or no growth.
Forecast and rationale The Berlin market has powered through the euro crisis and is trading at record highs (since 2000). We expect that growth will slow as occupancy is already very high and there are further hotels expected to open in 2013. The German economy will be one of the strongest in Europe next year – however on a more moderate pace – supporting stable trading in the tourism and hotel market.
Occupancy ADR RevPAR
Average 66.1% 83.78 55.34
Average growth
1.17% (0.27%) 0.97%
“Berlin has huge potential for its tourism and hospitality industry and while 2013 might start slowly, we expect hotel performance in 2013 should turn out positively.”
Puneet Chhatwal, Chief Executive Officer, Steigenberger Hotel Group
Berlin

28 European cities hotel forecast PwC
PwC Thriving or Surviving 29
Annual hotel statistics Long run (2002-2012) averages and growth
Source: Econometric forecast: PwC December 2012 Benchmarking data: STR Global
Notes: Annual hotel statistics, long-run averages and forecast are all in local currency 2012F – 9 months actual data + 3 months forecast 2013F – Forecast Occupancy growth: % change on prior year
% growth on previous year
Brussels
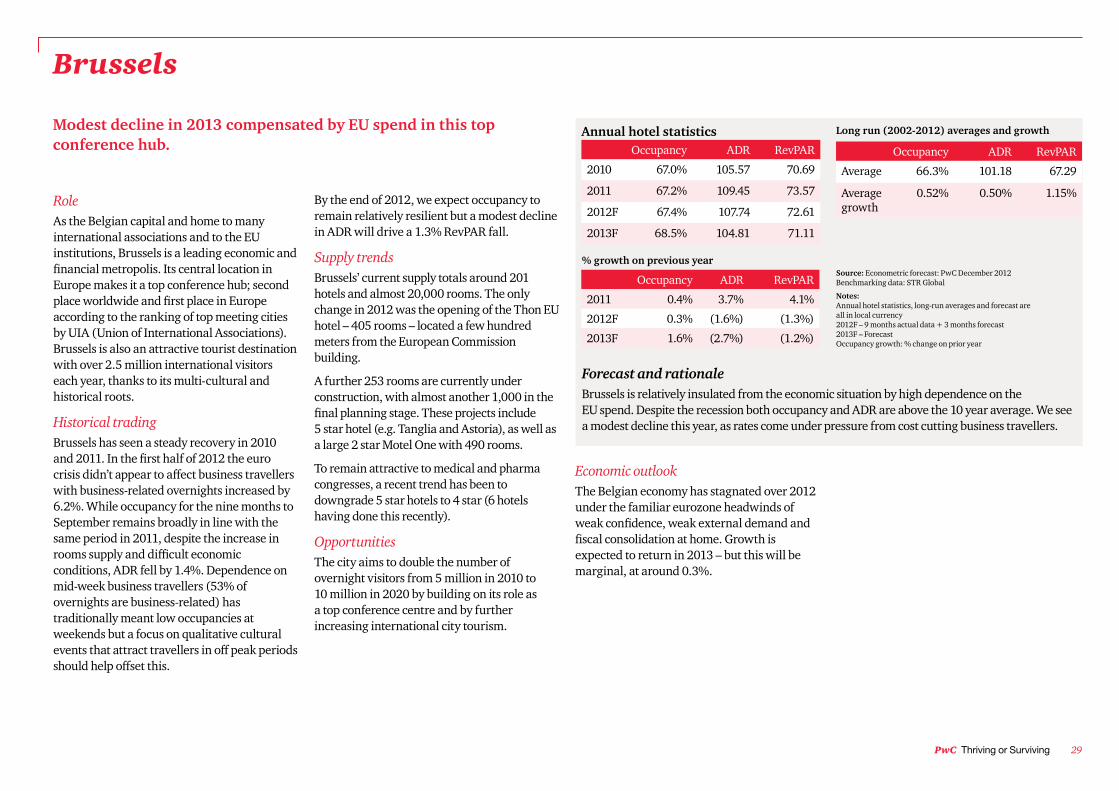
Modest decline in 2013 compensated by EU spend in this top conference hub.
RoleAs the Belgian capital and home to many international associations and to the EU institutions, Brussels is a leading economic and financial metropolis. Its central location in Europe makes it a top conference hub; second place worldwide and first place in Europe according to the ranking of top meeting cities by UIA (Union of International Associations). Brussels is also an attractive tourist destination with over 2.5 million international visitors each year, thanks to its multi-cultural and historical roots.
Historical trading Brussels has seen a steady recovery in 2010 and 2011. In the first half of 2012 the euro crisis didn’t appear to affect business travellers with business-related overnights increased by 6.2%. While occupancy for the nine months to September remains broadly in line with the same period in 2011, despite the increase in rooms supply and difficult economic conditions, ADR fell by 1.4%. Dependence on mid-week business travellers (53% of overnights are business-related) has traditionally meant low occupancies at weekends but a focus on qualitative cultural events that attract travellers in off peak periods should help offset this.
By the end of 2012, we expect occupancy to remain relatively resilient but a modest decline in ADR will drive a 1.3% RevPAR fall.
Supply trendsBrussels’ current supply totals around 201 hotels and almost 20,000 rooms. The only change in 2012 was the opening of the Thon EU hotel – 405 rooms – located a few hundred meters from the European Commission building.
A further 253 rooms are currently under construction, with almost another 1,000 in the final planning stage. These projects include 5 star hotel (e.g. Tanglia and Astoria), as well as a large 2 star Motel One with 490 rooms.
To remain attractive to medical and pharma congresses, a recent trend has been to downgrade 5 star hotels to 4 star (6 hotels having done this recently).
Opportunities The city aims to double the number of overnight visitors from 5 million in 2010 to 10 million in 2020 by building on its role as a top conference centre and by further increasing international city tourism.
Occupancy ADR RevPAR
2010 67.0% 105.57 70.69
2011 67.2% 109.45 73.57
2012F 67.4% 107.74 72.61
2013F 68.5% 104.81 71.11
Occupancy ADR RevPAR
2011 0.4% 3.7% 4.1%
2012F 0.3% (1.6%) (1.3%)
2013F 1.6% (2.7%) (1.2%)
Forecast and rationale Brussels is relatively insulated from the economic situation by high dependence on the EU spend. Despite the recession both occupancy and ADR are above the 10 year average. We see a modest decline this year, as rates come under pressure from cost cutting business travellers.
Economic outlookThe Belgian economy has stagnated over 2012 under the familiar eurozone headwinds of weak confidence, weak external demand and fiscal consolidation at home. Growth is expected to return in 2013 – but this will be marginal, at around 0.3%.
Occupancy ADR RevPAR
Average 66.3% 101.18 67.29
Average growth
0.52% 0.50% 1.15%
30 European cities hotel forecast PwC
Annual hotel statistics Long run (2002-2012) averages and growth
% growth on previous yearSource: Econometric forecast: PwC December 2012 Benchmarking data: STR Global
Notes: Annual hotel statistics, long-run averages and forecast are all in local currency 2012F – 9 months actual data + 3 months forecast 2013F – Forecast Occupancy growth: % change on prior year
Dublin
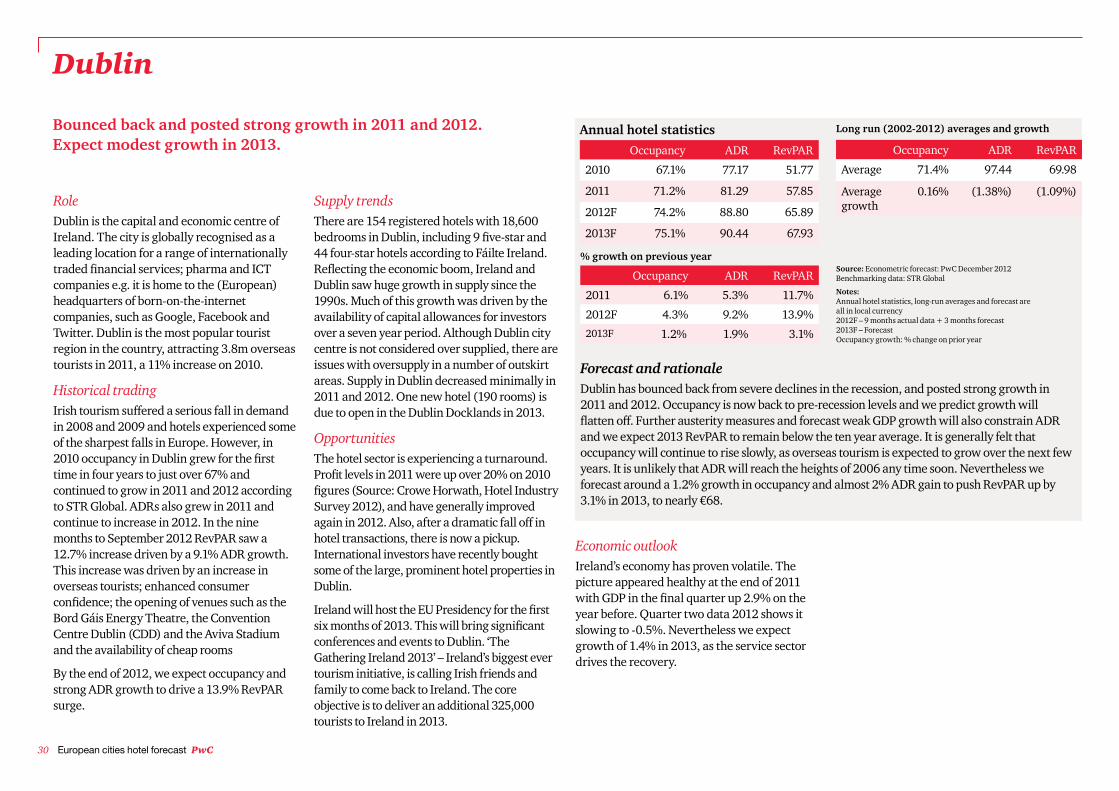
Bounced back and posted strong growth in 2011 and 2012. Expect modest growth in 2013.
RoleDublin is the capital and economic centre of Ireland. The city is globally recognised as a leading location for a range of internationally traded financial services; pharma and ICT companies e.g. it is home to the (European) headquarters of born-on-the-internet companies, such as Google, Facebook and Twitter. Dublin is the most popular tourist region in the country, attracting 3.8m overseas tourists in 2011, a 11% increase on 2010.
Historical tradingIrish tourism suffered a serious fall in demand in 2008 and 2009 and hotels experienced some of the sharpest falls in Europe. However, in 2010 occupancy in Dublin grew for the first time in four years to just over 67% and continued to grow in 2011 and 2012 according to STR Global. ADRs also grew in 2011 and continue to increase in 2012. In the nine months to September 2012 RevPAR saw a 12.7% increase driven by a 9.1% ADR growth. This increase was driven by an increase in overseas tourists; enhanced consumer confidence; the opening of venues such as the Bord Gáis Energy Theatre, the Convention Centre Dublin (CDD) and the Aviva Stadium and the availability of cheap rooms
By the end of 2012, we expect occupancy and strong ADR growth to drive a 13.9% RevPAR surge.
Occupancy ADR RevPAR
2010 67.1% 77.17 51.77
2011 71.2% 81.29 57.85
2012F 74.2% 88.80 65.89
2013F 75.1% 90.44 67.93
Occupancy ADR RevPAR
2011 6.1% 5.3% 11.7%
2012F 4.3% 9.2% 13.9%
2013F 1.2% 1.9% 3.1%
Supply trendsThere are 154 registered hotels with 18,600 bedrooms in Dublin, including 9 five-star and 44 four-star hotels according to Fáilte Ireland. Reflecting the economic boom, Ireland and Dublin saw huge growth in supply since the 1990s. Much of this growth was driven by the availability of capital allowances for investors over a seven year period. Although Dublin city centre is not considered over supplied, there are issues with oversupply in a number of outskirt areas. Supply in Dublin decreased minimally in 2011 and 2012. One new hotel (190 rooms) is due to open in the Dublin Docklands in 2013.
OpportunitiesThe hotel sector is experiencing a turnaround. Profit levels in 2011 were up over 20% on 2010 figures (Source: Crowe Horwath, Hotel Industry Survey 2012), and have generally improved again in 2012. Also, after a dramatic fall off in hotel transactions, there is now a pickup. International investors have recently bought some of the large, prominent hotel properties in Dublin.
Ireland will host the EU Presidency for the first six months of 2013. This will bring significant conferences and events to Dublin. ‘The Gathering Ireland 2013’ – Ireland’s biggest ever tourism initiative, is calling Irish friends and family to come back to Ireland. The core objective is to deliver an additional 325,000 tourists to Ireland in 2013.
Forecast and rationale Dublin has bounced back from severe declines in the recession, and posted strong growth in 2011 and 2012. Occupancy is now back to pre-recession levels and we predict growth will flatten off. Further austerity measures and forecast weak GDP growth will also constrain ADR and we expect 2013 RevPAR to remain below the ten year average. It is generally felt that occupancy will continue to rise slowly, as overseas tourism is expected to grow over the next few years. It is unlikely that ADR will reach the heights of 2006 any time soon. Nevertheless we forecast around a 1.2% growth in occupancy and almost 2% ADR gain to push RevPAR up by 3.1% in 2013, to nearly €68.
Economic outlookIreland’s economy has proven volatile. The picture appeared healthy at the end of 2011 with GDP in the final quarter up 2.9% on the year before. Quarter two data 2012 shows it slowing to -0.5%. Nevertheless we expect growth of 1.4% in 2013, as the service sector drives the recovery.
Occupancy ADR RevPAR
Average 71.4% 97.44 69.98
Average growth
0.16% (1.38%) (1.09%)
PwC Thriving or Surviving 31
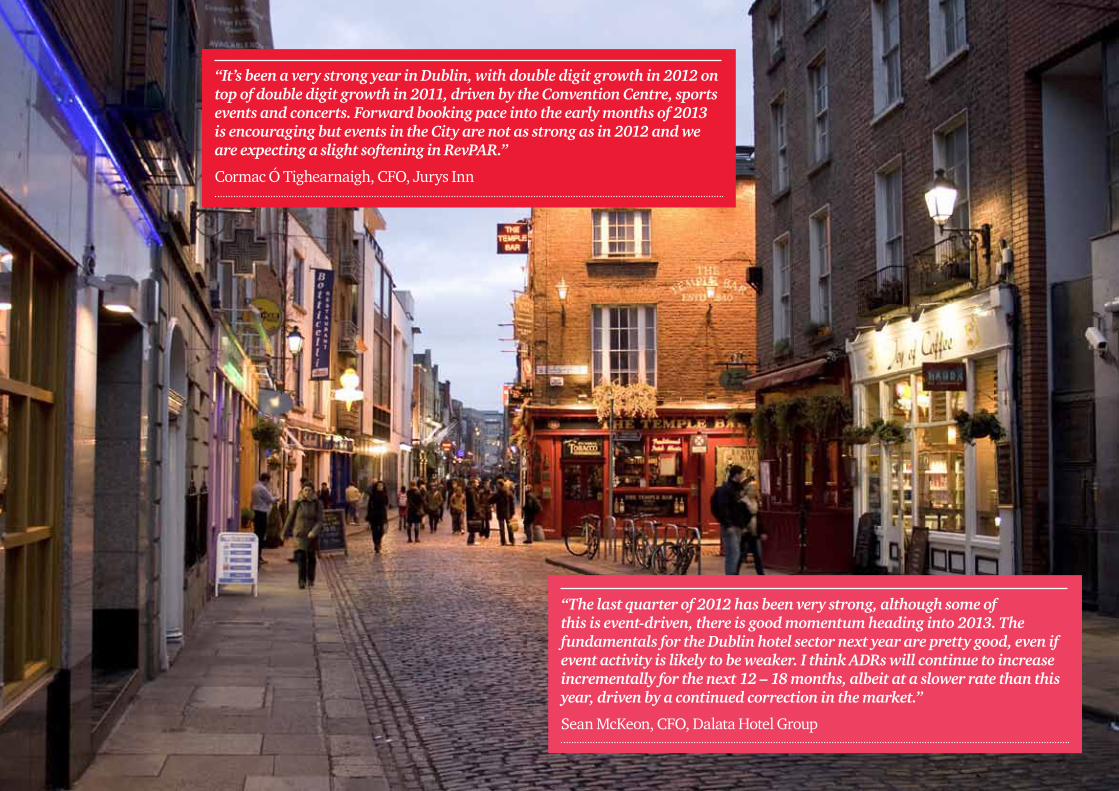
“The last quarter of 2012 has been very strong, although some of this is event-driven, there is good momentum heading into 2013. The fundamentals for the Dublin hotel sector next year are pretty good, even if event activity is likely to be weaker. I think ADRs will continue to increase incrementally for the next 12 – 18 months, albeit at a slower rate than this year, driven by a continued correction in the market.”
Sean McKeon, CFO, Dalata Hotel Group
“It’s been a very strong year in Dublin, with double digit growth in 2012 on top of double digit growth in 2011, driven by the Convention Centre, sports events and concerts. Forward booking pace into the early months of 2013 is encouraging but events in the City are not as strong as in 2012 and we are expecting a slight softening in RevPAR.”
Cormac Ó Tighearnaigh, CFO, Jurys Inn
32 European cities hotel forecast PwC
Annual hotel statistics Long run (2002-2012) averages and growth
% growth on previous yearSource: Econometric forecast: PwC December 2012 Benchmarking data: STR Global
Notes: Annual hotel statistics, long-run averages and forecast are all in local currency 2012F – 9 months actual data + 3 months forecast 2013F – Forecast Occupancy growth: % change on prior year
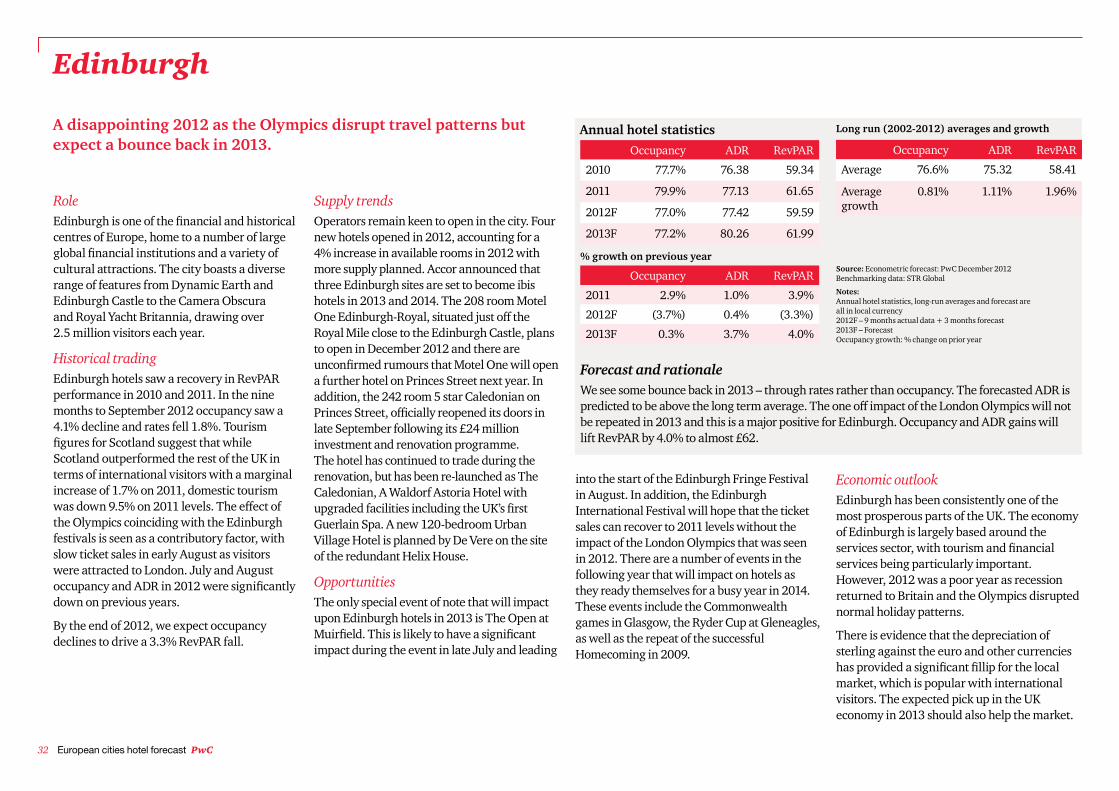
Edinburgh
A disappointing 2012 as the Olympics disrupt travel patterns but expect a bounce back in 2013.
RoleEdinburgh is one of the financial and historical centres of Europe, home to a number of large global financial institutions and a variety of cultural attractions. The city boasts a diverse range of features from Dynamic Earth and Edinburgh Castle to the Camera Obscura and Royal Yacht Britannia, drawing over 2.5 million visitors each year.
Historical trading Edinburgh hotels saw a recovery in RevPAR performance in 2010 and 2011. In the nine months to September 2012 occupancy saw a 4.1% decline and rates fell 1.8%. Tourism figures for Scotland suggest that while Scotland outperformed the rest of the UK in terms of international visitors with a marginal increase of 1.7% on 2011, domestic tourism was down 9.5% on 2011 levels. The effect of the Olympics coinciding with the Edinburgh festivals is seen as a contributory factor, with slow ticket sales in early August as visitors were attracted to London. July and August occupancy and ADR in 2012 were significantly down on previous years.
By the end of 2012, we expect occupancy declines to drive a 3.3% RevPAR fall.
Supply trendsOperators remain keen to open in the city. Four new hotels opened in 2012, accounting for a 4% increase in available rooms in 2012 with more supply planned. Accor announced that three Edinburgh sites are set to become ibis hotels in 2013 and 2014. The 208 room Motel One Edinburgh-Royal, situated just off the Royal Mile close to the Edinburgh Castle, plans to open in December 2012 and there are unconfirmed rumours that Motel One will open a further hotel on Princes Street next year. In addition, the 242 room 5 star Caledonian on Princes Street, officially reopened its doors in late September following its £24 million investment and renovation programme. The hotel has continued to trade during the renovation, but has been re-launched as The Caledonian, A Waldorf Astoria Hotel with upgraded facilities including the UK’s first Guerlain Spa. A new 120-bedroom Urban Village Hotel is planned by De Vere on the site of the redundant Helix House.
OpportunitiesThe only special event of note that will impact upon Edinburgh hotels in 2013 is The Open at Muirfield. This is likely to have a significant impact during the event in late July and leading
Occupancy ADR RevPAR
2010 77.7% 76.38 59.34
2011 79.9% 77.13 61.65
2012F 77.0% 77.42 59.59
2013F 77.2% 80.26 61.99
Occupancy ADR RevPAR
2011 2.9% 1.0% 3.9%
2012F (3.7%) 0.4% (3.3%)
2013F 0.3% 3.7% 4.0%
Forecast and rationale We see some bounce back in 2013 – through rates rather than occupancy. The forecasted ADR is predicted to be above the long term average. The one off impact of the London Olympics will not be repeated in 2013 and this is a major positive for Edinburgh. Occupancy and ADR gains will lift RevPAR by 4.0% to almost £62.
into the start of the Edinburgh Fringe Festival in August. In addition, the Edinburgh International Festival will hope that the ticket sales can recover to 2011 levels without the impact of the London Olympics that was seen in 2012. There are a number of events in the following year that will impact on hotels as they ready themselves for a busy year in 2014. These events include the Commonwealth games in Glasgow, the Ryder Cup at Gleneagles, as well as the repeat of the successful Homecoming in 2009.
Economic outlookEdinburgh has been consistently one of the most prosperous parts of the UK. The economy of Edinburgh is largely based around the services sector, with tourism and financial services being particularly important. However, 2012 was a poor year as recession returned to Britain and the Olympics disrupted normal holiday patterns.
There is evidence that the depreciation of sterling against the euro and other currencies has provided a significant fillip for the local market, which is popular with international visitors. The expected pick up in the UK economy in 2013 should also help the market.
Occupancy ADR RevPAR
Average 76.6% 75.32 58.41
Average growth
0.81% 1.11% 1.96%
PwC Thriving or Surviving 33
Annual hotel statistics Long run (2002-2012) averages and growth
Source: Econometric forecast: PwC December 2012 Benchmarking data: STR Global
Notes: Annual hotel statistics, long-run averages and forecast are all in local currency 2012F – 9 months actual data + 3 months forecast 2013F – Forecast Occupancy growth: % change on prior year
% growth on previous year
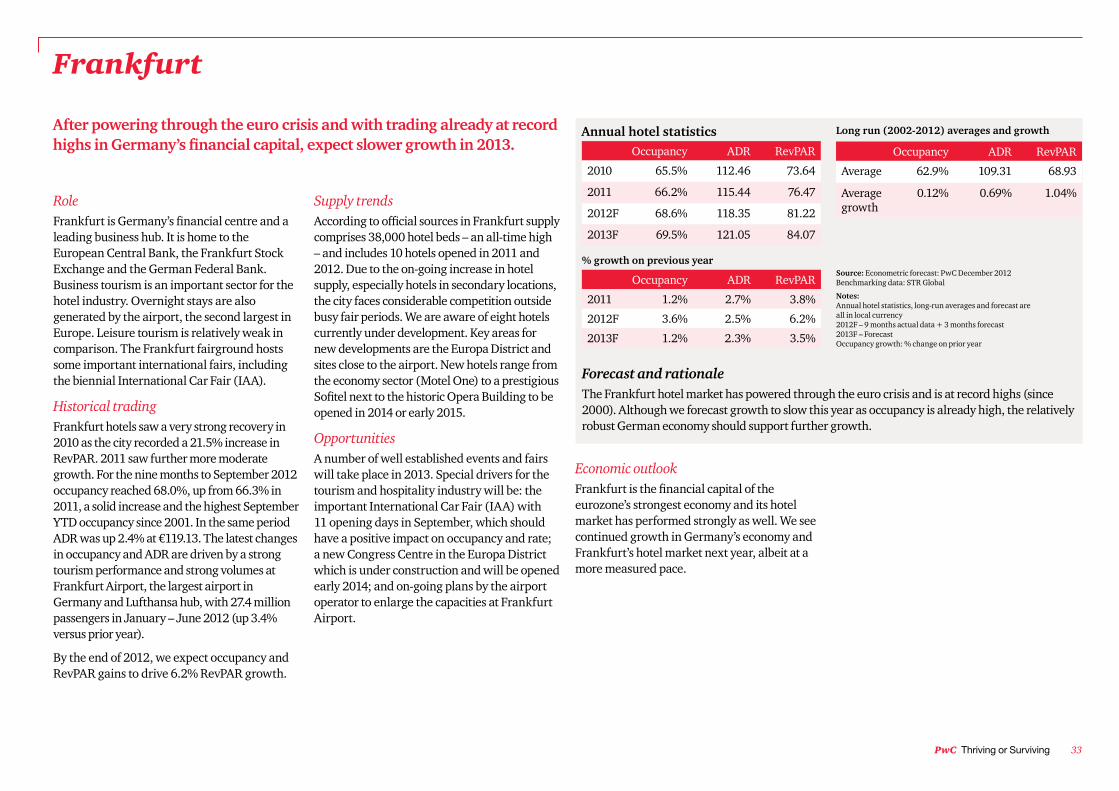
Forecast and rationale The Frankfurt hotel market has powered through the euro crisis and is at record highs (since 2000). Although we forecast growth to slow this year as occupancy is already high, the relatively robust German economy should support further growth.
Frankfurt
After powering through the euro crisis and with trading already at record highs in Germany’s financial capital, expect slower growth in 2013.
RoleFrankfurt is Germany’s financial centre and a leading business hub. It is home to the European Central Bank, the Frankfurt Stock Exchange and the German Federal Bank. Business tourism is an important sector for the hotel industry. Overnight stays are also generated by the airport, the second largest in Europe. Leisure tourism is relatively weak in comparison. The Frankfurt fairground hosts some important international fairs, including the biennial International Car Fair (IAA).
Historical trading Frankfurt hotels saw a very strong recovery in 2010 as the city recorded a 21.5% increase in RevPAR. 2011 saw further more moderate growth. For the nine months to September 2012 occupancy reached 68.0%, up from 66.3% in 2011, a solid increase and the highest September YTD occupancy since 2001. In the same period ADR was up 2.4% at €119.13. The latest changes in occupancy and ADR are driven by a strong tourism performance and strong volumes at Frankfurt Airport, the largest airport in Germany and Lufthansa hub, with 27.4 million passengers in January – June 2012 (up 3.4% versus prior year).
By the end of 2012, we expect occupancy and RevPAR gains to drive 6.2% RevPAR growth.
Supply trendsAccording to official sources in Frankfurt supply comprises 38,000 hotel beds – an all-time high – and includes 10 hotels opened in 2011 and 2012. Due to the on-going increase in hotel supply, especially hotels in secondary locations, the city faces considerable competition outside busy fair periods. We are aware of eight hotels currently under development. Key areas for new developments are the Europa District and sites close to the airport. New hotels range from the economy sector (Motel One) to a prestigious Sofitel next to the historic Opera Building to be opened in 2014 or early 2015.
OpportunitiesA number of well established events and fairs will take place in 2013. Special drivers for the tourism and hospitality industry will be: the important International Car Fair (IAA) with 11 opening days in September, which should have a positive impact on occupancy and rate; a new Congress Centre in the Europa District which is under construction and will be opened early 2014; and on-going plans by the airport operator to enlarge the capacities at Frankfurt Airport.
Occupancy ADR RevPAR
2010 65.5% 112.46 73.64
2011 66.2% 115.44 76.47
2012F 68.6% 118.35 81.22
2013F 69.5% 121.05 84.07
Occupancy ADR RevPAR
2011 1.2% 2.7% 3.8%
2012F 3.6% 2.5% 6.2%
2013F 1.2% 2.3% 3.5%
Economic outlookFrankfurt is the financial capital of the eurozone’s strongest economy and its hotel market has performed strongly as well. We see continued growth in Germany’s economy and Frankfurt’s hotel market next year, albeit at a more measured pace.
Occupancy ADR RevPAR
Average 62.9% 109.31 68.93
Average growth
0.12% 0.69% 1.04%
34 European cities hotel forecast PwC
Annual hotel statistics Long run (2002-2012) averages and growth
% growth on previous yearSource: Econometric forecast: PwC December 2012 Benchmarking data: STR Global
Notes: Annual hotel statistics, long-run averages and forecast are all in local currency 2012F – 9 months actual data + 3 months forecast 2013F – Forecast Occupancy growth: % change on prior year
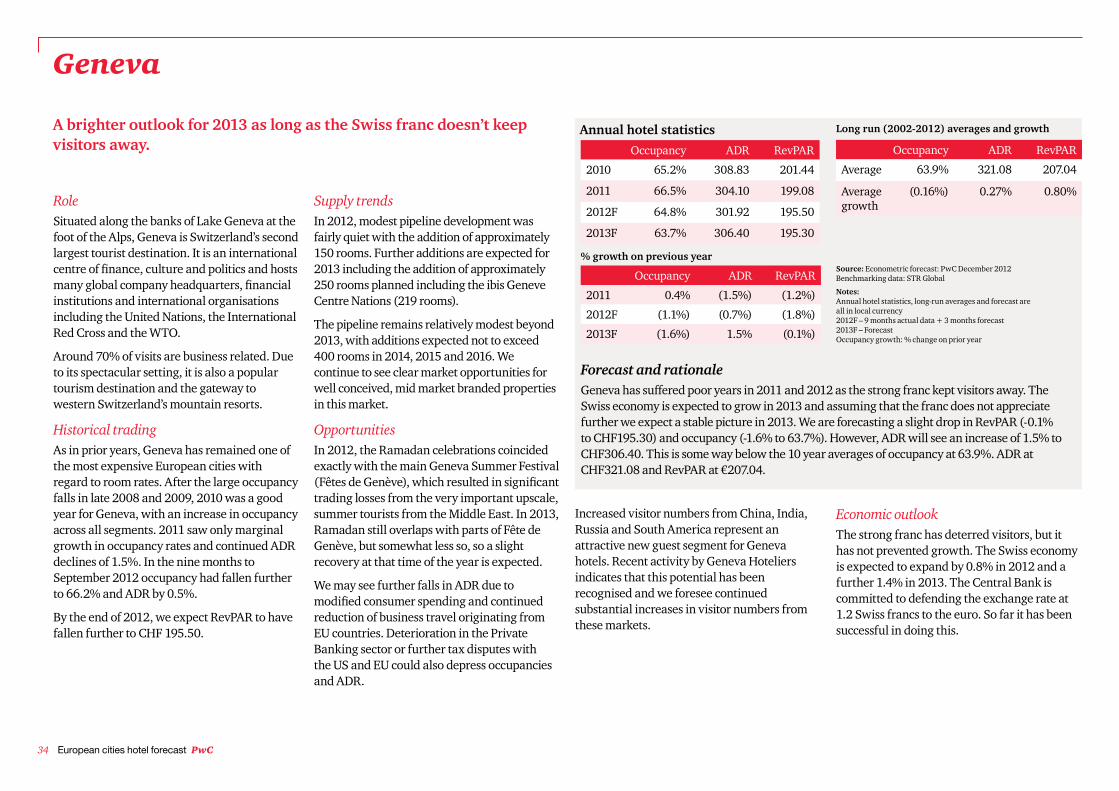
Forecast and rationale Geneva has suffered poor years in 2011 and 2012 as the strong franc kept visitors away. The Swiss economy is expected to grow in 2013 and assuming that the franc does not appreciate further we expect a stable picture in 2013. We are forecasting a slight drop in RevPAR (-0.1% to CHF195.30) and occupancy (-1.6% to 63.7%). However, ADR will see an increase of 1.5% to CHF306.40. This is some way below the 10 year averages of occupancy at 63.9%. ADR at CHF321.08 and RevPAR at €207.04.
Geneva
A brighter outlook for 2013 as long as the Swiss franc doesn’t keep visitors away.
RoleSituated along the banks of Lake Geneva at the foot of the Alps, Geneva is Switzerland’s second largest tourist destination. It is an international centre of finance, culture and politics and hosts many global company headquarters, financial institutions and international organisations including the United Nations, the International Red Cross and the WTO.
Around 70% of visits are business related. Due to its spectacular setting, it is also a popular tourism destination and the gateway to western Switzerland’s mountain resorts.
Historical trading As in prior years, Geneva has remained one of the most expensive European cities with regard to room rates. After the large occupancy falls in late 2008 and 2009, 2010 was a good year for Geneva, with an increase in occupancy across all segments. 2011 saw only marginal growth in occupancy rates and continued ADR declines of 1.5%. In the nine months to September 2012 occupancy had fallen further to 66.2% and ADR by 0.5%.
By the end of 2012, we expect RevPAR to have fallen further to CHF 195.50.
Supply trendsIn 2012, modest pipeline development was fairly quiet with the addition of approximately 150 rooms. Further additions are expected for 2013 including the addition of approximately 250 rooms planned including the ibis Geneve Centre Nations (219 rooms).
The pipeline remains relatively modest beyond 2013, with additions expected not to exceed 400 rooms in 2014, 2015 and 2016. We continue to see clear market opportunities for well conceived, mid market branded properties in this market.
OpportunitiesIn 2012, the Ramadan celebrations coincided exactly with the main Geneva Summer Festival (Fêtes de Genève), which resulted in significant trading losses from the very important upscale, summer tourists from the Middle East. In 2013, Ramadan still overlaps with parts of Fête de Genève, but somewhat less so, so a slight recovery at that time of the year is expected.
We may see further falls in ADR due to modified consumer spending and continued reduction of business travel originating from EU countries. Deterioration in the Private Banking sector or further tax disputes with the US and EU could also depress occupancies and ADR.
Occupancy ADR RevPAR
2010 65.2% 308.83 201.44
2011 66.5% 304.10 199.08
2012F 64.8% 301.92 195.50
2013F 63.7% 306.40 195.30
Occupancy ADR RevPAR
2011 0.4% (1.5%) (1.2%)
2012F (1.1%) (0.7%) (1.8%)
2013F (1.6%) 1.5% (0.1%)
Increased visitor numbers from China, India, Russia and South America represent an attractive new guest segment for Geneva hotels. Recent activity by Geneva Hoteliers indicates that this potential has been recognised and we foresee continued substantial increases in visitor numbers from these markets.
Economic outlookThe strong franc has deterred visitors, but it has not prevented growth. The Swiss economy is expected to expand by 0.8% in 2012 and a further 1.4% in 2013. The Central Bank is committed to defending the exchange rate at 1.2 Swiss francs to the euro. So far it has been successful in doing this.
Occupancy ADR RevPAR
Average 63.9% 321.08 207.04
Average growth
(0.16%) 0.27% 0.80%
PwC Thriving or Surviving 35
Annual hotel statistics Long run (2002-2012) averages and growth
Lisbon
% growth on previous yearSource: Econometric forecast: PwC December 2012 Benchmarking data: STR Global
Notes: Annual hotel statistics, long-run averages and forecast are all in local currency 2012F – 9 months actual data + 3 months forecast 2013F – Forecast Occupancy growth: % change on prior year
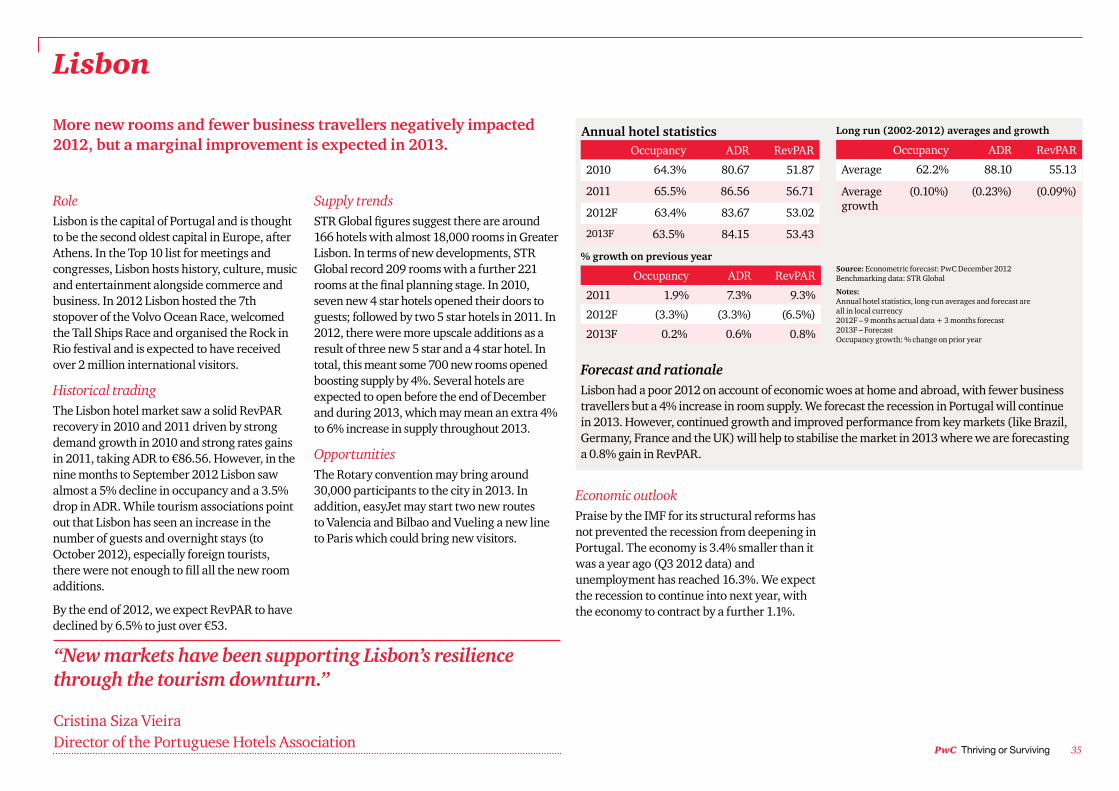
Forecast and rationale Lisbon had a poor 2012 on account of economic woes at home and abroad, with fewer business travellers but a 4% increase in room supply. We forecast the recession in Portugal will continue in 2013. However, continued growth and improved performance from key markets (like Brazil, Germany, France and the UK) will help to stabilise the market in 2013 where we are forecasting a 0.8% gain in RevPAR.
More new rooms and fewer business travellers negatively impacted 2012, but a marginal improvement is expected in 2013.
RoleLisbon is the capital of Portugal and is thought to be the second oldest capital in Europe, after Athens. In the Top 10 list for meetings and congresses, Lisbon hosts history, culture, music and entertainment alongside commerce and business. In 2012 Lisbon hosted the 7th stopover of the Volvo Ocean Race, welcomed the Tall Ships Race and organised the Rock in Rio festival and is expected to have received over 2 million international visitors.
Historical trading The Lisbon hotel market saw a solid RevPAR recovery in 2010 and 2011 driven by strong demand growth in 2010 and strong rates gains in 2011, taking ADR to €86.56. However, in the nine months to September 2012 Lisbon saw almost a 5% decline in occupancy and a 3.5% drop in ADR. While tourism associations point out that Lisbon has seen an increase in the number of guests and overnight stays (to October 2012), especially foreign tourists, there were not enough to fill all the new room additions.
By the end of 2012, we expect RevPAR to have declined by 6.5% to just over €53.
Supply trendsSTR Global figures suggest there are around 166 hotels with almost 18,000 rooms in Greater Lisbon. In terms of new developments, STR Global record 209 rooms with a further 221 rooms at the final planning stage. In 2010, seven new 4 star hotels opened their doors to guests; followed by two 5 star hotels in 2011. In 2012, there were more upscale additions as a result of three new 5 star and a 4 star hotel. In total, this meant some 700 new rooms opened boosting supply by 4%. Several hotels are expected to open before the end of December and during 2013, which may mean an extra 4% to 6% increase in supply throughout 2013.
OpportunitiesThe Rotary convention may bring around 30,000 participants to the city in 2013. In addition, easyJet may start two new routes to Valencia and Bilbao and Vueling a new line to Paris which could bring new visitors.
Occupancy ADR RevPAR
2010 64.3% 80.67 51.87
2011 65.5% 86.56 56.71
2012F 63.4% 83.67 53.02
2013F 63.5% 84.15 53.43
Occupancy ADR RevPAR
2011 1.9% 7.3% 9.3%
2012F (3.3%) (3.3%) (6.5%)
2013F 0.2% 0.6% 0.8%
“New markets have been supporting Lisbon’s resilience through the tourism downturn.”
Cristina Siza Vieira Director of the Portuguese Hotels Association
Economic outlookPraise by the IMF for its structural reforms has not prevented the recession from deepening in Portugal. The economy is 3.4% smaller than it was a year ago (Q3 2012 data) and unemployment has reached 16.3%. We expect the recession to continue into next year, with the economy to contract by a further 1.1%.
Occupancy ADR RevPAR
Average 62.2% 88.10 55.13
Average growth
(0.10%) (0.23%) (0.09%)

36 European cities hotel forecast PwC
© VisitBritain/James McCormick
PwC Thriving or Surviving 37
Annual hotel statistics Long run (2002-2012) averages and growth
Source: Econometric forecast: PwC December 2012 Benchmarking data: STR Global
Notes: Annual hotel statistics, long-run averages and forecast are all in local currency 2012F – 9 months actual data + 3 months forecast 2013F – Forecast Occupancy growth: % change on prior year
% growth on previous year
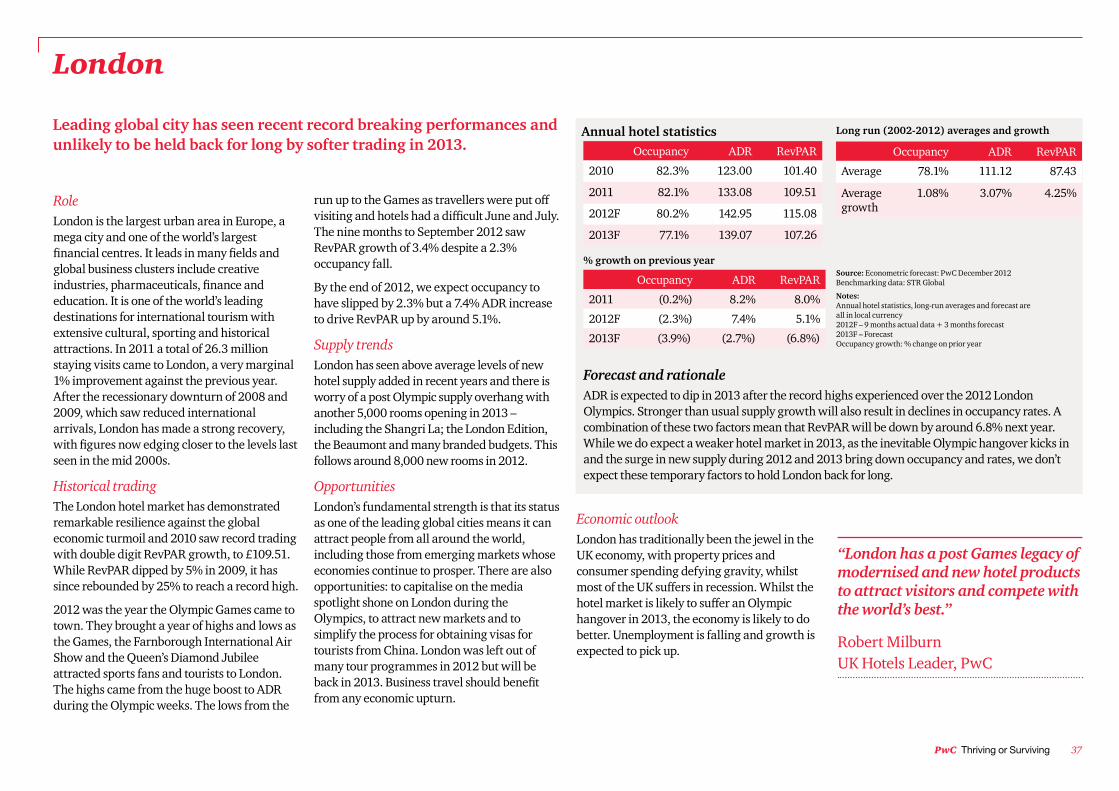
Forecast and rationale ADR is expected to dip in 2013 after the record highs experienced over the 2012 London Olympics. Stronger than usual supply growth will also result in declines in occupancy rates. A combination of these two factors mean that RevPAR will be down by around 6.8% next year. While we do expect a weaker hotel market in 2013, as the inevitable Olympic hangover kicks in and the surge in new supply during 2012 and 2013 bring down occupancy and rates, we don’t expect these temporary factors to hold London back for long.
London
Leading global city has seen recent record breaking performances and unlikely to be held back for long by softer trading in 2013.
RoleLondon is the largest urban area in Europe, a mega city and one of the world’s largest financial centres. It leads in many fields and global business clusters include creative industries, pharmaceuticals, finance and education. It is one of the world’s leading destinations for international tourism with extensive cultural, sporting and historical attractions. In 2011 a total of 26.3 million staying visits came to London, a very marginal 1% improvement against the previous year. After the recessionary downturn of 2008 and 2009, which saw reduced international arrivals, London has made a strong recovery, with figures now edging closer to the levels last seen in the mid 2000s.
Historical trading The London hotel market has demonstrated remarkable resilience against the global economic turmoil and 2010 saw record trading with double digit RevPAR growth, to £109.51. While RevPAR dipped by 5% in 2009, it has since rebounded by 25% to reach a record high.
2012 was the year the Olympic Games came to town. They brought a year of highs and lows as the Games, the Farnborough International Air Show and the Queen’s Diamond Jubilee attracted sports fans and tourists to London. The highs came from the huge boost to ADR during the Olympic weeks. The lows from the
run up to the Games as travellers were put off visiting and hotels had a difficult June and July. The nine months to September 2012 saw RevPAR growth of 3.4% despite a 2.3% occupancy fall.
By the end of 2012, we expect occupancy to have slipped by 2.3% but a 7.4% ADR increase to drive RevPAR up by around 5.1%.
Supply trendsLondon has seen above average levels of new hotel supply added in recent years and there is worry of a post Olympic supply overhang with another 5,000 rooms opening in 2013 – including the Shangri La; the London Edition, the Beaumont and many branded budgets. This follows around 8,000 new rooms in 2012.
OpportunitiesLondon’s fundamental strength is that its status as one of the leading global cities means it can attract people from all around the world, including those from emerging markets whose economies continue to prosper. There are also opportunities: to capitalise on the media spotlight shone on London during the Olympics, to attract new markets and to simplify the process for obtaining visas for tourists from China. London was left out of many tour programmes in 2012 but will be back in 2013. Business travel should benefit from any economic upturn.
Occupancy ADR RevPAR
2010 82.3% 123.00 101.40
2011 82.1% 133.08 109.51
2012F 80.2% 142.95 115.08
2013F 77.1% 139.07 107.26
Occupancy ADR RevPAR
2011 (0.2%) 8.2% 8.0%
2012F (2.3%) 7.4% 5.1%
2013F (3.9%) (2.7%) (6.8%)
Economic outlookLondon has traditionally been the jewel in the UK economy, with property prices and consumer spending defying gravity, whilst most of the UK suffers in recession. Whilst the hotel market is likely to suffer an Olympic hangover in 2013, the economy is likely to do better. Unemployment is falling and growth is expected to pick up.
Occupancy ADR RevPAR
Average 78.1% 111.12 87.43
Average growth
1.08% 3.07% 4.25%
“London has a post Games legacy of modernised and new hotel products to attract visitors and compete with the world’s best.”
Robert Milburn UK Hotels Leader, PwC
38 European cities hotel forecast PwC
Annual hotel statistics Long run (2002-2012) averages and growthAnnual hotel statistics Long run (2002-2012) averages and growth
Madrid
Source: Econometric forecast: PwC December 2012 Benchmarking data: STR Global
Notes: Annual hotel statistics, long-run averages and forecast are all in local currency 2012F – 9 months actual data + 3 months forecast 2013F – Forecast Occupancy growth: % change on prior year
% growth on previous year
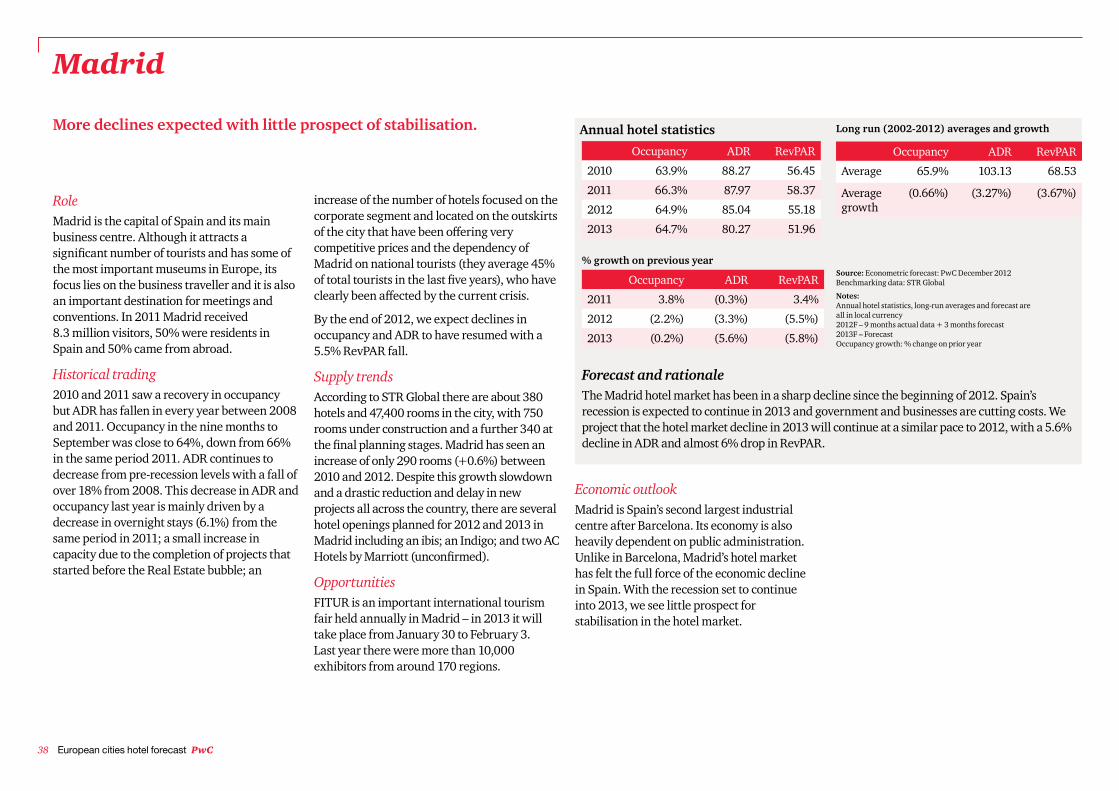
Forecast and rationale The Madrid hotel market has been in a sharp decline since the beginning of 2012. Spain’s recession is expected to continue in 2013 and government and businesses are cutting costs. We project that the hotel market decline in 2013 will continue at a similar pace to 2012, with a 5.6% decline in ADR and almost 6% drop in RevPAR.
More declines expected with little prospect of stabilisation.
RoleMadrid is the capital of Spain and its main business centre. Although it attracts a significant number of tourists and has some of the most important museums in Europe, its focus lies on the business traveller and it is also an important destination for meetings and conventions. In 2011 Madrid received 8.3 million visitors, 50% were residents in Spain and 50% came from abroad.
Historical trading 2010 and 2011 saw a recovery in occupancy but ADR has fallen in every year between 2008 and 2011. Occupancy in the nine months to September was close to 64%, down from 66% in the same period 2011. ADR continues to decrease from pre-recession levels with a fall of over 18% from 2008. This decrease in ADR and occupancy last year is mainly driven by a decrease in overnight stays (6.1%) from the same period in 2011; a small increase in capacity due to the completion of projects that started before the Real Estate bubble; an
increase of the number of hotels focused on the corporate segment and located on the outskirts of the city that have been offering very competitive prices and the dependency of Madrid on national tourists (they average 45% of total tourists in the last five years), who have clearly been affected by the current crisis.
By the end of 2012, we expect declines in occupancy and ADR to have resumed with a 5.5% RevPAR fall.
Supply trendsAccording to STR Global there are about 380 hotels and 47,400 rooms in the city, with 750 rooms under construction and a further 340 at the final planning stages. Madrid has seen an increase of only 290 rooms (+0.6%) between 2010 and 2012. Despite this growth slowdown and a drastic reduction and delay in new projects all across the country, there are several hotel openings planned for 2012 and 2013 in Madrid including an ibis; an Indigo; and two AC Hotels by Marriott (unconfirmed).
OpportunitiesFITUR is an important international tourism fair held annually in Madrid – in 2013 it will take place from January 30 to February 3. Last year there were more than 10,000 exhibitors from around 170 regions.
Occupancy ADR RevPAR
2010 63.9% 88.27 56.45
2011 66.3% 87.97 58.37
2012 64.9% 85.04 55.18
2013 64.7% 80.27 51.96
Occupancy ADR RevPAR
2011 3.8% (0.3%) 3.4%
2012 (2.2%) (3.3%) (5.5%)
2013 (0.2%) (5.6%) (5.8%)
Economic outlook Madrid is Spain’s second largest industrial centre after Barcelona. Its economy is also heavily dependent on public administration. Unlike in Barcelona, Madrid’s hotel market has felt the full force of the economic decline in Spain. With the recession set to continue into 2013, we see little prospect for stabilisation in the hotel market.
Occupancy ADR RevPAR
Average 65.9% 103.13 68.53
Average growth
(0.66%) (3.27%) (3.67%)
PwC Thriving or Surviving 39
% growth on previous yearSource: Econometric forecast: PwC December 2012 Benchmarking data: STR Global
Notes: Annual hotel statistics, long-run averages and forecast are all in local currency 2012F – 9 months actual data + 3 months forecast 2013F – Forecast Occupancy growth: % change on prior year
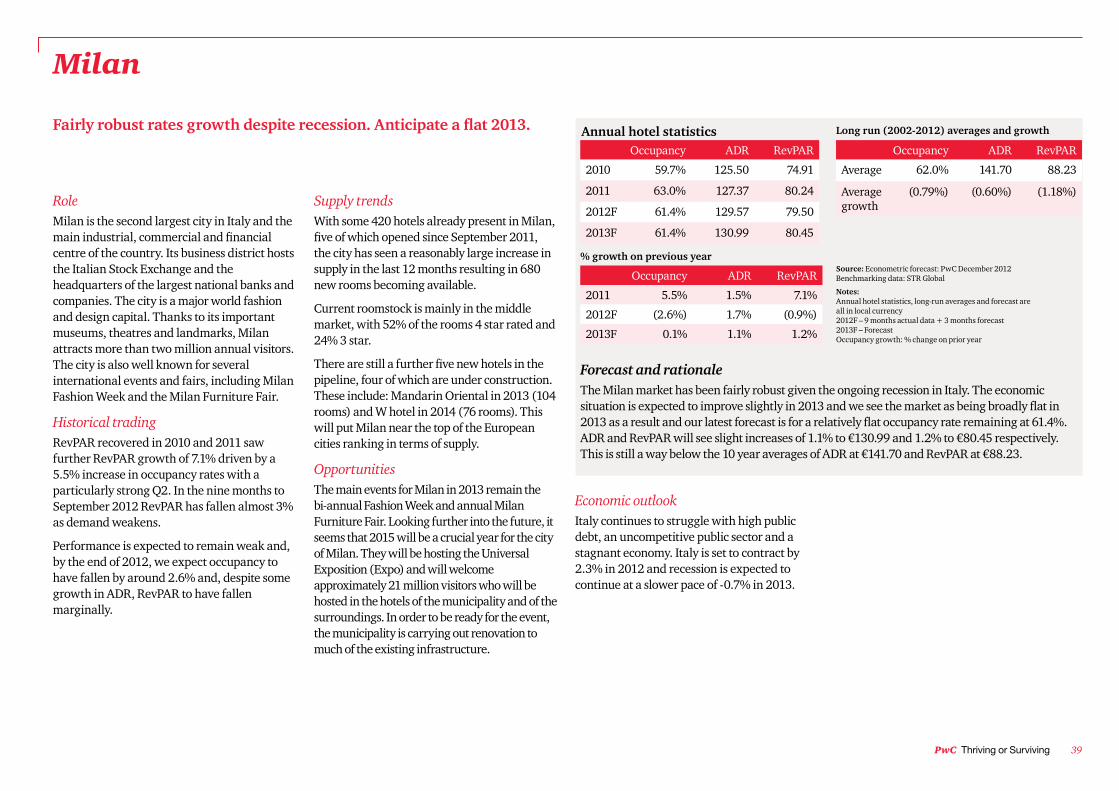
Forecast and rationale The Milan market has been fairly robust given the ongoing recession in Italy. The economic situation is expected to improve slightly in 2013 and we see the market as being broadly flat in 2013 as a result and our latest forecast is for a relatively flat occupancy rate remaining at 61.4%. ADR and RevPAR will see slight increases of 1.1% to €130.99 and 1.2% to €80.45 respectively. This is still a way below the 10 year averages of ADR at €141.70 and RevPAR at €88.23.
Milan
Fairly robust rates growth despite recession. Anticipate a flat 2013.
RoleMilan is the second largest city in Italy and the main industrial, commercial and financial centre of the country. Its business district hosts the Italian Stock Exchange and the headquarters of the largest national banks and companies. The city is a major world fashion and design capital. Thanks to its important museums, theatres and landmarks, Milan attracts more than two million annual visitors. The city is also well known for several international events and fairs, including Milan Fashion Week and the Milan Furniture Fair.
Historical trading RevPAR recovered in 2010 and 2011 saw further RevPAR growth of 7.1% driven by a 5.5% increase in occupancy rates with a particularly strong Q2. In the nine months to September 2012 RevPAR has fallen almost 3% as demand weakens.
Performance is expected to remain weak and, by the end of 2012, we expect occupancy to have fallen by around 2.6% and, despite some growth in ADR, RevPAR to have fallen marginally.
Supply trendsWith some 420 hotels already present in Milan, five of which opened since September 2011, the city has seen a reasonably large increase in supply in the last 12 months resulting in 680 new rooms becoming available.
Current roomstock is mainly in the middle market, with 52% of the rooms 4 star rated and 24% 3 star.
There are still a further five new hotels in the pipeline, four of which are under construction. These include: Mandarin Oriental in 2013 (104 rooms) and W hotel in 2014 (76 rooms). This will put Milan near the top of the European cities ranking in terms of supply.
OpportunitiesThe main events for Milan in 2013 remain the bi-annual Fashion Week and annual Milan Furniture Fair. Looking further into the future, it seems that 2015 will be a crucial year for the city of Milan. They will be hosting the Universal Exposition (Expo) and will welcome approximately 21 million visitors who will be hosted in the hotels of the municipality and of the surroundings. In order to be ready for the event, the municipality is carrying out renovation to much of the existing infrastructure.
Occupancy ADR RevPAR
2010 59.7% 125.50 74.91
2011 63.0% 127.37 80.24
2012F 61.4% 129.57 79.50
2013F 61.4% 130.99 80.45
Occupancy ADR RevPAR
2011 5.5% 1.5% 7.1%
2012F (2.6%) 1.7% (0.9%)
2013F 0.1% 1.1% 1.2%
Economic outlook Italy continues to struggle with high public debt, an uncompetitive public sector and a stagnant economy. Italy is set to contract by 2.3% in 2012 and recession is expected to continue at a slower pace of -0.7% in 2013.
Occupancy ADR RevPAR
Average 62.0% 141.70 88.23
Average growth
(0.79%) (0.60%) (1.18%)
Annual hotel statistics Long run (2002-2012) averages and growth
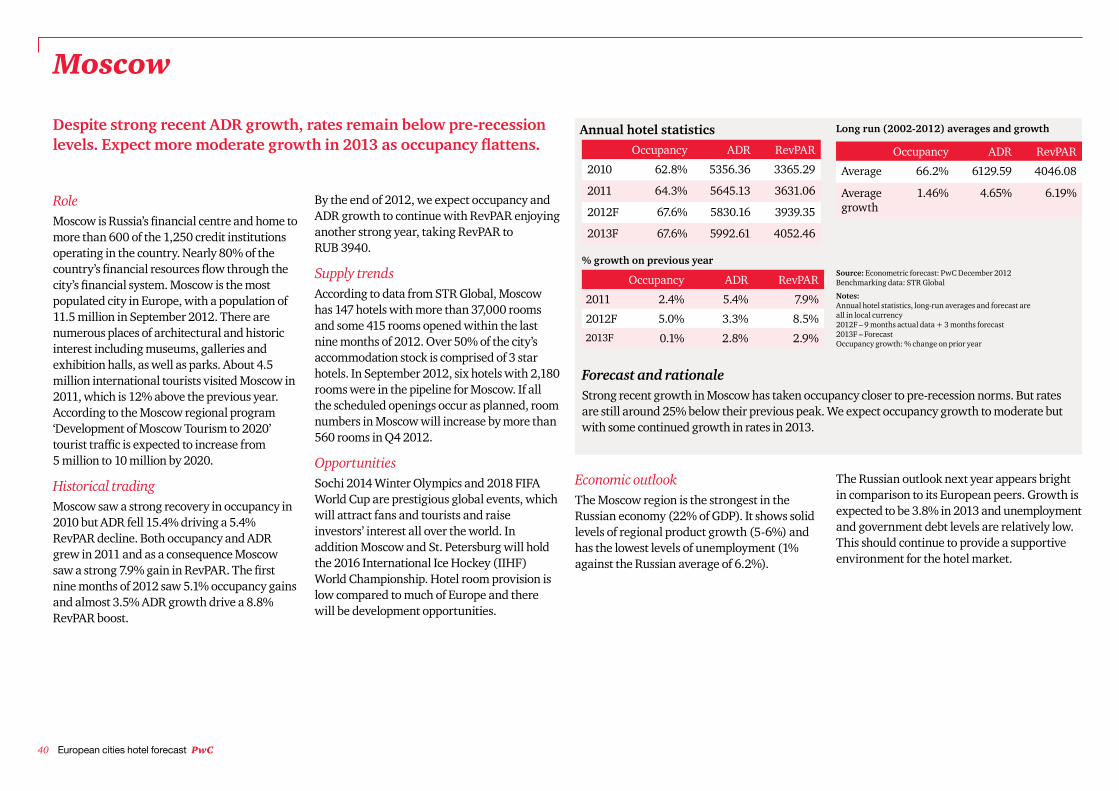
40 European cities hotel forecast PwC
Annual hotel statistics Long run (2002-2012) averages and growth
Moscow
Source: Econometric forecast: PwC December 2012 Benchmarking data: STR Global
Notes: Annual hotel statistics, long-run averages and forecast are all in local currency 2012F – 9 months actual data + 3 months forecast 2013F – Forecast Occupancy growth: % change on prior year
% growth on previous year
Forecast and rationale Strong recent growth in Moscow has taken occupancy closer to pre-recession norms. But rates are still around 25% below their previous peak. We expect occupancy growth to moderate but with some continued growth in rates in 2013.
Despite strong recent ADR growth, rates remain below pre-recession levels. Expect more moderate growth in 2013 as occupancy flattens.
RoleMoscow is Russia’s financial centre and home to more than 600 of the 1,250 credit institutions operating in the country. Nearly 80% of the country’s financial resources flow through the city’s financial system. Moscow is the most populated city in Europe, with a population of 11.5 million in September 2012. There are numerous places of architectural and historic interest including museums, galleries and exhibition halls, as well as parks. About 4.5 million international tourists visited Moscow in 2011, which is 12% above the previous year. According to the Moscow regional program ‘Development of Moscow Tourism to 2020’ tourist traffic is expected to increase from 5 million to 10 million by 2020.
Historical trading Moscow saw a strong recovery in occupancy in 2010 but ADR fell 15.4% driving a 5.4% RevPAR decline. Both occupancy and ADR grew in 2011 and as a consequence Moscow saw a strong 7.9% gain in RevPAR. The first nine months of 2012 saw 5.1% occupancy gains and almost 3.5% ADR growth drive a 8.8% RevPAR boost.
By the end of 2012, we expect occupancy and ADR growth to continue with RevPAR enjoying another strong year, taking RevPAR to RUB 3940.
Supply trendsAccording to data from STR Global, Moscow has 147 hotels with more than 37,000 rooms and some 415 rooms opened within the last nine months of 2012. Over 50% of the city’s accommodation stock is comprised of 3 star hotels. In September 2012, six hotels with 2,180 rooms were in the pipeline for Moscow. If all the scheduled openings occur as planned, room numbers in Moscow will increase by more than 560 rooms in Q4 2012.
OpportunitiesSochi 2014 Winter Olympics and 2018 FIFA World Cup are prestigious global events, which will attract fans and tourists and raise investors’ interest all over the world. In addition Moscow and St. Petersburg will hold the 2016 International Ice Hockey (IIHF) World Championship. Hotel room provision is low compared to much of Europe and there will be development opportunities.
Occupancy ADR RevPAR
2010 62.8% 5356.36 3365.29
2011 64.3% 5645.13 3631.06
2012F 67.6% 5830.16 3939.35
2013F 67.6% 5992.61 4052.46
Occupancy ADR RevPAR
2011 2.4% 5.4% 7.9%
2012F 5.0% 3.3% 8.5%
2013F 0.1% 2.8% 2.9%
Economic outlook The Moscow region is the strongest in the Russian economy (22% of GDP). It shows solid levels of regional product growth (5-6%) and has the lowest levels of unemployment (1% against the Russian average of 6.2%).
The Russian outlook next year appears bright in comparison to its European peers. Growth is expected to be 3.8% in 2013 and unemployment and government debt levels are relatively low. This should continue to provide a supportive environment for the hotel market.
Occupancy ADR RevPAR
Average 66.2% 6129.59 4046.08
Average growth
1.46% 4.65% 6.19%
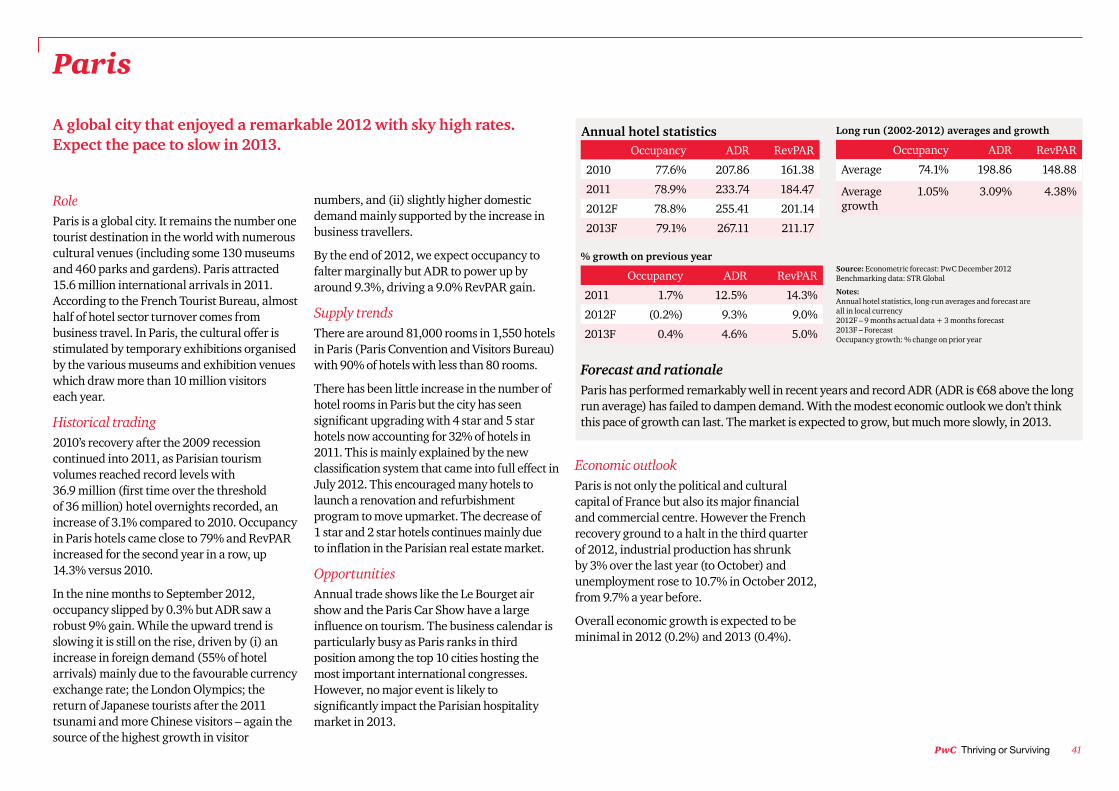
PwC Thriving or Surviving 41
Annual hotel statistics Long run (2002-2012) averages and growth
% growth on previous yearSource: Econometric forecast: PwC December 2012 Benchmarking data: STR Global
Notes: Annual hotel statistics, long-run averages and forecast are all in local currency 2012F – 9 months actual data + 3 months forecast 2013F – Forecast Occupancy growth: % change on prior year
Forecast and rationale Paris has performed remarkably well in recent years and record ADR (ADR is €68 above the long run average) has failed to dampen demand. With the modest economic outlook we don’t think this pace of growth can last. The market is expected to grow, but much more slowly, in 2013.
Paris
A global city that enjoyed a remarkable 2012 with sky high rates. Expect the pace to slow in 2013.
RoleParis is a global city. It remains the number one tourist destination in the world with numerous cultural venues (including some 130 museums and 460 parks and gardens). Paris attracted 15.6 million international arrivals in 2011. According to the French Tourist Bureau, almost half of hotel sector turnover comes from business travel. In Paris, the cultural offer is stimulated by temporary exhibitions organised by the various museums and exhibition venues which draw more than 10 million visitors each year.
Historical trading 2010’s recovery after the 2009 recession continued into 2011, as Parisian tourism volumes reached record levels with 36.9 million (first time over the threshold of 36 million) hotel overnights recorded, an increase of 3.1% compared to 2010. Occupancy in Paris hotels came close to 79% and RevPAR increased for the second year in a row, up 14.3% versus 2010.
In the nine months to September 2012, occupancy slipped by 0.3% but ADR saw a robust 9% gain. While the upward trend is slowing it is still on the rise, driven by (i) an increase in foreign demand (55% of hotel arrivals) mainly due to the favourable currency exchange rate; the London Olympics; the return of Japanese tourists after the 2011 tsunami and more Chinese visitors – again the source of the highest growth in visitor
numbers, and (ii) slightly higher domestic demand mainly supported by the increase in business travellers.
By the end of 2012, we expect occupancy to falter marginally but ADR to power up by around 9.3%, driving a 9.0% RevPAR gain.
Supply trendsThere are around 81,000 rooms in 1,550 hotels in Paris (Paris Convention and Visitors Bureau) with 90% of hotels with less than 80 rooms.
There has been little increase in the number of hotel rooms in Paris but the city has seen significant upgrading with 4 star and 5 star hotels now accounting for 32% of hotels in 2011. This is mainly explained by the new classification system that came into full effect in July 2012. This encouraged many hotels to launch a renovation and refurbishment program to move upmarket. The decrease of 1 star and 2 star hotels continues mainly due to inflation in the Parisian real estate market.
OpportunitiesAnnual trade shows like the Le Bourget air show and the Paris Car Show have a large influence on tourism. The business calendar is particularly busy as Paris ranks in third position among the top 10 cities hosting the most important international congresses. However, no major event is likely to significantly impact the Parisian hospitality market in 2013.
Occupancy ADR RevPAR
2010 77.6% 207.86 161.38
2011 78.9% 233.74 184.47
2012F 78.8% 255.41 201.14
2013F 79.1% 267.11 211.17
Occupancy ADR RevPAR
2011 1.7% 12.5% 14.3%
2012F (0.2%) 9.3% 9.0%
2013F 0.4% 4.6% 5.0%
Economic outlook Paris is not only the political and cultural capital of France but also its major financial and commercial centre. However the French recovery ground to a halt in the third quarter of 2012, industrial production has shrunk by 3% over the last year (to October) and unemployment rose to 10.7% in October 2012, from 9.7% a year before.
Overall economic growth is expected to be minimal in 2012 (0.2%) and 2013 (0.4%).
Occupancy ADR RevPAR
Average 74.1% 198.86 148.88
Average growth
1.05% 3.09% 4.38%
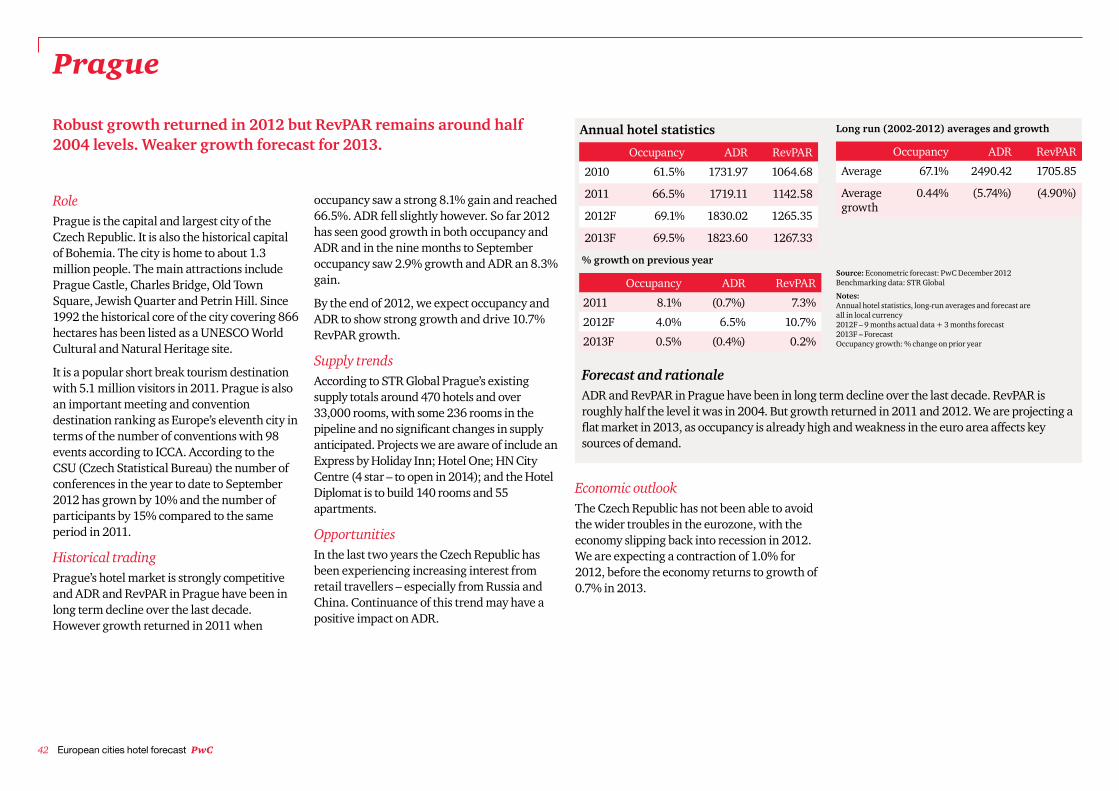
42 European cities hotel forecast PwC
Annual hotel statistics Long run (2002-2012) averages and growth
Source: Econometric forecast: PwC December 2012 Benchmarking data: STR Global
Notes: Annual hotel statistics, long-run averages and forecast are all in local currency 2012F – 9 months actual data + 3 months forecast 2013F – Forecast Occupancy growth: % change on prior year
% growth on previous year
Forecast and rationale ADR and RevPAR in Prague have been in long term decline over the last decade. RevPAR is roughly half the level it was in 2004. But growth returned in 2011 and 2012. We are projecting a flat market in 2013, as occupancy is already high and weakness in the euro area affects key sources of demand.
Prague
Robust growth returned in 2012 but RevPAR remains around half 2004 levels. Weaker growth forecast for 2013.
RolePrague is the capital and largest city of the Czech Republic. It is also the historical capital of Bohemia. The city is home to about 1.3 million people. The main attractions include Prague Castle, Charles Bridge, Old Town Square, Jewish Quarter and Petrin Hill. Since 1992 the historical core of the city covering 866 hectares has been listed as a UNESCO World Cultural and Natural Heritage site.
It is a popular short break tourism destination with 5.1 million visitors in 2011. Prague is also an important meeting and convention destination ranking as Europe’s eleventh city in terms of the number of conventions with 98 events according to ICCA. According to the CSU (Czech Statistical Bureau) the number of conferences in the year to date to September 2012 has grown by 10% and the number of participants by 15% compared to the same period in 2011.
Historical trading Prague’s hotel market is strongly competitive and ADR and RevPAR in Prague have been in long term decline over the last decade. However growth returned in 2011 when
occupancy saw a strong 8.1% gain and reached 66.5%. ADR fell slightly however. So far 2012 has seen good growth in both occupancy and ADR and in the nine months to September occupancy saw 2.9% growth and ADR an 8.3% gain.
By the end of 2012, we expect occupancy and ADR to show strong growth and drive 10.7% RevPAR growth.
Supply trendsAccording to STR Global Prague’s existing supply totals around 470 hotels and over 33,000 rooms, with some 236 rooms in the pipeline and no significant changes in supply anticipated. Projects we are aware of include an Express by Holiday Inn; Hotel One; HN City Centre (4 star – to open in 2014); and the Hotel Diplomat is to build 140 rooms and 55 apartments.
OpportunitiesIn the last two years the Czech Republic has been experiencing increasing interest from retail travellers – especially from Russia and China. Continuance of this trend may have a positive impact on ADR.
Occupancy ADR RevPAR
2010 61.5% 1731.97 1064.68
2011 66.5% 1719.11 1142.58
2012F 69.1% 1830.02 1265.35
2013F 69.5% 1823.60 1267.33
Occupancy ADR RevPAR
2011 8.1% (0.7%) 7.3%
2012F 4.0% 6.5% 10.7%
2013F 0.5% (0.4%) 0.2%
Economic outlook The Czech Republic has not been able to avoid the wider troubles in the eurozone, with the economy slipping back into recession in 2012.We are expecting a contraction of 1.0% for 2012, before the economy returns to growth of 0.7% in 2013.
Occupancy ADR RevPAR
Average 67.1% 2490.42 1705.85
Average growth
0.44% (5.74%) (4.90%)

PwC Thriving or Surviving 43
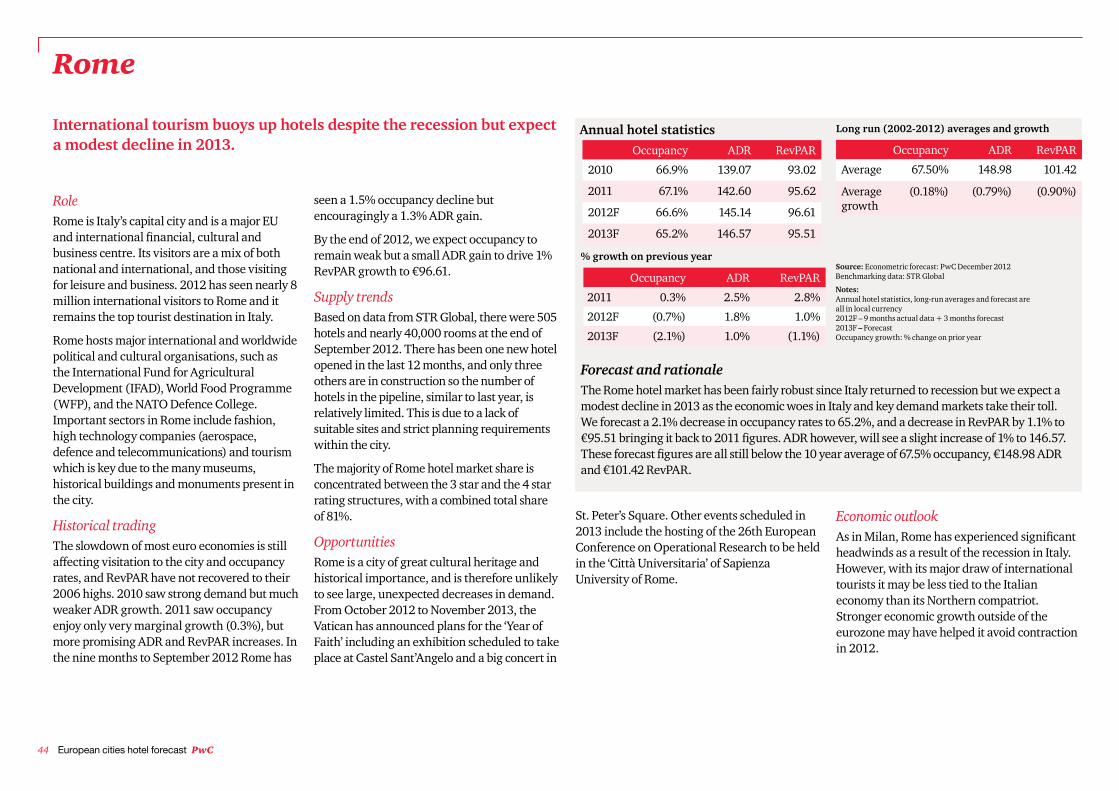
44 European cities hotel forecast PwC
Annual hotel statistics Long run (2002-2012) averages and growth
% growth on previous yearSource: Econometric forecast: PwC December 2012 Benchmarking data: STR Global
Notes: Annual hotel statistics, long-run averages and forecast are all in local currency 2012F – 9 months actual data + 3 months forecast 2013F – Forecast Occupancy growth: % change on prior year
Forecast and rationale The Rome hotel market has been fairly robust since Italy returned to recession but we expect a modest decline in 2013 as the economic woes in Italy and key demand markets take their toll. We forecast a 2.1% decrease in occupancy rates to 65.2%, and a decrease in RevPAR by 1.1% to €95.51 bringing it back to 2011 figures. ADR however, will see a slight increase of 1% to 146.57. These forecast figures are all still below the 10 year average of 67.5% occupancy, €148.98 ADR and €101.42 RevPAR.
Rome
International tourism buoys up hotels despite the recession but expect a modest decline in 2013.
RoleRome is Italy’s capital city and is a major EU and international financial, cultural and business centre. Its visitors are a mix of both national and international, and those visiting for leisure and business. 2012 has seen nearly 8 million international visitors to Rome and it remains the top tourist destination in Italy.
Rome hosts major international and worldwide political and cultural organisations, such as the International Fund for Agricultural Development (IFAD), World Food Programme (WFP), and the NATO Defence College. Important sectors in Rome include fashion, high technology companies (aerospace, defence and telecommunications) and tourism which is key due to the many museums, historical buildings and monuments present in the city.
Historical trading The slowdown of most euro economies is still affecting visitation to the city and occupancy rates, and RevPAR have not recovered to their 2006 highs. 2010 saw strong demand but much weaker ADR growth. 2011 saw occupancy enjoy only very marginal growth (0.3%), but more promising ADR and RevPAR increases. In the nine months to September 2012 Rome has
seen a 1.5% occupancy decline but encouragingly a 1.3% ADR gain.
By the end of 2012, we expect occupancy to remain weak but a small ADR gain to drive 1% RevPAR growth to €96.61.
Supply trendsBased on data from STR Global, there were 505 hotels and nearly 40,000 rooms at the end of September 2012. There has been one new hotel opened in the last 12 months, and only three others are in construction so the number of hotels in the pipeline, similar to last year, is relatively limited. This is due to a lack of suitable sites and strict planning requirements within the city.
The majority of Rome hotel market share is concentrated between the 3 star and the 4 star rating structures, with a combined total share of 81%.
OpportunitiesRome is a city of great cultural heritage and historical importance, and is therefore unlikely to see large, unexpected decreases in demand. From October 2012 to November 2013, the Vatican has announced plans for the ‘Year of Faith’ including an exhibition scheduled to take place at Castel Sant’Angelo and a big concert in
Occupancy ADR RevPAR
2010 66.9% 139.07 93.02
2011 67.1% 142.60 95.62
2012F 66.6% 145.14 96.61
2013F 65.2% 146.57 95.51
Occupancy ADR RevPAR
2011 0.3% 2.5% 2.8%
2012F (0.7%) 1.8% 1.0%
2013F (2.1%) 1.0% (1.1%)
St. Peter’s Square. Other events scheduled in 2013 include the hosting of the 26th European Conference on Operational Research to be held in the ‘Città Universitaria’ of Sapienza University of Rome.
Economic outlook As in Milan, Rome has experienced significant headwinds as a result of the recession in Italy. However, with its major draw of international tourists it may be less tied to the Italian economy than its Northern compatriot. Stronger economic growth outside of the eurozone may have helped it avoid contraction in 2012.
Occupancy ADR RevPAR
Average 67.50% 148.98 101.42
Average growth
(0.18%) (0.79%) (0.90%)
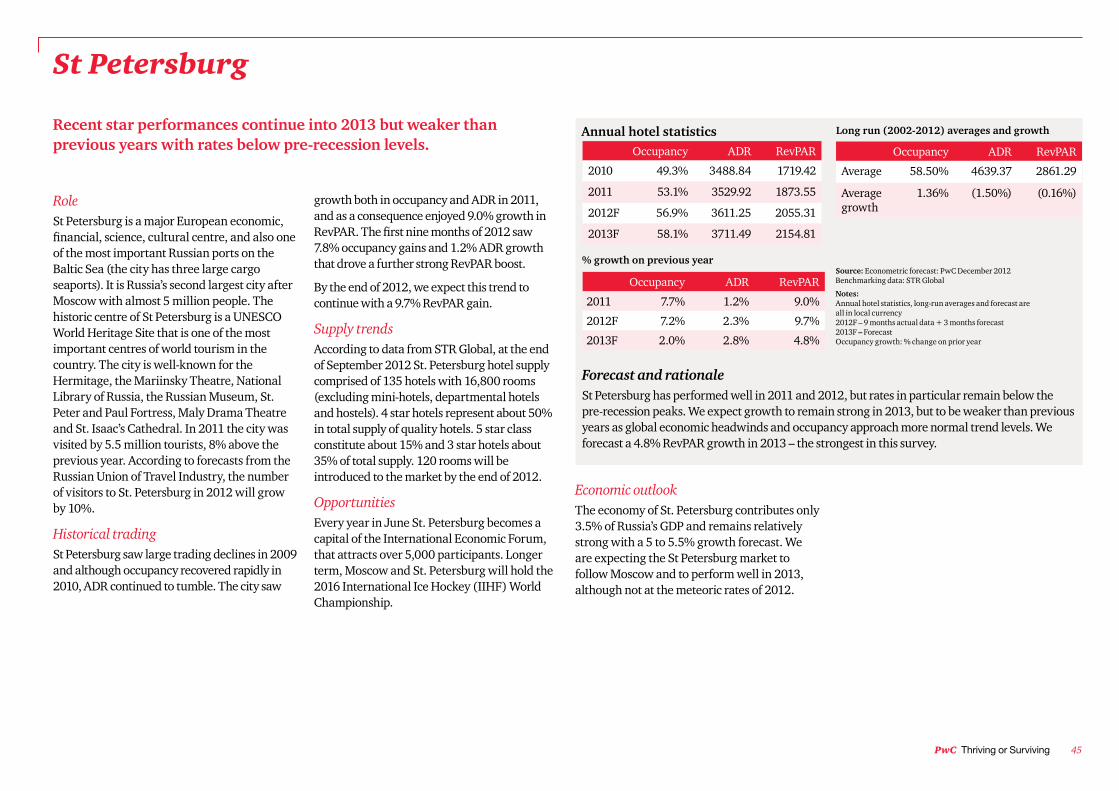
PwC Thriving or Surviving 45
Annual hotel statistics Long run (2002-2012) averages and growth
Source: Econometric forecast: PwC December 2012 Benchmarking data: STR Global
Notes: Annual hotel statistics, long-run averages and forecast are all in local currency 2012F – 9 months actual data + 3 months forecast 2013F – Forecast Occupancy growth: % change on prior year
% growth on previous year
Forecast and rationale St Petersburg has performed well in 2011 and 2012, but rates in particular remain below the pre-recession peaks. We expect growth to remain strong in 2013, but to be weaker than previous years as global economic headwinds and occupancy approach more normal trend levels. We forecast a 4.8% RevPAR growth in 2013 – the strongest in this survey.
St Petersburg
Recent star performances continue into 2013 but weaker than previous years with rates below pre-recession levels.
RoleSt Petersburg is a major European economic, financial, science, cultural centre, and also one of the most important Russian ports on the Baltic Sea (the city has three large cargo seaports). It is Russia’s second largest city after Moscow with almost 5 million people. The historic centre of St Petersburg is a UNESCO World Heritage Site that is one of the most important centres of world tourism in the country. The city is well-known for the Hermitage, the Mariinsky Theatre, National Library of Russia, the Russian Museum, St. Peter and Paul Fortress, Maly Drama Theatre and St. Isaac’s Cathedral. In 2011 the city was visited by 5.5 million tourists, 8% above the previous year. According to forecasts from the Russian Union of Travel Industry, the number of visitors to St. Petersburg in 2012 will grow by 10%.
Historical trading St Petersburg saw large trading declines in 2009 and although occupancy recovered rapidly in 2010, ADR continued to tumble. The city saw
growth both in occupancy and ADR in 2011, and as a consequence enjoyed 9.0% growth in RevPAR. The first nine months of 2012 saw 7.8% occupancy gains and 1.2% ADR growth that drove a further strong RevPAR boost.
By the end of 2012, we expect this trend to continue with a 9.7% RevPAR gain.
Supply trendsAccording to data from STR Global, at the end of September 2012 St. Petersburg hotel supply comprised of 135 hotels with 16,800 rooms (excluding mini-hotels, departmental hotels and hostels). 4 star hotels represent about 50% in total supply of quality hotels. 5 star class constitute about 15% and 3 star hotels about 35% of total supply. 120 rooms will be introduced to the market by the end of 2012.
OpportunitiesEvery year in June St. Petersburg becomes a capital of the International Economic Forum, that attracts over 5,000 participants. Longer term, Moscow and St. Petersburg will hold the 2016 International Ice Hockey (IIHF) World Championship.
Occupancy ADR RevPAR
2010 49.3% 3488.84 1719.42
2011 53.1% 3529.92 1873.55
2012F 56.9% 3611.25 2055.31
2013F 58.1% 3711.49 2154.81
Occupancy ADR RevPAR
2011 7.7% 1.2% 9.0%
2012F 7.2% 2.3% 9.7%
2013F 2.0% 2.8% 4.8%
Economic outlook The economy of St. Petersburg contributes only 3.5% of Russia’s GDP and remains relatively strong with a 5 to 5.5% growth forecast. We are expecting the St Petersburg market to follow Moscow and to perform well in 2013, although not at the meteoric rates of 2012.
Occupancy ADR RevPAR
Average 58.50% 4639.37 2861.29
Average growth
1.36% (1.50%) (0.16%)
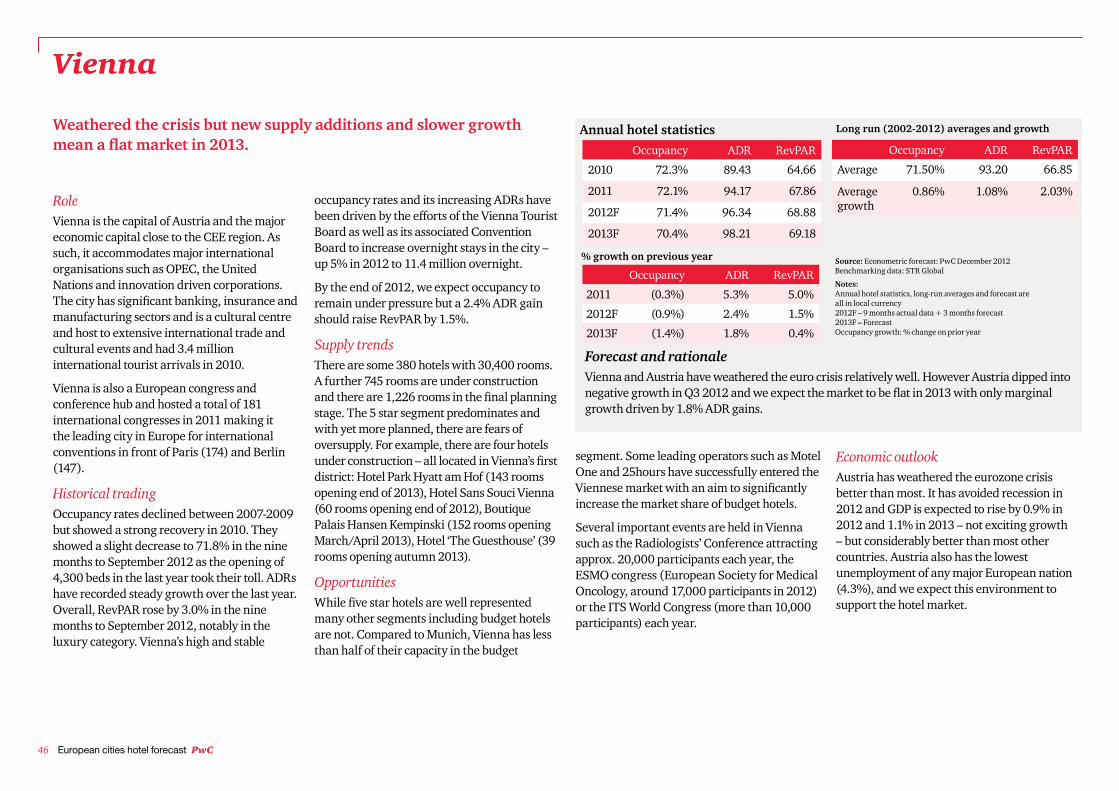
46 European cities hotel forecast PwC
Annual hotel statistics Long run (2002-2012) averages and growth
% growth on previous year Source: Econometric forecast: PwC December 2012 Benchmarking data: STR Global
Notes: Annual hotel statistics, long-run averages and forecast are all in local currency 2012F – 9 months actual data + 3 months forecast 2013F – Forecast Occupancy growth: % change on prior year
Forecast and rationale Vienna and Austria have weathered the euro crisis relatively well. However Austria dipped into negative growth in Q3 2012 and we expect the market to be flat in 2013 with only marginal growth driven by 1.8% ADR gains.
Vienna
Weathered the crisis but new supply additions and slower growth mean a flat market in 2013.
RoleVienna is the capital of Austria and the major economic capital close to the CEE region. As such, it accommodates major international organisations such as OPEC, the United Nations and innovation driven corporations. The city has significant banking, insurance and manufacturing sectors and is a cultural centre and host to extensive international trade and cultural events and had 3.4 million international tourist arrivals in 2010.
Vienna is also a European congress and conference hub and hosted a total of 181 international congresses in 2011 making it the leading city in Europe for international conventions in front of Paris (174) and Berlin (147).
Historical trading Occupancy rates declined between 2007-2009 but showed a strong recovery in 2010. They showed a slight decrease to 71.8% in the nine months to September 2012 as the opening of 4,300 beds in the last year took their toll. ADRs have recorded steady growth over the last year. Overall, RevPAR rose by 3.0% in the nine months to September 2012, notably in the luxury category. Vienna’s high and stable
occupancy rates and its increasing ADRs have been driven by the efforts of the Vienna Tourist Board as well as its associated Convention Board to increase overnight stays in the city – up 5% in 2012 to 11.4 million overnight.
By the end of 2012, we expect occupancy to remain under pressure but a 2.4% ADR gain should raise RevPAR by 1.5%.
Supply trendsThere are some 380 hotels with 30,400 rooms. A further 745 rooms are under construction and there are 1,226 rooms in the final planning stage. The 5 star segment predominates and with yet more planned, there are fears of oversupply. For example, there are four hotels under construction – all located in Vienna’s first district: Hotel Park Hyatt am Hof (143 rooms opening end of 2013), Hotel Sans Souci Vienna (60 rooms opening end of 2012), Boutique Palais Hansen Kempinski (152 rooms opening March/April 2013), Hotel ‘The Guesthouse’ (39 rooms opening autumn 2013).
OpportunitiesWhile five star hotels are well represented many other segments including budget hotels are not. Compared to Munich, Vienna has less than half of their capacity in the budget
Occupancy ADR RevPAR
2010 72.3% 89.43 64.66
2011 72.1% 94.17 67.86
2012F 71.4% 96.34 68.88
2013F 70.4% 98.21 69.18
Occupancy ADR RevPAR
2011 (0.3%) 5.3% 5.0%
2012F (0.9%) 2.4% 1.5%
2013F (1.4%) 1.8% 0.4%
segment. Some leading operators such as Motel One and 25hours have successfully entered the Viennese market with an aim to significantly increase the market share of budget hotels.
Several important events are held in Vienna such as the Radiologists’ Conference attracting approx. 20,000 participants each year, the ESMO congress (European Society for Medical Oncology, around 17,000 participants in 2012) or the ITS World Congress (more than 10,000 participants) each year.
Economic outlook Austria has weathered the eurozone crisis better than most. It has avoided recession in 2012 and GDP is expected to rise by 0.9% in 2012 and 1.1% in 2013 – not exciting growth – but considerably better than most other countries. Austria also has the lowest unemployment of any major European nation (4.3%), and we expect this environment to support the hotel market.
Occupancy ADR RevPAR
Average 71.50% 93.20 66.85
Average growth
0.86% 1.08% 2.03%
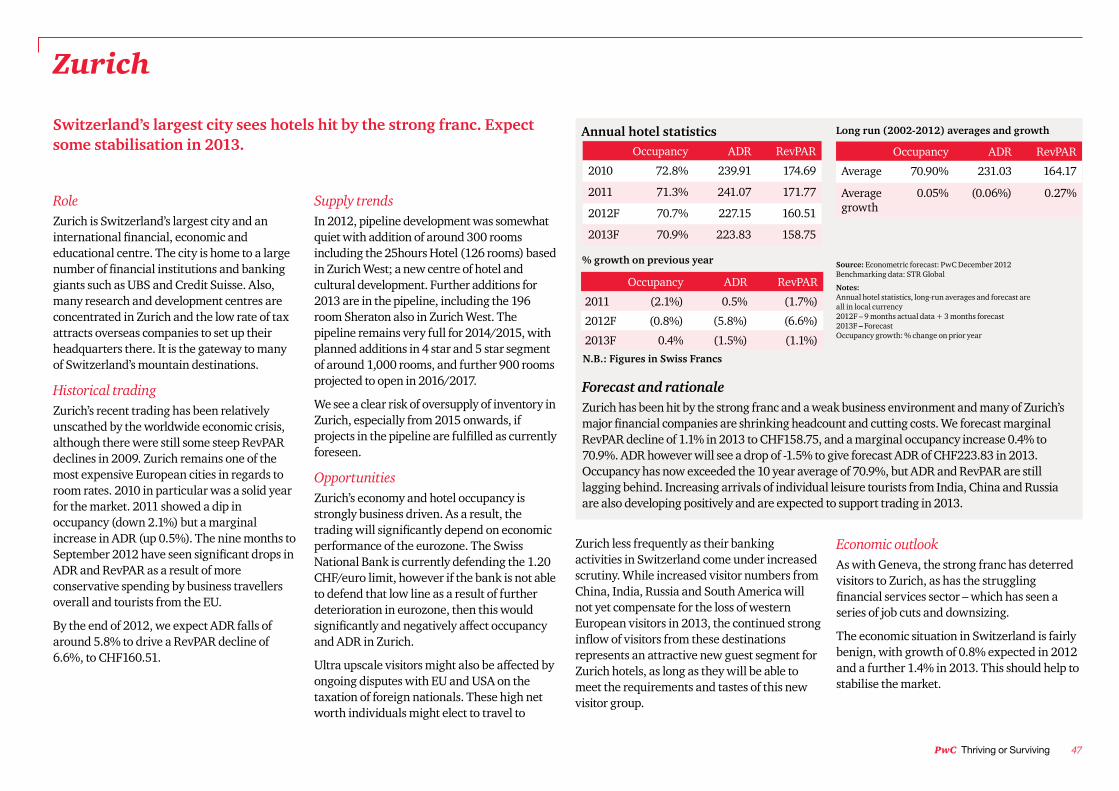
PwC Thriving or Surviving 47
Annual hotel statistics Long run (2002-2012) averages and growth
Source: Econometric forecast: PwC December 2012 Benchmarking data: STR Global
Notes: Annual hotel statistics, long-run averages and forecast are all in local currency 2012F – 9 months actual data + 3 months forecast 2013F – Forecast Occupancy growth: % change on prior year
% growth on previous year
Forecast and rationale Zurich has been hit by the strong franc and a weak business environment and many of Zurich’s major financial companies are shrinking headcount and cutting costs. We forecast marginal RevPAR decline of 1.1% in 2013 to CHF158.75, and a marginal occupancy increase 0.4% to 70.9%. ADR however will see a drop of -1.5% to give forecast ADR of CHF223.83 in 2013. Occupancy has now exceeded the 10 year average of 70.9%, but ADR and RevPAR are still lagging behind. Increasing arrivals of individual leisure tourists from India, China and Russia are also developing positively and are expected to support trading in 2013.
Zurich
Switzerland’s largest city sees hotels hit by the strong franc. Expect some stabilisation in 2013.
RoleZurich is Switzerland’s largest city and an international financial, economic and educational centre. The city is home to a large number of financial institutions and banking giants such as UBS and Credit Suisse. Also, many research and development centres are concentrated in Zurich and the low rate of tax attracts overseas companies to set up their headquarters there. It is the gateway to many of Switzerland’s mountain destinations.
Historical trading Zurich’s recent trading has been relatively unscathed by the worldwide economic crisis, although there were still some steep RevPAR declines in 2009. Zurich remains one of the most expensive European cities in regards to room rates. 2010 in particular was a solid year for the market. 2011 showed a dip in occupancy (down 2.1%) but a marginal increase in ADR (up 0.5%). The nine months to September 2012 have seen significant drops in ADR and RevPAR as a result of more conservative spending by business travellers overall and tourists from the EU.
By the end of 2012, we expect ADR falls of around 5.8% to drive a RevPAR decline of 6.6%, to CHF160.51.
N.B.: Figures in Swiss Francs
Supply trendsIn 2012, pipeline development was somewhat quiet with addition of around 300 rooms including the 25hours Hotel (126 rooms) based in Zurich West; a new centre of hotel and cultural development. Further additions for 2013 are in the pipeline, including the 196 room Sheraton also in Zurich West. The pipeline remains very full for 2014/2015, with planned additions in 4 star and 5 star segment of around 1,000 rooms, and further 900 rooms projected to open in 2016/2017.
We see a clear risk of oversupply of inventory in Zurich, especially from 2015 onwards, if projects in the pipeline are fulfilled as currently foreseen.
OpportunitiesZurich’s economy and hotel occupancy is strongly business driven. As a result, the trading will significantly depend on economic performance of the eurozone. The Swiss National Bank is currently defending the 1.20 CHF/euro limit, however if the bank is not able to defend that low line as a result of further deterioration in eurozone, then this would significantly and negatively affect occupancy and ADR in Zurich.
Ultra upscale visitors might also be affected by ongoing disputes with EU and USA on the taxation of foreign nationals. These high net worth individuals might elect to travel to
Occupancy ADR RevPAR
2010 72.8% 239.91 174.69
2011 71.3% 241.07 171.77
2012F 70.7% 227.15 160.51
2013F 70.9% 223.83 158.75
Occupancy ADR RevPAR
2011 (2.1%) 0.5% (1.7%)
2012F (0.8%) (5.8%) (6.6%)
2013F 0.4% (1.5%) (1.1%)
Zurich less frequently as their banking activities in Switzerland come under increased scrutiny. While increased visitor numbers from China, India, Russia and South America will not yet compensate for the loss of western European visitors in 2013, the continued strong inflow of visitors from these destinations represents an attractive new guest segment for Zurich hotels, as long as they will be able to meet the requirements and tastes of this new visitor group.
Economic outlook As with Geneva, the strong franc has deterred visitors to Zurich, as has the struggling financial services sector – which has seen a series of job cuts and downsizing.
The economic situation in Switzerland is fairly benign, with growth of 0.8% expected in 2012 and a further 1.4% in 2013. This should help to stabilise the market.
Occupancy ADR RevPAR
Average 70.90% 231.03 164.17
Average growth
0.05% (0.06%) 0.27%

48 European cities hotel forecast PwC
Economic and travel outlook
Methodology and model assumptions
PwC Thriving or Surviving 49
Annex: Methodology for hotel forecasts
DataOur hotels dataset provided by STR Global contains ADR, hotel room supply, demand and occupancy on a monthly basis for each of the 19 cities. Macroeconomic variables such as GDP growth and Consumer Price Indices (CPI) were obtained from Eurostat for all countries except Russia. For Russia, GDP and CPI data were obtained from the Russian National Statistics office. Investment growth rates, used in the model for Dublin only, were obtained from Eurostat. All exchange rate data were obtained from Thomson Reuters Datastream. The total nights spent by residents and non-residents in hotels, used to calculate GDP weights, and are also obtained from Eurostat for all countries except Russia. (See notes 1 and 2 below).
Note:
1. We have used a weighted GDP measure in our models; this is a weighted average of GDP growth of the major countries of origin of hotel guests, the weights being the proportion of hotel guests from the corresponding country. For example, if 80% of Edinburgh hotel guests were from the UK, 10% from France and 10% from the US, then, the weighted GDP measure for Edinburgh is the weighted average of GDP growth in the UK (weight 80%), France (10%) and US (10%).
2. No visitor data was available for Moscow or St. Petersburg. For these cities, we have used Russian GDP only.
This section outlines in more detail the PwC models used to forecast hotel occupancy, Average Daily Rate (ADR) and Revenue Per Available Room (RevPAR) for 18 European cities.
Econometric modelWe developed a 2-stage least squares (2SLS) instrumental variables approach that models hotel demand and price (ADR) using a two-stage process with the specifications set out in Table 4. This is consistent with the modelling approach we used for London and the rest of the UK in our report published in November 2012; After the party: UK hotels forecast 2013.
All models yielded robust significant results with the exception of the two Russian cities, Moscow and St. Petersburg. Russian national accounts data is unreliable. For this reason, often it is not possible to obtain robust econometric results. For these cities, a more simple univariate correlation approach was used, based on recent trends between ADR and inflation, and occupancy and GDP.
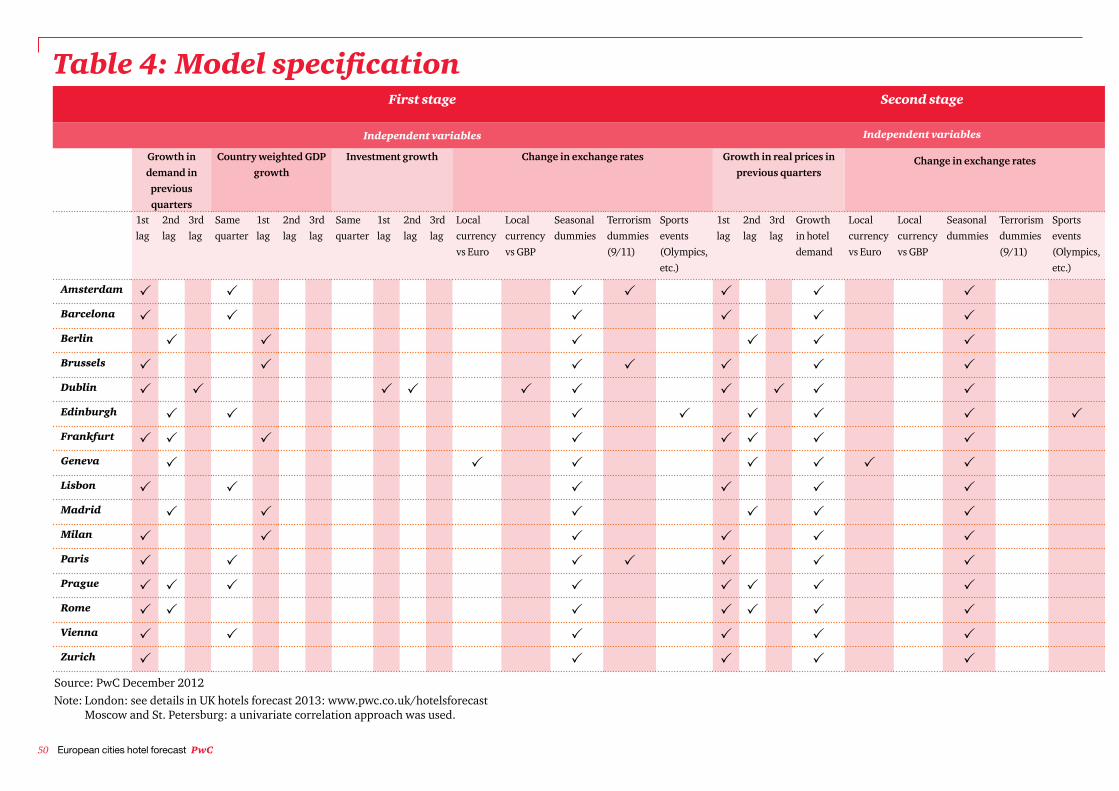
50 European cities hotel forecast PwC
Table 4: Model specificationFirst stage Second stage
Independent variables Independent variables
Growth in demand in previous quarters
Country weighted GDP growth
Investment growth Change in exchange rates Growth in real prices in previous quarters
Change in exchange rates
1st lag
2nd lag
3rd lag
Same quarter
1st lag
2nd lag
3rd lag
Same quarter
1st lag
2nd lag
3rd lag
Local currency vs Euro
Local currency vs GBP
Seasonal dummies
Terrorism dummies (9/11)
Sports events (Olympics, etc.)
1st lag
2nd lag
3rd lag
Growth in hotel demand
Local currency vs Euro
Local currency vs GBP
Seasonal dummies
Terrorism dummies (9/11)
Sports events (Olympics, etc.)
Amsterdam P P P P P P PBarcelona P P P P P PBerlin P P P P P PBrussels P P P P P P PDublin P P P P P P P P P PEdinburgh P P P P P P P PFrankfurt P P P P P P P PGeneva P P P P P P PLisbon P P P P P PMadrid P P P P P PMilan P P P P P PParis P P P P P P PPrague P P P P P P P PRome P P P P P P PVienna P P P P P PZurich P P P P P
Source: PwC December 2012Note: London: see details in UK hotels forecast 2013: www.pwc.co.uk/hotelsforecast Moscow and St. Petersburg: a univariate correlation approach was used.
PwC Thriving or Surviving 51
Key differences with the previous approach and forecast generation
For our previous forecasts we used a vector autoregression (VAR) approach to model hotel occupancy rates and ADR. We periodically review our model specifications based on a study of current academic literature and industry best practice. Based on our findings we updated our model to the 2-stage least squares (2SLS) instrumental variables approach.
The 2SLS approach has several advantages, namely it does not require any distributional assumptions for explanatory variables, e.g. variables may take a binary or non-normal form. It is also computationally simple and allows the use of diagnostic testing procedures for problems such as heteroscedasticity and specification error. In addition, the two-stage approach also allows us to estimate demand and price separately rather than projecting occupancy rates directly, recognising that these are driven by different factors.
However, the challenge of producing robust estimates using the 2SLS approach is the selection of ‘instruments’ or variables that are sufficiently exogenous to price, but have an influence on hotel demand; whereas the VAR model treats all variables as endogenous, which does away with the need to identify such variables as instruments. Our model specification includes quarterly dummies, the lag of GDP growth, the lag of the difference in prices as instruments.
For some models, special one-off factors such as the Olympics and terrorism were included as additional instruments.
In addition, we have used robust standard errors to account for possible autocorrelation.
ForecastsForecasts for ADR growth and hotel demand were generated using PwC forecasts of macroeconomic variables, supplemented by additional forecast data for hotel supply based on country-level pipeline data provided by STR Global. An attrition factor (10% for hotels in the pipeline and 0.5% for existing hotels) per annum was applied to supply. These rates were based on discussions with industry experts. RevPAR forecasts were constructed using ADR, demand and supply forecasts.
This model was used to generate forecasts through to Q4 2013.
52 European cities hotel forecast PwC
Further reading
For more information visit www.pwc.co.uk/hospitality-leisure/hotels
or contact Liz Hall, Hospitality & Leisure Research: [email protected]
Cities of Opportunity 2012PwC and the Partnership for New York City examine the current social and economic performance of the world’s leading cities.
Emerging Trends in Real Estate EuropeA joint undertaking of the Urban Land Institute and PwC, the Emerging Trends in Real Estate® series provides an outlook on real estate investment and development trends, real estate finance and capital markets, trends by property sector and metropolitan area, and other real estate issues.
UK Hotels ForecastOur flagship publication for the UK hospitality and leisure industry. Provides forecasts of occupancy and hotel revenues and analysis of key trends for the UK hotels sector.
Hospitality Directions USQuarterly outlook for the US lodging sector providing our forecast for occupancy and hotel revenues and analysis of key issues impacting the US industry.
South African Hospitality OutlookPwC’s team of hospitality specialists provide an unbiased overview of how the hospitality industry in South Africa is expected to develop over the coming years.
Hospitality Insights from the Indian CEO’s DeskReport on the key opportunities in the Indian hospitality and leisure sector, based on interviews with the business leaders shaping the industry.

Contacts
Belgium
Serge LoumayePartner
+32 2 7109791 [email protected]
Austria
Wolfgang VejdovskyDirector
+43 1 501 881 [email protected]
Czech Republic
Tomas Basta Partner
+420 251 152 087 M: +420 602 265 [email protected]
Jan Musil Senior Manager
+420 251 152 160 [email protected]
France
Anne-Claire FerriePartner
+33 1 56 57 12 [email protected]
Geoffroy SchmittPartner
+ 33 1 56 57 84 [email protected]
Germany
Dirk HennigPartner
+49 30 [email protected]
Markus HaukManager
+49 69 9585 [email protected]
Netherlands
Bart KruijssenPartner
+31 88 792 [email protected]
Portugal
Cesar GoncalvesPartner
+351 213 599 436 [email protected]
Ricardo Sousa VallesSenior Manager
+351 213 599 [email protected]
Russia
Robert GrumanPartner
+7 495 232 [email protected]
Oleg MalyshevPartner
+7 495 967 [email protected]
Lyubov SoloninaSenior Manager
+7 495 967 [email protected]
Spain
Álvaro Klecker Alonso De CeladaPartner
+34 915 684 [email protected]
David Samu VillaverdePartner
+34 915 [email protected]
Switzerland
Nicolas MayerDirector
+41 58 792 [email protected]
UK
Robert MilburnHospitality & Leisure Leader
+44 020 7212 [email protected]
Liz HallHead of Hospitality & Leisure Research
+44 020 7213 [email protected]
Sam WardHotels Transactions specialist
+44 020 7212 [email protected]
Richard SnookEconomist
+44 020 7212 [email protected]
Bruce CartwrightPartner
+44 013 1260 [email protected]
Ireland
Ann O’ConnellPartner
+353 (0)1 792 [email protected]
Jennifer GillenSenior Manager
+353 (1)792 [email protected]
Italy
Nicola AnzivinoPartner
+39 348 8519 [email protected]
Fabrizio Franco de BelvisExecutive Director
+39 348 5288 [email protected]
Caterina MoliternoSenior Manager
+39 347 8507 [email protected]
www.pwc.com/hospitalityThis publication has been prepared for general guidance on matters of interest only, and does not constitute professional advice. You should not act upon the information contained in this publication without obtaining specific professional advice. No representation or warranty (express or implied) is given as to the accuracy or completeness of the information contained in this publication, and, to the extent permitted by law, PwC does do not accept or assume any liability, responsibility or duty of care for any consequences of you or anyone else acting, or refraining to act, in reliance on the information contained in this publication or for any decision based on it.
© 2013 PwC. All rights reserved. PwC refers to the PwC network and/or one or more of its member firms, each of which is a separate legal entity. Please see www.pwc.com/structure for further details.
121220-192317-SF-OS