Embed Size (px)
Citation preview
Thursday Nov 4th
SIT WITH YOUR GROUP TODAY! Wrap up of Topic #13 Natural Climatic
Forcing (Volcanoes) then Introduction to
TOPIC #14 GLOBAL WARMING & ANTHROPOGENIC FORCING
ANNOUNCEMENT: The due date for RQ-7 is NEXT TUESDAY, Nov
9th
It will be posted tomorrow. Don’t FORGET!!!NOTE: your last 3 RQ’s will all be due on TUESDAYS
instead of Thursdays
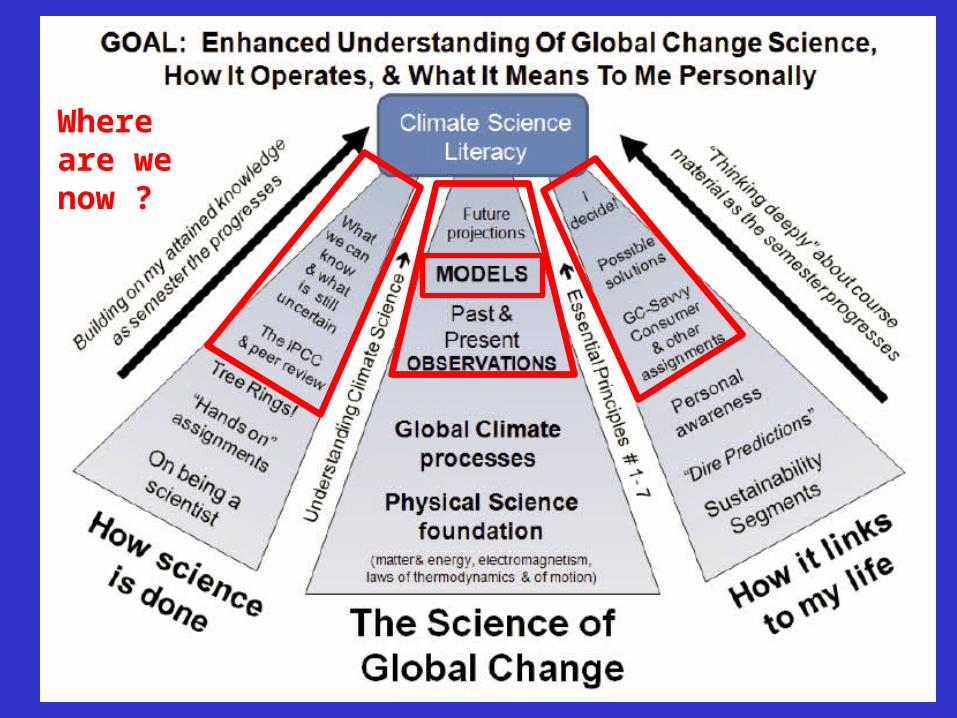
Where are we now ?

SEMESTER WRAP-UP:
20 pts
30 pts
5 pts
Today!
To be posted this weekend
Due last week of classes
3 RQ’s (20 pts), Test #4 (25 pts), + Final Exam ( 100 pts)
+ clicker pts (10 individual 5 group)
TOTAL OF
215 PTS LEFT !!

CLICKER QUESTION:
Q1 In the film shown in class on TUESDAY, what was Willie Nelson promoting??
A – Solar powerB – Corn ethanolC – Biodiesel D – Hybrid trucks
Wrap up of TOPIC # 13 NATURAL CLIMATIC
FORCING:
Volcanic Eruptions
(pp 71-74)
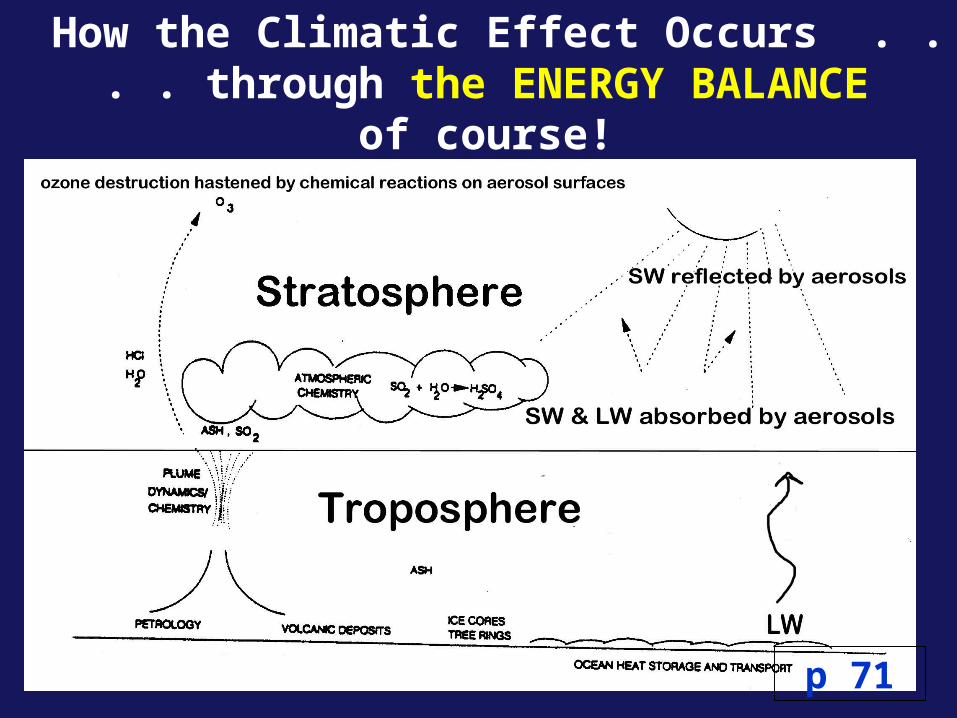
How the Climatic Effect Occurs . . . . through the ENERGY BALANCE
of course!
p 71
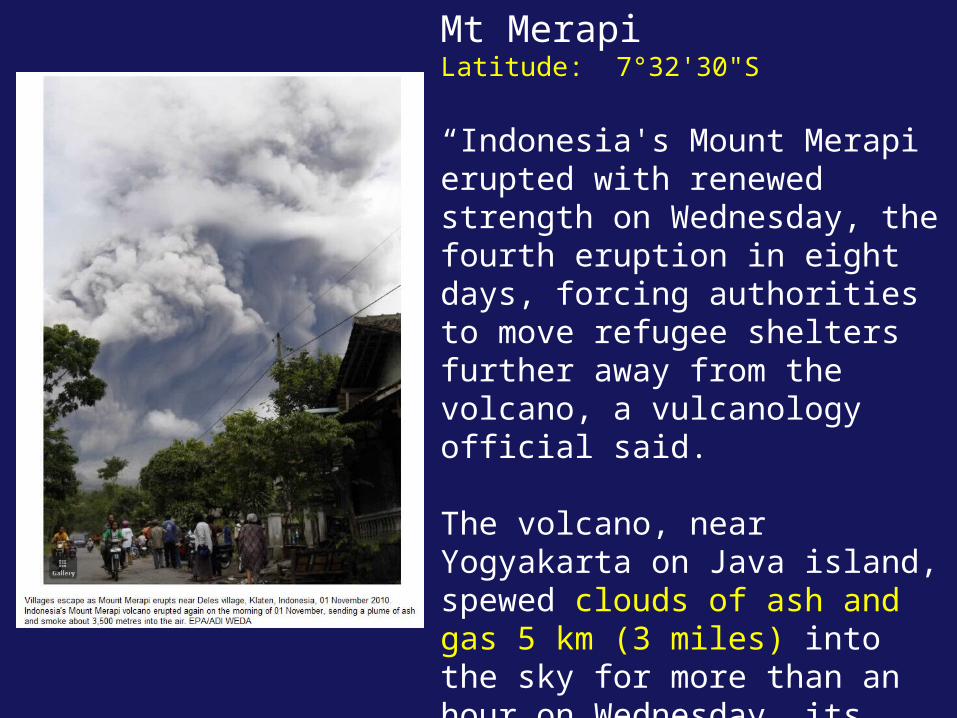
Mt MerapiLatitude: 7°32'30"S
“Indonesia's Mount Merapi erupted with renewed strength on Wednesday, the fourth eruption in eight days, forcing authorities to move refugee shelters further away from the volcano, a vulcanology official said.
The volcano, near Yogyakarta on Java island, spewed clouds of ash and gas 5 km (3 miles) into the sky for more than an hour on Wednesday, its biggest eruption so far in the past 10 days.
How CLIMATICALLY EFFECTIVE will this eruption be??
Hint: See p 39
Q2 - Will it get into the stratosphere?
1 – YES2 - NO, Probably not
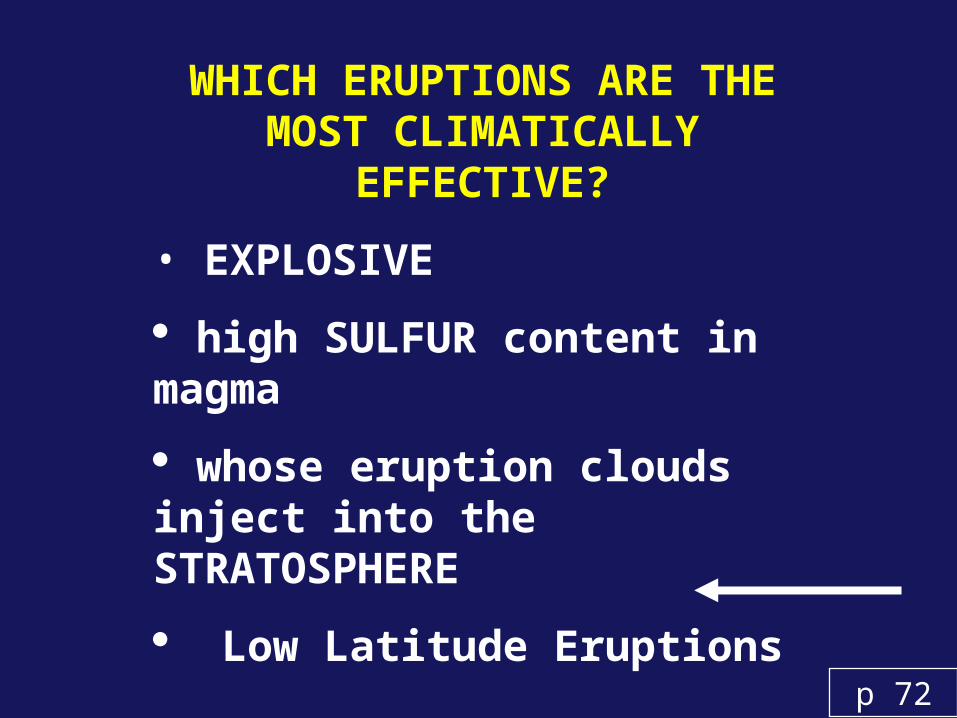
WHICH ERUPTIONS ARE THE MOST CLIMATICALLY
EFFECTIVE?
• EXPLOSIVE
high SULFUR content in magma
whose eruption clouds inject into the STRATOSPHERE
Low Latitude Eruptionsp 72
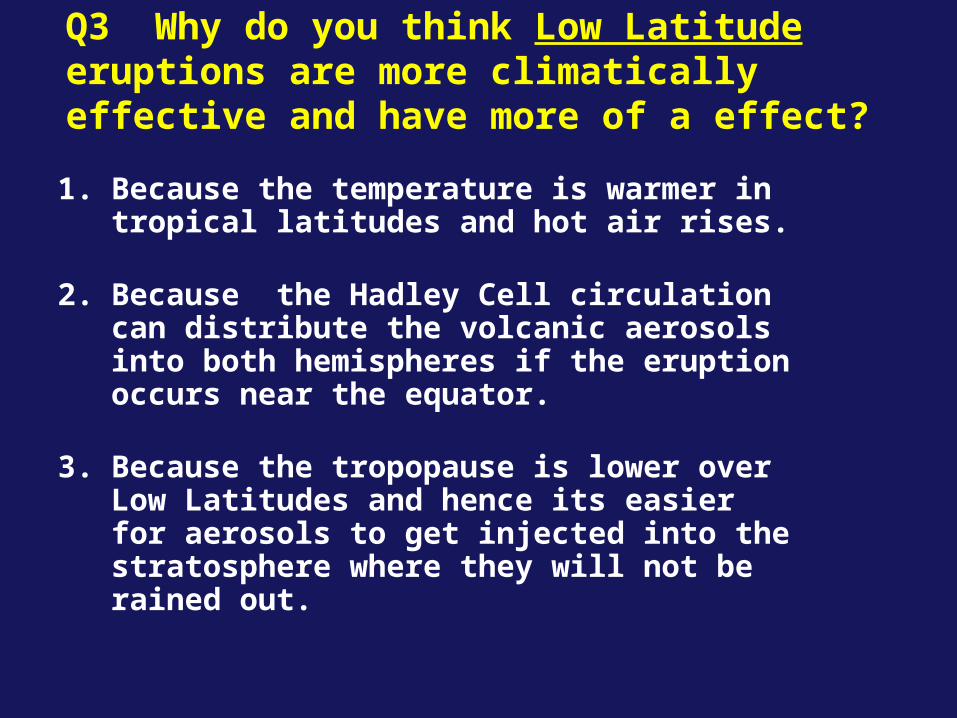
Q3 Why do you think Low Latitude eruptions are more climatically effective and have more of a effect?
1. Because the temperature is warmer in tropical latitudes and hot air rises.
2. Because the Hadley Cell circulation can distribute the volcanic aerosols into both hemispheres if the eruption occurs near the equator.
3. Because the tropopause is lower over Low Latitudes and hence its easier for aerosols to get injected into the stratosphere where they will not be rained out.
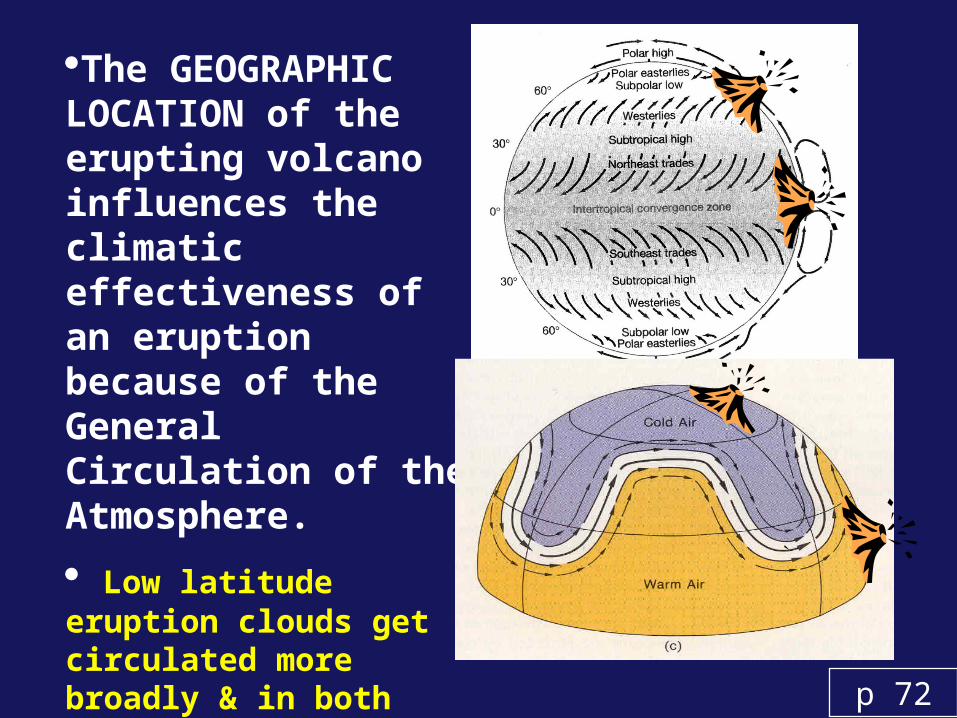
The GEOGRAPHIC LOCATION of the erupting volcano influences the climatic effectiveness of an eruption because of the General Circulation of the Atmosphere.
Low latitude eruption clouds get circulated more broadly & in both hemispheres p 72
HOW DO REGIONAL CLIMATES RESPOND TO AN EXPLOSIVE ERUPTION?
In general, explosive eruptions warm the stratosphere and cool the troposphere, especially during the summer season.
p 72
Major tropical eruption:
• Stratospheric heating is larger in the tropics enhanced pole-to-equator temperature gradient, esp. in winter.
N.H. winter enhanced gradient produces a stronger polar vortex stationary wave pattern of tropospheric circulation resulting in winter warming of NH continents. p 72
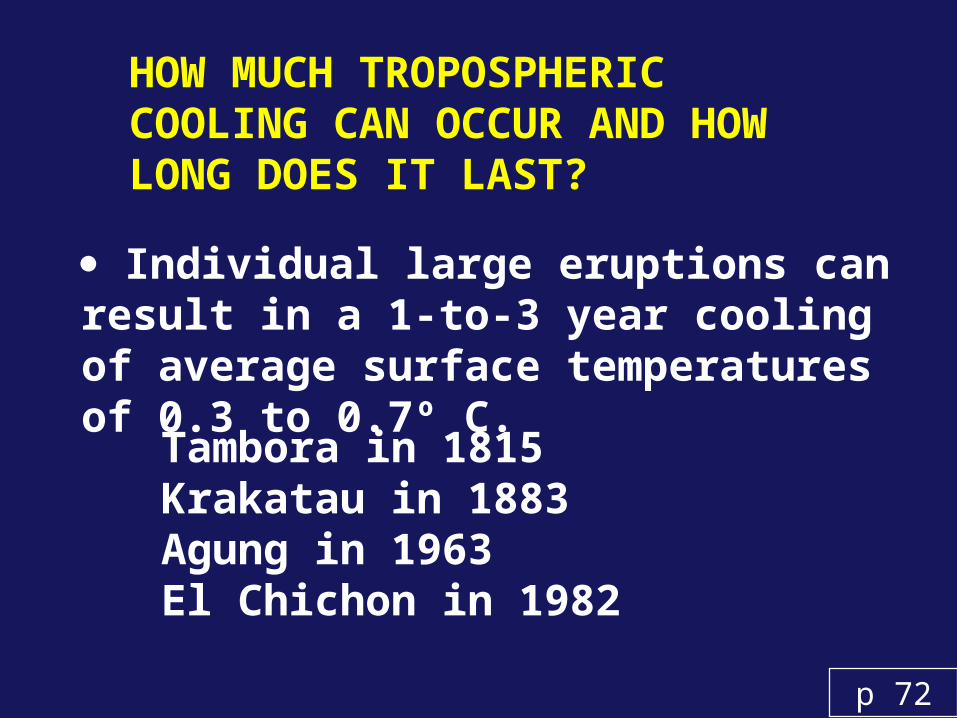
HOW MUCH TROPOSPHERIC COOLING CAN OCCUR AND HOW LONG DOES IT LAST?
Individual large eruptions can result in a 1-to-3 year cooling of average surface temperatures of 0.3 to 0.7º C.
Tambora in 1815Krakatau in 1883Agung in 1963El Chichon in 1982
p 72
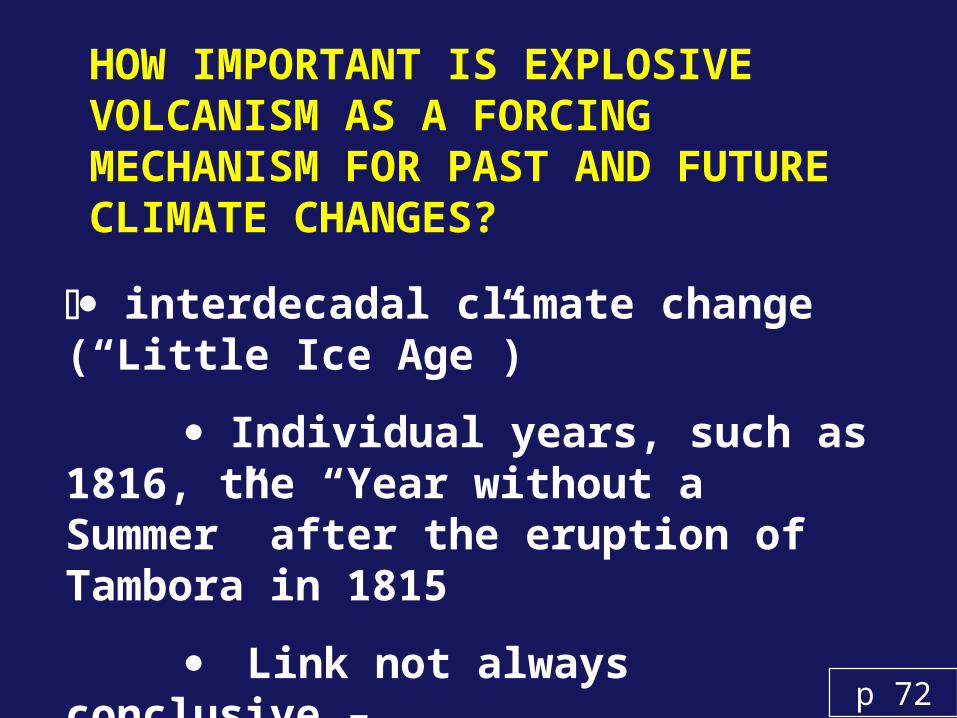
HOW IMPORTANT IS EXPLOSIVE VOLCANISM AS A FORCING MECHANISM FOR PAST AND FUTURE CLIMATE CHANGES?
interdecadal climate change (“Little Ice Age”)
Individual years, such as 1816, the “Year without a Summer” after the eruption of Tambora in 1815
Link not always conclusive –
e.g., El Nino at same time, etc.
p 72
p 72
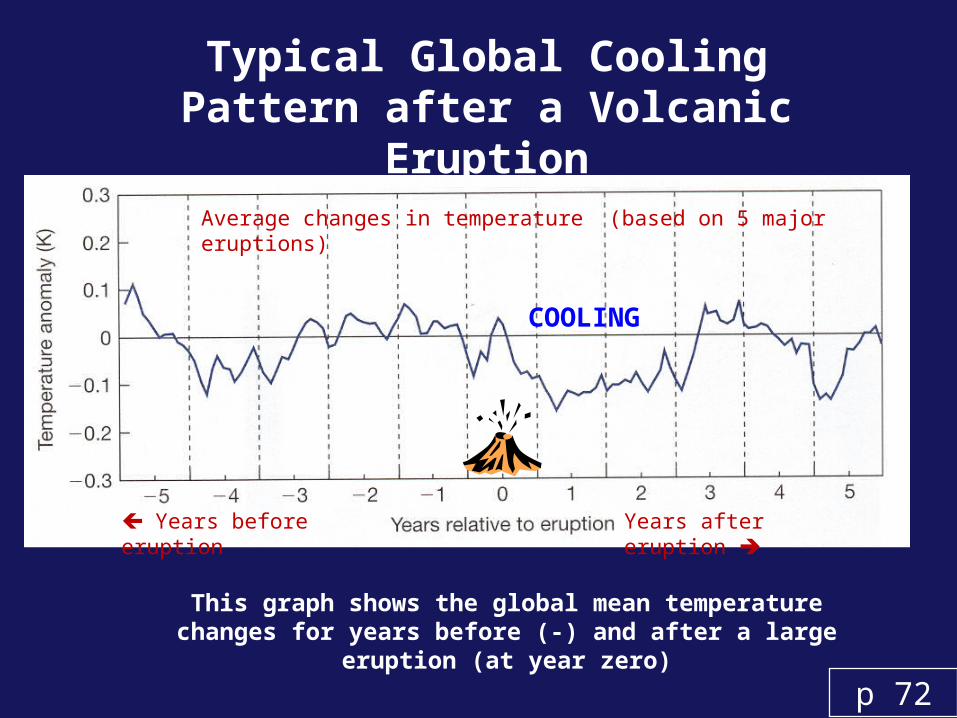
Typical Global Cooling Pattern after a Volcanic
Eruption
p 72
This graph shows the global mean temperature changes for years before (-) and after a large eruption
(at year zero)
Years before eruption
Years after eruption
Average changes in temperature (based on 5 major eruptions)
COOLING
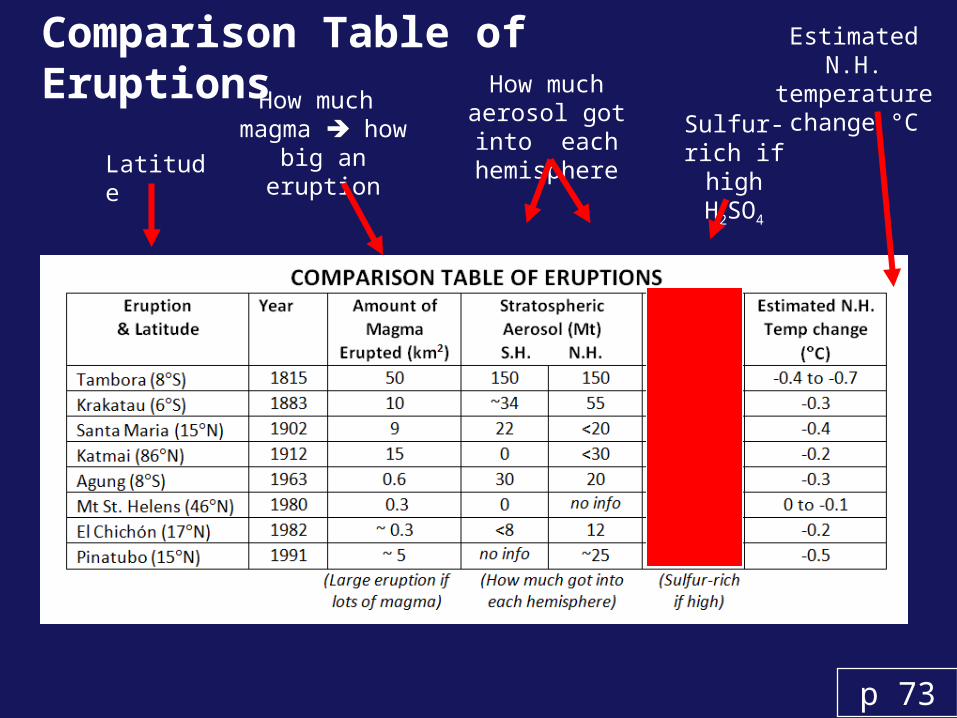
Comparison Table of Eruptions
Latitude
Sulfur-rich if high H2SO4
How much magma how big an eruption
How muchaerosol got into each hemisphere
Estimated N.H. temperature change °C
p 73
G-4 ACTIVITY ON VOLCANISM &
CLIMATE
P.S. This is one of my favorite questions to ask on the FINAL EXAM!!!!
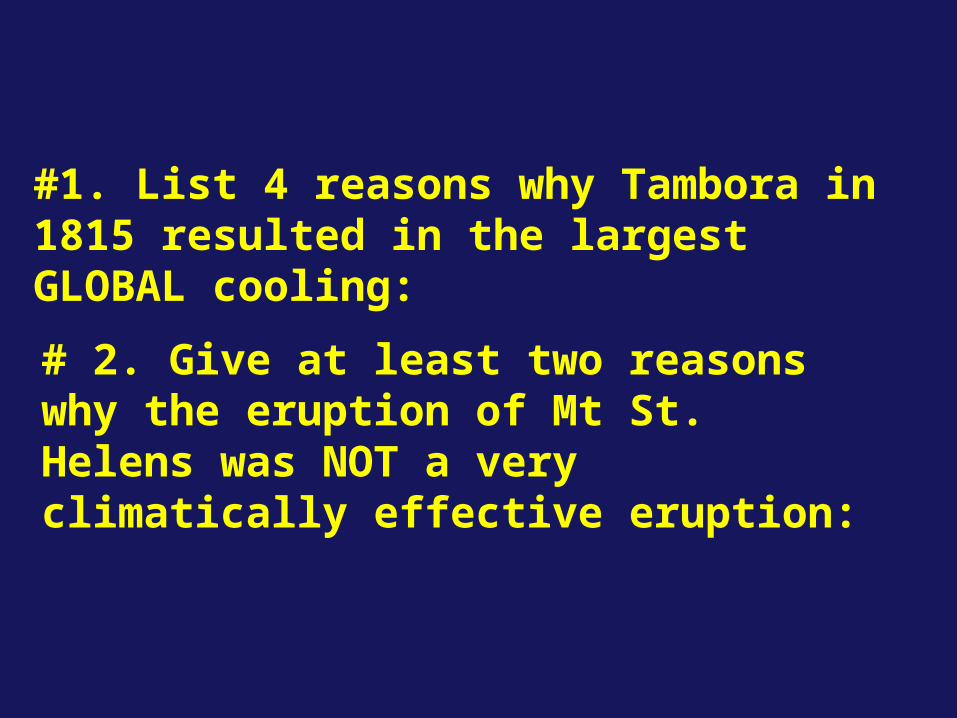
#1. List 4 reasons why Tambora in 1815 resulted in the largest GLOBAL cooling:
# 2. Give at least two reasons why the eruption of Mt St. Helens was NOT a very climatically effective eruption:
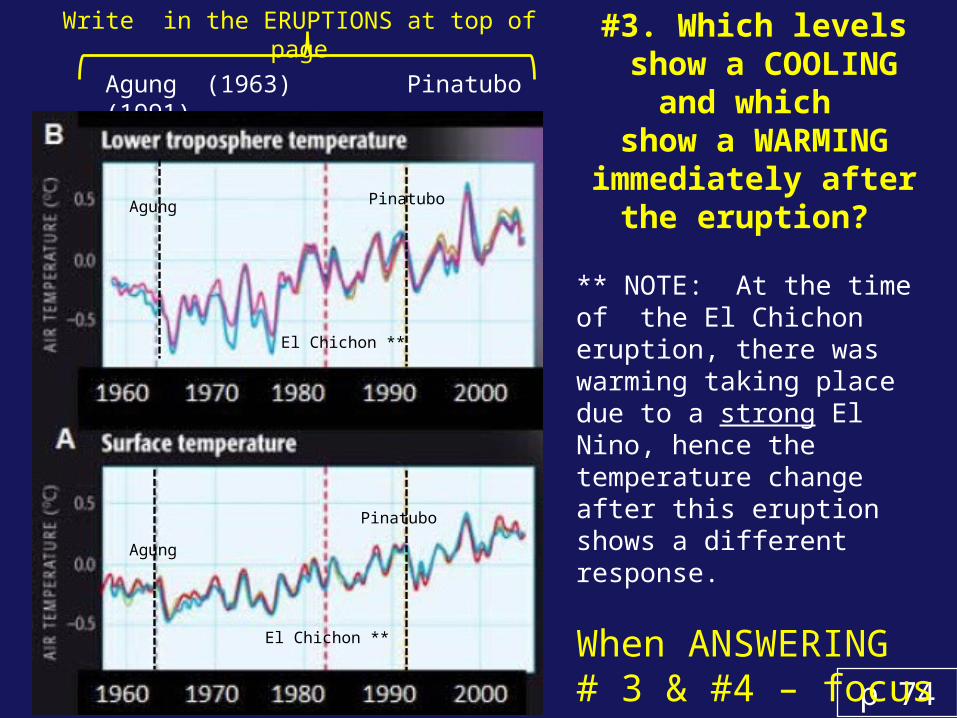
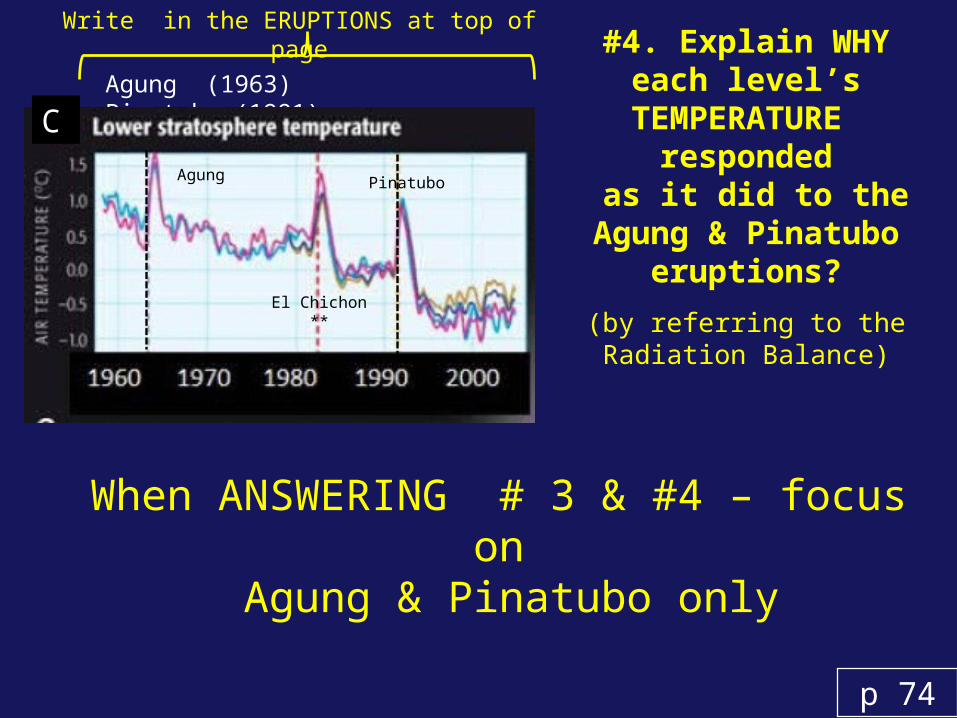
#3. Which levels show a COOLING
and which show a WARMING immediately after
the eruption?
p 74
Agung (1963) Pinatubo (1991)
Write in the ERUPTIONS at top of page
** NOTE: At the time of the El Chichon eruption, there was warming taking place due to a strong El Nino, hence the temperature change after this eruption shows a different response.
When ANSWERING # 3 & #4 – focus on Agung & Pinatubo only
Agung
El Chichon **
Pinatubo
Pinatubo
Agung
El Chichon **
p 74
Agung (1963) Pinatubo (1991)
Write in the ERUPTIONS at top of page
When ANSWERING # 3 & #4 – focus on
Agung & Pinatubo only
#4. Explain WHYeach level’s
TEMPERATURE responded
as it did to theAgung & Pinatubo
eruptions?
(by referring to the Radiation Balance)
Agung
Pinatubo
El Chichon **
C
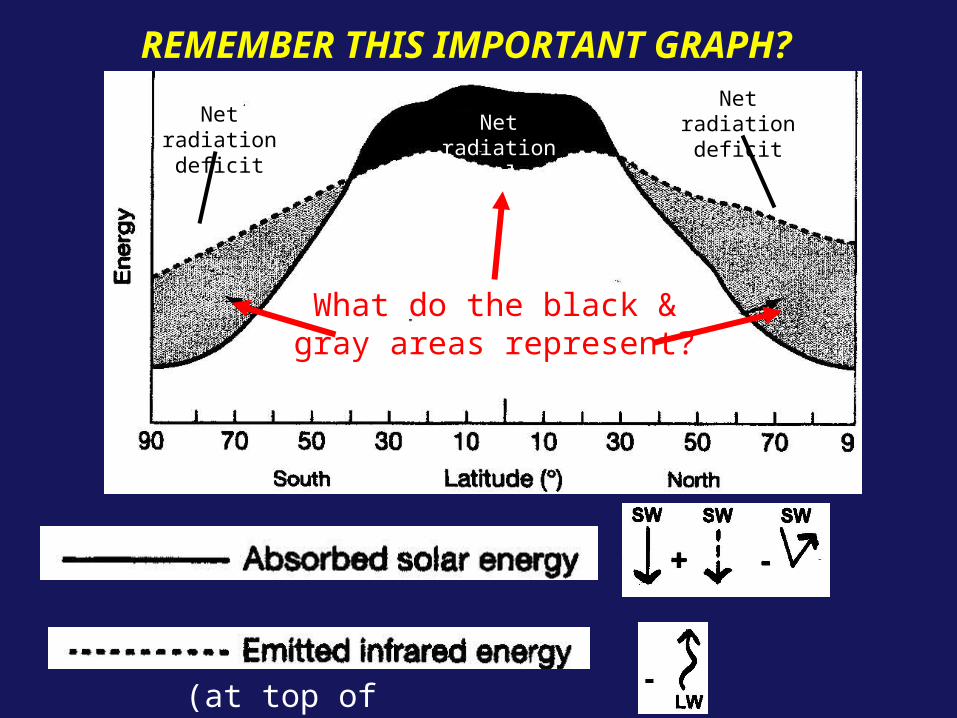
(at top of atmosphere)
Net radiation surplus
Net radiation deficit
Net radiation deficit
What do the black & gray areas represent?
REMEMBER THIS IMPORTANT GRAPH?
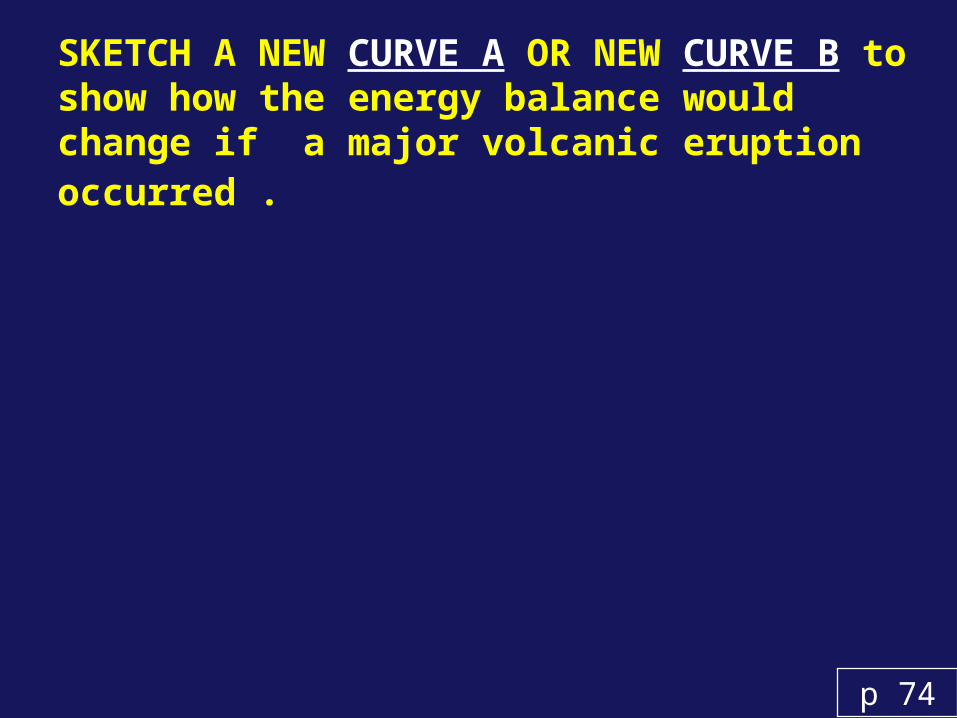
SKETCH A NEW CURVE A OR NEW CURVE B to show how the energy balance would change if a major volcanic eruption occurred .
p 74
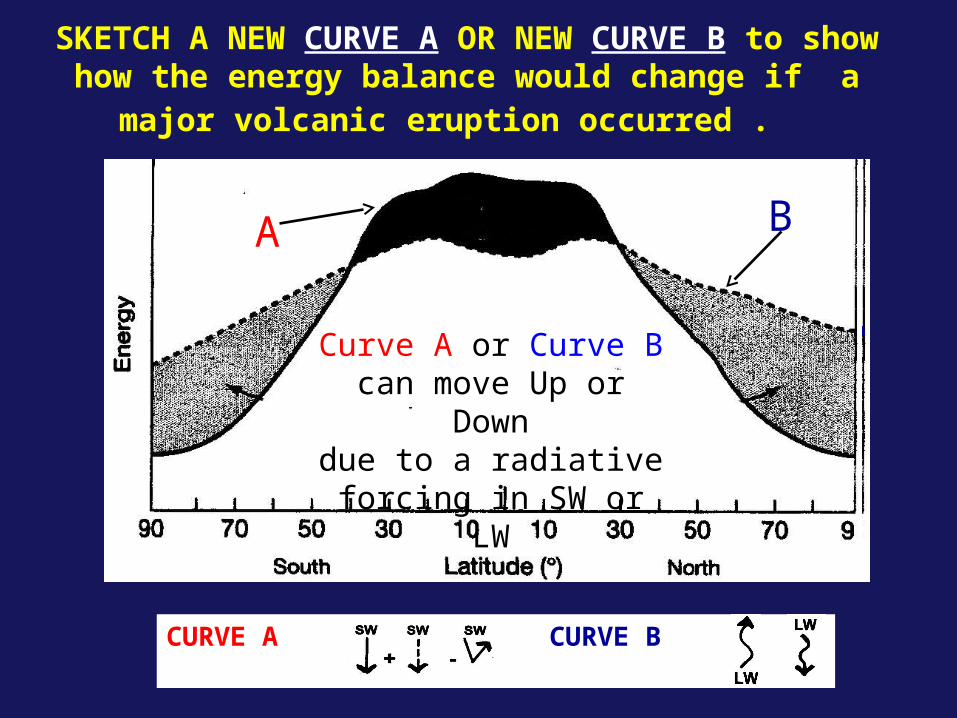
A B
CURVE A CURVE B is
Curve A or Curve B can move Up or Down
due to a radiative forcing in SW or LW
SKETCH A NEW CURVE A OR NEW CURVE B to show how the energy balance would change if
a major volcanic eruption occurred .
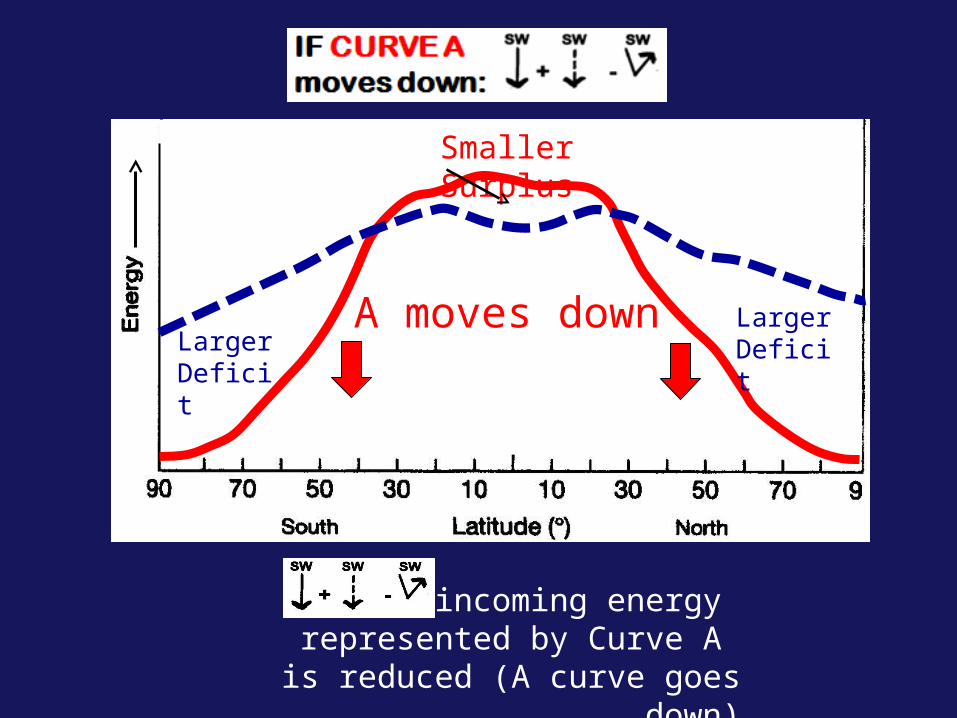
Smaller Surplus
Larger Deficit
LargerDeficit
If incoming energy represented by Curve A is
reduced (A curve goes down)
A moves down
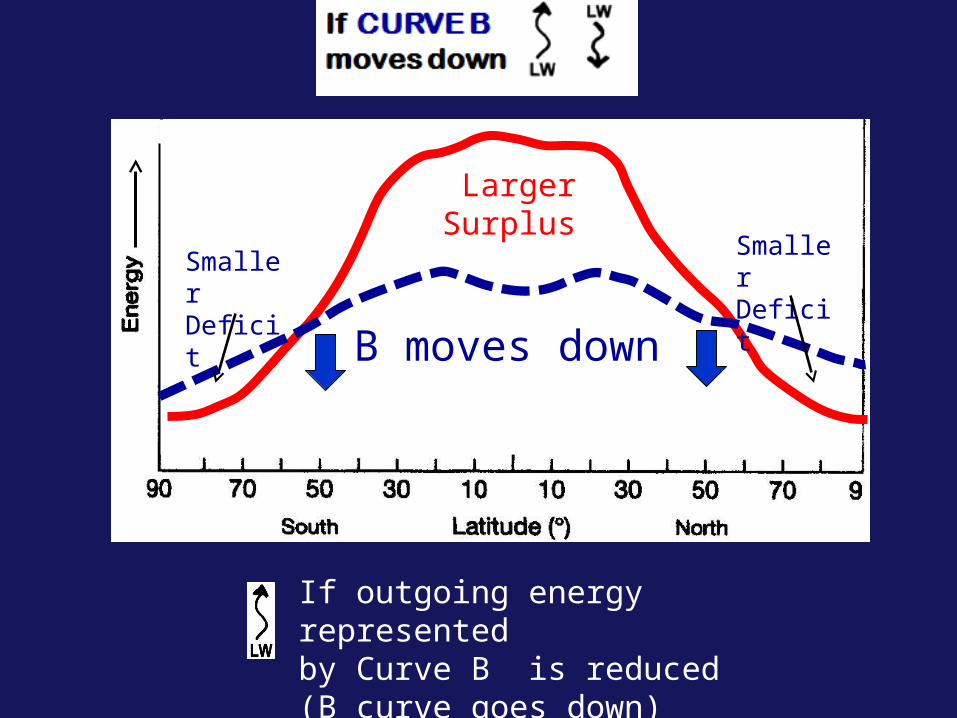
If outgoing energy represented by Curve B is reduced (B curve goes down)
LargerSurplus
Smaller Deficit
Smaller Deficit
B moves down
LargerSurplus
Smaller Deficit
Smaller Deficit
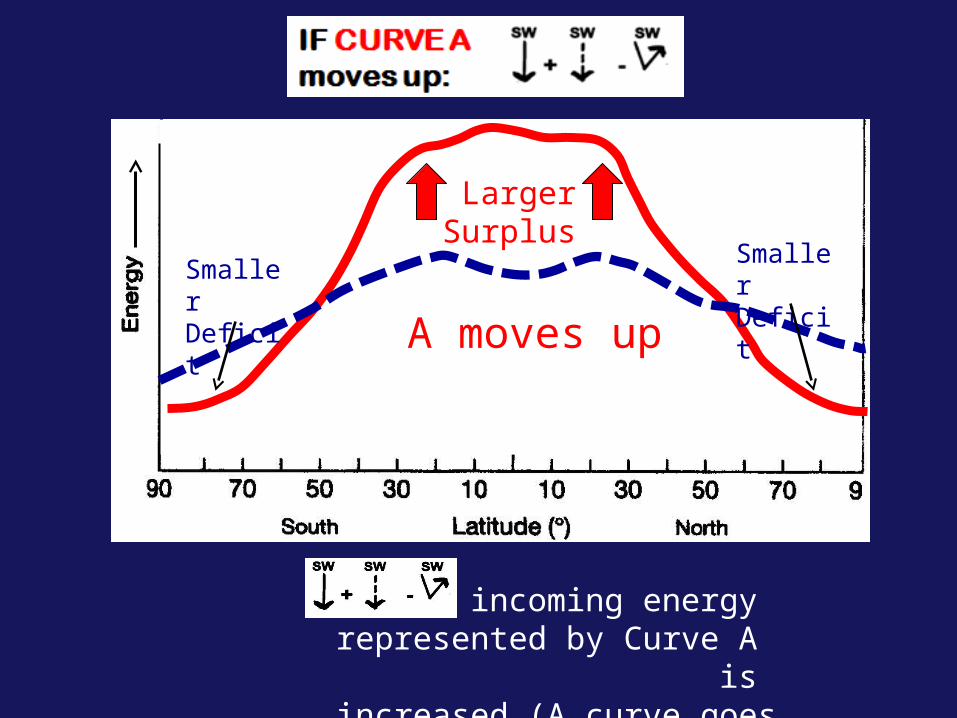
If incoming energy represented by Curve A is increased (A curve goes up)
A moves up
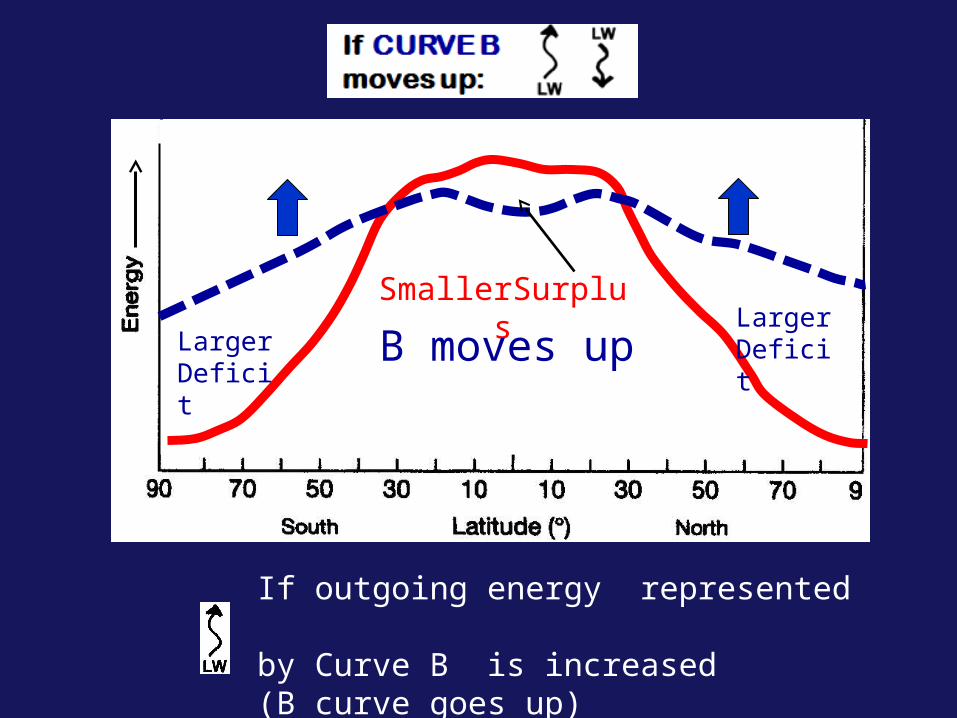
SmallerSurplus
Larger Deficit
LargerDeficit
If outgoing energy represented by Curve B is increased (B curve goes up)
B moves up
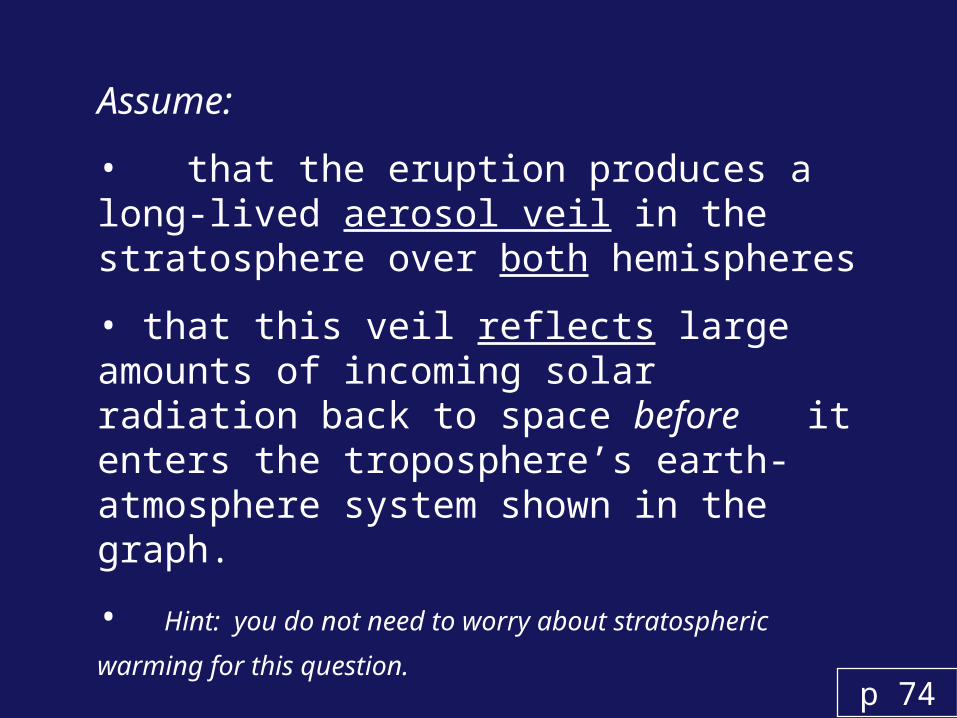
Assume:
• that the eruption produces a long-lived aerosol veil in the stratosphere over both hemispheres
• that this veil reflects large amounts of incoming solar radiation back to space before it enters the troposphere’s earth-atmosphere system shown in the graph.
• Hint: you do not need to worry about stratospheric
warming for this question.
p 74

Four scenario’s are possible for how you should sketch the new graph
IF CURVE A If CURVE B is affected: is affected:

THE ANSWERS!
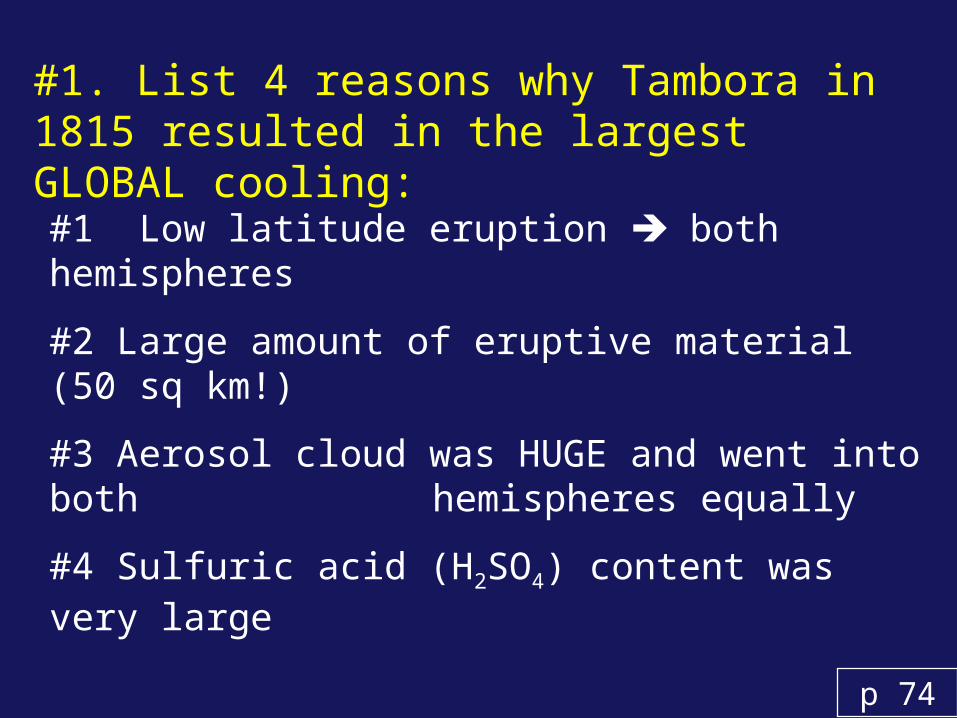
#1. List 4 reasons why Tambora in 1815 resulted in the largest GLOBAL cooling:
#1 Low latitude eruption both hemispheres
#2 Large amount of eruptive material (50 sq km!)
#3 Aerosol cloud was HUGE and went into both hemispheres equally
#4 Sulfuric acid (H2SO4) content was very large
p 74
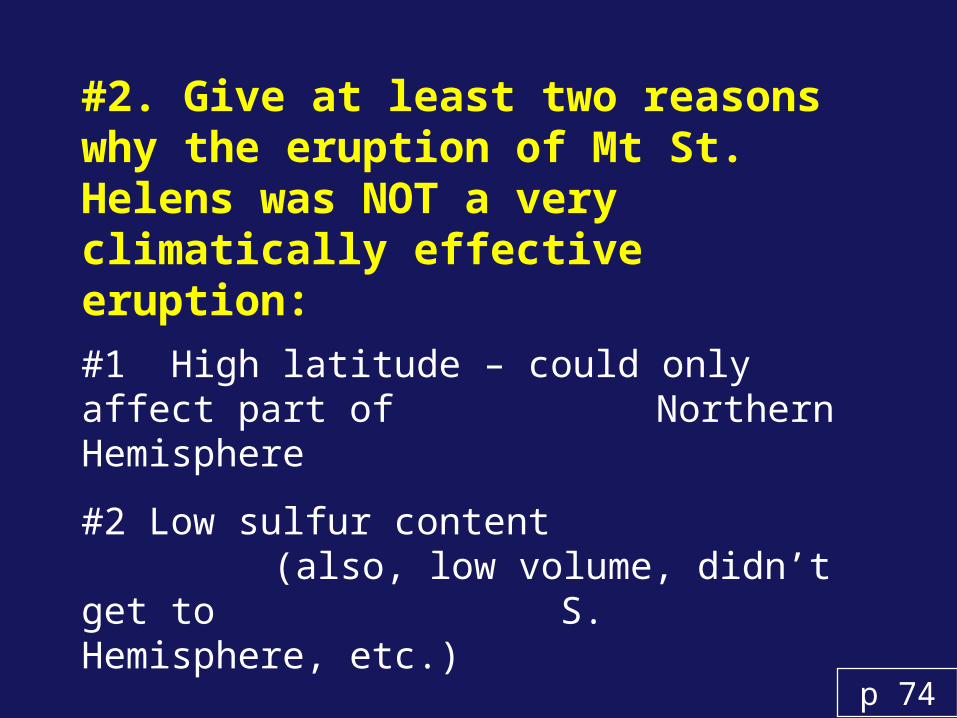
#2. Give at least two reasons why the eruption of Mt St. Helens was NOT a very climatically effective eruption:
#1 High latitude – could only affect part of Northern Hemisphere
#2 Low sulfur content (also, low volume, didn’t get
to S. Hemisphere, etc.)
p 74
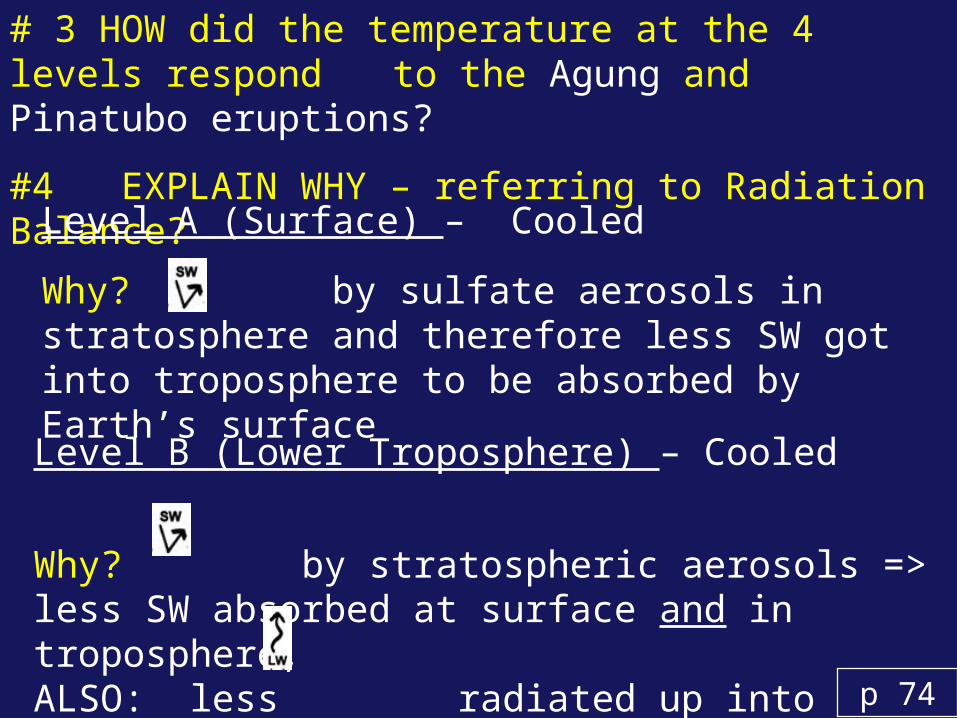
# 3 HOW did the temperature at the 4 levels respond to the Agung and Pinatubo eruptions?
#4 EXPLAIN WHY – referring to Radiation Balance?
p 74
Level B (Lower Troposphere) – Cooled
Why? by stratospheric aerosols => less SW absorbed at surface and in troposphere, ALSO: less radiated up into troposphere from the cooler Earth’s surface
Level A (Surface) – Cooled
Why? by sulfate aerosols in stratosphere and therefore less SW got into troposphere to be absorbed by Earth’s surface
p 74
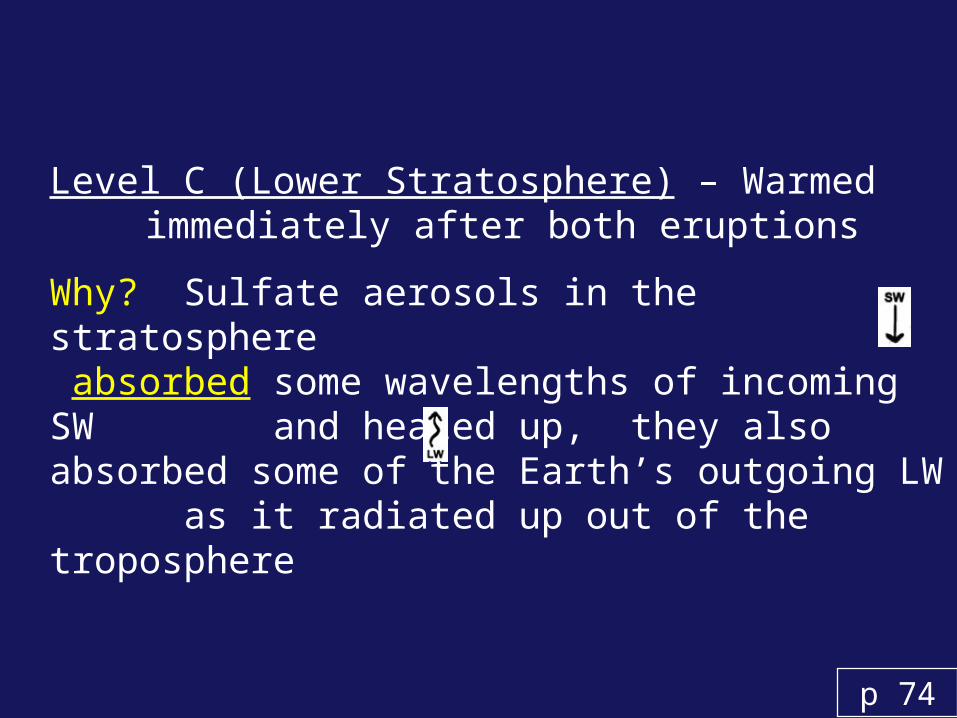
Level C (Lower Stratosphere) – Warmed immediately after both eruptions
Why? Sulfate aerosols in the stratosphere absorbed some wavelengths of incoming SW and heated up, they also absorbed some of the Earth’s outgoing LW as it radiated up out of the troposphere
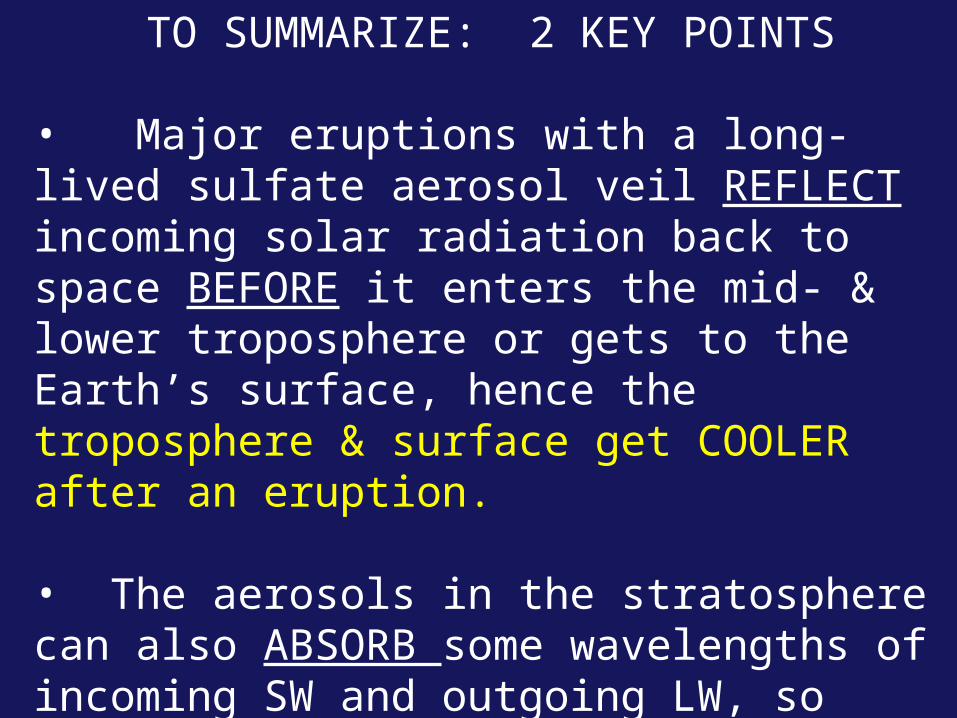
TO SUMMARIZE: 2 KEY POINTS
• Major eruptions with a long-lived sulfate aerosol veil REFLECT incoming solar radiation back to space BEFORE it enters the mid- & lower troposphere or gets to the Earth’s surface, hence the troposphere & surface get COOLER after an eruption.
• The aerosols in the stratosphere can also ABSORB some wavelengths of incoming SW and outgoing LW, so that the stratosphere WARMS slightly after an eruption.
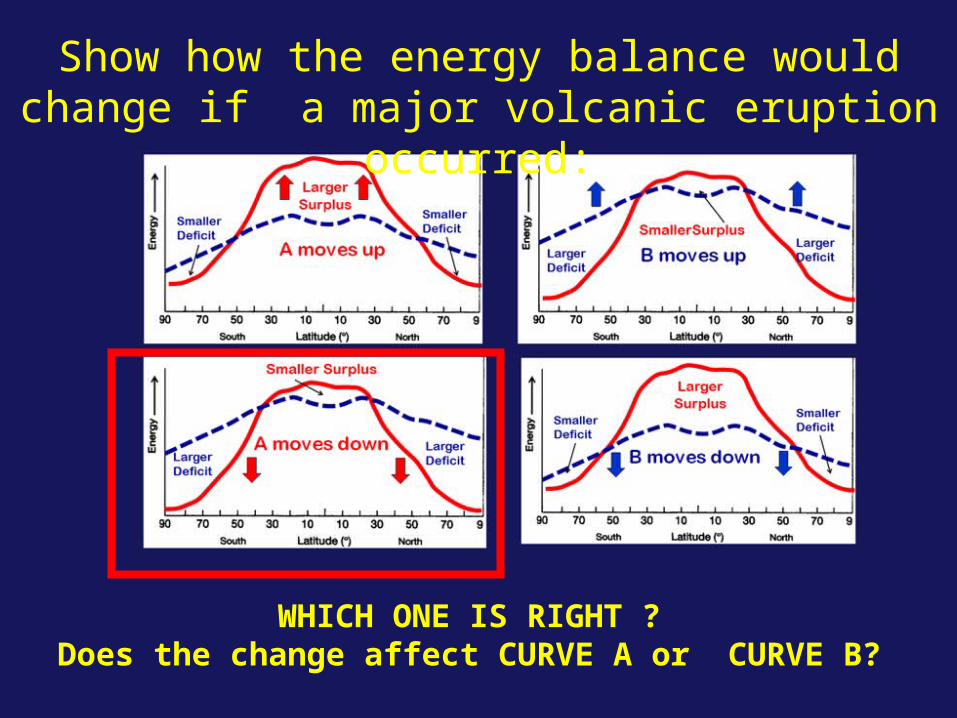
WHICH ONE IS RIGHT ? Does the change affect CURVE A or CURVE B?
Show how the energy balance would change if a major volcanic eruption
occurred:
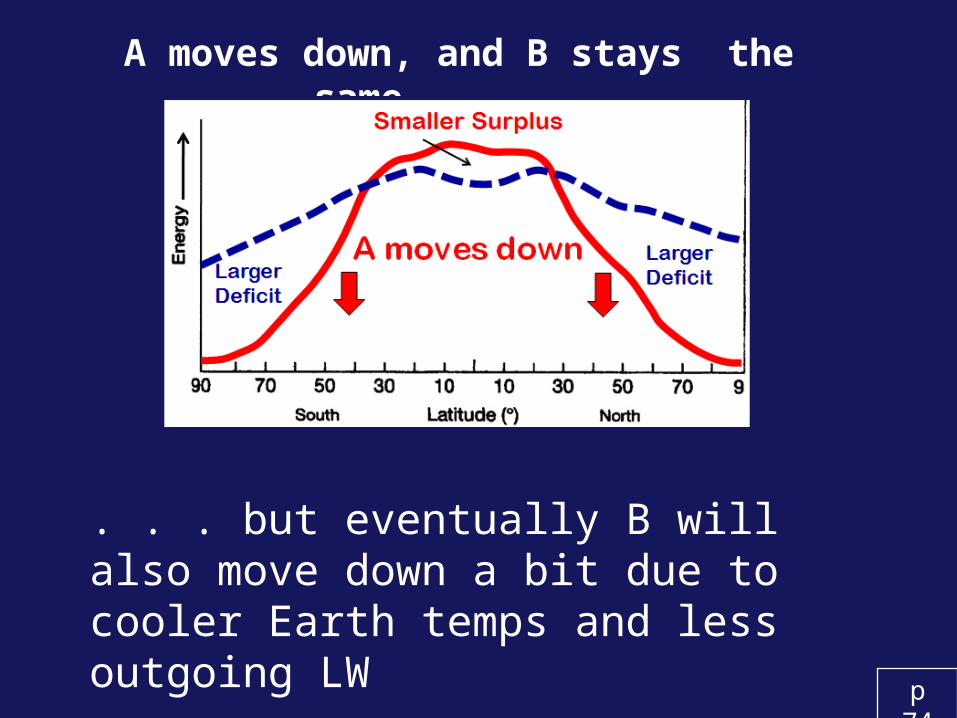
A moves down, and B stays the same . . . .
p 74
. . . but eventually B will also move down a bit due to cooler Earth temps and less outgoing LW

ZOMBIE BREAK !
TOPIC # 14GLOBAL WARMING &
ANTHROPOGENICFORCING
TODAY’s 3 KEY CONCEPTS:
Carbon / Forests / Deforestation Computer Model Evidence for Anthropogenic GW Forcing Tying it all together w/ RADIATIVE FORCING GRAPHS
TOPIC # 14GLOBAL WARMING &
ANTHROPOGENICFORCING
Part A - CARBON RESERVOIRS & FLUXES: Natural vs. Anthropogenically
Enhanced(or How does all that “C” get into the
atmosphere??)Class Notes pp 75
“I'm extremely concerned that the Earth has a chronic disease, and that chronic disease is CO2 syndrome, it‘s something that's creeping on us.
We have plenty of fossil fuel so it's going to continue to get worse, and it's going to affect every aspect of life on the planet, from food production to drinking water to coastlines to the plight of the poor in the tropics, and so forth.”
~Wally Broecker , Paleoclimatologist
p 75
CO2 & CARBON RESERVOIRS
CO2 in the atmosphere is one place CARBON resides in the Earth-Atmosphere system.
Where else is carbon located and how does it move (flux) from one reservoir to another?

p 75
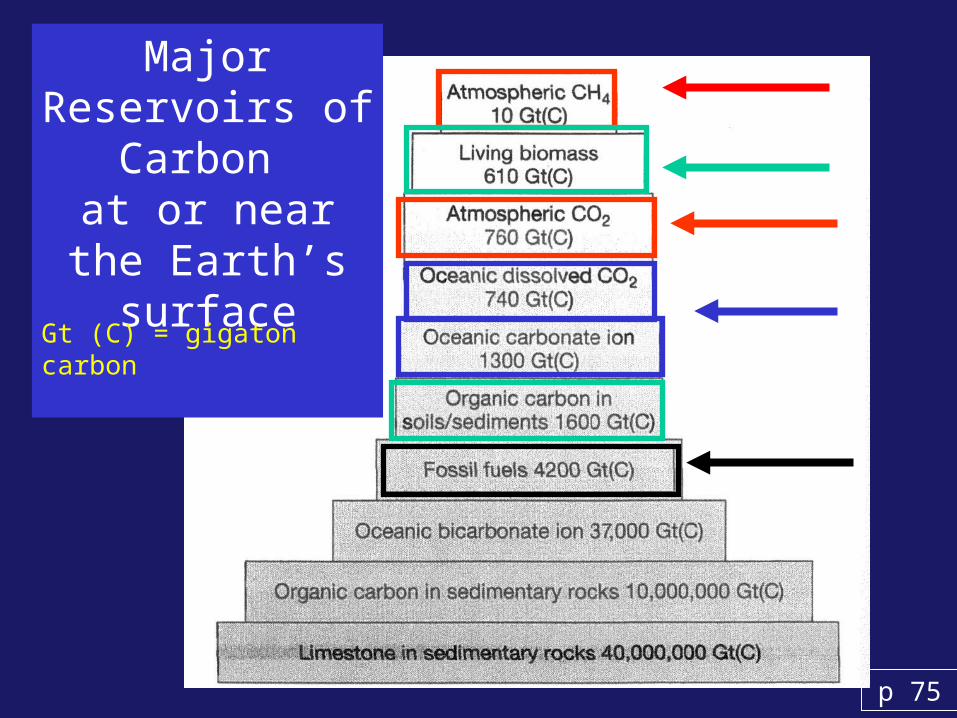
Major Reservoirs of
Carbon at or near the
Earth’s surface
Gt (C) = gigaton carbon
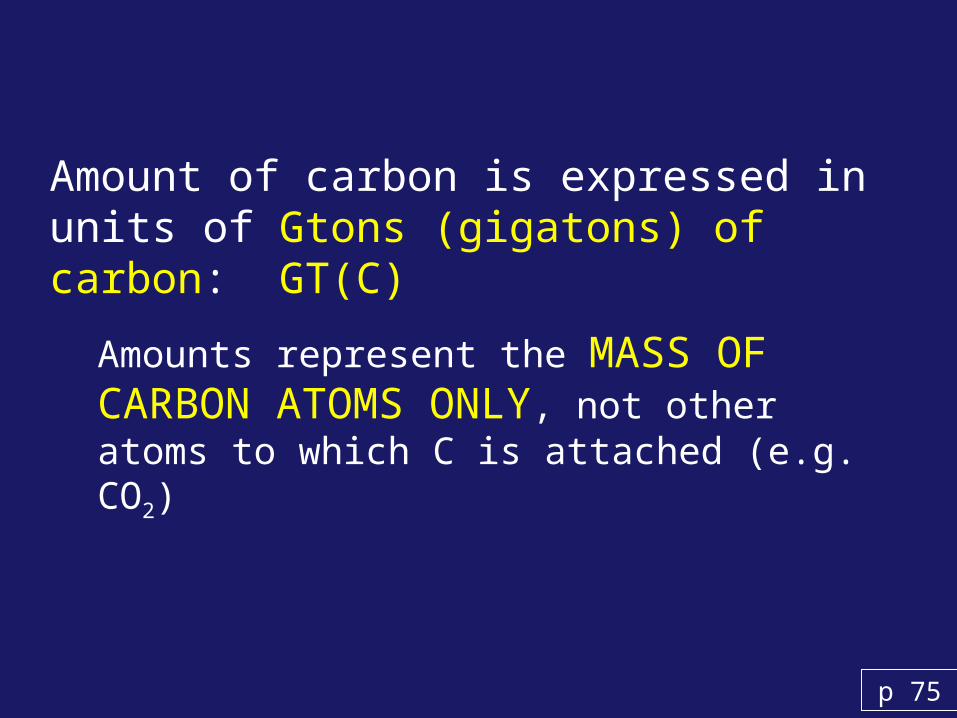
Amount of carbon is expressed in units of Gtons (gigatons) of carbon: GT(C)
Amounts represent the MASS OF CARBON ATOMS ONLY, not other atoms to which C is attached (e.g. CO2)
p 75
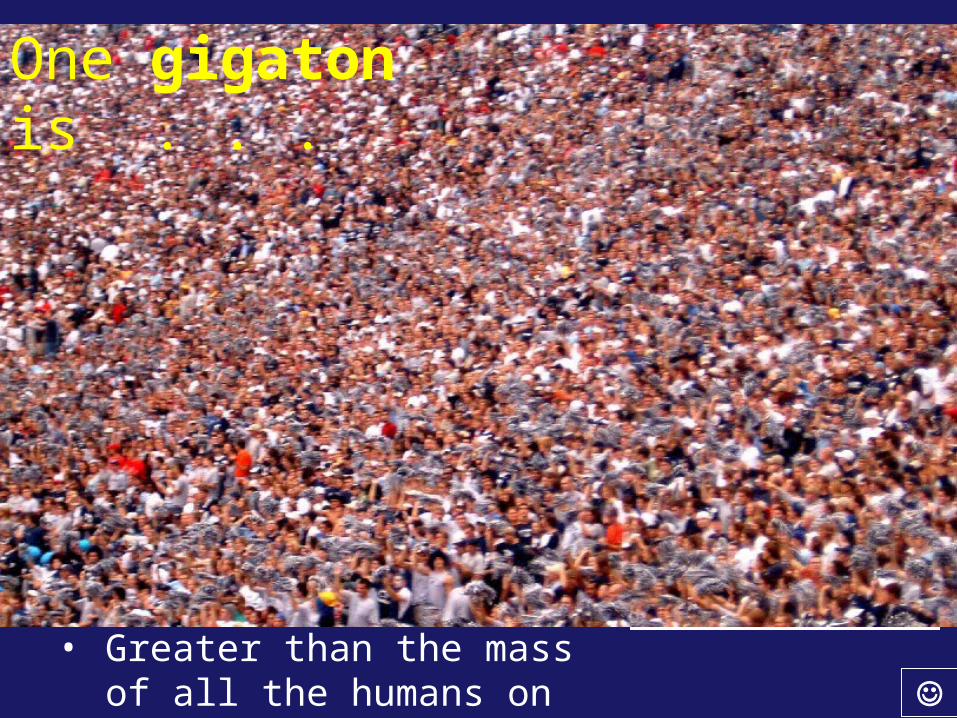
• 2740 Empire State Buildings or 77 Empire State Buildings made out of solid lead
• 142,857,142 African elephants -- That’s enough elephants stacked on top of each other to reach from Earth to the moon and halfway back
• Greater than the mass of all the humans on the planet
One gigaton is . . .
p 75
Major Reservoirs of
Carbon at or near the
Earth’s surface
Gt (C) = gigaton carbon
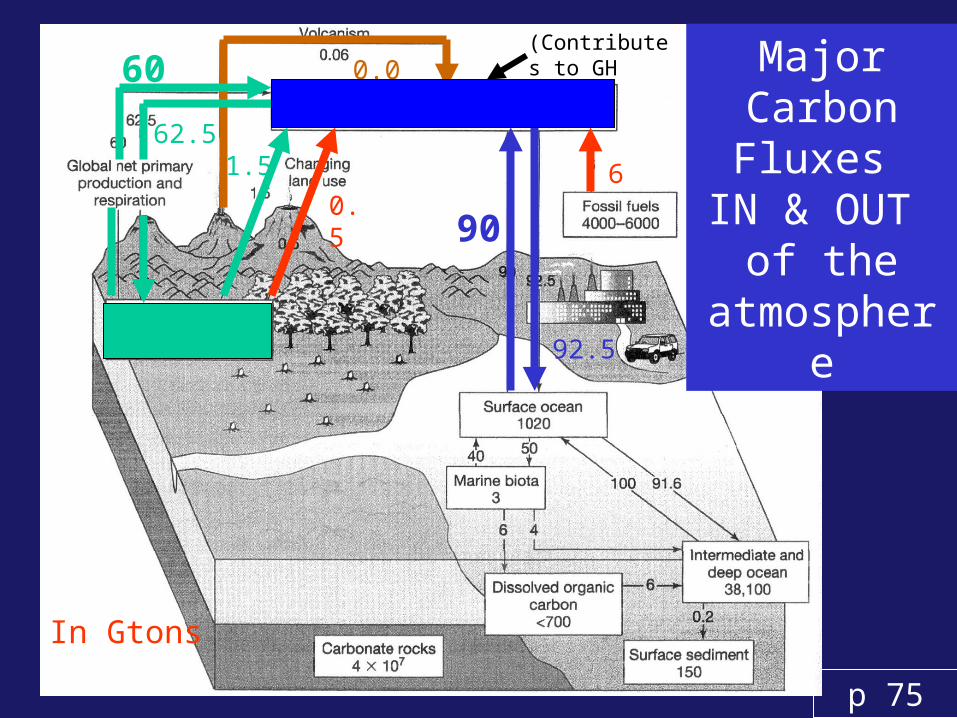
60
0.06
90
6
In Gtons
92.5
62.5
Major Carbon Fluxes
IN & OUT of the
atmosphere
1.5
0.5
p 75
(Contributes to GH effect)
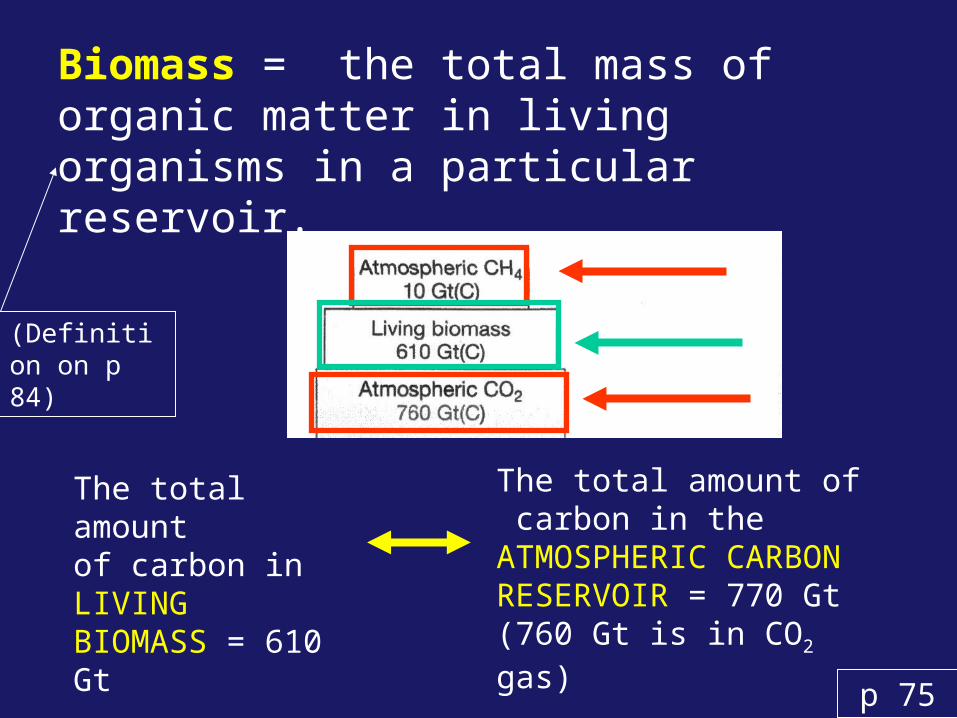
Biomass = the total mass of organic matter in living organisms in a particular reservoir.
p 75
The total amount of carbon in LIVING BIOMASS = 610 Gt
The total amount of carbon in the ATMOSPHERIC CARBON
RESERVOIR = 770 Gt(760 Gt is in CO2 gas)
(Definition on p 84)
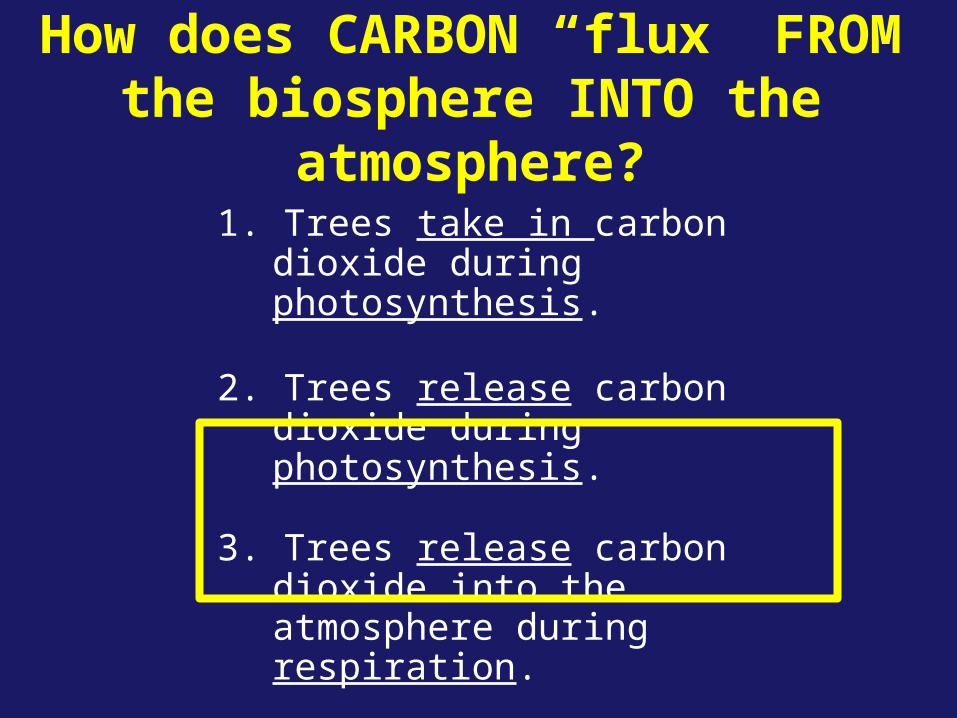
How does CARBON “flux” FROM the biosphere INTO
the atmosphere?1. Trees take in carbon
dioxide during photosynthesis.
2. Trees release carbon dioxide during photosynthesis.
3. Trees release carbon dioxide into the atmosphere during respiration.
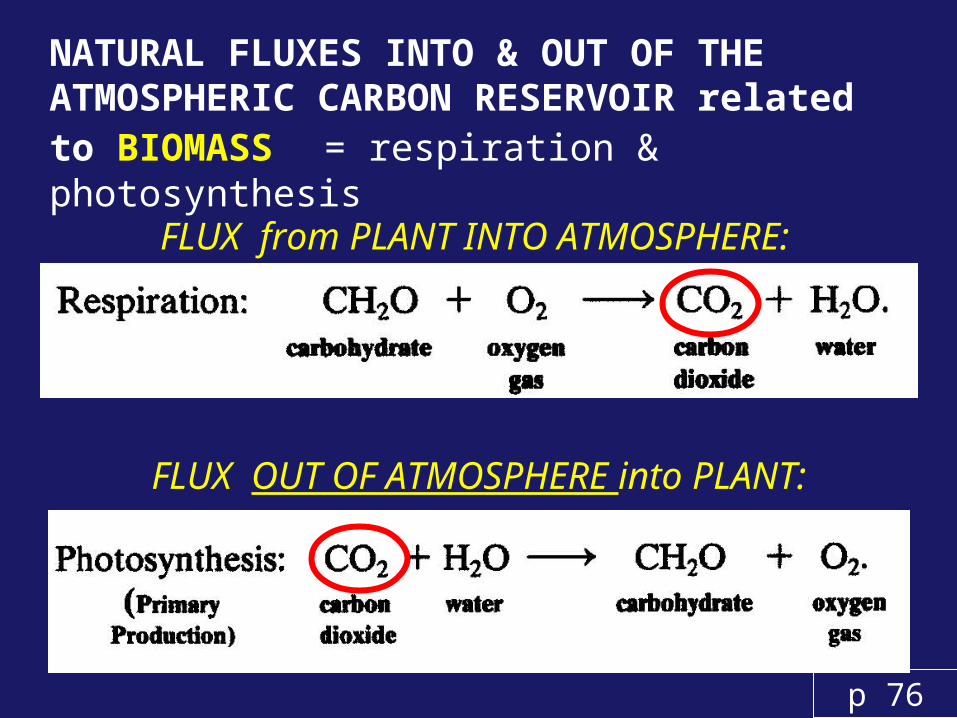
NATURAL FLUXES INTO & OUT OF THE ATMOSPHERIC CARBON RESERVOIR related to BIOMASS = respiration & photosynthesis
FLUX from PLANT INTO ATMOSPHERE:
FLUX OUT OF ATMOSPHERE into PLANT:
p 76
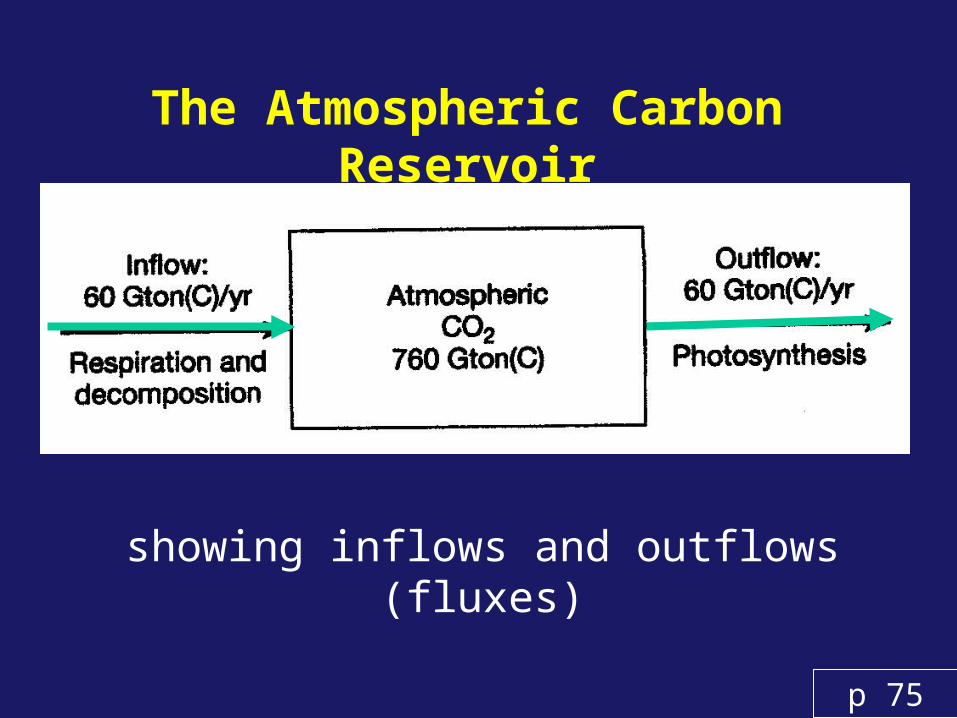
showing inflows and outflows (fluxes)
The Atmospheric Carbon Reservoir
p 75
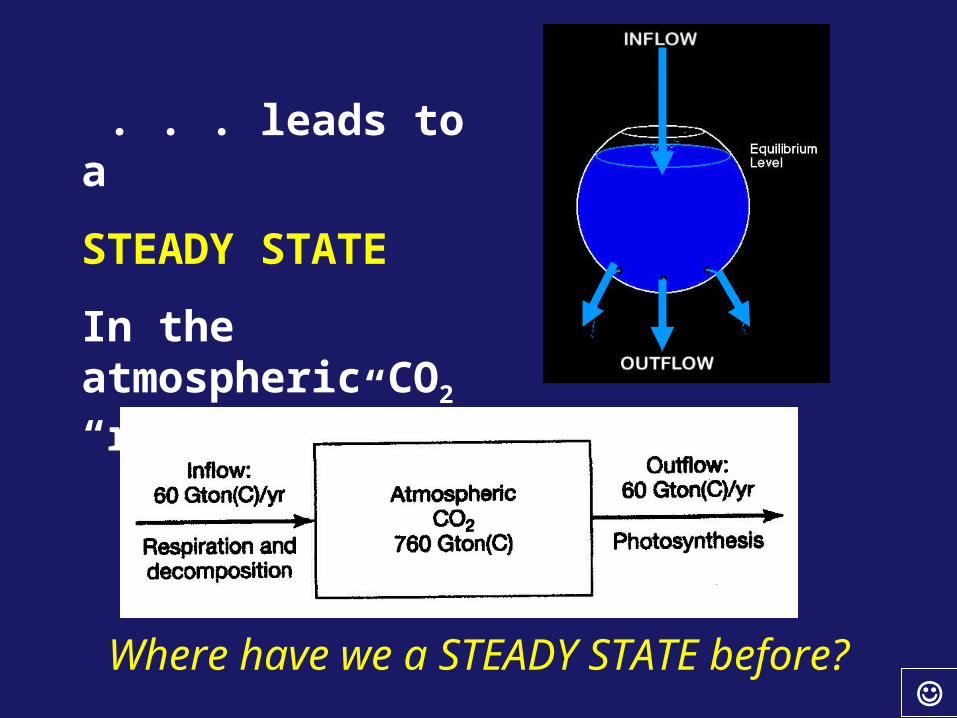
. . . leads to a
STEADY STATE
In the atmospheric CO2
“reservoir”
Where have we a STEADY STATE before?
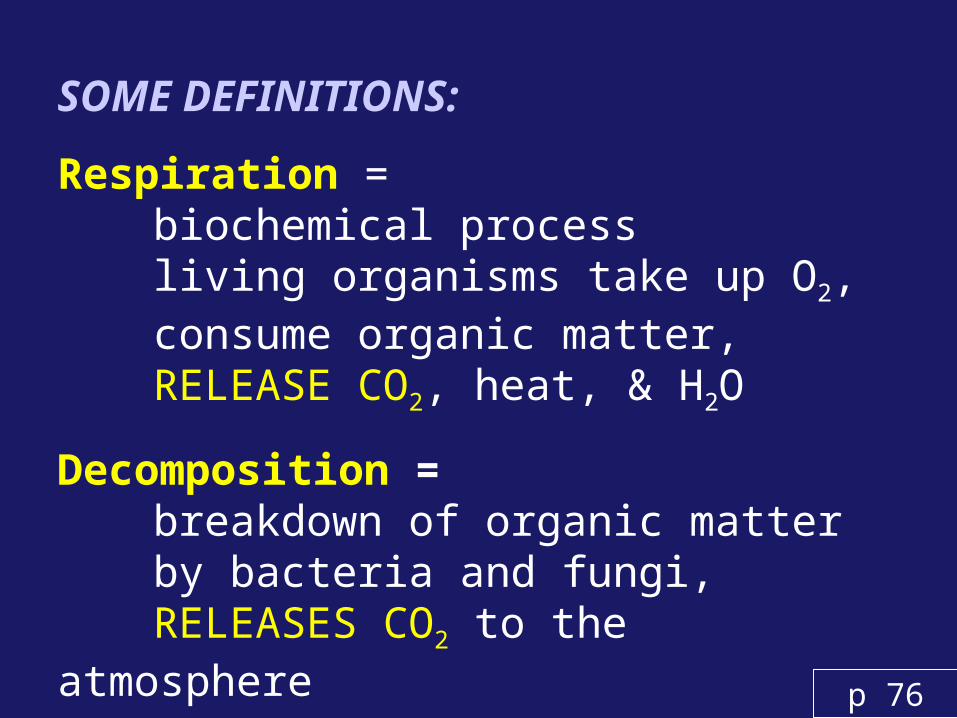
SOME DEFINITIONS:
Respiration = biochemical processliving organisms take up O2,
consume organic matter,RELEASE CO2, heat, & H2O
Decomposition = breakdown of organic matter by bacteria and fungi, RELEASES CO2 to the atmosphere
p 76
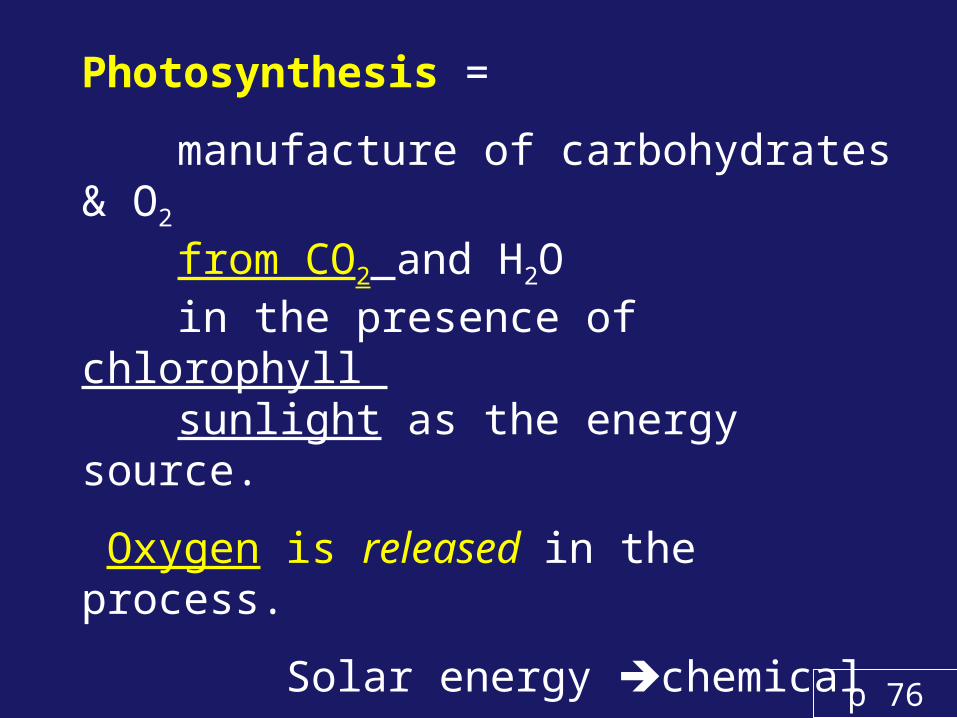
Photosynthesis =
manufacture of carbohydrates & O2
from CO2 and H2Oin the presence of chlorophyll sunlight as the energy source.
Oxygen is released in the process.
Solar energy chemical energy
(Part of chemical energy is stored in living tissues & used by other organisms (consumers) that cannot use solar energy directly.) p 76
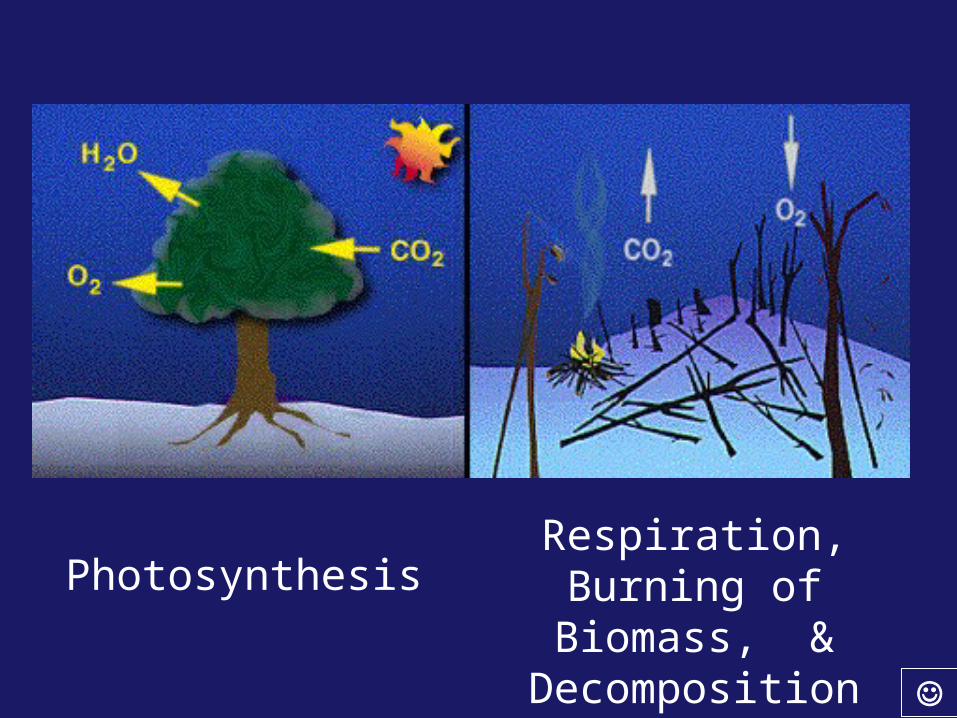
PhotosynthesisRespiration,
Burning of Biomass, & Decomposition
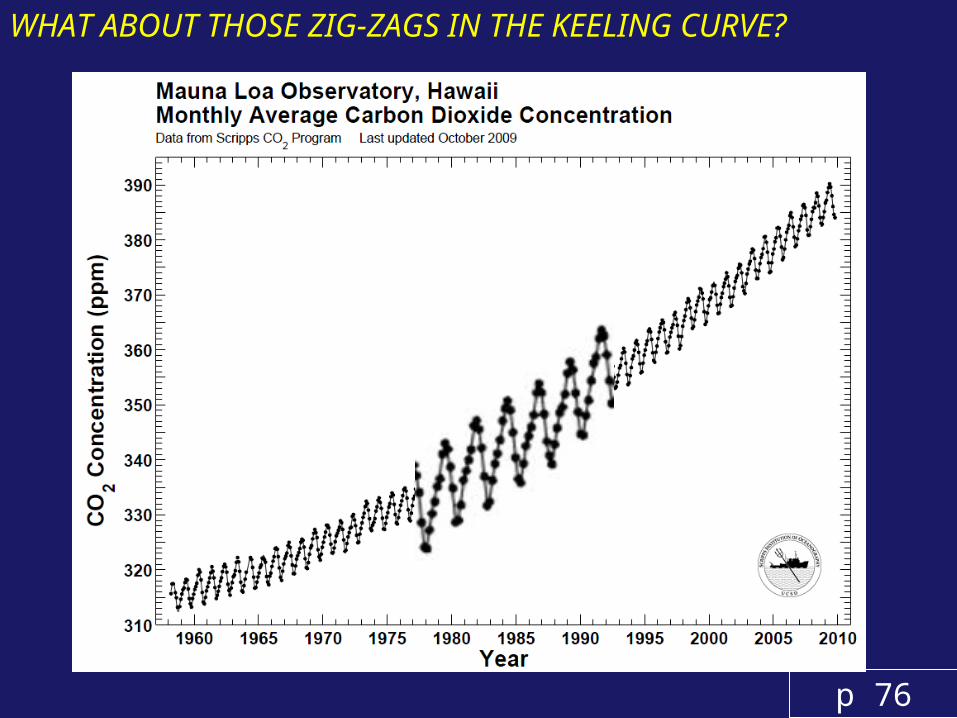
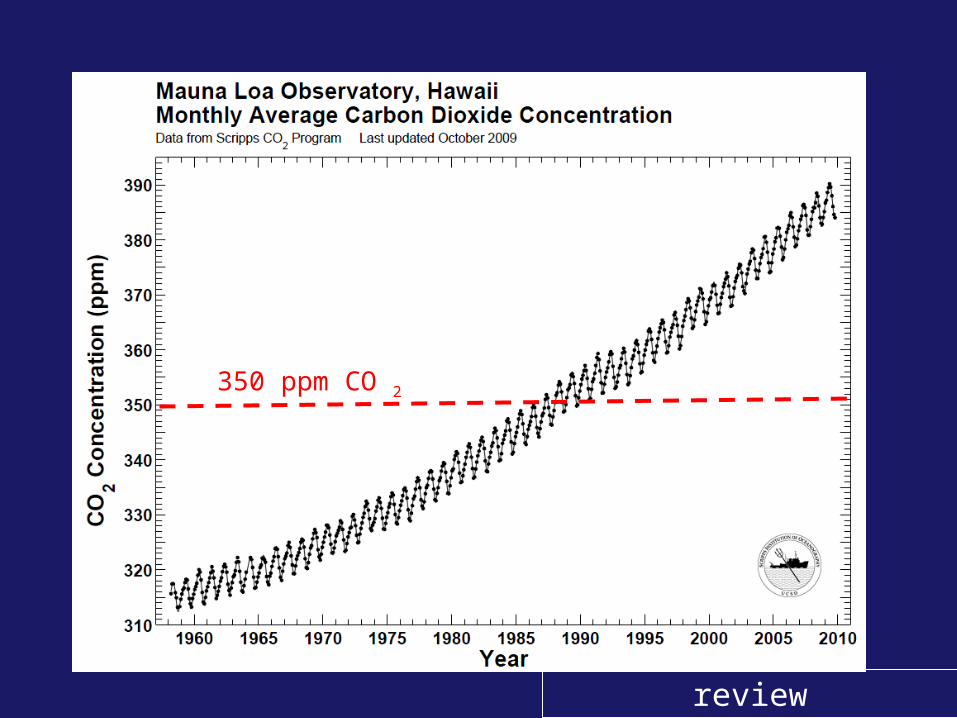
WHAT ABOUT THOSE ZIG-ZAGS IN THE KEELING CURVE?
p 76
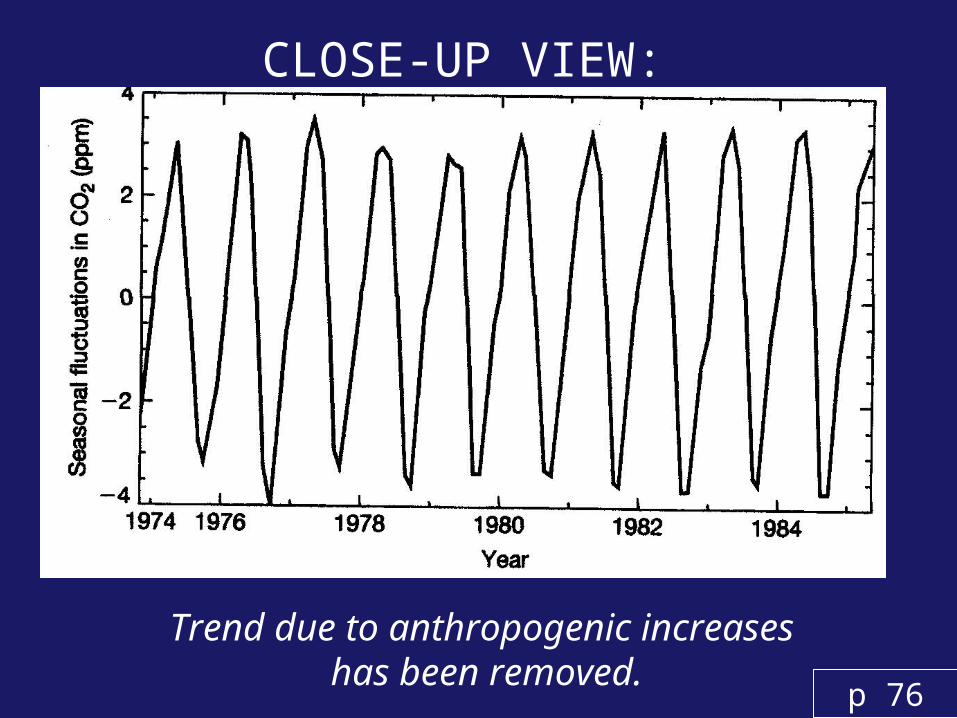
Trend due to anthropogenic increases has been removed.
CLOSE-UP VIEW:
p 76
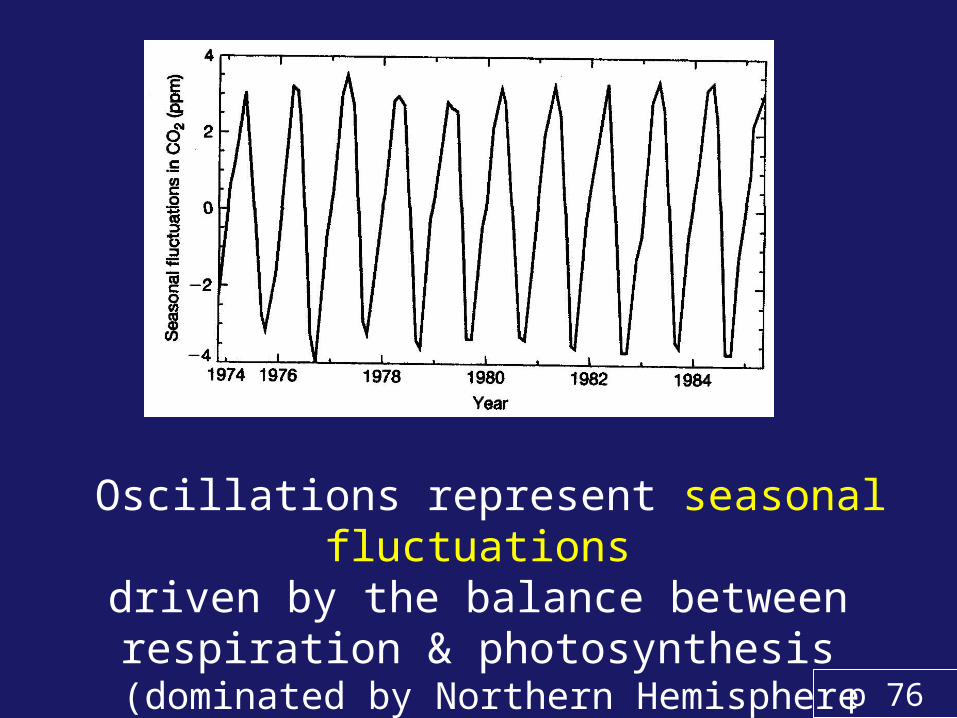
Oscillations represent seasonal fluctuations
driven by the balance between respiration & photosynthesis
(dominated by Northern Hemisphere forests) p 76
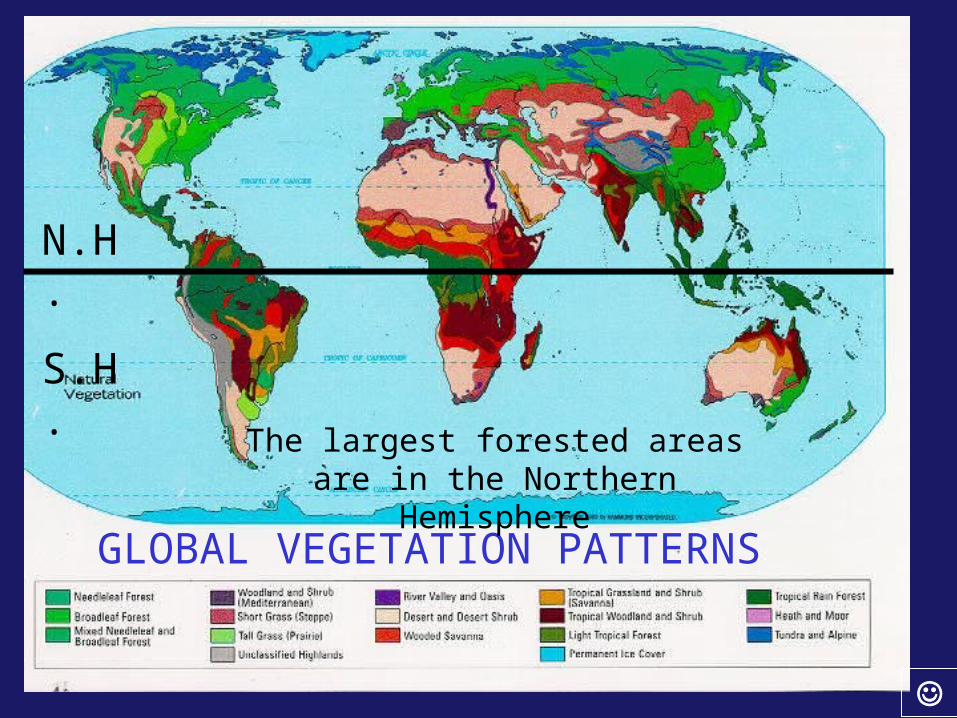
GLOBAL VEGETATION PATTERNS
The largest forested areas are in the Northern Hemisphere
N.H.
S.H.
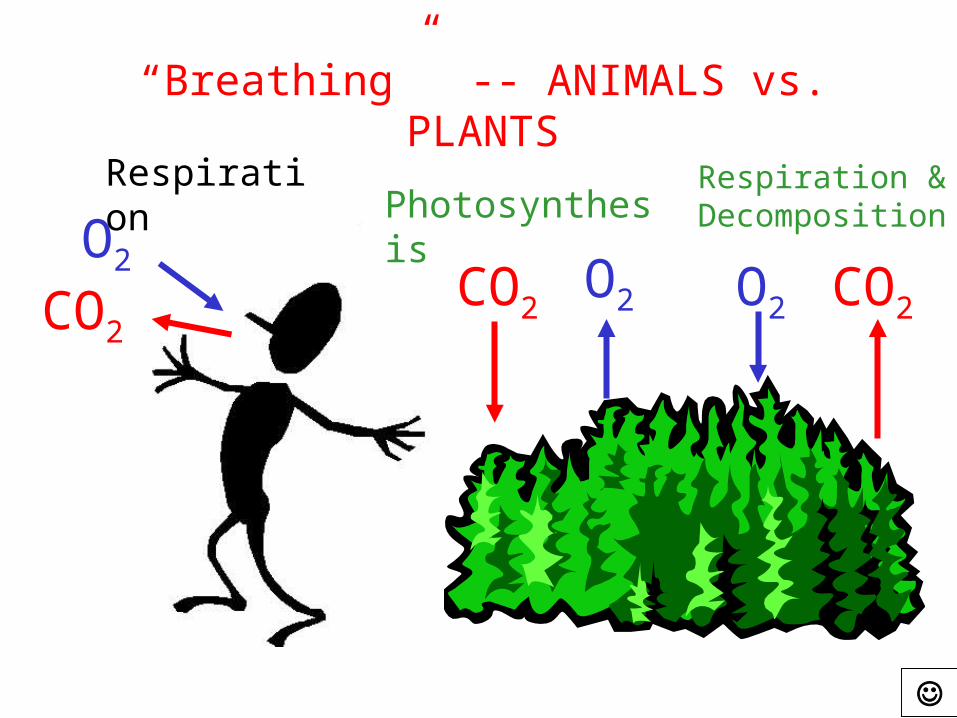
“Breathing” -- ANIMALS vs. PLANTS
O2
CO2CO2
O2
PhotosynthesisRespiration &
Decomposition
CO2O2
Respiration
JAN JAN
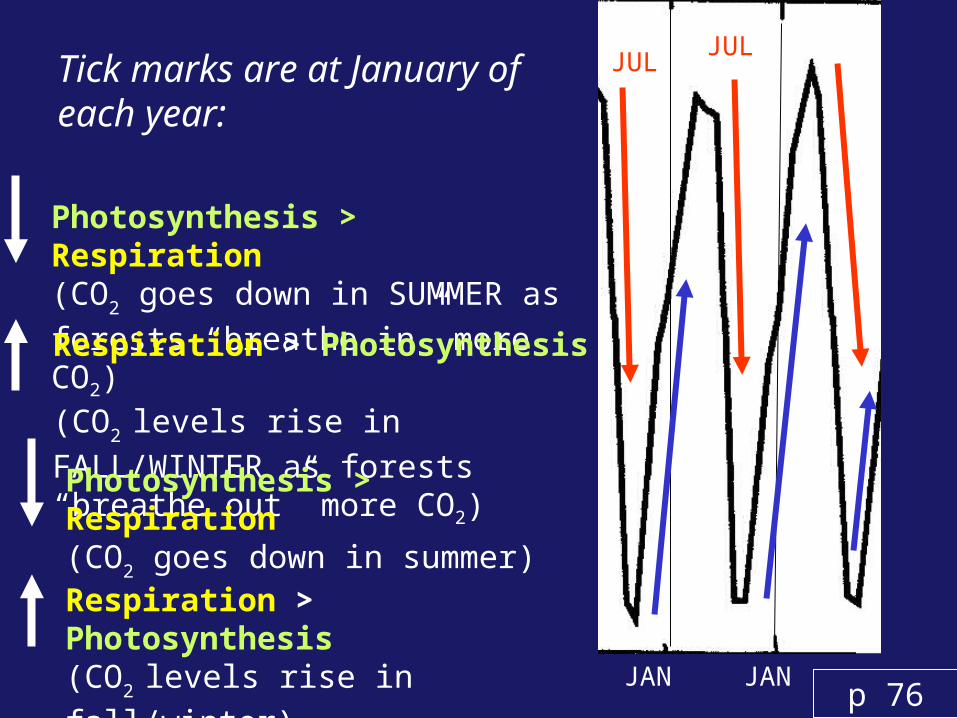
JULTick marks are at January of each year:
Photosynthesis > Respiration (CO2 goes down in SUMMER as forests “breathe in” more CO2)Respiration > Photosynthesis (CO2 levels rise in FALL/WINTER as forests “breathe out” more CO2)
Respiration > Photosynthesis (CO2 levels rise in fall/winter)
JUL
Photosynthesis > Respiration (CO2 goes down in summer)
p 76
review
350 ppm CO 2
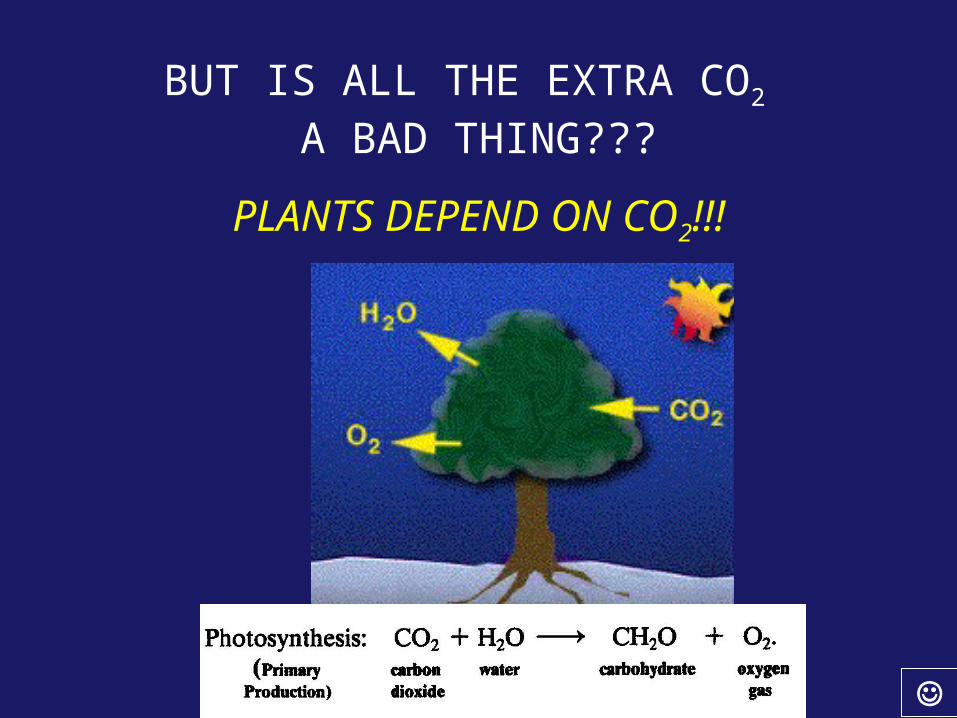
BUT IS ALL THE EXTRA CO2
A BAD THING???
PLANTS DEPEND ON CO2!!!

Mini- Zombie Break:
YOU TUBE!
http://www.youtube.com/watch?v=0_VmMIbWKoo
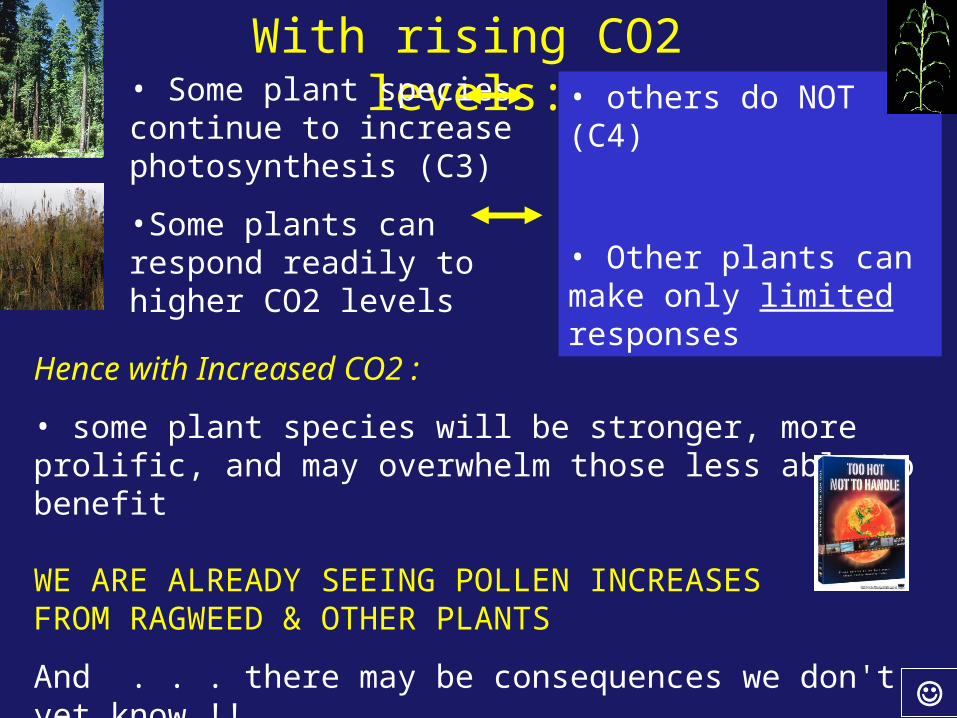
With rising CO2 levels:
Hence with Increased CO2 :
• some plant species will be stronger, more prolific, and may overwhelm those less able to benefit
WE ARE ALREADY SEEING POLLEN INCREASES FROM RAGWEED & OTHER PLANTS
And . . . there may be consequences we don't yet know !!
• others do NOT (C4)
• Other plants can make only limited responses
• Some plant species continue to increase photosynthesis (C3)
•Some plants can respond readily to higher CO2 levels
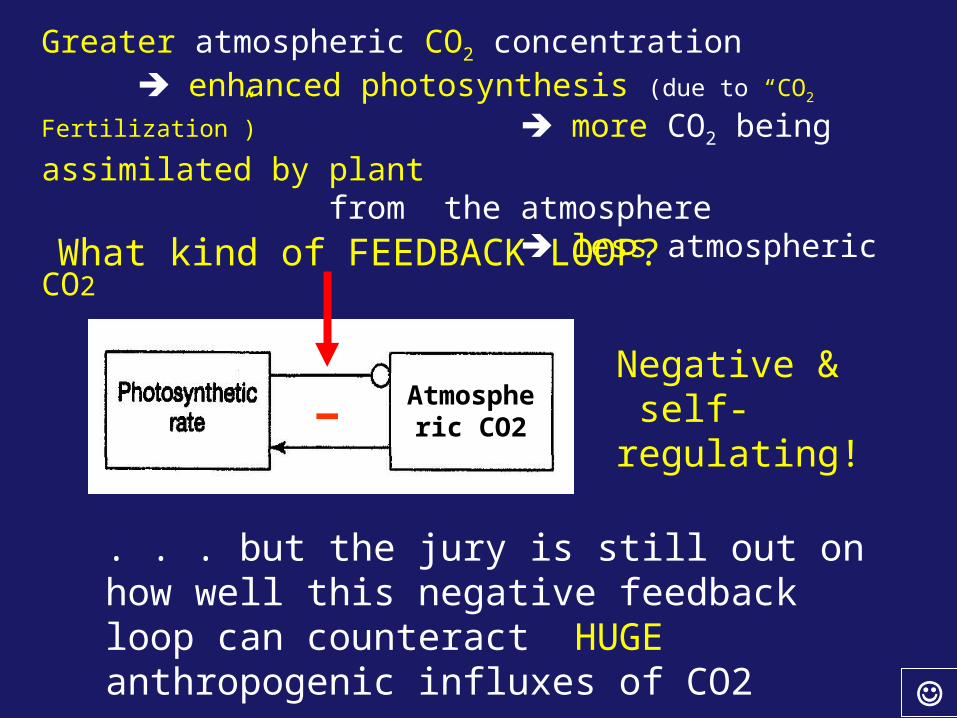
Greater atmospheric CO2 concentration enhanced photosynthesis (due to “CO2 Fertilization”)
more CO2 being assimilated by plant
from the atmosphere less atmospheric CO2
Atmospheric CO2
Negative & self-regulating!
-
What kind of FEEDBACK LOOP?
. . . but the jury is still out on how well this negative feedback loop can counteract HUGE anthropogenic influxes of CO2
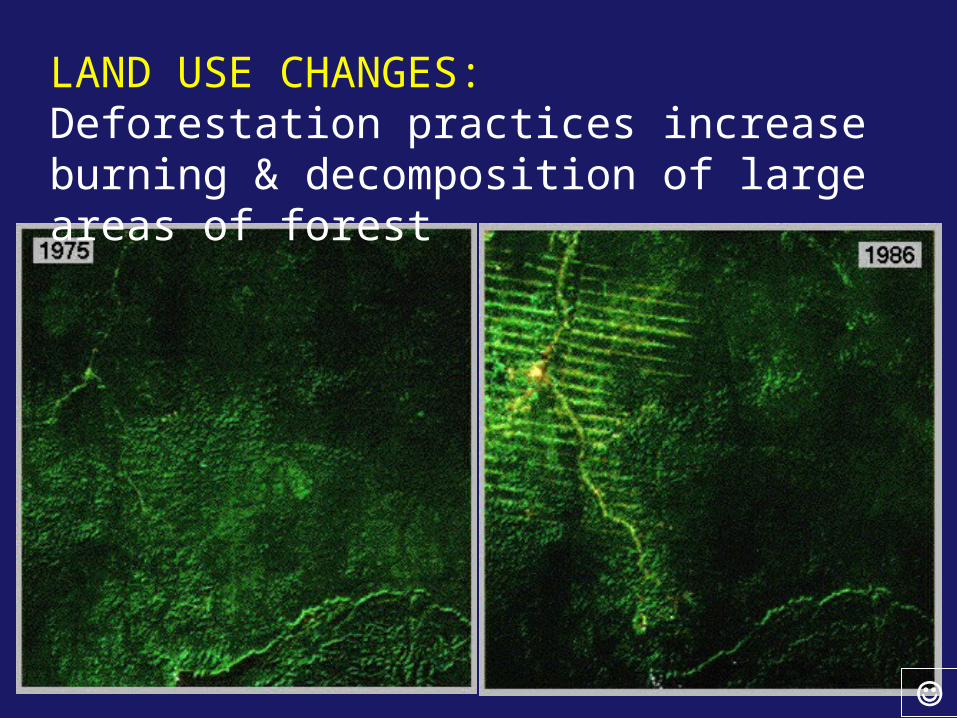
LAND USE CHANGES: Deforestation practices increase burning & decomposition of large areas of forest
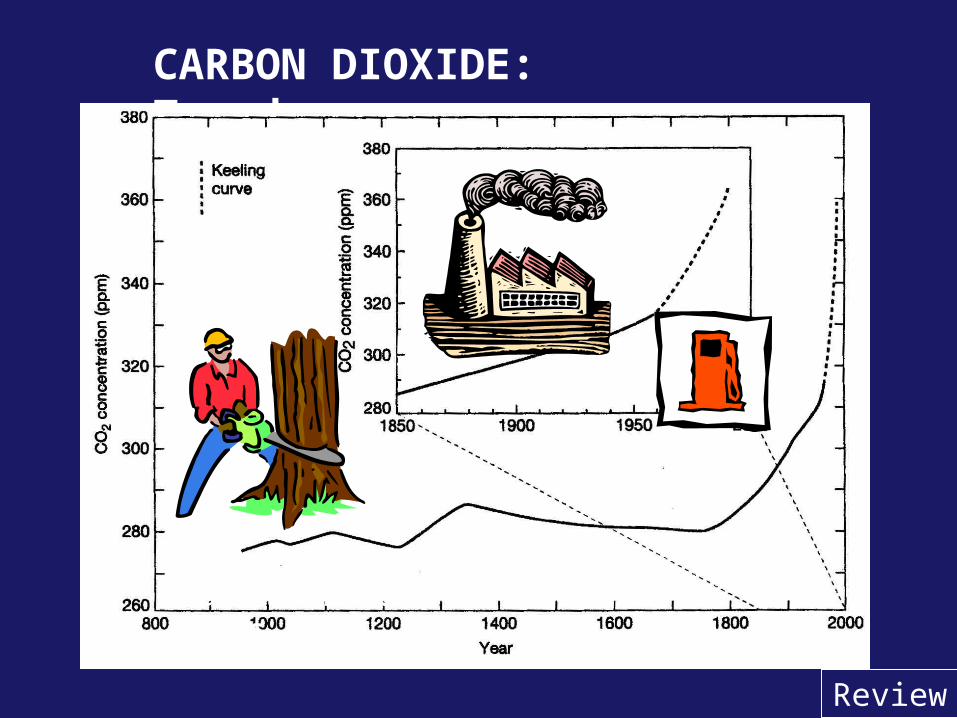
CARBON DIOXIDE: Trends
Data from ice cores
Review
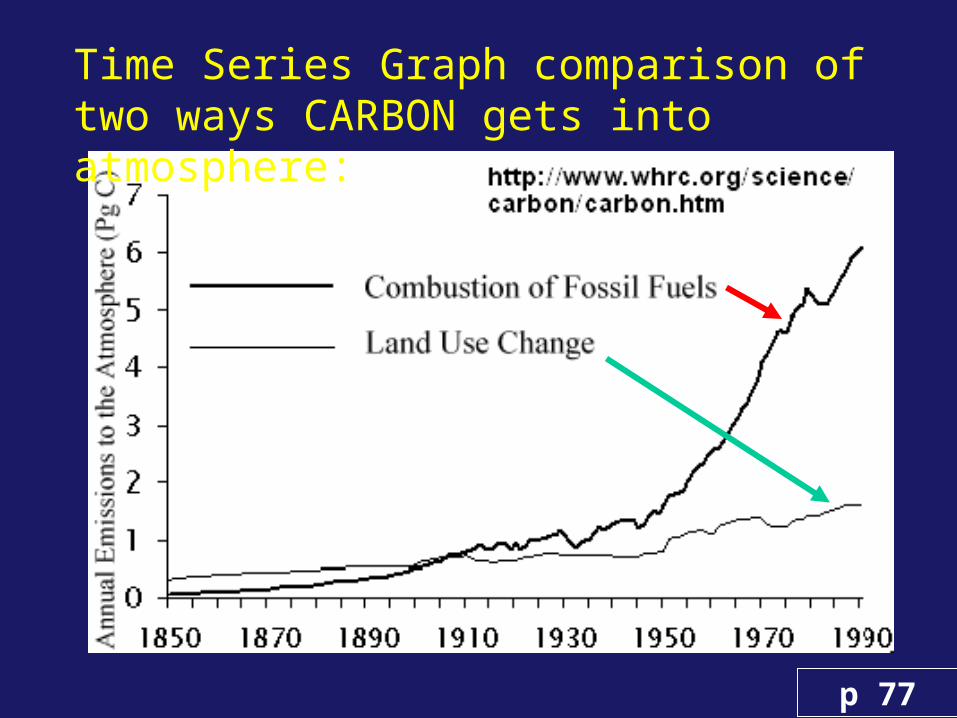
Time Series Graph comparison of two ways CARBON gets into atmosphere:
p 77
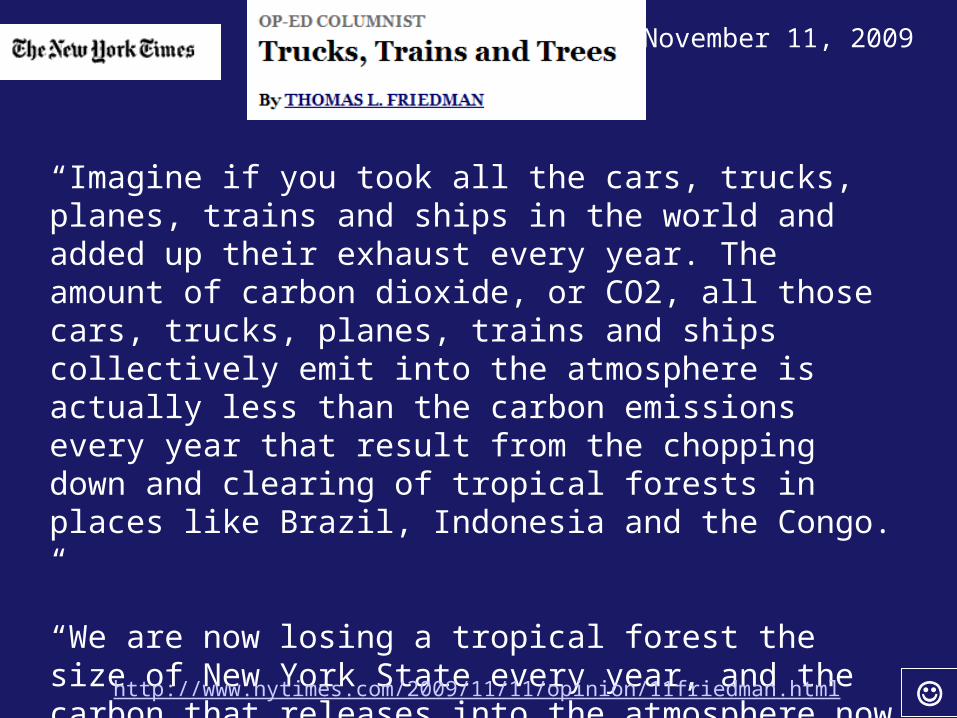
“Imagine if you took all the cars, trucks, planes, trains and ships in the world and added up their exhaust every year. The amount of carbon dioxide, or CO2, all those cars, trucks, planes, trains and ships collectively emit into the atmosphere is actually less than the carbon emissions every year that result from the chopping down and clearing of tropical forests in places like Brazil, Indonesia and the Congo. “
“We are now losing a tropical forest the size of New York State every year, and the carbon that releases into the atmosphere now accounts for roughly 17 percent of all global emissions contributing to climate change. “
November 11, 2009
http://www.nytimes.com/2009/11/11/opinion/11friedman.html
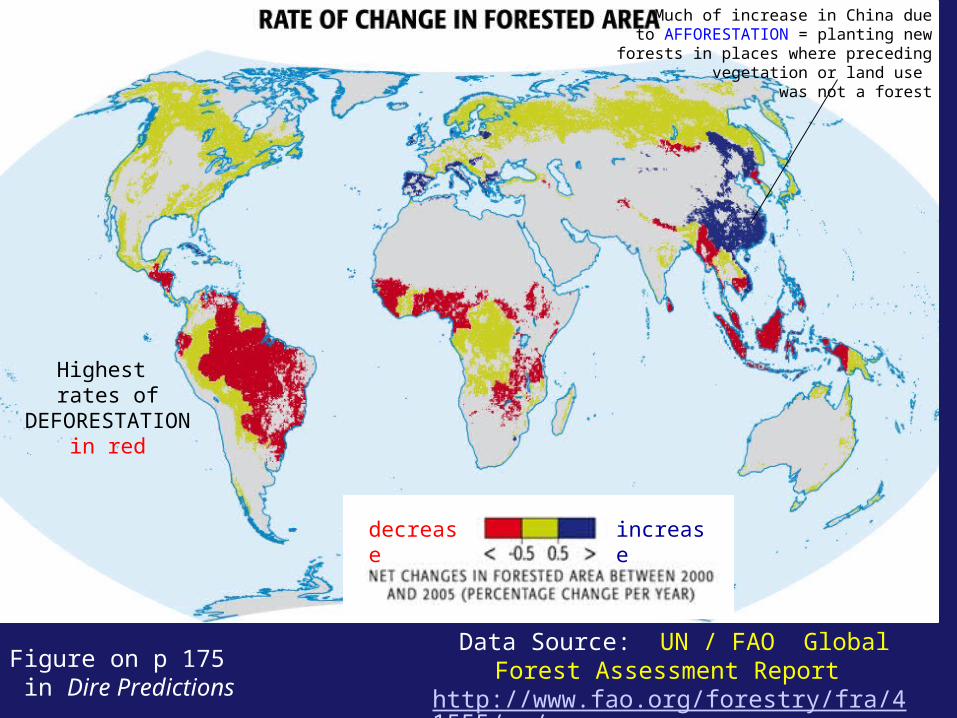
Figure on p 175 in Dire Predictions
Data Source: UN / FAO Global Forest Assessment Report
http://www.fao.org/forestry/fra/41555/en/
Highest rates of
DEFORESTATION in red
Much of increase in China dueto AFFORESTATION = planting new
forests in places where preceding vegetation or land use
was not a forest
decrease increase
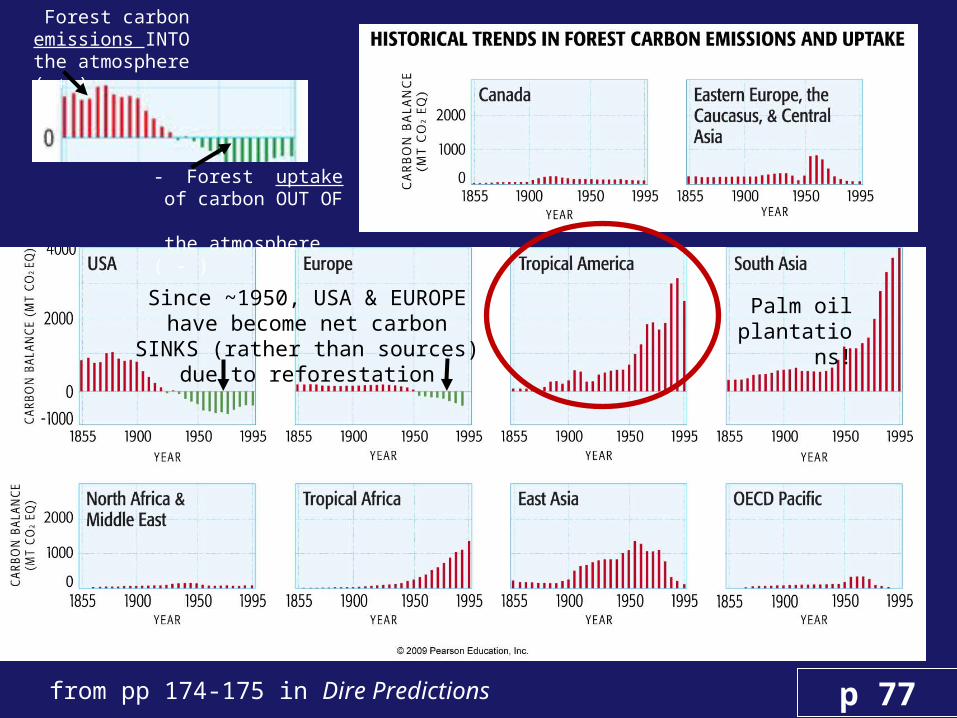
from pp 174-175 in Dire Predictions p 77
Forest carbon emissions INTO the atmosphere ( + )
- Forest uptake of carbon OUT OF the atmosphere ( - )
Since ~1950, USA & EUROPE have become net carbon SINKS
(rather than sources) due to reforestation
Palm oil plantations
!
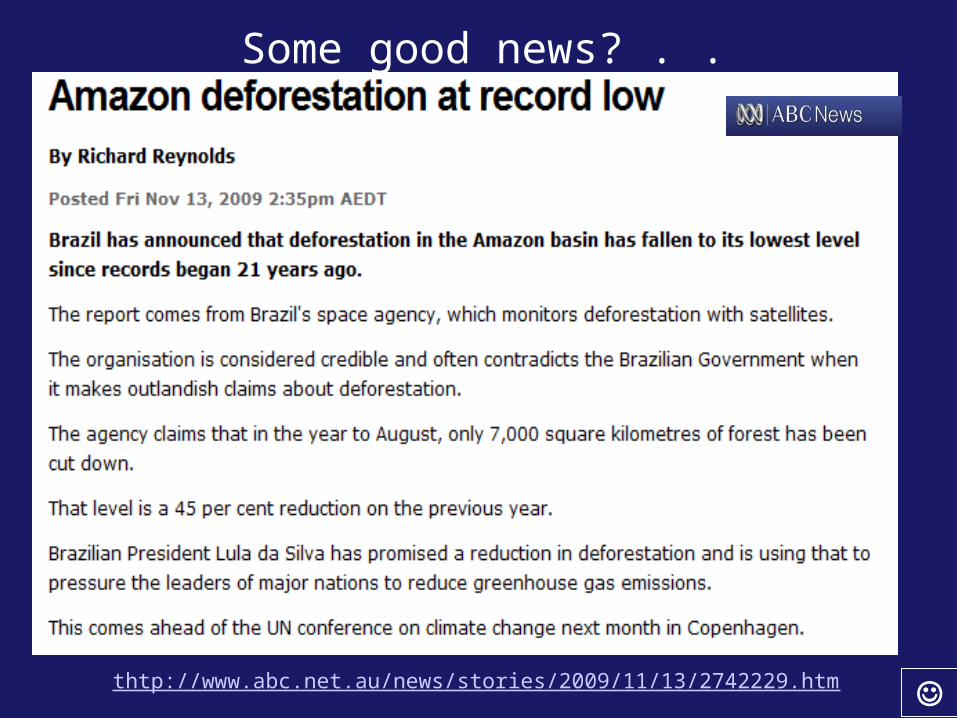
thtp://www.abc.net.au/news/stories/2009/11/13/2742229.htm
Some good news? . . .

HAVE A GREAT WEEKEND . . .
. . . but DON’T FORGET RQ-7!!GO CATS . . .
. . . .ALL TEAMS!!
COME & GET YOUR EXAMS . . . .


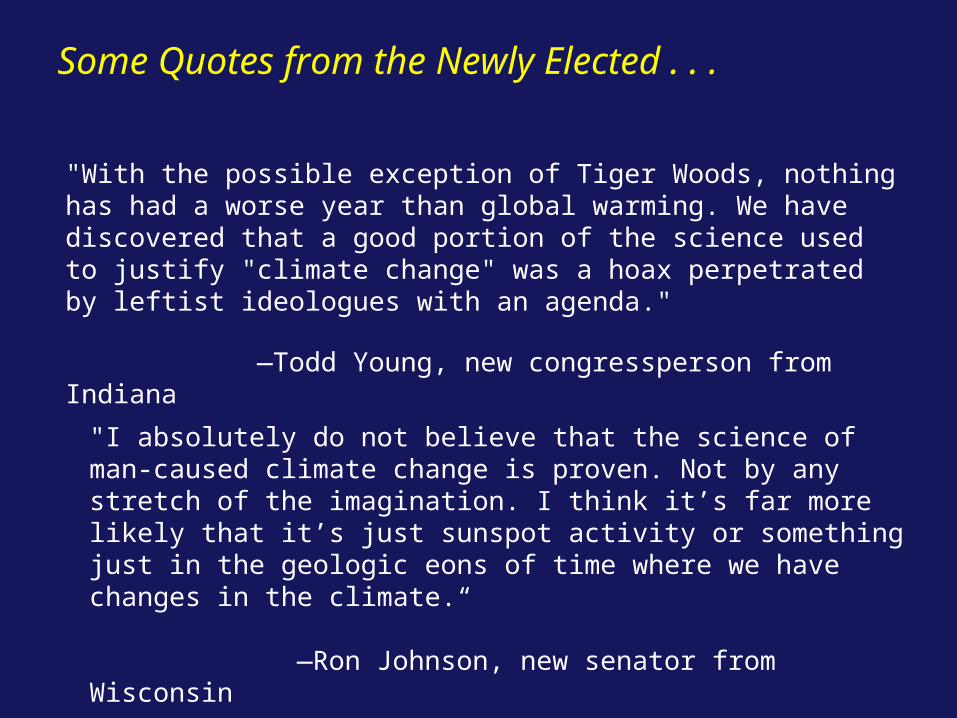
"With the possible exception of Tiger Woods, nothing has had a worse year than global warming. We have discovered that a good portion of the science used to justify "climate change" was a hoax perpetrated by leftist ideologues with an agenda."
—Todd Young, new congressperson from Indiana
"I absolutely do not believe that the science of man-caused climate change is proven. Not by any stretch of the imagination. I think it’s far more likely that it’s just sunspot activity or something just in the geologic eons of time where we have changes in the climate.“
—Ron Johnson, new senator from Wisconsin
Some Quotes from the Newly Elected . . .
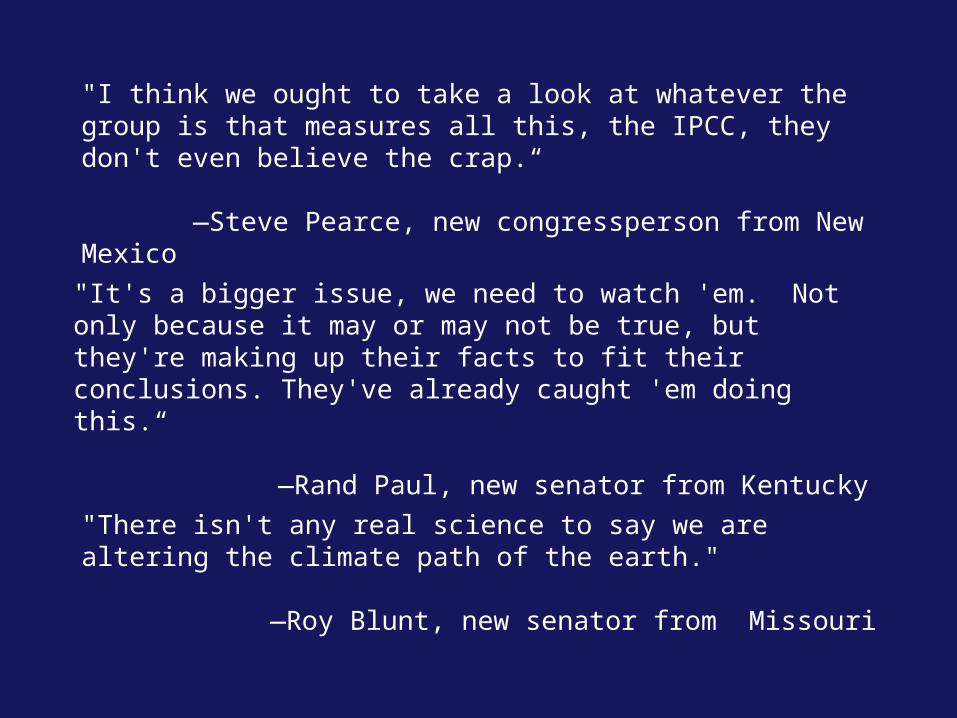
"I think we ought to take a look at whatever the group is that measures all this, the IPCC, they don't even believe the crap.“
—Steve Pearce, new congressperson from New Mexico
"It's a bigger issue, we need to watch 'em. Not only because it may or may not be true, but they're making up their facts to fit their conclusions. They've already caught 'em doing this.“
—Rand Paul, new senator from Kentucky
"There isn't any real science to say we are altering the climate path of the earth."
—Roy Blunt, new senator from Missouri
So, how do we begin to sort this out – or do we even need to?
Is it just political “talking points” OR
a serious science-baseddisagreement characterized by
open-minded inquiry and healthy skepticism?